harvey nash hrattracting a decreasing pool of available talent increasingly problematic. the talent...
TRANSCRIPT

HR HARVEY NASH
SURVEY2017

2
CONTENTS Foreword 3Report Infographic 4Key Findings 6About the Respondents 10Board HR Priorities 12Perception of HR 13HR as Innovators 14Systems & Technology 15Labour Market Trends 16HR Reporting 20Recruitment 21Employee Engagement 22Talent Management 23Leadership 24Skills and Performance 25Diversity 26HR Career 28Salary 31Regional Report – APAC 34Regional Report – Nordics 36Regional Report – Europe 38Regional Report – UK 40
PLEASE NOTE: GLOBAL RESULTS include charts that define trends across regions in addition to global averages. The ‘Europe’ data set includes EU member countries, Switzerland and Norway. Asia-Pacific (APAC) includes Australia, China, Hong Kong, Singapore and Vietnam. Some countries or regions – for example the UK and the Nordics – are also examined independently of their regional group in some charts, specifically where evidence of divergent trends exists.

3HARVEY NASH HR SURVEY 2017
Human resource professionals are riding a wave of transformation brought on by changes in technology, an ageing population and instabilities in the wider economy. As digitisation and automation replace existing skill sets at an ever-increasing rate, HR professionals will be required to develop their ‘ability to adapt’ as a core skill.
The shifting political and economic landscape makes attracting a decreasing pool of available talent increasingly problematic. The talent pipeline, its development, emigration and immigration of the workforce will be pushed to the forefront of the HR agenda.
Digital technology is transforming HR departments…but is the HR department ready to change?
Our survey participants this year have been vocal in expressing their concern about possible decreases in HR function through both outsourcing and automation. The future is likely to see leaner, smarter
HR departments making cost-effective decisions in their recruitment options and driving their talent attraction efforts towards those most attractive to the digitally savvy post-millennials.
In the next few years, in an age of big data and digitisation, employee engagement will change dramatically. In a fight to win scarce talent, it is likely that the companies that harness technology to unlock the masses of data in their HR systems will win.
Overall, this year’s results are relatively steady in comparison to last year, implying that businesses are holding a balanced line and sticking to trusted methods and processes in order to ride out the uncertainty around the global economy. However, one thing that needs addressing is the gender pay gap, which exists right across every job role in the HR profession. HR has a well-earned reputation for facilitating equality across the business; perhaps 2017 is the year to apply that experience to itself.
FOREWORD
Albert Ellis,Chief Executive,Harvey Nash plc

4
ABOUT THE RESPONDENTS
BOARD HR PRIORITIES
Total number of respondents:
1,008
HARVEY NASH HR SUR VEY 2017 KEY FINDINGS
DESCRIBED THEMSELVESAS FEMALE
BOARD PRIORITIES: TOP THREEleadership capability (58%)talent management (57%)employee engagement (56%)
BOARD PRIORITIES: FASTEST GROWINGorganisational growth (up 4%)business efficiency (up 3%)change management (up 3%)
BOARD PRIORITIES: FASTEST FALLINGrecruitment (down 8%) performance metrics (down 6%)training and education, employee engagement, and succession are all less of a priority (down 4%)
AREAGED 50+
ARE MEMBERS OF THE
OPERATIONAL BOARD (up 4%)
30+70+T30%63+37+T63% 51+49+T51%
1
1
1
2
2
2
3
3
3
PERCEPTION OF HR
Fewer respondents, 63 per cent (down 2%), are happy with the board perception of HR
of respondents feel they are not seen as very important by the board
66+34+T63%
9+91+T9%

5
• 67% cite employer branding as very important to the recruitment process
• Online recruitment up significantly: social media (up 15%), LinkedIn
(up 7%), job boards (up 3%) and corporate websites (up 2%)
• Recruitment companies are down 13%, referrals and personal
networks both down 3%
• 34 per cent of respondents are almost completely directly hiring (up 6%)
HARVEY NASH HR SUR VEY 2017 KEY FINDINGSDIVERSITY AND INCLUSION
are satisfied with progress of diversity
Government & Public Sector (36%), Transport &
Logistics (41%) and Energy (48%) are the sectors
least satisfied with diversity
53+47+T56%
LABOUR MARKET TRENDS
concerned with recruitment challenges in local region (up 2%)
concerned with demographics and ageing (up 10%)
concerned with labour supply and skills shortages (up 5%)
concerned with flexible employee contracts (up 11%)
58+42+T60% 42+58+T49%
44+56+T52% 33+67+T45%
80%are directly
involved in the recruitment process
(down 5%) RECRUITMENT
Gender and ethnicity still top the charts for the type of
diversity being pursued but in third place our respondents
are seeking cultural diversity. Around a third of our HR
professionals are looking for functional expertise (34%) and
international expertise (32 %)

HARVEY NASH HR SURVEY 20176
KEY FINDINGS
About the respondentsMore than a thousand HR professionals completed our survey this year. The seniority of our respondents has increased this year, not only in their ages, with nearly half aged 45 and above, but also in their role within the business: 17 per cent of this year’s respondents are C-level and above.
More than half of respondents are a member of their operational board or executive teams and more than one in four are responsible for global or international HR functions. The gender split remains on a par with previous years with nearly two-thirds of our respondents being female (63 per cent).
Board HR prioritiesThere is a decreased focus on training and recruitment priorities across the survey this year, as economic uncertainty continues to bite. Recruitment as a board priority has fallen by a significant 8 per cent in comparison to its position in 2016.
Change management, business efficiency and leadership capability have all increased in importance over the last year each growing between 2 & 3 per cent. Culture development shows growth year on year. Downsizing has been falling over the last three years, implying that the majority of organisations responding may have already downsized or be at optimum size.
Perception of HRThe vast majority of our HR professionals feel that their role is valued by the board and nearly two-thirds (63 per cent) feel satisfied with the way that they are perceived in their roles but there remains a significant proportion feeling undervalued.
There was a clear 50:50 split this year in those that feel responsible for proactively driving HR to do more for the business and those that feel they should be encouraging business to take more responsibility for the HR function.
HR as innovatorsMore than half our respondents cite continually evolving products and services as crucial to their organisations and a further one in four believe it is quite important. Luckily, the large majority of our HR respondents (86 per cent) feel that they actively support innovation within their organisations. More than one in ten responded that they lead the way in promoting and supporting innovation.
There must be more work to do around innovation as whilst nearly a quarter of all our respondents feel that their organisations are ahead of the competition when it comes to innovating, the vast majority believe that they are on a par with their competitors or feel that they are lagging behind.
Systems & technologyThe rise of technology and its impact, both positive and negative, is an area that we have highlighted within this survey. The rise of digitisation and automation in HR processes is an area that is preoccupying our respondents with more than half (60 per cent) feeling that its importance within the HR function has grown over the past year. HR departments are increasingly reliant on digital systems and processes and the vast majority (91 per cent) are aware that technology is vital for measuring their departmental function and return on investment.
Nearly a quarter cite that their existing processes for managing suppliers and recruitment are having a negative impact on their ability to be effective; so perhaps the change is overdue? More than half acknowledge the march towards digitisation and recognise that new technologies, artificial intelligence and automation will be affecting their workforce planning in less than five years’ time.
Labour market trendsHR continues to feel the pressure from diversified employee contracts and work statuses, and

HARVEY NASH HR SURVEY 20177
recognises that workers need a whole new set of rights and social protection to support them in leading more flexible working lives. The growing demand for flexible employee contracts was a labour trend affecting nearly half (45 per cent) of our respondents. Our survey shows that there is an upward trend for organisations to at least employ a proportion of their labour force on flexible contracts.
People are living and working for longer, which has implications for employers’ age strategies beyond older workers; as a result demographics and ageing populations are a labour trend that concerns more than half of our HR professionals (52 per cent). It’s clear the challenge around age is much more complex than simply realising that people now want to work ever later into life, and that employers need to harness and accommodate this.
Emigration of the available talent pool is also concerning our respondents and rightly so, as there is a corresponding increase in organisations employing workers from overseas and more than a quarter of respondents planning to increase those numbers over the next year. Even in light of Brexit only 6 per cent of UK respondents plan to reduce the proportion of people they recruit from overseas.
HR reportingThis year we asked our HR professionals what they would like to be able to measure that they don’t currently and the results were interesting. It would appear that two of the most commonly used measurements for organisations, recruitment KPIs (already measured by 73 per cent) and employee engagement (already measured by 70 per cent) for example, are unavailable in a proportion of our respondents’ businesses and frequently appeared on their wish lists.
Absence and staff retention information were 29 per cent more likely to be measured than profitability
of the HR department and return on investment for recruiting.
RecruitmentThe ability for candidates to reach out to potential employers through their own proactive online connectivity shows no sign of abating. One of the most dramatic swings highlighted by this year’s HR survey is away from using third parties to source candidates and towards direct hire through technology platforms. Personal networks, referrals and alumni programmes are down significantly as recruitment tools and the use of social media has grown significantly with more than four in ten (44 per cent) of our HR professionals using this for candidate acquisition.
LinkedIn, online job boards and reaching out through the corporate website are all recruitment tools being used by our HR professionals increasingly over the past few years. As a direct consequence the use of recruitment agencies for ‘transactional’ recruitment activities has fallen by 13 per cent, but there is an increased focus on value added services from recruitment partners.
Diversity In today’s competitive business environment, it has become more important than ever to leverage diversity and maximise the talent of every employee. Despite this fact, the proportion of our respondents that are satisfied with their diversity initiatives showed no change in comparison to last year, holding steady at 56 per cent. However, there was, overall, a general decline in the number of HR professionals stating that their diversity programmes were fully or mostly complete this year, down 3 per cent when compared to 2016.
Companies are defining their role in the global marketplace with more than a third of HR respondents seeking more functional skills and
HARVEY NASH HR SURVEY 20178
international expertise. That said, gender, ethnic and cultural diversity are still the dominant traits being sought by organisations within their formal diversity programmes.
HR careerGlobal uncertainty may be incentivising our respondents to stick within their current organisations. Our HR professionals appear to be looking to stay longer in their jobs than in previous years with job turnover down compared to last year and only a fifth (20 per cent) planning to move in the upcoming year. A third of our respondents have held their position within their organisation for more than six years. Almost half plan to stay at their current job for more than three years.
Broadly speaking, our HR professionals are happy within their current roles, with more than eight out of ten reporting that they find their role quite or very fulfilling. Furthermore, they appear to be taking pride in their work and more than half (51 per cent) report that the sense of HR having an important role to play within their organisation contributes most to their sense of fulfilment and being well paid is less of an issue.
SalaryThe average salary for HR professionals responding to the survey this year has been calculated to be $113,780. Salaries are highest in Europe, and the UK in particular. But the gender pay gap is still very much in evidence with men earning on average a quarter more than their female counterparts. This holds true for every level of role across the profession.
Despite this, more HR professionals are satisfied with their remuneration package this year compared to 2016 0. Nearly two-thirds believe that they are being paid what they are worth and a further 13 per cent consider themselves extremely satisfied and rewarded well for what they do.

9
1. GLOBAL RESULTS

GLOBAL RESULTS
HARVEY NASH HR SURVEY 201710
Just over a thousand HR professionals participated in the 2017 Harvey Nash HR Survey and the audience is becoming increasingly senior: 17 per cent of respondents are C-level executives compared with 13 per cent last year.
A wide range of industry sectors continue to be represented in this survey, including a few more from the Transport & Logistics sector. The majority of HR professionals responding were from Telecoms, Technology, Retail, Manufacturing and Financial Services.
ABOUT THE RESPONDENTS
The audience is becoming increasingly senior
A wide range of industry sectors continues to be represented in this survey
Chart 1. Which of the following best describes your job title?
Chart 2. In which sector is your organisation primarily engaged?
!"#$%&%'(
!"#$)(*+,&,-$.$/(0('"12(,%$/&+(3%"+ 1%
)(*+,&,-$.$/(0('"12(,%$4*,*-(+ 1%5*'(,%$4*,*-(2(,%$/&+(3%"+ 1%
61(+*%&",7$/&+(3%"+89:&(;$61(+*%&,-$6;;&3(+2%9:&(;$<=(3>%&0(84*,*-&,-$/&+(3%"+ 3%
6%:(+$9?)(0('8@A8/&+(3%"+ 3%5*'(,%$4*,*-(+ 3%9:&(;$BC$6;;&3(+ 9%
BC$D>7&,(77$A*+%,(+ 13%6%:(+ 15%
EF(,&"+G$4*,*-(+$BC 16%@A8/&+(3%"+$BC 17%
B(*H$";$BC 18%
1%
1%
1%
2%
3%
3%
3%
9%
13%
15%
16%
17%
18%
0% 5% 10% 15% 20%
Learning & Development Manager
Learning & Development Director
Talent Management Director
Operations Director/Chief Operating Officer
Chief Executive/Managing Director
Other C-Level/VP/Director
Talent Manager
Chief HR Officer
HR Business Partner
Other
(Senior) Manager HR
VP/Director HR
Head of HR
!"#$%&
!"#$'&%()#(*$+,+-").( /0
1)2"&$.*.34+,+56 /07$.8.$."* /0
9:(&.$;+,+<%3+=&%>.$ ?05:(&@(#"A$.#(8* ?0
B)A#($.%3 C0B3"&4; C0
D%2"&3@"3$+,+5AE8.#+!"#$%& F0G"(8$:#(&" F0
9%3*$&A#$.%3+,+B34.3""&.34 H0I&(3*=%&$+J+K%4.*$.#* H0
'A*.3"**+,+5&%>"**.%3(8+!"&2.#"* L06"$(.8+,+K".*A&" M0
N.3(3#.(8+!"&2.#"* /O0P$:"& /C0
-(3A>(#$A&.34 /C0I"#:3%8%4;+,+I"8"#%@* /F0
1% 1% 1%
2% 2%
3% 3%
4% 4%
7% 7%
8% 9%
10% 13% 13%
14%
0% 2% 4% 6% 8% 10% 12% 14% 16%
Broadcast / Media Advertising / PR
Utilities Charity / Non profit
Pharmaceuticals Education
Energy Government / Public Sector
Healthcare Construction / Engineering
Transport & Logistics Business / Professional Services
Retail / Leisure Financial Services
Other Manufacturing
Technology / Telecoms

GLOBAL RESULTS
HARVEY NASH HR SURVEY 201711
The increasing seniority of position matches the seniority of physical age in this year’s survey, with nearly half (48 per cent) of our HR professionals being aged 45 and over.
More of our HR professionals are responsible for global organisations (18 per cent) in comparison with respondents from last year. One in six have national or multinational responsibilities.
Nearly half of our HR professionals are aged 45 and over
More of our HR professionals are responsible for global organisations
Chart 3. How old are you?
Chart 4. Please indicate the geographical spread of your responsibility.
!"#
!"#$ !"#%$%& '( '(
$)*$+ +( ,(%%*%- -( .(%)*%+ '$( ',(+%*+- '/( '0(+)*++ ,)( ,'(0%*0- '$( '-(0)*0+ ',( '+(,%*,- $( /('/*,+ '( 0(
1%
4%
9%
16%
18%
20%
16%
12%
6%
1%
1%
2%
7%
12%
13%
21%
19%
14%
8%
3%
0% 5% 10% 15% 20% 25%
65+
60-64
55-59
50-54
45-49
40-44
35-39
30-34
25-29
18-24
2016
2017
!"#$%&#'(')'*+
!"#$ !"#%,%-.)/0"1'%&/%&)+ 234 254
6.*'%&.) 784 9:4;<)*'=&.*'%&.)/>(<*/&%*/1)%(.)? @94 @74
A)%(.) 254 284
19%
37%
24%
18%
18%
40%
23%
17%
0% 5% 10% 15% 20% 25% 30% 35% 40% 45%
Local region only
National
Multi-national (but not global)
Global 2016
2017

GLOBAL RESULTS
HARVEY NASH HR SURVEY 201712
GLOBAL RESULTS
12
The key business issues that the board is looking for HR to address are: leadership capability (up 2 per cent from last year), employee engagement (although down 4 per cent from last year) and talent management (also down 4 per cent from last year).
Key business issues that need to be addressed this year
Table 1. What are the key business issues that your board is looking for HR to address?
As a likely result of the current economic climate, for the majority of our responding organisations there have been some changes to these priorities compared with last year. Change management, business efficiency and leadership capability have all increased in importance over the last year, each growing between 2 per cent and 3 per cent. Culture development shows growth year on year. Downsizing has been falling over the last three years, implying that the majority of organisations responding may have already downsized or be at optimum size.
BOARD HR PRIORITIES
2017 Change 2016 2015Change management 46% 3 43% 51%Business efficiency 37% 3 34% 37%Leadership capability 58% 2 56% 61%Culture development 46% 1 45% 42%Capability & competence management 35% 1 34% 36%Flexible employment 14% 0 14% 15%Management development 39% -1 40% 44%Diversity 20% -1 21% 23%Industrial relations (Trade Unions) 12% -1 13% 14%Performance management 52% -2 54% 54%Employee retention & motivation 48% -2 50% 45%Downsizing 12% -2 14% 18%HR systems & processes 42% -3 45% 43%Organisational growth 34% -4 38% 36%Talent management 57% -4 61% 60%Employee engagement 56% -4 60% 58%Succession 38% -4 42% 43%Training & education programme 34% -4 38% 34%Performance metrics 21% -8 28% 27%Recruitment 50% -8 58% 51%
3 3
2 1 1
0 -1 -1 -1
-2 -2 -2
-3 -4 -4 -4 -4
-6 -8
Change management Business efficiency
Leadership capability Culture development
Capability & competence management Flexible employment
Management development Diversity
Industrial relations (Trade Unions) Performance management
Employee retention & motivation
HR systems & processes Talent management
Employee engagement
Training & education programme -4 Organisational growth
Performance metrics Recruitment
Succession
Downsizing
Change in board priorities
Chart 5. What are the key business issues that your board is looking for HR to address? - Change

GLOBAL RESULTS
HARVEY NASH HR SURVEY 201713
AreyousatisfiedwiththeimageoftheHRdepartmentasseenbytherestofthebusiness?
2017yes 63no 37
63%
37%
2017
yes
no
PERCEPTION OF HR
Almost two-thirds of respondents (63 per cent) are happy with the perception of HR within the business. But there is a slight downward trend in contentment levels compared with last year (65 per cent).
Just over half (52 per cent) feel that HR is very important to the board, with 9 per cent feeling they aren’t very important. Maybe HR is still feeling unappreciated – last year, two-thirds of respondents believed their senior HR leader was undervalued by the CEO.
Our HR professionals are evenly split on how best to improve their function within the organisation, with exactly half wanting the business to take more responsibility for HR and half wanting HR to do more for the business.
More than a third are unhappy with how they are perceived by the rest of the business
HR professionals feel valued in their role
Respondents evenly split on how best to improve HR function
Chart 6. Are you satisfied with the image of the HR department as seen by the rest of the business?
Chart 7. How important do you feel HR is to the board?
Chart 8. Which of the following is more important?
!"#$%&'"()*+)$,"$-".$/001$!2$%3$)"$)40$5"*(,6
70(-$%&'"()*+) 89:;.%)0$%&'"()*+) <=:
>")$?0(-$%&'"()*+) =:
52%
39%
9%
0%
10%
20%
30%
40%
50%
60%
Very important Quite important Not very important Whichofthefollowingismoreimportant?
2017GettingHRtodomoreforthebusiness 50
GettingthebusinesstotakemoreresponsibilityforHR 50
50% 50%
Chart Title
Getting HR to do more for the business
Getting the business to take more responsibility for HR

GLOBAL RESULTS
HARVEY NASH HR SURVEY 201714
More than half our respondents cite continually evolving products and services as crucial to their organisations (53 per cent), more than one in four rate it as quite important (44 per cent), while very few (3 per cent) responded that it is unimportant.
A quarter of all our respondents feel that their organisations are ahead of the competition when it comes to innovating but the vast majority (60 per cent) believe that they are on a par with their competitors and 15 per cent feel that they are lagging behind.
HR professionals working in the Energy (38 per cent) and Telecoms (36 per cent) sectors were the most likely to feel that their business was successfully driving innovation. Those working within Financial Services (14 per cent) and Education (17 per cent) were the least likely. The large majority of our HR respondents (86 per cent) feel that they actively support innovation within their organisations, with roughly one-sixth (15 per cent) responding that they lead the way in promoting and supporting innovation. Fourteen per cent feel that they support innovation to little or no extent.
47
53
Innovation is recognised as crucial to organisations
A quarter of respondents feel they have highly innovative organisations
Large majority of HR professionals support innovation
Chart 9. How important is innovation (i.e. continually evolving products / services / ways of working) to your organisation?
Chart 10. How successful is your organisation at innovating?
Chart 11. To what extent does HR have a role in promoting and supporting innovation?
HR AS INNOVATORS
Howimportantisinnovation(i.e.continuallyevolvingproducts/services/wayofworking)toyourorganisation?
Veryimportant–wewoulddiewithoutit 53%Quiteimportant–itpotentiallygivesusacompetitiveedge 44%
Notveryimportant 3%
53% 44%
3%
Chart Title
Very important – we would die without it
Quite important – it potentially gives us a competitive edge
Not very important
!"#$%&''(%%)&*$+%$,"&-$"-./0+%/1+"0$/1$+00"2/1+0.3
4(-,$5$#($/-($/6(/7$")$'"89(1+1"-% :;<=&+1($5$#($/-($"0$9/-$#+16$'"89(1+1"-% >?<
@"1$5$#($/-($A(6+07$'"89(1+1"-% B;<
25%
60%
15%
Chart Title
Very – we are ahead of competitors
Quite – we are on par with competitors
Not – we are behind competitors
!"#$%&'#()'(*'#+"(,#-.#%&/(#�"1(#2*#30"4"'2*5#&*+#,633"0'2*5#2**"/&'2"*7
80(&'#()'(*'#9#$(#&0(#1(&+2*5#'%(#$&: ;<=>"4(#()'(*'#9#$(#&0(#,633"0'2*5#"'%(0, ?;=
@2''1(#A#*"#()'(*' ;B=
15%
71%
14%
Chart Title
Great extent – we are leading the way
Some extent – we are supporting others
Little / no extent

GLOBAL RESULTS
HARVEY NASH HR SURVEY 201715
!"#$%&'(#)$%*+%$",%,-&.$&/0%.1.$,'.2%(3+),..,.%+4%'#/#0&/0%.5((6&,3.%#/*%3,)35&$&/0%"#7,%+/%1+53%#8&6&$1%$+%*,6&7,3%,44,)$&7,%9:;%
!"#$<,31%=,0#$&7, >
=,0#$&7, >?=+%,44,)$ >@
A+.&$&7, BC<,31%(+.&$&7, D
2%
21%
25%
49%
3%
Chart Title
Very negative
Negative
No effect
Positive
Very positive
!"#$%&'"()*+)$%,$-./0+"1"23$4+*51.6$!7$%+$&.*,8(%+2$!7$'.(9"(&*+/.$:$7;<=
!"#$>.(3$%&'"()*+) ?@
A8%).$%&'"()*+) ?BC")$%&'"()*+) B 58,%+.,,$*,$8,8*1
42%
49%
9%
Chart Title
Very important
Quite important
Not important
60%
39%
1%
Increased
Stayed the same
Decreased
While just half of our respondents (52 per cent) felt that their existing systems and processes enable them to be effective, nearly a quarter (23 per cent) felt quite the opposite, listing them as having a negative or very negative impact. A quarter (25 per cent) were ambivalent and felt that systems and processes have no influence on their effectiveness.
Just under half (49 per cent) of HR professionals feel that technology-enabled HR is somewhat important in measuring their performance and 42 per cent consider it very important. Perhaps with increased digitisation and early adoption, technology is simply ‘business as usual’ for the 9 per cent that say it is unimportant?
In spite of this low level of cynicism, our respondents report a general upward trend in the use of technology, with six in ten (60 per cent) reporting an increase in its importance on the HR function over the past year.
The opinion on the impact of existing systems and processes is split
Is technology-enabled HR just business as usual?
HR is increasing its reliance on technology
Chart 12. What impact do the existing systems / processes of managing suppliers and recruiting have on your ability to deliver effective HR?
Chart 13. How important is technology-enabled HR in measuring HR performance / ROI?
Chart 14. How has the importance of using technology-enabled HR changed in the past year?
SYSTEMS AND TECHNOLOGY

GLOBAL RESULTS
HARVEY NASH HR SURVEY 201716
HR professionals are very aware of the imminent march of technologies such as artificial intelligence and automation. More than half see such technologies impacting workforce planning now or in the near future. One in ten think the impact of such technologies as being a decade or more away.
When asked about what major trends are likely to disrupt their HR function in the future, nearly four in ten (38 per cent) of our respondents cited technology as the biggest disrupting factor for HR on the horizon. Outsourcing, flexible working practices and Brexit and the wider economy were also popular responses, with around one in ten of our respondents listing them as a concern.
LABOUR MARKET TRENDS
HR will feel the impact of artificial intelligence and automation sooner rather than later
Likely disruptors for HR function
Chart 15. At what point do you think technologies such as artificial intelligence and automation will be sufficiently advanced that they will impact workforce planning in your organisation?
What major trends are likely to significantly change / disrupt the HR function in the future?
!"#$%&"#'()*"#+(#,(-#"%)*.#"/0%*(1(2)/3#3-0%#&3#!4")5)0)&1#6*"/11)2/*0/#&*+#!-"(7&")(*#$)11#8/#3-55)0)/*"1,#&+9&*0/+#"%&"#"%/,#$)11#)7'&0"#$(4.5(40/#'1&**)*2#)*#,(-4#(42&*)3&")(*:
;($<#)"#)3#&14/&+,#%&''/*)*2 =>6*#"%/#*/?"#@#A#>#,/&43 BC
6*#"%/#*/?"#D#A#=C#,/&43 @@6*#"%/#*/?"#==#A#@C#,/&43 E
6*#7(4/#"%&*#@C#,/&43 @;/9/4 F
6#+(*G"#.*($ ==
15%
40% 22%
7%
3% 2% 11%
Chart Title
Now, it is already happening In the next 2- 5 years In the next 6 - 10 years In the next 11 - 20 years In more than 20 years Never I don’t know
Technology & AutomationOutsourcing
Flexible Work Practices Skills Shortages
Cost CuttingBrexit
The Wider Economy
Social Media
Talent pipeline
Demographics
HR devolved to wider business
Churn

GLOBAL RESULTS
HARVEY NASH HR SURVEY 201717
Recruitment challenges in the local market remain the most significant labour market concern for HR professionals, with six in ten of respondents listing this as a challenge for the next two years. This level of concern is similar to last year (58 per cent).
There has been a significant jump in the number of respondents concerned with demographics and an ageing workforce, with more than half (52 per cent) listing this as a concern in comparison with 42 per cent in 2016. Tight labour supply and general skills shortages are also an increasing concern, with almost half (49 per cent) of our respondents citing them, up 5 per cent from last year.
There has also been a significant increase in the number of HR professionals concerned with the growing demand for flexible contract employee options, with nearly half (45 per cent) listing this as a concern, up 11 per cent since last year.
A third of respondents (34 per cent) fear that education is not aligned with hiring needs, which is slightly up from 31 per cent last year.
HR professionals worried about an ageing workforce
Table 2. What labour market trends do you anticipate you will be responding to in the next 2 years? Please tick all that apply
2016 CHANGE 2015
Demographic shift / ageing workforce 52% 10% 42%
Growing demand for flexible contract employment options - employee 45% 11% 34%
Talent emigration 23% 5% 17%
Tight labour supply and skill shortages generally 49% 5% 44%
Education system not aligned with hiring needs 34% 3% 31%
Talent immigration 22% 3% 19%
Recruitment challenges in local economic region 60% 2% 58%
Growing demand for flexible contract employment options - employer 25% 2% 23%
Widespread unemployment 5% -1% 6%
Technology automating tasks previously performed by people* 30% * This is new for 2017

GLOBAL RESULTS
HARVEY NASH HR SURVEY 201718
There have been no remarkable changes to the proportion of the workforce being flexible labour in 2017 compared with last year. Just over half (51 per cent) of HR professionals report that their workforce is comprised of between 1 per cent and 10 per cent flexible workers. And just as in 2016, just over one in ten employ no flexible labour at all.
In light of Brexit, we looked at the concerns for talent migration in the UK. Twenty per cent of respondents in the UK are worried about talent immigration, which is on a par with global averages; but a third (33 per cent) are worried about talent emigration, which is significantly higher than the global average (23 per cent). APAC respondents are just as concerned about a talent exodus, with 36 per cent listing it as a concern. In the Netherlands all concerns are about talent immigration and this is matched in Switzerland where there are strict restrictions on external recruitment.
Flexible labour levels remain steady
UK concern about migrating talent
Chart 16. What proportion of your current workforce is flexible labour?
Table 3. What labour market trends do you anticipate you will be responding to in the next 2 years? Please tick all that apply - By region
What proportion of your current workforce is flexible labour?
2017 2016None 12% 11%1-10% 51% 49%11-25% 23% 23%26-40% 6% 8%41-50% 3% 4%51%+ 6% 5%
12%
51%
23%
6% 3%
6%
11%
49%
23%
8% 4% 5%
0%
10%
20%
30%
40%
50%
60%
None 1-10% 11-25% 26-40% 41-50% 51%+
2017
2016
Global Av APAC Nordics Europe UK
Talent emigration 23% 33% 14% 21% 33%

GLOBAL RESULTS
HARVEY NASH HR SURVEY 201719
Chart 17. What proportion of your current workforce is sourced from abroad?
Chart 18. Over the next year, do you plan to increase or decrease the proportion of people your company recruits from abroad?
Increased reliance on skills from abroadThe trend for using skills from abroad has increased for all our HR professionals, with almost two out of three (71 per cent) now using foreign labour to a degree. The proportion of HR professionals sourcing labour solely from their own country has decreased significantly by 7 per cent this year to just 29 per cent.
There would appear to be no significant change in desire to decrease the proportion of foreign labour in the near future. Just over a quarter (26 per cent) plan on increasing their foreign labour force over the next year, up 3 per cent from last year. Despite the complications surrounding Brexit, only 6 per cent of UK respondents plan to reduce the proportion of people they recruit from overseas and 16 per cent of UK HR professionals plan to increase their overseas recruitment.
A quarter of respondents plan to increase their foreign recruitment next year
!"#$%&'(&('$)(*%(+%,(-'%.-''/*$%0('1+('./%)2%2(-'./3%+'(4%#5'(#36
789: 789;!"#$ %&' ()'
*+*,' -.' --'**+%/' *-' *%'%)+-,' /' -'-*+/,' *' %'
/*'0 (' *'
29%
48%
14%
5% 1% 3%
36%
44%
12%
4% 2% 1% 0%
10%
20%
30%
40%
50%
60%
None 1-10% 11-25% 26-40% 41-50% 51%+
2017
2016
!"#$%&'#%(#)&%*#+$,%-.%*./%01+(%&.%2(3$#+4#%.$%-#3$#+4#%&'#%0$.0.$&2.(%.5%0#.01#%*./$%3.60+(*%$#3$/2&4%5$.6%+7$.+-8
9:;< 9:;=!"#$%&'% ()* (+*
,%%-./0%.'&1% ))* )2*3%#$%&'% 2* 2*
26%
66%
8%
23%
68%
8%
0%
10%
20%
30%
40%
50%
60%
70%
80%
Increase Keep the same Decrease
2017
2016

GLOBAL RESULTS
HARVEY NASH HR SURVEY 201720
When asked about what management information they are measuring, our HR respondents are mostly concerned with reporting absence and staff retention (81 per cent), KPIs (73 per cent) and employee engagement (70 per cent). Interestingly, just over half of respondents (59 per cent) are reporting on recruitment measurements such as time and cost to hire, which are the usual front-runners for digitisation. This might mean there are still many of our organisations that are yet to implement basic HR technology.
In addition to the possible selections available in our survey, HR professionals also mentioned measuring diversity, accident information, training and staff turnover among others.
When asked what they would like to be able to measure that they don’t currently, the results were interesting. It would appear that many of the most commonly used measurements for organisations – employee engagement, for example – are unavailable in a proportion of our respondents’ businesses.
Absence and staff retention dominate reports
What would you most like to measure?
Chart 19. What key management information do you measure?
What do you wish you could measure that you can't at the moment?
HR REPORTING
!"#$%&'(%)#*#+')'*$%,*-./)#$,.*%0.%(.1%)'#21/'3%456'#2'%$,7&%#66%$"#$%#556(8
!"#$% &'()*+,-.+/0"+1 23'
4%560" 78'9$.%)0"*$,"-$:;:-"0*$-"5-#0%$<.5="-"5-#0%$ 7>'
?*/15@$$-$,;+;$*$,"-=.5%$= AB'C4D= AE'
FG=$,.$-+,H-="+66-%$"$,"05, 3I'
6%
48%
52%
59%
70%
73%
81%
0% 10% 20% 30% 40% 50% 60% 70% 80% 90%
Other
Human capital
Profit
Recruitment e.g. time to hire/cost to hire
Employee engagement scores
KPIs
Absence and staff retention
Recruitment KPIs
Employee Engagement
Employee Engagement
Culture
Flexible Work Practices
Productivity
Leadership Metrics
Skills Shortages
Cost Cutting
Training ROI
Diversity
Brexit
The Wider Economy
Human Capital
Social Media
Churn
Talent pipeline
Demographics
HR devolved to wider business
Churn

GLOBAL RESULTS
HARVEY NASH HR SURVEY 201721
Chart 20. Are you directly involved in recruitment at your organisation?
Table 4. Please rate how important each of the following tools is in your recruitment strategy? - Very
Chart 21. Approximately, what percentage of your recruitment is directly hired? (e.g. direct to the candidate, without using a recruitment organisation or other third party)
RECRUITMENT
Perhaps explained by the increasing seniority of our survey respondents, fewer stated this year that they were directly involved with recruitment (80 per cent) compared with last year (85 per cent).
The use of social media as a recruitment tool (44 per cent) has grown by 15 per cent in comparison with last year. The use of LinkedIn and online job boards has also steadily grown, being used by half of all respondents. At the same time that these relatively low-cost options have grown, the use of external recruitment companies has decreased significantly, down 13 per cent on last year’s figures with just over a fifth (23 per cent) listing them as very important.
The way that HR professionals are conducting their recruitment shows some interesting shifts in comparison with previous years. The use of personal networks, alumni programmes and employee referrals has all decreased compared with last year’s survey.
Organisations are increasingly using direct hire, with more than three-quarters using this approach for the bulk of their recruiting and more than a third (34 per cent) using this for almost all their hiring strategy. Interestingly, there is no direct correlation between the size of the organisation and their likelihood to be hiring direct, with smaller organisations just as likely to be hiring directly as organisations with more than 1,000 employees.
Directly involved with recruitment
Trend continues for low-cost online recruitment methods
Organisations are hiring direct
!"#$%&'$()"#*+,%$)-.&,.#($)-$"#*"')+/#-+$0+$%&'"$&"10-)20+)&-3
4567 4568!"# $%& $'&() *%& +'&
80% 85%
20% 15%
0%
20%
40%
60%
80%
100%
2017 2016
Yes
No
2017 CHANGE 2016 2015
Social media (Facebook, Twitter etc) 44% 15 29% 22%
LinkedIn 50% 7 43% 37%
Corporate website 50% 2 48% 54%
Online job boards 52% 3 49% 42%
Printed adverts 7% 0 7% 5%
Personal network of the recruiter 41% -3 44% 39%
Alumni programme 7% -1 8% 5%
Employee referral programme 32% -3 35% 31%
Recruitment companies 23% -13 36% 34%
Employer branding* 67% n/a n/a n/a *New for 2017
!""#$%&'()*+,-./0()."*#1*2)(3*.$4.,$5#.#*1#5&)'*2).&6.7&#*1)+,.0&#*78.9*:3:.7&#*1).)$.)0*.1(27&7()*-./&)0$5).56&23.(.#*1#5&)'*2).$#3(2&;()&$2.$#.$)0*#.)0."(#),<
=>?@ =>?A!"##$%&'($)*+ ))+ ),+
))-.,+ ).+ ),+./-,*+ )0+ )1+,)-2,+ .1+ .0+
2/-)**+ 30+ .4+
11% 12% 14%
29%
34%
15% 15% 19%
24% 28%
0%
5%
10%
15%
20%
25%
30%
35%
40%
Less than 10% 11-25% 26-50% 51-75% 76-100%
2017
2016

GLOBAL RESULTS
HARVEY NASH HR SURVEY 201722
!"#$%&'()*")+),'%&-)%."/)0%-)'#$1",'')'2.%.'#'2*)."*)3'**'&)"&)4"&-'5
6789 678:!"##"$ %&' ()'*+," --' -.'/0$1" )2' )2'
48%
33%
19%
51%
30%
19%
0%
10%
20%
30%
40%
50%
60%
Better Same Worse
2017
2016
Overall, our survey respondents say that the level of employee engagement compared with five years ago remains on a par with last year. Almost half of respondents (48 per cent) feel that engagement is better, a third think it remains the same as five years ago and nearly two in ten (19 per cent) view it as worse.
Regional results show the UK is more positive than the global average with more than half (54 per cent) citing that employee engagement is better. HR professionals in the APAC region are most likely to think that their employee engagement is worse with more than a quarter (30 per cent) listing this as their choice.
No significant changes to employee engagement compared with last year
APAC regions more likely to feel that employee engagement is getting worse
Chart 22. Compared to 5 years ago, has employee engagement got better or worse?
Chart 23. Compared to 5 years ago, has employee engagement got better or worse? - By region
EMPLOYEE ENGAGEMENT
!"#$%&''(!)*+*'"'), -.-/ 0%12345 !61%#' 78 9$%:+$(-;<',,'1 =>? =@? =A? B=? =C?D+"' EB? =>? F>? EA? FF?G%15' F@? H=? HA? HI? HI?
46% 40%
47% 54%
48%
25%
46%
36%
27% 33% 30%
14% 17% 19% 19%
0%
10%
20%
30%
40%
50%
60%
APAC Nordics Europe UK Global Av
Better
Same
Worse

GLOBAL RESULTS
HARVEY NASH HR SURVEY 201723
Less reliance on formal talent management
More comprehensive talent management programmes
HR professionals in APAC have the most comprehensive talent management programmes
Chart 24. Does your organisation have a formal Talent Management Programme in place?
Chart 25. What does your Talent Management strategy include? (tick all that apply) - Change
Chart 26. Does your organisation have a formal Talent Management Programme in place? - By region
Our survey shows a trend of decreasing use of formal talent management programmes. This year’s results show that just over half of our survey respondents are using a formalised programme (55 per cent) compared with nearly two-thirds in 2015 and 61 per cent in 2016.
Talent management programmes where they do exist appear to be more comprehensive with an increase in the featuring of talent development, succession planning and behaviours and values. Indicative of the continuing trend of reduced expenditure in the economic climate, recruitment and the rewarding of talent are less likely to be part of the programme.
The UK consistently reports a higher than global average of features within its talent management programmes. APAC (25 per cent) is the least likely region to include early careers as part of its programme, well below the global average of a third.
APAC (65 per cent) and UK (60 per cent) respondents are most likely to have a formal talent management programme in place. The Nordic HR professionals are the least likely (46 per cent), which is below the global average (55 per cent).
TALENT MANAGEMENT!"#$%&"'(%"()*+,$*-,"+%.*/#%*%0"(1*2%3*2#+-%4*+*)#1#+-%5(")(*11#%,+%62*7#8
9:;< 9:;= 9:;>!"# $$% &'% &(%
55%
61% 63%
50%
55%
60%
65%
2017 2016 2015
Yes
!"#$%&'#()*+#,-%&#$-./#0*1%2+#3*2*4%5%2+#&+/*+%4$#6271.,%8#9+67:#*11#+)*+#*;;1$<
=>?@ 7)*24% =>?A!"#$%&'($)$#*+,$%& -./ 01 2./3455$667*%'+#"%%7%8 22/ . 20/
9"%"8$,$%&'($)$#*+,$%& 2./ . 21/:$;")7*4<6'"%(')"#4$6 .=/ = .1/
>$5<47&,$%& =1/ ?0@ .@/>$A"<(7%8'&"#$%& BC/ B B=/
D"<#E'5"<$$<6F @./ 'FG$A'H*<'I102
10
6
6
5
-13
4
Talent development
Succession planning
Management development
Behaviours and values
Recruitment
Rewarding talent
!"#$%&
'()*+,*-,./01*201(3+*40305(/(3+*63*7108(
!"!# $%&'()*+, %-&./ $0&1*)2345 6$&
78*9:8;!< %%&
65%
53% 60%
46%
55%
0%
10%
20%
30%
40%
50%
60%
70%
APAC Europe UK Nordics Global Av

GLOBAL RESULTS
HARVEY NASH HR SURVEY 201724
Almost half of our respondents (46 per cent) appear to be measuring the effectiveness of their leadership development, which is equal to last year. As with talent management programmes, where they are in place they would appear to be getting more comprehensive.
For those that are measuring leadership effectiveness, a number of strategies are in place. More than three-quarters use leadership behaviours (76 per cent), just over half (54 per cent) use employee retention numbers and almost half use formal assessments (47 per cent).
When it comes to developing leadership, half of our HR professionals (49 per cent) are doing this in-house compared with just under a quarter (24 per cent) outsourcing to an external company. The use of coaching (17 per cent) and mentoring (10 per cent) remains low.
Do you measure leadership effectiveness?
Leadership behaviours measured more than profitability
Developing leaders in-house
APAC leads the way in measuring leadership
Chart 27. Do you measure the effectiveness of your leadership development?
Chart 28. How do you measure your leadership development? Please tick all that apply
Chart 29: How do you carry out your leadership development?
Chart 30. Do you measure the effectiveness of your leadership development? - By region
LEADERSHIP
19 33 28 29 20 1533
Doyoumeasuretheeffectivenessofyourleadershipdevelopment?
2017Yes 46No 54
46% 54%
2017
Yes
No
!"#$%&'#()*#+)#,)-#.%/&-0%#,)-0#1%/+%0&(23#+%4%1)3.%567#81%/&%#629:#/11#6(/6#/331,
;<=> ;<=?!"#$%&'($)"*+,%-+.+,' /01 231
4#$."'55()5,5&,+"&(*+67)58 031 /91:5%;5)8<+$(-5<%=+"7)8 9>1 001
?")#%.(%88588#5&,@ 391@A5B(*")(2CD9
35%
54%
76%
47%
24%
37%
55%
0% 10% 20% 30% 40% 50% 60% 70% 80%
Company profitability
Employee retention figures
Leadership behaviours
Formal assessment*
2017
2016
!"#$%"$&"'$()**&$"'+$&"'*$,-)%-*./01$%-2-,"13-4+5
!"#$%&' ()*+$,-#."/ 01*
2%3&$%4-'53$5,"5'63'4",75-$89,": ;(*<'"3$4."/594$/4,88' 0=*
49%
17%
24%
10%
Chart Title
In-house
Coaching
Outsource to an external company
Mentoring programme
!"#$"%#&'()%*'#+,'#'--'.+/0'1'))#"-#$"%*#2'(3'*),/4#3'0'2"4&'1+5
!"#$%&"'("#)"&$*+, -.-/ 01&)+2$ 3%&1," 45 6718#7'-9:"$ ;<= ><= >>= >?= >;=
62%
42% 44% 48% 46%
0%
20%
40%
60%
80%
APAC Nordics Europe UK Global Av
* New for 2017
GLOBAL RESULTS
HARVEY NASH HR SURVEY 201725
SKILLS AND PERFORMANCE
Organisations develop skills effectively
High performance strategies remain important
A quarter of performance management programmes are comprehensive
Chart 31. How strongly do you agree that your organisation provides an effective environment to develop skills?
Chart 32. To what extent is a high performance strategy important to your company?
Chart 33. To what extent has a performance management programme been implemented at your company?
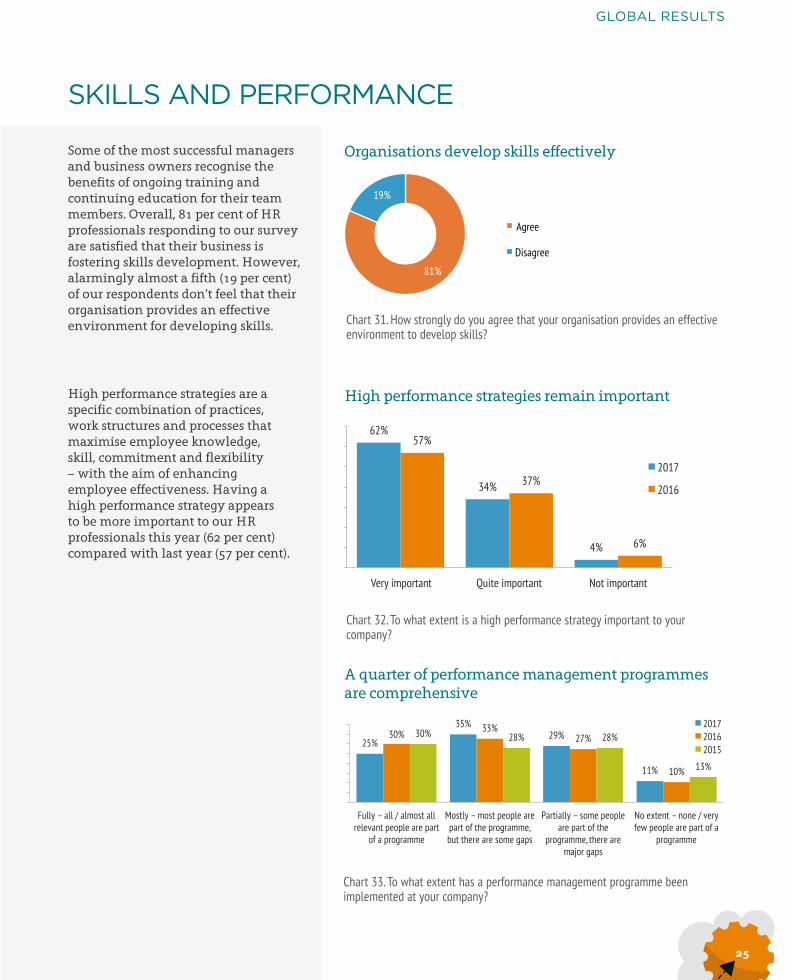
Some of the most successful managers and business owners recognise the benefits of ongoing training and continuing education for their team members. Overall, 81 per cent of HR professionals responding to our survey are satisfied that their business is fostering skills development. However, alarmingly almost a fifth (19 per cent) of our respondents don’t feel that their organisation provides an effective environment for developing skills.
High performance strategies are a specific combination of practices, work structures and processes that maximise employee knowledge, skill, commitment and flexibility – with the aim of enhancing employee effectiveness. Having a high performance strategy appears to be more important to our HR professionals this year (62 per cent) compared with last year (57 per cent).
Howstronglydoyouagreethatyourorganisationprovidesaneffectiveenvironmenttodevelopskills?
Agree 82%Disagree 19%
81%
19%
Chart Title
Agree
Disagree !"#$%&'#()'(*'#+,#&#%+-%#.(/0"/1&*2(#,'/&'(-3#+1."/'&*'#'"#3"4/#2"1.&*35
6789 678:!"#$%&'()#*+,* -./ 01/
23&*"%&'()#*+,* 45/ 41/6)*%&'()#*+,* 5/ -/
62%
34%
4%
57%
37%
6%
0%
10%
20%
30%
40%
50%
60%
70%
Very important Quite important Not important
2017
2016
!"#$%&'#()'(*'#%&+#&#,(-."-/&*0(#/&*&1(/(*'#,-"1-&//(#2((*#3/,4(/(*'(5#&'#6"7-#0"/,&*68
!"##$%&%'##%(%'#)*+,%'##%-.#./'0,%1.*1#.%'-.%1'-,%*2%'%1-*3-')).4*+,#$%&%)*+,%1.*1#.%'-.%1'-,%*2%,5.%1-*3-')).6%7",%,5.-.%'-.%+*).%3'1+
8'-,9'##$%&%+*).%1.*1#.%'-.%1'-,%*2%,5.%1-*3-')).6%,5.-.%'-.%)':*-%3'1+;*%.<,.0,%&%0*0.%(%/.-$%2.=%1.*1#.%'-.%1'-,%*2%'%1-*3-')).
25%
35% 29%
11%
30% 33% 27%
10%
30% 28% 28%
13%
0% 5%
10% 15% 20% 25% 30% 35% 40%
Fully – all / almost all relevant people are part
of a programme
Mostly – most people are part of the programme, but there are some gaps
Partially – some people are part of the
programme, there are major gaps
No extent – none / very few people are part of a
programme
2017 2016 2015

GLOBAL RESULTS
HARVEY NASH HR SURVEY 201726
There has been a slight fall in the numbers of HR professionals reporting satisfaction with diversity within their organisation this year (56 per cent) compared with last year’s survey result of 58 per cent.
The implementation of formal strategies and policies for increasing diversity has remained relatively static over the last three years.
Decreased satisfaction with diversity
No real change in formal strategies for diversity
Chart 34. Are you satisfied with how diversity is progressing in your organisation?
Chart 35. To what extent do you have a formal strategy / policy for promoting diversity in your organisation?
DIVERSITY
2017Yes 56%No 44%
56%
44%
Chart Title
Yes
No
!"#$%&'#()'(*'#+"#,"-#%&.(#&#/"01&2#3'0&'(4,#5#6"278,#/"0#60"1"'7*4#+7.(037',#7*#,"-0#"04&*73&'7"*9
!"#$ !"#%:-22,#;#$(#%&.(#&22#5#&21"3'#&22#'%(#0(2(.&*'#6"2787(3#7*#62&8(<=> <<>
?"3'2,#@#$(#%&.(#1"3'#7*7'7&'7.(3#7*#62&8(A#B-'#'%(0(#&0(#3'722#4&63C=> CC>D&0'7&22,#;#$(#%&.(#"1(#7*7'7&'7.(3#7*#62&8(A#'%(0(#&0(#1&E"0#4&63CF> <G>
H"#()'(*'#@#*"*(#5#.(0,#/($#7*7'7&'7.(3#&0(#7*#62&8( FI> FJ>
20%
30% 31%
19% 22%
33% 28%
17% 19%
32% 29%
20%
0% 5%
10% 15% 20% 25% 30% 35%
Fully – we have all / almost all the relevant
policies in place
Mostly - we have most initiatives in place, but
there are still gaps
Partially – we have a some initiatives in place,
there are major gaps
No extent - none / very few initiatives are in
place
2017
2016
2015

HARVEY NASH HR SURVEY 201727
Gender diversity still the major focus
Chart 36. Which areas are your organisation actively pursuing to be more diverse?
GLOBAL RESULTS
Gender (60 per cent) and ethnicity (41 per cent) still top the charts for the type of diversity being pursued. Around a third of our HR professionals are looking for functional expertise (34 per cent) and international expertise (32 per cent). Cultural (40 per cent) and age (38 per cent) diversification are also a high priority for our respondents.
Just over one in four respondents in the APAC region (41 per cent) are likely to be seeking more international expertise. The APAC region is also the most likely to be seeking cultural and functional diversity. After a year of high-profile LGBT discussion in the press, the UK is more likely to be seeking LGBT diversity (23 per cent) compared with the European average (16 per cent).
Europe twice as likely as APAC to seek gender diversity
Chart 37. Which areas are your organisation actively pursuing to be more diverse? - By region
!"#$"%&'(&)%#)%*+,'%+'-&.#)&/#+.%&$/#0(1*%2,'),#.-%/+%3(%4+'(%5#0(')(6
!"#$%&'()*&+(),%#"-.&/)&'0)12&'#3"'0"2 456789%&/)$&9:328.'0 4;6
<9&0"=%9)$&9:328.'0 >46?'@"2'&@%8'&/)"-A"2@%#" >B6
C.'9@%8'&/)"-A"2@%#" >56<3" >D6
E./@.2" 5F6G@H'%9%@+ 546
*"'0"2 ;F6
14%
16%
31%
32%
34%
38%
40%
41%
60%
0% 10% 20% 30% 40% 50% 60% 70%
Lesbian, Gay, Bisexual and Transgender
Social background
Academic background
International expertise
Functional expertise
Age
Culture
Ethnicity
Gender
!"#$%&"'()&*+,-').()/$,"*0
!"#$%&'(&)*+$,%*-" ./.0 1',2*3% 45,'#$ 67 89':;9&.+8$<2$, =>? @A? @B? @B? @>?4-C<*3*-" DA? =D? ==? BE? =F?059-5,$ BD? =F? EG? E@? =>?.H$ EB? EA? EG? =F? EG?I5<3-*'<;9&4J#$,-*%$ BA? D@? DG? EF? E=?.3;2$K*3&:;3LH,'5<2 =D? EB? DM? DA? EF?N<-$,<;-*'<;9&$J#$,-*%$ =F? EF? E>? D@? ED?O'3*;9&:;3LH,'5<2 DG? F>? F=? DF? F=?P8Q! F=? F>? F@? DE? F@?
0%
10%
20%
30%
40%
50%
60%
70%
80% APAC Nordics Europe UK Global Av

GLOBAL RESULTS
HARVEY NASH HR SURVEY 201728
Job turnover would appear to be down for our HR professionals, with less than a fifth being in their post for under a year (19 per cent) and a fifth planning to move in the coming year. A third of our respondents have held their position within their organisation for more than six years. Exactly half plan to stay at their current job for more than three years.
Broadly speaking, our HR professionals are happy within their current roles, with more than eight out of ten (84 per cent) reporting that they find their role quite or very fulfilling.
Job turnover holding steady compared with last year
HR professionals generally finding their roles more fulfilling this year
Chart 38. How long have you worked for your current employer?
Chart 39. How long, from this point onwards, do you expect to stay with your current employer?
Chart 40. How fulfilling do you find your current role?
HR CAREER
!"#$%"&'$()*+$,"-$#"./+0$1".$,"-.$2-..+&3$+45%",+.6
789: 789; 789< 789=!"##$%&'($)$*"'+ ),- .)- )/- )0-
)$1$.$*"'+# .2- ./- .3- ./-4$1$2$*"'+# .4- .,- ./- ./-
/$1$)5$*"'+# .)- )/- )3- )3-67+"$%&'($)5$*"'+# ).- 3- ).- )4-
0%
5%
10%
15%
20%
25%
30%
35%
Less than 1 year 1 - 2 years 3 - 5 years 6 - 10 years More than 10 years
2017
2016
2015
2014
!"#$%"&'($)*"+$,-./$0".&,$"*2/($2"$3"4$56057,$,"$/,13$#.,-$3"4*$74**5&,$5+0%"35*8
9:;< 9:;= 9:;> 9:;?!"##$%&'($)$*"'+ ,-. ,-. ,/. ,0.
)$1$,$*"'+# 0). 0-. 0-. 00.0$1$2$*"'+# 03. 02. ,4. 0).
5$1$)-$*"'+# )). 6. 6. 4.78+"$%&'($)-$*"'+# 2. 5. 5. 2.
0%
5%
10%
15%
20%
25%
30%
35%
40%
Less than 1 year 1 - 2 years 3 - 5 years 6 - 10 years More than 10 years
2017
2016
2015
2014 !"#$%&'%(''()*$+"$,"&$%()+$,"&-$.&--/)0$-"'/1
2345!"#$%&'(&)(()*+ ,-.
/')0"%&'(&)(()*+ 12.340%5"#$%&'(&)(()*+ 6,.340%70%7((%&'(&)(()*+ ,.
34%
50%
13%
3%
Chart Title
Very fulfilling
Quite fulfilling
Not very fulfilling
Not at all fulfilling

GLOBAL RESULTS
HARVEY NASH HR SURVEY 201729
Our HR professionals appear to take pride in their work and more than half (51 per cent) report that the sense of HR having an important role to play within their organisations contributes most to their sense of fulfilment.This year our respondents were less likely to say that being well paid contributed to their sense of job satisfaction and were more likely to say that the access and ability to shape business strategy were driving factors.
Having more say is a key factor to job fulfilment
Table 5. Please identify the three factors which contribute most to your sense of fulfillment.
Being offered a fresh challenge was the best potential offer that could prise our HR professionals away from their current role. Forty-two per cent might also be persuaded to leave for a role that offered more opportunity to be involved in business strategy. Our female respondents were most likely to leave to achieve a better work/life balance and the male respondents for cold hard cash.
The fastest-growing incentive to move job is being offered a seat on the board
2017 Change 2016 2015 2014
A sense that HR / Talent has an important role to play in the organisation 51% 2
49%51% 58%
Interesting and exciting work 47% 3 44% 53% 55%An opportunity to shape the business strategy 42% 5 37% 41% 41%
A feeling that I am empowered 41% 3 38% 42% 40%Access to management / contribute to strategy 39% 7 32% 34% 37%An opportunity to challenge the status quo* 33% n/a n/a n/a n/a A culture of open communication 29% 1 28% 21% 24%Competent management and a vision for the future 26% 3 23% 28% 27%Good salary 24% -3 27% 22% 26%A reputation for fairness and respect 23% 3 20% 18% 20%A creative / entrepreneurial environment 21% -1 22% 22% 21%Working for a brand I align with 20% 2 18% 18% 17%The opportunity to build a rewarding career 18% -2 20% 19% 20%A financially secure organisation 14% -4 18% 14% 14%A large organisation - international career opportunities 13% 1 12% 11% 13%
*New for 2017
2017 2016 2015
A fresh challenge 65% 64% 67%Greater budget responsibility 11% 14% 9%Greater financial stability of employer 13% 14% 9%Major change programme 24% 24% 21%Seat on the board 26% 21% 18%Better work/life balance 43% 42% 36%Greater involvement in business strategy 48% 48% 45%More money 39% 42% 33%
Table 6. If you were to move to a new role/organisation, which of the following factors would most affect your decision making?

GLOBAL RESULTS
HARVEY NASH HR SURVEY 201730
The reporting hierarchy for our HR professionals stays similar to last year with just under half reporting to the chief executive or managing director.
More than half of HR professionals responding to the survey are members of the operational board or the executive management team.
More HR professionals aspire to a board position but are less likely to want to be a chief executive or managing director.
The majority of respondents report to the board
More than half of HR professionals hold a key position
HR director is a key aspirational role
Chart 41. Who do you report to?
Chart 42. Are you a member of the operational board/executive management team of your organisation?
Chart 43. What role do you ultimately aspire to?
!"#$%#$&#'$()*#(+$+#,
-./0 -./1!"#$%&'($)*+#,$-./0/1#01&2#3$)+43 567 587
9:$3/+#40;&2#3$)+43-!"#$%&9:$3/+#01&9%%#)$3 <7 =7!"#$%&>?&9%%#)$3 @A7 @A7
9+"$3&!BC$,$D E7 57FG-2#3$)+43-H$0#43&./0/1$3&>? @A7 IJ7
46%
9%
18%
3%
18%
45%
7%
18%
4%
20%
2017
2016
!"#$%&'$($)#)*#"$&+$,-#$&.#"(,/&0(1$*&("23#4#5',/6#$)(0(7#)#0,$,#()$&+$%&'"$&"7(0/8(,/&09
!"#$ !"#% !"#&:#8 ;<= ;>= ;?=
51%
54%
50%
46% 48% 50% 52% 54% 56%
2017 2016 2015
Yes
0%
5%
10%
15%
20%
25%
30% 2017
2016
2015
GLOBAL RESULTS
HARVEY NASH HR SURVEY 201731
SALARY
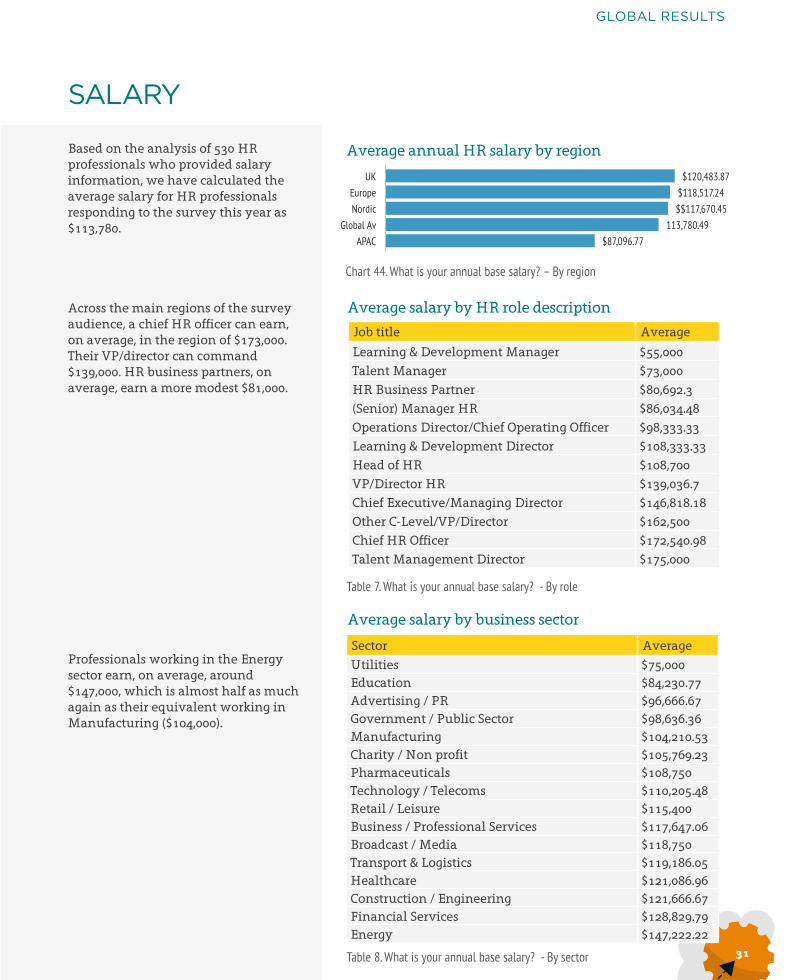
Based on the analysis of 530 HR professionals who provided salary information, we have calculated the average salary for HR professionals responding to the survey this year as $113,780.
Across the main regions of the survey audience, a chief HR officer can earn, on average, in the region of $173,000. Their VP/director can command $139,000. HR business partners, on average, earn a more modest $81,000.
Professionals working in the Energy sector earn, on average, around $147,000, which is almost half as much again as their equivalent working in Manufacturing ($104,000).
Average annual HR salary by region
Chart 44. What is your annual base salary? – By region
Average salary by HR role description
Average salary by business sector
Table 7. What is your annual base salary? - By role
Table 8. What is your annual base salary? - By sector
$87,096.77 113,780.49
$$117,670.45 $118,517.24 $120,483.87
0.00 20,000.00 40,000.00 60,000.00 80,000.00 100,000.00 120,000.00 140,000.00
APAC Global Av
Nordic Europe
UK
Sector AverageUtilities $75,000Education $84,230.77Advertising / PR $96,666.67Government / Public Sector $98,636.36Manufacturing $104,210.53Charity / Non profit $105,769.23Pharmaceuticals $108,750Technology / Telecoms $110,205.48Retail / Leisure $115,400Business / Professional Services $117,647.06Broadcast / Media $118,750Transport & Logistics $119,186.05Healthcare $121,086.96Construction / Engineering $121,666.67Financial Services $128,829.79Energy $147,222.22
Job title Average
Learning & Development Manager $55,000Talent Manager $73,000HR Business Partner $80,692.3(Senior) Manager HR $86,034.48Operations Director/Chief Operating Officer $98,333.33Learning & Development Director $108,333.33Head of HR $108,700VP/Director HR $139,036.7Chief Executive/Managing Director $146,818.18Other C-Level/VP/Director $162,500Chief HR Officer $172,540.98Talent Management Director $175,000

GLOBAL RESULTS
HARVEY NASH HR SURVEY 201732
Sadly, our survey showed that the gender pay gap is still in existence for our HR professionals, with our male respondents earning on average around $135,000, which is a third more than the average female who earns in the region of $101,000. To compound this, the pay gap existed across all levels of respondents’ job roles. The margin was 22 per cent difference for C-level respondents and 21 per cent for other HR roles.
More than one in seven HR professionals are in receipt of a performance bonus as part of their reward package (72 per cent), which is down slightly on last year (75 per cent).
More HR professionals are satisfied with their remuneration package this year compared with 2016. Nearly two-thirds believe that they are being paid what they are worth and a further 13 per cent consider themselves extremely satisfied and rewarded well for what they do.
*The currency used in this survey is US Dollars (USD). At the launch of the survey the conversion rate was 1 USD = 0.82 GBP; 0.90 Euro; 8.22 Norwegian Krone; 8.83 Swedish Krona; 0.99 Swiss Franc
Gender pay gap still in evidence
Fewer HR professionals are in receipt of a performance bonus compared with last year
More respondents are extremely satisfied with their salary
$101,116.20
$134,554.46
Female
Male
!"#$%&'$#()*)+(#$,&"$-$.#",&"/-01#$+&0'23
4567 45689#2 !"# !$#:& "%# "$#
72% 75%
28% 25%
0% 20% 40% 60% 80%
2017 2016
Yes
No
!"#$%&&'()*+(,%-.,/.#0(%$#(1*2(+.-)(1*2$(32$$#4-($#524#$%-.*4(6%37%8#9
:;<=>?-$#5#&1(,%-.,/.#0(@(A(%5(+#&&($#+%$0#0(/*$(+)%-(A(0*!"#
B%-.,/.#0(@(A(C#&.#"#(51($#425#$%-.*4(6%37%8#(.,(/%.$$%#D.,,%-.,/.#0(@(A(/##&(A(%5(6%.0(&#,,(-)%4(+)%-(A(%5(+*$-) &"#
13%
64%
23%
Chart Title
Extremely satisfied - I am well rewarded for what I do
Satisfied - I believe my renumeration package is fair
Dissatisfied - I feel I am paid less than what I am worth
Chart 45. What is your annual base salary? - By gender
Chart 46. Are you eligible for a performance bonus?
Chart 47. Overall, how satisfied are you with your current remuneration package?

GLOBAL RESULTS
HARVEY NASH HR SURVEY 201733
2. REGIONAL PROFILES

REGIONAL PROFILES
HARVEY NASH HR SURVEY 201734
ASIA-PACIFIC (APAC) REGION
Compared with the global average, an HR professional from APAC is…
More likely to be satisfied with HR image66 per cent report that they are satisfied with the image of HR within the business compared with the global average of 63 per cent
Least reliant on flexible labour27 per cent of APAC organisations responding have no flexible labour in their workforce compared with the global average of 12 per cent
Most likely to report that employee engagement has got worse30 per cent report that engagement levels have worsened compared with the global average of 19 per cent
Most varied in payThe overall average salary was $87,096 across the region, but big differences from country to country
The most likely to measure leadership62 per cent are measuring leadership behaviours compared with the global average of 46 per cent
Most likely to have formal talent management programmes65 per cent report having formal talent management programmes compared with the global average of 55 per cent
Most likely to employ overseas labour18 per cent report having no overseas labour within their business compared with the global average of 29 per cent
Least likely to be pursuing gender diversity40 per cent are pursuing gender diversity compared with the global average of 60 per cent
Top growing board priority: Leadership capability64 per cent of boards see this as priority, compared to 48 per cent last year
Asia-PAC includes Australia, China, Japan, Singapore and Vietnam.

REGIONAL PROFILES
HARVEY NASH HR SURVEY 201735
Fifteen per cent of our HR professionals were from APAC countries, including Australia, Japan, Singapore, Vietnam and Hong Kong. Our HR professionals responding from the APAC regions are by far the most likely to be concerned with employee retention (66 per cent) compared with the global average of 48 per cent. They are significantly most likely to be concerned with training and education programmes (49 per cent) compared with the global average (34 per cent). They are the most concerned with business efficiency of all the regions and the most likely to be undertaking performance metrics.
The APAC region appears to be showing caution by expressing more concern with nearly every labour trend in our survey than the global average. The one area that concerns APAC less than other regions is an ageing workforce. APAC is twice as likely to be concerned with widespread unemployment (10 per cent) than the global average and significantly more worried about the flow of talent and recruitment possibilities in their geographic territory. The APAC region has a reputation for technological innovation and this perhaps is behind their being the most concerned of all geographies about digital automation taking over from people.
APAC HR priorities
Labour trends for APAC
Chart 48. Key priorities the board wants to address
Chart 49. What labour market trends do you anticipate you will be responding to in the next 2 years?
!"!#$%&'()*)'+ ,-./'01(23)45637542)%'(689340761')%'(: ,;.<57=)>5767?@5%A?7'2 ,B."73C%3?4'D76?723)D( -E.$)F73()2A -B.#4@4>)5)2A64'06D%?@727'D76?4'4+7?7'2 GH.#I4'+76?4'4+7?7'2 ;,.J4'4+7?7'2607F75%@?7'2 ;,.K1DD7(()%' ;,.L1()'7((67CC)D)7'DA ;M.N3+4')(42)%'456+3%&2I ;E.OP6KA(27?(6Q6@3%D7((7( ;R.934)')'+6Q6S01D42)%'6@3%+34??7 ;R.#152137607F75%@?7'2 M-.S?@5%A7767'+4+7?7'2 M;."73C%3?4'D76?4'4+7?7'2 MB.9457'26?4'4+7?7'2 E;.P7D31)2?7'2 EM.T74073(I)@6D4@4>)5)2A EE.S?@5%A7763727'2)%'6Q6?%2)F42)%' EE.
12% 14%
17% 26% 27%
38% 41% 41% 41%
45% 46%
49% 49%
52% 54%
57% 64% 65% 66% 66%
0% 10% 20% 30% 40% 50% 60% 70%
Downsizing Industrial relations (Trade Unions)
Flexible employment Performance metrics
Diversity Capability and competence management
Change management Management development
Succession Business efficiency
Organisational growth HR systems & processes
Training & Education programme Culture development
Employee engagement Performance management
Talent management Recruitment
Leadership capability Employee retention & motivation
!"#$%&'()*'+%,-).-"&/0
1213Widespread unemployment !"#Talent immigration $!#Talent emigration $$#Growing demand for flexible contract employment options - employer $%#Technology automating tasks previously performed by people $&#Education system not aligned with hiring needs $'#Demographic shift / aging workforce %%#Growing demand for flexible contract employment options - employee %%#Tight labour supply and skill shortages generally ()#Recruitment challenges in local economic region )&#
10%
31%
33%
34%
37%
38%
44%
44%
56%
67%
0% 10% 20% 30% 40% 50% 60% 70% 80%
Widespread unemployment
Talent immigration
Talent emigration
Growing demand for flexible contract employment options - employer
Technology automating tasks previously performed by people
Education system not aligned with hiring needs
Demographic shift / ageing workforce
Growing demand for flexible contract employment options - employee
Tight labour supply and skill shortages generally
Recruitment challenges in local economic region

REGIONAL PROFILES
HARVEY NASH HR SURVEY 201736
NORDICS
Compared with the global average, an HR professional from the Nordics is…
Most likely to be satisfied with HR image68 per cent report that they are satisfied with the image of HR within the business compared with the global average of 63 per cent
More likely to use flexible labourOur Nordic respondents were slightly more likely to use flexible labour than the global average
Least likely to feel that levels of employee engagement have changed46 per cent report that engagement levels have stayed the same as last year compared with the global average of 33 per cent
Paid as well as the global averageAverage reported salary was $117,670 compared with the global average of $113,780
The least likely to measure leadership42 per cent are measuring leadership behaviours compared with the global average of 46 per cent
Least likely to have formal talent management programmes46 per cent report having formal talent management programmes compared with the global average of 55 per cent
Least likely to rely on overseas labour36 per cent report having no overseas labour within their business compared with the global average of 29 per cent
Most likely to be pursuing gender diversity67 per cent are pursuing gender diversity compared with the global average of 60 per cent
Top growing board priority: Performance management55 per cent of boards see this as priority, compared to 51 per cent last year

REGIONAL PROFILES
HARVEY NASH HR SURVEY 201737
Nordic HR priorities
Labour trends for Nordics
Thirty-five per cent of our survey respondents were from Norway, Denmark, Finland and Sweden this year. HR professionals in the Nordic regions are most concerned with downsizing (15 per cent) compared with the global average (12 per cent). They are also more concerned with performance management (55 per cent) compared with the global average (52 per cent). They are least likely to be concerned with organisational growth (27 per cent) compared with their global peers (34 per cent). They are least likely to prioritise flexible labour (12 per cent) compared with the global average (14 per cent).
In general Nordic HR professionals are less concerned with the majority of labour trends in comparison with the global average. In particular they seem happier with the talent and recruitment pool available to them than other regions and less concerned about its flow into and away from the region. They are, however, more likely than average to be concerned about widespread unemployment.
x
!"#$%&'()$**+"*
&,-./012345/634)4783,974:; <=>$:.?1;-/@3)-43@;/,:1)[email protected])?:/,:1C <D>E,F:1/G/:H <I>E/J4-1/;9 <K>L4-M,-7@:04)74;-/01 <K>%-H@:/1@;/,:@3)H-,F;N =K>*?00411/,: O=>P@8@6/3/;9)@:.)0,784;4:04)7@:@H474:; O=>Q?1/:411)4MM/0/4:09 OR>B-@/:/:H)S)".?0@;/,:)8-,H-@774 OK>T@:@H474:;).4J43,874:; D<>"783,944)-4;4:;/,:)S)7,;/J@;/,: DO>P?3;?-4).4J43,874:; DR>U!)*91;471)S)8-,041141 DR>PN@:H4)7@:@H474:; DV>B@34:;)7@:@H474:; IO>!40-?/;74:; IO>L4-M,-7@:04)7@:@H474:; II>"783,944)4:H@H474:; IR>([email protected]/8)0@8@6/3/;9 IW>
12% 14% 15%
17% 17%
27% 32% 32%
36% 37%
41% 43%
46% 46%
48% 53% 53%
55% 56%
59%
0% 10% 20% 30% 40% 50% 60% 70%
Flexible employment Industrial relations (Trade Unions)
Downsizing Diversity
Performance metrics Organisational growth
Succession Capability and competence management
Business efficiency Training & education programme
Management development Employee retention & motivation
Culture development HR systems & processes
Change management Talent management
Recruitment Performance management
Employee engagement Leadership capability
!"#$%&'()*'+%,-).-"&/0
1213Widespread unemployment !"#Talent immigration $!#Talent emigration $$#Growing demand for flexible contract employment options - employer $%#Technology automating tasks previously performed by people $&#Education system not aligned with hiring needs $'#Demographic shift / aging workforce %%#Growing demand for flexible contract employment options - employee %%#Tight labour supply and skill shortages generally ()#Recruitment challenges in local economic region )&#
10%
31%
33%
34%
37%
38%
44%
44%
56%
67%
0% 10% 20% 30% 40% 50% 60% 70% 80%
Widespread unemployment
Talent immigration
Talent emigration
Growing demand for flexible contract employment options - employer
Technology automating tasks previously performed by people
Education system not aligned with hiring needs
Demographic shift / ageing workforce
Growing demand for flexible contract employment options - employee
Tight labour supply and skill shortages generally
Recruitment challenges in local economic region
Chart 50. Key priorities the board wants to address
Chart 51. What labour market trends do you anticipate you will be responding to in the next 2 years?

REGIONAL PROFILES
HARVEY NASH HR SURVEY 201738
EUROPE
Compared with the global average, an HR professional from Europe is…
More likely to be satisfied with HR image64 per cent report that they are satisfied with the image of HR within the business compared with the global average of 63 per cent
More likely to have some flexible labour7 per cent report that they employ no flexible labour compared with the global average of 12 per cent
As likely to feel that employee engagement has improved47 per cent report that engagement levels have got better, which is similar to the global average of 48 per cent
Paid slightly better than the global averageAverage reported salary was $118,517 compared with the global average of $113,780
Less likely to measure leadership44 per cent are measuring leadership behaviours compared with the global average of 46 per cent
Less likely to have formal talent management programmes53 per cent report having formal talent management programmes compared with the global average of 55 per cent
Less likely to rely on overseas labour30 per cent report having no overseas labour within their business compared with the global average of 29 per cent
More likely to be pursuing gender diversity65 per cent are pursuing gender diversity compared with the global average of 60 per cent
Top growing board priority: Flexible employment14 per cent of boards see this as priority, compared to 13 per cent last year

REGIONAL PROFILES
HARVEY NASH HR SURVEY 201739
!"#$%&Widespread unemployment !"Talent immigration #$"Talent emigration ##"Growing demand for flexible contract employment options - employer #%"Technology automating tasks previously performed by people #&"Education system not aligned with hiring needs !!"Growing demand for flexible contract employment options - employee %'"Tight labour supply and skill shortages generally %&"Demographic shift / aging workforce ''"Recruitment challenges in local economic region '&"
3%
21%
22%
24%
29%
33%
45%
49%
55%
59%
0% 10% 20% 30% 40% 50% 60% 70%
Widespread unemployment
Talent immigration
Talent emigration
Growing demand for flexible contract employment options - employer
Technology automating tasks previously performed by people
Education system not aligned with hiring needs
Growing demand for flexible contract employment options - employee
Tight labour supply and skill shortages generally
Demographic shift / ageing workforce
Recruitment challenges in local economic region
!"#$%&'()$**+"*",-./0
$12,34-567)-07645.13)89-620),15.13: ;<=>.?135@51A ;<=B70C5D70)0E/7.FE014 ;G=>5H0-354F ;I=J0-K.-E61L0)E04-5L3 ;I=9-65151A)M)"2,L645.1)/-.A-6EE0 NO=%-A6153645.167)A-.?4P N;=Q6/6D5754F)612)L.E/0401L0)E616A0E014 NG=*,LL0335.1 NR=S,351033)0KK5L501LF NR=T!)*F340E3)M)/-.L03303 GO=U616A0E014)20H07./E014 GO="E/7.F00)-040145.1)M)E.45H645.1 GG=Q,74,-0)20H07./E014 GV=!0L-,54E014 GR=QP61A0)E616A0E014 GW=J0-K.-E61L0)E616A0E014 V;=967014)E616A0E014 VX="E/7.F00)01A6A0E014 VR=(0620-3P5/)L6/6D5754F VI=
12% 12% 14%
19% 19%
30% 31%
34% 37% 37%
40% 40%
44% 45% 47% 48%
51% 56% 57% 59%
0% 10% 20% 30% 40% 50% 60% 70%
Industrial relations (Trade Unions) Downsizing
Flexible employment Diversity
Performance metrics Training & Education programme
Organisational growth Capability and competence management
Succession Business efficiency
HR systems & processes Management development
Employee retention & motivation Culture development
Recruitment Change management
Performance management Talent management
Employee engagement Leadership capability
HR priorities
Labour trends for Europe
Forty-three per cent of our respondents this year were from European countries, including Germany, Ireland and Switzerland. Board priorities for our European HR professionals broadly match global averages in most areas. They are as concerned with business efficiency (37 per cent) as the global average, but less concerned with organisational growth (31 per cent) than their global peers (34 per cent).
The diversity of the individual countries forming the European respondents has balanced their concerns around labour trends to broadly match global averages. The rules governing the free movement of people between the EU member states is the likely driver behind Europe’s lack of concern with talent immigration and emigration. Europe is mildly more concerned with the issues surrounding an ageing population than average.
Chart 52. Key priorities the board wants to address
Chart 53. What labour market trends do you anticipate you will be responding to in the next 2 years?

REGIONAL PROFILES
HARVEY NASH HR SURVEY 201740
UNITED KINGDOM
Compared with the global average, an HR professional from the UK is…
Equally likely to be satisfied with HR image63 per cent report that they are satisfied with the image of HR within the business, which is on a par with the global average
Most likely to use flexible labour5 per cent report that they employ no flexible labour compared with the global average of 12 per cent
Most likely to feel that employee engagement has improved54 per cent report that engagement levels have got better, which is above the global average of 48 per cent
Paid better than other regionsAverage reported salary was $120,483 compared with the global average of $113,780
More likely to measure leadership48 per cent are measuring leadership behaviours, which is above the global average of 46 per cent
More likely to have formal talent management programmes60 per cent report having formal talent management programmes compared with the global average of 55 per cent
Less likely to rely on overseas labour27 per cent report having no overseas labour within their business, which is less than the global average of 29 per cent
More likely to be pursuing gender diversity65 per cent are pursuing gender diversity compared with the global average of 60 per cent
Top growing board priority: Flexible employment 15 per cent of boards see this as priority, compared to 10 per cent last year

REGIONAL PROFILES
HARVEY NASH HR SURVEY 201741
Nearly a third of our survey respondents this year were from the UK. They are most likely to be concerned with leadership capability (68 per cent) compared with the global average (58 per cent); more likely to be concerned with flexible employment (16 per cent) compared with the global average (14 per cent); most likely to be concerned with succession (48 per cent) compared with the global average (38 per cent); and least likely to be concerned with downsizing (9 per cent) compared with the global average (12 per cent).
Our survey results this year are a possible reflection of the uncertainty that is currently faced by HR professionals in the UK as a result of the Brexit referendum. Almost across the board our UK respondents reflect higher levels of concern around labour trends than their counterparts in other regions. The notable exception to this would appear to be the issue of widespread unemployment, which concerns the UK significantly less than the other regions.
HR priorities for the UK
Labour trends for UK
!"#$%&'()$**+"*+,
-./0123204 56$07819:2;<):=<;92.01)>?:;7=)802.01@ AA6B<=C2D<=)=EF<.GE=09 AH6?:;20204)I)"78J;92.0)F:.4:;EE= KL6-2M=:129G KL6N=:O.:E;0J=)E=9:2J1 KL6P!)*G19=E1)I)F:.J=11=1 LQ6!=J:829E=09 LR6%:4;021;92.0;<)4:./9S LR6T8120=11)=OO2J2=0JG UV6W;F;D2<29G);07)J.EF=9=0J=)E;0;4=E=09 UV6X;0;4=E=09)7=M=<.FE=09 UA6"EF<.G==):=9=092.0)I)E.92M;92.0 UR6W8<98:=)7=M=<.FE=09 UY6*8JJ=112.0 UY6N=:O.:E;0J=)E;0;4=E=09 U56WS;04=)E;0;4=E=09 QV6?;<=09)E;0;4=E=09 QY6"EF<.G==)=04;4=E=09 HL6(=;7=:1S2F)J;F;D2<29G HY6
9% 11%
16% 23% 23% 23%
35% 37% 37%
40% 40% 41%
47% 48% 48% 49% 50%
58% 63%
68%
0% 10% 20% 30% 40% 50% 60% 70% 80%
Downsizing Industrial relations (Trade Unions)
Flexible employment Training & education programme
Diversity Performance metrics
HR systems & processes Recruitment
Organisational growth Business efficiency
Capability and competence Management development
Employee retention & motivation Culture development
Succession Performance management
Change management Talent management
Employee engagement Leadership capability
!"Widespread unemployment !"Talent immigration #!"Growing demand for flexible contract employment options - employer #$"Technology automating tasks previously performed by people $!"Talent emigration $$"Education system not aligned with hiring needs $%"Growing demand for flexible contract employment options - employee &&"Tight labour supply and skill shortages generally &'"Recruitment challenges in local economic region (!"Demographic shift / aging workforce (#"
1%
21%
23%
31%
33%
38%
55%
59%
61%
62%
0% 10% 20% 30% 40% 50% 60% 70%
Widespread unemployment
Talent immigration
Growing demand for flexible contract employment options - employer
Technology automating tasks previously performed by people
Talent emigration
Education system not aligned with hiring needs
Growing demand for flexible contract employment options - employee
Tight labour supply and skill shortages generally
Recruitment challenges in local economic region
Demographic shift / ageing workforce
Chart 54. Key priorities the board wants to address
Chart 55. What labour market trends do you anticipate you will be responding to in the next 2 years?

Harvey Nash Group plcwww.harveynash.com