has the quality of immigrants declined? evidence from the labor market attachment of immigrants and...
TRANSCRIPT

HAS THE QUALITY OF IMMIGRANTS DECLINED? EVIDENCE FROM THE LABOR MARKET ATTACHMENT OF IMMIGRANTS AND NATIVES
RICHARD FRY*
7
ABBREVIATION CPS: Current Population Survey
This is an investigation of the labor market activities I$ U.S. immigrants who arrived from the 2960s through the 1980s. Relative to natives, upon arrival male immigrants who urrived during the 1980s are more likely to be persistently jobless than are male immigrants who arrived during the 1960s. The increased disengagement 4 immigrant arrivals from the U.S. labor market appears solely in the form of labor market withdrawal and has not manFsted itseF in increased institutionalization. Though the “new immigration” apparently does not increase fiscal burdens on the penal system, it nonetheless is expanding the dependent population. The greater labor market idleness I$ today’s immigrants relative to pre-1970 arrivals is consistent with a growing body of: economic midence suggesting a deterioration of U.S. immigrants‘ labor market capital and success during the post war period.
I. INTRODUCTION
Proposition 187 and the uptick of U.S. Congressional initiatives demonstrate re- newed debate on the merits of many U.S. immigration policies. lieformers challenge the levels of legal immigration and the cri- teria for admission as well as immigrants’ entitlement to an array of public services and transfers. (In this paper, ”immigrants” refer to the foreign born, not permanent resident aliens.) Economics literature on the impacts of immigrants on native U.S. workers’ wage and employment opportu- nities is growing. Other economic research simply seeks to evaluate immigrants’ labor market and social characteristics, com-
*Labor Economist, Division of Immigration Policy & Research, U.S. Department of Labor, email: [email protected]. The author thanks Stephen Trejo and Mark Regets for assistance in obtaining 1970 census data and Kristin Butcher, Greg DeFreitas, Edward Funkhouser, and Stephen Trejo for their comments. This is a revised version of a paper presented at the Western Economic Association International 70th An- nual Conference, San Diego, Calif., July 8, 1995. The analyses and conclusions are solely the author’s and do not necessarily represent the views of the U.S. De- partment of Labor.
Contemporary Economic Policy (ISSN 1074-3529) Vol. Xrv, July 1996
53
OWestern Economic Association International

54 CONTEMPORARY ECONOMIC POLICY
times as many prime-age, out-of-school men did not work at all during the year. Today more than one out of 20 prime-age men are not employed, not enrolled in school, and have not worked in the past 15 months.
Second, immigration is an important source of U.S. population growth. Demog- raphers project that under current U.S. im- migration law, immigrants and their chil- dren account for about half of the country’s population growth presently and will account for 60 percent within a few decades. By 2040, projections suggest that one in four U.S. residents will be an immigrant or the child of an immigrant. In addition, immigration is contributing to the further racial/ethnic diversification of the population (see Fix and Passel, 1994).
At the margin, therefore, the human capital or skills that immigrants bring to the labor market deserve scrutiny. Non- elderly males may lack the skills or abili- ties to land employment or a seat in school. If new immigrants are contributing to the young male population outside the labor market, then the new immigrant flows are exacerbating the dependent pop- ulation and the population eligible for cash income transfers. (For nonelderly males labor market nonparticipation is a necessary condition for receiving many public cash income transfers, including general assistance and disability payments under social security and supplemental se- curity income.) In addition, the new immi- grants may be expanding the urban ”un- derclass.” National assessment of U.S. im- migration policies should consider these characteristics.
1 1 . THE ECONOMIC QUALITIES OF RECENT IMMIGRANTS
Two recent studies by Bojas compare, with respect to economic traits, immi- grants arriving during the 1980s with those arriving before 1970. (Funkhouser and Trejo, 1995, Butcher and Piehl, 1995, and Funkhouser, 1995, examine various
characteristics of 1980s immigrants but do not compare these newest arrival cohorts to pre-1970 arrivals.) Borjas (1995a) uses 1970,1980, and 1990 census data to exam- ine the log hourly wage rate of immigrant cohorts relative to natives. Restricting his analysis to males aged 25-64, he finds that upon arrival, the 1985-1989 arrival cohort received lower relative wage rates than did the 1965-1969 arrival cohort. The pre- cise magnitude of the decline depends on the method of analysis, but a 15 percent- age point decline is representative. Borjas also responds to concerns that immigrant performance upon entry is a poor measure of long-run immigrant achievement. He finds that the lower initial starting posi- tions of 1970s immigrants have not been offset by higher subsequent wage growth, leading to the projection that 1980s immi- grants will never achieve hourly wage rate parity with natives.
Economists often use the price of labor to measure immigrant quality despite the associated methodological problems. Among other difficulties, a price of labor measure is readily constructed only for persons who generate earnings, i.e., the employed population. Among prime-age males, about one out of eight lacks a job. On a different vein, Borjas (1995a) uses census data to examine trends in the hourly wage rate. The census, unlike the CPS, asks the respondent to report only his/her annual earnings. Fortunately, other measures of immigrant achievement are available to supplement the findings based on earnings measures.
Bojas (1995b) uses 1970 to 1990 census data to examine the propensity of house- holds (with heads aged 18 and over) to receive cash welfare benefits-AFDC, SSI, and general assistance. He classifies household nativity status by using the na- tivity of the household head. Among male- headed households, Borjas finds that upon entry, 1980s immigrant arrivals were more likely to receive cash welfare than were 1960s immigrant arrivals. Native male-

FRY: HAS THE QUALITY OF IMMIGRANTS DECLINED? 55
headed households also increased their welfare usage between 1970 and 1990. Yet the increase was much greater among re- cently arrived immigrants than among na- tives, so that relative to natives, 1980s ar- rivals appear ”more welfare-prone” than do 1960s arrivals.
Borjas’s (1995b) results may hinge on the level of analysis he elects-the house- hold. His procedures classify a household as receiving welfare if any household member (regardless of nativity) receives welfare. An analysis of welfare participa- tion at the individual level very likely would reveal different immigrant welfare propensities over time.
For all immigrant households, Borjas (1995b) reports that 8.7 percent received welfare during 1979 and 9.1 percent re- ceived welfare during 1989. For all native households, Borjas’s corresponding fig- ures are 7.9 percent and 7.4 percent. Thus, he asserts that “the ’welfare gap’ between immigrants and natives widened substan- tially” during the 1980s. However, the wel- fare gap did not widen among immigrant and native persons from 1979 to 1989. Pas- sel and Fix (1994) use 1980 and 1990 census data to examine individual propensities to receive AFDC, SSI, and general assistance among those aged 15 and over. They re- port that among immigrants, 4.8 percent received cash welfare during 1979 and 4.7 percent during 1989. Among natives, the corresponding figures are 4.3 percent and 4.2 percent. Hence, relative to natives, im- migrant individuals were no more likely to receive cash welfare in 1989 than in 1979.
In sum, the extant literature on the qual- ity of 1980s immigrants examines several dimensions of behavior and points to a marked falling off in achievement. Trends in male labor market idleness, however, have not yet received special attention.
111. SUMMARY STATISTICS
This examination of nonelderly male immigrants’ economic activities utilizes
data extracts from the 1970 3 percent and 1980 and 1990 5 percent public-use micro samples of the decennial census. [Obtain- ing a 1970 3 percent sample involves com- bining the 1970 1 percent Neighborhood Characteristics file (5 percent data), the 1970 1 percent State file (5 percent data), and the 1970 1 percent SMSA and County Group file (5 percent data).] The extracts include all immigrants and all natives from smaller native populations but ran- dom subsamples of the larger native pop- ulations from each Census micro sample. (According to U.S. Census Bureau prac- tices, an ”immigrant” is not a U.S. citizen or is a U.S. citizen by naturalization. This implies that those born in Puerto Rico and Guam are classified as natives.) The de- scriptive analysis presents appropriately weighted statistics in order to portray ac- curately the behavior of the U.S. male pop- ulation, including noncivilians and the in- stitutionalized. The analysis exclusively il- luminates the behavior of young and prime-age men in order to abstract from any possible differences in retirement be- havior between immigrants and natives.
Table 1 shows basic demographic char- acteristics of recent immigrants and na- tives at each census. ”Recent immigrants” denotes those who arrived within five years of the census: those who entered after 1984 for the 1990 census, those who entered after 1974 for the 1980 census, and so forth. The examination focuses on the characteristics of the recent immigrant flows to the United States and purges the traits of older waves of immigrants. Rela- tive to 1960s proportions, 1980s immigrant arrivals are more Hispanic, more nonwhite (reflecting increased immigration of As- ians), and somewhat more black. Follow- ing Borjas (1995a), table 1 also indicates that immigrants to the United States are increasingly educated. The fraction of im- migrant arrivals having either less than a ninth grade education or lacking a high school diploma has dropped since 1970. Yet, the native male population has made

TABL
E 1
Sele
cted
Cha
ract
eris
tics
of N
ativ
e an
d R
ecen
t Im
mig
rant
Men
, Age
d 16
to 5
4
1970
19
80
1990
8 Z
Rec
ent
Rec
ent
Rec
ent
1 C
hara
cter
istic
N
ativ
e Im
mig
rant
a N
ativ
e Im
mig
rant
N
ativ
e Im
mig
rant
Mea
n ag
e 33
.2
31.1
32
.0
28.7
33
.3
28.9
7’0
9th
gra
de d
ropo
ut
15.0
30
.5
7.7
26.6
3.
5 23
.0
YO h
igh
scho
ol d
ropo
ut
40.1
45
.7
28.1
41
.8
21.1
44
.0
7’0 c
olle
ge g
rad
13.0
23
.8
17.8
20
.5
20.8
21
.4
7‘0 n
onw
hite
11
.2
23.3
14
.4
55.8
15
.9
59.4
YO
bla
ck
10.3
6.
7 11
.2
7.3
11.9
7.
5 YO
his
pani
c 3.
5 34
.2
4.5
37.6
E 2 I? 2
5.4
49.0
E
To m
anuf
actu
ring
em
ploy
men
t 28
.7
33.0
25
.6
29.8
21
.4
19.4
0
% d
urab
le m
anuf
actu
ring
empl
oym
ent
18.9
20
.8
17.3
19
.5
14.0
11
.9
2 0
Mea
n ag
e-at
-arr
ival
-
28.6
-
26.2
-
26.8
9.
3 Yo
bor
n in
“re
fuge
e-se
ndin
g na
tion”
-
13.2
-
13.6
-
b
Sour
ce: 1
970
3 pe
rcen
t and
198
0 an
d 19
90 5
per
cent
US.
Cen
sus
extr
acts
. N
ote:
Sam
ple
size
s ar
e sh
own
in t
able
2.
a”R
ecen
t im
mig
rant
s” r
efer
s to
imm
igra
nts
that
arr
ived
with
in 0
to 5
yea
rs o
f th
e ce
nsus
. R
efug
ee-s
endi
ng n
atio
n” r
efer
s to
the
15 c
ount
ries
that
Fix
and
Pas
sel
(199
4) a
nd B
orja
s (1
995b
) ide
ntif
y as
the
chie
f so
urce
s of
US
. ref
ugee
s,
nam
ely,
Afg
hani
stan
, A
lban
ia, B
ulga
ria,
Cam
bodi
a, C
uba,
Cze
chos
lova
kia,
Eth
iopi
a, H
unga
ry, I
raq,
Lao
s, Po
land
, Rom
ania
, Sov
iet U
nion
, Tha
iland
, an
d V
ietn
am.
b,,

FRY: HAS THE QUALITY OF IMMIGRANTS DECLINED? 57
marked improvements in educational at- tainment. Finally, the decline in manufac- turing employment has received much at- tention in relation to a plethora of labor market ills. Note that as of 1970, immi- grant arrivals were more reliant on manu- facturing employment than were the na- tive population.
With this background, consider first static measures of male labor market activ- ity during the calendar week preceding census enumeration. The analysis adopts the five-fold taxonomy of economic activ- ities used by Welch (1990) to examine white-black trends in labor market inactiv- ity. An individual is categorized into one of the following mutually exclusive states: (i) institutionalized, (iil if not institution- alized, then either employed or enlisted, (iii) enrolled in school (only men 30 years old or younger are classified as enrolled in school), (iv) unemployed, or (v) not in the labor force. Regarding those who are both employed and enrolled in school, individ- uals working less than 35 hours are treated as enrolled while individuals working more than 35 hours are treated as em- ployed or enlisted.
Table 2 depicts natives’ static labor mar- ket activities in 1970, 1980, and 1990 and compares them to all immigrants and re- cent immigrants. Coluinns (2) through (4) document the labor market activities for all males aged 16 to 54. Table 2 shows that throughout the period immigrants have been equally as successful as natives in en- gaging in productive activities. In 1970, about 94 percent of immigrants were em- ployed, enrolled, or searching for work, and in 1990 about 92 percent of immi- grants were engaged in productive pur- suits. Furthermore, in both years, immi- grants were less likely than natives to be inmates of correctional facilities, mental institutions, drug treatment centers, and other institutions. (The proportion of aged 16 to 54 male inmates in prisons and jails was about 49 percent in 1970 and 61 per- cent in 1980. The fraction in correctional
institutions also varies with age and nativ- ity. See Fry, 1995; Butcher and Piehl, 1995.)
Comparing traits of all immigrants at 1970 and 1990 does not measure the change in traits of immigrants who arrived in the 1980s from those who arrived in the 1960s. Between 1970 and 1990, new immi- grants arrived, but earlier immigrant ar- rivals left the resident U.S. population aged 16-54 due to aging, death, and emi- gration. In addition, earlier immigrant ar- rivals remaining in the target population likely altered their economic activities as a result of further acquiring U.S. specific human capital and learning about the U.S. labor market, welfare system, criminal op- portunities, and other institutions. Earlier immigrants “assimilated” into a different level of labor market activity than the one characterizing them upon arrival to the United States. For these reasons, one should compare the economic activities of arrival cohorts that have been in the United States a similar number of years in order to judge the traits of 1980s immi- grants relative to those of earlier arrivals. Table 2 shows this comparison only for ”recent” immigrant arrival cohorts.
Among men aged 16 to 54, table 2 indi- cates a long-run decline in U.S. immigrants’ labor market engagement. Relative to natives, as well as absolutely, a smaller fraction of recent immigrants were engaged in productive endeavors in 1990 than in 1970. Note two qualifications to this downward trend. First, relative to na- tives, the fraction of recent immigrants in institutions remained constant between 1970 and 1990, so that the greater inactiv- ity was solely labor market nonparticipa- tion. Second, compared with 1960s immi- grants, late 1980s arrivals seem less eco- nomically active, but table 2 shows that they are more active than 1970s immi- grants. Thus, the time profile of immigrant labor market involvement appears to be bowl-shaped.
Several factors motivate additional analysis of young males aged 20 to 24 and

w1 m
TA
BL
E 2
L
abor
Mar
ket
Stat
us of
Nat
ive
and
Imm
igra
nt M
en, 1
970,
1980
, and
199
0
Nat
ives
A
ges
16-5
4 A
ges
20-2
4 A
ges
25-4
4 ~
1970
19
80
3 990
19
70
1980
19
90
1970
19
80
1990
YO
enr
olle
d in
sch
ool
13.7
1.
6 1.
4 %
em
ploy
ed o
r en
liste
d %
une
mpl
oyed
%
not
in
labo
r fo
rce
70 in
stitu
tiona
lized
T
otal
s Sa
mpl
e Si
ze
70 en
rolle
d in
sch
ool
YO e
mpl
oyed
or
enlis
ted
70 un
empl
oyed
%
not
in l
abor
for
ce
70 in
stitu
tiona
lized
Sa
mpl
e Si
ze
70 en
roll
ed i
n sc
hool
70 em
ploy
ed o
r en
liste
d 70 un
empl
oyed
70
not
in la
bor
forc
e 70 in
stitu
tiona
lized
Sa
mpl
e Si
ze
77.4
2.
6 5.
0 1.
2 7 0
0.0
81,2
92
-4.3
4.
8 0.
1 0.
2 -0
.8
60,7
17
0.1
-1.6
0.
4 2.
0 -0
.9
15,9
06
13.5
74
.5
5.0
5.8
1.2
100.
0 18
0,84
9
-1.7
2.
0 -0
.4
0.7
-0.6
19
9,70
3
6.8
-10.
1 -0
.1
4.1
-0.6
59
,259
12.0
19
.5
18.3
24
.7
1.0
75.6
70
.0
67.2
61
.5
91.6
4.
6 3.
7 7.
8 6.
4 2.
4 6.
1 5.
3 5.
1 5.
0 3.
7 1.
7 1.
5 1.
7 2.
4 1.
3 10
0.0
100.
0 10
0.0
100.
0 10
0.0
213,
671
13,3
66
34,3
86
33,4
79
38,9
02
Diff
eren
ce b
etwe
en I
mm
igra
nts
and
Nat
ives
-1
.5
5.7
6.8
0.1
1.8
0.8
-7.7
-5
.7
0.3
-1.6
0.
7 -0
.2
-2.2
-0
.6
0.2
0.4
3.0
1.7
0.8
0.6
-0.4
-1
.0
-0.7
-0
.6
-0.9
315,
932
7,28
8 30
,706
45
,080
32
,903
Drff
eren
ce b
etwe
en R
ecen
t Im
mig
rant
sa a
nd N
ativ
es
5.0
8.7
12.5
-0
.7
4.8
-8.8
-1
1.2
-12.
1 0.
3 -6
.4
1.6
-1.0
-2
.7
-0.2
0.
5 3.
0 4.
5 3.
1 1.
6 2.
0 -0
.8
-1.1
-1
.1
-1.1
-1
.0
84,3
69
2,73
2 14
,444
21
,159
9,
840
87.6
4.
8 4.
8 1.
2 10
0.0
87,7
01
2.2
-2.5
-0
.2
1.1
-0.7
11
2,97
3
7.4
-11.
8 0.0
5.1
-0.7
31
,858
86.4
4.
7 5.
5 1.
9 10
0.0
116,
031
! E 2 2.
1 -3
.0
0.6
0.8
l -0
.5
n 8
190,
012
6.6
-11.
0 1.4
4.1
-1.1
45
,313
Sour
ce: 1
970
3 pe
rcen
t and
198
0 an
d 19
90 5
per
cent
US.
Cen
sus
extra
cts
a”R
ecen
t im
mig
rant
s” re
fers
to im
mig
rant
s w
ho a
rrive
d w
ithin
0 to
5 y
ears
of
the
cens
us.

FRY HAS THE QUALITY OF IMMIGRANTS DECLINED? 59
of prime-age males aged 25 to 44. Econo- mists conventionally have viewed the labor market problems confronting youths aged 16 to 24, especially minority and urban youth, as more severe and different from those confronting older populations. The labor market behavior of young adults does diverge from that of prime-age men. Young adults are less likely to be labor market inactive than are males over age 24. In addition, both schooling and crimi- nal activity occur largely during the teen and young adult portion of the life cycle (see Mare, 1994, on schooling). One reason to examine outcomes among 25 to 44 year old men is that this population likely is free of trends regarding early retirement.
Table 2 provides prima facia evidence for examining disaggregate age groupings. The table documents that the rising es- trangement of immigrant arrivals from U.S. labor market institutions does not characterize young adult immigrants. Be- tween 1970 and 1990, the fraction of young adult recent immigrants that are enrolled, employed, or job shopping markedly rose-absolutely, as well as relative to na- tive young adults.
Table 2 also documents young adult re- cent immigrants’ substantial reallocation of efforts to acquire human capital. In 1970, 28.2 percent of recent young adult immigrants were predominantly engaged in schooling. By 1990, the proportion ac- quiring human capital via schooling rather than full-time job market experience de- clined to 24.0 percent. Table 2 shows that native young adults were increasing their school enrollment between 1970 and 1990. Thus, upon entry, both absolutely and rel- ative to natives, the 1990 recent immigrant arrival cohort was substantially more work centered, at the expense of school- ing, than was the 1970 recent immigrant arrival cohort.
Thus far the discussion has focussed on the static activities of recent immigrants. However, the notion of economic idleness is a dvnamic concevt and is better cav-
tured by measures of behavior over time. One dynamic measure of labor market in- activity attempts to capture persistent iso- lation from U.S. labor market institutions: the census question regarding the year the respondent last worked. This information provides the basis for constructing a dy- namic measure of labor market idleness. Define a “labor market nonparticipant” as an individual who is, as of the census ref- erence week, neither currently enrolled nor employed and who has not worked during the prior 15 months (last worked prior to 1989 or never worked according to the 1990 census and last worked prior to 1979 or never worked according to the 1980 census, etc.). Haveman and Wolfe (1994) utilize a similar measure in study- ing the determinants of economic inactiv- ity. Table 3 presents the fraction of the pop- ulation who were labor market nonpartic- ipants in 1990, 1980, and 1970 among na- tives, all immigrants, and by immigrant arrival cohort.
Confirming Juhn’s (1992) tabulations from the CPS, table 3 shows that the inci- dence of prolonged labor market inactivity steeply increased among both natives (from 3.2 percent to 5.5 percent) and im- migrants from 1970 to 1990. Among men aged 25 to 44, the incidence of economic idleness more than doubled over 20 years. The labor market nonparticipation rates indicate that the flow of immigrant arriv- als to the United States over the past 20 years has exacerbated rather than miti- gated the prevalence of idleness among the nonelderly male population. Among men aged 16 to 54, each of the four immi- grant arrival cohorts exhibits an increase in idleness in excess of the native increase in idleness, when measured from 1970 to 1990 (table 3). At the same stage of dura- tion in the United States, immigrants who arrived after 1970 were more isolated from the world of work and school than were pre-1970 immigrants.
Table 3’s labor market nonparticipation rates Drovide some evidence that. al-

TABL
E 3
Labo
r Mar
ket N
onpa
rtic
ipat
ion
Rat
es (i
n pe
rcen
t) of
Nat
ive an
d Im
mig
rant
Men
, 197
0,19
80 a
nd 1
990
(Sam
ple S
izes
in P
aren
thes
es)
Age
s 16-54
Imm
igra
nt A
rriv
al C
ohor
ts-Y
ears
A
rriv
ed B
efor
e C
ensu
s A
ll
Nat
ives
Im
mig
rant
s 0-
5 6-
10
11-15
16-2
0 21-30
~~
1970
cen
sus
3.2
3.1
4.3
1.8
1.7
2.2
-
(81,
292)
(6
0,71
7)
(15,
906)
(1
1,17
2)
(10,
346)
(8
,368
) -
1980
cen
sus
4.9
5.1
7.9
3.7
3.7
3.6
3.9
1990
cen
sus
5.5
5.8
8.3
5.3
4.1
4.7
5.0
(180
,849
) (1
99,7
03)
(59,
259)
(4
0,91
0)
(33,
292)
(2
5,36
3)
(30,
579)
(213
,671
) (3
15,9
32)
(84,
369)
(7
3,05
6)
(54,
423)
(4
1,34
9)
(43,
641)
Age
s 25
-44
~~
~
1970
cen
sus
2.3
2.3
3.0
1.2
1.2
1.6
_.
(38,
902)
(3
2,90
3)
(9,8
40)
(7,1
95)
(6,2
47)
(4,1
29)
-
1980
cen
sus
4.0
4.3
7.3
2.8
2.9
2.9
3.3
(87,
701)
(1
12,9
73)
(31,
858)
(2
6,44
6)
(19,
883)
(1
3,51
0)
(16,
586)
1990
cen
sus
5.1
5.3
8.1
4.8
3.7
4.3
4.8
(116
,031
) (1
90,0
12)
(45,
313)
(4
7,80
9)
(37,
162)
(2
5,34
5)
(24,
756)
Age
s 20
-24
-
1970
cen
sus
2.9
4.8
6.3
2.8
2.7
4.3
(13,
366)
(7
,288
) (2
,732
) (1
,267
) (1
,059
) (1
,096
) -
1980
cen
sus
3.9
5.5
6.9
4.4
4.9
3.2
3.7
(34,
386)
(3
0,70
6)
(14,
444)
(6
,104
(3
,907
) (3
,468
) (2
,783
) 19
90 c
ensu
s 4.
8 5.
8 6.
6 4.
7 4.
7 5.
7 6.
2 (3
3,47
9)
(45,
080)
(2
1,15
9)
(11,
705)
(5
,629
) (4
,444
) (2
,143
)
Sour
ce: 1
970
3 pe
rcen
t and
198
0 an
d 19
90 5 p
erce
nt U
.S. C
ensu
s ext
ract
s N
ote:
The
labo
r m
arke
t non
part
icip
atio
n ra
te re
fers
to t
he fr
actio
n of
the
popu
latio
n th
at is
not
enr
olle
d, e
mpl
oyed
, or
enlis
ted
in
the
wee
k pr
eced
ing
cens
us e
num
erat
ion
and
that
has
not
wor
ked
in th
e pr
ior
15 m
onth
s.

FRY: HAS THE QUALITY OF IMMIGRANTS DECLINED? 61
though immigrants who arrived in the 1980s are more idle than immigrants who arrived in the 1960s, 1980s immigrants are less idle than immigrants arrived in the 1970s. For example, among men aged 25 to 44, the native labor market nonpartici- pation rate rose 1.1 percentage points from 1980 to 1990. Yet among immigrants who had arrived within zero to five years of the census, the labor market nonparticipation rate rose 0.8 percentage points from 1980 to 1990-from 7.3 percent to 8.1 percent. Thus, the deterioration in immigrant labor market attachment appears to have been arrested. Table 3 also supports the propo- sition that the long-term decline in immi- grant labor market attachment is confined to prime-age immigrants. Among young adults, labor market nonparticipation rates did rise from 1970 to 1990 for all four immigrant arrival cohorts, but relative to native young adults, immigrant idleness declined.
The descriptive analysis thus far has used the changes in the behavior of all na- tives over time as the norm against which to compare changes in the behavior of im- migrant arrival cohorts. Rather than com- paring immigrant arrivals to all natives, one can use natives of similar ethnicity and race to control for the changes in the economic and social environment occur- ring between 1970 and 1990. The 1990 Cen- sus reveals at least 38 different racial iden- tifications, but the 1970 Census identifies only seven. Across the three Censuses, one can identify nine mutually exclusive eth- nic-race groups. The top panel of table 4 displays the labor market nonparticipa- tion rates of native young adults and prime-age men among eight ethnic-race groups. Table 4 omits the rates of the ninth ethnic-race group, the residual group, made up of nonHispanic American Indi- ans, Eskimos, Aleuts, other Asian and Pa- cific Islanders, and “Other races.” The fact that the residual group is composed of such radically different ethnic-race groups in terms of labor market behavior war-
rants suppressing its traits. With the ex- ception of Cubans, prime-age men in every native ethnic-race group experi- enced an increase in idleness between 1970 and 1990.
The middle panel of table 4 presents the difference in labor market nonparticipa- tion rates between recent immigrants and natives, where the native comparison group is natives of all ethnic-races of like age, including Puerto Ricans and the resid- ual ethnic-race group, from table 3. For ex- ample, for young adults, the middle panel shows the recent immigrant labor market nonparticipation rate for that ethnic-race group minus 2.9 percent for 1970, minus 3.9 percent for 1980, and minus 4.8 for 1990. With the exception of Filipino and Japanese recent arrivals, men aged 25 to 44 in every recent immigrant ethnic-race group experienced an increase in eco- nomic inactivity from 1970 to 1990 relative to all natives of like age. With the excep- tion of Mexicans and nonHispanic blacks, young adults in every recent immigrant arrival group experienced a decline in labor market isolation from 1970 to 1990 relative to all native young adults.
The bottom panel of table 4 uses the native labor market nonparticipation rate of the like ethnic-race group and age and tallies the difference between the labor market nonparticipation rate of recent im- migrants and natives. The top panel shows very steep declines in labor market attach- ment among certain native minority pop- ulations between 1970 and 1990. Thus, using this alternative norm of comparison understandably generates slightly differ- ent conclusions. Namely, the declines in the labor market engagement of non- Hispanic black recent immigrants are re- versed when compared to native non- Hispanic blacks. Recall from table 1, how- ever, that nonHispanic blacks are a small portion of recent immigrant flows. More importantly, the decline in the labor mar- ket engagement of Mexican and other Hispanic recent immigrants reverses when

TABL
E 4
Lab
or M
arke
t Non
part
icip
atio
n R
ates
(in
per
cent
) of
Nat
ive
and
Rec
ent I
mm
igra
nt M
en, b
y Et
hnic
-rac
e G
roup
Nat
ives
A
ges
20-2
4 A
ges
25-4
4
1970
19
80
1990
19
70
1980
19
90
m
N
Cub
ans
Mex
ican
s Pu
erto
Ric
ans
Oth
er H
ispa
nics
N
onH
ispa
nic
Filip
inos
and
Jap
anes
e N
onH
ispa
nic
Chi
nese
N
onH
ispa
nic
blac
ks
Non
His
pani
c w
hite
s
Cub
ans
Mex
ican
s O
ther
His
pani
cs (
exce
pt P
uert
o R
ican
s)
Non
His
pani
c Fi
lipin
os a
nd J
apan
ese
Non
His
pani
c C
hine
se
Non
His
pani
c bl
acks
N
onH
ispa
nic
whi
tes
Cub
ans
Mex
ican
s O
ther
His
pani
cs (
exce
pt P
uert
o R
ican
s)
Non
His
pani
c Fi
lipin
os a
nd J
apan
ese
Non
His
pani
c C
hine
se
Non
His
pani
c bl
acks
N
onH
ispa
nic
whi
tes
5.9
4.1
9.9
4.2
2.7
2.5
8.3
2.1
7.3
1.1
5.1
5.1
3.4
3.8
2.7
4.3
-0.1
3.
8 5.
3 3.
8 -1
.6
3.5
6.0
2.9
6.8
6.0
5.2
7.5
3.2
5.3
12.3
13
.5
7.7
12.8
4.
9 6.
3 2.
5 5.
1 2.
6 2.
4 1.
4 2.
5 2.
4 2.
0 1.
6 2.
3 13
.1
15.5
5.
8 11
.9
2.3
2.7
1.9
2.9
Dif
fere
nce
betw
een
Rec
ent
Imm
igra
ntsa
and
Nat
ives
B
ase
grou
p: A
ll n
ativ
es o
f lik
e ag
e 3.
6 1.
6 0.
7 12
.3
1.9
1.6
0.4
1.4
4.4
3.8
0.9
2.8
3.2
-1.2
0.
7 -0
.1
1.2
-0.6
2.
2 4.
4 5.
7 4.
9 3.
7 5.
6 1.
4 0.
4 -0
.3
2.2
Dif
fere
nce
betw
een
Rec
ent I
mm
igra
nts
and
Nat
ives
B
ase
grou
p: N
ativ
es o
f lik
e et
hnic
ity-r
ace
and
age
1.5
3.5
-3.8
10
.3
0.6
-1.1
-0
.5
0.1
3.4
2.3
0.7
1.7
4.5
1.2
1.6
1.4
2.7
2.2
2.9
6.1
-3.5
-5
.8
0.2
-2.3
3.
0 2.
5 0.
2 3.
3
6.6
7.0
14.0
7.
5 3.
0 3.
2 n
0
15
.3
3.4
n 5 c $! 5 8 i
3.0
1.1
2.4
-0.3
4.
7 6.
2 n
3.
0 0”
1.6.
-0
.8
0.0
1.8
6.6
-4.0
4.
7
Sour
ce: 1
970
3 pe
rcen
t and
198
0 an
d 19
90 5
per
cent
US.
Cens
us e
xtra
cts
Not
e: T
he la
bor
mar
ket n
onpa
rtici
patio
n ra
te r
efer
s to
the
frac
tion
of t
he p
opul
atio
n th
at i
s no
t en
rolle
d, e
mpl
oyed
, or
enlis
ted
in th
e w
eek
prec
edin
g ce
nsus
enu
mer
atio
n an
d th
at h
as n
ot w
orke
d in
the
prio
r 15
mon
ths.
a’’R
ecen
t imm
igra
nts’
‘ ref
ers
to im
mig
rant
s w
ho a
rriv
ed w
ithin
zer
o to
fiv
e ye
ars
of th
e ce
nsus
.

FRY: HAS THE QUALITY OF IMMIGRANTS DECLINED? 63
compared to the behavior of native Mexi- cans and native other Hispanics. These Hispanic populations are important parts of recent immigrant arrival flows. Hence, the base group used for comparison does matter.
Considering the base group may atten- uate but does not purge the apparent de- cline in labor market attachment of prime- age immigrant arrivals from the 1960s to the 1980s. Rather than comparing the in- crease in the labor market nonparticipa- tion rate of recent immigrants to the in- crease of all natives, compare it to the in- crease of a demographically similar group of natives. If the native population ethnic- race composition were identical to that of immigrants aged 25 to 44 who arrived be- tween 1965 and 1970, the 1970 native labor market nonparticipation rate would be 2.9 percent rather than the 2.3 percent shown in table 3. Similarly, if the native popula- tion ethnic-race composition were identi- cal to that of the 1990 recent arrival cohort the 1990 native labor market nonparticipa- tion rate would be 6.8 percent rather than the 5.1 percent shown in table 3. Hence, the increase in the labor market nonpartic- ipation rate of a demographically similar group of natives from 1970 to 1990 would be 3.9 percentage points rather than the actual native increase of 2.8 percentage points. Yet, the labor market nonparticipa- tion rate of recent prime-age immigrants rose 5.1 percentage points from 1970 to 1990. Thus, no matter how one accounts for "period effects," the economic inactiv- ity of prime-age immigrant arrivals has in- creased over the past 20 years.
IV. PROBIT ANALYSIS OF LABOR MARKET IDLENESS
Probit analysis can answer the question of whether differences in the observable characteristics of immigrant arrivals can account for the unadjusted trends in labor market idleness depicted in section 111. A number of observable personal character- istics determine the likelihood of being
persistently isolated from the world of work and school (see, for example, Have- man and Wolfe, 1994; and Fry, 1995). The multivariate analysis reveals whether sta- tistically significant differences in eco- nomic idleness between arrival cohorts re- main after controlling for relevant observ- ables.
The parametric analysis employed to analyze the cohort effects is virtually iden- tical to the method that Borjas and Trejo (1991) and Borjas (1995b) use to investi- gate immigrant households' usage of cash welfare. The observations from the 1970, 1980, and 1990 Census data extracts are pooled and the probability of being a labor market nonparticipant (P,) is modelled as following a probit specification:
where F-l(Pi) is the inverse of the standard normal cumulative distribution function. Pi is the probability that the person is not currently employed, enrolled, or enlisted and has not worked in the past 15 months; Xi is a vector of control variables that in- clude age and age squared; Ci is a vector of dummy variables indicating the calen- dar year of immigrant arrival (set equal to zero for natives); yi is a quadratic in years since migration (also set equal to zero for natives); and Di,80 and Di,90 are the census dummy variables indicating an observa- tion from the 1980 census and 1990 census, respectively. The key parameters of inter- est here are the coefficients of the immi- grant arrival dummies, which capture the differences in the extent of labor market idleness across immigrant cohorts at the time of arrival. A key assumption permit- ting the identification of the cohort effects is that the period effect on labor market idleness is the same for immigrants and natives.

64 CONTEMPORARY ECONOMIC POLICY
Pooling the 1990,1980, and 1970 Census cross sections allows the analysis to track the progress of virtually the same cohort of immigrants and natives over time. This disentangles the fixed cohort qualities from assimilation effects. To operationa- lize this procedure for studying well-de- fined age groups, the age ranges from the three pooled cross sections differ. In order to examine the behavior of young adults, males aged 20 to 24 in the 1970 data extract are pooled with males aged 20 to 24 and aged 30 to 34 in the 1980 extract and males aged 20 to 24,30 to 34, and 40 to 44 in the 1990 extract. Similarly, the sample for the study of prime-age men consists of 25 to 44 in the 1970 extract, 25 to 54 in the 1980 extract, 25 to 64 in the 1990 extract. (The 1990 and 1980 Censuses do not identify the year of arrival for immigrants who arrived before 1950, so years since migration are unknown for immigrants who arrived be- fore 1950. The sample thus omits pre-1950s immigrants in the 1990 and 1980 cross sec- tions.)
Since the interpretation of probit coeffi- cients is opaque, tables 5 and 6 display the “marginal effects” or mean probability de- rivatives for selected regressors. The mar- ginal effect is the change in the probability of labor market nonparticipation due to a unit change in the regressor. Column (1) includes the minimalist set of controls, only age and age squared. Moving across the columns in tables 5 and 6 adds succes- sively more controls to the probit. Column (5)’s specification includes 20 control vari- ables.
Column (1) simply repackages the infer- ences from the summary statistics. Since the base group is all natives, the immi- grant arrival dummy’s marginal effect in- dicates the effect upon labor market idle- ness relative to natives of the same age. For both young aduits and prime-age men, column (1)’s t-ratios indicate statistically significant cohort effects for most arrival cohorts. Upon arrival, immigrants are more likely to be idle than are natives.
Among young adults, improving cohort quality is apparent over time. Young adults arriving in the 1980s are less likely to be idle than are pre-1970 young adult arrivals when compared to similarly aged natives. Opposed to this, men aged 25 to 44, in the 1980s arrival cohorts are more likely to be estranged from the labor mar- ket than are those in pre-1970 arrivals (table 6). These differences are statistically significant for both age groups.
Column (1) documents statistically sig- nificant differences in the unadjusted ex- tent of idleness across immigrant arrival cohorts. Columns (2) through (5) of tables 5 and 6 pursue whether these differences persist after introducing relevant observ- ables. Notice that the sample size de- creases with column (3)’s added controls. The added controls include a battery of dummy variables characterizing the respondent’s household structure. Hence, the sample is restricted to men residing outside of group quarters. The appendix shows the formal statistical results of sev- eral modifications to the sample exclusion procedures: (i) restricting the sample to males who do not reside in group quarters, (ii) eliminating from the sample immi- grants who were born in ”refugee-sending nations,” and (iii) eliminating from the sample immigrants who arrived after 1969 and are above the age of 44.
Examining column (5)’s cohort effects reveals that statistically significant cohort effects remain. That is, immigrants upon arrival are significantly more likely to be idle than are demographically similar na- tives. Due to the extensive controls in- cluded, they are more likely to be idle than are natives of the same educational attain- ment, of the same ethnic-race group, and of similar household structure. The rising labor market attachment of immigrant young adults in the 1980s relative to pre- 1970 immigrants apparent in column (1) remains after including controls. Introduc- ing controls does reverse the apparent de- cline in labor market attachment of prime-
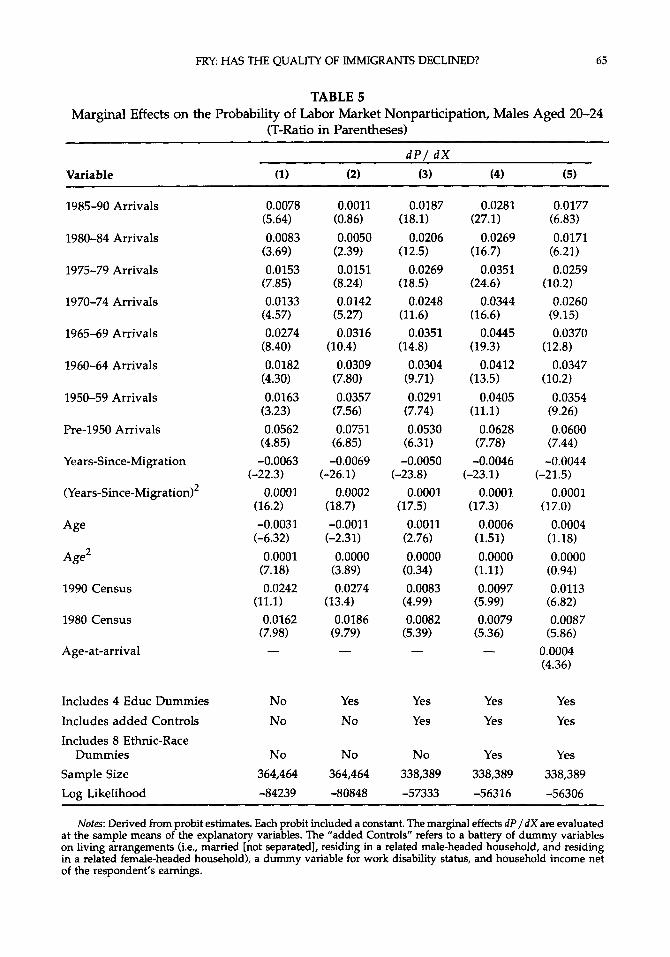
FRY HAS THE QUALITY OF IMMIGRANTS DECLINED? 65
TABLE 5 Marginal Effects on the Probability of Labor Market Nonparticipation, Males Aged 20-24
(T-Ratio in Parentheses)
d P / ax Variable (1) (2) (3) (4) (5)
1985-90 Arrivals
1980-84 Arrivals
1975-79 Arrivals
1970-74 Arrivals
1965-69 Arrivals
1960-64 Arrivals
1950-59 Arrivals
Pre-1950 Arrivals
Years-Since-Migration
(Year s-Since-Migration)’
Age
A g 2
1990 Census
1980 Census
Age-at-arrival
Includes 4 Educ Dummies Includes added Controls Includes 8 Ethnic-Race
Dummies Sample Size Log Likelihood
0.0078 (5.64) 0.0083
(3.69) 0.0153
(7.85) 0.0133
(4.57) 0.0274
(8.40) 0.0182
(4.30) 0.0163
(3.23) 0.0562
(4.85) -0.0063
0.0001
-0.0031
0.0001 (7.18) 0.0242
0.0162 (7.98)
(-22.3)
(16.2)
(-6.32)
(11.1)
-
No No
No 364,464 -84239
0.0011 (0.86) 0.0050
(2.39) 0.0151
(8.24) 0.0142
(5.27) 0.0316
0.0309 (7.80) 0.0357
(7.56) 0.0751
(6.85)
(10.4)
-0.0069
0.0002 (18.7) -0.0011
(-2.31) 0.0000
(3.89) 0.0274
0.0186 (9.79)
(-26.1 )
(13.4)
-
Yes No
No 364,464 -80848
0.0187
0.0206
0.0269
0.0248
0.0351
0.0304 (9.71) 0.0291
(7.74) 0.0530
(6.31)
(18.1)
(12.5)
(18.5)
(11.6)
(14.8)
-0.0050
0.0001
0.0011 (2.76) 0.0000
(0.34) 0.0083
(4.99) 0.0082
(5.39)
(-23.8)
(17.5)
-
Yes Yes
No 338,389 -57333
0.0281
0.0269
0.0351
0.0344
0.0445
0.0412
0.0405
0.0628 (7.78)
(27.1)
(16.7)
(24.6)
(16.6)
(19.3)
(13.5)
(11.1)
-0.0046
0.0001
0.0006 (1.51) 0.0000 (1.11) 0.0097
(5.99) 0.0079
(5.36)
(-23.1)
(17.3)
-
Yes Yes
Yes 338,389 -56316
0.0177 (6.83) 0.0171
(6.21) 0.0259
0.0260 (9.15) 0.0370
0.0347
0.0354 (9.26) 0.0600
(7.44) -0.0044
0.0001
0.0004 (1.18) 0.0000
(0.94) 0.0113
(6.82) 0.0087
(5.86) 0.0004 (4.36)
Yes Yes
Yes 338,389
(10.2)
(12.8)
(10.2)
(-21.5)
(17.0)
-56306
Notes: Derived from probit estimates. Each probit included a constant. The marginal effects d P / d X are evaluated at the sample means of the explanatory variables. The “added Controls” refers to a battery of dummy variables on living arrangements (i.e., married [not separated], residing in a related male-headed household, and residing in a related female-headed household), a dummy variable for work disability status, and household income net of the respondent’s earnings.

66 CONTEMPORARY ECONOMIC POLICY
TABLE 6 Marginal Effects on the Probability of Labor Market Nonparticipation, Males Aged 25-44
(T-Ratio in Parentheses)
d P / d X
Variable (1) (2) (3) (4) (5)
1985-90 Arrivals
1980-84 Arrivals
1975-79 Arrivals
1970-74 Arrivals
1965-69 Arrivals
1960-64 Arrivals
1950-59 Arrivals
Pre-1950 Arrivals
Years-Since-Migra tion
(Years-Since-Migra tion)’
Age
Age2
1990 Census
1980 Census
Age-at-arrival
Includes 4 Educ Dummies
Includes a d d e d Controls
Includes 9 Eth ic-Race Dummies
Sample Size
Log Likelihood
0.0133
0.0056 (3.44) 0.0101
(6.82) -0.0012
(-0.56) 0.0068
(2.95) 0.0040
(1.47) -0.0011
(-0.36) 0.0029
(4.60)
(12.3)
-0.0060 (31.3)
0.0001 (27.6) -0.0094
0.0001
0.0464
0.0378
(-45.1)
(59.3)
(32.1)
(28.3) -
No No
No 775,091 -189816
0.0115
0.0049 (3.24) 0.0142
0.0038 (1.95) 0.0174
(8.06) 0.0197
(7.62) 0.0167
(5.60) 0.0481
(8.08) -0.0068
0.0002 (32.8) -0.0082
0.0001
0.0599
0.0461
(11.2)
(10.2)
(-38.3)
(-41.6)
(53.8)
(43.5)
(36.5) -
Yes No
No
775,091 -183076
0.0271
0.0232
0.0291
0.0230
0.0307
0.0302
0.0272
0.0425 (9.30)
(36.4)
(20.9)
(28.4)
(15.9)
(19.3)
(15.7)
(12.2)
-0.0048
0.0001 (30.8) -0.0044
0.0001
0.0301
0.0261
(-36.8)
(-29.9)
(42.2)
(27.9)
(26.6) -
Yes Yes
No 748,755 -127493
0.0327
0.0275
0.0344
0.0303
0.0383
0.0392
0.0370
0.0526
(43.8)
(25.1)
(33.9)
(21.3)
(24.5)
(20.8)
(16.8)
(11.8)
(-35.7)
(29.7)
-0.0045
0.0001
-0.0046
0.0001
0.0300
0.0252
(-32.5)
(44.6)
(28.3)
(26.3) -
Yes Yes
Yes
748,755 -125885
0.0359
0.0304
0.0373
0.0330
0.0410
0.0417
0.0393
0.0540
(22.2)
(17.6)
(22.6)
(17.5)
(20.8)
(19.0)
(16.2)
(12.0) -0.0046
(-35.6) 0.0001
-0.0046
0.0001
0.0296
0.0251
(29.8)
(-31.9)
(44.6)
(27.7)
(26.0) -0.0001 (-2.22)
Yes
Yes
Yes
748,755 -125883
Notes: Derived from probit estimates. Each probit included a constant. The marginal effects dP / d X are evaluated at the sample means of the explanatory variables. The “added Controls” refers to a battery of dummy variables on living arrangements (i.e., married [not separated], residing in a related male-headed household, and residing in a related female-headed household), a dummy variable for work disability status, and household income net of the respondent’s earnings.

FRY HAS THE QUALITY OF IMMIGRANTS DECLINED? 67
age male immigrants. Column (5) of table 6 shows that prime-age 1980s immigrant arrivals are less likely to be idle than are demographically similar immigrants who arrived before 1970. Simply adding educa- tion controls [column (211 substantially in- creases the effect associated with arrival before 1970.
V. CONCLIJSIONS
Following Borjas’s (1992) finding that the quality of successive waves of immi- grants to the United States deteriorated from World War I1 to 1980 along important dimensions, economists are studying the economic traits of 1980s immigrants com- pared with earlier arrivals. The analysis here focuses on 1980s immigrants’ ability to engage in productive endeavors-that is, it focuses on immigrants’ success in landing opportunities to acquire human capital through either job market experi- ence or school enrollment. The trait of suc- cess in obtaining some productive activity is far from universal. Today, one out of 20 prime-age native men is neither working nor enrolled and has not worked in the prior 15 months. The methodology is straightforward, stressing unadjusted dif- ferences across immigrant arrival cohorts. The methodology is defensible since, as Borjas and Trejo (1991) and Blau (1992) ob- serve, what matters for policy purposes are the unadjusted differentials between immigrants and natives and not compari- sons of demographically similar immi- grants and natives.
This investigation presents a rather dim view of a set of abilities possessed by non- elderly male immigrants arriving in the 1980s. Compared with immigrants arriv- ing in the 1960s, today’s new arrivals ap- pear less likely to pursue productive activ- ities and less likely to avoid prolonged pe- riods of idleness. Fortunately, the decline in economic activity surfaces exclusively in increased labor market withdrawal and not in the form of an increased propensity to be institutionalized, so it does not ap-
pear that today‘s immigrants are imposing greater costs on the public fisc via the penal system. Nonetheless, relative to 1960s arrivals, today’s immigrants are en- larging the dependent population. Borjas’s work suggests that they are increasing de- mands on public resources via the cash welfare system. One caveat is that this in- vestigation explicitly eschews trends among older men. An examination of the differences in retirement behavior across immigrant arrival cohorts seems war- ranted.
Recalling table 1, speculating on expla- nations for the decline in relative employ- ment among nonelderly recent immi- grants since the 1960s is easy. On the labor market demand side, recent immigrant workers were disproportionately concen- trated in manufacturing and durable man- ufacturing until the 1980s. Thus, the her- alded decline in manufacturing appears a likely candidate. In addition, Juhn (1992) asserts that in the early 1970s a decline developed in the relative demand for high school dropouts, manifested in a large rel- ative employment decline among the less- educated. Table 1 documents that, at least since the 1960s, immigrant arrivals are more likely than natives to be high school dropouts. Thus, the educational character- istics of immigrant arrivals also may help explain their relative employment decline. On the supply side, the rising generosity of disability payments during the 1970s is credited with inducing labor market with- drawal. Since newly arrived immigrants are ineligible for social security disability payments, this factor would work to in- crease the relative employment of immi- grant arrivals. A more complete explana- tion would entail examining the relative supplies of immigrant arrivals and natives and their industrial and regional distribu- tion.
In conclusion, this investigation and others suggest a decline in the economic attainments of immigrants relative to pre- vious generations. Immigrant flows ap-

68 CONTEMPORARY ECONOMIC POLICY
pear increasingly ill-suited to succeed in the U.S. labor market. The entry criteria that have produced these flows have re- mained basically unchanged since the 1965 Amendments to the Immigration and Nationality Act. While contemplating the social costs and benefits of the status quo, immigration policymakers should realize that the labor market skills of immigrant flows are increasingly out-of-touch with the employment and schooling opportuni- ties present in the U.S. economy. As a re- sul t , nonelder ly immigrants likely a re placing increased demands on the scarce fiscal resources devoted to job placement, education and training, and income main- tenance, a s well as on the private resources of immigrants’ sponsors.
APPENDIX
This appendix presents the statistical results of several alterations to the sample utilized in the text. The sample underlying table 6 includes all men aged 25 to 44. Table A1 presents the marginal effects of the minimal probit specifi- cation. Compare its results with column (1) of table 6. Column (1) of table A1 shows the mar- ginal effects when the sample is restricted to men residing outside of group quarters. Em- ploying this restricted sample produces few changes.
The text explains that the synthetic cohort analysis pools men aged 25 to 44 in the 1970 Census with men aged 25 to 54 in the 1980 Cen-
sus and men aged 25 to 64 in the 1990 Census. This procedure enables the analyst to track the progress of an immigration cohort as it ages. It also systematically includes older immigrants for cohorts who arrived after 1970. In order to see if this biases the estimates of the fixed cohort effects, column (2) of table A1 shows the results when the sample omits immigrants aged 44 years and over who arrived after 1969. Again, the pattern of estimated cohort effects is nearly identical to that in table 6.
Finally, the Census questionnaire does not reveal the immigrant’s present immigration sta- tus nor immigration status upon arrival. Fix and Passel (1994) and Borjas (1995b) proxy for ar- rival as a refugee by identifying immigrants who originated in countries that are refugee generating nations. These refugee generating nations send a substantial number of refugees to the United States, and a large percentage of authorized entrants from these countries enter as refugees. Herein, an immigrant originated in a refugee sending country if he was born in Af- ghanistan, Albania, Bulgaria, Cambodia, Cuba, Czechoslovakia, Ethiopia, Hungary, Iraq, Laos, Poland, Romania, Soviet Union, Thailand, or Vietnam. Column (3) of table A1 reports the marginal effects when the sample omits immi- grants who originate from refugee-sending countries. The pattern of cohort effects reported in column (3) is markedly different than that in table 6. Among “non-refugees,” nearly all im- migrant cohorts upon arrival are not statisti- cally different from natives in the estimated de- gree of labor market idleness. These results sug- gest that non-refugees may not have experi- enced a decline in immigrant labor market at- tachment since the 1960s.

FXY: HAS THE QUALITY OF IMMIGRANTS DECLINED? 69
TABLE A1 Probit Analysis of Labor Market Nonparticipation, Males Aged 25-44, Using
Alternative Sample Inclusion Criteria (T-Ratio in Parentheses)
d P / d X
Variable (1) (2) (3)
1985-90 Arrivals
1980-84 Arrivals
1975-79 Arrivals
1970-74 Arrivals
1965-69 Arrivals
1960-64 Arrivals
1950-59 Arrivals
Pre-1950 Arrivals
Years-Since-Migra tion
(Years-Since-Migra ti,x-d2
Age
Age2
1990 Census
1980 Census
Age-at-arrival
Includes 4 Educ Dummies Includes added Controls Includes 9 Ethnic-Race Dummies Sample Size Log Likelihood
0.0121
0.0041 (2.70)
0.0067 (4.72)
(-0.67)
0.0063 (2.95)
0.0035 (1.38)
-0.0003 (-0.12)
0.0275 (4.84)
-0.0049
0.0001 (24.1)
-0.0084
0.0001
0.0374
0.0287
(11.9)
-0.0013
(-27.5)
(-43.2)
(58.3)
(27.6)
(22.9) -
No No No
748,755
-162649
0.0105 (8.58)
0.0198 (1.11)
0.0096 (6.19)
-0.0012 (-0.52)
0.0032 (1.37)
0.0003 (0.10) -0.0042
(-1.30)
0.0244 (3.98)
-0.0055
0.0001 (24.6)
-0.0088
0.0001
0.0452
0.0365
(-27.1)
(-41.0)
(53.9)
(31.7)
(27.6) -
No No No
723,506
-173426
0.0003 (0.27)
-0.0173 (-9.54)
-0.0012 (-0.75)
-0.0050 (-2.30)
0.0029 (1.19)
0.0014 (0.50)
-0.0033 (-1.02)
0.0241 (3.71)
-0.0053
0.0001 (22.9)
-0.0100
0.0001
0.0456
0.0366
(-26.3)
(-46.9)
(60.0)
(32.0)
(27.5) -
No No No
715,895
-171669
Notes: Derived from probit estimates. Each probit included a constant. The marginal effects dP / d X are evaluated at the sample means of the explanatory variables. Column (1) excludes men residing in group quarters. Column (2) excludes immigrants who are older than 44 and arrived after 1969. Column (3) excludes "rehgees."

70 CONTEMPORARY ECONOMIC POLICY
REFERENCES
Blau, Francine D., “The Fertility of Immigrant Women: Evidence from High-Fertility Source Countries,” in Immigration arid the Work Force: Economic Con- sequences for the United States and Source Areas, 1st ed., George J. Borjas and Richard B. Freeman, eds., University of Chicago Press, Chicago, Ill.,
Borjas, George J., “National Origin and the Skills of Immigrants in the Postwar Period,” in Immigra- tion and the Work Force: Economic Consequences f i r the United States and Source Areas, 1st ed., George J. Borjas and Richard B. Freeman, eds., University of Chicago Press, Chicago, Ill., 1992, 17-47.
, “Assimilation and Changes in Cohort Quality Revisited: What Happened to Immigrant Earnings in the 198Os?” Journal $Labor Economics, 13:2, April 1995a, 201-245.
, ”lmmigration and Welfare, 1970-1990,” Re- search in Lnbor Economics, XIV, 1995b, 251-280.
Borjas, George J., and Stephen J. Trejo, “Immigrant Par- ticipation in the Welfare System,” Industrial and Labor Relations Review, 442, January 1991, 195- 211.
Butcher, Kristin F., and Anne Morrison Piehl, Immigra- tion and Incarceration, Mimeo, Boston College, Chestnut Hill, Mass., October, 1995.
Fix, Michael, and Jeffrey S. Passel, Immigration and Im- migrants: Setting the Record Straight, The Urban Institute Press, Washington, D.C., May, 1994.
Fry, &chard, Labor Market Participation oflmmigrant and Native Men, Mimeo, Division of Immigration Pol- icy & Research, U S . Dept. of Labor, Washington, D.C., March, 1995.
Funkhouser, Edward, How Much of Immigration Assim- ilation is Related fo English Language Acquisition, Mimeo, University of California, Santa Barbara, Calif., 1995.
Funkhouser, Edward, and Stephen J. Trejo, “The Labor Market Skills of Recent Male Immigrants: Evi- dence from the Current Population Survey,” In- dustrial and Labor Relations Review, 484, July 1995,
Haveman, Robert, and Barbara Wolfe, Economic Inac- tivity o f Young Adults: A n Intergenerational Analy- sis. Jerome Levy Economics Institute of Bard College Working Paper #107, March, 1994.
Juhn, Chinhui, “Decline of Male Labor Market Partic- ipation: The Role of Deching Market Opportu- nities,’’ Quarterly Journal of Economics, February
Mare, Robert D., “Changes in Educational Attainment, School Enrollment, and Skill Levels,” in Social and Economic Trends in the 198Os, 1st ed., Reynolds Far- ley, ed., Vol. I, Russell Sage, New York, 1994.
Passel, Jeffrey S., and Michael Fix, ”Immigrants and Social Services,” Migration World, XMI:4, 1994,
Welch, Finis, ”The Employment of Black Men,” Iournal of Labor Economics, 8:1, January 1990, 526-74.
1992, 93-133.
792-811.
1992, 79-12],
22-25.