have questions? charvey@beveragemarketing
TRANSCRIPT
(Published December 2014. Data through 2013.
Market projections through 2018.) More than 240 pages, with
extensive text analysis, graphs, charts and more than 70 tables
850 Third Avenue, 13th Floor, New York, NY 10022
Tel: 212-688-7640 Fax: 212-826-1255
Direct Download
$3,995
To learn more, to place an advance order or to inquire about
additional user licenses call: Charlene Harvey +1 212.688.7640
ext. 1962 [email protected]
dynamic segment of the beer business receives close
examination in this report. Situating specialty beer in the context
of the overall beer market, Beverage Marketing analyzes the
growth drivers and elucidates the trends. It offers data on
regional markets and packaging as well as volume figures for the
leading craft beer brands. The report also features advertising
and demographic data and five-year projections. bmcreports.com
REPORT OVERVIEW A brief discussion of this
report’s key features. 2
TABLE OF CONTENTS A detailed outline of this report’s contents and data
tables. 5
SAMPLE TEXT AND INFOGRAPHICS Examples of report text, data content, layout and
style. 10
? HAVE QUESTIONS?
Contact Charlene Harvey: 212-688-7640 x 1962 [email protected]

The answers you need
What trends are driving the fast growth of the U.S. craft beer market?
How many gallons of craft beer per person were consumed in 2013, and how is this likely to change in the future?
Which is the biggest regional craft beer market?
How did the leading specialty beer companies such as Boston Beer, Sierra Nevada, New Belgium and Craft Brew Alliance perform?
Which distribution channel grew the fastest in 2013?
How many specialty brewers are active in the United States, and how has this changed?
This report features
This report addresses industry developments and issues of interest to beer marketers, advertising executives, industry suppliers, financial analysts and anyone else with a special interest in the beer market. It contains:
An overview of the national and regional beer markets, including volume, per capita consumption and
growth for all beer, imports and craft beer.
Discussion of the leading states in terms of volume and per capita consumption.
Analysis of beer categories and the brands comprising
Discussion and data breakdown of the packaged, draft and packaged & draft specialty beer market by segment including regional brews, national specialty beer, microbrews and brewpubs
Current volume statistics for the leading craft companies including D.G. Yuengling & Son, Boston
Beer, Sierra Nevada, New Belgium, Craft Brew Alliance and more.
Data for the top 30 microbreweries including Flying Fish Brewing, Natty Greene’s Thomas Creek, Santa Fe Brewing, Mad River Brewing, Weyerbacher Brewing and more.
A look at the top 30 U.S. brewpubs
A look at packaged and draft beer trends nationally, regionally and by state.
A look at beer pricing at the producer and consumer levels.
A breakdown of the beer and craft beer markets by distribution channel.
Analysis of advertising expenditures, detailed by company, brand and media.
Comparisons of consumer demographics for all beer and specialty beer.
Beverage Marketing’s projections for the future of the craft beer industry through 2018.

The U.S. Craft Beer Market 2014 Edition December 2014
R E S E A R C H D A T A C O N S U L T I N G
NOTE: The information contained in this report is confidential and solely intended for the benefit of the immediate recipient hereof.
Copyright 2014 Beverage Marketing Corporation of New York, 850 Third Avenue, New York, New York 10022, (212) 688-7640. All rights reserved. Reproductions in any form prohibited by law.

Table of Contents
Con
tents
The U.S. Beer Market
TABLE OF CONTENTS
Copyright 2014 Beverage Marketing Corporation of New York Reproduction without written permission is strictly prohibited
i
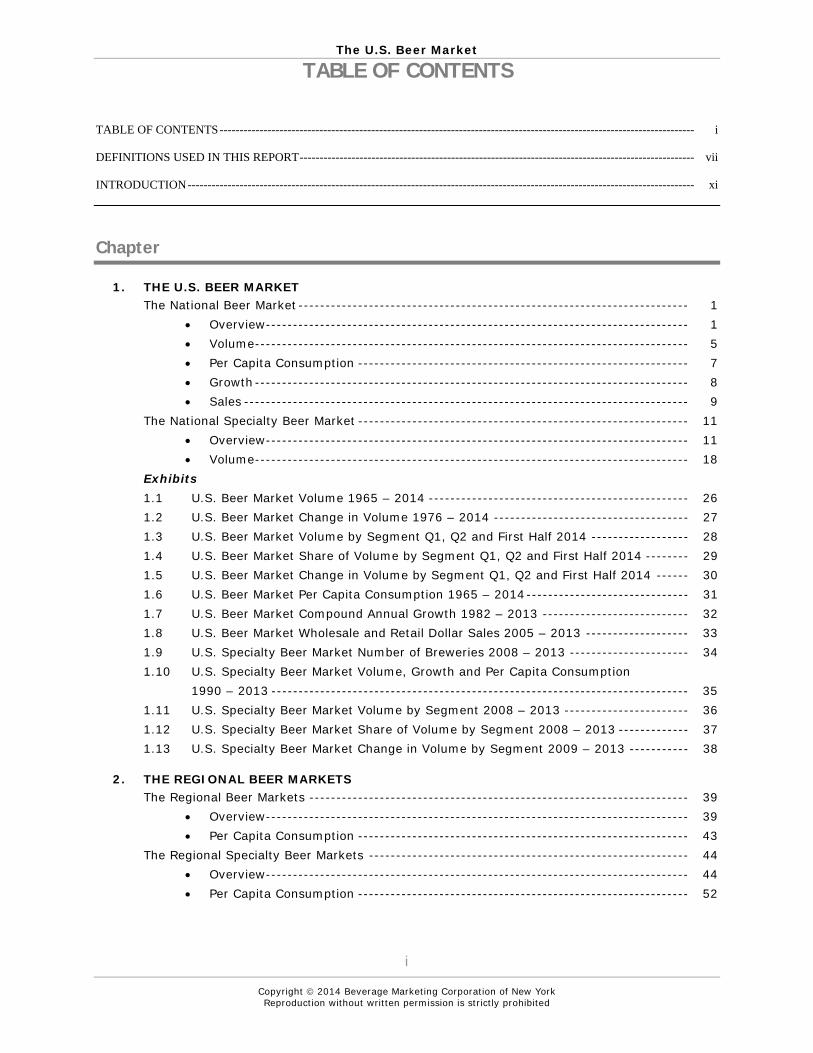
TABLE OF CONTENTS ----------------------------------------------------------------------------------------------------------------------- i DEFINITIONS USED IN THIS REPORT --------------------------------------------------------------------------------------------------- vii INTRODUCTION ------------------------------------------------------------------------------------------------------------------------------- xi
Chapter
1. THE U.S. BEER MARKET The National Beer Market ------------------------------------------------------------------------ 1
Overview ------------------------------------------------------------------------------ 1 Volume -------------------------------------------------------------------------------- 5 Per Capita Consumption ------------------------------------------------------------- 7 Growth -------------------------------------------------------------------------------- 8 Sales ---------------------------------------------------------------------------------- 9
The National Specialty Beer Market ------------------------------------------------------------- 11 Overview ------------------------------------------------------------------------------ 11 Volume -------------------------------------------------------------------------------- 18
Exhibits 1.1 U.S. Beer Market Volume 1965 – 2014 ------------------------------------------------ 26 1.2 U.S. Beer Market Change in Volume 1976 – 2014 ------------------------------------ 27 1.3 U.S. Beer Market Volume by Segment Q1, Q2 and First Half 2014 ------------------ 28 1.4 U.S. Beer Market Share of Volume by Segment Q1, Q2 and First Half 2014 -------- 29 1.5 U.S. Beer Market Change in Volume by Segment Q1, Q2 and First Half 2014 ------ 30 1.6 U.S. Beer Market Per Capita Consumption 1965 – 2014 ------------------------------ 31 1.7 U.S. Beer Market Compound Annual Growth 1982 – 2013 --------------------------- 32 1.8 U.S. Beer Market Wholesale and Retail Dollar Sales 2005 – 2013 ------------------- 33 1.9 U.S. Specialty Beer Market Number of Breweries 2008 – 2013 ---------------------- 34 1.10 U.S. Specialty Beer Market Volume, Growth and Per Capita Consumption 1990 – 2013 ----------------------------------------------------------------------------- 35 1.11 U.S. Specialty Beer Market Volume by Segment 2008 – 2013 ----------------------- 36 1.12 U.S. Specialty Beer Market Share of Volume by Segment 2008 – 2013 ------------- 37 1.13 U.S. Specialty Beer Market Change in Volume by Segment 2009 – 2013 ----------- 38
2. THE REGIONAL BEER MARKETS The Regional Beer Markets ---------------------------------------------------------------------- 39
Overview ------------------------------------------------------------------------------ 39 Per Capita Consumption ------------------------------------------------------------- 43
The Regional Specialty Beer Markets ----------------------------------------------------------- 44 Overview ------------------------------------------------------------------------------ 44 Per Capita Consumption ------------------------------------------------------------- 52

The U.S. Beer Market
TABLE OF CONTENTS
Copyright 2014 Beverage Marketing Corporation of New York Reproduction without written permission is strictly prohibited
ii
Chapter
2. THE REGIONAL BEER MARKETS (cont’d) Exhibits 2.14 U.S. Beer Market Volume by Region 2008 – 2013 ------------------------------------ 55 2.15 U.S. Beer Market Share of Volume by Region 2008 – 2013 -------------------------- 56 2.16 U.S. Beer Market Change in Volume by Region 2009 – 2013 ------------------------- 57 2.17 U.S. Beer Market Per Capita Consumption by Region 2008 – 2013 ------------------ 58 2.18 U.S. Specialty Beer Market Volume by Region 2008 – 2013 -------------------------- 59 2.19 U.S. Specialty Beer Market Share of Volume by Region 2008 – 2013 --------------- 60 2.20 U.S. Specialty Beer Market Change in Volume by Region 2009 – 2013 -------------- 61 2.21 U.S. Specialty Beer Market Per Capita Consumption by Region 2008 – 2013 ------- 62
3. THE LEADING CRAFT BEER COMPANIES AND THEIR BRANDS The Beer Companies and Their Strategies ------------------------------------------------------ 63
The Leading Specialty Brewers ------------------------------------------------------ 63 The Leading Microbrewers ----------------------------------------------------------- 65 The Leading Brewpubs --------------------------------------------------------------- 67
D.G. Yuengling & Son, Inc. Overview ------------------------------------------------------------------------------ 68 Marketing ----------------------------------------------------------------------------- 72 Management -------------------------------------------------------------------------- 75
The Boston Beer Company Overview ------------------------------------------------------------------------------ 76 Marketing ----------------------------------------------------------------------------- 81 Management -------------------------------------------------------------------------- 88
Sierra Nevada Brewing Company Overview ------------------------------------------------------------------------------ 90 Marketing ----------------------------------------------------------------------------- 93 Management -------------------------------------------------------------------------- 95
New Belgium Brewing Company Overview ------------------------------------------------------------------------------ 96 Marketing ----------------------------------------------------------------------------- 99 Management -------------------------------------------------------------------------- 100
Spoetzl Brewery Overview ------------------------------------------------------------------------------ 102 Marketing ----------------------------------------------------------------------------- 104 Management -------------------------------------------------------------------------- 106
Craft Brew Alliance Overview ------------------------------------------------------------------------------ 107 Marketing ----------------------------------------------------------------------------- 114 Management -------------------------------------------------------------------------- 118

The U.S. Beer Market
TABLE OF CONTENTS
Copyright 2014 Beverage Marketing Corporation of New York Reproduction without written permission is strictly prohibited
iii
Chapter
3. THE LEADING CRAFT BEER COMPANIES AND THEIR BRANDS(cont’d) Exhibits 3.22 Leading U.S. Craft Brewers Volume 2008 – 2013 ------------------------------------- 120 3.23 Leading U.S. Craft Brewers Share of Volume 2008 – 2013 --------------------------- 121 3.24 Leading U.S. Craft Brewers Change in Volume 2009 – 2013 ------------------------- 122 3.25 Leading U.S. Craft Brewers Volume in Grocery Stores 2013 ------------------------- 123 3.26 Leading U.S. Craft Brewers Retail Sales in Grocery Stores 2013 --------------------- 124 3.27 Leading U.S. Microbrewers Volume 2008 – 2013 -------------------------------------- 125 3.28 Leading U.S. Microbrewers Share of Volume 2008 – 2013 --------------------------- 126 3.29 Leading U.S. Microbrewers Change in Volume 2009 – 2013 -------------------------- 127 3.30 Leading U.S. Brewpubs Volume 2008 – 2013 ----------------------------------------- 128 3.31 Leading U.S. Brewpubs Share of Volume 2008 – 2013 ------------------------------- 129 3.32 Leading U.S. Brewpubs Change in Volume 2009 – 2013 ------------------------------ 130
4. PACKAGED AND DRAFT BEER IN THE U.S. Beer Packaging ----------------------------------------------------------------------------------- 131
Overview ------------------------------------------------------------------------------ 131 Packaged Beer Volume by Container Type ----------------------------------------- 137 Packaged and Draft Volume by Region --------------------------------------------- 139 Packaged Volume by State ---------------------------------------------------------- 141 Draft Volume by State --------------------------------------------------------------- 142
Specialty Beer Packaging ------------------------------------------------------------------------ 143 Packaged and Draft Specialty Beer ------------------------------------------------- 143 Specialty Beer Packaging by Segment ---------------------------------------------- 150
Exhibits 4.33 U.S. Beer Market Packaged and Draft Volume and Share 1975 – 2013 -------------- 153 4.34 U.S. Beer Market Change in Packaged and Draft Volume 1980 – 2013 -------------- 154 4.35 U.S. Beer Market Packaged Volume and Share by Container Type 1982 – 2013 ---- 155 4.36 U.S. Beer Market Change in Packaged Volume by Container Type 1983 – 2013 ---- 156 4.37 Regional Beer Markets Packaged and Draft Volume 2008 – 2013 -------------------- 157 4.38 Regional Beer Markets Share of Packaged and Draft Volume 2008 – 2013 ---------- 158 4.39 Regional Beer Markets Change in Packaged and Draft Volume 2009 – 2013 -------- 159 4.40 The Leading States in Packaged Beer Volume 2008 – 2013 -------------------------- 160 4.41 The Leading States in Draft Beer Volume 2008 – 2013 ------------------------------- 161 4.42 U.S. Specialty Beer Market Estimated Packaged and Draft Volume 2008 – 2013 --- 162 4.43 U.S. Specialty Beer Market Share of Estimated Packaged and Draft Volume 2008 – 2013 ----------------------------------------------------------------------------- 163 4.44 U.S. Specialty Beer Market Change in Estimated Packaged and Draft Volume 2009 – 2013 ----------------------------------------------------------------------------- 164

The U.S. Beer Market
TABLE OF CONTENTS
Copyright 2014 Beverage Marketing Corporation of New York Reproduction without written permission is strictly prohibited
iv
Chapter
5. BEER INDUSTRY PRICING IN THE U.S. Beer Pricing --------------------------------------------------------------------------------------- 165
Consumer Prices --------------------------------------------------------------------- 165 Producer Prices ----------------------------------------------------------------------- 167 Producer Prices by Package Type --------------------------------------------------- 169
Exhibits 5.45 Consumer Price Indexes Beer and Ale vs. All Items Change 1975 – 2013 ----------- 172 5.46 Producer Price Indexes Malt Beverages vs. All Items Change 1990 – 2013 --------- 173 5.47 Producer Price Index Malt Beverages vs. All Commodities Change by Package Types 1991 – 2013 ---------------------------------------------------------------------- 174
6. BEER ADVERTISING IN THE U.S. Beer Marketing ----------------------------------------------------------------------------------- 175
Overview ------------------------------------------------------------------------------ 175 Imported Beer ------------------------------------------------------------------------ 177 Domestic Beer ------------------------------------------------------------------------ 180
Advertising Expenditures by Category ---------------------------------------------------------- 183 Overview ------------------------------------------------------------------------------ 183
Leading Beer Companies’ Advertising Expenditures -------------------------------------------- 186 Overview ------------------------------------------------------------------------------ 186 Advertising Dollars Per Barrel ------------------------------------------------------- 189
Leading Brands’ Advertising Expenditures ------------------------------------------------------ 191 Overview ------------------------------------------------------------------------------ 191 Advertising Dollars Per Barrel ------------------------------------------------------- 192
Advertising Expenditures by Media -------------------------------------------------------------- 194 Overview ------------------------------------------------------------------------------ 194
Exhibits 6.48 Domestic and Imported Beer Market Advertising Expenditures 1981 – 2013 ------- 196 6.49 U.S. Beer Market Advertising Expenditures by Category 2008 – 2013 --------------- 197 6.50 U.S. Beer Market Share of Advertising Expenditures by Category 2008 – 2013 ---- 198 6.51 U.S. Beer Market Change in Advertising Expenditures by Category 2009 – 2013 --- 199 6.52 Leading Beer Companies Advertising Expenditures 2008 – 2013 -------------------- 200 6.53 Leading Beer Companies Share of Advertising Expenditures 2008 – 2013 ---------- 201 6.54 Leading Beer Companies Change in Advertising Expenditures 2009 – 2013--------- 202 6.55 Leading Beer Companies Advertising Dollars Per Barrel 2008 – 2013 --------------- 203 6.56 Leading Beer Brands Advertising Expenditures 2008 – 2013 ------------------------- 204 6.57 Leading Beer Brands Share of Advertising Expenditures 2008 – 2013 --------------- 205 6.58 Leading Beer Brands Change in Advertising Expenditures 2009 – 2013 ------------- 206 6.59 Leading Beer Brands Advertising Dollars Per Barrel 2008 – 2013 -------------------- 207

The U.S. Beer Market
TABLE OF CONTENTS
Copyright 2014 Beverage Marketing Corporation of New York Reproduction without written permission is strictly prohibited
v
Chapter
6. BEER ADVERTISING IN THE U.S. (cont’d) 6.60 U.S. Beer Market Advertising Expenditures by Media 2008 – 2013 ------------------ 208 6.61 U.S. Beer Market Share of Advertising Expenditures by Media 2008 – 2013 -------- 209 6.62 U.S. Beer Market Change in Advertising Expenditures by Media 2009 – 2013 ------ 210
7. DEMOGRAPHICS OF THE U.S. BEER CONSUMER The Beer Consumer ------------------------------------------------------------------------------ 211
Overview ------------------------------------------------------------------------------ 211 Budweiser and Miller Lite ------------------------------------------------------------ 215
The Specialty Beer Consumer ------------------------------------------------------------------- 221 Microbrews --------------------------------------------------------------------------- 221 Samuel Adams ----------------------------------------------------------------------- 225
Exhibits 7.63 Demographics of the Beer Consumer 2013 -------------------------------------------- 226 7.64 Demographics of the Budweiser Consumer 2013 -------------------------------------- 227 7.65 Demographics of the Miller Lite Consumer 2013 -------------------------------------- 228 7.66 Demographics of the Microbrew Consumer 2013 -------------------------------------- 229 7.67 Demographics of the Samuel Adams Consumer 2013 -------------------------------- 230
8. THE PROJECTED U.S. BEER MARKET The Projected National Beer Market ------------------------------------------------------------- 231
Overview ------------------------------------------------------------------------------ 231 Per Capita Consumption ------------------------------------------------------------- 234
The Projected National Specialty Beer Market -------------------------------------------------- 235 Overview ------------------------------------------------------------------------------ 235 Per Capita Consumption ------------------------------------------------------------- 236
Exhibits 8.68 The Projected U.S. Beer Market Volume 1965 – 2018 -------------------------------- 237 8.69 The Projected U.S. Beer Market Change in Volume 1976 – 2018 -------------------- 238 8.70 The Projected U.S. Beer Market Compound Annual Growth 1981 – 2018 ----------- 239 8.71 The Projected U.S. Beer Market Per Capita Consumption 1965 – 2018 -------------- 240 8.72 The Projected U.S. Craft Beer Market Volume 1990 – 2018 -------------------------- 241 8.73 The Projected U.S. Craft Beer Market Change in Volume 1991 – 2018 -------------- 242 8.74 The Projected U.S. Craft Beer Market Compound Annual Growth 1995 – 2018 ----- 243 8.75 The Projected U.S. Craft Beer Market Per Capita Consumption 1990 – 2018 -------- 244
Appendix
U.S. Population by Region 1977 – 2013 -------------------------------------------------------- 245

Copyright 2014 Beverage Marketing Corporation of New York Reproduction without written permission is strictly prohibited

Copyright 2014 Beverage Marketing Corporation of New York Reproduction without written permission is strictly prohibited

Copyright 2014 Beverage Marketing Corporation of New York Reproduction without written permission is strictly prohibited