haw par corporation limited annual report 2007
TRANSCRIPT

HA
W P
AR
CO
RP
OR
AT
ION
LIM
ITE
D A
nnual R
ep
ort 2
00
7
HAW PAR CORPORATION LIMITED
Annual Report 2007
HAW PAR CORPORATION LIMITED(Incorporated in the Republic of Singapore)
Company Registration Number: 196900437M
401 Commonwealth Drive
#03-03 Haw Par Technocentre
Singapore 149598
Tel: 6337 9102 Fax: 6336 9232
www.hawpar.com

GROUP OF
COMPANIES
CORE OPERATIONS
Healthcare
Haw Par Healthcare Limited
Tiger Balm (Malaysia) Sdn. Bhd.
Haw Par Tiger Balm (Philippines), Inc.
Tiger Medicals (Taiwan) Limited
Xiamen Tiger Medicals Co., Ltd.
Haw Par Elder (India) Private Limited
Haw Par Tiger Balm (Thailand) Limited
PT. Haw Par Healthcare
Leisure
Haw Par Leisure Pte Ltd
Underwater World Singapore Pte Ltd
Underwater World Pattaya Ltd
Chengdu Haw Par Oceanarium Co. Ltd
PROPERTY & INVESTMENTS
Property
Haw Par Properties (Singapore) Private Limited
Haw Par Centre Private Ltd
Setron Limited
Haw Par Land (Malaysia) Sdn. Bhd.
Investments
Haw Par Investment Holdings Private Limited
Straits Maritime Leasing Private Limited
Pickwick Securities Private Limited
Haw Par Equities Pte Ltd
Haw Par Trading Pte Ltd
M & G Maritime Services Pte Ltd
Haw Par Capital Pte Ltd
Haw Par Securities (Private) Limited
Haw Par International Limited
Associated Companies
Hua Han Bio-Pharmaceutical Holdings Limited (20.84%)
UIC Technologies Pte Ltd (40%)
CONTENTS
1 Corporate Profi le
2 Chairman’s Statement
6 Board of Directors
11 Corporate Information
12 Key & Senior Executives
14 Group Financial Highlights
16 Five-Year Financial Summary
18 Operations Review
26 People & The Community
28 Financial Review
33 Share Price & Trading Volume
34 Corporate Governance Report
41 Statutory Reports & Financial Statements
107 Financial Calendar
108 Group Offi ces
110 Management Listing
111 Major Products & Services
112 Statistics of Shareholdings
114 Notice of Annual General Meeting
119 Proxy Form

HA
W P
AR
CO
RP
OR
AT
ION
LIM
ITE
D
An
nu
al
Re
po
rt 2
00
7
1
CORPORATE
PROFILE
HAW PAR CORPORATION LIMITED has been listed on The Singapore Exchange
since 1969.
Headquartered in Singapore, the Group’s core healthcare and leisure businesses promote
healthy lifestyles through its healthcare products and oceanariums.
Haw Par’s healthcare products are manufactured and marketed under its various
established brands such as Tiger Balm and Kwan Loong. Its renowned ointment Tiger
Balm and product extensions such as Tiger Balm Medicated Plaster, Tiger Balm Joint Rub,
Tiger Balm Neck & Shoulder Rub and Tiger Balm Neck and Shoulder Rub Boost are used
worldwide to invigorate the body as well as to relief aches and pains.
The Group owns and operates two oceanariums, namely the Underwater World Singapore
at Sentosa and Underwater World Pattaya in Thailand. A third oceanarium in Chengdu,
China, is under construction and due for completion in 2008.
The Group also has interests in investment properties and manages its own portfolio of
investments in securities.
The Group’s primary corporate strategy is to expand its core healthcare and leisure
businesses through product extensions under its own established brands, form strategic
alliances with partners in various key markets and explore acquisition of compatible
businesses. It also aims to manage effi ciently its portfolio of investments in properties and
securities to achieve a reasonable return.

HA
W P
AR
CO
RP
OR
AT
ION
LIM
ITE
D
An
nu
al
Re
po
rt 2
00
7
2
CHAIRMAN’S
STATEMENT
FINANCIAL PERFORMANCE
Strong economic fundamentals in Singapore
continued to bolster Haw Par’s performance.
Group earnings in 2007 increased by 48% to
$159.0 million (2006: $107.1 million) due to higher
operating profi ts, higher special dividends and
fair values gains on investment properties. Group
turnover was maintained at $119 million despite
the strengthening of the Singapore dollar and
divestment of the generic operations.
The healthcare division continued its global outreach
by expanding target markets and products while
keeping up with local market challenges. Tiger Balm
brand products garnered a 6% increase in sales,
amidst the weakening of the US dollar.
The leisure division also turned in respectable
results. Underwater World Singapore (“UWS”)
achieved better than expected performance with
increased visitors. Underwater World Pattaya
managed to increase revenue despite lower
visitor numbers and challenging local conditions.
Property income rode on the wave of improved
rental and occupancy rates in the buoyant
Singapore property market, pushing its profits
higher by 38% year-on-year.
DIVIDENDS
For the fi nancial year ended 31 December 2007, the
Directors recommend the payment of a fi nal tax-
exempt (one-tier) dividend of 14 cents per ordinary
share and a special tax-exempt (one-tier) dividend of
5 cents per ordinary share. Together with the interim
tax-exempt (one-tier) dividend of 6 cents paid in
September 2007, the total tax-exempt (one-tier)
dividend per ordinary share for fi nancial year 2007
would be 25 cents [2006: 20 cents tax-exempt (one-
tier)]. This dividend represents more than 50% of our
operating profi t. A share buyback exercise carried
out during the year, which repurchased shares at
between $6.85 and $8.30 per share, helped to further
improve shareholder value.
GROUP OPERATING HIGHLIGHTS
Key markets for Tiger Balm products in America,
Europe and Asia witnessed challenges during the
year. Increased regulatory controls and global
competition hampered efforts to expand our
distribution networks and product range within
each market. However, Tiger Balm Neck and
Shoulder Rub Boost, a new variant, which was
introduced in Singapore during the year enjoyed
good reception and would be rolled out to other
markets in due course.
HA
W P
AR
CO
RP
OR
AT
ION
LIM
ITE
D
An
nu
al
Re
po
rt 2
00
7
3
CHAIRMAN’S
STATEMENT
UWS’s unique programme of self-renewal and
strategic marketing was pivotal in sustaining growth
in 2007. The continual introduction of new exhibits
rejuvenated and strengthened interest for UWS.
The property division benefi ted from the recent
property boom and turned in respectable results
with higher occupancy and rental rates.
BUSINESS OUTLOOK AND STRATEGY
Although the offi cial estimate for Singapore’s
GDP growth in 2008 is between 4% to 6%, many
uncertainties cloud the global economy. Amid
tighter regulatory controls in the overseas markets,
increased global competition and a stronger
Singapore dollar, the Group will continue to
pursue revenue and profi t growth for its healthcare
business by focusing its efforts in developing the
regional markets.
The Singapore tourism industry is expected to
remain vibrant with the hosting of global events,
although the hotel supply crunch will continue to
pose challenges for leisure travellers, which is a
key market segment for UWS. Our oceanarium in
Chengdu, currently under construction, is scheduled
to commence operation by end of 2008.
The Group will continue to explore acquisitions and collaborative opportunities over the coming years, especially in those areas that can leverage on the Group’s network and expertise.
The Group will continue to explore acquisitions and
collaborative opportunities over the coming years,
especially in those areas that can leverage on the
Group’s network and expertise.
ACKNOWLEDGEMENT
The Group has done well for the year. For this,
I wish to thank my fellow Board members for their
invaluable counsel and contributions, management
and staff for their hard work and dedication, and
our shareholders and business associates for their
continuing support.
Wee Cho Yaw
Chairman

HA
W P
AR
CO
RP
OR
AT
ION
LIM
ITE
D
An
nu
al
Re
po
rt 2
00
7
4
2007
48% 1 5900 2006 1
710
1
1900
6%
38%
2007 12 31
14
5
2007 9 6
2007
25 2006 20
50
$6.85 $8.30
Neck and Shoulder Rub
Boost

HA
W P
AR
CO
RP
OR
AT
ION
LIM
ITE
D
An
nu
al
Re
po
rt 2
00
7
5
2007
2008
4% 6%
2008
2007
HA
W P
AR
CO
RP
OR
AT
ION
LIM
ITE
D
An
nu
al
Re
po
rt 2
00
7
6
BOARD OF
DIRECTORS
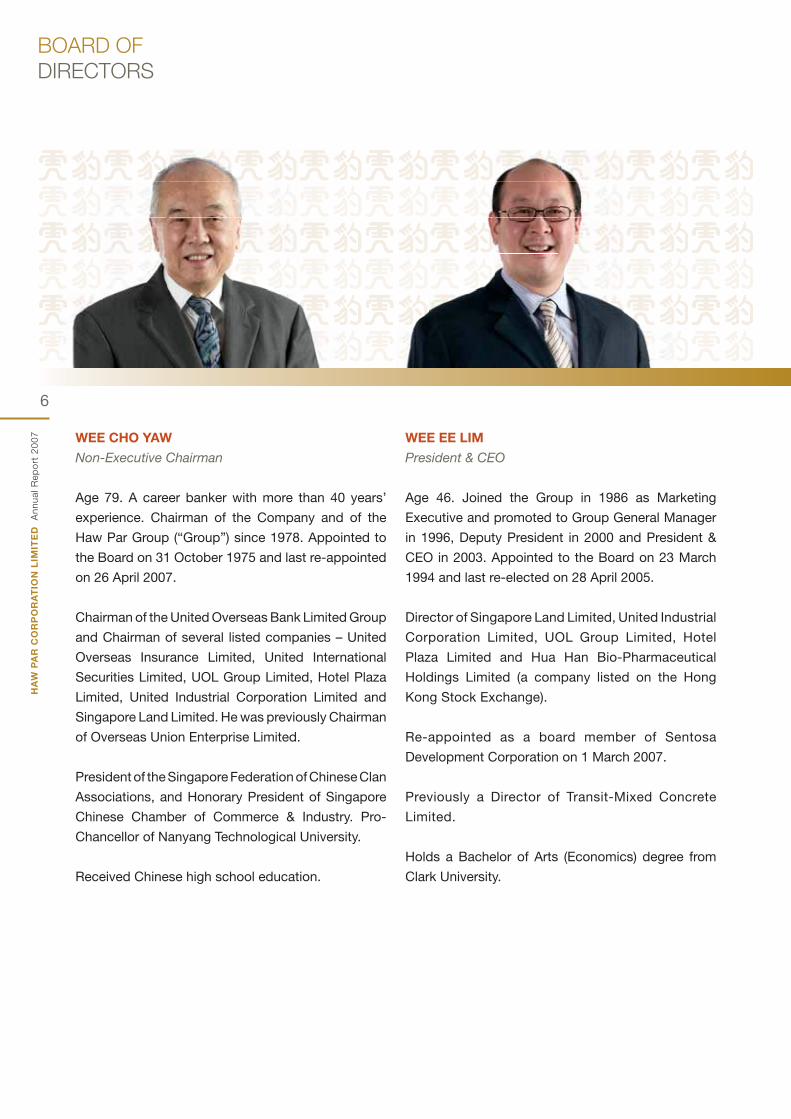
WEE CHO YAW
Non-Executive Chairman
Age 79. A career banker with more than 40 years’
experience. Chairman of the Company and of the
Haw Par Group (“Group”) since 1978. Appointed to
the Board on 31 October 1975 and last re-appointed
on 26 April 2007.
Chairman of the United Overseas Bank Limited Group
and Chairman of several listed companies – United
Overseas Insurance Limited, United International
Securities Limited, UOL Group Limited, Hotel Plaza
Limited, United Industrial Corporation Limited and
Singapore Land Limited. He was previously Chairman
of Overseas Union Enterprise Limited.
President of the Singapore Federation of Chinese Clan
Associations, and Honorary President of Singapore
Chinese Chamber of Commerce & Industry. Pro-
Chancellor of Nanyang Technological University.
Received Chinese high school education.
WEE EE LIM
President & CEO
Age 46. Joined the Group in 1986 as Marketing
Executive and promoted to Group General Manager
in 1996, Deputy President in 2000 and President &
CEO in 2003. Appointed to the Board on 23 March
1994 and last re-elected on 28 April 2005.
Director of Singapore Land Limited, United Industrial
Corporation Limited, UOL Group Limited, Hotel
Plaza Limited and Hua Han Bio-Pharmaceutical
Holdings Limited (a company listed on the Hong
Kong Stock Exchange).
Re-appointed as a board member of Sentosa
Development Corporation on 1 March 2007.
Previously a Director of Transit-Mixed Concrete
Limited.
Holds a Bachelor of Arts (Economics) degree from
Clark University.

HA
W P
AR
CO
RP
OR
AT
ION
LIM
ITE
D
An
nu
al
Re
po
rt 2
00
7
7
BOARD OF
DIRECTORS
SAT PAL KHATTAR
Independent Director
Age 65. A founding partner and later consultant in
Messrs KhattarWong with over 40 years’ experience
in the legal profession. Now, Chairman and Director
of Khattar Holdings Pte Ltd Group of Companies
which engages principally in making investments.
Appointed to the Board on 1 January 1977 and last
re-elected on 28 April 2005.
Chairman of GuocoLand Limited. Chairman of
the Board of Trustees of the Singapore Business
Federation and Director of the Institute of South
Asian Studies.
Holds a LLM degree and a LLB (Hons) degree from
the University of Singapore.
REGGIE THEIN
Independent Director
Age 67. An accountant with over 40 years’ in the
profession. Appointed to the Board on 8 July 2003
and last re-elected on 26 April 2007.
Director of United Overseas Bank Limited,
GuocoLand Limited, GuocoLeisure Limited, Grand
Banks Yachts Limited, MFS Technology Limited,
FJ Benjamin Holdings Limited, MobileOne Limited,
Keppel Telecommunications and Transportation
Limited, Energy Support Management Pte Ltd,
Ascendas Pte Ltd and DLF Offi ce Trust.
Also a member of the governing council of the
Singapore Institute of Directors.
Previously, a Director of Pearl Energy Limited.
Fellow of the Institute of Chartered Accountants in
England and Wales and a member of the Institute
of Certifi ed Public Accountants of Singapore.

HA
W P
AR
CO
RP
OR
AT
ION
LIM
ITE
D
An
nu
al
Re
po
rt 2
00
7
8
BOARD OF
DIRECTORS
HWANG SOO JIN
Independent Director
Age 72. A chartered insurer with more than 40
years of professional experience. Appointed to
the Board on 28 October 1986 and last re-elected
on 26 April 2007.
Chairman Emeritus, Director and Senior Advisor
of Singapore Reinsurance Corporation Limited
and Director of Singapore Land Limited, United
Industrial Corporation Limited and United Overseas
Insurance Limited.
A Director of the Hokkien Foundation.
Previously, a Director of Lee Kim Tah Holdings
Limited among others.
A chartered insurer of the Chartered Insurance
Institute, UK, an advisor to the ASEAN Insurance
Council, an Honorary Fellow of The Singapore
Insurance Institute and a Justice of the Peace.
LEE SUAN YEW
Independent Director
Age 74. A medical practitioner with over 40 years’
experience. Appointed to the Board on 18 December
1995 and last re-appointed on 26 April 2007.
Currently, also a Director of K1 Ventures Limited and
Chairman of the National Medical Ethics Committee.
Appointed Justice of the Peace in 1998. He was
President of the Singapore Medical Council for
4 years (2000 – 2004). For his numerous public
services, he was awarded the Public Service Star in
1991 and Public Service Star (Bar) in 2002.
Holds a M.B.B. Chir. degree from the University of
Cambridge and MRCP and FRCP from the Royal
College of Physicians, Glasgow.

HA
W P
AR
CO
RP
OR
AT
ION
LIM
ITE
D
An
nu
al
Re
po
rt 2
00
7
9
BOARD OF
DIRECTORS
LIM KEE MING
Independent Director
Age 81. Chairman of Lim Teck Lee Group of
Companies. Appointed to the Board on 5 December
1997 and last re-appointed on 26 April 2007.
Director of UOL Group Limited and Hotel Plaza
Limited. Also an advisor to Network China.
Honorary President of Singapore Chinese Chamber
of Commerce & Industry and Vice President of
Ngee Ann Kongsi.
Previously Chairman of Preservation of Monument
Board.
Holds a Masters degree in International Trade
& Finance from Columbia University and a Bachelor
degree in Business Administration from New
York University.
WEE EE CHAO
Non-Executive Director
Age 53. Chairman of UOB-Kay Hian Holdings
Limited. Appointed to the Board on 8 July 2003 and
last re-elected on 26 April 2006.
Chairman and Managing Director of UOB-Kay
Hian Holdings Limited Group and Director of Wee
Investments Private Limited Group, UOL Group
Limited and Hotel Plaza Limited.
Previously, Chairman of the Singapore Tourism
Board, 2002 – 2004.
Holds a Bachelor of Business Administration degree
from The American University.

HA
W P
AR
CO
RP
OR
AT
ION
LIM
ITE
D
An
nu
al
Re
po
rt 2
00
7
10
BOARD OF
DIRECTORS
CHNG HWEE HONG
Executive Director
Age 58. Joined the Group in 1990. Appointed as
Group General Manager in 1992 and promoted as
Executive Director and Chief Operating Offi cer in
1996. Appointed to the Board on 23 March 1994 and
last re-elected on 26 April 2006.
Appointed as a Committee Member of the Singapore
Sichuan Trade and Investment Committee on
1 May 2005.
Holds a Bachelor of Science (Hons) degree in Applied
Chemistry and a Diploma in Business Administration
from the National University of Singapore.
HAN AH KUAN
Executive Director
Age 59. Joined the Group in 1991 as General
Manager of Haw Par Healthcare Limited (“HPH”) and
appointed as a director of HPH in 1995. Appointed
to the Board on 28 January 2005 and re-elected on
26 April 2007.
Holds a Bachelor of Business Administration (Hons)
degree from the National University of Singapore.

HA
W P
AR
CO
RP
OR
AT
ION
LIM
ITE
D
An
nu
al
Re
po
rt 2
00
7
11
CORPORATE
INFORMATION
DIRECTORS
Wee Cho Yaw
Chairman (Non-Executive)
Wee Ee Lim
President & Chief Executive Offi cer
Sat Pal Khattar
Independent Director
Reggie Thein
Independent Director
Hwang Soo Jin
Independent Director
Lee Suan Yew
Independent Director
Lim Kee Ming
Independent Director
Wee Ee Chao
Non-Executive Director
Chng Hwee Hong
Executive Director
Han Ah Kuan
Executive Director
AUDIT COMMITTEE
Reggie Thein
Chairman
Hwang Soo Jin
Lee Suan Yew
INVESTMENT COMMITTEE
Wee Cho Yaw
Chairman
Wee Ee Lim
Chng Hwee Hong
Han Ah Kuan
NOMINATING COMMITTEE
Sat Pal Khattar
Chairman
Wee Cho Yaw
Lee Suan Yew
REMUNERATION COMMITTEE
Sat Pal Khattar
Chairman
Wee Cho Yaw
Hwang Soo Jin
COMPANY SECRETARY
Tan Thiam Hee
AUDITORS
PricewaterhouseCoopers
Chew Teck Soon (From 2004)
Audit Partner-in-charge
BANKERS
The Hong Kong & Shanghai Banking
Corporation Limited
United Overseas Bank Limited
REGISTRAR
Boardroom Corporate & Advisory Services
Pte Ltd
Formerly known as Lim Associates (Pte) Ltd
3 Church Street, #08-01
Samsung Hub,
Singapore 049483
REGISTERED OFFICE
401 Commonwealth Drive
#03-03 Haw Par Technocentre
Singapore 149598
Tel : 6337 9102
Fax : 6336 9232
Website : www.hawpar.com
Reg. No. : 196900437M

HA
W P
AR
CO
RP
OR
AT
ION
LIM
ITE
D
An
nu
al
Re
po
rt 2
00
7
12
KEY & SENIOR
EXECUTIVES
TAN THIAM HEE
Group Financial Controller
& Group Company Secretary,
Haw Par Corporation Limited
Joined the Group as Group Financial Controller and
Group Company Secretary in 2006.
Holds a Master of Business Administration
(International Business) and a Bachelor of
Accountancy degree from the Nanyang Technological
University. A member of the Institute of Certifi ed
Public Accountants of Singapore and the Singapore
Institute of Directors.
TEO THIN YIEN
Group Internal Audit Manager
Haw Par Corporation Limited
Joined the Group in 1979 as Group Internal Audit
Manager.
Fellow of CPA Australia.
TARN SIEN HAO
General Manager (Corporate Development),
Haw Par Corporation Limited
Joined the Group in 2001 as Deputy General
Manager (Corporate Development). Promoted to
present position in 2005.
Holds a Master of Business Administration from the
University of Dubuque.
GOH BEE LEONG
Director & General Manager (Manufacturing),
Haw Par Healthcare Limited
Joined Haw Par Healthcare in 1977 as Quality
Control Pharmacist. Promoted to present position
in 2006.
Holds a Bachelor of Science (Pharmacy) from the
University of Singapore.
JASMIN HONG
Deputy General Manager (Marketing),
Haw Par Healthcare Limited
Joined Haw Par Healthcare in 2004 as Deputy
General Manager (Marketing).
Holds a Bachelor of Commerce degree from the
University of Melbourne.

HA
W P
AR
CO
RP
OR
AT
ION
LIM
ITE
D
An
nu
al
Re
po
rt 2
00
7
13
KEY & SENIOR
EXECUTIVES
KWEK MENG TIAM
Director & General Manager,
Underwater World Singapore Pte Ltd
Joined Underwater World Singapore in 1991
as Maintenance Superintendent. Promoted to
Operations Director in 2002 and to present position
in 2005.
Holds a Bachelor of Arts in Business Studies,
The Open University, UK.
JEFFREY L. MAHON
Curatorial Director,
Underwater World Singapore Pte Ltd
Joined Underwater World Singapore in 2005
as Curatorial Director.
Holds a Doctor of Philosophy (Zoology) degree from
the University of Hawaii and a Bachelor of Science
(Oceanography) degree from the United States
Naval Academy.
DAVID HONG
Director & General Manager,
Underwater World Pattaya Ltd
Joined Underwater World Singapore in 1992 as
Manager (Finance & Admin). Promoted to Senior
Projects Manager in 1997 and re-designated as
General Manager of Underwater World Pattaya
in 2002.
Holds a Master of Science (Urban Land Appraisal)
from the Reading University.
KENNETH PEH
General Manager,
Chengdu Haw Par Oceanarium Co. Ltd
Joined Underwater World Singapore in 1998 as
Facilities Manager. Promoted to Senior Manager
(Facilities/Projects) in 2008 and seconded to
Chengdu Haw Par Oceanarium Co. Ltd as General
Manager in December 2007.
Holds a Bachelor of Applied Science degree
in Construction Management from the Royal
Melbourne Institute of Technology.
WONG FOOK YUEN
Director & Property Manager,
Haw Par Properties (Singapore) Private Limited
Joined Haw Par Properties as Property Manager
in 2001.
Holds a Bachelor of Science degree in Estate
Management from the University of Singapore.

HA
W P
AR
CO
RP
OR
AT
ION
LIM
ITE
D
An
nu
al
Re
po
rt 2
00
7
14
GROUP FINANCIAL
HIGHLIGHTS
% Increase/
2007 2006 (Decrease)
RESULTS ($’000)
Group turnover:
1st Quarter 26,498 26,837 (1.3)
2nd Quarter 29,119 31,176 (6.6)
3rd Quarter 30,658 32,570 (5.9)
4th Quarter 33,057 29,099 13.6
119,332 119,682 (0.3)
Profi t before taxation:
1st Quarter 8,810 10,323 (14.7)
2nd Quarter 62,739 40,103 56.4
3rd Quarter 31,980 46,351 (31.0)
4th Quarter 84,301 30,320 178.0
187,830 127,097 47.8
Earnings for the year:
1st Quarter 7,742 8,802 (12.0)
2nd Quarter 52,903 33,131 59.7
3rd Quarter 27,216 39,108 (30.4)
4th Quarter 71,122 26,050 173.0
158,983 107,091 48.5
BALANCE SHEET ($’000)
Shareholders’ funds 1,927,289 1,799,165 7.1
Borrowings – – –
Debt/Equity (%) – – –
PER SHARE
Earnings (cents) 77.8 51.6 50.8
Dividend net (cents) 25.0 20.0 25.0
Dividend cover (times) 3.1 2.6 19.2
Net tangible assets per share ($) 9.71 8.61 12.8
EMPLOYEES
Number of employees 381 399 (4.5)
Group turnover per employee ($’000) 313 300 4.3
Pre-tax profi t per employee ($’000) 493 319 54.5

HA
W P
AR
CO
RP
OR
AT
ION
LIM
ITE
D
An
nu
al
Re
po
rt 2
00
7
15
GROUP FINANCIAL
HIGHLIGHTS
1 Profi t contribution refers to profi t before tax and excludes fair value gain on investment properties.
TURNOVER (%)
2007 2006
Healthcare 59.1 63.7
Leisure 31.0 28.4
Property 9.9 7.8
PROFIT CONTRIBUTION 1 (%)
2007 2006
Healthcare 11.9 21.5
Leisure 14.8 14.7
Property 7.1 5.5
Investments 66.2 58.3
ASSETS EMPLOYED (%)
2007 2006
Healthcare 4.1 5.0
Leisure 3.1 3.9
Property 9.0 8.1
Investments 83.8 83.0
2007
2007
2007
2006
2006
2006
HA
W P
AR
CO
RP
OR
AT
ION
LIM
ITE
D
An
nu
al
Re
po
rt 2
00
7
16
FIVE-YEAR FINANCIAL
SUMMARY
2007 2006 2005 2004 2003
RESULTS ($’000)
Group turnover 119,332 119,682 120,404 113,379 99,384
Profi t from operations after interest 109,039 101,837 94,872 86,677 63,417
Associates’ contribution 6,129 8,599 309 163 (405)
Profi t before exceptional items 187,830 127,097 95,181 86,840 63,012
Exceptional items – – – – 326
Profi t before taxation 187,830 127,097 95,181 86,840 63,338
Profi t after taxation 159,130 107,268 80,689 74,469 51,947
Earnings for the year 158,983 107,091 80,311 73,254 49,834
PER SHARE
Earnings (cents) 77.8 51.6 38.8 35.4 24.1
Dividend net (cents) 25.0 20.0 19.0 17.0 14.7
Dividend cover (times) 3.1 2.6 2.0 2.1 1.6
BALANCE SHEET ($’000)
Shareholders’ funds 1,927,289 1,799,165 1,310,875 592,941 559,093
Minority interests 6,899 6,909 6,895 6,668 5,132
1,934,188 1,806,074 1,317,770 599,609 564,225
Property, plant and equipment 26,469 23,106 23,417 29,600 32,345
Investment properties 214,498 151,698 134,968 124,433 132,390
Associated companies 49,995 43,680 36,696 1,448 1,705
Available-for-sale fi nancial assets 1,285,747 1,194,564 846,834 311,299 330,836
Intangible assets 11,216 11,116 14,428 14,428 15,215
Net current assets 413,918 443,162 302,060 124,721 95,551
Long term liabilities (67,655) (61,252) (40,633) (6,320) (43,817)
1,934,188 1,806,074 1,317,770 599,609 564,225
STATISTICS
Return on equity (%) 8.2 5.9 6.1 12.2 8.8
Net tangible assets per share ($) 9.71 8.61 6.26 2.80 2.63
Debt/Equity (%) – – 0.0 0.8 17.5
Number of shareholders 21,770 22,574 24,915 25,912 27,608
EMPLOYEES
Number of employees 381 399 442 470 449
Group turnover per employee ($’000) 313 300 272 241 221
Pre-tax profi t per employee ($’000) 493 319 215 185 141
HA
W P
AR
CO
RP
OR
AT
ION
LIM
ITE
D
An
nu
al
Re
po
rt 2
00
7
17
FIVE-YEAR FINANCIAL
SUMMARY
0
30.0
60.0
90.0
120.0
150.0
180.0
0
5.0
10.0
15.0
20.0
25.0
30.0
1998 1999 2000 2001 2002 2003 2004 2005 2006 2007
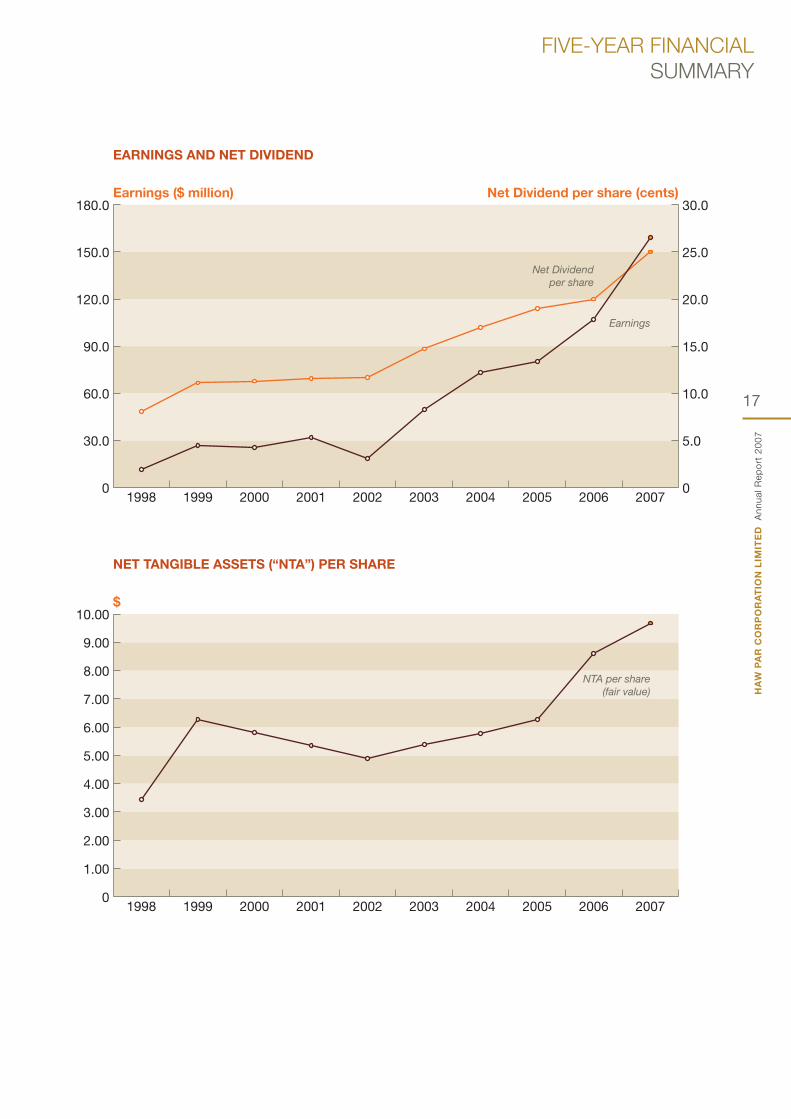
Earnings ($ million) Net Dividend per share (cents)
EARNINGS AND NET DIVIDEND
Earnings
Net Dividend
per share
0 1998 1999 2000 2001 2002 2003 2004 2005 2006 2007
$
NET TANGIBLE ASSETS (“NTA”) PER SHARE
1.00
2.00
3.00
4.00
5.00
6.00
7.00
8.00
9.00
10.00
NTA per share
(fair value)

HA
W P
AR
CO
RP
OR
AT
ION
LIM
ITE
D
An
nu
al
Re
po
rt 2
00
7
18
HEALTHCARE
In 2007, Haw Par Healthcare faced several
challenges. The depreciation of the US Dollar (which
is the currency transacted in various key markets),
coupled with an unusually warmer winter in Europe,
depressed revenue growth.
Markets such as India, Hong Kong, China and
Thailand were the main drivers of growth in the
sales of Tiger Balm brand products. The change
in India’s business model saw a substantial
increase in sales in 2007 over the previous year’s
with the sizeable increase in advertisement and
promotional funds invested by our Indian partner.
Similar licensing models are being considered for
other selective markets.
In the US market, to keep up with the intense
competition and to appeal to the younger consumers,
advertising through non-traditional media such as
YouTube and Google on the Internet were made
and was very well-received. Tiger Balm Back Pain
Patch was also introduced into the US market which
was met with encouraging acceptance by trade and
consumers. Unfortunately, our products also faced
delisting threats from some chain stores which are
becoming more demanding.

HA
W P
AR
CO
RP
OR
AT
ION
LIM
ITE
D
An
nu
al
Re
po
rt 2
00
7
19
HEALTHCARE
Tiger Balm was awarded the Certifi cate of Special
Congressional Recognition for its service to the
community in California by the Honourable Mr Tom
Lantos, US Congressman. The ceremony was
held on 8 December, 2006 and the award was
received by Mr A K Han, Executive Director of
Haw Par Corporation on behalf of Tiger Balm.
The community service was sponsored by Tiger
Balm and implemented by our USA distributor,
Prince-of-Peace.
Following its successful launch in Singapore in 2005,
Tiger Balm Neck & Shoulder Rub was launched in
Hong Kong in 2007 with reasonably good acceptance
by the trade. The product was also launched in
Thailand in February 2008. A line extension for
Tiger Balm Neck & Shoulder Rub was introduced in
Singapore in 2007 to meet the needs of consumers
who require a stronger version. This new product is
branded Tiger Balm Neck & Shoulder Rub Boost.
The two versions accorded us higher visibility and
image for our brand at the retail level.
Recently, our product registrations were approved
and we have appointed a distributor for the Vietnam
market. This is a potentially large market for Tiger
Balm and Kwan Loong although the competition
there is keen.
We continue to face many local challenges in
the markets that we compete in. In China, our
product registrations and licenses have suffered
some unexpected delays. Changes in some of our
distributors’ manpower had direct impact on our
business. We have preempted this to some extent
with the appointment of our Country Managers in
the key markets. The cost of our key raw materials,
camphor and menthol, have escalated and is
projected to continue increasing, thereby affecting
our margins.

HA
W P
AR
CO
RP
OR
AT
ION
LIM
ITE
D
An
nu
al
Re
po
rt 2
00
7
20
TIGER BALM
WORLDWIDE DISTRIBUTION
AMERICA
Bahamas
Canada
El-Salvador
Jamaica
Mexico
Panama
Suriname
Trinidad & Tobago
USA
Venezuela

HA
W P
AR
CO
RP
OR
AT
ION
LIM
ITE
D
An
nu
al
Re
po
rt 2
00
7
21
TIGER BALM
WORLDWIDE DISTRIBUTION
AUSTRALASIA
Australia
New Zealand
Papua New Guinea
ASIA
Brunei
China
Hong Kong
India
Indonesia
Japan
Macau
Malaysia
Pakistan
Nepal
Philippines
Singapore
Sri Lanka
Taiwan
Thailand
Vietnam
Laos
AFRICA
Ivory Coast
Kenya
Mauritius
Namibia
Seychelles
South Africa
Malawi
MIDDLE EAST
Bahrain
Israel
Jordan
Kuwait
Oman
Qatar
Saudi Arabia
UAE
EUROPE
Andorra
Austria
Belgium
Croatia
Cyprus
Czech Republic
Denmark
Estonia
Finland
France
Germany
Gibraltar
Greece
Holland
Hungary
Ireland
Italy
Lithuania
Liechtenstein
Luxembourg
Macedonia
Malta
Norway
Poland
Portugal
Russia
Slovakia
Slovenia
Spain
Sweden
Switzerland
United Kingdom
Countries that have manufacturing facilities.

HA
W P
AR
CO
RP
OR
AT
ION
LIM
ITE
D
An
nu
al
Re
po
rt 2
00
7
22
LEISURE
UNDERWATER WORLD SINGAPORE
Underwater World Singapore (“UWS”)’s visitorship
in 2007 surpassed that of 2006 amid record-
breaking hotel rates fuelled by growing demands
from business travellers and a severe supply crunch
of hotel rooms, which signifi cantly impacted leisure
group arrivals to Singapore. UWS’s unique fabric of
self-renewal and strategic marketing was pivotal in
sustaining growth in 2007. The relentless effort in
innovation resulted in the birth of new exhibits that
rejuvenated and strengthened interest for UWS.
Anticipating the challenges in 2007, UWS moved to
enhance brand equity and draw in leisure tourists by
implementing new interactive experiences through
creative advertisements that built a strategic
leverage against local and regional competing
attractions. UWS also invested in outdoor media
that allowed it to creatively display visuals for
maximum impact and exposure.
In 2007, UWS continued to offer new, exciting and
interactive exhibits to visitors. Our new marketing
campaign has also strengthened UWS’s overall
impression to visitors and differentiated UWS from
other aquariums in the region.
In February 2007, in celebration of the Lunar New
Year of the Pig, UWS exhibited the Pig-nosed Turtle in
a uniquely designed, world’s largest giant gold ingot
tank to wish all visitors longevity and good fortune.
Visitors had the opportunity to try their luck and skill
at tossing coins into specially designed tank-in-
tank wishing wells built inside the giant gold ingot.
Monies collected were donated in full to support the
conservation efforts of Waterways Watch Society.
In May 2007, UWS catalysed the integration of aquatic
science and wireless technology by introducing the
Radio Frequency Identifi cation (“RFID”) System
making it the world’s fi rst oceanarium to do so. RFID
is an automatic identifi cation technology, where
RFID tags with unique identifi cation numbers (“ID”)
are embedded in the bodies of the fi shes. Within a
detectable range, the fi sh and its ID will be tracked
by the antenna on the exhibit window. A picture
and information on the fi sh would automatically be
retrieved from the database and instantly displayed
on the computer screen in front of the exhibit. Visitors
are able to navigate through the detailed information
about it simply by clicking on the appropriate icons
on the computer touch screen.
In December 2007, the Mystical Anti Gravity
Interactive Concept Tank or MAGIC-T was the latest
avant-garde attraction at UWS. Visitors are able to
feed the fi shes enclosed in the MAGIC-T, through
openings in the side and not have any water splashing
out of the tank. Under normal circumstances and

HA
W P
AR
CO
RP
OR
AT
ION
LIM
ITE
D
An
nu
al
Re
po
rt 2
00
7
23
LEISURE
the laws of physics, water would fl ow out through
any opening in the middle of a water-fi lled tank. The
MAGIC-T however, defi es gravity with its specially
designed mechanism that creates a vacuum at the
top of the tank and maintains low pressure such that
water does not come gushing out of the outlets.
Competition from new and existing attractions locally
and within the region coupled with the shortages
of hotel rooms continue to remain a challenge to
the business of UWS. To mitigate the risks, UWS
will continue to revamp existing exhibits and launch
new displays focusing on interactive experiences,
in order to create the differentiation necessary to
stay competitive.
Simultaneously, additional effort shall be taken up to
sell products and services to increase the per pax
spent of visitors to UWS.
UNDERWATER WORLD PATTAYA
Underwater World Pattaya (“UWP”)’s visitorship
during 2007 continued to be adversely affected by
lower domestic consumption as a result of concerns
of surging oil prices and political uncertainty.
Competition from Siam Ocean World in Bangkok
and other up-and-coming destinations such as Ko
Chang (Elephant Island), Hua Hin and Phuket were
other contributing factors.
UWP launched the “River Otter” Exhibit in April
2007 to welcome the Songkran festival. More than
60 guests from the local and national press, TV
stations and magazine publishers attended the press
conference that was held for the occasion.
UWP showcased the RFID Exhibit together with
the Science Museum of Bangkok and UWS in the
month-long Science Exhibit held at the Queen Sirikit
Convention Hall starting from 27 June 2007. The
application of RFID technology in UWP was the fi rst
in an aquarium in Thailand.
In October 2007, UWP became the fi rst aquarium in
Thailand to exhibit rare Shark Rays. The Shark Ray
is a unique species as it looks like a hybrid between
a shark and a stingray and feeds mainly on small
crustaceans like crabs or shrimps.
Strong competition from alternative attractions and
high fuel prices continue to pose challenges.
CHENGDU OCEANARIUM
Construction of the oceanarium is underway with
major piling work completed in the last quarter of
2007. Despite challenges from extreme weather
conditions and rising raw material prices, the project
is scheduled for completion by end of 2008.

HA
W P
AR
CO
RP
OR
AT
ION
LIM
ITE
D
An
nu
al
Re
po
rt 2
00
7
24
PROPERTY &
INVESTMENTS
PROPERTY
The Group’s property portfolio comprises 68,084
square metres of commercial and industrial space
mainly in Singapore and Malaysia.
Singapore
Haw Par Centre and Haw Par Glass Tower are two
offi ce buildings with a total lettable area of 13,567
square metres. Both buildings were well leased with
average occupancy of close to 90%.
Haw Par Technocentre and Setron Building are two
light industrial buildings with a total lettable area
of 27,477 square metres. Haw Par Technocentre’s
average occupancy has been more than 95% in the
fi rst 3 quarters of the year and 100% by the beginning
of the 4th quarter of the year. As for Setron Building,
due to the planning review for a comprehensive
redevelopment of the area by the authorities, the
property will be surrendered back to the Housing &
Development Board.

HA
W P
AR
CO
RP
OR
AT
ION
LIM
ITE
D
An
nu
al
Re
po
rt 2
00
7
25
PROPERTY &
INVESTMENTS
Malaysia
Menara Haw Par, a freehold commercial building
in Kuala Lumpur, has a net lettable area of 15,659
square metres. Although there is still an over-supply
of offi ce space in Kuala Lumpur, the improving
sentiments in the offi ce market has allowed the
building to achieve an average occupancy in excess
of 85%.
Hong Kong
The three offi ce-cum-industrial units at Westlands
Centre with a total lettable area of 475 square metres
continue to be fully leased.
INVESTMENTS
The Group has substantial investments in various
securities that are actively managed under the
guidance of the Investment Committee.
These investments have provided the Group with
a stable source of recurring dividend income and
fi nancial strength over the years.

HA
W P
AR
CO
RP
OR
AT
ION
LIM
ITE
D
An
nu
al
Re
po
rt 2
00
7
26
PEOPLE &
THE COMMUNITY
COMMUNITY RELATIONS
In line with the Group’s corporate social
responsibility mission, contributions were made to
charitable organisations and educational concerns.
Some of these included the President’s Challenge,
Shan You Counselling Centre, Chinese Development
Assistance Council, Nanyang CCC Welfare and
Education Fund and Zhonghua Alumni Association.
Staff of the Haw Par Group continued in their
annual tradition of community service and
bringing cheer to the less fortunate. An outing
was organised in November 2007 for residents of
the Saint Theresa’s Home.
CONSERVATION
In support of the conservation of wildlife and
endangered animals, the Group continues to sponsor
the Malayan Tiger Exhibit at the Night Safari and the
Leopard Exhibit at the Singapore Zoo.
UWS Blue Mission
Over the years, UWS has sought to raise public
awareness on marine conservation issues via its
exhibits, interpretive panels, enriching educational
programmes and various conservation projects.
A logo and conservation slogan: Blue Mission –
Inspire, Educate and Conserve was adopted in 2007
to represent the vision and work that UWS strives to
do for the environment. The inaugural Blue Mission
eNewsletter was disseminated to educators and
partners on 22 October 2007 to update them on the
latest happenings at UWS.

HA
W P
AR
CO
RP
OR
AT
ION
LIM
ITE
D
An
nu
al
Re
po
rt 2
00
7
27
PEOPLE &
THE COMMUNITY
Young Marine Biologist Award (“YMBA”) 2007
YMBA, an annual not-for-profi t contest launched
since 2002, was opened for the fi rst time in 2007
to students from Primary to Tertiary level. It received
tremendous response from more than 2000 students
throughout Singapore. In an aim to raise awareness
about the impacts of global warming on the marine
environment, the YMBA 2007 required students to
create and submit artistic designs expressing their
concerns on the global issue. Best submissions
were pieced together to form an inspiring 10 metres
wide Global Warming Art Montage – likely the fi rst
of its kind in an aquarium. It was offi cially launched
by Mr Ng Meng Hiong, Deputy Director of the 3P
Partnership Department of the National Environment
Agency of Singapore on 27 September 2007.
Singapore Marine Roundtable (“MRT”) Committee
International Year of the Reef (“IYOR”) Underwater
World Singapore is one of the few NGOs to play a
pivotal role on the MRT committee, consisting of
passionate individuals and organisations sharing
a common goal to make a difference for marine
conservation in Singapore. In celebration of the
IYOR 2008, the MRT committee has formed a
sub-IYOR working committee, of which UWS is
also actively involved. UWS would be playing a
signifi cant role in increasing awareness amongst
students and the public about the importance of
Coral Conservation through roving exhibits and
other educational programmes, in collaboration
with other organisations like WWF, wildsingapore,
NParks and more.
Clean & Green Week Schools’ Carnival
UWS participated in the Clean & Green Week
Schools’ Carnival organised by the National
Environment Agency (“NEA”) under the Corporate
and School Partnership Programme (“CASP”).
As a participating corporation for the fourth year,
UWS acted as mentor to Keming Primary School
by facilitating training attachments and providing
resources and advice to the school’s environmental
programmes and projects.

HA
W P
AR
CO
RP
OR
AT
ION
LIM
ITE
D
An
nu
al
Re
po
rt 2
00
7
28
FINANCIAL
REVIEW
OVERVIEW
Group turnover for FY2007 was fl at year-on-year.
The good growth of 9% and 25% in sales for the
leisure and property divisions respectively offset
the 8% fall in sales experienced by the healthcare
division, due primarily to the divestment of the
generic pharmaceutical business in 2006.
Group earnings increased by 48% to $159.0
million as compared to 2006, propelled by gain on
revaluation of investment properties and higher
investment income.
Earnings per share increased to 77.8 cents
(2006: 51.6 cents). Net tangible assets per share
increased to $9.71 (2006: $8.61) from increase in
fair value of its available-for-sale fi nancial assets
and investment properties.
RETURN ON ASSETS EMPLOYED
The Group applies a Return of Assets Employed
(“ROA”) measure to evaluate the performance of its
business operations. The ROA measures profi tability
of assets utilised by the various operations.
In 2007, Group ROA increased to 9.3% (2006: 7.4%).
The ROA of the healthcare division declined mainly
due to the divestment of the generic pharmaceutical
business. ROA of the leisure division improved with
stronger results from Underwater World Singapore,
despite weaker results from Underwater World
Pattaya and pre-operating cost incurred for the
new Chengdu oceanarium. ROA of the investment
division improved from 4.1% to 4.5% due to higher
dividends received. Due to the substantially higher
revalued asset base, ROA of the property division
only increased marginally to 4.7% in spite of the
higher rental and occupancy rates.
16.9 18.0
6.38.6
66.8
80.7
0
10.0
20.0
30.0
40.0
50.0
60.0
90.0
80.0
70.0
14.4
24.6
Healthcare Leisure Property Investments
2006 2007
Segment Profi ts Before Interest and Tax
($ million)
4.14.5 4.7
7.4
9.3
28.8
17.2
25.1
28.8
4.5
0
5.0
10.0
15.0
20.0
25.0
30.0
35.0
Group Healthcare Leisure Property Investments
2006 2007
Return on Assets Employed
(%)

HA
W P
AR
CO
RP
OR
AT
ION
LIM
ITE
D
An
nu
al
Re
po
rt 2
00
7
29
FINANCIAL
REVIEW
SEGMENTAL PERFORMANCE
Healthcare
Turnover of Tiger brand products continue to show
encouraging improvement as a result of intensifi ed
marketing activities both at home and overseas.
Excluding the generic pharmaceutical business
divested in 2006, year-on-year profi t contribution
from the healthcare division was fl at, due primarily to
changes in territorial and product sales mix.
Healthcare
(Sales of Tiger Brand Products)
($ million)
7.1
0
5.0
10.610.611.1
8.49.1
42.2
38.1
America Europe Middle East Asia
2006 2007
10.0
15.0
20.0
25.0
30.0
35.0
45.0
40.0

HA
W P
AR
CO
RP
OR
AT
ION
LIM
ITE
D
An
nu
al
Re
po
rt 2
00
7
30
FINANCIAL
REVIEW
Leisure
Profi t for the leisure division increased by 6% to
$18.0 million. While Underwater World Singapore
recorded 9% higher profi ts due to higher visitorship,
it was eroded by the weaker results of Underwater
World Pattaya and pre-operating expenses at
Chengdu Oceanarium.
Revenue for the leisure division improved by 9%
year-on-year to $37.0 million. For Underwater World
Singapore, record visitorship of more than 1.7 million
was about 5% above last year, driving revenue up
9% to $33.5 million. Underwater World Pattaya’s
performance, however, was affected by high fuel
prices and political uncertainty, which curtailed local
travelling in Thailand. Revenue of $3.4 million and
visitorship of 0.34 million was 14% above and 1%
below last year respectively, mainly due to a stronger
Thai Baht.
0
0.3
0.6
0.9
1.2
1.5
1.8
1.62
1.70
2006 2007
Underwater World Singapore
(Number of Visitors)
(million)
0
100.0
340342
2006 2007
Underwater World Pattaya
(Number of Visitors)
(’000)
200.0
300.0
400.0

HA
W P
AR
CO
RP
OR
AT
ION
LIM
ITE
D
An
nu
al
Re
po
rt 2
00
7
31
0
25.0
50.0
75.0
100.0
FINANCIAL
REVIEW
Property
Profi t for the property division jumped 38% year-
on-year to $8.6 million due to higher occupancy
and rental rates. In addition, the Group enjoyed
a substantial 336% increase in fair value gain on
revaluation of investment properties to $72.7 million.
Outlook for the offi ce and industrial rental market
had both improved on the back of the booming
property sector.
Investments
The increase in investment income by 32% year-
on-year to $72.2 million is due to higher dividends
received from our investment portfolio.
The Group’s investment portfolio enjoyed a healthy
valuation surplus of $1.2 billion.
Investment (Cost vs Fair Value)
($ million)
0
200
400
600
800
1,000
1,200
1,400
1,800
1,600
408.8
1,551.0
418.6
1,647.2
2006 2007
Cost Fair Value
76.0
86.0 86.0
66.0
100.0100.0
93.0
72.0
Haw Par Haw Par Glass Haw Par Menara
Centre Tower Technocentre Haw Par
2006 2007
Property (Building Occupancy Rates)
(%)

HA
W P
AR
CO
RP
OR
AT
ION
LIM
ITE
D
An
nu
al
Re
po
rt 2
00
7
32
FINANCIAL
REVIEW
Financial Position
Shareholders’ funds increased 7% to $1.9 billion
mainly due to the higher revaluation surplus derived
from the fair valuation of the Group’s fi nancial assets
and investment properties.
The Group ended the year in a strong fi nancial
position with net cash balances of $51.7 million,
after carrying out a $82.5 million share buyback
exercise and dividend payments of $41.3 million.
Cash generated by operating activities was a healthy
$92.4 million.
Dividends
In view of the higher earnings, strong fi nancial
position and healthy operating cashfl ow, a second
& fi nal dividend of 14 cents per share and a special
dividend of 5 cents per share is being proposed at
the coming Annual General Meeting.0
500
1,000
1,500
2,000
1,927.3
1,799.2
2006 2007
Shareholders’ Funds
($ million)

HA
W P
AR
CO
RP
OR
AT
ION
LIM
ITE
D
An
nu
al
Re
po
rt 2
00
7
33
SHARE PRICE &
TRADING VOLUME
0 0 2003 2004 2005 2006 2007
— Share Price Trading Volume
Trading Volume (’000 shares) Share Price ($)
2,000
4,000
6,000
8,000
10,000
12,000
14,000
16,000
18,000
20,000
22,000
24,000
0.50
1.00
1.50
2.00
2.50
3.00
3.50
4.00
4.50
5.00
5.50
6.00
6.50
7.00
7.50
8.00
8.50
2003 2004 2005 2006 2007
SHARE PRICE ($)
Last Done 4.46 5.15 5.15 7.10 7.11
High 4.58 5.40 5.45 7.50 8.45
Low 3.10 4.46 4.96 5.10 6.55
PER SHARE
Earnings (cents) 24.1 35.4 38.8 51.6 77.8
Dividend net (cents) 14.7 17.0 19.0 20.0 25.0
Dividend cover (times) 1.6 2.1 2.0 2.6 3.1
Net tangible assets per share ($) 2.63 2.80 6.26 8.61 9.71

HA
W P
AR
CO
RP
OR
AT
ION
LIM
ITE
D
An
nu
al
Re
po
rt 2
00
7
34
CORPORATE GOVERNANCE
REPORT
Haw Par Corporation Limited is committed to uphold good corporate governance practices to safeguard the
interests of its shareholders and to comply with the principles set out in the Code of Corporate Governance
(the “Code”).
BOARD MATTERS
Principle 1: Board’s Conduct of its Affairs
The principal responsibilities of the Board include:
• approving strategic plans and annual budgets;
• approving major funding, investment and divestment proposals;
• approving the appointment of Directors to the Board;
• ensuring management maintains a sound system of internal controls, risk management, fi nancial reporting
standards and statutory compliance;
• reviewing the performance of management; and
• approving the announcement of fi nancial results and declaration of dividends.
The Board meets at least four times a year. Meetings are scheduled at the start of each year, with ad-hoc
meetings called only when there are important and urgent matters requiring the Board’s consideration and
approval in between the scheduled meetings.
The Board has delegated specifi c responsibilities to four Committees, namely, the Audit, Nominating,
Remuneration and Investment Committees. The composition of each Committee is set out in the table as
follows. The Board held four physical meetings during the year. The attendance of Directors at meetings of
the Board and the Committees are as follows:
Name
Number of meetings attended in 2007
Main
Board
Audit
Committee
Nominating
Committee
Remuneration
Committee
Investment
Committee
Wee Cho Yaw 4 1 1 10
Wee Ee Lim (1) 4 4 1 10
Sat Pal Khattar 4 1 1
Reggie Thein 4 4
Hwang Soo Jin 4 4 1
Lee Suan Yew 4 4 1
Lim Kee Ming 4
Wee Ee Chao 4
Chng Hwee Hong 4 10
Han Ah Kuan 4 10
Number of meetings
held in 2007 4 4 1 1 10
(1) Mr Wee Ee Lim was in attendance at the meetings of the Audit and Remuneration Committees although
he is not a member of either Committee.

HA
W P
AR
CO
RP
OR
AT
ION
LIM
ITE
D
An
nu
al
Re
po
rt 2
00
7
35
CORPORATE GOVERNANCE
REPORT
Appropriate training and orientation program to familiarise Directors with the Company’s business and
governance practices will be organised as and when necessary.
Principle 2: Board Composition and Balance
There are ten Directors on the Board. The Nominating Committee (“NC”), having regard to the Code’s
guidance for assessing independence, is of the view that fi ve Non-Executive Directors were independent and
no individual or small group of individuals dominated the decisions of the Board.
The Board regarded its current size to be appropriate and also held the view that it comprised Directors, who
as a group possessed the core competencies needed to discharge their duties effectively.
Principle 3: Chairman and Chief Executive Offi cer
There is a clear division of duties between the non-executive Chairman and the Chief Executive Offi cer
(“CEO”), who is also the son of the Chairman. The Chairman’s principal role is to lead and guide the Board
while the CEO has the executive responsibility for the day-to-day operations of the Group.
Principle 4: Board Membership
The NC comprises three members, of whom two including the chairman of the NC, are independent Directors.
The Chairman of the NC is neither a substantial shareholder of the Company nor directly associated with a
substantial shareholder of the Company. The NC makes annual recommendations to the Board on all board
appointments as well as re-nomination of Directors having regard to their contributions and performance.
Directors with multiple board memberships are also assessed on their ability and availability to carry out their
duties. At each Annual General Meeting, one-third of the Board are required to retire from offi ce by rotation
and submit themselves for re-election. Key information regarding the Directors is provided under the Board
of Directors section of this Annual Report.
Principle 5: Board Performance
The NC evaluated the performance of the Board as a whole taking into consideration, amongst other
things, the Board’s discharge of its principal responsibilities, earnings of the Group, return on equity and
the share price performance of the Company. The NC is of the opinion that the Board had performed well
during the year.
The Chairman of the Board and the chairman of the NC, considered the contribution of individual Directors,
including the achievement of fi nancial objectives for Executive Directors, and were of the view that the
performance of each of them had been more than satisfactory.

HA
W P
AR
CO
RP
OR
AT
ION
LIM
ITE
D
An
nu
al
Re
po
rt 2
00
7
36
CORPORATE GOVERNANCE
REPORT
Principle 6: Access to Information
The Board is provided with adequate and timely information which includes quarterly management reports
highlighting the Group’s fi nancial performance and position, draft announcement of fi nancial results and
matters requiring Board’s decision, at least fi ve working days prior to Board meetings.
The Board also has separate and independent access to the senior management and the Company
Secretary, who attends all Board and Committee meetings and ensures that the Company complies with
all regulatory requirements.
To assist the Directors to carry out their duties, the Company will, upon the approval of the Chairman, appoint
professional advisors to render the appropriate advice at its expense.
REMUNERATION MATTERS
Principle 7: Procedures for Developing Remuneration Policies
The Remuneration Committee (“RC”) comprises three members, of which two including the chairman of
the RC, are independent Directors. The RC is supported by Group Human Resource as and when advice
is needed.
The principal responsibilities of the RC are:
• to recommend to the Board a framework of remuneration for Directors and key executives;
• to determine the remuneration packages for the Executive Directors including the CEO;
• to review the remuneration packages for key executives; and
• to administer the Company’s share option schemes.
During the year, the RC has recommended the amount of directors’ fees to be paid to the Non-Executive
Directors, assessed the performance and determine the bonus and salary components for the Executive
Directors, reviewed the remuneration packages for key executives and granted share options to eligible staff.
Principle 8: Level and Mix of Remuneration
The RC adopts a remuneration policy refl ective of market conditions and comparable within the industry that
comprises a fi xed and a performance-based variable component.
None of the Non-Executive Directors are on service contracts or have consultancies with the Company. Only
Non-Executive Directors, including the Chairman of the Board, are paid directors’ fees which comprises
basic fees and additional fees for serving on Board committees. Directors’ fees recommended by the RC are
submitted for endorsement by the Board and payment of these fees is subject to shareholders’ approval.
None of the Non-Executive Directors has been granted share options although the Company’s share option
scheme allow for such grants.
The remuneration packages of the CEO and the Executive Directors include a variable bonus element which
is performance-based. Share options are only granted to the Executive Directors.

HA
W P
AR
CO
RP
OR
AT
ION
LIM
ITE
D
An
nu
al
Re
po
rt 2
00
7
37
CORPORATE GOVERNANCE
REPORT
Principle 9: Disclosure of Remuneration
Details of the share option schemes are disclosed in the Report of the Directors.
The details of the remuneration of each individual Director and the top fi ve key executives are as follows:
Name
Directors’
fees
Base
or fi xed
salary
Variable
bonus
Benefi t-
in-kind
and others Total
Share options
granted
% % % % % No. of shares
$750,000 to $1,000,000
Wee Ee Lim – 53 38 9 100 –
$500,001 to $750,000
Chng Hwee Hong – 49 30 21 100 48,000
Han Ah Kuan – 48 27 25 100 48,000
Below $250,000
Wee Cho Yaw 100 – – – 100 –
Sat Pal Khattar 100 – – – 100 –
Reggie Thein 100 – – – 100 –
Hwang Soo Jin 100 – – – 100 –
Lee Suan Yew 100 – – – 100 –
Lim Kee Ming 100 – – – 100 –
Wee Ee Chao 100 – – – 100 –
Top 5 Key Executives Number of executives of the Group in remuneration bands
$250,001 to $500,000 4
Below $250,000 1
The names of these executives are not disclosed due to confi dentiality reasons.
There were no employees who were immediate family members of the Directors or the CEO.

HA
W P
AR
CO
RP
OR
AT
ION
LIM
ITE
D
An
nu
al
Re
po
rt 2
00
7
38
CORPORATE GOVERNANCE
REPORT
ACCOUNTABILITY AND AUDIT
Principle 10: Accountability
The Management provides the Board with relevant and timely information on actual performance, fi nancial
position and business prospects on a quarterly basis. Price-sensitive information, including announcements
of fi nancial results, is released to shareholders through the SGXNET and the Company’s website.
Principle 11: Audit Committee
The Audit Committee (“AC”) comprises three members, all of whom are independent Directors. The chairman
of the AC is an accountant with over 40 years’ experience in the profession while another member has over 40
years of business experience. The Board is of the view that the members of the AC have the requisite accounting
or fi nancial management expertise and experience to discharge the AC’s responsibilities effectively.
The principal responsibilities of the AC are:
• to review the audit plans and reports of the internal and external auditors;
• to consider the auditors’ evaluation of the system of internal controls;
• to recommend the re-appointment of external auditors;
• to review annually the independence and objectivity of the external auditors, the cost effectiveness of the
audit, and the nature and extent of non-audit services;
• to ensure adequacy, independence, effectiveness and objectivity of the internal audit function and that it
meets professional standards;
• to review the Group’s quarterly and annual fi nancial statements for approval by the Board, and the
appropriateness and consistency of accounting principles and policies adopted across the Group,
including signifi cant fi nancial reporting issues and judgements;
• to review the risk management policies and processes; and
• to review interested person transactions.
During the year, the AC had fulfi lled its responsibilities as stated above. In the review of non-audit services,
the AC was satisfi ed that they were not material and would not affect the independence of the external
auditors. It has recommended to the Board to re-appoint PricewaterhouseCoopers as auditors for fi nancial
year 2007 having been satisfi ed with their standards of audit, independence and objectivity.
The AC has full authority to investigate any matter where it is alerted of any suspected fraud or irregularity or
failure of internal controls, full access to and cooperation of the Management and full discretion to invite any
staff to attend its meetings.
Principle 12: Internal Controls and Risk Management
During the year, the AC met four times with the internal and external auditors to review their audit plans and
evaluation of internal controls of the Group. It also met with the external and internal auditors separately
without the presence of the Management.
Based on the reports by the internal and external auditors and review undertaken by the AC, the Board was
satisfi ed that the internal controls of the Group were adequate to safeguard its assets and ensure the integrity
of its fi nancial statements.

HA
W P
AR
CO
RP
OR
AT
ION
LIM
ITE
D
An
nu
al
Re
po
rt 2
00
7
39
CORPORATE GOVERNANCE
REPORT
The Group had established a formal risk management framework across the entire organisation to provide
a structured approach, balancing between cost and benefi t, to ensure that the full spectrum of risks are
identifi ed, mitigated and managed. The Risk Management Committee, chaired by the CEO and comprising
four other senior key executives, oversees the risk management policies and processes of the Group. It meets
semi-annually to review risk management across the Group and reports annually to the AC on its fi ndings and
actions taken to address the key risks identifi ed.
Major operational risks such as competition, manufacturing capability, regulatory compliance and business
interruption are managed by leveraging on the Group’s experience and knowledge of local market
conditions, taking out appropriate insurance coverage, and having effective business continuity plans.
Financial risks are mitigated by using appropriate hedging instruments and actively managing foreign
exchange and credit exposures. Further details on managing fi nancial risks are disclosed in Note 28 on
page 92 of the Annual Report.
Principle 13: Internal Audit
The Company has an internal audit department comprising four staff. The Group Internal Audit Manager
reports to the chairman of the AC on audit matters and to the CEO on administrative matters. The internal
audit function meets the standards set by recognised professional bodies. The AC is of the view that the
internal audit function is adequately resourced and has appropriate standing within the Group.
Principles 14 and 15: Communication with Shareholders
The Company strives to convey to its shareholders pertinent information in a regular and timely manner.
Communication is generally made through annual reports, press releases, SGXNET announcements and its
website at http://www.hawpar.com.
The CEO, Group Financial Controller and the Corporate Communications Manager hold regular meetings
with research analysts, fund managers and institutional investors to provide a better understanding of the
Group’s businesses.
At AGMs, shareholders are invited to raise questions on any matters that need clarifi cation and appropriate
responses are provided. The chairpersons of the AC, NC and RC as well as the external auditors are present
at the AGMs to address all queries from shareholders.
The Company’s Articles of Association allow a shareholder to appoint one or two proxies to attend and
vote at the Company’s general meetings. Separate resolutions on each distinct issue are tabled at the
general meetings.

HA
W P
AR
CO
RP
OR
AT
ION
LIM
ITE
D
An
nu
al
Re
po
rt 2
00
7
40
CORPORATE GOVERNANCE
REPORT
OTHER GOVERNANCE PRACTICES
Investment Committee
The Investment Committee is headed by the Chairman of the Board and comprises three other Executive
Directors. The Committee meets monthly to review the Group’s investments and funding requirements.
Interested Person Transactions
During the year, there were no interested person transactions entered into by the Company and any Directors
that required disclosure under the Listing Rules.
Material Contracts
Except as disclosed on page 88 (Note 24 – Related Party Transactions) of this annual report, there were no
other material contracts of the Company or its subsidiaries involving the interests of the CEO, each director or
controlling shareholder, either still subsisting at the end of the fi nancial year or if not then subsisting, entered
into since the end of the previous fi nancial year.
Dealings in Securities
The Group adopts the Best Practices Guide with respect to dealings in securities issued by the Singapore
Exchange Securities Trading Limited. It has a policy which prohibits its offi cers from dealing in the securities
of the Company during the period commencing two weeks before the announcement of the fi nancial results
for each of the fi rst three quarters and one month before the announcement of the full year results.

STATUTORY REPORTS &FINANCIAL STATEMENTS
CONTENTS
42 Directors’ Report
46 Statement by Directors
47 Independent Auditor’s Report to the Members of Haw Par Corporation Limited
49 Consolidated Income Statement
50 Balance Sheets
51 Consolidated Statement of Recognised Income & Expense
52 Consolidated Cash Flow Statement
54 Notes to the Financial Statements
HA
W P
AR
CO
RP
OR
AT
ION
LIM
ITE
D
An
nu
al
Re
po
rt 2
00
7
42
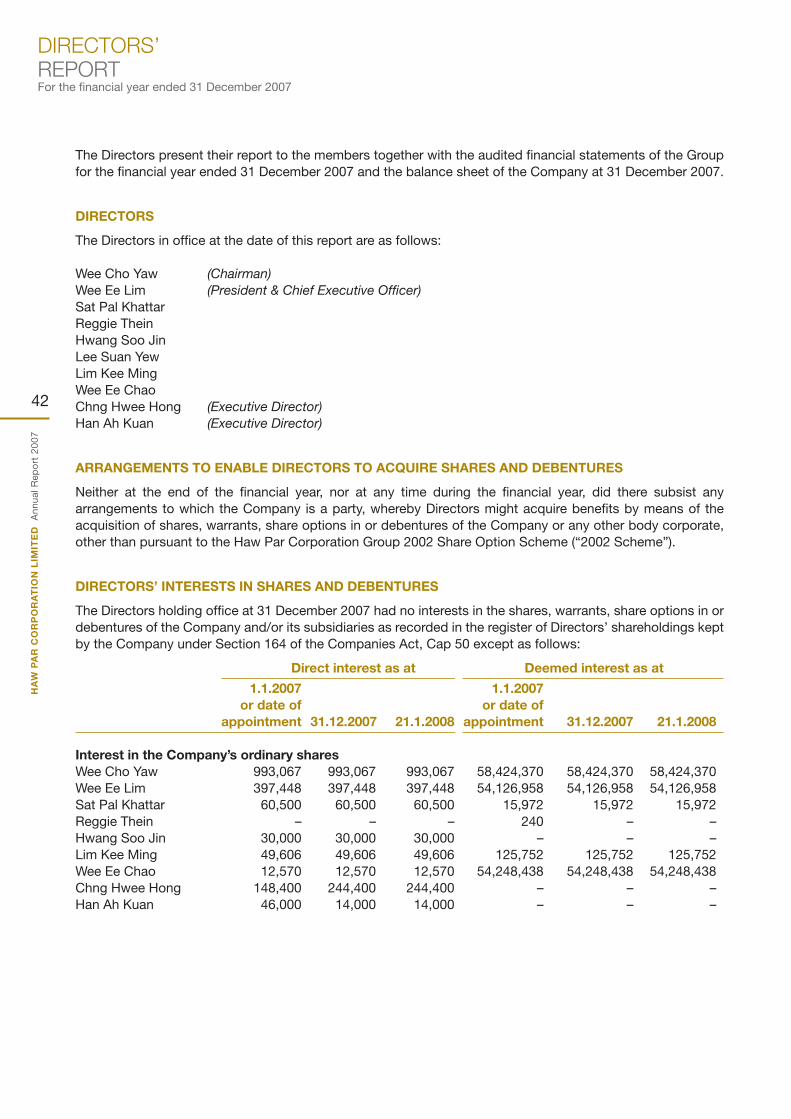
The Directors present their report to the members together with the audited fi nancial statements of the Group
for the fi nancial year ended 31 December 2007 and the balance sheet of the Company at 31 December 2007.
DIRECTORS
The Directors in offi ce at the date of this report are as follows:
Wee Cho Yaw (Chairman)
Wee Ee Lim (President & Chief Executive Offi cer)
Sat Pal Khattar
Reggie Thein
Hwang Soo Jin
Lee Suan Yew
Lim Kee Ming
Wee Ee Chao
Chng Hwee Hong (Executive Director)
Han Ah Kuan (Executive Director)
ARRANGEMENTS TO ENABLE DIRECTORS TO ACQUIRE SHARES AND DEBENTURES
Neither at the end of the fi nancial year, nor at any time during the fi nancial year, did there subsist any
arrangements to which the Company is a party, whereby Directors might acquire benefi ts by means of the
acquisition of shares, warrants, share options in or debentures of the Company or any other body corporate,
other than pursuant to the Haw Par Corporation Group 2002 Share Option Scheme (“2002 Scheme”).
DIRECTORS’ INTERESTS IN SHARES AND DEBENTURES
The Directors holding offi ce at 31 December 2007 had no interests in the shares, warrants, share options in or
debentures of the Company and/or its subsidiaries as recorded in the register of Directors’ shareholdings kept
by the Company under Section 164 of the Companies Act, Cap 50 except as follows:
Direct interest as at Deemed interest as at
1.1.2007 1.1.2007
or date of or date of
appointment 31.12.2007 21.1.2008 appointment 31.12.2007 21.1.2008
Interest in the Company’s ordinary shares
Wee Cho Yaw 993,067 993,067 993,067 58,424,370 58,424,370 58,424,370
Wee Ee Lim 397,448 397,448 397,448 54,126,958 54,126,958 54,126,958
Sat Pal Khattar 60,500 60,500 60,500 15,972 15,972 15,972
Reggie Thein – – – 240 – –
Hwang Soo Jin 30,000 30,000 30,000 – – –
Lim Kee Ming 49,606 49,606 49,606 125,752 125,752 125,752
Wee Ee Chao 12,570 12,570 12,570 54,248,438 54,248,438 54,248,438
Chng Hwee Hong 148,400 244,400 244,400 – – –
Han Ah Kuan 46,000 14,000 14,000 – – –
DIRECTORS’REPORTFor the fi nancial year ended 31 December 2007

HA
W P
AR
CO
RP
OR
AT
ION
LIM
ITE
D
An
nu
al
Re
po
rt 2
00
7
43
DIRECTORS’REPORT
For the fi nancial year ended 31 December 2007
DIRECTORS’ INTERESTS IN SHARES AND DEBENTURES (continued)
Direct interest as at Deemed interest as at
1.1.2007 1.1.2007
or date of or date of
appointment 31.12.2007 21.1.2008 appointment 31.12.2007 21.1.2008
Options to subscribe for the Company’s ordinary shares
(Under the 2002 Scheme)
Chng Hwee Hong 192,000 144,000 144,000 – – –
Han Ah Kuan 48,000 48,000 48,000 – – –
DIRECTORS’ CONTRACTUAL BENEFITS
Since the end of the previous fi nancial year, no Director has received or has become entitled to receive benefi ts
required to be disclosed by Section 201(8) of the Companies Act, Cap 50 by reason of a contract made by the
Company or its subsidiaries with the Director or with a fi rm of which he is a member or with a company in which
he has a substantial fi nancial interest except those disclosed in Note 24 to the fi nancial statements.
SHARE OPTIONS
Haw Par Corporation Group 2002 Share Option Scheme
The 2002 Scheme was approved by members of the Company at an Extraordinary General Meeting held
on 22 May 2002. The 2002 Scheme is granted to key management personnel and directors (including non-
executive directors) of the Company and the maximum life-span of exercising the options is 10 years. The
exercise price of the options is determined at the average of the closing prices of the Company’s ordinary
shares as quoted on the Singapore Exchange for fi ve market days immediately preceding the date of the grant.
The options are exercisable beginning on the fi rst anniversary from the date when the options are granted or
the second anniversary if the options are granted at a discount to the market price. The share option scheme
size shall not exceed 15% of the issued share capital of the Company on the day preceding grant date and
exercise prices are allowed to be set at discounts of up to 20% to their market price.
As at 31 December 2007, options to subscribe for unissued shares of the Company under the 2002 Scheme
were as follows:
Number of shares covered by the options
Balance at
1.1.2007
or date of
Date grant Balance at Exercise
of grant (if later) Cancelled Exercised 31.12.2007 Price Exercise Period
7.6.2002 16,000 – 16,000 – $4.24 7.6.2003 – 6.6.2007
20.6.2003 64,000 – 48,000 16,000 $3.96 20.6.2004 – 19.6.2008
18.5.2004 94,000 – 74,000 20,000 $4.80 18.5.2005 – 17.5.2009
19.5.2005 177,000 – 64,000 113,000 $5.11 19.5.2006 – 18.5.2010
2.3.2006 321,000 5,000 160,000 156,000 $5.52 2.3.2007 – 1.3.2011
2.3.2007 378,000 6,000 – 372,000 $7.54 2.3.2008 – 1.3.2012
1,050,000 11,000 362,000 677,000
In 2007, options to subscribe for 378,000 unissued shares in the Company at the price of $7.54 per share were
granted under the 2002 Scheme. No options have been granted at a discount to the market price of shares of
the Company.

HA
W P
AR
CO
RP
OR
AT
ION
LIM
ITE
D
An
nu
al
Re
po
rt 2
00
7
44
SHARE OPTIONS (continued)
During the fi nancial year, options to subscribe for 11,000 unissued shares were cancelled and 362,000 shares
were issued by virtue of the exercise of options, the details of which are set out above. The market prices on
the dates of exercise ranged from $6.65 to $8.30.
Other information required by the Singapore Exchange Securities Trading Limited (Pursuant to Listing Rule 852
of the Singapore Exchange Listing Manual)
(1) The share option schemes of the Company are administered by the Remuneration Committee, comprising
the following Directors:
Sat Pal Khattar (Chairman)
Wee Cho Yaw
Hwang Soo Jin
(2) The details of options granted to the Directors of the Company under the 2002 Scheme are as follows:
Aggregate
Aggregate Aggregate number
number number of shares Aggregate
Number of shares of shares comprised number
of shares comprised comprised in options of shares
comprised in options in options that have comprised
in options granted since exercised since expired since in options
granted commencement commencement commencement outstanding
during the of scheme to of scheme to of scheme to as at
Name of director fi nancial year 31.12.2007 31.12.2007 31.12.2007 31.12.2007
Wee Ee Lim – 48,000 48,000 – –
Chng Hwee Hong 48,000 288,000 144,000 – 144,000
Han Ah Kuan 48,000 220,000 172,000 – 48,000
(3) no options are granted to controlling shareholders of the Company and their associates of the Company;
(4) no participant has received 5% or more of the total number of options available under the share
option schemes;
(5) no options have been granted at a discount to the market price of shares of the Company for the fi nancial
year ended 31 December 2007; and
(6) options granted by the Company do not entitle the holders of the options, by virtue of such options, any
right to participate in any share issue of any other company in the Group.
DIRECTORS’REPORTFor the fi nancial year ended 31 December 2007

HA
W P
AR
CO
RP
OR
AT
ION
LIM
ITE
D
An
nu
al
Re
po
rt 2
00
7
45
AUDIT COMMITTEE
The Audit Committee comprises three members, all of whom are independent Directors. The members of the
Audit Committee are as follows:
Reggie Thein (Chairman)
Hwang Soo Jin
Lee Suan Yew
In accordance with Section 201B(5) of the Companies Act, Cap 50, the Audit Committee has reviewed with
the Company’s internal auditors their audit plan and the scope and results of their internal audit procedures.
The Committee has also reviewed with the Company’s auditors, PricewaterhouseCoopers, their audit plan,
their evaluation of the system of internal accounting controls, their audit report on the consolidated fi nancial
statements of the Group for the fi nancial year ended 31 December 2007 and the assistance given by the
offi cers of the Group to them. The consolidated fi nancial statements of the Group have been reviewed by the
Committee prior to their submission to the Board of Directors.
The Committee has recommended to the Board of Directors the re-appointment of PricewaterhouseCoopers
as auditors of the Company.
AUDITORS
PricewaterhouseCoopers have expressed their willingness to accept re-appointment as auditors of the
Company and a resolution proposing their re-appointment will be submitted at the forthcoming Annual
General Meeting.
On behalf of the Board
Wee Cho Yaw Wee Ee Lim
Chairman President & Chief Executive Offi cer
Singapore
20 March 2008
DIRECTORS’REPORT
For the fi nancial year ended 31 December 2007

HA
W P
AR
CO
RP
OR
AT
ION
LIM
ITE
D
An
nu
al
Re
po
rt 2
00
7
46
STATEMENT BY DIRECTORS PURSUANT TO SECTION 201(15)For the fi nancial year ended 31 December 2007
We, Wee Cho Yaw and Wee Ee Lim, being two of the Directors of Haw Par Corporation Limited, do hereby state
that, in the opinion of the Directors:
(a) the balance sheet of the Company and the consolidated fi nancial statements of the Group as set out on
pages 49 to 106 are drawn up so as to give a true and fair view of the state of affairs of the Company and
of the Group as at 31 December 2007 and of the results of the business, recognised income and expense
and cash fl ows of the Group for the fi nancial year then ended; and
(b) at the date of this statement, there are reasonable grounds to believe that the Company will be able to pay
its debts as and when they fall due.
On behalf of the Board
Wee Cho Yaw Wee Ee Lim
Chairman President & Chief Executive Offi cer
Singapore
20 March 2008

HA
W P
AR
CO
RP
OR
AT
ION
LIM
ITE
D
An
nu
al
Re
po
rt 2
00
7
47
INDEPENDENT AUDITOR’S REPORT TO THE MEMBERS OF HAW PAR CORPORATION LIMITED
For the fi nancial year ended 31 December 2007
We have audited the accompanying fi nancial statements of Haw Par Corporation Limited (“the Company”) and
its subsidiaries (“the Group”) set out on pages 49 to 106, which comprise the balance sheets of the Company
and of the Group as at 31 December 2007, and the consolidated income statement, consolidated statement of
recognised income and expense and consolidated cash fl ow statement of the Group for the year then ended,
and a summary of signifi cant accounting policies and other explanatory notes.
MANAGEMENT’S RESPONSIBILITY FOR THE FINANCIAL STATEMENTS
Management is responsible for the preparation and fair presentation of these fi nancial statements in accordance
with the provisions of the Singapore Companies Act (Cap. 50) (the “Act”) and Singapore Financial Reporting
Standards. This responsibility includes:
(a) devising and maintaining a system of internal accounting controls suffi cient to provide a reasonable
assurance that assets are safeguarded against loss from unauthorised use or disposition; and transactions
are properly authorised and that they are recorded as necessary to permit the preparation of true and fair
profi t and loss accounts and balance sheets and to maintain accountability of assets;
(b) selecting and applying appropriate accounting policies; and
(c) making accounting estimates that are reasonable in the circumstances.
AUDITOR’S RESPONSIBILITY
Our responsibility is to express an opinion on these fi nancial statements based on our audit. We conducted
our audit in accordance with Singapore Standards on Auditing. Those Standards require that we comply with
ethical requirements and plan and perform the audit to obtain reasonable assurance as to whether the fi nancial
statements are free from material misstatement.
An audit involves performing procedures to obtain audit evidence about the amounts and disclosures in the
fi nancial statements. The procedures selected depend on the auditor’s judgement, including the assessment
of the risks of material misstatement of the fi nancial statements, whether due to fraud or error. In making those
risk assessments, the auditor considers internal control relevant to the entity’s preparation and fair presentation
of the fi nancial statements in order to design audit procedures that are appropriate in the circumstances, but
not for the purpose of expressing an opinion on the effectiveness of the entity’s internal control. An audit also
includes evaluating the appropriateness of accounting policies used and the reasonableness of accounting
estimates made by management, as well as evaluating the overall presentation of the fi nancial statements.
We believe that the audit evidence we have obtained is suffi cient and appropriate to provide a basis for our
audit opinion.

HA
W P
AR
CO
RP
OR
AT
ION
LIM
ITE
D
An
nu
al
Re
po
rt 2
00
7
48
OPINION
In our opinion,
(a) the accompanying balance sheet of the Company and the consolidated fi nancial statements of the Group
are properly drawn up in accordance with the provisions of the Act and Singapore Financial Reporting
Standards so as to give a true and fair view of the state of affairs of the Company and of the Group as at
31 December 2007, and the results, recognised income and expense and cash fl ows of the Group for the
fi nancial year ended on that date; and
(b) the accounting and other records required by the Act to be kept by the Company and by those subsidiaries
incorporated in Singapore of which we are the auditor have been properly kept in accordance with the
provisions of the Act.
PricewaterhouseCoopers
Public Accountants and
Certifi ed Public Accountants
Singapore
20 March 2008
INDEPENDENT AUDITOR’S REPORT TO THE MEMBERS OF HAW PAR CORPORATION LIMITEDFor the fi nancial year ended 31 December 2007

HA
W P
AR
CO
RP
OR
AT
ION
LIM
ITE
D
An
nu
al
Re
po
rt 2
00
7
49
CONSOLIDATED INCOME STATEMENT
For the fi nancial year ended 31 December 2007
The Group
Note 2007 2006
$’000 $’000
Revenue 4 119,332 119,682
Cost of sales (48,539) (47,939)
Gross profi t 70,793 71,743
Other income 5 76,396 67,027
Sales and marketing expenses (22,656) (24,162)
Warehouse and delivery expenses (780) (717)
General and administrative expenses (14,714) (12,052)
Profi t from operations 109,039 101,839
Finance costs – (2)
Share of results of associated companies 14 6,129 8,599
Fair value gain on investment properties 12 72,662 16,661
Profi t before taxation 187,830 127,097
Taxation 7 (28,700) (19,829)
Profi t for the year 159,130 107,268
Attributable to:
Equity holders of the Company 158,983 107,091
Minority interests 8 147 177
159,130 107,268
Earnings per share 10
– Basic 77.8 cents 51.6 cents
– Diluted 77.8 cents 51.6 cents
The accompanying notes form an integral part of these fi nancial statements.

HA
W P
AR
CO
RP
OR
AT
ION
LIM
ITE
D
An
nu
al
Re
po
rt 2
00
7
50
BALANCE SHEETS As at 31 December 2007
The Group The Company
Note 2007 2006 2007 2006
$’000 $’000 $’000 $’000
ASSETS
Non-current assets
Property, plant and equipment 11 26,469 23,106 – 626
Investment properties 12 214,498 151,698 – –
Investment in subsidiaries 13 – – 389,613 401,143
Investment in associated companies 14 49,995 43,680 2,895 2,895
Available-for-sale fi nancial assets 15 1,285,747 1,194,564 937 3,922
Intangible assets 16 11,216 11,116 – –
1,587,925 1,424,164 393,445 408,586
Current assets
Available-for-sale fi nancial assets 15 361,433 356,449 – –
Stocks 17 5,596 6,144 – –
Receivables 18 20,403 15,443 147,209 104,750
Tax recoverable 600 856 – –
Deposits with banks and
fi nancial institutions 19 33,368 81,746 20,893 69,194
Cash and bank balances 19 18,317 15,861 1,102 1,067
439,717 476,499 169,204 175,011
Asset held for sale 20 10,000 – – –
449,717 476,499 169,204 175,011
Total assets 2,037,642 1,900,663 562,649 583,597
LIABILITIES
Current liabilities
Trade and other payables 21 (28,645) (24,876) (224,550) (282,518)
Taxation (7,154) (8,461) (272) (591)
(35,799) (33,337) (224,822) (283,109)
Non-current liabilities
Deferred income taxation 22 (67,655) (61,252) – (141)
(67,655) (61,252) – (141)
Total liabilities (103,454) (94,589) (224,822) (283,250)
NET ASSETS 1,934,188 1,806,074 337,827 300,347
EQUITY
Equity attributable to equity holders of
the Company
Share capital 23 239,238 250,277 239,238 250,277
Reserves 8 1,688,051 1,548,888 98,589 50,070
1,927,289 1,799,165 337,827 300,347
Minority interests 8 6,899 6,909 – –
Total equity 1,934,188 1,806,074 337,827 300,347
The accompanying notes form an integral part of these fi nancial statements.

HA
W P
AR
CO
RP
OR
AT
ION
LIM
ITE
D
An
nu
al
Re
po
rt 2
00
7
51
CONSOLIDATED STATEMENT OF RECOGNISED INCOME & EXPENSE
For the fi nancial year ended 31 December 2007
The accompanying notes form an integral part of these fi nancial statements.
The Group
Note 2007 2006
$’000 $’000
Recognised in foreign currency translation reserve
Equity accounting of associated company’s translation reserve 8 1,185 (133)
Exchange differences on translation of the fi nancial statements
of foreign entities (net) 8 (1,112) (930)
Recognised in fair value reserve
Fair value gains (net of tax) on available-for-sale fi nancial assets 8 90,593 419,690
Disposal of available-for-sale fi nancial assets 8 (247) –
Recognised in share option reserve
Expensing of share options 8 533 357
Recognised in revenue reserve
Share buyback 8 (69,645) –
Net income recognised directly in equity 21,307 418,984
Profi t for the year 159,130 107,268
Total recognised income and expense for the year 180,437 526,252
Attributable to:
Equity holders of the Company 180,447 525,590
Minority interests 8 (10) 662
180,437 526,252

HA
W P
AR
CO
RP
OR
AT
ION
LIM
ITE
D
An
nu
al
Re
po
rt 2
00
7
52
CONSOLIDATED CASH FLOW STATEMENT For the fi nancial year ended 31 December 2007
The Group
Note 2007 2006
$’000 $’000
Cash fl ows from operating activities
Profi t for the year 159,130 107,268
Adjustments for:
Taxation 7 28,700 19,829
Share of results of associated companies 14 (6,129) (8,599)
Finance costs – 2
Fair value gain on investment properties (72,662) (16,661)
Investment income 5 (72,235) (54,927)
Interest income 5 (2,263) (1,459)
Depreciation of property, plant and equipment 11 2,969 2,842
Expensing of share options 533 357
Gain on sale of short term investments (306) (1)
Property, plant and equipment written off 168 246
Allowance for stock obsolescence 171 102
(Write back)/allowance for impairment of receivables (73) 124
Write back of unclaimed dividends (99) (1,068)
Gain on disposal of a subsidiary – (7,621)
Loss on dilution on investment in an associated company 14 – 146
Amortisation of/write off of intangible assets 100 48
Gain on disposal of property, plant and equipment – (11)
Translation gains (510) (1,616)
Operating profi t before working capital changes 37,494 39,001
Decrease in stocks 377 302
Increase in receivables (5,112) (2,206)
Increase in creditors 3,871 23
Cash generated from operations 36,630 37,120
Interest paid – (2)
Investment income received 72,235 54,750
Interest income received 2,440 725
Net taxation paid (18,939) (16,882)
Net cash provided by operating activities 92,366 75,711
Cash fl ows from investing activities
Proceeds from capital reduction of long term investment 3,055 –
Purchase of long term available-for-sale fi nancial assets (15,290) –
Purchases of property, plant and equipment 11 (6,630) (3,801)
Proceeds received from disposal/maturity of short term and
long term held-to-maturity fi nancial assets 1,969 260
Dividends received from associated companies 14 1,046 2,101
Net cash infl ow from disposal of a subsidiary – 17,742
Proceeds from disposal of property, plant and equipment – 91
Proceeds from redemption of preference shares in long term
available-for-sale fi nancial assets 17 –
Deferred expenditure incurred (200) –
Improvements to investment properties 12 (287) (645)
Net cash (used in)/provided by investing activities (16,320) 15,748
The accompanying notes form an integral part of these fi nancial statements.

HA
W P
AR
CO
RP
OR
AT
ION
LIM
ITE
D
An
nu
al
Re
po
rt 2
00
7
53
CONSOLIDATED CASH FLOW STATEMENT
For the fi nancial year ended 31 December 2007
The Group
Note 2007 2006
$’000 $’000
Cash fl ows from fi nancing activities
Funds used for share buyback (82,507) –
Proceeds from issue of share capital 23 1,823 2,127
Payment of dividends to minority shareholders – (648)
Payment of dividends to shareholders of the Company 9 (41,284) (39,427)
Net cash used in fi nancing activities (121,968) (37,948)
Net (decrease)/increase in cash and cash equivalents (45,922) 53,511
Cash and cash equivalents at beginning of the fi nancial year 19 97,607 44,096
Cash and cash equivalents at end of the fi nancial year 19 51,685 97,607
The accompanying notes form an integral part of these fi nancial statements.

HA
W P
AR
CO
RP
OR
AT
ION
LIM
ITE
D
An
nu
al
Re
po
rt 2
00
7
54
NOTES TO THE FINANCIAL STATEMENTS For the fi nancial year ended 31 December 2007
These notes form an integral part of and should be read in conjunction with the accompanying fi nancial
statements.
1. GENERAL
Haw Par Corporation Limited (the “Company”) is incorporated and domiciled in Singapore and is listed on
the Singapore Exchange. The address of its registered offi ce is as follows:
401 Commonwealth Drive
#03-03 Haw Par Technocentre
Singapore 149598.
The Company is the owner of the “Tiger” trademarks and is the holding company of the Group.
The principal activities of the Company are licensing of the “Tiger” trademarks, and owning investments
for long term holding purposes.
The principal activities of the Group are as follows:
(a) manufacturing, marketing and trading healthcare products;
(b) providing leisure-related services; and
(c) investing in properties and securities.
2. SIGNIFICANT ACCOUNTING POLICIES
(a) Basis of preparation
The fi nancial statements have been prepared in accordance with Singapore Financial Reporting Standards
(“FRS”). The fi nancial statements have been prepared under the historical cost convention, except as
disclosed in the accounting policies below.
The preparation of fi nancial statements in conformity with FRS requires management to exercise its
judgement in the process of applying the Group’s accounting policies. It also requires the use of certain
critical accounting estimates and assumptions. The areas involving a higher degree of judgement or
complexity or areas where assumptions and estimates are signifi cant to the fi nancial statements are
disclosed in Note 3.
Interpretations and amendments to published standards in 2007
On 1 January 2007, the Group and the Company adopted the new or amended FRS and Interpretations
to FRS (INT FRS) that are mandatory for application from that date. Changes to the Group’s accounting
policies have been made as required, in accordance with the relevant transitional provisions in the
respective FRS and INT FRS.
The following are the new or amended FRS and INT FRS that are relevant to the Group:
Amendments to FRS 1 Presentation of Financial Statements – Capital Disclosures
FRS 107 Financial Instruments: Disclosures
INT FRS 110 Interim Financial Reporting and Impairment
The adoption of the above FRS or INT FRS has not resulted in any substantial changes to the Group’s
accounting policies nor any signifi cant impact on these fi nancial statements. FRS 107 and the complementary
amended FRS 1 introduce new disclosures relating to fi nancial instruments and capital respectively.

HA
W P
AR
CO
RP
OR
AT
ION
LIM
ITE
D
An
nu
al
Re
po
rt 2
00
7
55
NOTES TO THE FINANCIAL STATEMENTS
For the fi nancial year ended 31 December 2007
2. SIGNIFICANT ACCOUNTING POLICIES (continued)
(a) Basis of preparation (continued)
Early adoption of FRS 108 “Operating Segment”
The Group early adopted FRS 108 “Operating Segment”. FRS 108 supersedes FRS 14 Segment
Reporting and requires the Group to report the fi nancial performance of its operating segments based
on the information used internally by management for evaluating segment performance and deciding
on allocation of resources. Such information may be different from information included in the fi nancial
statements, and the basis of its preparation and reconciliation to the amounts recognised in the fi nancial
statements shall be disclosed. Note 29 sets out the new disclosures under FRS 108.
(b) Revenue recognition
Revenue comprises the fair value of the consideration received or receivable for the sale of goods and
rendering of services, net of goods and services tax, rebates and discounts, and after eliminating sales
within the Group. Revenue is recognised as follows:
(1) Sale of goods
Revenue from sale of goods is recognised when a Group entity has transferred to the customer the
signifi cant risks and rewards of the ownership of the goods, and collectibility of the related receivables
is reasonably assured.
(2) Rendering of services
Revenue from services is recognised upon rendering of services.
(3) Interest income
Interest income is recognised on a time proportion basis using the effective interest method. When
a receivable is impaired, the Group reduces the carrying amount to its recoverable amount, being
the estimated future cash fl ow discounted at the original effective interest rate of the instrument, and
thereafter amortising the discount as interest income on the recoverable amount.
(4) Dividend income
Dividend income from subsidiaries, associated companies and available-for-sale fi nancial assets is
recognised when the right to receive payment is established.
(5) Rental income
Rental income from operating leases on investment properties is recognised on a straight-line basis
over the lease term.
(c) Group accounting
(1) Subsidiaries
Subsidiaries are entities over which the Group has power to govern the fi nancial and operating policies,
generally accompanying a shareholding of more than one half of the voting rights and/or controls the
majority composition of the Board of Directors. The existence and effect of potential voting rights that
are currently exercisable or convertible are considered when assessing whether the Group controls
another entity.
The purchase method of accounting is used to account for the acquisition of subsidiaries by the
Group. The cost of an acquisition is measured as the fair value of the assets given, equity instruments
issued or liabilities incurred or assumed at the date of exchange, plus costs directly attributable to the
acquisition. Identifi able assets acquired and liabilities and contingent liabilities assumed in a business
combination are measured initially at their fair values on the date of acquisition, irrespective of the
extent of any minority interest. Please refer to Note 2(e)(1) for the accounting policy on goodwill on
acquisition of subsidiaries.

HA
W P
AR
CO
RP
OR
AT
ION
LIM
ITE
D
An
nu
al
Re
po
rt 2
00
7
56
2. SIGNIFICANT ACCOUNTING POLICIES (continued)
(c) Group accounting (continued)
(1) Subsidiaries (continued)
Subsidiaries are consolidated from the date on which control is transferred to the Group to the date
on which that control ceases.
In preparing the consolidated fi nancial statements, intercompany transactions, balances and unrealised
gains on transactions between group companies are eliminated. Unrealised losses are also eliminated
unless the transaction provides evidence of an impairment of the asset transferred. Where necessary,
adjustments are made to the fi nancial statements of subsidiaries to ensure consistency of accounting
policies with those of the Group.
Minority interest is that part of the net results of operations and of net assets of a subsidiary attributable
to interests which are not owned directly or indirectly by the parent. It is measured at the minorities’
share of the fair value of the subsidiaries’ identifi able assets and liabilities at the date of acquisition
by the Group and the minorities, share of changes in equity since the date of acquisition, except
when the losses applicable to the minority in a subsidiary exceed the minority interest in the equity
of that subsidiary. In such cases, the excess and further losses applicable to the minority are taken
to the consolidated income statement, unless the minority has a binding obligation to, and is able to,
make good the losses. When that subsidiary subsequently reports profi ts, the profi ts applicable to the
minority are taken to the consolidated income statement until the minority's share of losses previously
taken to the consolidated income statement is fully recovered.
Please refer to Note 2(h) for the Company’s accounting policy on investments in subsidiaries.
(2) Associated companies
Associated companies are entities over which the Group has signifi cant infl uence, but not control,
generally accompanying a shareholding of between and including 20% and 50% of the voting rights.
Investments in associated companies are accounted for in the consolidated fi nancial statements
using the equity method of accounting. Investments in associated companies in the consolidated
balance sheet include goodwill (net of accumulated impairment loss) identifi ed on acquisition, where
applicable. Please refer to Note 2(e)(1) for the Group’s accounting policy on goodwill.
Investments in associated companies are initially recognised at costs. The cost of an acquisition
is measured at the fair value of the assets given, equity instruments issued or liabilities incurred or
assumed at the date of exchange, plus costs directly attributable to the acquisition.
In applying the equity method of accounting the Group’s share of its associated companies’ post-
acquisition results net of tax is recognised in the consolidated income statement and its share of post-
acquisition movements in reserves is recognised in equity directly. These post-acquisition movements
are adjusted against the carrying amount of the investment. When the Group’s share of losses in an
associated company equals or exceeds its interest in the associated company, including any other
unsecured receivables, the Group does not recognise further losses, unless it has obligations or has
made payments on behalf of the associated company.
Unrealised gains on transactions between the Group and its associated companies are eliminated to
the extent of the Group's interest in the associated companies. Unrealised losses are also eliminated
unless the transaction provides evidence of an impairment of the asset transferred. Where necessary,
adjustments are made to the fi nancial statements of associated companies to ensure consistency of
accounting policies with those of the Group.
Please refer to Note 2(h) for the Company’s accounting policy on investments in associated companies.
NOTES TO THE FINANCIAL STATEMENTS For the fi nancial year ended 31 December 2007

HA
W P
AR
CO
RP
OR
AT
ION
LIM
ITE
D
An
nu
al
Re
po
rt 2
00
7
57
2. SIGNIFICANT ACCOUNTING POLICIES (continued)
(d) Property, plant and equipment
(1) Leasehold land and buildings
Leasehold land and buildings are stated at cost less accumulated depreciation and accumulated
impairment losses (Note 2(i)(2)).
(2) Other property, plant and equipment
Plant, equipment, furniture, motor vehicles and marine livestock are stated at cost less accumulated
depreciation and accumulated impairment losses (Note 2(i)(2)).
(3) Component of costs
The cost of an item of property, plant and equipment includes its purchase price and any cost that
is directly attributable to bringing the asset to the location and condition necessary for it to be
capable of operating in the manner intended by management. The projected cost of dismantlement,
removal or restoration is also included as part of the cost of property, plant and equipment if the
obligation for dismantlement, removal or restoration is incurred as a consequence of acquiring or
using the asset.
(4) Depreciation
Depreciation is calculated using a straight-line method to allocate the depreciable amounts of property,
plant and equipment over their estimated useful lives as follows:
Leasehold land and buildings – 50 years or over the term of the lease,
whichever is shorter
Plant, equipment, furniture and vehicles – 4 to 10 years
Marine livestock – 5 years
Construction-in-progress assets are not depreciated until they are brought to use. Fully depreciated
assets are retained in the fi nancial statements until they are no longer in use.
The residual values, estimated useful lives and depreciation method of property, plant and equipment
are reviewed, and adjusted as appropriate, at each balance sheet date to ensure that the method and
period of depreciation are consistent with the expected pattern of economic benefi ts from items of
property, plant and equipment. The effects of any revision are included in the consolidated income
statement for the fi nancial year in which the changes arise.
(5) Subsequent expenditure
Subsequent expenditure relating to property, plant and equipment that has already been
recognised is added to the carrying amount of the asset only when it is probable that future
economic benefi ts associated with the item will fl ow to the Group and the cost of the item can
be measured reliably. All other repair and maintenance expense is recognised in the consolidated
income statement when incurred.
(6) Disposal
On disposal of an item of property, plant and equipment, the difference between the net disposal
proceeds and its carrying amount is taken to the consolidated income statement.
NOTES TO THE FINANCIAL STATEMENTS
For the fi nancial year ended 31 December 2007

HA
W P
AR
CO
RP
OR
AT
ION
LIM
ITE
D
An
nu
al
Re
po
rt 2
00
7
58
2. SIGNIFICANT ACCOUNTING POLICIES (continued)
(e) Intangible assets
(1) Goodwill
Goodwill represents the excess of the cost of an acquisition of subsidiaries or associated companies
over the fair value of the Group’s share of their identifi able net assets at the date of acquisition.
i Acquisitions pre 1 January 2001
Goodwill on acquisitions was adjusted against retained earnings in the year of acquisition.
On disposal of the subsidiaries or associated companies, the goodwill previously adjusted against
retained earnings are not recognised in the consolidated income statement.
ii Acquisition post 1 January 2001
Goodwill on acquisitions of subsidiaries is included in intangible assets. Goodwill on acquisitions
of associated companies is included in the carrying amount of investments in associated
companies.
Goodwill for acquisitions post 1 January 2005 is determined after deducting the Group’s share of
their identifi able net assets and contingent liabilities.
Goodwill recognised separately as intangible assets is tested at least annually for impairment and
carried at cost less accumulated impairment losses.
Gains and losses on the disposal of the subsidiaries and associated companies include the
carrying amount of goodwill relating to the entity sold and are recognised in the consolidated
income statement.
(2) Trademarks
Trademarks are stated at cost less accumulated amortisation and accumulated impairment
losses (Note 2(i)(2)). Amortisation is calculated using the straight line method to allocate the cost
of trademarks over a period not exceeding 20 years. These are fully amortised as at the balance
sheet date.
(3) Deferred expenditure
Deferred expenditure comprises technology fee paid in advance, clinical trial expenses and television
advertisement production costs, which are recognised as assets as they generate future economic
benefi ts. Technology fee expense paid in advance for the use of a third party’s technology is amortised
using the straight line method over the contract period which is 5 years. Clinical trial expenses incurred
for product registrations are amortised using the straight line method over a 5-year period. Television
advertisement production costs are amortised using the straight line method over the estimated useful
life of approximately 2-3 years.
The amortisation period and amortisation method of intangible assets other than goodwill are reviewed at
least at each balance sheet date. The effects of any revision are recognised in the consolidated income
statement when the changes arise.
(f) Finance costs
Finance costs are taken to the consolidated income statement on a time-proportion basis using the
effective interest method.
NOTES TO THE FINANCIAL STATEMENTS For the fi nancial year ended 31 December 2007
HA
W P
AR
CO
RP
OR
AT
ION
LIM
ITE
D
An
nu
al
Re
po
rt 2
00
7
59
2. SIGNIFICANT ACCOUNTING POLICIES (continued)
(g) Investment properties
Investment properties of the Group, principally comprising offi ce and industrial buildings, are held for long-
term rental yields and are not substantially occupied by the Group.
Investment properties are treated as non-current investments, initially recognised at cost and
subsequently carried at fair value, determined annually by independent professional valuers. Changes
in fair values are recognised in the consolidated income statement.
Investment properties are subject to renovations or improvements at regular intervals. The cost of major
renovations and improvements is capitalised as addition and the carrying amounts of the replaced
components are written off to the consolidated income statement. The cost of maintenance, repairs and
minor improvement is charged to the consolidated income statement when incurred.
On disposal of an investment property, the difference between the net disposal proceeds and the carrying
amount is taken to the consolidated income statement.
(h) Investments in subsidiaries and associated companies
Investments in subsidiaries and associated companies are stated at cost less accumulated impairment
losses (Note 2(i)(2)) in the Company’s balance sheet. On disposal of investments in subsidiaries and
associated companies, the difference between net disposal proceeds and the carrying amount of the net
investment is taken to the consolidated income statement.
(i) Impairment of non-fi nancial assets
(1) Goodwill
Goodwill is tested annually for impairment, as well as when there is any indication that the goodwill
may be impaired.
For the purpose of impairment testing of goodwill, goodwill is allocated to each of the Group’s cash
generating units (“CGU”) expected to benefi t from synergies of the business combination.
An impairment loss is recognised when the carrying amount of CGU, including the goodwill, exceeds
the recoverable amount of the CGU. Recoverable amount of the CGU is the higher of the CGU’s fair
value less cost to sell and value-in-use.
The total impairment loss is allocated fi rst to reduce the carrying amount of goodwill allocated to the
CGU and then to the other assets of the CGU pro-rata on the basis of the carrying amount of each
asset in the CGU.
An impairment loss on goodwill is recognised in the consolidated income statement and is not reversed
in a subsequent period.
(2) Intangible assets, Property, plant and equipment, and Investments in subsidiaries and associated
companies
Intangible assets, property, plant and equipment and investments in subsidiaries and associated
companies are reviewed for impairment whenever there is any indication that these assets may be
impaired. If any such indication exists, the recoverable amount (i.e. the higher of the fair value less
cost to sell and value in use) of the asset is estimated to determine the amount of impairment loss.
NOTES TO THE FINANCIAL STATEMENTS
For the fi nancial year ended 31 December 2007

HA
W P
AR
CO
RP
OR
AT
ION
LIM
ITE
D
An
nu
al
Re
po
rt 2
00
7
60
2. SIGNIFICANT ACCOUNTING POLICIES (continued)
(i) Impairment of non-fi nancial assets (continued)
(2) Intangible assets, Property, plant and equipment, and Investments in subsidiaries and associated
companies (continued)
For the purpose of impairment testing of these assets, recoverable amount is determined on an
individual asset basis unless the asset does not generate cash fl ows that are largely independent of
those from other assets. If this is the case, recoverable amount is determined for the CGU to which
the asset belongs to.
If the recoverable amount of the asset (or CGU) is estimated to be less than its carrying amount, the
carrying amount of the asset (or CGU) is reduced to its recoverable amount.
The impairment loss is recognised in the consolidated income statement.
An impairment loss for an asset other than goodwill is reversed if, and only if, there has been a
change in the estimates used to determine the assets’ recoverable amount since the last impairment
loss was recognised. The carrying amount of an asset other than goodwill is increased to its revised
recoverable amount, provided that this amount does not exceed the carrying amount that would have
been determined (net of amortisation or depreciation) had no impairment loss been recognised for the
asset in prior years.
A reversal of impairment loss for an asset other than goodwill is recognised in the consolidated income
statement, unless the asset is carried at revalued amount, in which case, such reversal is treated as
a revaluation increase. However, to the extent that an impairment loss on the same revalued asset
was previously recognised in consolidated income statement, a reversal of that impairment is also
recognised in consolidated income statement.
(j) Investments in fi nancial assets
(1) Classifi cation
The Group classifi es its investments in fi nancial assets in the following categories: loans and receivables,
held-to-maturity investments, and available-for-sale fi nancial assets. The classifi cation depends on
the purpose for which the assets were acquired. Management determines the classifi cation of its
fi nancial assets at initial recognition.
i Loans and receivables
Loans and receivables are non-derivative fi nancial assets with fi xed or determinable payments
that are not quoted in an active market. They are included in current assets, except those maturing
more than 12 months after the balance sheet date which are classifi ed as non-current assets.
Loans and receivables are classifi ed within “Receivables” on the balance sheets.
ii Financial assets, held-to-maturity
Financial assets, held-to-maturity are non-derivative fi nancial assets with fi xed or determinable
payments and fi xed maturities that the Group’s management has the positive intention and ability
to hold to maturity.
iii Financial assets, available-for-sale
Financial assets, available-for-sale are non-derivatives that are either designated in this category
or not classifi ed in any of the other categories.
NOTES TO THE FINANCIAL STATEMENTS For the fi nancial year ended 31 December 2007
HA
W P
AR
CO
RP
OR
AT
ION
LIM
ITE
D
An
nu
al
Re
po
rt 2
00
7
61
2. SIGNIFICANT ACCOUNTING POLICIES (continued)
(j) Investments in fi nancial assets (continued)
(2) Recognition and derecognition
Purchases and sales of fi nancial assets are recognised on trade-date – the date on which the Group
commits to purchase or sell the asset. Financial assets are derecognised when the rights to receive
cash fl ows from the fi nancial assets have expired or have been transferred and the Group has
transferred substantially all risks and rewards of ownership.
On sale of a fi nancial asset, the difference between the net sale proceeds and its carrying amount is
taken to the consolidated income statement. Any amount in the fair value reserve relating to that asset
is also taken to the consolidated income statement.
(3) Initial measurement
Financial assets are initially recognised at fair value plus transaction costs.
(4) Subsequent measurement
Financial assets, available-for-sale are subsequently carried at fair value. Loans and receivables and
fi nancial assets, held-to-maturity are carried at amortised cost using the effective interest method.
Changes in the fair values of monetary items denominated in foreign currencies are analysed into
currency translation differences on the amortised cost of the asset and other changes; the currency
translation difference are recognised in the consolidated income statement and the other changes
are recognised in the fair value reserve. Changes in fair value of available-for-sale equity securities
(ie. non-monetary assets) are recognised in the fair value reserve, together with the related currency
translation differences.
(5) Impairment
The Group assesses at each balance sheet date whether there is objective evidence that a fi nancial
asset or a group of fi nancial assets is impaired and recognises an allowance for impairment when
such evidence exists.
i Loans and receivables
An allowance for impairment of loans and receivables, including trade and other receivables, is
recognised when there is objective evidence that the Group will not be able to collect all amounts
due according to the original terms of the receivables. Signifi cant fi nancial diffi culties of the
debtor, probability that the debtor will enter bankruptcy or fi nancial reorganisation, and default or
delinquency in payments are considered indicators that the receivable is impaired. The amount
of the allowance is the difference between the asset’s carrying amount and the present value of
estimated future cash fl ows, discounted at the original effective interest rate. The amount of the
allowance for impairment is recognised in the consolidated income statement within “General
and administrative expenses”. When the asset becomes uncollectible, it is written off against the
allowance account.
The allowance for impairment loss account is reduced through the consolidated income statement
in a subsequent period when the amount of impairment loss decreases and the related decrease
can be objectively measured. The carrying amount of the asset previously impaired is increased to
the extent that the new carrying amount does not exceed the amortised cost had no impairment
been recognised in prior periods.
NOTES TO THE FINANCIAL STATEMENTS
For the fi nancial year ended 31 December 2007

HA
W P
AR
CO
RP
OR
AT
ION
LIM
ITE
D
An
nu
al
Re
po
rt 2
00
7
62
2. SIGNIFICANT ACCOUNTING POLICIES (continued)
(j) Investments in fi nancial assets (continued)
(5) Impairment (continued)
ii Financial assets, held-to-maturity
If there is objective evidence that an impairment loss on held-to-maturity fi nancial assets has
incurred, the carrying amount of the asset is reduced by an allowance for impairment. This
allowance, calculated as the difference between the asset’s carrying amount and the present value
of estimated future cash fl ows, discounted at the original effective interest rate, is recognised in
the consolidated income statement in the period in which the impairment occurs.
Impairment loss is reversed through the consolidated income statement. The carrying amount of
the asset previously impaired is increased to the extent that the new carrying amount does not
exceed the amortised cost had no impairment been recognised in prior periods.
iii Financial assets, available-for-sale
In the case of an equity security classifi ed as available for sale, a signifi cant or prolonged decline
in the fair value of the security below its cost and the disappearance of an active trading market
for the security are considered objective evidence that the security is impaired.
When there is objective evidence that an available-for-sale fi nancial asset is impaired, the
cumulative loss that has been recognised directly in the fair value reserve is removed from the fair
value reserve within equity and recognised in the consolidated income statement. The cumulative
loss is measured as the difference between the acquisition cost (net of any principal repayments
and amortisation) and the current fair value, less any impairment loss on that fi nancial asset
previously recognised in consolidated income statement.
(k) Financial guarantees
The Company has issued corporate guarantees to banks for credit facilities of its subsidiaries. These
guarantees are fi nancial guarantee contracts as they require the Company to reimburse the banks if
the subsidiaries fail to make principal or interest payments when due in accordance with terms of their
credit facilities.
Financial guarantee contracts are initially recognised at their fair values plus transaction costs in the
Company’s balance sheet.
Financial guarantee contracts are subsequently amortised to the consolidated income statement over the
period of the subsidiaries’ borrowings, unless it is probable that the Company will reimburse the bank for
an amount higher than the unamortised amount. In this case, the fi nancial guarantee contracts shall be
carried at the expected amount payable to the bank in the Company’s balance sheet.
Intragroup transactions are eliminated on consolidation.
NOTES TO THE FINANCIAL STATEMENTS For the fi nancial year ended 31 December 2007

HA
W P
AR
CO
RP
OR
AT
ION
LIM
ITE
D
An
nu
al
Re
po
rt 2
00
7
63
2. SIGNIFICANT ACCOUNTING POLICIES (continued)
(l) Stocks
Stocks are carried at the lower of cost and net realisable value. Cost is determined on a weighted average
basis. The cost of fi nished goods and work-in-progress comprises raw materials, direct labour, other direct
costs and related production overheads (based on normal operating capacity) but exclude borrowing
costs. Net realisable value is the estimated selling price in the ordinary course of business, less applicable
variable selling expenses.
(m) Loans and borrowings
Loans and borrowings are recognised initially at fair value, net of transaction costs incurred. Borrowings
are subsequently stated at amortised cost. Any difference between the proceeds (net of transaction costs)
and the redemption value is taken to the consolidated income statement over the period of the borrowings
using the effective interest method.
Loans and borrowings which are due to be settled within twelve months after the balance sheet date are
included in current borrowings in the balance sheets even though the original term was for a period longer
than twelve months and an agreement to refi nance, or to reschedule payments, on a long-term basis is
completed after the balance sheet date and before the fi nancial statements are authorised for issue. Other
loans and borrowings due to be settled more than twelve months after the balance sheet date are included
in non-current borrowings in the balance sheets.
(n) Operating leases
(1) When a group company is the lessee:
Leases of property, plant and equipment where a signifi cant portion of the risks and rewards of
ownership is retained by the lessor are classifi ed as operating leases. Payments made under operating
leases (net of any incentives received from the lessor) are taken to the consolidated income statement
on a straight line basis over the period of the lease.
When an operating lease is terminated before the lease period has expired, any payment required to
be made to the lessor by way of penalty is recognised as an expense in the period in which termination
takes place.
(2) When a group company is the lessor:
Leases where the Group assumes substantially all risks and rewards incidental to ownership of the
leased assets are classifi ed as fi nance leases.
The leased assets are recognised on the consolidated balance sheet as investment properties and
property, plant and equipment at the inception of the leases based on the lower of the fair value of the
leased assets and the present value of the minimum lease payments.
Rental income (net of any incentives given to lessees) is recognised on a straight line basis over the
lease term.
When an operating lease is terminated before the lease period has expired, any payment required to
be made by the lessee by way of penalty is recognised as an income in the period in which termination
takes place.
NOTES TO THE FINANCIAL STATEMENTS
For the fi nancial year ended 31 December 2007

HA
W P
AR
CO
RP
OR
AT
ION
LIM
ITE
D
An
nu
al
Re
po
rt 2
00
7
64
2. SIGNIFICANT ACCOUNTING POLICIES (continued)
(o) Trade and other payables
Trade and other payables are initially measured at fair value, and subsequently measured at amortised
cost, using the effective interest method.
(p) Income taxes
Current income tax liabilities (and assets) for current and prior periods are recognised at the amounts
expected to be paid to (or recovered from) the tax authorities, using the tax rates (and tax laws) that have
been enacted or substantially enacted by the balance sheet date.
Deferred income tax assets/liabilities are recognised for all deductible taxable temporary differences arising
between the tax bases of assets and liabilities and their carrying amounts in the fi nancial statements
except when the deferred income tax assets/liabilities arise from the initial recognition of goodwill or an
asset or liability in a transaction that is not a business combination and at the time of the transaction,
affects neither accounting nor taxable profi t or loss.
Deferred income tax liability is recognised on temporary differences arising on investments in subsidiaries
and associated companies, except where the timing of the reversal of the temporary difference can be
controlled and it is probable that the temporary difference will not reverse in the foreseeable future.
Deferred income tax asset is recognised to the extent that it is probable that future taxable profi t will be
available against which the temporary differences can be utilised.
Deferred income tax is measured:
(1) at the tax rates that are expected to apply when the related deferred income tax asset is realised or
the deferred income tax liability is settled, based on tax rates (and tax laws) that have been enacted
or substantively enacted by the balance sheet date; and
(2) based on the tax consequence that would follow from the manner in which the Group expects, at the
balance sheet date, to recover or settle the carrying amounts of its assets and liabilities.
Current and deferred income tax are recognised as income or expenses in the consolidated income
statement for the period, except to the extent that the tax arises from a business combination or a
transaction, which is recognised directly in equity. Deferred tax arising from a business combination is
adjusted against goodwill on acquisition. Deferred tax on temporary differences arising from fair value
changes on investment properties are charged directly to the consolidated income statement while those
on fair value gains on available-for-sale fi nancial assets are charged directly to equity, in the same period
in which the temporary differences arise.
(q) Employee benefi ts
(1) Defi ned contribution plans
Defi ned contribution plans are post-employment benefi t plans under which the Group pays fi xed
contributions into separate entities such as the Central Provident Fund on a mandatory, contractual
or voluntary basis. The Group has no further payment obligations once the contributions have been
paid. The Group’s contribution are recognised as employee compensation expense when they are
due, unless they can be capitalised as an asset.
NOTES TO THE FINANCIAL STATEMENTS For the fi nancial year ended 31 December 2007

HA
W P
AR
CO
RP
OR
AT
ION
LIM
ITE
D
An
nu
al
Re
po
rt 2
00
7
65
2. SIGNIFICANT ACCOUNTING POLICIES (continued)
(q) Employee benefi ts (continued)
(2) Share-based compensation
The Group operates an equity-settled, share-based compensation plan. The fair value of the employee
services received in exchange for the grant of the options is recognised as an expense in the
consolidated income statement with a corresponding increase in share option reserve within equity
over the vesting period. The total amount to be recognised over the vesting period is determined by
reference to the fair value of the options granted on the date of grant. Non-market vesting conditions
are included in the estimation of the number of shares under options that are expected to become
exercisable on vesting date. At each balance sheet date, the Group revises its estimates of the number
of shares under options that are expected to become exercisable on vesting date and recognises
the impact of the revision of estimates in the consolidated income statement, with a corresponding
adjustment to the share option reserve over the remaining vesting period.
When the options are exercised, the proceeds received (net of any directly attributable transaction
costs) and the related balance previously recognised in the share option reserve are credited to share
capital, when new ordinary shares are issued.
(r) Fair value estimation
The carrying amounts of current fi nancial assets and liabilities, carried at amortised cost, are assumed to
approximate their fair values.
The fair values of fi nancial instruments traded in active markets (such as exchange-traded and over-the-
counter securities and derivatives) are based on quoted market prices at the balance sheet date. The
quoted market prices used for fi nancial assets held by the Group are the current bid prices; the appropriate
quoted market prices for fi nancial liabilities are the current asking prices.
The fair values of fi nancial instruments that are not traded in an active market are determined by using
valuation techniques, such as estimated discounted cash fl ows.
The fair values of fi nancial liabilities carried at amortised cost are estimated by discounting the future
contractual cash fl ows at the current market interest rates that are available to the Group for similar
fi nancial liabilities.
(s) Currency translation
(1) Functional and presentation currency
Items included in the fi nancial statements of each entity in the Group are measured using the currency
of the primary economic environment in which the entity operates (“the functional currency”). The
consolidated fi nancial statements of the Group are presented in Singapore Dollar, which is the
Company’s functional currency.
(2) Transactions and balances
Transactions in a currency other than the functional currency (“foreign currency”) are translated into
the functional currency using the exchange rates prevailing at the date of transactions. Currency
translation gains and losses resulting from the settlement of such transactions and from the translation
of monetary assets and liabilities denominated in foreign currencies at the closing rates at the balance
sheet date are recognised in the consolidated income statement, except for currency translation
differences on the net investment in foreign operations, borrowings in foreign currencies and other
currency instruments qualifying as net investment hedges for foreign operations, which are included
in the currency translation reserve within equity in the consolidated fi nancial statements.
NOTES TO THE FINANCIAL STATEMENTS
For the fi nancial year ended 31 December 2007

HA
W P
AR
CO
RP
OR
AT
ION
LIM
ITE
D
An
nu
al
Re
po
rt 2
00
7
66
2. SIGNIFICANT ACCOUNTING POLICIES (continued)
(s) Currency translation (continued)
(2) Transactions and balances (continued)
Non-monetary items that are measured at fair values in foreign currencies are translated using the
exchange rates at the date when the fair values are determined. Currency translation differences
on non-monetary items whereby gains or losses are recognised directly in equity, such as equity
investments classifi ed as available-for-sale fi nancial assets are included in the fair value reserve.
(3) Translation of Group entities’ fi nancial statements
The results and fi nancial position of Group entities (none of which has the currency of a hyperinfl ationary
economy) that are in functional currencies different from the presentation currency are translated into
the presentation currency as follows:
(i) Assets and liabilities are translated at the closing rates at the date of the balance sheet;
(ii) Income and expenses are translated at average exchange rates (unless this average is not a
reasonable approximation of the cumulative effect of the rates prevailing on the transaction dates,
in which case income and expenses are translated at the dates of the transactions); and
(iii) All resulting exchange differences are taken to the foreign currency translation reserve
within equity.
Goodwill and fair value adjustments arising on acquisition of a foreign entity on or after 1 January
2005 are treated as assets and liabilities of the foreign entity and translated at the closing rates at the
date of the balance sheet. For acquisitions prior to 1 January 2005, the exchange rates at the dates
of the acquisition are used.
(4) Consolidation adjustments
On consolidation, currency translation differences arising from the net investment in foreign operations,
borrowings in foreign currencies, and other currency instruments designated as hedges of such
investments, are taken to foreign currency translation reserve. When a foreign operation is sold, such
currency translation differences recorded in the foreign currency translation reserve are recognised in
the consolidated income statement as part of the gain or loss on sale.
(t) Segment reporting
An operating segment is a distinguishable component of the Group engaged in providing products or
services that are subject to risks and returns that are different from those of other business segments
and whose operating results are regularly reviewed by the Board of Directors to make decisions about
resources to be allocated to the segment and assess its performance.
(u) Cash and cash equivalents
Cash and cash equivalents include cash and bank balances, deposits with fi nancial institutions and bank
overdrafts, if any.
NOTES TO THE FINANCIAL STATEMENTS For the fi nancial year ended 31 December 2007

HA
W P
AR
CO
RP
OR
AT
ION
LIM
ITE
D
An
nu
al
Re
po
rt 2
00
7
67
2. SIGNIFICANT ACCOUNTING POLICIES (continued)
(v) Share capital
Ordinary shares are classifi ed as equity. Incremental costs directly attributable to the issuance of new
ordinary shares are deducted against the share capital account. When the Company’s ordinary shares
are repurchased, the weighted average cost of each share is written off against the share capital, with the
remaining amounts written off against the retained earnings of the Company.
(w) Dividends
Interim dividends are recorded during the fi nancial year in which they are declared payable. Final dividends
are recorded in the fi nancial year in which the dividends are approved by the shareholders.
(x) Assets held for sale
Assets are classifi ed as held for sale if their carrying amount will be recovered principally through sale
rather than through continuing use. Such assets are measured at the lower of their carrying amount and
fair value less costs to sell.
3. CRITICAL ACCOUNTING ESTIMATES AND JUDGEMENTS
Estimates, assumptions and judgements are continually evaluated and are based on historical experience
and other factors, including expectations of future events that are believed to be reasonable under the
circumstances.
The Group makes estimates and assumptions concerning the future. The resulting accounting estimates
will, by defi nition, seldom equal to the related actual results. The estimates and assumptions that have a
signifi cant risk of causing a material adjustment to the carrying amounts of assets and liabilities within the
next fi nancial year are discussed below.
(1) Impairment of goodwill
The Group tests annually whether goodwill has suffered any impairment, in accordance with the
accounting policy stated in Note 2(i)(1). The recoverable amounts of cash-generating units have been
determined based on value-in-use calculations. These calculations require the use of estimates.
Based on the positive recoverable amount, there is no impairment of goodwill.
As the estimates and assumptions used are reasonably conservative, it will require a signifi cant
variation to the estimates and assumptions to result in any adjustments.
(2) Impairment of available-for-sale fi nancial assets
The Group follows the guidance of FRS 39 on determining when an investment is other-than-
temporary impaired. This determination requires signifi cant judgement; the Group evaluates, among
other factors, the duration and extent to which the fair value of an investment is less than its cost,
and the fi nancial health of and near-term business outlook for the investee, including factors such as
industry and sector performance, changes in technology and operational and fi nancing cash fl ow.
If the assumptions made regarding the duration that, and extent to which, the fair value is less than
its cost do not hold, the Group would suffer an additional $1,533,000 (2006: $2,000,000) loss in its
results, being the transfer of the cumulative loss previously recognised in the fair value reserve within
equity to the consolidated income statement.
NOTES TO THE FINANCIAL STATEMENTS
For the fi nancial year ended 31 December 2007

HA
W P
AR
CO
RP
OR
AT
ION
LIM
ITE
D
An
nu
al
Re
po
rt 2
00
7
68
4. REVENUE
Revenue of the Group represents invoiced sales and services, and rental income but excludes dividend
income, interest income and intra-group transactions.
The Group
2007 2006
$’000 $’000
Sales of goods 77,888 82,408
Sales of services 29,612 27,824
Rental income 11,832 9,450
119,332 119,682
5. OTHER INCOME
The Group
2007 2006
$’000 $’000
Investment income from gross dividends from quoted
equity investments 72,235 54,927
Gain on disposal of a subsidiary – 7,621
Gain on disposal of available-for-sale fi nancial assets, net 306 –
Write back of unclaimed dividends 99 1,068
Interest income from:
Deposits 2,263 1,452
Bonds – 7
Service, licence and rental fee 870 771
Miscellaneous income 623 1,181
76,396 67,027
6. NATURE OF EXPENSES
The Group
2007 2006
$’000 $’000
Purchase of inventories 26,139 22,379
Changes in inventories 534 3,561
Sales and marketing expenses 18,801 18,859
Employee benefi ts 18,998 17,433
Trademark expenses 1,220 300
Depreciation of property, plant and equipment (Note 11) 2,969 2,842
Expensing of share option 533 357
NOTES TO THE FINANCIAL STATEMENTS For the fi nancial year ended 31 December 2007

HA
W P
AR
CO
RP
OR
AT
ION
LIM
ITE
D
An
nu
al
Re
po
rt 2
00
7
69
6. NATURE OF EXPENSES (continued)
The Group
2007 2006
$’000 $’000
Auditors’ remuneration:
– Auditors of the Company:
– fees 492 498
– non-audit fees 70 35
– Under-provision in respect of prior year 85 21
– Other auditors:
– fees 7 16
– non-audit fees 8 –
Net exchange loss/(gain) 494 (248)
Stocks written off 171 102
Amortisation of/write off of intangible assets 100 48
7. TAXATION
The Group
2007 2006
$’000 $’000
Tax expense attributable to profi t is made up of:
Current taxation
Current year:
Singapore 17,292 16,138
Overseas 1,713 1,487
19,005 17,625
Over provision in respect of previous years:
Singapore (1,135) (219)
Overseas (116) (66)
(1,251) (285)
Deferred taxation
Origination and reversal of temporary differences:
Singapore 11,004 2,406
Overseas (58) 83
10,946 2,489
28,700 19,829
NOTES TO THE FINANCIAL STATEMENTS
For the fi nancial year ended 31 December 2007

HA
W P
AR
CO
RP
OR
AT
ION
LIM
ITE
D
An
nu
al
Re
po
rt 2
00
7
70
7. TAXATION (continued)
The tax expense on accounting profi t differs from the amount that would arise using the Singapore standard
rate of income tax due to the following:
2007 2006
$’000 $’000
Profi t before taxation 187,830 127,097
Taxation at applicable Singapore tax rate of 18% (2006: 20%) 33,809 25,419
Adjustments:
Change in tax rate (586) –
Tax rate difference in subsidiaries 595 222
Tax effect of expenses not deductible for tax purposes 1,589 201
Tax effect of income not subject to tax (4,221) (4,771)
Tax rebates and exemptions (147) (246)
Utilisation of tax losses not recognised in previous years (70) (545)
Deferred income tax asset not recognised (394) –
Reversal of previous years' temporary differences (652) –
Overprovision in respect of previous years (1,243) (285)
Others 20 (166)
Taxation expense 28,700 19,829
On 15 February 2007, the Singapore Second Minister of Finance announced a reduction in the corporate
tax rate from 20% to 18% and various tax incentives for the year of assessment 2008 and onwards. This
reduction resulted in a decrease in deferred tax of approximately $6.1million, of which approximately
$5.9million is included in fair value reserves (Note 8).
8. RESERVES AND MINORITY INTERESTS
The Group The Company
2007 2006 2007 2006
$’000 $’000 $’000 $’000
Non-distributable reserves
Statutory reserve
Balance at beginning of fi nancial year 974 743 – –
Transferred from revenue reserve 291 231 – –
Balance at end of fi nancial year 1,265 974 – –
NOTES TO THE FINANCIAL STATEMENTS For the fi nancial year ended 31 December 2007

HA
W P
AR
CO
RP
OR
AT
ION
LIM
ITE
D
An
nu
al
Re
po
rt 2
00
7
71
8. RESERVES AND MINORITY INTERESTS (continued)
The Group The Company
2007 2006 2007 2006
$’000 $’000 $’000 $’000
Non-distributable reserves (continued)
Capital reserve
Balance at beginning and
end of fi nancial year 17,267 17,267 38 38
Fair value reserve
Balance at beginning of fi nancial year 1,087,894 668,204 (72) (170)
Disposal of available-for-sale
fi nancial assets (247) – – –
Net fair value gains on available-for-sale
fi nancial assets (Note 15) 85,937 437,723 86 98
Currency translation differences 157 293 – –
Reduction in tax rate 5,892 – – –
Tax on fair value gains on current
available-for-sale fi nancial
assets (Note 22) (1,393) (18,326) – –
Balance at end of fi nancial year 1,178,240 1,087,894 14 (72)
Share option reserve
Balance at beginning of fi nancial year 711 354 711 354
Expensing of share options 533 357 533 357
Balance at end of fi nancial year 1,244 711 1,244 711
Total non-distributable reserves 1,198,016 1,106,846 1,296 677
The statutory reserve is legally required to be set aside in the countries of incorporation of certain
subsidiaries. Those laws restrict the distribution and use of the reserve.
The capital reserve relates to non-distributable profi ts arising from sale of long term investments
according to certain subsidiaries’ Articles of Association and share premium arising from issue of shares
by certain subsidiaries.
NOTES TO THE FINANCIAL STATEMENTS
For the fi nancial year ended 31 December 2007
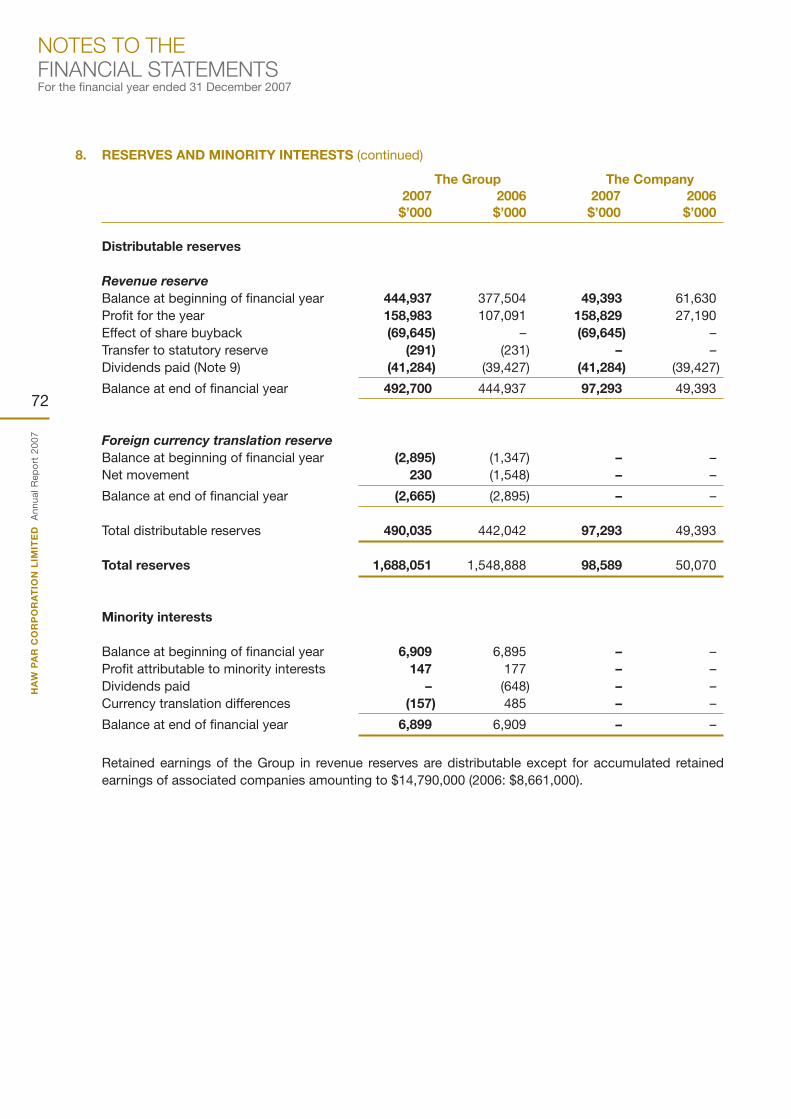
HA
W P
AR
CO
RP
OR
AT
ION
LIM
ITE
D
An
nu
al
Re
po
rt 2
00
7
72
8. RESERVES AND MINORITY INTERESTS (continued)
The Group The Company
2007 2006 2007 2006
$’000 $’000 $’000 $’000
Distributable reserves
Revenue reserve
Balance at beginning of fi nancial year 444,937 377,504 49,393 61,630
Profi t for the year 158,983 107,091 158,829 27,190
Effect of share buyback (69,645) – (69,645) –
Transfer to statutory reserve (291) (231) – –
Dividends paid (Note 9) (41,284) (39,427) (41,284) (39,427)
Balance at end of fi nancial year 492,700 444,937 97,293 49,393
Foreign currency translation reserve
Balance at beginning of fi nancial year (2,895) (1,347) – –
Net movement 230 (1,548) – –
Balance at end of fi nancial year (2,665) (2,895) – –
Total distributable reserves 490,035 442,042 97,293 49,393
Total reserves 1,688,051 1,548,888 98,589 50,070
Minority interests
Balance at beginning of fi nancial year 6,909 6,895 – –
Profi t attributable to minority interests 147 177 – –
Dividends paid – (648) – –
Currency translation differences (157) 485 – –
Balance at end of fi nancial year 6,899 6,909 – –
Retained earnings of the Group in revenue reserves are distributable except for accumulated retained
earnings of associated companies amounting to $14,790,000 (2006: $8,661,000).
NOTES TO THE FINANCIAL STATEMENTS For the fi nancial year ended 31 December 2007

HA
W P
AR
CO
RP
OR
AT
ION
LIM
ITE
D
An
nu
al
Re
po
rt 2
00
7
73
9. DIVIDENDS PAID
The Group The Company
2007 2006 2007 2006
$’000 $’000 $’000 $’000
Ordinary dividends (one-tier) paid:
Final exempt 2006 dividend of 14 cents
per share (2006: Final 2005 dividend
of 13 cents per share) 29,113 26,974 29,113 26,974
Interim exempt 2007 dividend of 6 cents
per share (2006: 6 cents per share) 12,171 12,453 12,171 12,453
41,284 39,427 41,284 39,427
Dividend per share (net of tax) 20.0 cents 19.0 cents 20.0 cents 19.0 cents
The Directors recommend a fi nal tax exempt one-tier dividend of 19 cents per share (inclusive of a 5 cents
per share special dividends) amounting to approximately $37.5 million be paid for the fi nancial year ended
31 December 2007 (2006:14 cents per share amounting to approximately $29.1million). These fi nancial
statements do not refl ect this dividend, which will be accounted for in the shareholders’ equity as an
appropriation of revenue reserve in the fi nancial year ending 31 December 2008.
10. EARNINGS PER SHARE
The Group
2007 2006
$’000 $’000
Earnings for the fi nancial year 158,983 107,091
’000 ’000
Weighted average number of ordinary shares
for calculation of basic earnings per share 204,324 207,471
Dilution adjustment for share options 145 146
Adjusted weighted average number of shares
for calculation of diluted earnings per share 204,469 207,617
Earnings per share
Basic 77.8 cents 51.6 cents
Diluted 77.8 cents 51.6 cents
Basic earnings per share is calculated by dividing the earnings for the fi nancial year by the weighted
average number of ordinary shares in issue during the fi nancial year.
The diluted earnings per share is adjusted for the effects of all dilutive potential ordinary shares. The
Company has one category of dilutive potential ordinary shares which is share options. A calculation is
carried out to determine the number of shares that could have been acquired at fair value (determined
as the average annual market share price of the Company’s shares) based on the monetary value of the
subscription rights attached to outstanding share options. The number of shares calculated is compared
with the number of shares that would have been issued assuming the exercise of the share options.
The difference is added to the denominator as an issuance of ordinary shares for no consideration. No
adjustment is made to earnings (numerator).
NOTES TO THE FINANCIAL STATEMENTS
For the fi nancial year ended 31 December 2007

HA
W P
AR
CO
RP
OR
AT
ION
LIM
ITE
D
An
nu
al
Re
po
rt 2
00
7
74
11. PROPERTY, PLANT AND EQUIPMENT
Plant,
equipment,
Leasehold furniture Marine
land and and and Construction-
buildings vehicles livestock in-progress Total
$’000 $’000 $’000 $’000 $’000
The Group
Cost
At 1 January 2007 30,830 32,867 919 734 65,350
Additions 538 2,303 185 3,604 6,630
Disposals/write-offs – (310) (190) – (500)
Currency translation
differences (227) (13) (1) – (241)
At 31 December 2007 31,141 34,847 913 4,338 71,239
Accumulated Depreciation
At 1 January 2007 14,420 27,150 674 – 42,244
Charge for 2007 1,332 1,573 64 – 2,969
Disposals/write-offs – (279) (53) – (332)
Currency translation
differences (111) – – – (111)
At 31 December 2007 15,641 28,444 685 – 44,770
Net book value
At 31 December 2007 15,500 6,403 228 4,338 26,469
Cost
At 1 January 2006 30,301 37,058 821 – 68,180
Additions – 2,875 192 734 3,801
Disposals/write-offs (158) (7,061) (102) – (7,321)
Currency translation
differences 687 (5) 8 – 690
At 31 December 2006 30,830 32,867 919 734 65,350
Accumulated Depreciation
At 1 January 2006 13,102 31,021 640 – 44,763
Charge for 2006 1,199 1,590 53 – 2,842
Disposals/write-offs – (5,447) (21) – (5,468)
Currency translation
differences 119 (14) 2 – 107
At 31 December 2006 14,420 27,150 674 – 42,244
Net book value
At 31 December 2006 16,410 5,717 245 734 23,106
NOTES TO THE FINANCIAL STATEMENTS For the fi nancial year ended 31 December 2007

HA
W P
AR
CO
RP
OR
AT
ION
LIM
ITE
D
An
nu
al
Re
po
rt 2
00
7
75
11. PROPERTY, PLANT AND EQUIPMENT (continued)
Plant,
equipment,
furniture
and vehicles
$’000
The Company
Cost
At 1 January 2007 1,728
Disposals/write-offs (1,728)
At 31 December 2007 –
Accumulated Depreciation
At 1 January 2007 1,102
Disposals/write-offs (1,102)
At 31 December 2007 –
Net book value
At 31 December 2007 –
Cost
At 1 January 2006 1,629
Additions 130
Disposals/write-offs (31)
At 31 December 2006 1,728
Accumulated Depreciation
At 1 January 2006 836
Charge for 2006 290
Disposals/write-offs (24)
At 31 December 2006 1,102
Net book value
At 31 December 2006 626
NOTES TO THE FINANCIAL STATEMENTS
For the fi nancial year ended 31 December 2007

HA
W P
AR
CO
RP
OR
AT
ION
LIM
ITE
D
An
nu
al
Re
po
rt 2
00
7
76
12. INVESTMENT PROPERTIES
The Group
2007 2006
$’000 $’000
At beginning of the fi nancial year 151,698 134,966
Improvements 287 645
Fair value gain on investment properties taken to:
– consolidated income statement 72,662 16,661
Transfer to asset held for sale (Note 20) (10,000) –
Currency translation differences (149) (574)
At end of the fi nancial year 214,498 151,698
At valuation:
Freehold and 999-year leasehold properties 28,198 22,568
Leasehold properties 186,300 129,130
All investment properties of the Group are based on open market valuations carried out by independent
professional valuers annually at balance sheet date. It is the intention of the Directors to hold the investment
properties for long term.
Investment properties are mainly leased to third parties under operating leases (Note 26).
Fair value changes of investment properties of approximately $72,662,000 (2006: $16,661,000)
(before deferred taxation) are non-cash in nature.
The following amounts are recognised in the consolidated income statement:
The Group
2007 2006
$’000 $’000
Rental income (Note 4) 11,832 9,450
Direct operating expenses arising from investment
properties that generated rental income (3,928) (3,745)
The details of the Group’s investment properties are as follows:
Tenure Independent Valuation
Investment properties Description of land valuer date
Haw Par Glass Tower 8-storey offi ce building 99-year lease DTZ 31
178 Clemenceau Avenue on a land area of 899 from 2 June Debenham December
Singapore 239926 square metres. The lettable 1970 Tie Leung 2007
area is 3,316 square metres. (SEA) Pte Ltd
Haw Par Centre 6-storey offi ce building 99-year lease DTZ 31
180 Clemenceau Avenue on a land area of 2,464 from Debenham December
Singapore 239922 square metres. The 1 September Tie Leung 2007
lettable area is 10,251 1952 (SEA) Pte Ltd
square metres.
NOTES TO THE FINANCIAL STATEMENTS For the fi nancial year ended 31 December 2007

HA
W P
AR
CO
RP
OR
AT
ION
LIM
ITE
D
An
nu
al
Re
po
rt 2
00
7
77
12. INVESTMENT PROPERTIES (continued)
Tenure Independent Valuation
Investment properties Description of land valuer date
Haw Par Technocentre 7-storey industrial building 99-year lease DTZ 31
401 Commonwealth Drive on a land area of from 1 March Debenham December
Singapore 149598 8,131 square metres. 1963 Tie Leung 2007
The lettable area is (SEA) Pte Ltd
15,715 square metres.
Menara Haw Par 32-storey offi ce building Freehold DTZ 31
Lot 242, Jalan Sultan on a land area of 2,321 Nawawi December
Ismail, 50250 square metres. The Tie Leung 2007
Kuala Lumpur lettable area is 16,062 Property
Malaysia square metres. Consultants
Sdn Bhd
Westlands Centre 3 units of offi ce/industrial 999-year lease DTZ 31
Units 1405-1407 space with a lettable area Debenham December
Westlands Centre of 475 square metres. Tie Leung 2007
20 Westlands Road Limited
Quarry Bay
Hong Kong
13. INVESTMENT IN SUBSIDIARIES
The Company
2007 2006
$’000 $’000
Equity investments at cost:
Unquoted, at written down cost 429,758 433,588
Allowance for impairment in value (40,145) (32,445)
389,613 401,143
Details of signifi cant subsidiaries are shown in Note 31.
NOTES TO THE FINANCIAL STATEMENTS
For the fi nancial year ended 31 December 2007

HA
W P
AR
CO
RP
OR
AT
ION
LIM
ITE
D
An
nu
al
Re
po
rt 2
00
7
78
14. INVESTMENT IN ASSOCIATED COMPANIES
The Group The Company
2007 2006 2007 2006
$’000 $’000 $’000 $’000
Balance at beginning of fi nancial year 43,680 36,696 2,895 2,895
Loss on dilution – (146) – –
Share of profi ts 6,129 8,599 – –
Dividends received/receivable (998) (2,101) – –
Share of translation reserves 3,634 2,382 – –
Currency translation differences (2,450) (1,750) – –
–
Balance at end of fi nancial year 49,995 43,680 2,895 2,895
The summarised Group’s share
of fi nancial information of associated
companies are as follows:
– Assets 79,062 76,065
– Liabilities (29,321) (33,422)
– Revenues 53,061 64,841
– Net profi t 6,129 8,599
Share of associated companies
contingent liabilities incurred
jointly with other investors – –
Contingent liabilities in which the
Group is severally liable – –
Fair value of investment in a Hong Kong Stock Exchange listed associate of cost $34,172,000
(2006: $34,939,000) is $70,013,940 (2006: $89,032,000). This is based on its quoted closing price as
at 31 December 2007 and the exchange rate of $1=HK$5.35 (2006: $1=HK$5.05).
Investments in associated companies at 31 December 2007 include intangible assets valued at $3,293,000
(2006: $3,756,000).
Details of associated companies are set out in Note 31, and Note 31(iv) explains the basis of equity
accounting for an associated company, which has a different fi nancial year end.
NOTES TO THE FINANCIAL STATEMENTS For the fi nancial year ended 31 December 2007

HA
W P
AR
CO
RP
OR
AT
ION
LIM
ITE
D
An
nu
al
Re
po
rt 2
00
7
79
15. AVAILABLE-FOR-SALE FINANCIAL ASSETS
The Group The Company
2007 2006 2007 2006
$’000 $’000 $’000 $’000
Balance at beginning of fi nancial year 1,551,013 1,113,428 3,922 3,824
Additions 15,290 – – –
Net fair value gains transferred to
fair value reserve (Note 8) 85,937 437,723 86 98
Disposals (1,926) (11) (16) –
Capital reduction by an investee (3,055) – (3,055) –
Currency translation differences (79) (127) – –
Balance at end of fi nancial year 1,647,180 1,551,013 937 3,922
Less: Non–current portion (1,285,747) (1,194,564) (937) (3,922)
Current portion 361,433 356,449 – –
Quoted investments 1,646,127 1,546,958 – –
Unquoted investments 1,053 4,055 937 3,922
1,647,180 1,551,013 937 3,922
The quoted investments are mainly listed in Singapore.
16. INTANGIBLE ASSETS
The Group The Company
2007 2006 2007 2006
$’000 $’000 $’000 $’000
Goodwill on consolidation 11,116 11,116 – –
Trademarks and deferred expenditure 100 – – –
11,216 11,116 – –
(a) Goodwill on consolidation
The Group
2007 2006
$’000 $’000
Cost
Balance at beginning of fi nancial year 11,116 14,380
Written off on disposal of a subsidiary – (3,264)
Balance at end of fi nancial year 11,116 11,116
Impairment tests for goodwill
The goodwill is allocated to the healthcare division of the Group, which is regarded as a cash-
generating unit (“CGU”).
NOTES TO THE FINANCIAL STATEMENTS
For the fi nancial year ended 31 December 2007

HA
W P
AR
CO
RP
OR
AT
ION
LIM
ITE
D
An
nu
al
Re
po
rt 2
00
7
80
16. INTANGIBLE ASSETS (continued)
(a) Goodwill on consolidation (continued)
During the year, the Group determines that there is no impairment of its CGU containing goodwill.
The recoverable amount (i.e. higher of value-in-use and fair value less costs to sell) of the CGU
is determined on the basis of value-in-use calculations. These calculations incorporate cash fl ow
projections by management covering a twenty-year period.
Key assumptions used for value-in-use calculations:
Discount rate 10.31% (2006: 5.73%)
Growth rate 0.00%
These assumptions have been used for the analysis of the CGU. The discount rate used is post-tax
and refl ects specifi c risks relating to the healthcare division. Management determined a 0% growth
rate on grounds of prudence.
(b) Trademarks and deferred expenditure
Deferred
Trademarks expenditure
$’000 $’000
The Group
Net Book Value
Balance at 1 January 2007 – –
Additions during the year – 200
Amortisation during the year – (100)
Balance at 31 December 2007 – 100
Balance at 1 January 2006 – 48
Amount written off during the year – (48)
Balance at 31 December 2006 – –
At 31 December 2007:
Cost 3,200 1,400
Less: Accumulated amortisation (3,200) (1,300)
Net book value – 100
At 31 December 2006:
Cost 3,200 1,248
Less: Accumulated amortisation (3,200) (1,248)
Net book value – –
NOTES TO THE FINANCIAL STATEMENTS For the fi nancial year ended 31 December 2007

HA
W P
AR
CO
RP
OR
AT
ION
LIM
ITE
D
An
nu
al
Re
po
rt 2
00
7
81
16. INTANGIBLE ASSETS (continued)
(b) Trademarks and deferred expenditure (continued)
Trademarks
$’000
The Company
Balance at 1 January and 31 December 2007,
net of accumulated amortisation –
At 31 December 2007:
Cost 2,000
Less: Accumulated amortisation (2,000)
Net book value –
The Company and its wholly-owned subsidiary, Haw Par Brothers International (HK) Ltd (“HPBIHK”)
own the “Tiger” (Cost: $2.0 million) and “Kwan Loong” (“Double Lion”) (Cost: HK$5.58 million)
trademarks respectively. The Company and HPBIHK (together “the Licensors”), licensed to Haw
Par Healthcare Limited (“HPH”), another subsidiary, the exclusive right to manufacture, distribute,
market and sell “Tiger” and “Kwan Loong” products worldwide until 31 December 2012. These
licensing arrangements are renewable upon expiry for a further period of 25 years on terms to be
mutually agreed between the Licensors and HPH.
17. STOCKS
The Group
2007 2006
$’000 $’000
Trading stocks 399 411
Manufacturing stocks 3,862 4,311
Finished stocks 1,335 1,422
Total 5,596 6,144
The cost of stocks recognised as expense and included in “Cost of sales” amounted to $33,265,000
(2006: $34,506,000).
During the year, the Group reversed $Nil (2006: $32,000), being part of an inventory write-down made in
2006, as the inventories were sold above the carrying amounts in 2007. The reversal has been included in
“Cost of sales” in the consolidated income statement.
NOTES TO THE FINANCIAL STATEMENTS
For the fi nancial year ended 31 December 2007

HA
W P
AR
CO
RP
OR
AT
ION
LIM
ITE
D
An
nu
al
Re
po
rt 2
00
7
82
18. RECEIVABLES
The Group The Company
2007 2006 2007 2006
$’000 $’000 $’000 $’000
Trade receivables 17,575 12,617 – –
Less: Allowance for impairment
of receivables (77) (150) – –
Trade receivables (net) 17,498 12,467 – –
Advances to subsidiaries – – 146,803 104,526
Other receivables 2,905 2,976 406 224
2,905 2,976 147,209 104,750
Total 20,403 15,443 147,209 104,750
Advances to subsidiaries are unsecured, interest-free (2006: interest-free) and are repayable on demand.
The carrying values of the advances approximate their fair values.
These advances are mainly non-trade in nature, except for royalty income receivable from a subsidiary,
which is trade-related and the amount is not material.
(i) Allowance for impairment of receivables
Impairment loss on receivables recognised as an expense and included in “Sales and marketing”
expenses amounted to $Nil (2006: $124,000). A write back of impairment for $73,000 (2006: $Nil) was
recognised and included in miscellaneous income under “Other Income”.
(ii) Other receivables:
The Group The Company
2007 2006 2007 2006
$’000 $’000 $’000 $’000
Sundry receivables and deposits 2,181 2,027 394 48
Dividends receivable 686 734 – –
Interest receivable on deposits 38 215 12 176
2,905 2,976 406 224
The carrying amounts of sundry, dividends and interest receivables and deposits approximate their
fair values.
NOTES TO THE FINANCIAL STATEMENTS For the fi nancial year ended 31 December 2007

HA
W P
AR
CO
RP
OR
AT
ION
LIM
ITE
D
An
nu
al
Re
po
rt 2
00
7
83
19. CASH AND CASH EQUIVALENTS
The Group The Company
2007 2006 2007 2006
$’000 $’000 $’000 $’000
Short term bank deposits 33,368 81,746 20,893 69,194
Cash at bank and on hand 18,317 15,861 1,102 1,067
51,685 97,607 21,995 70,261
The carrying amounts of cash and cash equivalents approximate their fair values.
Included in the cash and cash equivalents are bank deposits and cash on hand amounting to
$15,095,000 (2006: $15,808,000) which are not freely remissible for use by the Group because of currency
exchange restrictions.
Short term bank deposits have an average maturity of 1 to 3 months (2006: 1 to 3 months) from the end of
the fi nancial year. The weighted average effective interest rate of the short-term bank deposits at year-end
is 2.14% (2006: 3.08%) per annum.
Cash and cash equivalents included in the consolidated cash fl ow statement comprised the following
balance sheet amounts:
The Group
2007 2006
$’000 $’000
Cash and bank balances 18,317 15,861
Deposits with banks and fi nancial institutions 33,368 81,746
51,685 97,607
20. ASSET HELD FOR SALE
Asset held for sale of $10,000,000 (2006: $Nil) represents a property, previously held as an investment
property. Details of the property are as follow:
Asset held for sale Description Tenure of land
Setron Building 8-storey industrial building 60-year lease
10 Dundee Road on a land area of 6,567 square from 1 November 1972
Singapore 149455 metres. The lettable area is
11,763 square metres.
The property has been vacant for a number of years due to restricted use of the building. An active
disposal plan is underway and is expected to be completed within the next twelve months.
The property did not earn any revenue during the fi nancial year and incurred expenses of approximately
$179,000 (2006: $94,000) that are classifi ed as part of cost of sales in the consolidated income
statement.
The property is classifi ed as part of the “Property rental” operating segment disclosed in Note 29.
NOTES TO THE FINANCIAL STATEMENTS
For the fi nancial year ended 31 December 2007

HA
W P
AR
CO
RP
OR
AT
ION
LIM
ITE
D
An
nu
al
Re
po
rt 2
00
7
84
21. TRADE AND OTHER PAYABLES
The Group The Company
2007 2006 2007 2006
$’000 $’000 $’000 $’000
Trade creditors 4,580 3,653 – –
Bills payable (trade) 12 28 – –
Accrued advertisement and
promotion expenses 9,204 8,779 – –
Accrued repairs and maintenance 164 157 – –
Sundry accruals 6,879 5,692 580 1,259
Other creditors 3,136 3,065 366 199
Rental deposits 3,754 2,699 – –
Unclaimed dividends 916 803 898 785
Advances from subsidiaries – – 222,706 280,275
28,645 24,876 224,550 282,518
The carrying values of trade creditors and advances approximate their fair values.
Trade creditors include $1,221,000 (2006: $26,000) payable to the minority shareholder of Haw Par Elder
(India) Private Limited, a subsidiary of the Group.
Advances from subsidiaries are unsecured, and interest free (2006: interest free) and are repayable
on demand.
These advances are mainly non-trade in nature.
22. DEFERRED INCOME TAXATION
Deferred income tax assets and liabilities are offset when there is a legally enforceable right to set off
current income tax assets against current income tax liabilities and when the deferred income taxes relate
to the same fi scal authority. The amounts, determined after appropriate offsetting, are shown on the
balance sheets as follows:
The Group The Company
2007 2006 2007 2006
$’000 $’000 $’000 $’000
Deferred income tax assets
– to be recovered within 12 months (587) (271) – (7)
Deferred income tax liabilities
– to be settled within 12 months 319 526 – 7
– to be settled after more than
12 months 67,923 60,997 – 141
68,242 61,523 – 148
67,655 61,252 – 141
NOTES TO THE FINANCIAL STATEMENTS For the fi nancial year ended 31 December 2007

HA
W P
AR
CO
RP
OR
AT
ION
LIM
ITE
D
An
nu
al
Re
po
rt 2
00
7
85
22. DEFERRED INCOME TAXATION (continued)
The movements in the deferred income tax account are as follows:
The Group The Company
2007 2006 2007 2006
$’000 $’000 $’000 $’000
At beginning of fi nancial year 61,252 40,633 141 141
Disposal of a subsidiary – (200) – –
Tax charged to:
– fair value reserve (4,499) 18,326 – –
Tax charged/(credited) to
consolidated income statement
– changes in fair value 11,397 3,268 (141) –
– others (451) (779) – –
Currency translation differences (44) 4 – –
At end of fi nancial year 67,655 61,252 – 141
Deferred income tax assets are recognised for tax losses carried forward to the extent that realisation of
the related tax benefi ts through future taxable profi ts is probable. The Group has unrecognised deferred
income tax assets arising from tax losses of $31.7 million (2006: $34.4 million). These tax losses can be
carried forward and used to offset against future taxable income subject to meeting certain statutory
requirements by those corporations in their respective countries of incorporation. These tax losses have
no expiry date.
The Group’s and Company’s deferred tax liabilities have been computed based on the corporate tax rate
and tax laws prevailing at balance sheet date.
The Group
The movements in the deferred income tax assets and liabilities (prior to offsetting of balances within the
same tax jurisdiction) during the year are as follows:
Deferred income tax liabilities
Accrued
interest
receivable Fair value
Accelerated on deposits changes on
Fair value tax and investment
gains depreciation debentures properties Total
$’000 $’000 $’000 $’000 $’000
2007
Beginning of fi nancial year 54,823 858 354 5,488 61,523
Charged to equity (4,499) – – – (4,499)
(Credited)/charged to
consolidated
income statement – (100) (35) 11,397 11,262
Currency translation
differences – (39) – (5) (44)
End of fi nancial year 50,324 719 319 16,880 68,242
NOTES TO THE FINANCIAL STATEMENTS
For the fi nancial year ended 31 December 2007

HA
W P
AR
CO
RP
OR
AT
ION
LIM
ITE
D
An
nu
al
Re
po
rt 2
00
7
86
22. DEFERRED INCOME TAXATION (continued)
Deferred income tax liabilities (continued)
Accrued
interest
receivable Fair value
Accelerated on deposits changes on
Fair value tax and investment
gains depreciation debentures properties Total
$’000 $’000 $’000 $’000 $’000
2006
Beginning of fi nancial year 36,657 822 843 2,526 40,848
Charged to equity 18,326 – – – 18,326
(Credited)/charged to
consolidated
income statement – (234) (489) 3,268 2,545
Disposal of a subsidiary – (200) – – (200)
Currency translation
differences (160) 470 – (306) 4
End of fi nancial year 54,823 858 354 5,488 61,523
The Group
Deferred income tax assets
Provisions
$’000
2007
Beginning of fi nancial year (271)
Credited to consolidated income statement (316)
End of fi nancial year (587)
2006
Beginning of fi nancial year (215)
Credited to consolidated income statement (56)
End of fi nancial year (271)
NOTES TO THE FINANCIAL STATEMENTS For the fi nancial year ended 31 December 2007

HA
W P
AR
CO
RP
OR
AT
ION
LIM
ITE
D
An
nu
al
Re
po
rt 2
00
7
87
22. DEFERRED INCOME TAXATION (continued)
The Company
Deferred income tax liabilities
Accelerated
tax
depreciation
$’000
2007
Beginning of fi nancial year 148
Credited to income statement (148)
End of fi nancial year –
2006
Beginning and end of fi nancial year 148
Deferred income tax assets
Provisions
$’000
2007
Beginning and end of fi nancial year (7)
Charged to income statement 7
End of fi nancial year –
2006
Beginning and end of fi nancial year (7)
23. SHARE CAPITAL
No. of shares Amount
’000 $’000
The Group and the Company
2007
Beginning of fi nancial year 207,652 250,277
Issued 362,000 ordinary shares by virtue of
exercise of share options (Note 27(c)) 362 1,823
Cancellation of shares arising from share buyback (10,620) (12,862)
End of fi nancial year 197,394 239,238
NOTES TO THE FINANCIAL STATEMENTS
For the fi nancial year ended 31 December 2007

HA
W P
AR
CO
RP
OR
AT
ION
LIM
ITE
D
An
nu
al
Re
po
rt 2
00
7
88
23. SHARE CAPITAL (continued)
No. of shares Amount
’000 $’000
The Group and the Company
2006
Beginning of fi nancial year 207,200 207,200
Effect of Companies (Amendment) Act 2005 – 40,950
Issued 452,000 ordinary shares by virtue of
exercise of share options (Note 27(c)) 452 2,127
End of fi nancial year 207,652 250,277
The holders of ordinary shares are entitled to receive dividends as and when declared by the Company. All
ordinary shares carry one vote per share without restriction.
Please refer to Note 27 for details of share options.
24. RELATED PARTY TRANSACTIONS
In addition to other related party information disclosed in the fi nancial statements, the following
transactions have been carried out between the Group and its related parties on commercial terms and
at market rates during the fi nancial year:
(a) Transactions with a related party:
The Group
2007 2006
$’000 $’000
Purchase of stocks from Elder Health Care Limited 3,559 1,870
Elder Health Care Limited is a minority shareholder of Haw Par Elder (India) Private Limited, a 67.4%
owned subsidiary of the Group.
(b) Share options granted to key management
The aggregate number of share options granted to the key management of the Group during the
fi nancial year is 228,000 (2006: 199,000). The share options have been granted on the same terms
and conditions as those offered to the other employees of the Company (Note 27 (c)). The aggregate
number of share options granted to the key management of the Group outstanding as at the end of
the fi nancial year is 457,000 (2006: 461,000).
NOTES TO THE FINANCIAL STATEMENTS For the fi nancial year ended 31 December 2007

HA
W P
AR
CO
RP
OR
AT
ION
LIM
ITE
D
An
nu
al
Re
po
rt 2
00
7
89
24. RELATED PARTY TRANSACTIONS (continued)
(c) Key management’s remuneration
The key management’s remuneration includes fees, salary, bonus, commission and other emoluments
(including benefi ts-in-kind) computed based on the cost incurred by the Group and the Company, and
where the Group or Company do not incur any costs, the value of the benefi t. The key management’s
remuneration is as follows:
The Group
2007 2006
$’000 $’000
Key management of the Group:
– directors of the Company 2,016 2,225
– directors of the subsidiaries 1,695 1,445
– others 257 597
3,968 4,267
Comprising the following:
The Group
2007 2006
$’000 $’000
Salaries and other short-term employee benefi ts 3,619 3,769
Post-employment benefi ts – contribution to CPF 81 80
Share options granted 268 418
3,968 4,267
25. CONTINGENT LIABILITIES
Contingent liabilities relating to guarantees and claims are:
The Company
2007 2006
$’000 $’000
In respect of guarantees given to banks in connection
with facilities granted to subsidiaries 562 664
NOTES TO THE FINANCIAL STATEMENTS
For the fi nancial year ended 31 December 2007

HA
W P
AR
CO
RP
OR
AT
ION
LIM
ITE
D
An
nu
al
Re
po
rt 2
00
7
90
26. COMMITMENTS
(a) Capital commitments
The Group The Company
2007 2006 2007 2006
$’000 $’000 $’000 $’000
Capital commitments authorised and
contracted but not provided for in
the consolidated fi nancial statements 6,577 2,766 – –
The capital commitments above relate to property, plant and equipment.
(b) Operating lease commitments
As a lessee
The Group leases certain offi ces, warehouses, and other premises under non-cancellable lease
arrangements. Certain premises are further sub-leased to third parties under non-cancellable
sub-lease agreements.
The Group
2007 2006
$’000 $’000
Lease rental expense 1,965 1,587
Sub-lease rental income recognised in consolidated
income statement (718) (653)
Future minimum rentals payable under non-cancellable leases as of 31 December are as follows:
The Group
2007 2006
$’000 $’000
Within one year 912 698
Between one year and fi ve years 1,818 1,139
After fi ve years 3,052 2,673
5,782 4,510
As a lessor
The Group owns certain investment properties, which are tenanted under non-cancellable
lease arrangements.
Future minimum rentals receivable under non-cancellable leases as of 31 December are as follows:
The Group
2007 2006
$’000 $’000
Within one year 13,712 9,244
Between one year and fi ve years 16,352 10,136
More than fi ve years 2,472 –
32,536 19,380
NOTES TO THE FINANCIAL STATEMENTS For the fi nancial year ended 31 December 2007

HA
W P
AR
CO
RP
OR
AT
ION
LIM
ITE
D
An
nu
al
Re
po
rt 2
00
7
91
27. EMPLOYEE BENEFITS
2007 2006
(a) Number of employees (full-time and contract) at 31 December:
– Group 381 399
– Company – 27
The Group
2007 2006
$’000 $’000
(b) Staff costs (including Executive Directors):
– salaries, bonuses and other costs 17,492 16,299
– employer’s contribution to Central Provident Fund and
other defi ned contribution plans 1,506 1,134
18,998 17,433
Key management’s remuneration is disclosed in Note (24(c)).
(c) The Company operates the Haw Par Corporation Group 2002 Share Option Scheme (“2002 Scheme”).
The 2002 Scheme was approved by members of the Company on 22 May 2002.
The 2002 Scheme grants non-transferable options to selected employees and includes the
participation by the non-executive directors and the maximum life-span of exercising the options is
10 years (exercise period). The options are exercisable beginning on the fi rst anniversary from the date
when the options are granted or the second anniversary if the options are granted at a discount to the
market price under the 2002 Scheme.
The exercise price is equivalent to the average of the last dealt price for the share for fi ve consecutive
market days immediately before the offer date (“market price”) at the time of grant and can be set at
discounts of up to 20% to the market price under the 2002 Scheme. During the year, 378,000 (2006:
342,000) shares options have been granted to qualifying employees on 2 March 2007 (2006: 2 March
2006), of which 6,000 (2006: 14,000) have been subsequently cancelled. The fair value of the options
granted using the Trinomial valuation model is $587,723 (2006: $283,860). The signifi cant inputs into
the model are exercise price of $7.54 (2006: $5.52) at the grant date, standard deviation of expected
share price returns of 28% (2006: 16%), 5-year option life and annual risk-free interest rate of 3.11%
(2006: 3.26%). The volatility measured at the standard deviation of expected share price returns is
based on statistical analysis of daily share prices.
Information with respect to share options granted under the 2002 Scheme is as follows:
2007 2006
Under 2002 Scheme:
Outstanding at beginning of the year 672,000 816,000
Granted 378,000 342,000
Cancelled (11,000) (34,000)
Exercised (362,000) (452,000)
Outstanding at end of the year 677,000 672,000
Exercisable at end of the year 305,000 351,000
NOTES TO THE FINANCIAL STATEMENTS
For the fi nancial year ended 31 December 2007

HA
W P
AR
CO
RP
OR
AT
ION
LIM
ITE
D
An
nu
al
Re
po
rt 2
00
7
92
27. EMPLOYEE BENEFITS (continued)
(c) (continued)
2007 2006
Details of share options granted during the fi nancial year:
Expiry date 1.3.2012 1.3.2011
Exercise price (set at prevailing market price) $7.54 $5.52
Aggregate proceeds if shares are issued ($’000) 2,805 1,888
Details of share options exercised during the fi nancial year:
Number exercised
Exercise period Exercise price 2007 2006
7.6.2003 – 6.6.2007 $4.24 16,000 88,000
20.6.2004 – 19.6.2008 $3.96 48,000 46,000
18.5.2005 –17.5.2009 $4.80 74,000 182,000
19.5.2006 –18.5.2010 $5.11 64,000 129,000
2.3.2007 – 1.3.2011 $5.52 160,000 7,000
Total number of shares issued 362,000 452,000
Aggregate proceeds of shares issued ($’000) 1,823 2,127
Terms of share options outstanding as at 31 December 2007:
Number Number
Exercise period Exercise price outstanding exercisable
Under 2002 Scheme:
20.6.2004 – 19.6.2008 $3.96 16,000 16,000
18.5.2005 –17.5.2009 $4.80 20,000 20,000
19.5.2006 –18.5.2010 $5.11 113,000 113,000
2.3.2007 – 1.3.2011 $5.52 156,000 156,000
2.3.2008 –1.3.2012 $7.54 372,000 –
Total number of shares 677,000 305,000
28. FINANCIAL RISK MANAGEMENT
Financial risk factors
The Group’s activities expose it to market risk (including currency risk, interest rate risk and price risk),
credit risk and liquidity risk. The Group’s overall risk management strategy seeks to minimise adverse
effects from the unpredictability of fi nancial markets on the Group’s fi nancial performance.
The Board of Directors is responsible for setting the objectives and underlying principles of fi nancial
risk management for the Group. The Investment Committee then establishes the detailed policies,
such as authority levels, oversight responsibilities, risk identifi cation and measurement, exposure
limits and hedging strategies, in accordance with the objectives and underlying principles approved
by the Board of Directors.
Monthly and quarterly reports are submitted to Investment Committee and Board of Directors respectively
that contain the Group’s exposure to each type of fi nancial risks.
NOTES TO THE FINANCIAL STATEMENTS For the fi nancial year ended 31 December 2007

HA
W P
AR
CO
RP
OR
AT
ION
LIM
ITE
D
An
nu
al
Re
po
rt 2
00
7
93
28. FINANCIAL RISK MANAGEMENT (continued)
(a) Market risk
The Group is exposed to market risk, including primarily changes in currency exchange rates and
market prices of securities.
(1) Foreign currency risk
The Group operates in Asia and through agents/distributors in other parts of the world, with
dominant operations in Singapore. Entities in the Group regularly transact in currencies other than
their respective functional currencies (“foreign currencies”) such as the United States Dollar.
Currency risk arises when transactions are denominated in foreign currencies.
In addition, the Group is also exposed to currency translation risks arising from its foreign currency
denominated net assets, which are not signifi cant.
The Group manages its foreign currency exposures by a policy of matching, as far as
possible, by receipts and payments in each individual currency. The surplus of convertible
currencies are either further matched with future foreign currency requirements or exchanged
for Singapore dollar. The Group also has available forward contract facilities to hedge future
foreign exchange exposure.
The foreign currency exposure of the Group's net investment in overseas subsidiaries is managed
under the guidance of the Investment Committee.
The Group’s currency exposure based on the information provided to key management is
as follows:
US Hong Kong
Dollar Dollar Euro
$’000 $’000 $’000
Group
At 31 December 2007
Cash and cash equivalents 2,622 – 134
Trade and other receivables 6,310 – 2,347
Trade and other payables (2,290) (1,549) (1,150)
6,642 (1,549) 1,331
At 31 December 2006
Cash and cash equivalents 3,925 – 445
Trade and other receivables 5,337 – 108
Trade and other payables (3,943) (532) (317)
5,319 (532) 236
The Company does not have material foreign currency exposure as at 31 December 2007 and
2006 except for certain amounts due to a subsidiary denominated in Hong Kong Dollar for
$24,328,000 (2006: $25,779,000).
NOTES TO THE FINANCIAL STATEMENTS
For the fi nancial year ended 31 December 2007

HA
W P
AR
CO
RP
OR
AT
ION
LIM
ITE
D
An
nu
al
Re
po
rt 2
00
7
94
28. FINANCIAL RISK MANAGEMENT (continued)
(a) Market risk (continued)
(1) Foreign currency risk (continued)
A 5% (2006: 5%) weakening of Singapore dollar against the following currencies at reporting date
would increase / (decrease) profi t or loss by the amounts shown below, with all other variables
including tax rate being held constant:
US Hong Kong
Dollar Dollar Euro
$’000 $’000 $’000
Group
At 31 December 2007
Profi t and loss 332 (77) 67
At 31 December 2006
Profi t and loss 266 (27) 12
A 5% strengthening of Singapore dollar against the above currencies would have had the equal
but opposite effect on the above currencies to the amounts shown above, on the basis that all
other variables remain constant.
(2) Market price risk
The Group has substantial investments carried at fair value of $1,647.0 million (2006: carried at
fair value of $1,551.0 million) held in various forms of securities as of 31 December 2007 and have
been accounted for in accordance with the accounting policy stated in Note 2(j). These securities
are mainly listed in Singapore. The Group is not exposed to commodity price risk.
The market price risk associated with these investments is the potential loss in fair value resulting
from the decrease in market prices of securities. If prices for equity securities listed in Singapore
and elsewhere change by 5% (2006: 5%) with all other variables including tax rate being held
constant, the equity will be:
2007 2006
$’000 $’000
Group
Listed in Singapore
– increased by 81,869 76,689
– decreased by (81,869) (76,689)
NOTES TO THE FINANCIAL STATEMENTS For the fi nancial year ended 31 December 2007

HA
W P
AR
CO
RP
OR
AT
ION
LIM
ITE
D
An
nu
al
Re
po
rt 2
00
7
95
28. FINANCIAL RISK MANAGEMENT (continued)
(a) Market risk (continued)
(2) Market price risk (continued)
2007 2006
$’000 $’000
Group
Listed elsewhere
– increased by 438 653
– decreased by (438) (653)
The Group's investments are managed under the guidance of the Investment Committee.
(b) Liquidity risk
As at 31 December 2007, the Group has available cash and short term bank deposits totalling
$51.7 million (2006: $97.6 million). In addition, the Group has available credit facilities of about
$269.4 million (2006: $270.4 million).
The cash and deposits, together with the available credit facilities are expected to be suffi cient to
meet the funding requirements of the Group's operations.
The Group does not have any material fi nancial liabilities maturing more than 3 months from
31 December 2007.
(c) Credit risk
Credit risk refers to the risk that customers will default on its contractual obligations resulting in
fi nancial loss to the Group.
The Group's maximum exposure to credit risk in the event that the counterparties fail to perform their
obligations as of 31 December 2007 in relation to each class of recognised fi nancial assets is the
carrying amount of those assets as indicated in the balance sheets, except as follows:
2007 2006
$’000 $’000
Corporate guarantees provided to banks on subsidiaries’ obligations 562 664
The Group’s and Company’s major classes of fi nancial assets that are subject to credit risk are short-
term bank deposits and trade receivables.
It is the Group's policy to transact with creditworthy counterparties. In addition, the granting of material
credit limits to counterparties is reviewed and approved by senior management. The Group does not
expect to incur material credit losses on its fi nancial assets or other fi nancial instruments.
(i) Financial assets that are neither past due nor impaired
Short-term bank deposits that are neither past due nor impaired are mainly deposits with banks
with high credit-ratings assigned by international credit rating agencies. Trade receivables that
are neither past due nor impaired are substantially companies with a good collection track record
with the Group.
NOTES TO THE FINANCIAL STATEMENTS
For the fi nancial year ended 31 December 2007

HA
W P
AR
CO
RP
OR
AT
ION
LIM
ITE
D
An
nu
al
Re
po
rt 2
00
7
96
28. FINANCIAL RISK MANAGEMENT (continued)
(c) Credit risk (continued)
(ii) Financial assets that are past due and/or impaired
There is no other class of fi nancial assets that is past due and/or impaired except for trade
receivables.
The age analysis of trade receivables past due but not impaired is as follows:
Group
2007 2006
$’000 $’000
Past due 1 to 3 months 1,336 68
Past due 4 to 6 months 642 27
Past due over 6 months 3 32
1,981 127
The carrying amount of trade receivables individually determined to be impaired and the movement
of the related allowance for impairment are as follows:
Group
2007 2006
$’000 $’000
Gross amount 17,575 12,617
Less: Allowance for impairment (77) (150)
17,498 12,467
Beginning of fi nancial year 150 26
Allowance made – 124
Allowance written back (73) –
End of fi nancial year 77 150
(d) Capital risk
The Group’s objectives when managing capital are to safeguard the Group’s ability to continue as
a going concern and to maintain an optimal capital structure so as to maximise shareholder value.
In order to maintain or achieve an optimal capital structure, the Group may adjust the amount of
dividend payment, return capital to shareholders, buy back issued shares or obtain new borrowings.
Management monitors capital based on ability of the Group to generate sustainable profi ts and
availability of retained profi ts for dividend payments to shareholders.
NOTES TO THE FINANCIAL STATEMENTS For the fi nancial year ended 31 December 2007

HA
W P
AR
CO
RP
OR
AT
ION
LIM
ITE
D
An
nu
al
Re
po
rt 2
00
7
97
29. SEGMENTAL REPORTING
At 31 December 2007, the Group is organised into the following main business segments:
• Manufacturing, marketing and trading of healthcare products;
• Provision of leisure-related services;
• Property rental, and
• Investments in securities
Healthcare division principally manufactures and distributes topical analgesic products under the
“Tiger Balm” and “Kwan Loong” brand. These products are sold in more than 70 countries around
the world.
Leisure division provides family and tourist oriented leisure alternatives mainly in the form of oceanariums.
Property division owns and leases out several investment properties in the Asia region.
Investment division engages in investing activities, mainly in quoted and unquoted securities in
Asia region.
Inter-segment transactions are determined on an arm’s length basis. Unallocated costs represent
corporate expenses. Segment assets consist primarily of available-for-sale financial assets, investment
properties, property, plant and equipment, intangible assets, inventories, receivables, bank deposits
and cash and bank balances. Segment liabilities comprise operating liabilities and exclude tax assets
and tax liabilities. Capital expenditure comprises additions to investment properties and property,
plant and equipment.
The Group evaluates performance on the basis of profit or loss from operations before tax expenses
and management fees charged internally and exclude non-recurring gains and losses.
The Group accounts for intersegment sales and transfers as if the sales or transfers were to third
parties, ie. at current market prices.
The Group’s reportable segments are strategic business units that offer different product and services.
They are managed separately because each business target different customers and carry different
business risk.
NOTES TO THE FINANCIAL STATEMENTS
For the fi nancial year ended 31 December 2007

HA
W P
AR
CO
RP
OR
AT
ION
LIM
ITE
D
An
nu
al
Re
po
rt 2
00
7
98
29. SEGMENTAL REPORTING (continued)
(a) Reportable segments
Leisure
products
Healthcare and Property
products services rental Investments Eliminations Consolidated
$’000 $’000 $’000 $’000 $’000 $’000
2007
Sales to external
customers 70,511 37,024 11,797 – – 119,332
Inter-segment sales 37 – 267 – (304) –
Other income 76 464 1,272 74,584 – 76,396
Inter-segment
other income – – – 83,539 (83,539) –
Total revenue 70,624 37,488 13,336 158,123 (83,843) 195,728
Depreciation and
amortisation 912 1,919 4 295 (61) 3,069
Reportable segment profi t 14,421 17,974 8,628 156,669 (82,130) 115,562
Unallocated expenses (6,523)
Profi t from operations 109,039
Share of results of
associated companies – – – 6,129 – 6,129
Fair value gain on
investment properties – – 72,662 – – 72,662
Taxation (28,700)
Minority interests (147)
Earnings for the
fi nancial year 158,983
Reportable
segment assets 41,112 39,424 223,162 2,021,039 (287,695) 2,037,042
Tax recoverable 600
Total assets per balance sheet 2,037,642
Expenditures for
reportable segment
non-current assets 1,827 4,905 13 85 – 6,830
Reportable
segment liabilities 16,813 4,192 4,113 3,527 – 28,645
Taxation 7,154
Deferred income taxation 67,655
Total liabilities per balance sheet 103,454
NOTES TO THE FINANCIAL STATEMENTS For the fi nancial year ended 31 December 2007

HA
W P
AR
CO
RP
OR
AT
ION
LIM
ITE
D
An
nu
al
Re
po
rt 2
00
7
99
29. SEGMENTAL REPORTING (continued)
(a) Reportable segments (continued)
Leisure
products
Healthcare and Property
products services rental Investments Eliminations Consolidated
$’000 $’000 $’000 $’000 $’000 $’000
2006
Sales to external
customers 76,251 33,981 9,450 – – 119,682
Inter-segment sales – – 267 – (267) –
Other income 7,727 447 775 58,086 (8) 67,027
Inter-segment
other income – – – 24,755 (24,755) –
Total revenue 83,978 34,428 10,492 82,841 (25,030) 186,709
Depreciation and
amortisation 950 1,661 3 228 – 2,842
Reportable segment profi ts 17,002 16,892 6,261 81,663 (23,425) 98,393
Gain on disposal of subsidiary 7,621 – – – – 7,621
Unallocated expenses (4,175)
Profi t from operations 101,839
Finance costs (2)
Share of results of
associated companies – – – 8,599 – 8,599
Fair value gain on
investment properties – – 16,661 – – 16,661
Taxation (19,829)
Minority interests (177)
Earnings for the
fi nancial year 107,091
Reportable
segment assets 34,497 37,205 150,317 2,007,905 (330,117) 1,899,807
Tax recoverable 856
Total assets per balance sheet 1,900,663
Expenditures for
reportable segment
non-current assets 1,211 2,452 652 131 – 4,446
Reportable
segment liabilities 15,863 3,710 2,977 2,326 – 24,876
Taxation 8,461
Deferred income taxation 61,252
Total liabilities per balance sheet 94,589
NOTES TO THE FINANCIAL STATEMENTS
For the fi nancial year ended 31 December 2007

HA
W P
AR
CO
RP
OR
AT
ION
LIM
ITE
D
An
nu
al
Re
po
rt 2
00
7
100
29. SEGMENTAL REPORTING (continued)
(b) Geographical Information
Revenues Non-Current Assets
(i) (ii)
$’000 $’000
2007
Singapore 49,589 1,498,010
Other Asian countries 40,431 89,915
Other countries 29,312 –
Total 119,332 1,587,925
2006
Singapore 50,823 1,348,483
Other Asian countries 39,122 75,681
Other countries 29,737 –
Total 119,682 1,424,164
(i) Revenues are attributable to countries in which the customer is located.
(ii) Non-current assets are shown by the geographical area where the assets are located.
(c) Major customers
The Group does not have any particular customer that accounts for more than 10 per cent of the
Group’s revenues.
30. NEW ACCOUNTING STANDARDS AND FRS INTERPRETATIONS AND AMENDMENTS
Certain new accounting standards and interpretations have been published that are mandatory for
accounting periods beginning on or after 1 January 2008 or later periods and which the Group has not
early adopted.
The Group’s assessment of the impact of adopting those standards, amendments and interpretations that
are relevant to the Group is set out below.
INT FRS 111 Group and Treasury Share Transactions
The Group has adopted INT FRS 111 on 1 January 2008. INT FRS 111 clarifi es that the arrangement where
an entity receives goods or services as consideration for its own equity-instruments shall be accounted for
as an equity-settled share-based payment (“SBP”) transaction, regardless of how the equity instruments
needed are obtained. It also provides guidance on whether group SBP arrangements shall be classifi ed as
equity-settled or cash-settled SBP arrangements.
The Group operates an equity-settled, share-based compensation plan. As the Group has been recognising
these share option grants as equity-settled and does not operate any other SBP group arrangements, INT
FRS 111 does not have any impact to the Group.
NOTES TO THE FINANCIAL STATEMENTS For the fi nancial year ended 31 December 2007

HA
W P
AR
CO
RP
OR
AT
ION
LIM
ITE
D
An
nu
al
Re
po
rt 2
00
7
101
31. SIGNIFICANT SUBSIDIARIES AND ASSOCIATED COMPANIES
Effective equity
Country of interest held
Subsidiaries incorporation Principal activities by Group
2007 2006
% %
Leisure products
and services
Haw Par Leisure Singapore Investment holding 100.0 100.0
Pte Ltd
* Chengdu Haw Par The People’s Owning and operating 100.0 100.0
Oceanarium Co. Ltd ++ Republic of China oceanariums
* Sports Services Ltd Singapore Investment holding 100.0 100.0
* Sovereign Marketing Singapore Investment holding 100.0 100.0
Pte Ltd
* Underwater World Singapore Investment holding 100.0 100.0
International Pte Ltd
* Underwater World Singapore Owning and operating 100.0 100.0
Singapore Pte Ltd oceanariums
Underwater World Singapore Investment holding 100.0 100.0
Attractions Pte Ltd
* Underwater World Thailand Investment holding 49.0 49.0
(Thailand) Ltd. +
* Underwater World Thailand Owning and operating 46.6 46.6
Pattaya Ltd + oceanariums
NOTES TO THE FINANCIAL STATEMENTS
For the fi nancial year ended 31 December 2007

HA
W P
AR
CO
RP
OR
AT
ION
LIM
ITE
D
An
nu
al
Re
po
rt 2
00
7
102
31. SIGNIFICANT SUBSIDIARIES AND ASSOCIATED COMPANIES (continued)
Effective equity
Country of interest held
Subsidiaries incorporation Principal activities by Group
2007 2006
% %
Healthcare products
Haw Par Singapore Manufacturing, marketing 100.0 100.0
Healthcare Limited and distributing healthcare
products under licence
* Tiger Balm (Malaysia) Malaysia Manufacturing, marketing 100.0 100.0
Sdn. Bhd. + and distributing
pharmaceutical products
* Haw Par Tiger Balm Thailand Marketing and distributing 49.0 49.0
(Thailand) Limited + pharmaceutical products
* Haw Par Tiger Balm Philippines Marketing and distributing 100.0 100.0
(Philippines), Inc. ++ pharmaceutical products
* PT. Haw Par Healthcare ++ Indonesia Import, export and 100.0 100.0
distribution of
pharmaceutical,
health and consumer
products
* Tiger Medicals Taiwan Marketing and distributing 100.0 100.0
(Taiwan) Limited ++ pharmaceutical products
* Xiamen Tiger The People’s Manufacturing, marketing 100.0 100.0
Medicals Co., Ltd. ++ Republic of and distributing
China pharmaceutical products
* Haw Par Elder (India) India Marketing and distributing 67.4 67.4
Private Limited + pharmaceutical products
NOTES TO THE FINANCIAL STATEMENTS For the fi nancial year ended 31 December 2007

HA
W P
AR
CO
RP
OR
AT
ION
LIM
ITE
D
An
nu
al
Re
po
rt 2
00
7
103
31. SIGNIFICANT SUBSIDIARIES AND ASSOCIATED COMPANIES (continued)
Effective equity
Country of interest held
Subsidiaries incorporation Principal activities by Group
2007 2006
% %
Property
Haw Par Properties Singapore Property development 100.0 100.0
(Singapore) Private including owning and
Limited letting properties
Haw Par Centre Singapore Owning and letting 100.0 100.0
Private Ltd properties
* Sovereign Sports Hong Kong Owning and letting 100.0 100.0
Limited + properties
Haw Par Land Malaysia Owning and letting 100.0 100.0
(Malaysia) Sdn. Bhd. + properties
Setron Limited Singapore Property development 100.0 100.0
including owning and
letting properties
NOTES TO THE FINANCIAL STATEMENTS
For the fi nancial year ended 31 December 2007

HA
W P
AR
CO
RP
OR
AT
ION
LIM
ITE
D
An
nu
al
Re
po
rt 2
00
7
104
31. SIGNIFICANT SUBSIDIARIES AND ASSOCIATED COMPANIES (continued)
Effective equity
Country of interest held
Subsidiaries incorporation Principal activities by Group
2007 2006
% %
Corporate offi ce/Investments
Haw Par Equities Singapore Investment holding 100.0 100.0
Pte Ltd and dealing in securities
Haw Par Securities Singapore Investment holding 100.0 100.0
(Private) Limited and dealing in securities
Pickwick Securities Singapore Investment holding 100.0 100.0
Private Limited
Haw Par Investment Singapore Investment holding 100.0 100.0
Holdings Private Limited
* Haw Par International Hong Kong Investment holding 100.0 100.0
Limited + and dealing in securities
* Haw Par Brothers Hong Kong Investment holding 100.0 100.0
International (H.K.)
Limited +
Haw Par Hong Kong Hong Kong Investment holding 100.0 100.0
Limited +
Haw Par Capital Singapore Investment holding 100.0 100.0
Pte Ltd
Straits Maritime Singapore Investment holding 100.0 100.0
Leasing Private and dealing in securities
Limited
Haw Par Management Singapore Provision of 100.0 100.0
Services Pte Ltd management support
services
NOTES TO THE FINANCIAL STATEMENTS For the fi nancial year ended 31 December 2007

HA
W P
AR
CO
RP
OR
AT
ION
LIM
ITE
D
An
nu
al
Re
po
rt 2
00
7
105
31. SIGNIFICANT SUBSIDIARIES AND ASSOCIATED COMPANIES (continued)
Effective equity
Country of interest held
Subsidiaries incorporation Principal activities by Group
2007 2006
% %
M & G Maritime Singapore Investment holding 100.0 100.0
Services Pte Ltd and dealing in securities
U S E Enterprises Singapore Investment holding 100.0 100.0
Pte Ltd
Haw Par Trading Singapore Investment holding 100.0 100.0
Pte Ltd and dealing in securities
Haw Par Countertrade Singapore Dormant 100.0 100.0
Pte Ltd
Haw Par Pharmaceutical Singapore Investment holding 100.0 100.0
Holdings Pte. Ltd
Haw Par Management Philippines Dormant 100.0 100.0
(Phil.), Inc. ++
Effective equity
Associated Country of interest held
companies incorporation Principal activities by Group
2007 2006
% %
UIC Technologies Singapore Investment holding 40.0 40.0
Pte Ltd
* Hua Han Cayman Islands Investment holding 20.84 20.84
Bio-Pharmaceutical
Holdings Limited #
NOTES TO THE FINANCIAL STATEMENTS
For the fi nancial year ended 31 December 2007

HA
W P
AR
CO
RP
OR
AT
ION
LIM
ITE
D
An
nu
al
Re
po
rt 2
00
7
106
31. SIGNIFICANT SUBSIDIARIES AND ASSOCIATED COMPANIES (continued)
Notes
(i) Companies indicated with a (*) are indirectly held by Haw Par Corporation Limited.
(ii) Companies indicated with a (+) are audited by fi rms of PricewaterhouseCoopers outside Singapore.
(iii) Companies indicated with a (++) are audited by other fi rms. These foreign- incorporated companies
are not considered as signifi cant foreign-incorporated subsidiaries under the Singapore Exchange
Listing Manual. Accordingly, Rule 716 of the Listing Manual has been complied with.
(iv) Company indicated with a (#) is listed on an overseas exchange and audited by other fi rm of
auditors. Its fi nancial year end is 30 June. The Group has equity accounted for the profi t of its
associated company from 1 January 2007 based on its audited accounts for the fi nancial year
ended 30 June 2007, and unaudited six months results to 31 December 2007 as announced on
the overseas stock exchange.
(v) Accounting year end for Haw Par Elder (India) Private Limited (“HPEI”) is 31 March as required by the
laws of its country of incorporation. The consolidated fi nancial statements incorporate the unaudited
results of HPEI from 1 January to 31 December.
(vi) All the above subsidiaries and associated companies operate in their respective countries of
incorporation except Hua Han Bio-Pharmaceutical Holdings Limited which operates mainly in the
People’s Republic of China.
32. AUTHORISATION OF FINANCIAL STATEMENTS
These fi nancial statements were authorised for issue in accordance with a resolution of the Board of
Directors of Haw Par Corporation Limited on 20 March 2008.
NOTES TO THE FINANCIAL STATEMENTS For the fi nancial year ended 31 December 2007

HA
W P
AR
CO
RP
OR
AT
ION
LIM
ITE
D
An
nu
al
Re
po
rt 2
00
7
107
FINANCIALCALENDAR
Date Event
10 May 2007 Announcement of 2007 1st quarter results
8 August 2007 Announcement of 2007 2nd quarter results
10 September 2007 Payment of 2007 fi rst and interim dividend
7 November 2007 Announcement of 2007 3rd quarter results
22 February 2008 Announcement of 2007 full-year results (excluding share of associated
company, Hua Han Bio-Pharmaceutical Holdings Limited’s profi ts)
20 March 2008 Update of 2007 full-year results (including share of associated company,
Hua Han Bio-Pharmaceutical Holdings Limited’s profi ts)
1 April 2008 Announcement of Notice of Annual General Meeting/Despatch of 2007
Summary Financial Report
8 April 2008 Despatch of 2007 Annual Report
23 April 2008 39th Annual General Meeting
16 May 2008 Proposed books closure date for dividend entitlement
30 May 2008 Proposed payment of 2007 second & fi nal dividend and special dividend

HA
W P
AR
CO
RP
OR
AT
ION
LIM
ITE
D
An
nu
al
Re
po
rt 2
00
7
108
GROUPOFFICES
CORPORATE OFFICE
Haw Par Corporation Limited
401 Commonwealth Drive
#03-03 Haw Par Technocentre
Singapore 149598
Tel : 6337 9102
Fax : 6336 9232
Website : www.hawpar.com
Healthcare
Haw Par Healthcare Limited
401 Commonwealth Drive
#03-03 Haw Par Technocentre
Singapore 149598
Tel : 6337 9102
Fax : 6262 3436
Website : www.tigerbalm.com
Tiger Balm (Malaysia) Sdn. Bhd.
PLO 95 No.6
Jalan Firma 1/1
Tebrau Industrial Estate
81100 Johor Bahru
Malaysia
Tel : 07 354 9616
Fax : 07 354 9630
Xiamen Tiger Medicals
Co., Ltd
2/F No 17 Building,
Yi Bin Road,
Taiwan Industrial Estate,
Huli District, Zipcode 361006,
Xiamen
China
Tel : 86 592 562 0201
Fax : 86 592 562 0202
PT. Haw Par Healthcare
Jl. Tebet Timur
Dalam Raya No. 135
Jakarta 12820
Indonesia
Haw Par Tiger Balm
(Thailand) Limited
280 Charoenkrung
Kwaeng Samphanthawong,
Khet Samphanthawong,
Bangkok 10100
Thailand
Haw Par Tiger Balm
(Philippines), Inc.
Towers Virtual Offi ce and
Business Center
11/F Unit MN
CyberOne Building
Cyberpark Eastwood
Libis, Quezon City
Philippines 1110
Haw Par Elder (India)
Private Limited
C-9, Dalia Industrial Estate
Off Veera Desai Road
Andheri (W)
Mumbai 400058
India
Tiger Medicals (Taiwan) Limited
5F, No. 410 Sec 5
Zhong Xiao E. Road
Taipei City 11061
Taiwan
ROC

HA
W P
AR
CO
RP
OR
AT
ION
LIM
ITE
D
An
nu
al
Re
po
rt 2
00
7
109
GROUPOFFICES
Leisure
Haw Par Leisure Pte Ltd
401 Commonwealth Drive
#03-03 Haw Par Technocentre
Singapore 149598
Tel : 6337 9102
Fax : 6336 9232
Underwater World Singapore
Pte Ltd
80 Siloso Road, Sentosa
Singapore 098969
Tel : 6275 0030
Fax : 6275 0036
Email : uwspl@underwater
world.com.sg
Website : www.underwaterworld.
com.sg
Underwater World Pattaya Ltd
22/22 Moo 11,
Sukhumvit Road,
Nongprue, Banglamung,
Chonburi 20260
Thailand
Tel : 66 3875 6879
Fax : 66 3875 6977
Chengdu Haw Par Oceanarium
Co. Ltd#
Bridge No.1
Hong Xing Bei Lu
Chenghua District
Chengdu, Sichuan Province
P. R. China
Property & Investments
Haw Par Properties
(Singapore) Private Limited
Haw Par Securities
(Private) Limited
401 Commonwealth Drive
#03-03 Haw Par Technocentre
Singapore 149598
Tel : 6337 9102
Fax : 6336 9232
Haw Par Land (Malaysia)
Sdn. Bhd.
9th Floor, Menara Haw Par
Lot 242, Jalan Sultan Ismail
50250, Kuala Lumpur
Malaysia
Tel : 03 2070 1855
Fax : 03 2070 6078
Haw Par International Limited
Units 1607-1614
16F Cosco Tower
183 Queen’s Road
Tel : 852 2820 9178
Fax : 852 2810 5506
# Under construction.

HA
W P
AR
CO
RP
OR
AT
ION
LIM
ITE
D
An
nu
al
Re
po
rt 2
00
7
110
MANAGEMENTLISTING
CORPORATE OFFICE
Wee Ee LimPresident &Chief Executive Offi cer
Chng Hwee HongExecutive Director
Han Ah KuanExecutive Director
Tan Thiam HeeGroup Financial Controller &Group Company Secretary
Teo Thin YienGroup Internal Audit Manager
Tarn Sien HaoGeneral Manager(Corporate Development)
Zann LimGroup Finance Manager
Angeline NgGroup Human Resource Manager
Jezamine LeeCorporate Communications Manager
Lawrence OeiLegal Counsel
Tan Quee KimCorporate Secretarial Manager
Property
Wong Fook YuenDirector & Property Manager,Haw Par Properties (Singapore) Private Limited
Jon LeeProperty Manager,Haw Par Land (Malaysia) Sdn. Bhd.
Healthcare
Han Ah KuanDirector & General Manager,Haw Par Healthcare Limited
Goh Bee LeongDirector & General Manager (Manufacturing),Haw Par Healthcare Limited
Jasmin HongDeputy General Manager(Marketing),Haw Par Healthcare Limited
Law Lan HuaGroup Finance Manager,Haw Par Healthcare Limited
Kow Mui LickSenior Manager (QC & QA),Haw Par Healthcare Limited
Irene KumRegional Manager,Haw Par Healthcare Limited
Gerald WongRegional Manager,Haw Par Healthcare Limited
Serene LeeRegional Manager,Haw Par Healthcare Limited
Lynda NgRegional Manager(Kwan Loong Brand Products),Haw Par Healthcare Limited
Aninthaya SoonsathamCountry Manager(Thailand & Indochina),Haw Par Tiger Balm(Thailand) Limited
Randive UdayCountry Manager (India),Haw Par Healthcare Limited
Tai Voon SanDirector & Plant Manager,Tiger Balm (Malaysia) Sdn. Bhd.
Benson Lim Kok ChongPlant Manager,Xiamen Tiger Medicals Co., Ltd
Leisure
Chng Hwee HongDirector,Haw Par Leisure Pte Ltd
Kwek Meng TiamDirector & General Manager,Underwater World SingaporePte Ltd
Jeffrey MahonCuratorial Director,Underwater World SingaporePte Ltd
Betty KhooSenior Finance& Administration Manager,Underwater World SingaporePte Ltd
Peter ChewAssistant Director(Sales & Marketing),Underwater World SingaporePte Ltd
David HongDirector & General Manager,Underwater World Pattaya Ltd
Thanormwan PummarinSenior Finance& Administration Manager, Underwater World Pattaya Ltd
Darong YingchonCurator, Underwater World Pattaya Ltd
Kenneth PehGeneral Manager,Chengdu Haw Par Oceanarium Co. Ltd
Liu Wei BinCurator,Chengdu Haw Par Oceanarium Co. Ltd

HA
W P
AR
CO
RP
OR
AT
ION
LIM
ITE
D
An
nu
al
Re
po
rt 2
00
7
111
MAJOR PRODUCTS& SERVICES
Healthcare Products
Tiger Brand Products
Tiger Balm,
Tiger Balm Soft,
Tiger Balm Medicated Plaster,
Tiger Indomethacin Plaster,
Tiger Balm Muscle Rub,
Tiger Balm Liniment,
Tiger Headache Cure,
Tiger Mosquito Repellent,
Tiger Balm Arthritis Rub,
Tiger Balm Joint Rub,
Tiger Balm Muscle Spray,
Tiger Balm Refresher,
Tiger Balm Neck & Shoulder Rub,
Tiger Balm Neck & Shoulder
Rub Boost
Tiger Balm Back Pain Patch
Kwan Loong Brand Products
Kwan Loong Medicated Oil,
Kwan Loong Refresher
Leisure Facilities
Oceanariums
Underwater World Singapore*
Dolphin Lagoon
80 Siloso Road,
Sentosa
Singapore 098969
– aquarium building leasehold
Unexpired term: 10 years
* Properties used by the operations
are included in Property, Plant and
Equipment.
# Under construction.
Underwater World Pattaya Ltd*
22/22 Moo 11, Sukhumvit Road,
Nongprue, Banglamung,
Chonburi 20260
Thailand
– aquarium building leasehold
Unexpired term: 14 years
Chengdu Haw Par Oceanarium
Co. Ltd#
Bridge No.1
Hong Xing Bei Lu
Chenghua District
Chengdu, Sichuan Province
P. R. China
Properties
Haw Par Centre
180 Clemenceau Avenue
Singapore 239922
– commercial building six-storey
leasehold
Unexpired term: 44 years
Haw Par Glass Tower
178 Clemenceau Avenue
Singapore 239926
– commercial building
eight-storey leasehold
Unexpired term: 62 years
Haw Par Technocentre
401 Commonwealth Drive
Singapore 149598
– industrial building seven-storey
leasehold
Unexpired term: 55 years
Haw Par Tiger Balm Building*
2 Chia Ping Road
Singapore 619968
– industrial building nine-storey
leasehold
Unexpired term: 22 years
Menara Haw Par
Lot 242, Jalan Sultan Ismail
50250 Kuala Lumpur,
Malaysia
– commercial building thirty-two
storey freehold
Setron Building
10 Dundee Road
Singapore 149455
– industrial building eight-storey
leasehold
Unexpired term: 25 years
Westlands Centre
Unit 1405-1407
Westlands Centre
20 Westlands Road
Quarry Bay, Hong Kong
– offi ce & industrial units
999-year lease

HA
W P
AR
CO
RP
OR
AT
ION
LIM
ITE
D
An
nu
al
Re
po
rt 2
00
7
112
STATISTICS OFSHAREHOLDINGSAs at 10 March 2008
DISTRIBUTION OF SHAREHOLDINGS
Number of shares issued : 197,393,654
Class of shares : Ordinary
Voting rights : One vote per share
No. of No. of
Size of Holdings Shareholders % Shares %
1 – 999 16,841 77.36 2,044,247 1.03
1,000 – 10,000 4,348 19.97 12,154,715 6.16
10,001 – 1,000,000 566 2.60 24,653,097 12.49
1,000,001 and above 15 0.07 158,541,595 80.32
Total 21,770 100.00 197,393,654 100.00
TWENTY LARGEST SHAREHOLDERS
No. of
No. Name Shares %
1 DBS Nominees Pte Ltd 52,263,932 26.48
2 Wee Investments Private Limited 43,133,202 21.85
3 Tye Hua Nominees (Pte) Ltd 15,850,486 8.03
4 UOB Kay Hian Pte Ltd 11,498,345 5.83
5 Citibank Nominees Singapore Pte Ltd 5,757,817 2.92
6 United Overseas Bank Nominees Pte Ltd 5,736,137 2.91
7 HSBC (Singapore) Nominees Pte Ltd 4,295,241 2.18
8 DBSN Services Pte Ltd 4,054,131 2.05
9 United Overseas Insurance Limited – SHF 3,886,000 1.97
10 Wah Hin & Co Pte Ltd 3,320,596 1.68
11 Raffl es Nominees Pte Ltd 2,495,693 1.26
12 DB Nominees (S) Pte Ltd 2,194,691 1.11
13 C. Y. Wee & Co Pte Ltd 1,493,771 0.76
14 Ho Sim Guan 1,461,000 0.74
15 Merrill Lynch (Singapore) Pte Ltd 1,100,553 0.56
16 Wee Cho Yaw 972,583 0.49
17 Phillip Securities Pte Ltd 759,741 0.38
18 Morgan Stanley Asia (Singapore) Securities Pte Ltd 622,157 0.32
19 How Kok Kooi 522,000 0.26
20 Ho Han Leong Calvin 500,401 0.25
Total 161,918,477 82.03
FREE FLOAT
Based on the information available to the Company as at 10 March 2008, approximately 41% of the issued
ordinary shares of the Company is held by the public and therefore, the Company has complied with Rule 723
of the SGX-ST Listing Manual which requires at least 10% of equity securities (excluding preference shares
and convertible equity securities) in a class that is listed at all times held by the public.

HA
W P
AR
CO
RP
OR
AT
ION
LIM
ITE
D
An
nu
al
Re
po
rt 2
00
7
113
STATISTICS OFSHAREHOLDINGS
As at 10 March 2008
SUBSTANTIAL SHAREHOLDERS AS AT 10 MARCH 2008
No. of Shares held
Direct Deemed Total %
Wee Cho Yaw 993,067 58,312,001 59,305,068 30.04 (1), (2), (3)
Wee Ee Cheong 117,143 55,651,074 55,768,217 28.25 (1), (2), (4)
Wee Ee Lim 397,448 54,126,443 54,523,891 27.62 (1)
Wee Ee Chao 12,570 54,247,305 54,259,875 27.49 (1), (5)
Wee Investments Private Limited 43,132,542 – 43,132,542 21.85
Arnhold and S. Bleichroeder Advisers, LLC – 24,081,240 24,081,240 12.20 (7)
Mackenzie Cundill Investment
Management Ltd – 22,926,000 22,926,000 11.61 (8)
United Overseas Bank Limited – 19,735,034 19,735,034 10.00 (9)
Supreme Island Corporation 10,986,910 – 10,986,910 5.57
(1) Messrs Wee Cho Yaw, Wee Ee Cheong, Wee Ee Lim and Wee Ee Chao are deemed to be interested in
the shares held by Wee Investments Private Limited, Supreme Island Corporation and Kheng Leong Co
Pte Ltd.
(2) Messrs Wee Cho Yaw and Wee Ee Cheong are deemed to have an interest in the shares held by C. Y. Wee
& Co Pte Ltd.
(3) Mr Wee Cho Yaw is deemed to have an interest in the shares held by UOL Group Limited.
(4) Mr Wee Ee Cheong is deemed to have an interest in the shares held by E. C. Wee Pte Ltd.
(5) Mr Wee Ee Chao is deemed to have an interest in the shares held by Protheus Investment Holdings
Pte Ltd and KIP Investment Holdings Pte Ltd.
(6) Kheng Leong Co Pte Ltd, C. Y. Wee & Co Pte Ltd, UOL Group Limited, E. C. Wee Pte Ltd, Protheus
Investment Holdings Pte Ltd and KIP Investment Holdings Pte Ltd are not substantial shareholders of
the Company.
(7) Arnhold and S. Bleichroeder Advisers, LLC is an U.S. investment adviser, holding the shares on behalf of
its clients. One of its mutual funds, First Eagle Overseas Fund holds 18,160,000 shares, amounting to a
shareholding of 9.19%.
(8) Mackenzie Cundill Investment Management Ltd holds the shares in its capacity as investment counsel
on behalf of its advisory accounts. One of the accounts, Mackenzie Cundill Value Fund holds 18,778,000
shares, amounting to a shareholding of 9.51%.
(9) United Overseas Bank Limited is deemed to have an interest in the 15,849,034 shares held by Tye Hua
Nominees (Pte) Limited and 3,886,000 shares held by United Overseas Insurance Limited – SHF.

HA
W P
AR
CO
RP
OR
AT
ION
LIM
ITE
D
An
nu
al
Re
po
rt 2
00
7
114
NOTICE OFANNUAL GENERAL MEETING
NOTICE IS HEREBY GIVEN that the Thirty-Ninth Annual General Meeting of the Company will be held at
80 Raffl es Place, 61st Storey, UOB Plaza 1, Singapore 048624 on Wednesday, 23 April 2008 at 3.00 p.m. to
transact the following business:
AS ORDINARY BUSINESS
Resolution 1 To receive and adopt the Directors’ Report and Audited Financial Statements for the fi nancial
year ended 31 December 2007 together with the Auditors’ Report thereon.
Resolution 2 To declare a Second & Final Tax-Exempt (One-Tier) Dividend of 14 cents and a Special
(One-Tier) Dividend of 5 cents per share for the fi nancial year ended 31 December 2007.
To re-appoint the following Directors, who are retiring pursuant to Section 153(6) of the Companies Act, Cap.
50, to hold offi ce until the next Annual General Meeting of the Company:
Resolution 3 Mr Lim Kee Ming
Mr Lim is considered an independent Director.
Resolution 4 Mr Wee Cho Yaw
Mr Wee Cho Yaw will, upon re-appointment, continue as chairman of the Board and
Investment Committee and a member of the Nominating Committee and Remuneration
Committee of the Company.
Resolution 5 Dr Lee Suan Yew
Dr Lee Suan Yew will, upon re-appointment, continue as a member of the Audit Committee
and Nominating Committee of the Company. Dr Lee is considered as an independent
Director.
Resolution 6 Mr Hwang Soo Jin
Mr Hwang Soo Jin will, upon re-appointment, continue as a member of the Audit
Committee and Remuneration Committee of the Company. Mr Hwang is considered as an
independent Director.
HAW PAR CORPORATION LIMITED
(Incorporated in the Republic of Singapore)
Company Registration Number: 196900437M

HA
W P
AR
CO
RP
OR
AT
ION
LIM
ITE
D
An
nu
al
Re
po
rt 2
00
7
115
NOTICE OFANNUAL GENERAL MEETING
To re-elect the following Directors, who are retiring by rotation pursuant to Article 98 of the Company’s
Articles of Association:
Resolution 7 Mr Wee Ee Lim
Mr Wee Ee Lim will, upon re-election, continue as a member of the Investment Committee.
Resolution 8 Mr Sat Pal Khattar
Mr Sat Pal Khattar will, upon re-election, continue as chairman of the Nominating
Committee and Remuneration Committee of the Company. Mr Khattar is considered as
an independent Director.
Resolution 9 To approve Directors’ fees of $257,000 for the fi nancial year ended 31 December 2007
(2006: $257,000).
Resolution 10 To re-appoint Messrs PricewaterhouseCoopers as Auditors of the Company to hold offi ce
until the conclusion of the next Annual General Meeting and to authorise the Directors to fi x
their remuneration.
AS SPECIAL BUSINESS
To consider and, if thought fi t, pass the following ordinary resolutions:
Resolution 11 “That approval be and is hereby given to the Directors to offer and grant options in
accordance with the rules of the Haw Par Corporation Group 2002 Share Option Scheme
(“2002 Scheme”), and pursuant to Section 161 of the Companies Act, Cap. 50, to allot and
issue from time to time such number of shares in the Company as may be required to be
issued pursuant to the exercise of options under the 2002 Scheme provided always that the
aggregate number of shares to be issued pursuant to this resolution shall not exceed fi ve
per cent (5%) of the issued share capital of the Company from time to time.”
Resolution 12 “That pursuant to Section 161 of the Companies Act, Cap. 50, the Articles of Association of
the Company and the listing rules of the Singapore Exchange Securities Trading Limited,
approval be and is hereby given to the Directors to issue shares in the Company (whether by
way of rights, bonus or otherwise) at any time and upon such terms and conditions and for
such purposes and to such persons as the Directors may in their absolute discretion deem
fi t provided that the aggregate number of shares to be issued pursuant to this resolution
shall not exceed fi fty per cent (50%) of the issued share capital of the Company, of which
the aggregate number of shares to be issued other than on a pro-rata basis to members
of the Company shall not exceed twenty per cent (20%) of the issued share capital of the
Company, and for the purposes of this resolution, the issued share capital shall be the
Company’s issued share capital at the time this resolution is passed after adjusting for new
shares arising from the conversion of share options on issue at the time this resolution is
passed, and any subsequent consolidation or subdivision of the Company’s shares.”

HA
W P
AR
CO
RP
OR
AT
ION
LIM
ITE
D
An
nu
al
Re
po
rt 2
00
7
116
NOTICE OFANNUAL GENERAL MEETING
NOTICE OF CLOSURE OF BOOKS
NOTICE IS HEREBY GIVEN that the Share Transfer Books and Register of Members of the Company will
be closed on 16 May 2008.
Duly completed transfers received in respect of the shares of the Company by the Company’s Share
Registrar, Boardroom Corporate & Advisory Services Pte Ltd at 3 Church Street, #08-01, Samsung Hub,
Singapore 049483 up to 5.00 p.m. on 15 May 2008 will be registered to determine members’ entitlement
to the proposed Second & Final dividend and the Special dividend. Members whose securities accounts
with The Central Depository (Pte) Ltd which are credited with shares of the Company as at 5.00 p.m. on
15 May 2008 will be entitled to such proposed dividend.
The proposed Second & Final dividend and the Special dividend, if approved by members, will be payable
on 30 May 2008.
By Order of the Board
Tan Thiam Hee
Company Secretary
Singapore
1 April 2008

HA
W P
AR
CO
RP
OR
AT
ION
LIM
ITE
D
An
nu
al
Re
po
rt 2
00
7
117
NOTICE OFANNUAL GENERAL MEETING
Notes to Resolutions 2, 3 to 8, 11 and 12
Resolution 2 Together with the interim tax-exempt (one-tier) dividend of 6 cents per share paid on 6
September 2007 and subject to shareholders’ approval on the second & fi nal tax-exempt
(one-tier) dividend of 14 cents and a special (one-tier) dividend of 5 cents per share, the total
tax-exempt (one-tier) dividend for the fi nancial year ended 31 December 2007 would be 25
cents per share. (2006: 20 cents tax-exempt (one-tier)).
Resolutions Further information on the Directors can be found in the Board of Directors section of this
3 to 8 Annual Report.
Resolution 11 is to empower the Directors to allot and issue shares pursuant to the Haw Par Corporation
Group 2002 Share Option Scheme (“2002 Scheme”) which was approved at the
Extraordinary General Meeting of the Company on 22 May 2002. A copy of the Rules of
the 2002 Scheme is available for inspection by members during normal business hours
at the registered offi ce of the Company at 401 Commonwealth Drive, #03-03 Haw Par
Technocentre, Singapore 149598.
Resolution 12 is to empower the Directors to issue shares in the Company, subject to the limits contained in
the resolution. Unless revoked or varied by the Company in general meetings, such authority
shall remain in force until the conclusion of the next Annual General Meeting of the Company
or the date by which the next Annual General Meeting of the Company is required by law to
be held, whichever is the earlier. The Directors would only issue shares under this resolution
where they consider it appropriate and in the interest of the Company to do so.
Notes:
(1) A member entitled to attend and vote at the meeting is entitled to appoint one or two proxy/proxies to
attend and vote in his/her stead. A proxy need not be a member of the Company.
(2) To be effective, the Proxy Form must be deposited at the registered office of the Company at
401 Commonwealth Drive, #03-03 Haw Par Technocentre, Singapore 149598, not less than 48 hours
before the time set for holding the meeting.

This page has been left blank intentionally.

IMPORTANT
1. For investors who have used their CPF monies to buy shares of Haw Par Corporation Limited, this annual report is forwarded to them at the request of their CPF Approved Nominees and is sent solely FOR INFORMATION ONLY.
2. This Proxy Form is not valid for use by CPFIS investors and shall be ineffective for all intents and purposes if used or purported to be used by them.
3. CPFIS Investors who wish to vote should contact their CPF Approved Nominees.
I/We, ____________________________________________________________________________________ (Name)
of _____________________________________________________________________________________ (Address)
being a member/members of the Company, hereby appoint:
NAME ADDRESS NRIC/ PASSPORT NO.PROPORTION OF
SHAREHOLDINGS (%)
(a)
And/or (delete as appropriate)
(b)
as my/our proxy/proxies to attend and vote for me/us and on my/our behalf at the Thirty-Ninth Annual
General Meeting of the Company to be held on Wednesday, 23 April 2008 at 3.00 p.m. and at any
adjournment thereof.
(Please indicate with a “X” in the spaces provided whether you wish your votes to be cast for or against
the Ordinary Resolutions as set out in the Notice of Annual General Meeting. In the absence of specifi c
directions, your proxy/proxies may vote or abstain as he/she may think fi t.)
NO. RESOLUTION FOR AGAINST
ORDINARY BUSINESS
1Adoption of Financial Statements and Reports of the Directors
and Auditors
2Declaration of Second and Final Dividend and the Special
Dividend
3 Re-appointment of Mr Lim Kee Ming
4 Re-appointment of Mr Wee Cho Yaw
5 Re-appointment of Dr Lee Suan Yew
6 Re-appointment of Mr Hwang Soo Jin
7 Re-election of Mr Wee Ee Lim
8 Re-election of Mr Sat Pal Khattar
9 Approval of Directors’ fees
10 Re-appointment of PricewaterhouseCoopers as Auditors
SPECIAL BUSINESS
11 Authority to issue shares (Share Options)
12 Authority to issue shares (General)
Dated this _________________ day of _________________ 2008
Signature(s) or Common Seal of Member(s)
HAW PAR CORPORATION LIMITED
(Incorporated in the Republic of Singapore)
Company Registration Number: 196900437M
THIRTY-NINTH ANNUAL GENERAL MEETING
(Before completing this form, please read the notes behind.)
Number of shares held:
Scrip-based
Scripless
PROXY FORM

Notes:
1. Please insert at the top right hand corner of this Proxy Form the number of scrip-based shares in the
Company registered in your name in the Register of Members and the number of scripless shares in the
Company entered against your name in the Depository Register maintained by The Central Depository
(Pte) Limited ("CDP") in respect of the shares in your securities account with CDP. If no number is inserted,
this Proxy Form shall be deemed to relate to all the shares held by you.
2. A member entitled to attend and vote at the meeting is entitled to appoint one or two proxy/proxies to
attend and vote in his/her stead. A proxy need not be a member of the Company.
3. A member is not entitled to appoint more than two proxies to attend and vote on his/her behalf. Where a
member appoints two proxies, the appointments shall be invalid unless he/she specifi es the proportion
of his/her shareholding (expressed as a percentage of the whole) to be represented by each proxy.
4. The sending of a Proxy Form by a shareholder does not preclude him/her from attending and voting
in person at the Annual General Meeting if he/she fi nds that he/she is able to do so. In such event, the
relevant Proxy Form will be deemed to be revoked.
5. To be effective, this Proxy Form must be deposited at the registered offi ce of the Company at 401
Commonwealth Drive, #03-03 Haw Par Technocentre, Singapore 149598, not less than 48 hours before
the time set for holding the meeting.
6. This Proxy Form must be signed by the appointor or by his/her attorney. In the case of a corporation, this
form must be executed under its common seal or signed by its duly authorised attorney or offi cer. In the
case of joint holders, all holders must sign this form.
7. Any alteration made in this Proxy Form should be initialled by the person who signs it.
8. The Company shall be entitled to reject this Proxy Form if it is incomplete, improperly completed or
illegible or where the true intentions of the appointor is not ascertainable from the instructions of the
appointor specifi ed in the form. In the case of members whose shares are entered against their names
in the Depository Register, the Company may reject any proxy form lodged if such members are not
shown to have the corresponding number of shares in the Company entered against their names in the
Depository Register as at 48 hours before the time set for holding the meeting or the adjourned meeting,
as appropriate.
9. Agent banks acting on the requests of the CPFIS investors who wish to attend the Annual General
Meeting as observers are requested to submit in writing, a list with details of the investors’ names, NRIC/
Passport numbers, addresses and number of shares held. The list, signed by an authorised signatory of
the Agent Bank, should reach the Company’s Registrar, Boardroom Corporate & Advisory Services Pte
Ltd at 3 Church Street #08-01 Samsung Hub Singapore 049483, not less than 48 hours before the time
set for holding the meeting.

GROUP OF
COMPANIES
CORE OPERATIONS
Healthcare
Haw Par Healthcare Limited
Tiger Balm (Malaysia) Sdn. Bhd.
Haw Par Tiger Balm (Philippines), Inc.
Tiger Medicals (Taiwan) Limited
Xiamen Tiger Medicals Co., Ltd.
Haw Par Elder (India) Private Limited
Haw Par Tiger Balm (Thailand) Limited
PT. Haw Par Healthcare
Leisure
Haw Par Leisure Pte Ltd
Underwater World Singapore Pte Ltd
Underwater World Pattaya Ltd
Chengdu Haw Par Oceanarium Co. Ltd
PROPERTY & INVESTMENTS
Property
Haw Par Properties (Singapore) Private Limited
Haw Par Centre Private Ltd
Setron Limited
Haw Par Land (Malaysia) Sdn. Bhd.
Investments
Haw Par Investment Holdings Private Limited
Straits Maritime Leasing Private Limited
Pickwick Securities Private Limited
Haw Par Equities Pte Ltd
Haw Par Trading Pte Ltd
M & G Maritime Services Pte Ltd
Haw Par Capital Pte Ltd
Haw Par Securities (Private) Limited
Haw Par International Limited
Associated Companies
Hua Han Bio-Pharmaceutical Holdings Limited (20.84%)
UIC Technologies Pte Ltd (40%)
CONTENTS
1 Corporate Profi le
2 Chairman’s Statement
6 Board of Directors
11 Corporate Information
12 Key & Senior Executives
14 Group Financial Highlights
16 Five-Year Financial Summary
18 Operations Review
26 People & The Community
28 Financial Review
33 Share Price & Trading Volume
34 Corporate Governance Report
41 Statutory Reports & Financial Statements
107 Financial Calendar
108 Group Offi ces
110 Management Listing
111 Major Products & Services
112 Statistics of Shareholdings
114 Notice of Annual General Meeting
119 Proxy Form

HA
W P
AR
CO
RP
OR
AT
ION
LIM
ITE
D A
nnual R
ep
ort 2
00
7
HAW PAR CORPORATION LIMITED
Annual Report 2007
HAW PAR CORPORATION LIMITED(Incorporated in the Republic of Singapore)
Company Registration Number: 196900437M
401 Commonwealth Drive
#03-03 Haw Par Technocentre
Singapore 149598
Tel: 6337 9102 Fax: 6336 9232
www.hawpar.com