hawai’i pacific health...net decrease in project funds held by trustee under bond indenture...
TRANSCRIPT
Ernst & Young LLP
C O N S O L I D A T E D F I N A N C I A L S T A T E M E N T S A N D S U P P L E M E N T A R Y I N F O R M A T I O N
Hawai’i Pacific Health Years Ended June 30, 2017 and 2016 With Report of Independent Auditors

Hawai’i Pacific Health
Consolidated Financial Statements and Supplementary Information
Years Ended June 30, 2017 and 2016
Contents
Report of Independent Auditors.......................................................................................................1
Consolidated Financial Statements
Consolidated Balance Sheets ...........................................................................................................3 Consolidated Statements of Unrestricted Revenues,
Expenses and Other Changes in Net Assets .................................................................................5 Consolidated Statements of Cash Flows ..........................................................................................7 Notes to Consolidated Financial Statements ....................................................................................9
Supplementary Information
Members of the Hawai’i Pacific Health Obligated Group: Combined Balance Sheets ...........................................................................................................59 Combined Statements of Unrestricted Revenues,
Expenses and Other Changes in Net Assets ............................................................................61 Combined Statements of Cash Flows .........................................................................................63 Note to Supplementary Information ...........................................................................................65

A member firm of Ernst & Young Global Limited
Ernst & Young LLP Harbor Court C-120 Suite 1900 55 Merchant Street Honolulu, HI 96813
Tel: +1 808 531 2037 Fax: +1 808 535 6888 ey.com
1
Report of Independent Auditors
The Board of Directors Hawai’i Pacific Health
We have audited the accompanying consolidated financial statements of Hawai’i Pacific Health, which comprise the consolidated balance sheets as of June 30, 2017 and 2016, and the related consolidated statements of unrestricted revenues, expenses and other changes in net assets and cash flows for the years then ended, and the related notes to the consolidated financial statements.
Management’s Responsibility for the Financial Statements
Management is responsible for the preparation and fair presentation of these financial statements in conformity with U.S. generally accepted accounting principles; this includes the design, implementation and maintenance of internal control relevant to the preparation and fair presentation of financial statements that are free of material misstatement, whether due to fraud or error.
Auditor’s Responsibility
Our responsibility is to express an opinion on these financial statements based on our audits. We conducted our audits in accordance with auditing standards generally accepted in the United States. Those standards require that we plan and perform the audit to obtain reasonable assurance about whether the financial statements are free of material misstatement.
An audit involves performing procedures to obtain audit evidence about the amounts and disclosures in the financial statements. The procedures selected depend on the auditor’s judgment, including the assessment of the risks of material misstatement of the financial statements, whether due to fraud or error. In making those risk assessments, the auditor considers internal control relevant to the entity’s preparation and fair presentation of the financial statements in order to design audit procedures that are appropriate in the circumstances, but not for the purpose of expressing an opinion on the effectiveness of the entity’s internal control. Accordingly, we express no such opinion. An audit also includes evaluating the appropriateness of accounting policies used and the reasonableness of significant accounting estimates made by management, as well as evaluating the overall presentation of the financial statements.
We believe that the audit evidence we have obtained is sufficient and appropriate to provide a basis for our audit opinion.

A member firm of Ernst & Young Global Limited
2
Opinion
In our opinion, the financial statements referred to above present fairly, in all material respects, the consolidated financial position of Hawai’i Pacific Health at June 30, 2017 and 2016, and the consolidated results of its operations and its cash flows for the years then ended in conformity with U.S. generally accepted accounting principles.
Supplementary Information
Our audits were conducted for the purpose of forming an opinion on the consolidated financial statements as a whole. The accompanying Members of the Hawai’i Pacific Health Obligated Group combined financial statements are presented for purposes of additional analysis and are not a required part of the financial statements. Such information is the responsibility of management and was derived from and relates directly to the underlying accounting and other records used to prepare the consolidated financial statements. The information has been subjected to the auditing procedures applied in the audits of the consolidated financial statements and certain additional procedures, including comparing and reconciling such information directly to the underlying accounting and other records used to prepare the financial statements or to the financial statements themselves, and other additional procedures in accordance with auditing standards generally accepted in the United States. In our opinion, the information is fairly stated, in all material respects, in relation to the consolidated financial statements as a whole.
October 18, 2017

3
2017 2016Assets Current assets:
Cash and cash equivalents 173,211,819$ 161,276,282$ Patient accounts receivable, less allowance for uncollectible
accounts (2017 – $7,212,000; 2016 – $7,537,000) 161,432,708 174,492,455 Due from third-party payors 13,459,316 3,075,192 Other receivables 20,296,989 20,542,847 Inventories 18,262,247 17,042,657 Funds held by trustee under bond indenture agreement 19,922,004 18,865,059 Prepaid expenses and other 11,590,674 4,924,650
Total current assets 418,175,757 400,219,142
Assets whose use is limited or restricted: Board-designated 257,865,754 234,728,842 Funds held by trustee under bond indenture agreement 15,605,698 16,586,274 Restricted by donor or grantor 16,170,215 46,156,769
Total assets whose use is limited or restricted 289,641,667 297,471,885
Investments 277,649,190 238,275,035 Property and equipment, net 552,017,375 538,414,364 Due from third-party payors 6,417,047 12,117,189
Other assets: Investments in joint ventures 15,421,488 8,031,500 Other 46,012,644 44,178,553
61,434,132 52,210,053 Total assets 1,605,335,168$ 1,538,707,668$
Hawai’i Pacific Health
Consolidated Balance Sheets
June 30
4
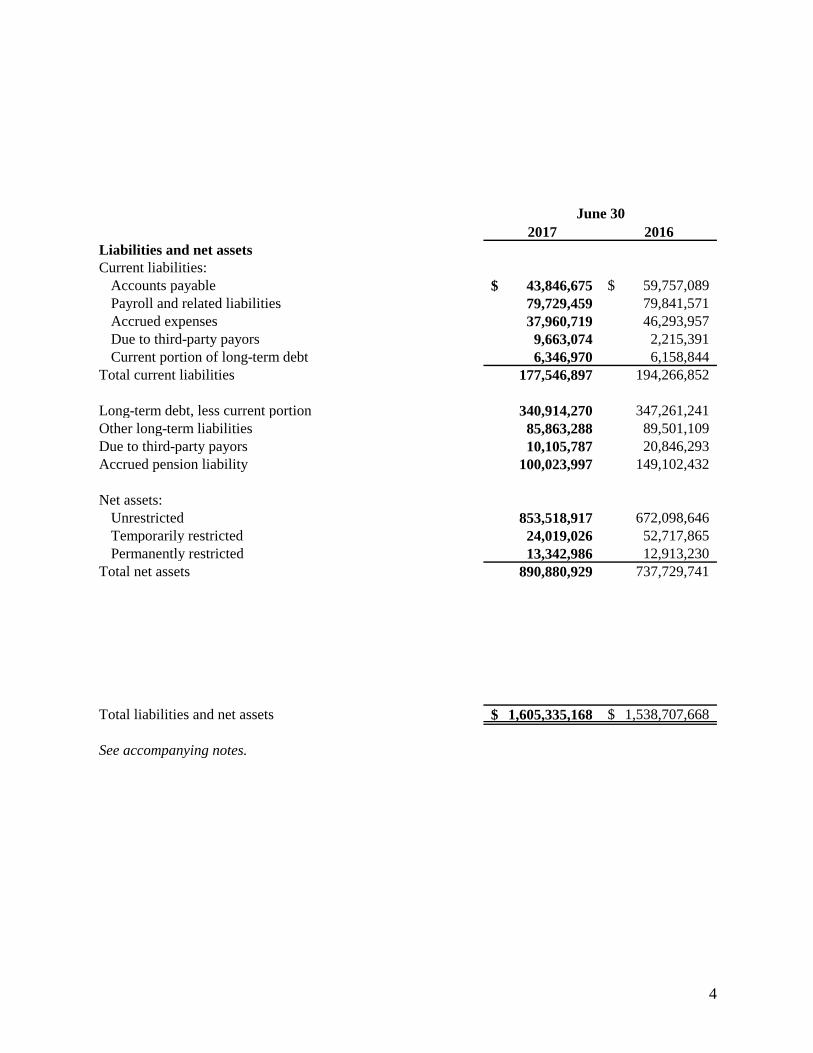
2017 2016Liabilities and net assets Current liabilities:
Accounts payable 43,846,675$ 59,757,089$ Payroll and related liabilities 79,729,459 79,841,571 Accrued expenses 37,960,719 46,293,957 Due to third-party payors 9,663,074 2,215,391 Current portion of long-term debt 6,346,970 6,158,844
Total current liabilities 177,546,897 194,266,852
Long-term debt, less current portion 340,914,270 347,261,241 Other long-term liabilities 85,863,288 89,501,109 Due to third-party payors 10,105,787 20,846,293 Accrued pension liability 100,023,997 149,102,432
Net assets:
Unrestricted 853,518,917 672,098,646 Temporarily restricted 24,019,026 52,717,865 Permanently restricted 13,342,986 12,913,230
Total net assets 890,880,929 737,729,741
Total liabilities and net assets 1,605,335,168$ 1,538,707,668$ See accompanying notes.
June 30

5
2017 2016Unrestricted revenues Net patient service revenue 1,253,414,966$ 1,216,632,449$ Provision for bad debts (20,319,285) (24,796,457) Net patient service revenue less provision for bad debts 1,233,095,681 1,191,835,992 Premium revenue 12,856,941 11,467,109 Other revenues 27,160,907 30,407,972 Temporarily restricted net assets released from restrictions
for operations 16,893,408 12,780,326 Total unrestricted revenues 1,290,006,937 1,246,491,399
Expenses Salaries and employee benefits 725,928,326 709,523,215 Services 157,336,253 142,861,059 Supplies 175,368,101 162,922,122 Other purchases 68,136,814 75,432,733 Depreciation and amortization 55,220,500 48,883,101 Specific purpose projects/donations 16,893,408 12,780,326 Interest 18,790,552 12,299,197 Loss on disposal of property and equipment 98,139 304,980 Other 14,902,598 13,445,361 Total expenses 1,232,674,691 1,178,452,094 Operating income 57,332,246 68,039,305 Joint venture investment income 3,073,147 3,114,076 Other nonoperating income 495,734 240,792 Investment income (loss) 29,761,132 (13,823,136) Gain on sale of joint venture, net of taxes 6,532,674 - 39,862,687 (10,468,268) Excess of revenues over expenses 97,194,933 57,571,037 Change in net unrealized gains on investments 14,487,454 8,214,617 Temporarily restricted net assets released from restrictions
for purchase of property and equipment 34,991,823 1,738,139 Change in funded status of pension plan 31,313,343 (37,324,004) Change in interest rate swap value 3,897,171 (2,705,794) Other changes in net assets (464,453) (362,926) Increase in unrestricted net assets 181,420,271 27,131,069
Continued to next page
Hawai’i Pacific Health
Consolidated Statements of Unrestricted Revenues,
Year Ended June 30
Expenses and Other Changes in Net Assets

6
2017 2016Temporarily restricted net assets Restricted grants and contributions 21,719,296$ 17,272,707$ Investment income (loss) 713,582 (642,118) Change in net unrealized gains on investments 819,514 16,920 Net assets released from restrictions (51,885,231) (14,518,465) Other changes in temporarily restricted net assets (66,000) 65,011 (Decrease) increase in temporarily restricted net assets (28,698,839) 2,194,055 Permanently restricted net assets Restricted grants and contributions 171,740 268,633 Change in beneficial interest in perpetual trusts 258,016 (355,350) Increase (decrease) in permanently restricted net assets 429,756 (86,717) Increase in net assets 153,151,188 29,238,407 Net assets at beginning of year 737,729,741 708,491,334 Net assets at end of year 890,880,929$ 737,729,741$
See accompanying notes.
Hawai’i Pacific Health
Consolidated Statements of Unrestricted Revenues,
Year Ended June 30
Expenses and Other Changes in Net Assets (continued)

7
2017 2016Operating activities Increase in net assets 153,151,188$ 29,238,407$ Adjustments to reconcile the increase in net assets
to net cash provided by operating activities: Depreciation and amortization 55,220,500 48,883,101 Provision for bad debts 20,319,285 24,796,457 Joint venture investment income (3,073,147) (3,114,076) Gain on sale of joint venture, net of taxes (6,532,674) – Net (gains) losses on alternative investments (21,185,486) 7,924,378 Change in net unrealized gains on investments (15,306,968) (8,231,537) Realized (gains) losses on investments (2,183,962) 13,900,455 Loss on disposition of property and equipment 98,139 304,980 Temporarily and permanently restricted contributions (21,891,036) (17,541,340) Changes in operating assets and liabilities:
Patient accounts receivable (7,259,538) (28,531,753) Due to/from third-party payors (7,976,805) 13,088,238 Other receivables 245,858 (2,329,388) Inventories and other assets (9,719,705) (14,250,603) Restricted pledges receivable 5,990,537 3,010,537 Accounts payable and accrued expenses (20,210,018) 23,781,366 Other long-term liabilities (3,637,821) 7,837,711 Accrued pension liability (49,078,435) 26,206,369
Net cash provided by operating activities 66,969,912 124,973,302
Investing activities Purchases of property and equipment (76,845,131) (134,104,707) Net distributions from joint venture partnerships 5,993,568 2,630,338 Purchases of investment securities (182,394,690) (157,205,192) Sales and maturities of investment securities 162,089,892 102,836,815 Assets whose use is limited or restricted:
Increase in funds held by trustee under bond indenture agreement (76,369) (1,624,506)
Net increase (decrease) in cash and cash equivalents 24,474,011 (3,780,643) Purchases of investment securities (146,066,317) (109,993,695) Sales and maturities of investment securities 142,058,470 107,660,261 Net decrease in project funds held by trustee
under bond indenture agreement – 35,381,214 Net cash used in investing activities (70,766,566) (158,200,115)
Continued to next page.
Hawai’i Pacific Health
Consolidated Statements of Cash Flows
Year Ended June 30

8
2017 2016Financing activities Payment of long-term debt (6,158,845)$ (6,000,689)$ Temporarily and permanently restricted contributions 21,891,036 17,541,340 Net cash provided by financing activities 15,732,191 11,540,651 Increase (decrease) in cash and cash equivalents 11,935,537 (21,686,162) Cash and cash equivalents at beginning of year 161,276,282 182,962,444 Cash and cash equivalents at end of year 173,211,819$ 161,276,282$
Non-cash activityProperty and equipment and accrued expenses 2,595,270$ 10,518,751$ See accompanying notes.
Hawai’i Pacific Health
Consolidated Statements of Cash Flows (continued)
Year Ended June 30

9
Hawai’i Pacific Health
Notes to Consolidated Financial Statements
June 30, 2017
1. Organization and Summary of Accounting Policies
Hawai’i Pacific Health (HPH) is the sole member of Kapi’olani Medical Center for Women and Children (KMCWC), Pali Momi Medical Center (PMMC), Pali Momi Foundation, Kapi’olani Medical Specialists, Providers Insurance Corporation (PIC), Kapi’olani Health Foundation (KHF), Straub Clinic & Hospital (SCH), Straub Foundation, Wilcox Memorial Hospital (WMH), Kauai Medical Clinic, Wilcox Health Foundation, Hawai’i Pacific Health Partners, Inc., Hawai’i Health Partners and other smaller healthcare-related entities (some of which are for-profit) located in Hawaii. HPH and the above affiliates are collectively referred to as “the Company” and are consolidated in the accompanying consolidated financial statements. All inter-organizational transactions and balances have been eliminated in consolidation.
Except with regard to unrelated business income (UBI), which is taxed at corporate income tax rates, the Company’s not-for-profit organizations are (a) exempt from federal and state income taxes pursuant to Internal Revenue Code Section 501(a) and applicable state laws and (b) generally exempt from Hawaii general excise tax on revenue related to their tax-exempt purpose.
The taxable affiliates of the Company utilize the liability method of accounting for income taxes. Under this method, deferred income tax assets and liabilities are determined based on differences between the financial reporting and tax basis of assets and liabilities and are measured using the currently enacted tax rates and laws. Valuation allowances are used to reduce deferred tax assets to their estimated net realizable values and are established by management when it is more likely than not that a deferred tax asset will not be realized.
The accounting principles followed by the Company and the methods of applying those principles comply with accounting principles generally accepted in the United States and general practice within the healthcare industry. The significant policies are summarized below.
Cash Equivalents
Highly liquid investments with a maturity of three months or less when purchased are considered to be cash equivalents.
Inventories
Inventories, consisting of medical, surgical and other supplies, are stated at the lower of cost (first-in, first-out method) or market.

Hawai’i Pacific Health
Notes to Consolidated Financial Statements (continued)
10
1. Organization and Summary of Accounting Policies (continued)
Property and Equipment
Property and equipment acquisitions are recorded at cost. Depreciation is computed using the straight-line method over the estimated useful lives of the assets, ranging from 2 to 75 years for buildings and improvements, and 3 to 20 years for equipment. Equipment under capital lease obligations is amortized on the straight-line method over the shorter period of the lease term or the estimated useful life of the equipment. Such amortization is included in depreciation and amortization in the consolidated statements of unrestricted revenues, expenses and other changes in net assets. Interest incurred on borrowed funds during the period of construction of capital assets is capitalized as a component of the cost of acquiring those assets.
Gifts of long-lived assets such as land, buildings, or equipment are reported as unrestricted support and are excluded from the excess of revenues over expenses. Gifts of long-lived assets with explicit restrictions that specify how the assets are to be used, and gifts of cash or other assets that must be used to acquire long-lived assets, are reported as restricted support. Absent explicit donor stipulations about how long those long-lived assets must be maintained, expirations of donor restrictions are reported within unrestricted net assets when the donated or acquired long-lived assets are placed in service.
Investments
Investments in equity securities with readily determinable fair values, and all investments in debt securities, are measured at fair value in the consolidated balance sheets. Fair value is established based on quoted prices from established securities exchanges or based on quoted market prices of similar instruments. The Company determined that all marketable securities held at June 30, 2017 and 2016, are designated as other than trading. Accordingly, unrealized gains and losses on investments, except for other-than-temporary declines in fair value, are excluded from the excess of revenues over expenses.
The Company also holds investments in fund of funds and direct funds, which include private equities and limited partnerships that are classified as alternative investments. These alternative investments seek positive returns regardless of market direction and are not restricted to any particular asset class. At the investment managers’ direction, these alternative investments may invest in both registered and non-registered securities in the U.S. and globally, with exposure to both emerging and developed markets. The investment managers employ a range of investment strategies, including but not limited to long/short equity positions, derivatives, forward and futures contracts, and currency hedges.
Hawai’i Pacific Health
Notes to Consolidated Financial Statements (continued)
11
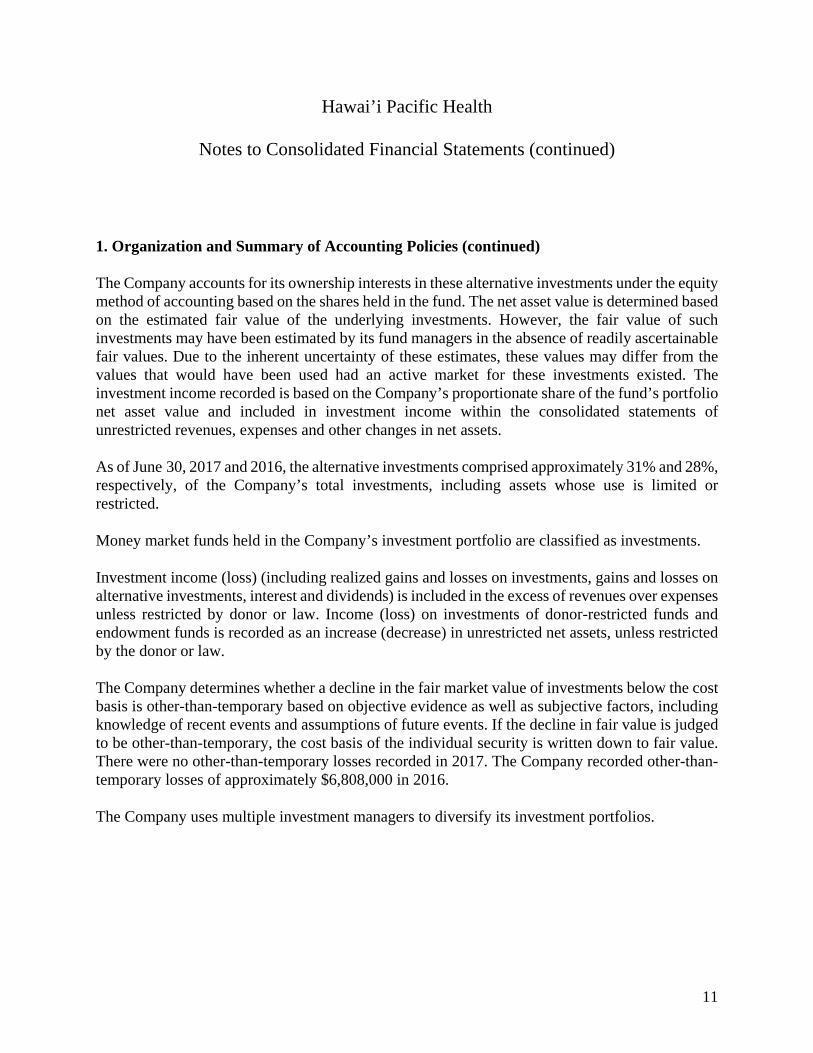
1. Organization and Summary of Accounting Policies (continued)
The Company accounts for its ownership interests in these alternative investments under the equity method of accounting based on the shares held in the fund. The net asset value is determined based on the estimated fair value of the underlying investments. However, the fair value of such investments may have been estimated by its fund managers in the absence of readily ascertainable fair values. Due to the inherent uncertainty of these estimates, these values may differ from the values that would have been used had an active market for these investments existed. The investment income recorded is based on the Company’s proportionate share of the fund’s portfolio net asset value and included in investment income within the consolidated statements of unrestricted revenues, expenses and other changes in net assets.
As of June 30, 2017 and 2016, the alternative investments comprised approximately 31% and 28%, respectively, of the Company’s total investments, including assets whose use is limited or restricted.
Money market funds held in the Company’s investment portfolio are classified as investments.
Investment income (loss) (including realized gains and losses on investments, gains and losses on alternative investments, interest and dividends) is included in the excess of revenues over expenses unless restricted by donor or law. Income (loss) on investments of donor-restricted funds and endowment funds is recorded as an increase (decrease) in unrestricted net assets, unless restricted by the donor or law.
The Company determines whether a decline in the fair market value of investments below the cost basis is other-than-temporary based on objective evidence as well as subjective factors, including knowledge of recent events and assumptions of future events. If the decline in fair value is judged to be other-than-temporary, the cost basis of the individual security is written down to fair value. There were no other-than-temporary losses recorded in 2017. The Company recorded other-than-temporary losses of approximately $6,808,000 in 2016.
The Company uses multiple investment managers to diversify its investment portfolios.

Hawai’i Pacific Health
Notes to Consolidated Financial Statements (continued)
12
1. Organization and Summary of Accounting Policies (continued)
Investments in joint ventures that are 20%–50% owned or where the Company has the ability to exercise significant influence over the operating and financial activities of the joint venture are recorded under the equity method of accounting, which approximates the Company’s equity in its underlying net book values. Investments in joint ventures that are more than 50% owned or where the Company can exert control are consolidated in the accompanying consolidated financial statements.
At June 30, the investments in joint ventures include ownership in the following organizations:
Ownership Percentage 2017 2016 Pacific ASC, LLC 50.00% –% Invision LLC 40.00 40.00 The Cancer Center of Hawaii, LLC 30.56 38.89 Pacific Medical Collections, Inc. 33.33 33.33 United Holdings, LLC 17.38 17.38
The carrying value of the investment in Pacific ASC, LLC., as reported in the accompanying consolidated balance sheets, is approximately $9,754,000 as of June 30, 2017. Included in the carrying value is approximately $8,640,000 in equity method goodwill representing the difference between the Company’s carrying value and its share of Pacific ASC, LLC equity. Management evaluates the investment for impairment and has not recorded an impairment loss as of June 30, 2017.
In July 2016, United Holdings, LLC sold all interest in its subsidiary companies. The Company recognized a gain of approximately $6,500,000 from the sale which is reported as gain on sale of joint venture, net of taxes, in the accompanying consolidated financial statements.

Hawai’i Pacific Health
Notes to Consolidated Financial Statements (continued)
13
1. Organization and Summary of Accounting Policies (continued)
Summarized financial information (unaudited) for significant, unconsolidated joint ventures is as follows:
June 30 2017 2016 Current assets $ 12,210,000 $ 17,304,000 Non-current assets 18,552,000 56,426,000 Total assets $ 30,762,000 $ 73,730,000 Current liabilities $ 2,607,000 $ 12,026,000 Non-current liabilities 9,626,000 40,160,000 Capital 18,529,000 21,544,000 Total liabilities and capital $ 30,762,000 $ 73,730,000
Year Ended June 30 2017 2016 Excess of revenues over expenses $ 68,041,000 $ 11,806,000
Board-Designated Assets
Board-designated assets consist of unrestricted investments and accumulated income which have been designated by the Board of Directors for expansion and support of fundraising activities. The Board of Directors can redesignate these assets at its discretion.
Contributions
Contributions received, including unconditional promises to give, are recognized as revenue at fair value in the period received. Fair value is measured as the present value of estimated cash flows using a discount rate commensurate with the risks involved. Pledges receivable are stated at their estimated net realizable value and are included in other receivables and assets whose use is limited or restricted – restricted by donor or grantor in the accompanying consolidated balance sheets.

Hawai’i Pacific Health
Notes to Consolidated Financial Statements (continued)
14
1. Organization and Summary of Accounting Policies (continued)
The pledges receivable are as follows:
June 30 2017 2016 Receivable in less than one year $ 4,098,480 $ 4,637,796 Receivable in one to five years 3,843,024 4,431,685 Thereafter 1,102,683 1,482,200 9,044,187 10,551,681 Less: present value discount 264,889 455,022 Less: allowance for uncollectible pledges 1,005,655 22,883 $ 7,773,643 $ 10,073,776
Temporarily and Permanently Restricted Net Assets
Restricted net assets consist of donations and other funds where donor restrictions have been imposed as to their use for specific purposes. Temporarily restricted net assets consist of those net assets whose use by the Company has been limited by donors to a specific purpose or time period. When a donor-stipulated time restriction ends or a purpose restriction is accomplished, temporarily restricted net assets are reclassified to unrestricted net assets and reported in the consolidated statements of unrestricted revenues, expenses and other changes in net assets as net assets released from restrictions. Permanently restricted net assets consist of the principal amount of net assets whose use by donors has been restricted in perpetuity. Investment income related to permanently restricted net assets is reported as temporarily restricted in the consolidated statements of unrestricted revenues, expenses and other changes in net assets in accordance with donor designation.
Net Patient Service Revenue, Provision for Bad Debts, Premium Revenue, and Patient Accounts Receivable
Net patient service revenue associated with services provided to patients who have third-party coverage is recognized on the basis of contractual rates for services rendered, including retroactive adjustments in accordance with third-party payor agreements. For uninsured patients that do not qualify for charity, net patient service revenues is recognized on the basis of its standard rates less financial assistance policy discounts.
Hawai’i Pacific Health
Notes to Consolidated Financial Statements (continued)
15
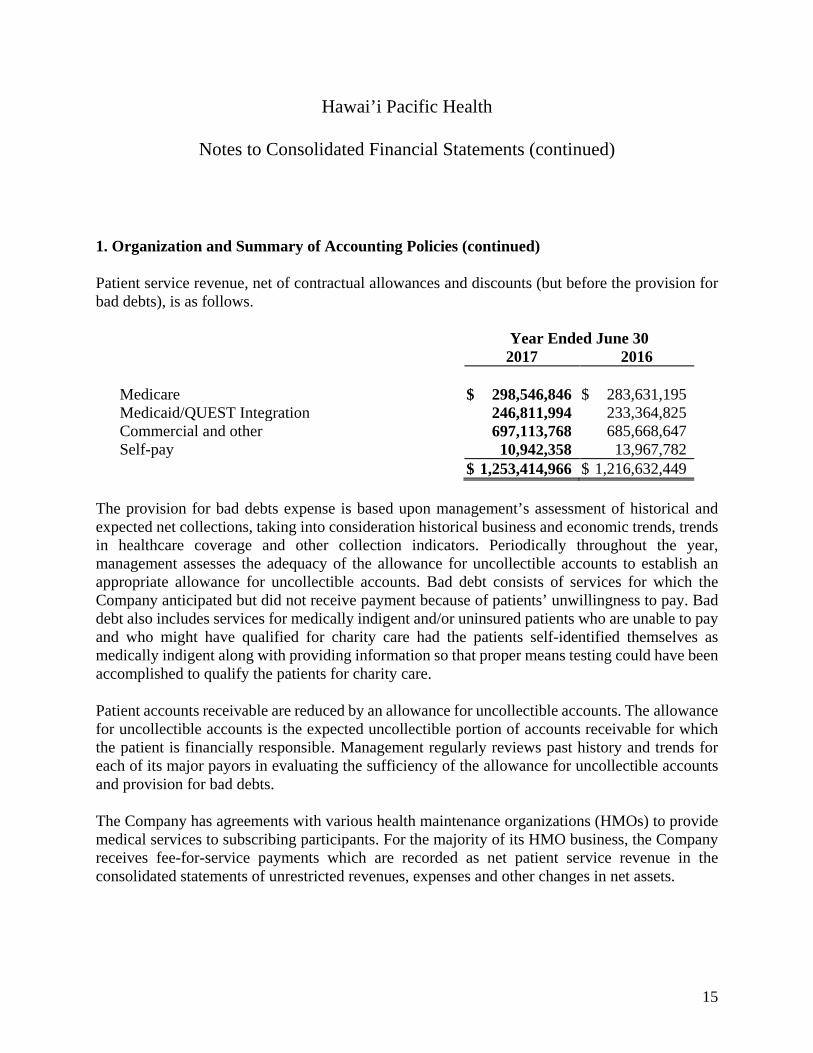
1. Organization and Summary of Accounting Policies (continued)
Patient service revenue, net of contractual allowances and discounts (but before the provision for bad debts), is as follows.
Year Ended June 30 2017 2016 Medicare $ 298,546,846 $ 283,631,195 Medicaid/QUEST Integration 246,811,994 233,364,825 Commercial and other 697,113,768 685,668,647 Self-pay 10,942,358 13,967,782 $ 1,253,414,966 $ 1,216,632,449
The provision for bad debts expense is based upon management’s assessment of historical and expected net collections, taking into consideration historical business and economic trends, trends in healthcare coverage and other collection indicators. Periodically throughout the year, management assesses the adequacy of the allowance for uncollectible accounts to establish an appropriate allowance for uncollectible accounts. Bad debt consists of services for which the Company anticipated but did not receive payment because of patients’ unwillingness to pay. Bad debt also includes services for medically indigent and/or uninsured patients who are unable to pay and who might have qualified for charity care had the patients self-identified themselves as medically indigent along with providing information so that proper means testing could have been accomplished to qualify the patients for charity care.
Patient accounts receivable are reduced by an allowance for uncollectible accounts. The allowance for uncollectible accounts is the expected uncollectible portion of accounts receivable for which the patient is financially responsible. Management regularly reviews past history and trends for each of its major payors in evaluating the sufficiency of the allowance for uncollectible accounts and provision for bad debts.
The Company has agreements with various health maintenance organizations (HMOs) to provide medical services to subscribing participants. For the majority of its HMO business, the Company receives fee-for-service payments which are recorded as net patient service revenue in the consolidated statements of unrestricted revenues, expenses and other changes in net assets.

Hawai’i Pacific Health
Notes to Consolidated Financial Statements (continued)
16
1. Organization and Summary of Accounting Policies (continued)
Significant concentrations of patient accounts receivable include Hawaii Medical Service Association (HMSA) – 22% and 24%, Medicaid and QUEST Integration, which was formed on January 1, 2015, and combined and replaced the QUEST and QUEST Expanded Access (QEXA) programs – 26% and 26%, and Medicare – 29% and 28% as of June 30, 2017 and 2016, respectively.
HPH entered into an Accountable Care Agreement (ACA) with HMSA for its commercial HMO and preferred provider organization (PPO) product lines covering the 5-year period January 1, 2014 to December 31, 2018. One of the main contract principles is to lower the medical cost trend of the lives attributed to HPH’s accountable care organization (Hawai’i Health Partners, LLC) without compromising quality and to transition the organization from a payor reimbursement model based on volume to one based on measured value. Various payment mechanisms are included in the arrangement: fee-for-service, hospital quality payments, ambulatory physician quality program fees, primary care patient-centered medical home payments, provider organization fees, shared savings/shared risk, and patient management fees. The shared risk component of the ACA is determined based on a defined medical cost trend formula that is measured on patient services rendered to HPH’s attributed members for the period from January 1 to December 31. Based on criteria met during the years ended June 30, 2017 and 2016, HPH recorded revenues of approximately $1,245,000 and $4,608,000, respectively, reflected in other operating revenue within the consolidated statements of unrestricted revenues, expenses and other changes in net assets, and approximately $4,478,000 and $3,821,000, respectively, reflected in premium revenue within the consolidated statements of unrestricted revenues, expenses and other changes in net assets, which includes risk share adjustments for the settlement periods from January 1, 2015 to December 31, 2016. No risk share settlement has been recorded for the period January 1 to June 30, 2017, as the risk share, if any, cannot be estimated at this time as the settlement information has not yet been fully developed for that period. The Company has deferred revenue of approximately $2,887,000 and $10,242,000 at June 30, 2017 and 2016, respectively, of which approximately $2,054,000 and $7,743,000, respectively, is reflected in accrued expenses and approximately $833,000 and $2,499,000, respectively, is reflected in other long-term liabilities within the consolidated balance sheet.
Government Reimbursement Programs
The Company renders services to patients under contractual arrangements with the Medicare and Medicaid programs. Medicare acute inpatient services are reimbursed based on clinical, diagnostic, and other factors. Medicaid services are reimbursed based on a per diem rate for routine

Hawai’i Pacific Health
Notes to Consolidated Financial Statements (continued)
17
1. Organization and Summary of Accounting Policies (continued)
services and a per discharge rate for ancillary services. Outpatient services and defined capital costs related to Medicare and Medicaid beneficiaries are paid based upon a prospective payment system, fee schedules or a cost reimbursement method.
The Company is reimbursed for certain portions of the Medicare program, primarily disproportionate share and bad debt, at an interim rate during the year; final settlement is determined after annual cost reports submitted by the Company are audited by the Medicare contractors. Differences between final cost report settlements and amounts accrued in previous years, due to audit adjustments recorded by the fiscal intermediary, are reported as current year changes to net patient service revenues. For the years ended June 30, 2017 and 2016, the Company recorded an increase to net patient services revenue relating to the cost report settlements of approximately $1,056,000 and $1,118,000, respectively. The Company has the ability to appeal the adjustments based on a process established by Medicare and Medicaid.
Laws and regulations governing the Medicare and Medicaid programs are complex and subject to interpretation. As a result, there is at least a reasonable possibility that recorded estimates will change by a material amount in the near term. The Company believes that it is in compliance with all applicable laws and regulations and is not aware of any pending or threatened investigation involving allegations of potential wrongdoing that would have a material impact on the consolidated financial statements that have not been recorded. Compliance with such laws and regulations can be subject to future government review and interpretation as well as significant regulatory action including fines, penalties, and exclusion from the Medicare and Medicaid programs.
The Company entered into several agreements with health plans to provide healthcare services to plan members who are eligible to participate in the State of Hawaii’s QUEST Integration program and Section 1115 Medicaid waiver programs. The Company negotiates with health plans contracted by Medicaid for the provision of the healthcare services.
The percentage of gross patient service revenue applicable to the Medicare and Medicaid and QUEST Integration programs approximated 33% and 24% in 2017, respectively, and 32% and 25% in 2016, respectively.
The State of Hawai’i uses a provider fee to help finance the state share of Medicaid expenditures. The Hospital Sustainability Program Act (HSPA) began in 2012 and made direct payments to hospitals through FY 2016. Beginning with FY 2017, the Act was amended to make payments to

Hawai’i Pacific Health
Notes to Consolidated Financial Statements (continued)
18
1. Organization and Summary of Accounting Policies (continued)
hospitals through enhanced rates to Medicaid Managed Care Plans. For years 2017 and 2016, the Company recorded approximately $8,620,000 and $18,063,000 in net patient revenues related to HSPA payments, respectively, and $6,083,000 and $17,109,000 of provider fee payments, respectively, recorded within other purchases as tax payments.
In addition, the Company recorded a change in estimate of approximately $7,883,000 as an increase in patient revenues relating to the HSPA monies received during 2017 relating to prior year program revenues. Most of the change was due to additional retroactive direct payments made by the State for 2015 and 2016, which was $1,196,000 and $4,582,000, respectively. The remaining $2,105,000 increase was due to updated Uncompensated Care Cost data for 2015 and 2016. Also recorded in 2017 was the additional provider fee of $4,544,000 which was associated with the retroactive payments.
Charity Care
The Company will treat patients regardless of their ability to pay. An established charity care policy sets guidelines to determine which patients qualify for care given at no charge. Since the Company does not pursue collection from qualified charity care patients, related charges are not reported as revenue. Recorded charity care provided in both 2017 and 2016 was less than 1% of total net patient service revenue, as measured by applying the cost to gross charges ratio to gross uncompensated charges associated with providing charity care to patients.
Collective Bargaining Agreements (Unaudited)
The Company has several collective bargaining agreements covering approximately 38% of its labor force. As of June 30, 2017, three collective bargaining agreements with two unions, or approximately 15% of the Company’s labor force, will expire within one year.
Advertising Expense
The Company expenses advertising costs as incurred. Advertising expense was approximately $4,599,000 in 2017 and $4,923,000 in 2016 and was recorded in services expense in the consolidated statements of unrestricted revenues, expenses and other changes in net assets.
Hawai’i Pacific Health
Notes to Consolidated Financial Statements (continued)
19
1. Organization and Summary of Accounting Policies (continued)
Deferred Financing Costs
Costs incurred in obtaining long-term financing are deferred and amortized over the terms of the related obligations using the effective-interest method.
Accounting for the Impairment or Disposal of Long-Lived Assets
The Company accounts for the impairment or disposal of long-lived assets using a future cash flow model to determine whether assets have been impaired. The Company reviews long-lived assets for circumstances which could indicate that carrying values may not be recoverable. Management determined that no long-lived assets were impaired as of June 30, 2017 and 2016.
Excess of Revenues Over Expenses
The consolidated statements of unrestricted revenues, expenses and other changes in net assets include the excess of revenues over expenses. Changes in unrestricted net assets, which are excluded from the excess of revenues over expenses, include unrealized gains and losses on investments in other than trading securities, contributions of long-lived assets (including assets acquired using contributions which by donor restrictions were to be used for the purposes of acquiring such assets), changes in funded status of the pension plan and changes in the interest rate swap value associated with derivatives that qualify as effective cash flow hedges.
Subsequent Events
Subsequent events have been evaluated through October 18, 2017, the date these consolidated financial statements were issued (see Note 6).
Use of Estimates
The preparation of financial statements in conformity with U.S. generally accepted accounting principles generally (GAAP) requires management to make estimates and assumptions that affect the amounts reported in the consolidated financial statements and accompanying notes. Actual results could differ from those estimates.
Hawai’i Pacific Health
Notes to Consolidated Financial Statements (continued)
20
1. Organization and Summary of Accounting Policies (continued)
Adoption of New Accounting Standards
In August 2014, the Financial Accounting Standards Board (FASB) issued Disclosure of Uncertainties about an Entity’s Ability to Continue as a Going Concern, which requires management to evaluate whether there are conditions and events which raise doubt about an entity’s ability to continue as a going concern within one year after the date that the financial statements are issued. During 2017, the Company was required to adopt this accounting standard.
Management does not believe that there is substantial doubt over the Company’s ability to continue as a going concern given the Company’s available cash and investment balances as of June 30, 2017 in relation to its expected operational cash expenditure requirements for the upcoming 12 month period.
Accounting Standards Pending Adoption
In May 2014, as part of its ongoing efforts to assist in the convergence of U.S. GAAP and International Financial Reporting Standards, the FASB issued a new accounting standard, Revenue from Contracts with Customers, which amends current revenue recognition guidance. Under the new standard, recognition of revenue occurs when a customer obtains control of promised goods or services in an amount that reflects the consideration which the entity expects to receive in exchange for those goods or services. In doing so, companies generally will be required to use more judgement and make more estimates than under current guidance. In addition, this accounting standard requires disclosure of the nature, amount, timing, and uncertainty of revenue and cash flows arising from contracts with customers. This accounting standard is effective for the fiscal years, and interim periods, beginning after December 15, 2017. For financial reporting purposes, this accounting standard allows for either full retrospective adoption or modified retrospective adoption. Management is currently evaluating the impact of adopting this accounting standard, including the adoption method that will be used.
In February 2016, the FASB issued a new accounting standard, Leases. This accounting standard requires companies that lease assets to recognize a right-of-use asset and a lease liability, initially measured at the present value of the lease payments, in its balance sheet. Lessor accounting remains largely unchanged as it is substantially equivalent to existing guidance for sales-type leases, direct financing leases and operating leases. This accounting standard will also require additional disclosures about the amount, timing and uncertainty of cash flows arising from leases. This accounting standard is effective for fiscal years, and interim periods, beginning after

Hawai’i Pacific Health
Notes to Consolidated Financial Statements (continued)
21
1. Organization and Summary of Accounting Policies (continued)
December 15, 2018. Management is currently evaluating the impact of adopting this accounting standard.
In July 2015, the FASB issued a new accounting standard, Inventory: Simplifying the Measurement of Inventory. This accounting standard applies to companies that measure inventory using the first-in first-out method or average cost, with inventory being measured at the lower of cost or net realizable value. Net realizable value is the estimated selling price in the normal course of business, less predictable costs for completion, disposal or transportation. This accounting standard is effective for fiscal years beginning after December 15, 2016. Management does not believe this standard will have a material impact on its consolidated financial statements.
In January 2016, the FASB issued a new accounting standard, Financial Instruments—Overall: Recognition and Measurement of Financial Assets and Financial Liabilities. This accounting standard will require equity investments, except those accounted for using the equity method of accounting, to be measured at fair value with changes in fair value recognized in net income. This accounting standard is effective for fiscal years beginning after December 15, 2017. Management is currently evaluating the impact of adopting this accounting standard which could result in the Company reporting unrealized investment earnings and losses, for those equity investments held in the Company’s investment portfolio, within excess of revenues over expenses. Currently, unrealized equity investment earnings, other than other-than-temporary losses, are not reported within excess of revenues over expenses.
In August 2016, the FASB issued a new accounting standard, Not-for-Profit Entities: Presentation of Financial Statements of Not-for-Profit Entities. This accounting standard will change the presentation of net assets into two categories, net assets with donor restrictions and net assets without donor restrictions. This accounting standard will also allow companies to elect to use either the direct or indirect cash flow method, and requires additional liquidity disclosures and presentation of expenses by both natural and functional classification. This accounting standard is effective for fiscal years, and interim periods, beginning after December 15, 2017. Management is currently evaluating the impact of adopting this accounting standard.
In November 2016, the FASB issued a new accounting standard, Statement of Cash Flows (Topic 230), Restricted Cash (a consensus of the Emerging Issues Task Force). This accounting standard will require that entities present cash receipts and cash payments from cash equivalents and restricted cash accounts within the statements of cash flows. This accounting standard is effective for fiscal years, and interim periods, beginning after December 15, 2017. Management is currently evaluating the impact of adopting this accounting standard.

Hawai’i Pacific Health
Notes to Consolidated Financial Statements (continued)
22
1. Organization and Summary of Accounting Policies (continued)
In March 2017, the FASB issued a new accounting standard, Compensation—Retirement Benefits (Topic 715): Improving the Presentation of Net Periodic Pension Cost and Net Periodic Postretirement Benefit Cost. This accounting standard will require that employers report the service cost component of net benefit cost in the same line item or items as other compensation costs arising from services rendered by the pertinent employees during the period and the other components of net benefit cost in the income statement separately from the service cost component and outside a subtotal of income from operations, if one is presented. This accounting standard is effective for fiscal years, and interim periods, beginning after December 15, 2017. Management is currently evaluating the impact of adopting this accounting standard.
In August 2017, the FASB issued a new accounting standard, Derivatives and Hedging. This will allow an entity that holds a financial instrument which hedges cash flow interest rate risk of a variable rate instrument, to designate the hedged risk based on the variability in cash flows attributable to the contractually specified interest rate. By eliminating the concept of benchmark interest rates for hedges of variable-rate instruments, the amendment removes the requirement to designate only the overall variability in cash flows as the hedged risk in a cash flow hedge of a variable rate instrument indexed to a non-benchmark interest rate. This accounting standard is effective for fiscal years beginning after December 15, 2018. Management is currently evaluating the impact of adopting this standard.

Hawai’i Pacific Health
Notes to Consolidated Financial Statements (continued)
23
2. Assets Whose Use Is Limited or Restricted and Investments
Assets whose use is limited or restricted and investments consist of the following:
June 30 2017 2016 Board-designated:
Money market funds $ 1,280,401 $ 16,609,488 Equity securities 151,416,703 122,200,901 Alternative investments 88,390,650 79,936,289 Cash surrender value of life insurance policies 16,778,000 15,982,164
257,865,754 234,728,842 Funds held by trustee under bond indenture agreement:
Money market funds 21,270,226 20,366,196 Debt securities 14,257,476 15,085,137
35,527,702 35,451,333 Restricted by donor or grantor:
Cash and cash equivalents 140,789 24,614,800 Pledges receivable, net 2,785,783 8,776,320 Certificate of deposit 600,000 600,000 Money market funds 35,726 492,032 Equity securities 4,950,777 4,334,458 Beneficial interest in perpetual trusts
(comprised of fixed income and equity securities) 4,805,471 4,547,454 Alternative investments 2,466,316 2,367,996 Debt securities 305,762 340,381 Charitable remainder trust assets 79,591 83,328
16,170,215 46,156,769 Unrestricted – undesignated investments:
Equity securities 158,572,709 119,192,145 Debt securities 24,518,290 24,172,661 Alternative investments 89,605,774 75,081,595 Money market funds 1,298,003 15,600,759 Cash surrender value of life insurance policies 3,654,414 4,227,875
277,649,190 238,275,035 $ 587,212,861 $ 554,611,979

Hawai’i Pacific Health
Notes to Consolidated Financial Statements (continued)
24
2. Assets Whose Use Is Limited or Restricted and Investments (continued)
Investment income (loss) for assets limited or restricted as to use, cash equivalents, and other investments is composed of the following:
Year Ended June 30 2017 2016
Unrestricted Temporarily
Restricted Unrestricted Temporarily
Restricted Dividends and interest $ 6,872,532 $ 232,734 $ 7,061,985 $ 297,594 Realized gains (losses) 2,121,895 62,067 (13,327,018) (573,437) Net gains (losses) on
alternative investments 20,766,705 418,781 (7,558,103) (366,275) $ 29,761,132 $ 713,582 $ (13,823,136) $ (642,118)
Year Ended June 30 2017 2016 Unrealized gains – change in:
Unrestricted net assets $ 14,487,454 $ 8,214,617 Temporarily restricted net assets 819,514 16,920
$ 15,306,968 $ 8,231,537 The following table summarizes the unrealized losses on investments held at June 30:
2017 Less Than Twelve Months Twelve Months or More Total
Description Fair Value Unrealized
Loss Fair Value Unrealized
Loss Fair Value Unrealized
Loss Equity securities $ – $ – $ 5,799,462 $ 134,628 $ 5,799,462 $ 134,628 Debt securities 71,705,587 1,142,802 – – 71,705,587 1,142,802 Total $ 71,705,587 $ 1,142,802 $ 5,799,462 $ 134,628 $ 77,505,049 $ 1,277,430

Hawai’i Pacific Health
Notes to Consolidated Financial Statements (continued)
25
2. Assets Whose Use Is Limited or Restricted and Investments (continued)
2016 Less Than Twelve Months Twelve Months or More Total
Description Fair Value Unrealized
Loss Fair Value Unrealized
Loss Fair Value Unrealized
Loss Equity securities $ 29,747,034 $ 1,280,829 $ 29,947,620 $ 1,341,224 $ 59,694,654 $ 2,622,053 Debt securities – – 24,434,900 920,362 24,434,900 920,362 Total $ 29,747,034 $ 1,280,829 $ 54,382,520 $ 2,261,586 $ 84,129,554 $ 3,542,415 Management has concluded that the current economic environment will enable the Company to recover the unrealized losses. This conclusion was based on a number of factors, including (1) the significance of the difference between cost and fair value of the investment and (2) the time period for which fair value was lower than cost.
3. Fair Value
The Company’s investments are recorded at fair value based on an exit price, representing the amount that would be received to sell an asset or paid to transfer a liability in an orderly transaction between market participants. As such, fair value is a market-based measurement that should be determined based on assumptions that market participants would use in pricing an asset or liability. As a basis for considering such assumptions, ASC 820, Fair Value Measurement, establishes a three-tier fair value hierarchy and prioritizes the inputs used in measuring fair value as follows:
Level 1 – Pricing inputs are based on quoted prices, unadjusted, for identical assets or liabilities, in active markets.
Level 2 – Pricing inputs are based on quoted prices for similar instruments in active markets, quoted prices for identical or similar instruments in markets that are not active and model-based valuation techniques for which all significant assumptions are observable in the market or can be corroborated by observable market data for substantially the full contractual term of the assets or liabilities.
Level 3 – Pricing inputs are generally unobservable and include situations where there is little, if any, market activity for the instrument. The inputs into the determination of fair value require management’s judgment or estimation of assumptions that market participants would use in pricing the assets or liabilities. Level 3 fair values are therefore determined using factors that involve considerable judgment and interpretations, including but not limited to private and public comparable, discounted cash flow models and fund manager estimates.
Hawai’i Pacific Health
Notes to Consolidated Financial Statements (continued)
26
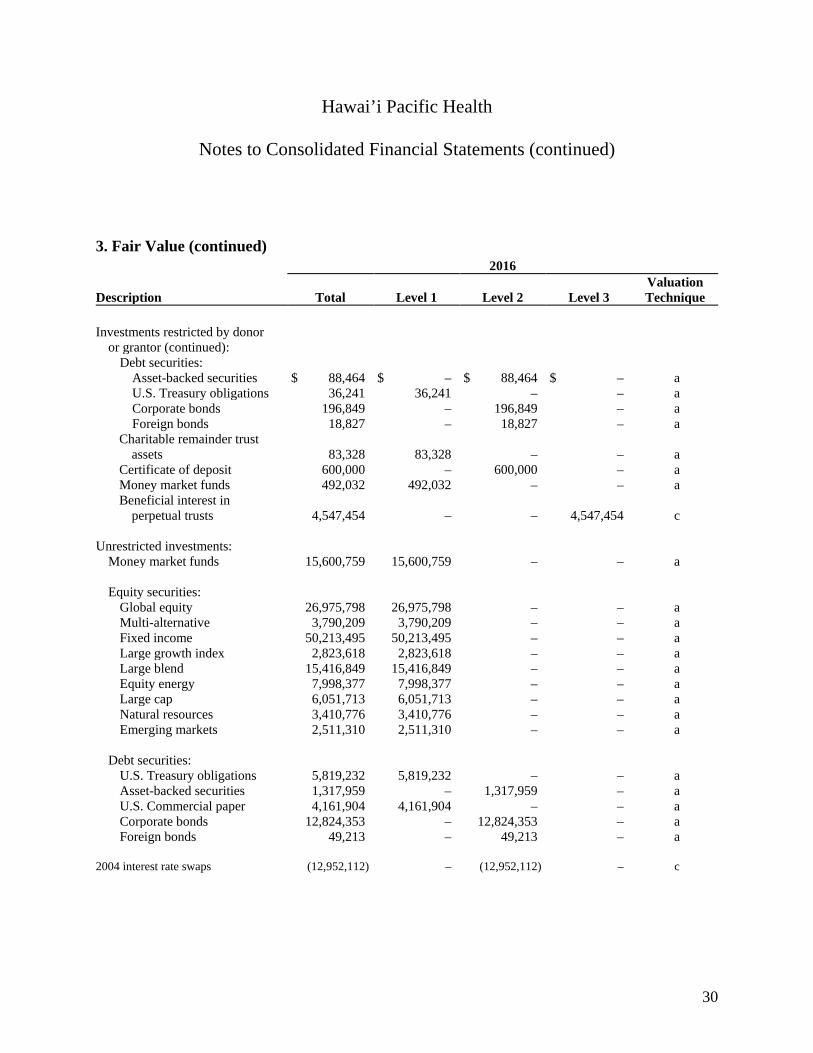
3. Fair Value (continued)
Assets and liabilities measured at fair value are based on one or more of the three valuation techniques. The three valuation techniques are identified in the tables below. Where more than one technique is noted, individual assets or liabilities were valued using one or more of the noted techniques. The valuation techniques are as follows:
(a) Market approach – Prices and other relevant information generated by market transactions involving identical or comparable assets or liabilities.
(b) Cost approach – Amount that would be required to replace the service capacity of an asset (replacement cost).
(c) Income approach – Techniques to convert future amounts to a single present value amount based on market expectations (including present value techniques, option-pricing and excess earnings models for intangibles).
As of June 30, 2017 and 2016, the Company’s alternative investments amounting to approximately $180,463,000 and $157,386,000, respectively, are accounted for using the equity method of accounting. Approximately $88,391,000 and $79,936,000 of the Company’s alternative investments are reported as Board-designated, $2,466,000 and $2,368,000 are restricted by donor or grantor and $89,606,000 and $75,082,000 are unrestricted-undesignated as of June 30, 2017 and 2016, respectively. Since alternative investments are accounted for using the equity method of accounting, which is not a fair value measure, they are omitted from the following tables.
The Company has unfunded capital commitments under private equity investment funds totaling approximately $22,373,000 as of June 30, 2017 through June 2023.
As of June 30, 2017 and 2016, the Company’s investments in cash surrender values of life insurance policies amounting to approximately $20,432,000 and $20,210,000, respectively, are omitted from the following table as they are accounted for as life insurance contracts. Approximately $16,778,000 and $15,982,000 of the Company’s cash surrender values of life insurance policies are reported as Board-designated and approximately $3,654,000 and $4,228,000 are unrestricted-undesignated as of June 30, 2017 and 2016, respectively.
The carrying amounts reported in the consolidated balance sheets for cash and cash equivalents, receivables, accounts payable and accrued expenses approximate fair value due to the short-term nature of these instruments.

Hawai’i Pacific Health
Notes to Consolidated Financial Statements (continued)
27
3. Fair Value (continued)
Fair values for long-term debt are estimated using quoted market prices of similar types of borrowings (see Note 7).
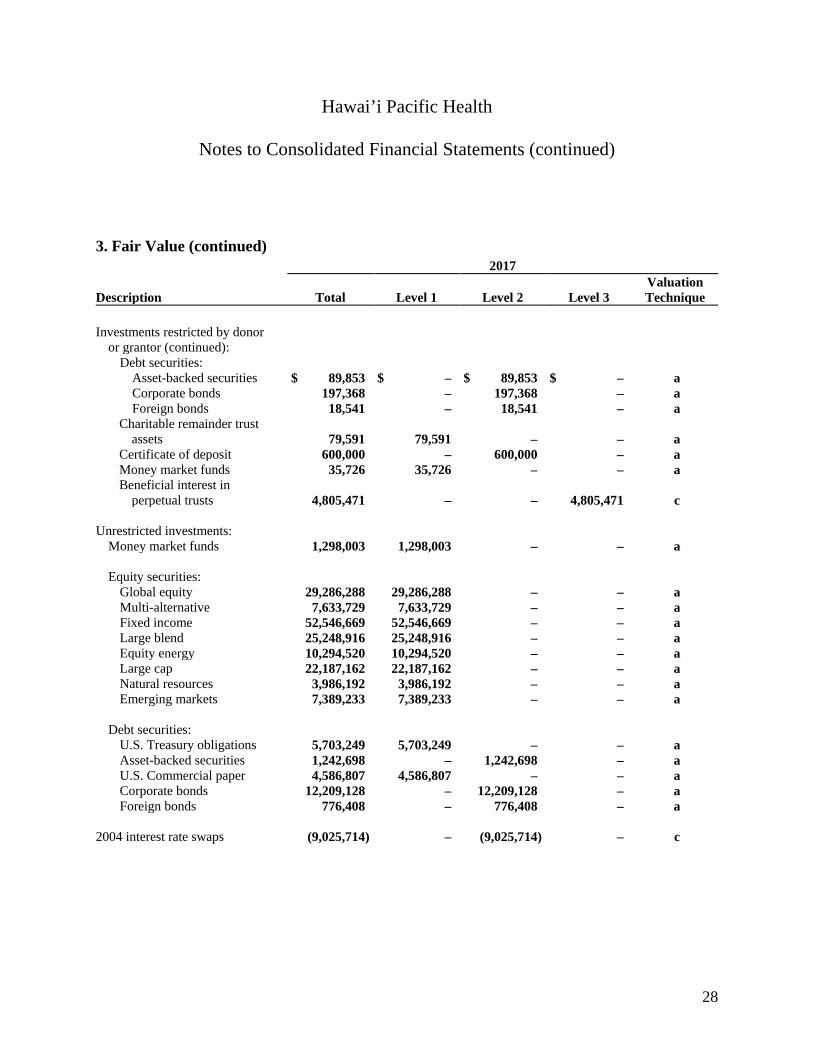
The tables below present the Company’s fair value measurements on a recurring basis as of June 30:
2017
Description Total Level 1 Level 2 Level 3 Valuation Technique
Board-designated investments:
Money market funds $ 1,280,401 $ 1,280,401 $ – $ – a Equity securities:
Large blend 22,361,433 22,361,433 – – a Global equity 28,273,585 28,273,585 – – a Multi-alternative 7,412,984 7,412,984 – – a Fixed income 50,779,814 50,779,814 – – a Equity energy 9,996,833 9,996,833 – – a Large cap 21,545,575 21,545,575 – – a Natural resources 3,870,924 3,870,924 – – a Emerging markets 7,175,555 7,175,555 – – a
Funds held by trustee under bond
indenture agreement: Money market funds 21,270,226 21,270,226 – – a Debt securities – municipals 14,257,476 – 14,257,476 – a
Investments restricted by donor
or grantor: Equity securities:
Large blend 1,271,133 1,271,133 – – a Global equity 852,412 852,412 – – a Multi-alternative 207,802 207,802 – – a Fixed income 1,425,567 1,425,567 – – a Equity energy 280,233 280,233 – – a Large cap 603,970 603,970 – – a Natural resources 108,511 108,511 – – a Emerging markets 201,149 201,149 – – a
Hawai’i Pacific Health
Notes to Consolidated Financial Statements (continued)
28
3. Fair Value (continued) 2017
Description Total Level 1 Level 2 Level 3 Valuation Technique
Investments restricted by donor
or grantor (continued): Debt securities:
Asset-backed securities $ 89,853 $ – $ 89,853 $ – a Corporate bonds 197,368 – 197,368 – a Foreign bonds 18,541 – 18,541 – a
Charitable remainder trust assets 79,591 79,591 – – a
Certificate of deposit 600,000 – 600,000 – a Money market funds 35,726 35,726 – – a Beneficial interest in
perpetual trusts 4,805,471 – – 4,805,471 c Unrestricted investments:
Money market funds 1,298,003 1,298,003 – – a
Equity securities: Global equity 29,286,288 29,286,288 – – a Multi-alternative 7,633,729 7,633,729 – – a Fixed income 52,546,669 52,546,669 – – a Large blend 25,248,916 25,248,916 – – a Equity energy 10,294,520 10,294,520 – – a Large cap 22,187,162 22,187,162 – – a Natural resources 3,986,192 3,986,192 – – a Emerging markets 7,389,233 7,389,233 – – a
Debt securities:
U.S. Treasury obligations 5,703,249 5,703,249 – – a Asset-backed securities 1,242,698 – 1,242,698 – a U.S. Commercial paper 4,586,807 4,586,807 – – a Corporate bonds 12,209,128 – 12,209,128 – a Foreign bonds 776,408 – 776,408 – a
2004 interest rate swaps (9,025,714) – (9,025,714) – c

Hawai’i Pacific Health
Notes to Consolidated Financial Statements (continued)
29
3. Fair Value (continued) 2016
Description Total Level 1 Level 2 Level 3 Valuation Technique
Board-designated investments:
Money market funds $ 16,609,488 $ 16,609,488 $ – $ – a Equity securities:
Large blend 14,016,412 14,016,412 – – a Global equity 28,205,863 28,205,863 – – a Multi-alternative 3,963,038 3,963,038 – – a Fixed income 52,328,362 52,328,362 – – a Large growth index 2,804,342 2,804,342 – – a Equity energy 8,363,094 8,363,094 – – a Large cap 6,327,664 6,327,664 – – a Natural resources 3,566,303 3,566,303 – – a Emerging markets 2,625,823 2,625,823 – – a
Funds held by trustee under bond
indenture agreement: Money market funds 20,366,196 20,366,196 – – a Debt securities – municipals 15,085,137 – 15,085,137 – a
Investments restricted by donor
or grantor: Equity securities:
Large blend 1,046,489 1,046,489 – – a Global equity 904,324 904,324 – – a Multi-alternative 119,451 119,451 – – a Fixed income 1,550,229 1,550,229 – – a Large growth index 84,527 84,527 – – a Equity energy 252,075 252,075 – – a Large cap 190,724 190,724 – – a Natural resources 107,493 107,493 – – a Emerging markets 79,146 79,146 – – a
Hawai’i Pacific Health
Notes to Consolidated Financial Statements (continued)
30
3. Fair Value (continued) 2016
Description Total Level 1 Level 2 Level 3 Valuation Technique
Investments restricted by donor
or grantor (continued): Debt securities:
Asset-backed securities $ 88,464 $ – $ 88,464 $ – a U.S. Treasury obligations 36,241 36,241 – – a Corporate bonds 196,849 – 196,849 – a Foreign bonds 18,827 – 18,827 – a
Charitable remainder trust assets 83,328 83,328 – – a
Certificate of deposit 600,000 – 600,000 – a Money market funds 492,032 492,032 – – a Beneficial interest in
perpetual trusts 4,547,454 – – 4,547,454 c Unrestricted investments:
Money market funds 15,600,759 15,600,759 – – a
Equity securities: Global equity 26,975,798 26,975,798 – – a Multi-alternative 3,790,209 3,790,209 – – a Fixed income 50,213,495 50,213,495 – – a Large growth index 2,823,618 2,823,618 – – a Large blend 15,416,849 15,416,849 – – a Equity energy 7,998,377 7,998,377 – – a Large cap 6,051,713 6,051,713 – – a Natural resources 3,410,776 3,410,776 – – a Emerging markets 2,511,310 2,511,310 – – a
Debt securities:
U.S. Treasury obligations 5,819,232 5,819,232 – – a Asset-backed securities 1,317,959 – 1,317,959 – a U.S. Commercial paper 4,161,904 4,161,904 – – a Corporate bonds 12,824,353 – 12,824,353 – a Foreign bonds 49,213 – 49,213 – a
2004 interest rate swaps (12,952,112) – (12,952,112) – c

Hawai’i Pacific Health
Notes to Consolidated Financial Statements (continued)
31
3. Fair Value (continued)
The Company received restricted pledges and contributions amounting to approximately $8,996,000 in 2017 and $7,773,000 in 2016, which are recorded within temporarily restricted grants and contributions in the consolidated statements of unrestricted revenues, expenses and other changes in net assets, that were subject to fair value measurement upon initial measurement. The restricted contributions were measured based on the actual cash received, or for pledge receivables, using discounted cash flow projections as outlined in the income approach. Pledges receivable, net of the present value discount, using discount rates up to 3.77%, and allowance for uncollectible pledges, were approximately $7,774,000 and $10,074,000 as of June 30, 2017 and 2016, respectively.
As of June 30, 2017 and 2016, the uncollateralized portion of the Company’s swaps subject to nonperformance risk was approximately $9,026,000 and $12,952,000, respectively. The resulting reduction in unrealized loss on interest swaps due to this nonperformance risk, arising from the Company’s own credit risk, was not material and, no adjustment was recorded in the excess of revenue over expenses for the years ended June 30, 2017 and 2016.
4. Property and Equipment
Property and equipment are summarized as follows:
June 30 2017 2016 Land and land improvements $ 45,199,597 $ 44,718,941 Buildings and improvements 689,570,670 465,103,404 Equipment 393,103,612 381,455,445 Construction in progress 32,365,354 231,795,730 1,160,239,233 1,123,073,520 Less: amortization and accumulated depreciation 608,221,858 584,659,156 Property and equipment, net $ 552,017,375 $ 538,414,364
In 2017 and 2016, the Company wrote off fully depreciated equipment with cost and accumulated depreciation totaling approximately $19,358,000 and $92,160,000, respectively.

Hawai’i Pacific Health
Notes to Consolidated Financial Statements (continued)
32
5. Employee Benefit Plans
Eligible employees of the Company are covered under the Hawai’i Pacific Health Retirement Plan (the Plan), a noncontributory defined benefit pension plan. Benefits are based on years of service and a percentage of the employee’s compensation. The Company’s policy is to accrue actuarially determined net periodic pension costs and to annually contribute an amount within regulatory guidelines.
In May 2015, the HPH Board of Directors approved a plan to change the Plan to a cash balance defined benefit pension plan (cash balance plan) with an effective date of January 1, 2016. Most of the Company’s bargaining units ratified the plan change in fiscal year 2015, and remaining bargaining units ratified the plan change in November 2015. For all active, eligible participants in the Plan on January 1, 2016, the current accrued benefit was converted to a cash balance account using actuarial factors and this account will be credited at a rate of 3.5% per year. After the effective date, cash balance credits ranging from 3% to 6.5% of eligible compensation are allocated to active eligible participant accounts based on the participant’s age and years of service. Participant accounts are also credited at an annual interest rate of 3.5%. The Company recognized the effect of the change in the plan (for all groups that ratified) as of June 30, 2015, which was reflected as a credit to the funded status of the plan and an addition to the prior service credit of approximately $98,663,000. The Company recognized the effect of the remaining groups as of June 30, 2016, which was reflected as a credit to the funded status of the plan and an addition to the prior service credit of approximately $2,697,000. In conjunction with the approval of the Plan amendment, the Board of Directors approved an enhancement payment to be paid to eligible Plan participants who met certain criteria and were employed by the Company on January 1, 2016 and July 1, 2016. This enhancement payment was paid as a contribution to participant’s defined contribution retirement plans and was determined based on actuarial benefit factors as of December 31, 2015. The January 2016 and July 2016 enhancement payments amounted to approximately $2,343,000 and $2,291,000, respectively, and are reflected in salaries and employee benefits in the accompanying consolidated statement of unrestricted revenues, expenses and other changes in net assets.
Included in net assets at June 30, 2017, are the following amounts that have not yet been recognized in net periodic pension cost: unrecognized prior service credits of approximately $87,363,000 and unrecognized actuarial losses of approximately $195,959,000. The unrecognized prior service credit and actuarial loss included in net assets and expected to be recognized in net periodic pension cost during the year ended June 30, 2018, is approximately $3,848,000. At June 30, 2016, approximately $95,139,000 in unrecognized prior service credits and $235,037,000

Hawai’i Pacific Health
Notes to Consolidated Financial Statements (continued)
33
5. Employee Benefit Plans (continued)
in unrecognized actuarial losses had not yet been recognized in net periodic pension cost. The unrecognized prior service credit and actuarial loss included in net assets and recognized in net periodic pension cost during the year ended June 30, 2017, was approximately $6,574,000.
During 2017, a change was made in the yield curve used to estimate the discount rate used in the calculation of the projected benefit obligation. The selection of a new yield curve, beginning with the year end projected benefit obligation determination, was made because it resulted in a better estimate of the discount rate in the Company’s facts and circumstances. In addition, management elected to change the methodology for calculating the discount rate used in computing the service and interest cost components of the net periodic benefit cost from its historical practice of using a single weighted average discount rate derived from the yield curve to a spot rate method. Management believes that this second change, which is a change in estimate inseparable from a change in accounting principle, is preferable because it will result in a more precise calculation of the service and interest cost components of pension expense. During fiscal year 2017 an analysis was done to determine the effect of these changes. These changes resulted in reductions to the benefit obligation of approximately $5,300,000 as of June 30, 2017 and fiscal year 2018 service and interest costs of approximately $700,000 and $2,100,000, respectively.
The following is a summary of the changes in the projected benefit obligation and the fair value of plan assets for the fiscal years ended June 30 and the accumulated benefit obligation at June 30:
Year Ended June 30 2017 2016 Projected benefit obligation Benefit obligation, at beginning of year $ 409,254,474 $ 365,690,490
Service cost 17,995,973 16,842,179 Interest cost 13,388,055 15,201,497 Actuarial (return) loss (21,501,265) 27,183,591 Plan change – (2,697,170) Benefits paid (16,560,265) (12,966,113)
Benefit obligation at end of year $ 402,576,972 $ 409,254,474

Hawai’i Pacific Health
Notes to Consolidated Financial Statements (continued)
34
5. Employee Benefit Plans (continued)
Year Ended June 30 2017 2016 Fair value of plan assets Fair value of plan assets, at beginning of year $ 260,152,042 $ 242,794,427
Contributions 37,662,000 31,243,000 Actual return (loss) on plan assets 21,299,198 (919,272) Benefits paid (16,560,265) (12,966,113)
Fair value of plan assets at end of year 302,552,975 260,152,042 Accrued pension liability, end of year $ 100,023,997 $ 149,102,432 Accumulated benefit obligation $ 402,576,972 $ 409,254,474
The underfunded status of the plan of approximately $100,024,000 and $149,102,000 at June 30, 2017 and 2016, respectively, is recognized in the accompanying consolidated balance sheets as accrued pension liability. No plan assets are expected to be returned to the Company during the year ending June 30, 2018.
Components of Net Periodic Benefit Cost
Year Ended June 30 2017 2016 Service cost $ 17,995,973 $ 16,842,179 Interest cost 13,388,055 15,201,497 Expected return on plan assets (18,072,439) (16,836,653) Recognized prior service credit (7,775,931) (7,693,766) Recognized net loss 14,350,287 12,682,207 Net periodic benefit cost $ 19,885,945 $ 20,195,464
Weighted Average Assumptions Used to Determine Benefit Obligations
June 30 2017 2016 Discount rate 3.75% 3.38%

Hawai’i Pacific Health
Notes to Consolidated Financial Statements (continued)
35
5. Employee Benefit Plans (continued)
Weighted Average Assumptions Used to Determine Net Periodic Benefit Cost
Year Ended June 30 2017 2016 Discount rate 3.38% 4.12/4.25%** Expected return on plan assets 6.75 6.75 Rate of compensation increase 3.50 3.50
** Due to a plan re-measurement as of November 30, 2015, as a result of the remaining
bargaining units ratifying the Plan’s change to a cash balance plan, the rate utilized was 4.12% as of November 30, 2015. The rate utilized as of June 30, 2016, was 4.25%.
Asset Allocations
The assets of the plan are held by the plan trustee in the HPH combined pension fund. Oversight of the combined pension fund assets is provided by the HPH Investment Advisory Group and the HPH Finance Committee of the Board of Directors. The long-term financial objectives of the combined pension fund are to comply with regulatory funding requirements and balance liquidity needs to meet benefit and expense obligations when due with long-term investment return goals to satisfy future plan obligations.
The long-term investment objective is to earn an average, real return of 5%, after adjusting for inflation and management fees, over long time periods. In order to achieve this objective, the fund needs to exceed the investment objectives in certain periods in order to compensate for shortfalls in other periods. This implies a higher average allocation to equity securities. The HPH Investment Committee’s investment policy sets a target for the weighted average asset allocation of 70% equity securities and 30% fixed income securities and cash.

Hawai’i Pacific Health
Notes to Consolidated Financial Statements (continued)
36
5. Employee Benefit Plans (continued)
The expected return on plan assets of 6.75% was developed based upon analysis of historical market returns, current market conditions, targeted future asset allocations, the plan assets’ past performance, and expectations on potential future market returns. The expected return represents a long-term average view of the performance of the plan assets which may not be achieved during a given plan year.
The weighted average target asset allocations compared to actual asset allocations at June 30, by major asset category, are as follows:
Target
Allocation Percentage of Actual
Plan Assets at June 30 2017 2017 2016 Major asset category U.S. equity 21% 23% 20% Global equity 18 24 19 Emerging markets equity 6 7 5 Fixed income 26 28 26 Inflation hedging 5 2 4 Marketable alternative investments 20 12 14 Global tactical asset allocation – – 1 Real estate – 3 4 Cash and cash equivalents 4 1 7 100% 100% 100%
Hawai’i Pacific Health
Notes to Consolidated Financial Statements (continued)
37
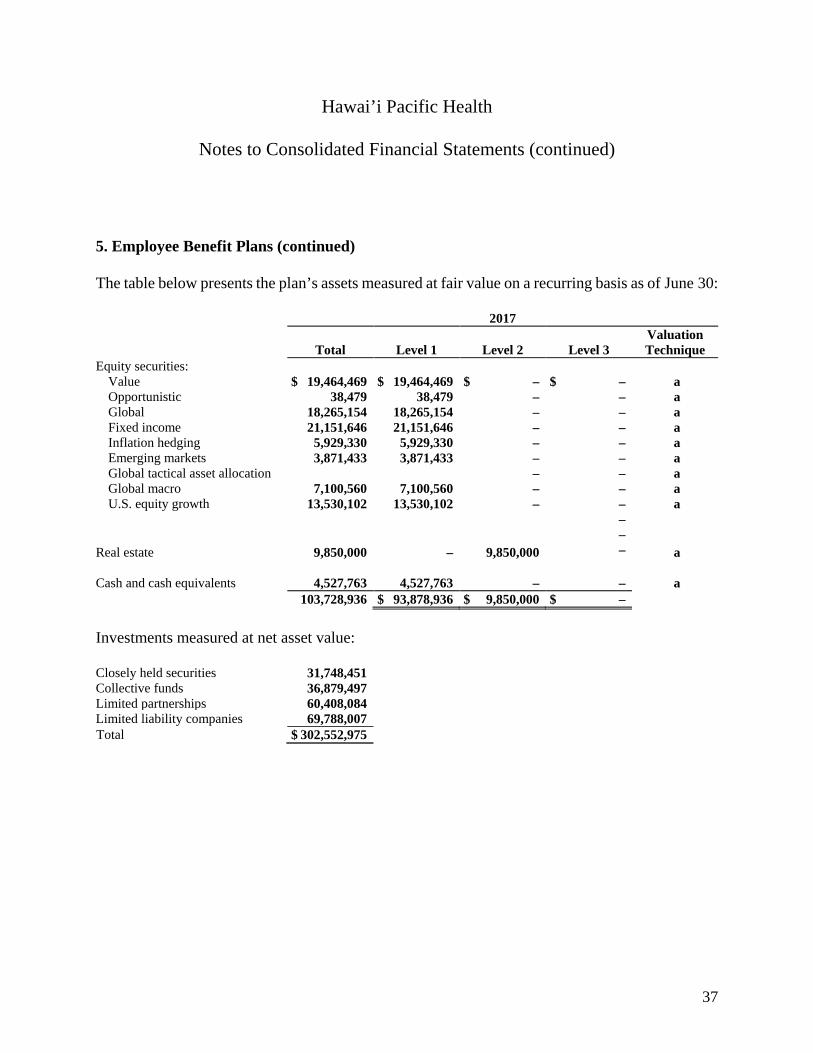
5. Employee Benefit Plans (continued)
The table below presents the plan’s assets measured at fair value on a recurring basis as of June 30:
2017
Total Level 1 Level 2 Level 3 Valuation Technique
Equity securities: Value $ 19,464,469 $ 19,464,469 $ – $ – a Opportunistic 38,479 38,479 – – a Global 18,265,154 18,265,154 – – a Fixed income 21,151,646 21,151,646 – – a Inflation hedging 5,929,330 5,929,330 – – a Emerging markets 3,871,433 3,871,433 – – a Global tactical asset allocation – – a Global macro 7,100,560 7,100,560 – – a U.S. equity growth 13,530,102 13,530,102 – – a
– – Real estate 9,850,000 – 9,850,000 – a Cash and cash equivalents 4,527,763 4,527,763 – – a 103,728,936 $ 93,878,936 $ 9,850,000 $ – Investments measured at net asset value:
Closely held securities 31,748,451 Collective funds 36,879,497 Limited partnerships 60,408,084 Limited liability companies 69,788,007 Total $ 302,552,975

Hawai’i Pacific Health
Notes to Consolidated Financial Statements (continued)
38
5. Employee Benefit Plans (continued)
2016
Total Level 1 Level 2 Level 3 Valuation Technique
Equity securities: Core $ 9,493,430 $ 9,493,430 $ – $ – a Value 15,143,951 15,143,951 – – a Opportunistic 32,704 32,704 – – a Global 23,033,334 23,033,334 – – a Fixed income 12,642,171 12,642,171 – – a Inflation hedging 9,890,749 9,890,749 – – a Emerging markets 3,034,310 3,034,310 – – a Global tactical asset allocation 2,202,778 2,202,778 – – a Global macro 3,747,608 3,747,608 – – a U.S. equity growth 2,738,867 2,738,867 – – a
Debt securities:
U.S. Treasury obligations 16,286,376 16,286,376 – – a Municipals 4,311,251 – 4,311,251 – a Corporate bonds 34,531,452 – 34,531,452 – a U.S. Government agencies 842,971 – 842,971 – a
Real estate 9,390,000 – 9,390,000 – a Cash and cash equivalents 17,141,408 17,141,408 – – a 164,463,360 $ 115,387,686 $ 49,075,674 $ – Investments measured at net asset value:
Closely held securities 32,412,686 Collective funds 8,975,394 Limited partnerships 7,466,331 Limited liability companies 46,834,271 Total $ 260,152,042 The plan’s mutual funds with underlying investments in debt securities are reported as equity securities, which differs from its target asset allocation reporting.

Hawai’i Pacific Health
Notes to Consolidated Financial Statements (continued)
39
5. Employee Benefit Plans (continued)
The plan has classified its common stock, mutual funds, money market funds and U.S. agency securities which are considered highly liquid and easily tradable as Level 1 within the fair value hierarchy. These securities are valued using inputs observable in active markets for identical securities. The plan’s investments in real estate are classified as Level 2. Real estate is valued based on an appraisal using inputs observable in active markets for similar properties.
Certain of the plan’s alternative investments are reported at net asset value per share or its equivalent. The following tables and explanations identify attributes relating to the nature and risk of such investments at June 30:
2017
Fair Value
Redemption Frequency
(If Currently Eligible)
Redemption Notice Period (If Currently
Eligible)
Redemption Restrictions and
Expiration of Restriction
Fixed income $ 62,474,176 Daily 2 business days – Global ex-U.S. equity 38,979,449 Daily, monthly 1 or 10 days – U.S. equity growth 38,219,288 Daily, monthly 31 days – Emerging markets equity 17,247,421 Daily, monthly 2, 5 or 30 days Gates Diversified arbitrage/
event-driven 13,240,252 Quarterly, annually 44–65 days Side pockets, gates
Distressed 6,199,817 Every 24 months,
25% quarterly 60-65 days Side pockets, gates, hard lock-up 3/31/18
Global long/short equity 12,218,313 Quarterly, annually,
25% quarterly 45–90 days Side pockets, gates U.S. long/short equity 1,851,468 Quarterly 60 days Gates Global macro 7,400,665 Monthly 2 or 14 days – Private equity 866,766 – – – Opportunistic 126,424 Every 24 months 90 days – $ 198,824,039

Hawai’i Pacific Health
Notes to Consolidated Financial Statements (continued)
40
5. Employee Benefit Plans (continued)
2016
Fair Value
Redemption Frequency
(If Currently Eligible)
Redemption Notice Period (If Currently
Eligible)
Redemption Restrictions and
Expiration of Restriction
U.S. equity growth $ 8,975,394 Monthly Prior to 22nd calendar
day of month – Global ex-U.S. equity 37,705,736 Monthly 10 or 31 days Soft lock-up 12/31/16 Emerging markets equity 9,844,611 Monthly 5 or 30 days Gates
Diversified arbitrage/event-driven 13,586,762 Quarterly, annually 44–90 days
Side pockets, gates, hard lock-up 9/30/15; soft lock-up 9/30/17
Distressed 2,781,332 Every 24 months 60 days Side pockets
Global long/short equity 17,120,691 Quarterly, annually,
25% quarterly 45–90 days Side pockets, gates; hard lock-up 9/30/15
U.S. long/short equity 1,802,289 Quarterly 60 days Gates Global macro 3,722,295 Monthly 2 days – Opportunistic 149,572 Every 24 months 90 days – $ 95,688,682
U.S. equity growth: This category has an emphasis on equities of companies with rapid earnings growth and high multiples of earnings, dividends, and book values.
Global ex-U.S. equity: This category invests in portfolios consisting of a core group of long stock positions and stock indexes in global ex.-U.S. equity markets. These managers do not focus on a single sector or geographic region, instead employing a broad, global ex.-US mandate.
Emerging markets equity: This category has products investing in the equity securities of companies located in emerging and frontier market countries.
Diversified arbitrage: This category has multi-strategy portfolios that have broad investment parameters, seeking to profit from mispricings across asset classes and strategies.
Event-driven: This category has multi-strategy portfolios that seek to exploit security mispricings caused by mergers and acquisitions, spin-offs, tracking stocks, accounting write-offs, reorganizations, bankruptcies, share buybacks and special dividends.
Hawai’i Pacific Health
Notes to Consolidated Financial Statements (continued)
41
5. Employee Benefit Plans (continued)
Distressed: This category has portfolios consisting primarily of investments in debt securities of companies that are experiencing business, financial, market or legal uncertainties, attempting to capture the difference between the market price of security or debt obligations and their underlying intrinsic value.
Global long/short equity: This category has portfolios consisting of a core group of long stock positions with short sales of stock and stock indexes in global and global ex. U.S. equity markets.
U.S. long/short equity: This category has portfolios consisting of a core group of long stock positions with short sales of stock and stock indexes in U.S. equity markets.
Global macro: This category has broad, top-down strategies that seek to capitalize on perceived macroeconomic and political and shifts in investor behavior and market positions. This category is unconstrained by asset class or geography and implemented through long and short positions and means of cash, asset purchases (including physical commodities), futures, options, and other instruments. Leverage is often applied, and return and volatility targets may vary sharply.
Private-equity: Private equity is capital that is not traded on a public exchange. Private equity is composed of funds and investors that directly invest in private companies, or that engage in buyouts of public companies, resulting in the delisting of public equity. The plan has unfunded capital commitments for private equity funds totaling approximately $7,200,000 as of June 30, 2017 through June 2023.

Hawai’i Pacific Health
Notes to Consolidated Financial Statements (continued)
42
5. Employee Benefit Plans (continued)
Opportunistic: This category has multi-strategy portfolios that have a broad mandate and employ an opportunistic investment approach, shifting capital across asset classes and strategies depending on their profitability.
The Company expects to make contributions to the Plan amounting to approximately $80,500,000 in 2018 (see Note 6).
Benefit payments, which reflect expected future service, as appropriate, are expected to be paid as follows:
Year ending June 30: 2018 $ 27,413,385 2019 31,376,723 2020 23,408,664 2021 23,336,472 2022 26,075,656 Years 2023–2027 139,689,295
The Company has defined contribution retirement plans (Retirement Plans) that cover substantially all employees and provide participants the ability to make pretax payroll deduction contributions for deposit into retirement savings accounts. The participants’ contributions are matched at a percentage of their total contributions up to annual dollar limits per participant as defined by the Retirement Plans. The Company may also make discretionary contributions. The total expense related to the above Retirement Plans was approximately $21,099,000 in 2017 and $20,277,000 in 2016.
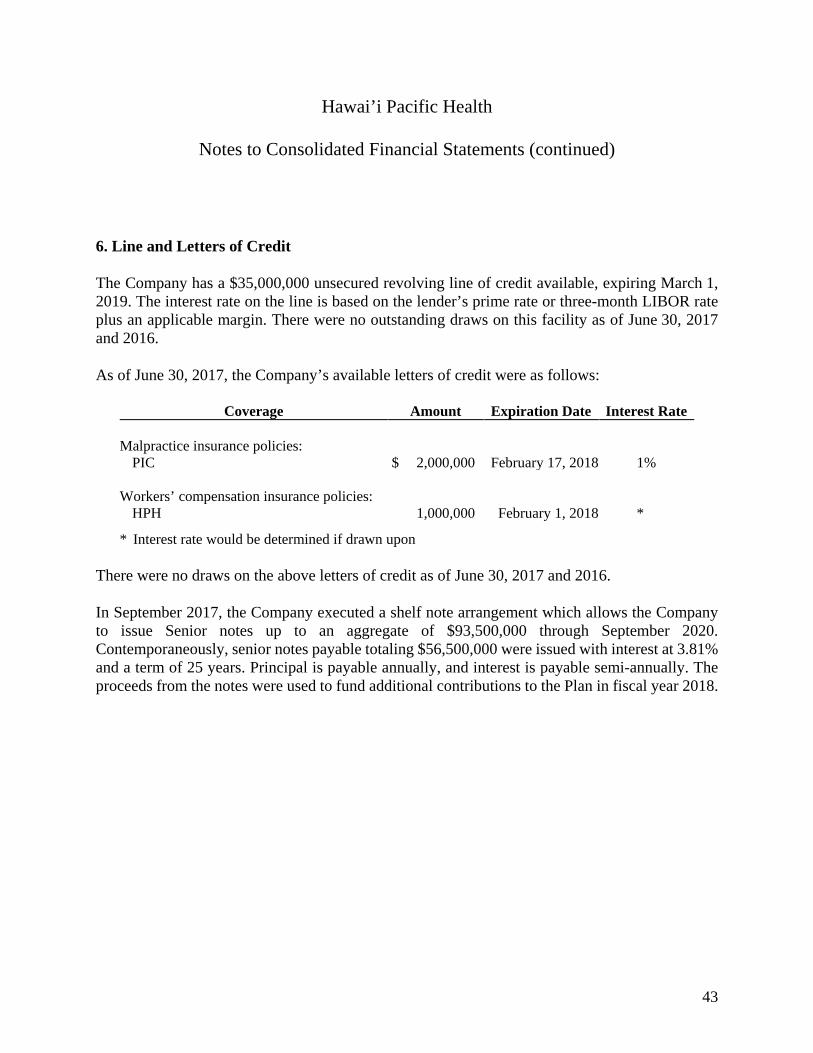
Hawai’i Pacific Health
Notes to Consolidated Financial Statements (continued)
43
6. Line and Letters of Credit
The Company has a $35,000,000 unsecured revolving line of credit available, expiring March 1, 2019. The interest rate on the line is based on the lender’s prime rate or three-month LIBOR rate plus an applicable margin. There were no outstanding draws on this facility as of June 30, 2017 and 2016.
As of June 30, 2017, the Company’s available letters of credit were as follows:
Coverage Amount Expiration Date Interest Rate Malpractice insurance policies:
PIC $ 2,000,000 February 17, 2018 1% Workers’ compensation insurance policies:
HPH 1,000,000 February 1, 2018 *
* Interest rate would be determined if drawn upon
There were no draws on the above letters of credit as of June 30, 2017 and 2016.
In September 2017, the Company executed a shelf note arrangement which allows the Company to issue Senior notes up to an aggregate of $93,500,000 through September 2020. Contemporaneously, senior notes payable totaling $56,500,000 were issued with interest at 3.81% and a term of 25 years. Principal is payable annually, and interest is payable semi-annually. The proceeds from the notes were used to fund additional contributions to the Plan in fiscal year 2018.

Hawai’i Pacific Health
Notes to Consolidated Financial Statements (continued)
44
7. Long-Term Debt
Long-term debt is summarized as follows:
June 30 2017 2016 Series 2013C Special Purpose Variable Rate Revenue Bonds,
principal payments in varying annual amounts ranging from $1,900,000 to $4,200,000 due July 2017 through 2033 (interest rate of 1.512% at June 30, 2017) $ 46,085,239 $ 47,968,056
Series 2013B Special Purpose Revenue Bonds, interest payable
semi-annually at rates ranging from 3.00% to 5.25% (4.84% at June 30, 2017), principal payments in varying annual amounts ranging from $265,000 to $3,105,000 due July 2017 through 2033 32,365,633 33,823,300
Series 2013A Special Purpose Revenue Bonds, interest payable
semi-annually at rates ranging from 4.00% to 6.00% (5.48% at June 30, 2017), principal payments in varying annual amounts ranging from $1,130,000 to $1,930,000 due July 2017 through 2028; $1,795,000 to $5,385,000 due July 2029 through 2033; $2,520,000 to $3,120,000 due July 2034 through 2038, $3,295,000 to $23,995,000 due July 2039 through 2043 117,978,451 119,121,784
Series 2010B Special Purpose Revenue Bonds, interest payable
semi-annually at rates ranging from 5.00% to 5.75% (5.64% at June 30, 2017), principal payments in varying annual amounts ranging from $1,220,000 to $1,410,000 due July 2017 through 2020; $1,480,000 to $2,425,000 due July 2021 through 2030; $2,560,000 to $4,245,000 due July 2031 through 2040 55,938,215 57,077,026
Series 2010A Special Purpose Revenue Bonds, interest payable
semi-annually at rates ranging from 3.625% to 5.50% (5.38% at June 30, 2017), principal payments in varying annual amounts ranging from $735,000 to $2,275,000 due July 2017 through 2021; $335,000 to $1,640,000 due July 2022 through 2030; $1,280,000 to $12,705,000 due July 2031 through 2040 94,893,702 95,429,919
Total long-term debt 347,261,240 353,420,085 Less current portion 6,346,970 6,158,844 Noncurrent portion $ 340,914,270 $ 347,261,241
Hawai’i Pacific Health
Notes to Consolidated Financial Statements (continued)
45
7. Long-Term Debt (continued)
The 2013 and 2010 Series Special Purpose Revenue Bonds are collateralized by a security interest in the gross receipts and pledged assets of the Obligated Group (comprised of HPH – parent company only, KMCWC, PMMC, SCH and WMH) as defined in the Master Indenture. The 2013C Bonds are subject to optional redemption at various terms and to mandatory redemption on or after July 1, 2015, payable in annual amounts of $1,900,000 to $4,200,000. The 2013A & B Bonds are subject to optional redemption on or after July 2, 2023, at a redemption price equal to 100% of the principal amount plus accrued interest to the date of redemption without premium. In addition, the 2013A Bonds maturing on July 1, 2033, July 1, 2038, and July 1, 2043, are subject to redemption prior to their stated maturity on or after July 1, 2029, in varying amounts of $1,795,000 to $23,995,000 without premium. The 2010B Bonds are subject to optional redemption on or after July 1, 2020, at a redemption price equal to 100% of the principal amount being redeemed, plus accrued interest to the date of redemption, without premium. The 2010B Bonds are subject to mandatory redemption on or after July 1, 2021, payable in annual sinking fund installments from $1,480,000 to $4,245,000. The 2010A Bonds are subject to optional redemption on or after July 2, 2020, at a redemption price equal to 100% of the principal amount being redeemed, plus accrued interest to the date of redemption, without premium. The 2010A Bonds are subject to mandatory redemption on or after July 1, 2022, payable in annual sinking fund installments from $335,000 to $12,705,000.
As of June 30, 2017 and 2016, approximately $19,922,000 and $18,865,000, respectively, included in current assets, was held by the bond trustee to fund principal maturities and accrued interest payable.
In October 2013, the Company issued Series 2013A, 2013B and 2013C Bonds in the amounts of $122,240,000, $36,740,000 and $50,000,000, respectively. The Series 2013A Bonds established a project fund to finance construction of a healthcare facility and equipment. The 2013A Bonds are a combination of serial and term bonds. The serial bonds have maturity dates that started July 1, 2015 through 2028, with interest rates ranging from 3.00% to 5.00%. The term bonds have maturity dates of July 1, 2033, July 1, 2038, and July 1, 2043, with fixed interest rates of 6.00%, 5.50% and 5.50%, respectively. The Series 2013B Bonds were used to refund the Series 1998 Bonds and Series 2004A Bonds. The 2013B Bonds have maturity dates that started July 1, 2014 through 2033 with interest rates ranging from 2.00% to 5.25%. The Series 2013C Bonds were used to refund the Series 2004B Bonds. The Series 2013C Bonds are a direct bank purchase bonds bearing interest at 67% of one-month LIBOR plus 0.80%. Principal payments in varying amounts ranging from $1,900,000 to $4,200,000 have maturity dates starting July 1, 2015 through 2033.

Hawai’i Pacific Health
Notes to Consolidated Financial Statements (continued)
46
7. Long-Term Debt (continued)
Certain bond agreements require the Obligated Group of the Company to comply with various covenants, including the maintenance of a minimum long-term debt service coverage rates. As of June 30, 2017, the Obligated Group was in compliance with all bond covenants.
Long-term debt maturities for the years succeeding June 30, 2017, are as follows.
Year ending June 30: 2018 $ 6,346,970 2019 6,589,024 2020 6,876,509 2021 7,165,521 2022 7,503,884 Thereafter 312,779,332
$ 347,261,240 Interest paid was approximately $18,847,000 in 2017 and $12,389,000 in 2016 (net of amounts capitalized). Interest capitalized was approximately $6,773,000 in 2016. No interest was capitalized in 2017.
The fair value of long-term debt as of June 30, 2017 and 2016, was approximately $389,109,000 and $414,595,000, respectively.
8. Other Long-Term Liabilities
In connection with the acquisition of SCHI Holding, Inc. (SCHI) by the Company in 2001, the Company is obligated to make payments on the deferred compensation and other obligations of SCHI, an unrelated for-profit corporation. While certain of the deferred compensation obligations are non-interest bearing, others bear interest at rates ranging from 2% to 7%. The deferred compensation obligations are payable at termination, retirement, or over a period of years beginning at termination or retirement of certain former employees of SCHI. The net present value of the deferred compensation obligation, at 6% interest, is approximately $13,168,000 and $12,994,000 as of June 30, 2017 and 2016, respectively, and is included in other long-term liabilities in the consolidated balance sheets. Total payments on the deferred compensation obligations and other obligations were approximately $662,000 in 2017 and $736,000 in 2016.

Hawai’i Pacific Health
Notes to Consolidated Financial Statements (continued)
47
9. Leases
As Lessee
Leases on various types of office and storage space, office equipment and furniture are classified as operating leases.
Future minimum lease payments under noncancelable operating leases as of June 30, 2017, are as follows:
Year ending June 30: 2018 $ 10,113,000 2019 8,501,000 2020 7,666,000 2021 6,778,000 2022 6,302,000 Thereafter 47,105,000
$ 86,465,000 Minimum rent payments have not been reduced by minimum sublease rentals of approximately $9,468,000 due in the future under noncancelable subleases.
The composition of total rental expense for all operating leases except those with terms of a month or less is as follows:
Year Ended June 30 2017 2016 Minimum rentals $ 12,072,000 $ 12,461,000 Less: sublease rentals 1,744,000 1,521,000 $ 10,328,000 $ 10,940,000

Hawai’i Pacific Health
Notes to Consolidated Financial Statements (continued)
48
9. Leases (continued)
As Lessor
Future minimum rental income to be received under noncancelable operating leases for office space as of June 30, 2017, is as follows:
Year ending June 30: 2018 $ 1,718,000 2019 1,633,000 2020 1,657,000 2021 563,000 2022 368,000 Thereafter 13,399,000
$ 19,338,000 10. Income Taxes
Some of the Company’s not-for-profit organizations have generated net operating losses (NOL) attributable to revenue-generating activities that are not related to their respective tax-exempt purposes. The Company has unused federal and Hawaii NOL carryforwards as of June 30, 2017, of approximately $5,710,000. The NOL carryforwards begin to expire in 2020. The deferred tax asset associated with these NOL carryforwards are offset by a full valuation allowance in the consolidated balance sheets as management has determined it is more likely than not that the NOLs will not be utilized.
11. Functional Classification of Expenses
The functional classification of expenses by major classes of program services and supporting activities are summarized as follows:
Year Ended June 30 2017 2016 Patient services $ 908,758,935 $ 861,107,966 Management and general 323,915,756 317,344,128 $ 1,232,674,691 $ 1,178,452,094
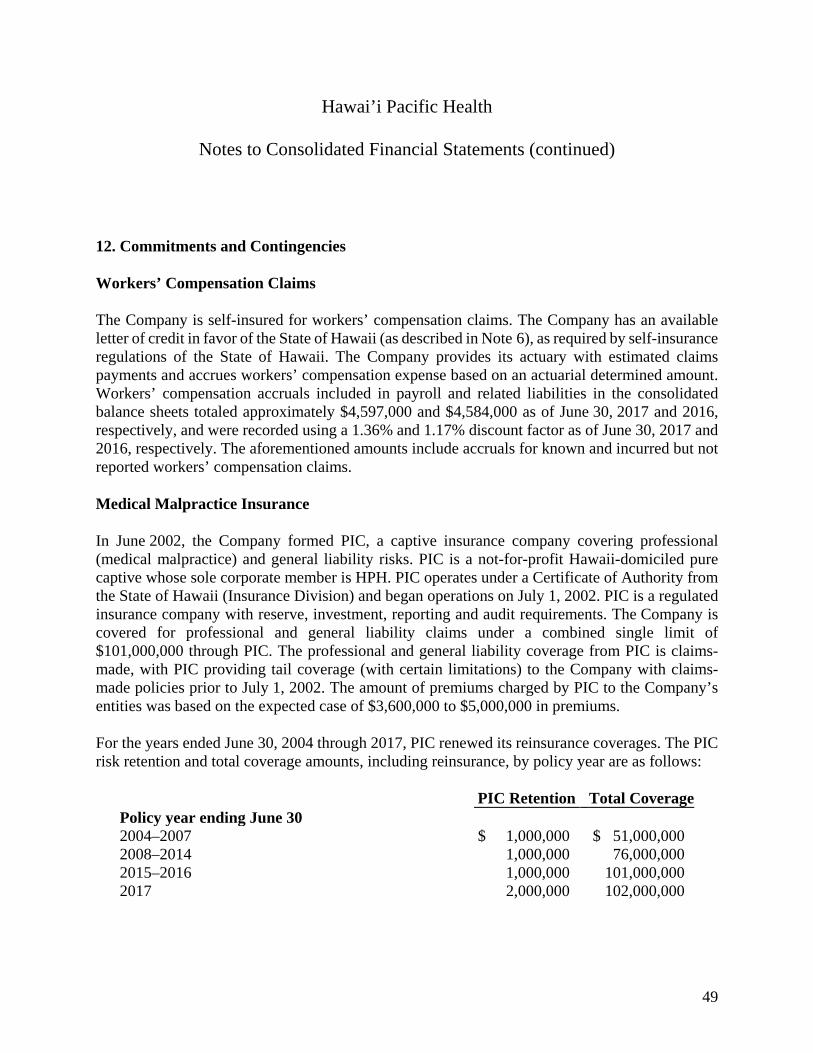
Hawai’i Pacific Health
Notes to Consolidated Financial Statements (continued)
49
12. Commitments and Contingencies
Workers’ Compensation Claims
The Company is self-insured for workers’ compensation claims. The Company has an available letter of credit in favor of the State of Hawaii (as described in Note 6), as required by self-insurance regulations of the State of Hawaii. The Company provides its actuary with estimated claims payments and accrues workers’ compensation expense based on an actuarial determined amount. Workers’ compensation accruals included in payroll and related liabilities in the consolidated balance sheets totaled approximately $4,597,000 and $4,584,000 as of June 30, 2017 and 2016, respectively, and were recorded using a 1.36% and 1.17% discount factor as of June 30, 2017 and 2016, respectively. The aforementioned amounts include accruals for known and incurred but not reported workers’ compensation claims.
Medical Malpractice Insurance
In June 2002, the Company formed PIC, a captive insurance company covering professional (medical malpractice) and general liability risks. PIC is a not-for-profit Hawaii-domiciled pure captive whose sole corporate member is HPH. PIC operates under a Certificate of Authority from the State of Hawaii (Insurance Division) and began operations on July 1, 2002. PIC is a regulated insurance company with reserve, investment, reporting and audit requirements. The Company is covered for professional and general liability claims under a combined single limit of $101,000,000 through PIC. The professional and general liability coverage from PIC is claims-made, with PIC providing tail coverage (with certain limitations) to the Company with claims-made policies prior to July 1, 2002. The amount of premiums charged by PIC to the Company’s entities was based on the expected case of $3,600,000 to $5,000,000 in premiums.
For the years ended June 30, 2004 through 2017, PIC renewed its reinsurance coverages. The PIC risk retention and total coverage amounts, including reinsurance, by policy year are as follows:
PIC Retention Total Coverage Policy year ending June 30 2004–2007 $ 1,000,000 $ 51,000,000 2008–2014 1,000,000 76,000,000 2015–2016 1,000,000 101,000,000 2017 2,000,000 102,000,000

Hawai’i Pacific Health
Notes to Consolidated Financial Statements (continued)
50
12. Commitments and Contingencies (continued)
For the years ended June 30, 2004 through 2016, PIC entered into a retrospective rating program for the first reinsurance layer of $10,000,000. Depending on actual claims experience, the premium is adjusted either down to a minimum of $2,000,000 or up to a maximum of $8,000,000. Under the retrospective rating program, the Company estimates that it will pay additional premiums to the reinsurer of approximately $6,208,000, which has been recorded within accrued expenses within the consolidated balance sheets, and adjustments have been made to premiums earned from each of the Company’s entities as of June 30, 2017. The Company does not have a deductible for coverage provided by PIC. PIC’s total costs are allocated through a premium charge to the Company based on actuarial information derived from historical loss experience and expected losses.
Medical malpractice expense totaled approximately $16,528,000 in 2017 and $16,080,000 in 2016. Medical malpractice accruals, including claims expected to be paid by reinsurance, totaled approximately $61,929,000 and $60,857,000 and reinsurance recoverable totaled approximately $33,198,000 and $35,313,000 as of June 30, 2017 and 2016, respectively, and were recorded using a 1.77% and 1.74% discount factor at June 30, 2017 and 2016, respectively, within deposits and other in the consolidated balance sheets. Undiscounted medical malpractice accruals and reinsurance recoverable totaled approximately $65,996,000 and $35,375,000, respectively, as of June 30, 2017.
Interest Rate Swap Agreements
During the second quarter of fiscal year 2004, the Company issued $30,000,000 of fixed rate and $50,000,000 of variable rate bonds for a total of $80,000,000 of 2004 Bonds. In order to hedge future variability in cash flows associated with variable rate debt, two tranches of floating-to-fixed amortizing interest rate swaps of $25,000,000 each in notional amounts were entered into at the time the variable rate debt was issued. The variable rate debt from the 2004 Bonds was refunded by the 2013C Bonds. The 2013C Bonds were structured to match the terms of the 2004 Bonds so that the existing interest rate swaps could continue to be designated as a hedge against the variability in the cash flows of the current variable rate debt. The Company pays fixed rates ranging between 3.842% and 3.849% and receives a variable rate tied to LIBOR. A component of the fixed rate on these two swaps includes the financing of the loss on a previous, but now terminated $30,000,000 forward starting amortizing interest rate swap on the date of termination. As of June 30, 2017 and 2016, the Company recorded an accumulated loss of approximately $7,700,000 and $11,600,000, respectively, in unrestricted net assets related to the current amortizing interest rate swaps outstanding. The balance of the unamortized loss as of June 30, 2017 and 2016, amounted to approximately $1,190,000 and $1,260,000, respectively.

Hawai’i Pacific Health
Notes to Consolidated Financial Statements (continued)
51
12. Commitments and Contingencies (continued)
The mark-to-market loss position on the swap arrangements related to the 2004 and 2013 Bonds was approximately $9,026,000 and $12,952,000 as of June 30, 2017 and 2016, respectively.
Companies are allowed to offset derivative fair value and cash collateral amounts executed with the same counterparty under a master netting arrangement. The Company has chosen to adopt the netting of such amounts under its master agreement with its counterparties. The Company did not have the right to reclaim cash collateral or obligation to return cash collateral for derivatives under master netting arrangements that have not been offset against net derivative positions as of June 30, 2017 and 2016.
The following discloses information requirements regarding offsetting liabilities. The Company did not hold offsetting assets as of June 30, 2017 and 2016.
Offsetting of Financial Liabilities and Derivative Liabilities ($ in millions)
As of June 30, 2017
Gross
Gross Amounts
Offset
Net Amounts of Liabilities
Presented
Gross Amounts Not Offset
in the Consolidated Balance Sheet
Description
Amounts of Recognized Liabilities
in the Consolidated Balance Sheet
in the Consolidated Balance sheet
Financial Instruments
Cash Collateral Pledged
Net Amount
Derivatives $ 9.0 $ – $ 9.0 $ – $ – $ 9.0 Total $ 9.0 $ – $ 9.0 $ – $ – $ 9.0
As of June 30, 2016
Gross
Gross Amounts
Offset
Net Amounts of Liabilities
Presented
Gross Amounts Not Offset
in the Consolidated Balance Sheet
Description
Amounts of Recognized Liabilities
in the Consolidated Balance Sheet
in the Consolidated Balance Sheet
Financial Instruments
Cash Collateral Pledged
Net Amount
Derivatives $ 13.0 $ – $ 13.0 $ – $ – $ 13.0 Total $ 13.0 $ – $ 13.0 $ – $ – $ 13.0
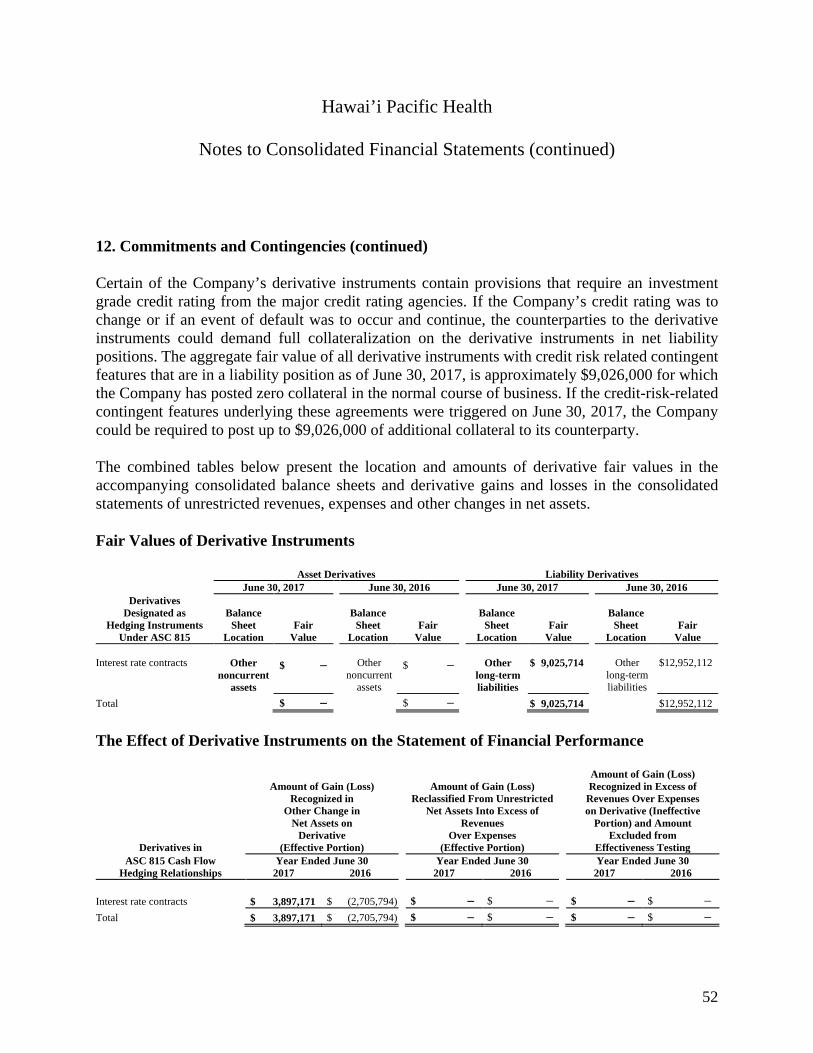
Hawai’i Pacific Health
Notes to Consolidated Financial Statements (continued)
52
12. Commitments and Contingencies (continued)
Certain of the Company’s derivative instruments contain provisions that require an investment grade credit rating from the major credit rating agencies. If the Company’s credit rating was to change or if an event of default was to occur and continue, the counterparties to the derivative instruments could demand full collateralization on the derivative instruments in net liability positions. The aggregate fair value of all derivative instruments with credit risk related contingent features that are in a liability position as of June 30, 2017, is approximately $9,026,000 for which the Company has posted zero collateral in the normal course of business. If the credit-risk-related contingent features underlying these agreements were triggered on June 30, 2017, the Company could be required to post up to $9,026,000 of additional collateral to its counterparty.
The combined tables below present the location and amounts of derivative fair values in the accompanying consolidated balance sheets and derivative gains and losses in the consolidated statements of unrestricted revenues, expenses and other changes in net assets.
Fair Values of Derivative Instruments
Asset Derivatives Liability Derivatives June 30, 2017 June 30, 2016 June 30, 2017 June 30, 2016
Derivatives Designated as
Hedging Instruments Under ASC 815
Balance Sheet
Location Fair
Value
Balance Sheet
Location Fair
Value
Balance Sheet
Location Fair
Value
Balance Sheet
Location Fair
Value Interest rate contracts Other
noncurrent assets
$ –
Other noncurrent
assets
$ –
Other long-term liabilities
$ 9,025,714
Other long-term liabilities
$12,952,112
Total $ – $ – $ 9,025,714 $12,952,112
The Effect of Derivative Instruments on the Statement of Financial Performance
Derivatives in
Amount of Gain (Loss) Recognized in
Other Change in Net Assets on
Derivative (Effective Portion)
Amount of Gain (Loss) Reclassified From Unrestricted
Net Assets Into Excess of Revenues
Over Expenses (Effective Portion)
Amount of Gain (Loss) Recognized in Excess of
Revenues Over Expenses on Derivative (Ineffective
Portion) and Amount Excluded from
Effectiveness Testing ASC 815 Cash Flow Year Ended June 30 Year Ended June 30 Year Ended June 30
Hedging Relationships 2017 2016 2017 2016 2017 2016 Interest rate contracts $ 3,897,171 $ (2,705,794) $ – $ – $ – $ – Total $ 3,897,171 $ (2,705,794) $ – $ – $ – $ –

Hawai’i Pacific Health
Notes to Consolidated Financial Statements (continued)
53
12. Commitments and Contingencies (continued)
Litigation
The Company is involved in legal actions in the normal course of business, some of which seek monetary damages, including punitive damages, which are not covered by insurance. These actions, when finally concluded and determined, will not, in the opinion of management and the Company’s general counsel, have a material adverse effect on the Company’s financial position, results of operations, or cash flows.
Other (Unaudited)
The Company has outstanding construction commitments of approximately $39,483,000 as of June 30, 2017.
13. Related-Party Transactions
A joint venture investment of the Company provided laundry services to the Company. The laundry services companies were sold to an unaffiliated third party in July 2016. Payments for services totaled approximately $3,209,000 in 2016.
A joint venture investment of the Company provides collection services to the Company. Payments to the joint venture totaled approximately $1,181,000 in 2017 and $1,023,000 in 2016.
SCH leased land from the Plan for $696,000 in lease rent for both 2017 and 2016. The lease terminates in 2042, and rental payments are renegotiated every five years based on an appraisal of the land. Future annual lease payments are $696,000 through December 31, 2021, at which point the lease agreement will be up for renegotiation and lease terms subject to change. The Office of Pension and Welfare Benefit Programs granted the Plan an exemption from prohibitions for the aforementioned lease arrangement.
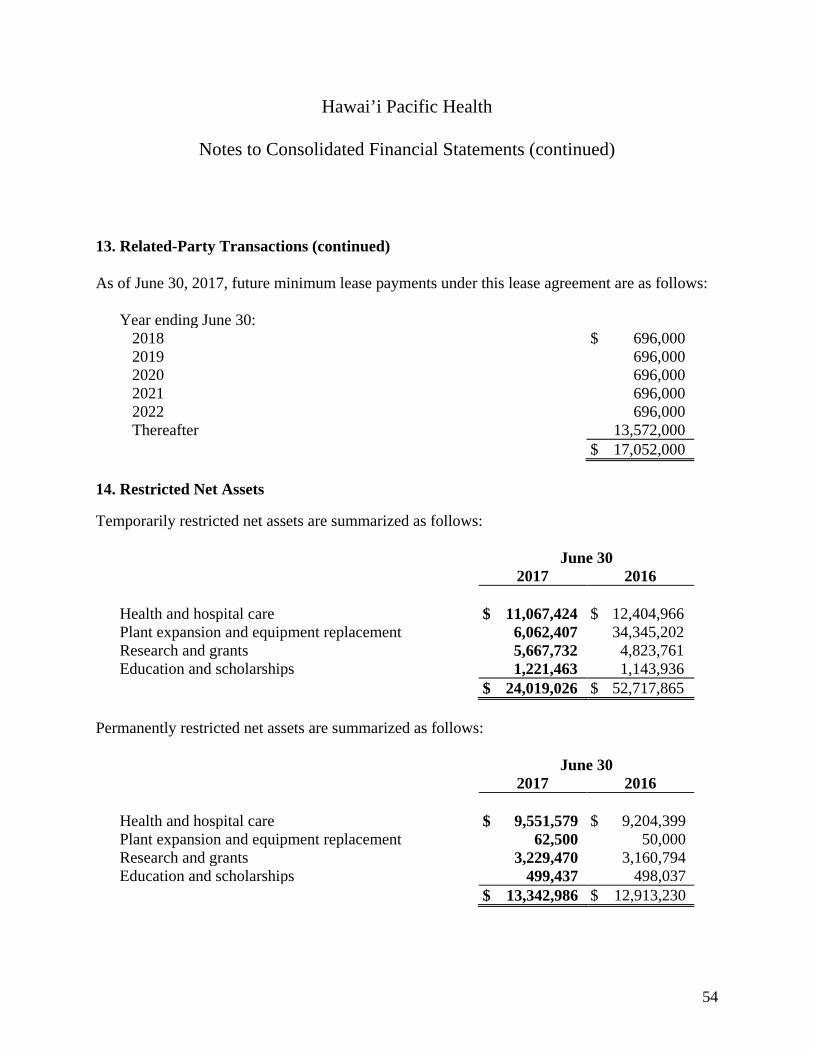
Hawai’i Pacific Health
Notes to Consolidated Financial Statements (continued)
54
13. Related-Party Transactions (continued)
As of June 30, 2017, future minimum lease payments under this lease agreement are as follows:
Year ending June 30: 2018 $ 696,000 2019 696,000 2020 696,000 2021 696,000 2022 696,000 Thereafter 13,572,000
$ 17,052,000 14. Restricted Net Assets
Temporarily restricted net assets are summarized as follows:
June 30 2017 2016 Health and hospital care $ 11,067,424 $ 12,404,966 Plant expansion and equipment replacement 6,062,407 34,345,202 Research and grants 5,667,732 4,823,761 Education and scholarships 1,221,463 1,143,936 $ 24,019,026 $ 52,717,865
Permanently restricted net assets are summarized as follows:
June 30 2017 2016 Health and hospital care $ 9,551,579 $ 9,204,399 Plant expansion and equipment replacement 62,500 50,000 Research and grants 3,229,470 3,160,794 Education and scholarships 499,437 498,037 $ 13,342,986 $ 12,913,230

Hawai’i Pacific Health
Notes to Consolidated Financial Statements (continued)
55
15. Endowment
The Company’s endowment consists of approximately 48 individual funds established for a variety of purposes. The endowment includes both donor-restricted funds and funds designated by the Board of Directors to function as endowments. Net assets associated with the endowment funds are classified and reported based on the existence or absence of donor-imposed restrictions.
Interpretation of Relevant Law
In June 2009, Hawai’i Revised Statute 517E was signed into law, enacting UPMIFA. UPMIFA became effective on July 1, 2009, replacing the Uniform Management of Institutional Funds Act. UPMIFA applies to institutional funds created after July 1, 2009, and to decisions made after July 1, 2009, for existing institutional funds. UPMIFA eliminates the concept of “historic dollar value” and allows an institution to spend or accumulate as the board determines is prudent for the uses, benefits, purposes and duration of the endowment fund unless the gift instrument states a particular rate or formula.
The Company has interpreted UPMIFA as requiring the preservation of the fair value of the original gift as of the gift date of the donor-restricted endowment funds absent explicit donor stipulations to the contrary. As a result of this interpretation, the Company classifies as permanently restricted net assets (1) the original value of gifts donated to the permanent endowment, (2) the original value of subsequent gifts to the permanent endowment and (3) accumulations to the permanent endowment made in accordance with the direction of the applicable donor gift instrument at the time the accumulation is added to the fund. The remaining portion of the donor-restricted endowment fund that is not classified in permanently restricted net assets is characterized as temporarily restricted net assets until those amounts are appropriated for expenditure by the Company in a manner consistent with the standard for expenditure prescribed by UPMIFA. In accordance with UPMIFA, the Company considers the following factors in making a determination to appropriate or accumulate donor-restricted endowment funds:
1. The duration and preservation of the fund. 2. The general purposes of the Company and the donor-restricted endowment fund. 3. General economic conditions. 4. The possible effect of inflation and deflation. 5. The expected total return from income and the appreciation of investments. 6. Other resources of the Company. 7. The investment policies of the Company.

Hawai’i Pacific Health
Notes to Consolidated Financial Statements (continued)
56
15. Endowment (continued)
Funds With Deficiencies
From time to time, the fair value of assets associated with individual donor-restricted endowment funds may fall below the level that the donor requires the Company to retain as a fund of perpetual duration. In accordance with GAAP, deficiencies of this nature that are reported in unrestricted net assets were approximately $121,000 and $187,000 as of June 30, 2017 and 2016, respectively.
Return Objectives and Risk Parameters
The Company has adopted investment and spending policies for endowment assets that attempt to provide a predictable stream of funding to programs supported by its endowment while seeking to maintain the purchasing power of the endowment assets. Endowment assets include those assets of donor-restricted funds that the organization must hold in perpetuity. Under this policy, the endowment assets are invested in a manner that is intended to produce results that equal or exceed a mix of the Russell 3000, MSCI All Country World, consumer price index plus 5%, Hedge Fund Research, Inc. and Barclays Capital benchmarks. The Company expects its endowment funds to provide an annual real return, net of inflation and management fees, of approximately 5% over long time periods. Actual returns in any given year may vary from this amount.
Strategies Employed for Achieving Objectives
To satisfy its long-term rate-of-return objectives, the Company relies on a total return strategy in which investment returns are achieved through both capital appreciation (realized and unrealized) and current yield (interest and dividends). The Company targets a diversified asset allocation that places a greater emphasis on equity-based investments to achieve its long-term return objectives within prudent risk constraints.
Spending Policy and How the Investment Objectives Relate to Spending Policy
The Company has a policy of appropriating for distribution each year 4.5% of its endowment fund’s average fair value using quarter-end values for the preceding three years. The amount of the distribution is subject to a 6% cap and 3% floor applied to the most recent quarter-end value to account for market volatility. In establishing this policy, the Company considered the long-term expected return on its endowment. Accordingly, the Company expects the current spending policy

Hawai’i Pacific Health
Notes to Consolidated Financial Statements (continued)
57
15. Endowment (continued)
to allow its endowment to grow over long time periods, which is consistent with the Company’s objective to maintain the purchasing power of the endowment assets held in perpetuity or for a specified term as well as to provide additional real growth through new gifts and investment returns.
The endowment net asset composition by type of fund consists of the following at June 30:
2017
Unrestricted Temporarily
Restricted Permanently
Restricted Total Donor-restricted funds $ (121,053) $ 5,656,881 $ 13,342,986 $ 18,878,814 Board-designated funds 257,865,754 – – 257,865,754 $ 257,744,701 $ 5,656,881 $ 13,342,986 $ 276,744,568
2016
Unrestricted Temporarily
Restricted Permanently
Restricted Total Donor-restricted funds $ (187,057) $ 4,668,577 $ 12,913,230 $ 17,394,750 Board-designated funds 234,728,842 – – 234,728,842 $ 234,541,785 $ 4,668,577 $ 12,913,230 $ 252,123,592

Hawai’i Pacific Health
Notes to Consolidated Financial Statements (continued)
58
15. Endowment (continued)
Changes in endowment net assets for the years ended June 30 consist of the following:
2017
Unrestricted Temporarily
Restricted Permanently
Restricted Total Endowment net assets,
beginning of year $ 234,541,785 $ 4,668,577 $ 12,913,230 $ 252,123,592 Investment income:
Investment income 2,726,451 195,128 – 2,921,579 Net appreciation (realized
and unrealized) 20,412,300 1,111,662 –
21,523,962 Total investment gain 23,138,751 1,306,790 – 24,445,541 Contributions – – 171,740 171,740 Appropriation of endowment
assets for expenditure – (226,960) – (226,960) Beneficial interest in
perpetual trust – – 258,016 258,016 Transfers 64,165 (91,526) – (27,361)
Endowment net assets, end of year $ 257,744,701 $ 5,656,881 $ 13,342,986 $ 276,744,568
2016
Unrestricted Temporarily
Restricted Permanently
Restricted Total Endowment net assets,
beginning of year $ 240,033,160 $ 5,470,935 $ 12,999,947 $ 258,504,042 Investment income (loss):
Investment income (loss) 3,343,276 237,897 – 3,581,173 Net depreciation (realized
and unrealized) (8,738,790) (751,815) – (9,490,605) Total investment loss (5,395,514) (513,918) – (5,909,432) Contributions – – 268,633 268,633 Appropriation of endowment
assets for expenditure (95,861) (331,535) – (427,396) Beneficial interest in
perpetual trust – – (355,350) (355,350) Transfers – 43,095 – 43,095
Endowment net assets, end of year $ 234,541,785 $ 4,668,577 $ 12,913,230 $ 252,123,592

Supplementary Information

59
2017 2016Assets Current assets:
Cash and cash equivalents 141,031,350$ 138,224,516$ Patient accounts receivable, less allowance for uncollectible
accounts (2017 – $6,998,000; 2016 – $7,187,000) 156,064,947 168,712,886 Due from third-party payors 13,459,316 3,075,192 Other receivables 9,307,332 9,871,301 Due from affiliates 5,818,024 – Inventories 17,846,427 16,626,837 Funds held by trustee under bond indenture agreement 19,922,004 18,865,059 Prepaid expenses and other 5,918,213 4,245,651
Total current assets 369,367,613 359,621,442 Assets whose use is limited or restricted:
Board-designated 188,766,083 172,087,504 Funds held by trustee under bond indenture agreement 15,605,698 16,586,274 Restricted by donor or grantor 31,824,502 60,727,191
Total assets whose use is limited or restricted 236,196,283 249,400,969 Investments 246,447,770 207,455,531 Property and equipment, net 537,649,078 523,913,669 Due from third-party payors 6,417,047 12,117,189 Other assets:
Investment in unconsolidated subsidiaries 46,682,049 38,971,814 Investments in joint ventures 25,000 25,000 Beneficial interest in net assets of foundations 60,166,674 41,536,560 Other 13,459,917 10,791,010
Total other assets 120,333,640 91,324,384 Total assets 1,516,411,431$ 1,443,833,184$
Members of the Hawai’i Pacific Health Obligated Group
Combined Balance Sheets
June 30

60
2017 2016Liabilities and net assets Current liabilities:
Accounts payable 41,890,037$ 56,722,869$ Payroll and related liabilities 73,646,931 73,626,895 Accrued expenses 22,059,611 26,410,455 Due to affiliates – 484,864 Due to third party payors 10,198,583 2,776,106 Current portion of long-term debt 6,346,970 6,158,844
Total current liabilities 154,142,132 166,180,033 Long-term debt, less current portion 340,914,270 347,261,241 Other long-term liabilities 36,711,286 40,363,835 Due to third party payors 10,105,787 20,846,293 Accrued pension liability 100,023,997 149,102,432 Net assets:
Unrestricted 837,181,544 654,479,306 Temporarily restricted 23,989,429 52,686,814 Permanently restricted 13,342,986 12,913,230
Total net assets 874,513,959 720,079,350
Total liabilities and net assets 1,516,411,431$ 1,443,833,184$
June 30
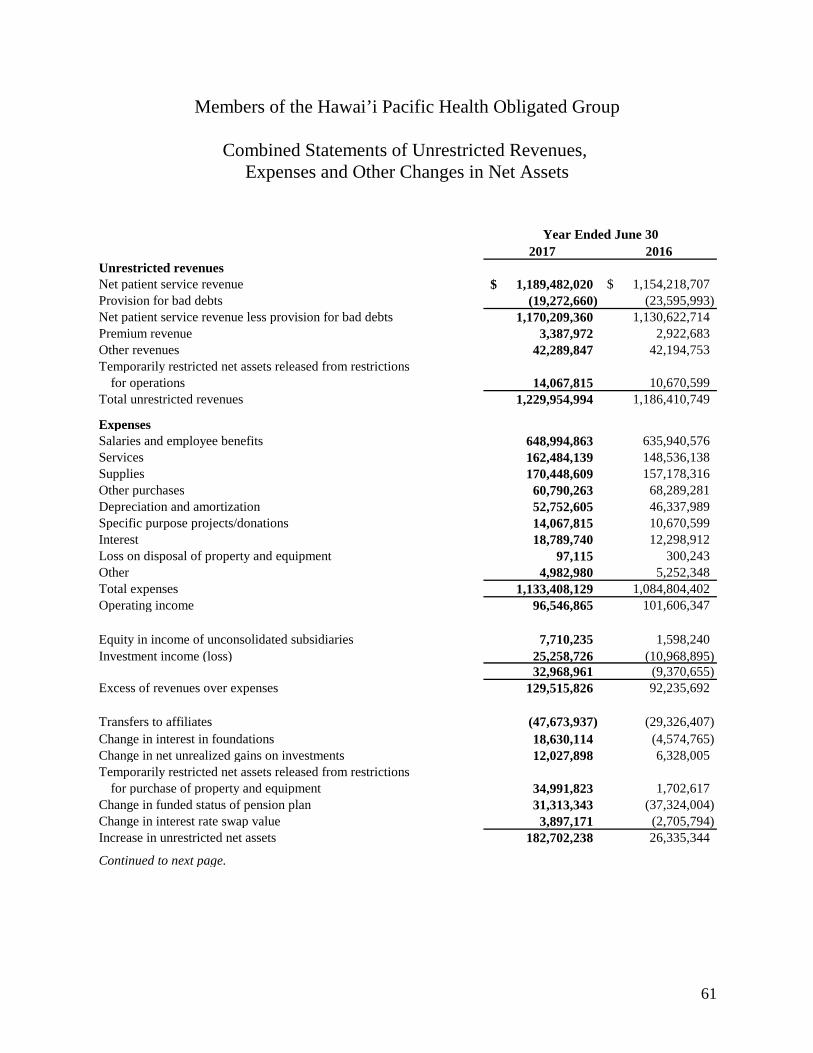
61
2017 2016Unrestricted revenues Net patient service revenue 1,189,482,020$ 1,154,218,707$ Provision for bad debts (19,272,660) (23,595,993) Net patient service revenue less provision for bad debts 1,170,209,360 1,130,622,714 Premium revenue 3,387,972 2,922,683 Other revenues 42,289,847 42,194,753 Temporarily restricted net assets released from restrictions
for operations 14,067,815 10,670,599 Total unrestricted revenues 1,229,954,994 1,186,410,749 Expenses Salaries and employee benefits 648,994,863 635,940,576 Services 162,484,139 148,536,138 Supplies 170,448,609 157,178,316 Other purchases 60,790,263 68,289,281 Depreciation and amortization 52,752,605 46,337,989 Specific purpose projects/donations 14,067,815 10,670,599 Interest 18,789,740 12,298,912 Loss on disposal of property and equipment 97,115 300,243 Other 4,982,980 5,252,348 Total expenses 1,133,408,129 1,084,804,402 Operating income 96,546,865 101,606,347 Equity in income of unconsolidated subsidiaries 7,710,235 1,598,240 Investment income (loss) 25,258,726 (10,968,895) 32,968,961 (9,370,655) Excess of revenues over expenses 129,515,826 92,235,692 Transfers to affiliates (47,673,937) (29,326,407) Change in interest in foundations 18,630,114 (4,574,765) Change in net unrealized gains on investments 12,027,898 6,328,005 Temporarily restricted net assets released from restrictions
for purchase of property and equipment 34,991,823 1,702,617 Change in funded status of pension plan 31,313,343 (37,324,004) Change in interest rate swap value 3,897,171 (2,705,794) Increase in unrestricted net assets 182,702,238 26,335,344
Continued to next page.
Members of the Hawai’i Pacific Health Obligated Group
Combined Statements of Unrestricted Revenues, Expenses and Other Changes in Net Assets
Year Ended June 30
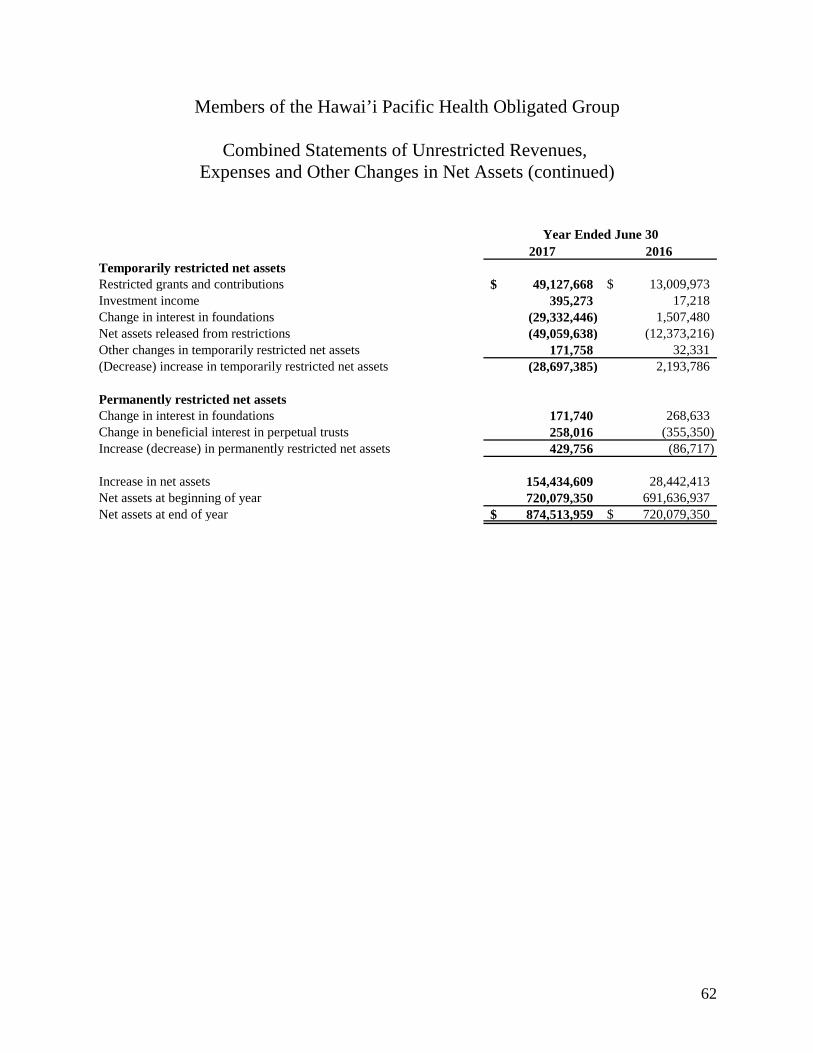
62
2017 2016Temporarily restricted net assets Restricted grants and contributions 49,127,668$ 13,009,973$ Investment income 395,273 17,218 Change in interest in foundations (29,332,446) 1,507,480 Net assets released from restrictions (49,059,638) (12,373,216) Other changes in temporarily restricted net assets 171,758 32,331 (Decrease) increase in temporarily restricted net assets (28,697,385) 2,193,786 Permanently restricted net assets Change in interest in foundations 171,740 268,633 Change in beneficial interest in perpetual trusts 258,016 (355,350) Increase (decrease) in permanently restricted net assets 429,756 (86,717) Increase in net assets 154,434,609 28,442,413 Net assets at beginning of year 720,079,350 691,636,937 Net assets at end of year 874,513,959$ 720,079,350$
Expenses and Other Changes in Net Assets (continued)
Year Ended June 30
Members of the Hawai’i Pacific Health Obligated Group
Combined Statements of Unrestricted Revenues,

63
2017 2016Operating activities Increase in net assets 154,434,609$ 28,442,413$ Adjustments to reconcile the increase in net assets
to net cash provided by operating activities: Change in interest in foundations 10,530,592 2,798,650 Depreciation and amortization 52,752,605 46,337,989 Provision for bad debts 19,272,660 23,595,993 Equity in income of unconsolidated subsidiaries (7,710,235) (1,598,240) Net (gains) losses on alternative investments (17,855,618) 5,604,360 Change in net unrealized gains on investments (12,027,898) (6,328,005) Realized (gains) losses on investments (1,760,214) 11,170,689 Loss on disposition of property and equipment 97,115 300,243 Temporarily and permanently restricted contributions (49,299,408) (13,278,606) Changes in operating assets and liabilities:
Patient accounts receivable (6,624,721) (26,082,650) Due to/from third-party payors, net (8,002,011) 13,325,882 Other receivables 563,969 (73,682) Inventories and other assets (5,561,059) (3,616,261) Accounts payable and accrued expenses (11,129,824) 13,998,813 Other long-term liabilities (3,652,549) (3,721,724) Accrued pension liability (49,078,435) 26,206,369
Net cash provided by operating activities 64,949,578 117,082,233 Investing activities Purchases of property and equipment (74,618,945) (131,929,963) Decrease in due to affiliates, net (6,302,888) (275,287) Purchases of investment securities (157,666,176) (132,283,348) Sales and maturities of investment securities 136,702,133 75,382,989 Assets whose use is limited or restricted:
Increase in funds held by trustee under bond indenture agreements (76,369) (1,624,506)
Purchases of investment securities (104,667,591) (77,762,148) Sales and maturities of investment securities 101,346,529 76,806,459 Net decrease in project funds held by trustee under
bond indenture agreement – 35,381,214 Net cash used in investing activities (105,283,307) (156,304,590) Continued to next page.
Members of the Hawai’i Pacific Health Obligated Group
Combined Statements of Cash Flows
Year Ended June 30
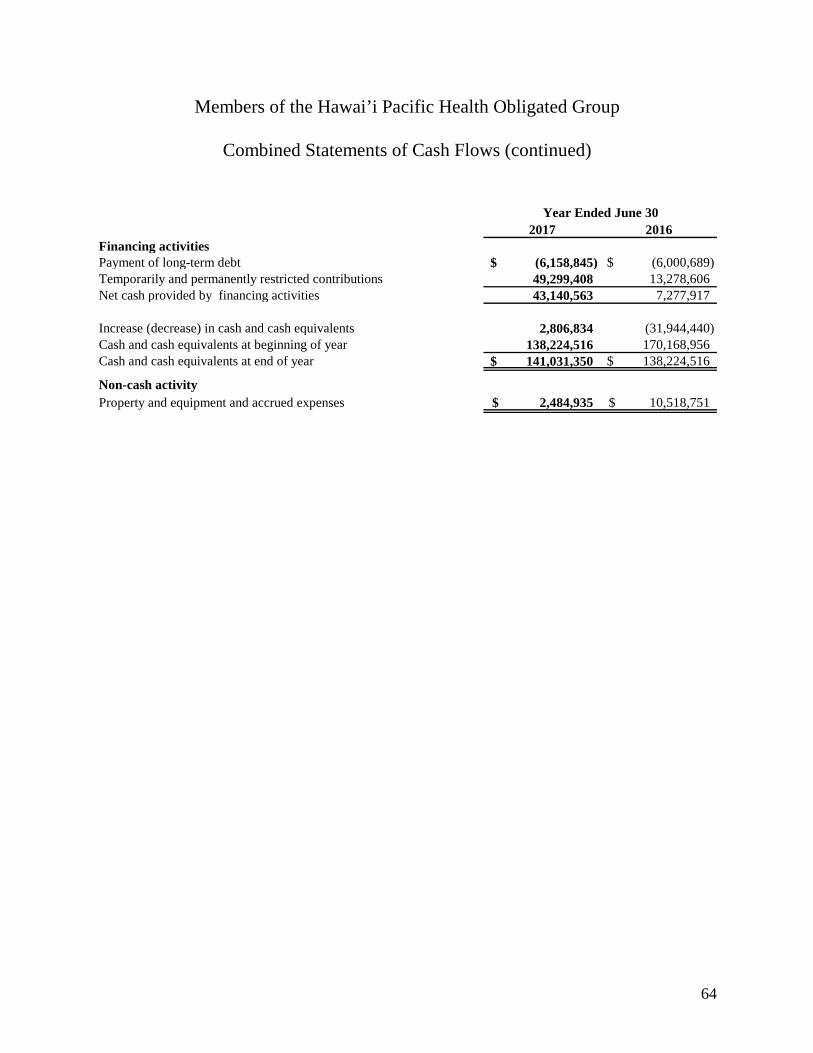
64
2017 2016Financing activities Payment of long-term debt (6,158,845)$ (6,000,689)$ Temporarily and permanently restricted contributions 49,299,408 13,278,606 Net cash provided by financing activities 43,140,563 7,277,917 Increase (decrease) in cash and cash equivalents 2,806,834 (31,944,440) Cash and cash equivalents at beginning of year 138,224,516 170,168,956 Cash and cash equivalents at end of year 141,031,350$ 138,224,516$
Non-cash activityProperty and equipment and accrued expenses 2,484,935$ 10,518,751$
Year Ended June 30
Members of the Hawai’i Pacific Health Obligated Group
Combined Statements of Cash Flows (continued)

65
Hawai’i Pacific Health
Note to Supplementary Information – Members of the Hawai’i Pacific Health Obligated Group
June 30, 2017
1. Combined Financial Statements
The combined financial statements present the financial position, results of operations, and cash flows of the Obligated Group members.
The members of the Obligated Group comprise:
• Hawai’i Pacific Health (parent company only) • Kapi’olani Medical Center for Women and Children • Pali Momi Medical Center • Straub Clinic & Hospital • Wilcox Memorial Hospital
As prescribed in The Hawai’i Pacific Health (HPH) Master Trust Indenture, except as noted below, the accompanying combined financial statements include only the Members of the Obligated Group. All significant intercompany transactions within the Obligated Group have been eliminated upon combination. Non-Obligated Group subsidiaries are presented in the combined financial statements using the equity method of accounting. Non-Obligated Group entities controlled through sole corporate membership and their subsidiaries are excluded from the special-purpose combined financial statements. Accounting principles generally accepted in the United States require that all majority-owned subsidiaries be consolidated and all controlled affiliates be combined with the financial statements of HPH.
EY | Assurance | Tax | Transactions | Advisory
About EYEY is a global leader in assurance, tax, transaction and advisory services. The insights and quality services we deliver help build trust and confidence in the capital markets and in economies the world over. We develop outstanding leaders who team to deliver on our promises to all of our stakeholders. In so doing, we play a critical role in building a better working world for our people, for our clients and for our communities.
EY refers to the global organization, and may refer to one or more, of the member firms of Ernst & Young Global Limited, each of which is a separate legal entity. Ernst & Young Global Limited, a UK company limited by guarantee, does not provide services to clients. For more information about our organization, please visit ey.com.
© 2017 Ernst & Young LLP. All Rights Reserved.
ey.com