hawaiian limpet harvesting in historical perspective: a review
TRANSCRIPT
21
Hawaiian Limpet Harvesting in Historical Perspective:A Review of Modern and Archaeological Data on Cellana spp.
from the Kalaupapa Peninsula, Moloka‘i Island1
Mark D. McCoy2
Abstract: The isolated Kalaupapa region, Moloka‘i Island, Hawai‘i, offers ar-chaeologists and ecologists a unique opportunity to study traditional Hawaiianlimpet (‘opihi) (Cellana spp.) harvesting from the Proto-Historic Period (1650–1795), Early Historic Period (1795–1866), and the present day. In this study, ar-chaeological collections, modern harvests, and field observations are used to de-scribe a regular pattern of slightly larger mean limpet size in western shorelineharvests and an increase in average limpet size from the Proto-Historic Periodto the present. Although further investigations are necessary to test alternativeexplanations, these results suggest (1) that shelter from ocean currents and tradewinds may provide a microenvironment favorable to local limpet growth, and (2)a lessening of harvesting pressure concurrent with the massive depopulation ofthe study area after European contact. Future studies should focus on identify-ing possible ecological factors impacting average size, documenting changes inlimpet size using specimens from archaeological deposits, and accounting forthe impact of population change on marine resources in historic and prehistoricHawai‘i.
Although archaeological studies ofthe Kalaupapa region, Moloka‘i Island,Hawai‘i, have been successful at trackingprehistoric expansion and intensification ofagriculture (Kirch 2002, Kirch et al. 2003,McCoy 2005a, McCoy and Hartshorn 2007),there is little notion of what impact, if any,past human occupation had on marine re-sources. Harvested shellfish are often a majorcomponent of archaeological deposits world-wide, especially in thick deposits built up overtime from persistent discard in the same loca-tion, commonly referred to as shell middens(see Bowdler 2006 for a recent review); how-
ever, the analysis of these remains by archae-ologists has been plagued by problematicworking assumptions (Erlandson 1988, Claas-sen 1998, Jackson et al. 2001, Mannino andThomas 2002). Until recently, it was com-monplace for archaeologists to assume thatshellfish had never made a substantial con-tribution to paleodiet and were best catego-rized as a ‘‘starvation food’’ or a ‘‘seasonalresource’’ (Erlandson 1988:102). More re-cently, when archaeological analyses havedetected a diminished abundance, reducedmean size, or extinction of shellfish, theseare unproblematically interpreted as evidenceof human overexploitation (Claassen 1998,Bowdler 2006:334). On the other extreme,there is the equally pervasive and problematicmyth of the ‘‘ecological Indian,’’ which as-sumes that prehistoric peoples were unfailingecological stewards who never overexploitednatural resources (Krech 1999, Kirch2005:423). However, these fallacies areslowly being debunked, and in their place re-searchers are simultaneously consideringenvironmental factors that impact shellfishpopulations ( Jerardino 1997), variation in hu-man harvesting and discard behavior (Bird
Pacific Science (2008), vol. 62, no. 1:21–38: 2008 by University of Hawai‘i PressAll rights reserved
1 This work was supported by the National ScienceFoundation (BSC-0535706), the Arizona Memorial Mu-seum Association, and the National Park Service. Manu-script accepted 20 February 2007.
2 Department of Anthropology and BehavioralSciences, One Washington Square, San Jose State Uni-versity, San Jose, California 95192-0113 (phone: 408-924-5542; e-mail: [email protected]).
and Bird 1997, Bird et al. 2002), and paleo-demography (Klein 1999:470–471) as poten-tially accounting for patterns observed.
In their recent review, Jackson et al.(2001) distinguished between three overlap-ping chapters in the history of human impacton marine resources: aboriginal, colonial, andglobal periods. Each period is characterizedby different extractive technologies, economicmotivations, and types of resource manage-ment. The authors noted that to take thiskind of historical perspective one must ‘‘sac-rifice some of the apparent precision and an-alytical elegance prized by ecologists’’ and usepaleoecological, archaeological, and historicalrecords ( Jackson et al. 2001:630). Indeed,there is an overall trend toward a closer rela-tionship between archaeology and ecology,especially with the explicit use of optimal for-aging models to interpret faunal remainsfrom archaeological deposits. Unfortunately,these studies have been narrowly focused onprehistoric aboriginal harvesting and rarelyaddress the historic period. Further, Manninoand Thomas (2002:458) noted that thereare ‘‘problems in using optimal foragingmodels as the primary basis for inferringover-exploitation . . . [because] human forag-ing strategies and processing decisions canhave a marked impact on what is incorporatedinto a developing midden’’ (see also Bird andBird 1997, Bird et al. 2002). Nonetheless, for-aging efficiency, diet breadth, and overexploi-tation are important factors in evaluatingmarine resource use over time.
Previous Research on Cellana spp.
Known locally as ‘opihi, Cellana spp. are a col-lection of several shellfish species endemic tothe Hawaiian Islands, including C. exarata( blackfoot), C. sandwicensis (yellowfoot), andC. talcosa (giant ‘opihi) (Kay and Magruder1977). These limpets occupy overlapping ba-salt shore habitats in the intertidal and sub-tidal coastal zones, with C. exarata preferringthe splash zone close to the shore, C. sandwi-censis slightly farther away, and the larger C.talcosa living farthest from the coast in thelow littoral and sublittoral zones at depths upto 10 m below sea level (Magruder and Kay
1983). Much of what is known about the bi-ology of Cellana spp. comes from studies con-ducted in the 1970s by Kay and Magruder(1977), who used a combination of data fromcollected specimens, harvests, and archaeo-logical collections to describe Hawaiian lim-pet biogeography and growth rates and todemonstrate a relationship between commer-cial harvesting pressure and average size.
The Kalaupapa Region, Moloka‘i Island
Located on Moloka‘i Island’s rugged northshore, the Kalaupapa region includes morethan 14.7 km (9.1 miles) of shoreline thatranges from sand beaches on Kalaupapa Pen-insula’s western and northern coasts to higheastern basalt benches and boulder beachesalong the base of sea cliffs (Figure 1). Thecoastline in the eastern half of the study areais directly exposed to trade winds and cur-rents that create a high-energy sea spray zoneyear-round (Canfield 1990). Indeed, oceantravel along this coast is virtually impossibleduring the winter months due to high swells.
In 1866, the Kingdom of Hawai‘i’s Boardof Health took advantage of the KalaupapaPeninsula’s natural isolation to resettle peoplewith Hansen’s disease (leprosy). Today, thearea is designated as a national historical parkand managed through a partnership betweenthe State of Hawai‘i’s Department of Healthand the U.S. National Park Service. Theformer cares for the local community’s lastremaining Hansen’s disease patients and theNational Park Service manages cultural andnatural resources (Alexander 1996).
Recent archaeological research in Kalau-papa has been centered on defining a historyof social development from A.D. 800 tothe foundation of the Hansen’s disease settle-ment in the midnineteenth century (Kirch2002, McCoy 2002, 2003, 2004, 2005a,b,2006). In brief, these studies suggested thatthe first secure signs of settlement and agri-cultural activities are in wetland environ-ments, specifically in local valleys and atthe bases of cliffs, and date to around A.D.1150–1200 (McCoy 2005a). Nonirrigatedfarming was strictly limited at first, but afterA.D. 1450–1550 there are clear signs of the
22 PACIFIC SCIENCE . January 2008
development of a large-scale agricultural fieldsystem that occupied the entire KalaupapaPeninsula (Kirch 2002, McCoy 2005a). How-ever, it was not until after A.D. 1650 that set-tlement expanded onto the peninsula itself.Oral traditions suggest that it was also at thattime that a local chiefdom centered on thenorthern half of the island was subjugated byits rivals and a monument to this defeat builtin the center of the peninsula (McCoy 2005b,Manning and Neller in press).
Previous Archaeological Research
Archaeologists throughout Oceania rely onshellfish remains to help reconstruct ancientdiet (see Kirch [2000] for a recent review ofOceanic prehistory). In the Kalaupapa region,
excavations at a cave shelter in the late 1960swere specifically aimed at using shellfish re-mains to learn more about local resource use(Kaupikiawa Cave, State of Hawaii Registerof Historic Places ID number 50-60-03-312[Hirata and Potts 1967, Pearson et al. 1974]).Of the five taxa described in postfieldworkanalysis, sea snail (Neritidae) and limpet (Cel-lana spp.) were selected to test changes in theaverage size of individuals over time. In thiscase, change in size was determined by count-ing the number of specimens per 200 g ofshell remains. Contrary to their expectations,the team found that shellfish increased inaverage size over time. Although they had nonotion of the actual date of the site’s use, theysuggested that the pattern ‘‘might be inferredto reflect a lessening of the pressure on the
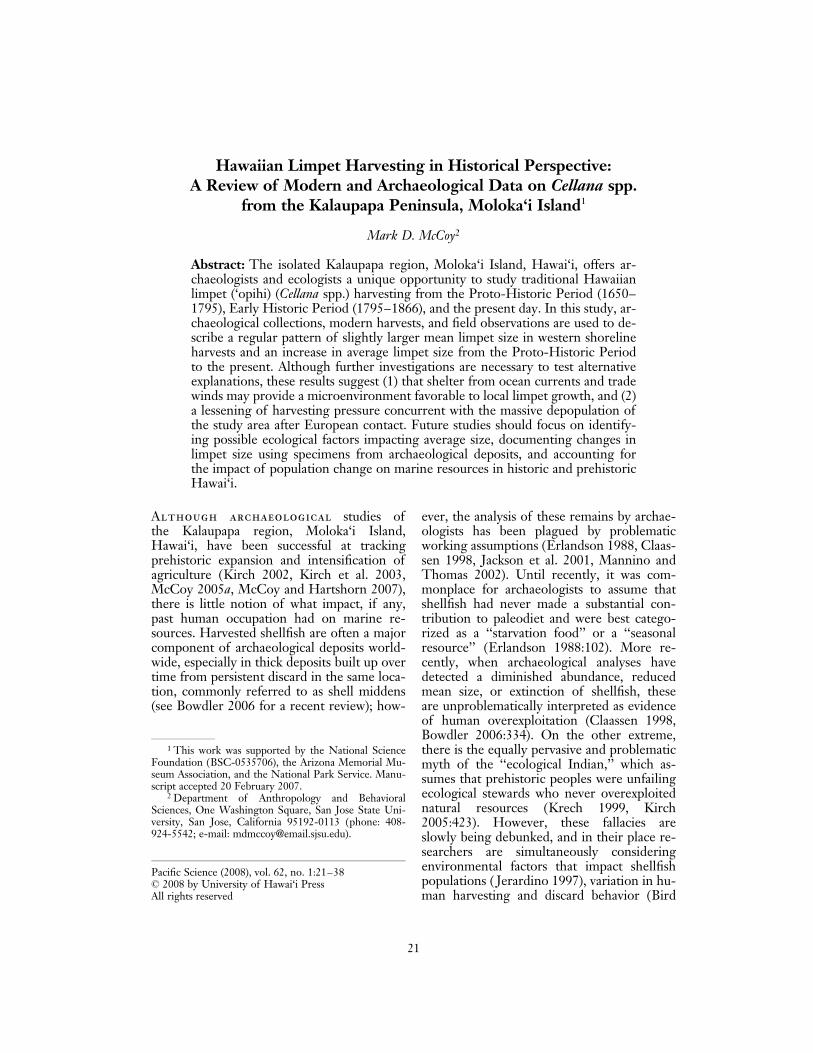
Figure 1. Kalaupapa region, Moloka‘i Island, Hawai‘i. Bold lines indicate community territory (ahupua‘a) boundaries.Archaeological sites are labeled with State of Hawai‘i Register of Historic Places identification numbers. Sites includehabitations (circles) and ritual sites (triangles); 100-foot elevation contours are shown.
Modern and Archaeological Data on Cellana spp. From Moloka‘i . McCoy 23
shell[fish] supply during the time period ofthe upper levels’’ (Pearson et al. 1974:48).However, it remained undetermined if thetrend was ‘‘the result of human activity relat-ing to the shellfish or to an internal dynamicwithin the shell[fish] population’’ (Pearson etal. 1974:49).
In 2000, Kirch (2002) revisited that cavesite and made small, column samples ofdeposit left exposed by the previous project’sexcavation pits. Next, modern sediment anal-yses and radiocarbon dates were used toestablish a firm site chronology (Kirch et al.2003). Several new radiocarbon dates (accel-erated mass spectrometry) on individual frag-ments of charcoal identified as short-livedspecies helped determine that the lowestartifact-free deposits in the cave markedburning in the area associated with initialdryland cultivation beginning in the twelfthcentury A.D. Next, sometime after A.D.1650, the site began to be used as a shelter,possibly as part of a larger house complex(Kirch et al. 2003). Finally, the discovery ofmetal and glass artifacts in the uppermostlevels showed that the occupation of the sitecontinued into the Early Historic Period.
Most important for this study, Kirch et al.(2003:16–19) made a thorough evaluation ofthe variety and amounts of food remainspresent, specifically noting that invertebrateand vertebrate species contributed roughlyequal amounts of the biomass represented,that density of invertebrate remains (thenumber of individual specimens per cubiccentimeter excavated) was highest at initialoccupation and decreased, and that C. sandwi-censis predominated over other Cellana spp.The first observation is consistent with inter-pretations of the area around the site as acommoner household located near the coast.At such a site we would expect fish and shell-fish to be regularly consumed, with domesti-cates, such as pig, reserved for higher-statuspeoples or ceremonial occasions (Kirch andO’Day 2003). The second pattern, decreasingdensity of shellfish remains, suggests a trendtoward less-abundant marine resources afterthe initial occupation of the site sometimeafter A.D. 1650.
Finally, Kirch et al. (2003) suggested that
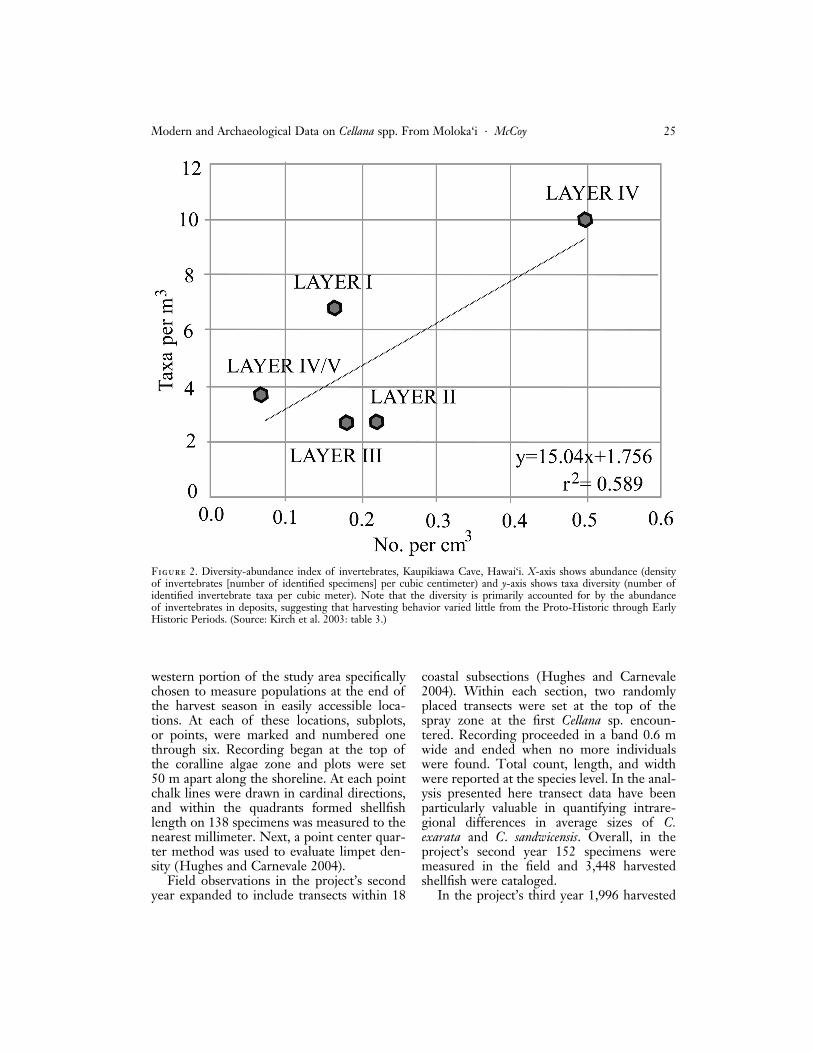
the virtual absence of one of the two com-mon nearshore limpets ‘‘may be indicative ofover-exploitation of C. exarata prior to theoccupation of the rockshelter’’ or simply ‘‘se-lective emphasis’’ on C. sandwicensis (Kirch etal. 2003:17). Although it is difficult to deter-mine definitively if overexploitation or selec-tive preference is responsible for this pattern,an analysis of invertebrate taxa suggests thatdiversity is primarily a function of the abun-dance of shellfish in the layer examined andthat harvesting behavior has been relativelystable over time (Figure 2) (r 2 ¼ 0:59).
materials and methods
Although the overall goal of this study is thereconstruction of traditional Hawaiian subsis-tence patterns, modern and archaeologicaldata on limpets (Cellana spp.) play an equallyimportant role in the analysis. Thus, eachdata set is described in the following sections.
Modern Data Collection
In the past decade, the Hawai‘i State Depart-ment of Health has banned shellfish gather-ing by visitors to the Kalaupapa region. Thus,collecting has been limited to perhaps lessthan 100 people, including Kalaupapa com-munity residents and other local Moloka‘iIsland residents accessing the area by smallboat. From 2002 to 2004, the natural re-sources division of Kalaupapa National His-torical Park took advantage of these lowlevels of harvesting to document Cellana spp.population biology through two methods:field examinations of shellfish and trackingthe size of shellfish harvested by local gather-ers (Hughes and Carnevale 2004). Gathererswere explicitly asked to report the locationof their catch and when during the year theywere collected. Following Kay and Magruder(1977), shellfish were sorted by size in 5 mmcategories and converted into percentagesby size class. Inspections of shellfish in thefield were made without removing individualanimals and then also converted into sizeclasses.
Field observations made in the study’s firstyear centered on two boulder beaches on the
24 PACIFIC SCIENCE . January 2008
western portion of the study area specificallychosen to measure populations at the end ofthe harvest season in easily accessible loca-tions. At each of these locations, subplots,or points, were marked and numbered onethrough six. Recording began at the top ofthe coralline algae zone and plots were set50 m apart along the shoreline. At each pointchalk lines were drawn in cardinal directions,and within the quadrants formed shellfishlength on 138 specimens was measured to thenearest millimeter. Next, a point center quar-ter method was used to evaluate limpet den-sity (Hughes and Carnevale 2004).
Field observations in the project’s secondyear expanded to include transects within 18
coastal subsections (Hughes and Carnevale2004). Within each section, two randomlyplaced transects were set at the top of thespray zone at the first Cellana sp. encoun-tered. Recording proceeded in a band 0.6 mwide and ended when no more individualswere found. Total count, length, and widthwere reported at the species level. In the anal-ysis presented here transect data have beenparticularly valuable in quantifying intrare-gional differences in average sizes of C.exarata and C. sandwicensis. Overall, in theproject’s second year 152 specimens weremeasured in the field and 3,448 harvestedshellfish were cataloged.
In the project’s third year 1,996 harvested
Figure 2. Diversity-abundance index of invertebrates, Kaupikiawa Cave, Hawai‘i. X-axis shows abundance (densityof invertebrates [number of identified specimens] per cubic centimeter) and y-axis shows taxa diversity (number ofidentified invertebrate taxa per cubic meter). Note that the diversity is primarily accounted for by the abundanceof invertebrates in deposits, suggesting that harvesting behavior varied little from the Proto-Historic through EarlyHistoric Periods. (Source: Kirch et al. 2003: table 3.)
Modern and Archaeological Data on Cellana spp. From Moloka‘i . McCoy 25
shellfish were sorted by size, bringing thetotal number of modern Cellana spp. speci-mens studied to date to 5,734 (Hughes andCarnevale 2004).
Archaeological Data Collection
To represent ancient harvests whole Cellanaspp. specimens were drawn from archaeolog-ical collections representing sites across theKalaupapa region (McCoy 2003, 2004) (Fig-ure 1, Table 1). Excavation methodology atthose sites employed arbitrary levels withinnatural layers that were dated using acceler-ated mass spectrometry (AMS) radiocarbondating of charcoal and/or the presence ofhistoric materials (metal, glass, ceramics). Ex-cavations targeted floor deposits or food rub-bish dumps assumed to represent multipleyears of harvesting. Table 1 shows the depth,interpretation, and age of deposits.
Shellfish collections include a proportion-ately large number of specimens from twohabitation sites dated to a time in Hawaiianculture history called the Proto-HistoricPeriod (A.D. 1650–1795). One site is locatedon the Nıhoa Landshelf (50-60-03-2110)ðn ¼ 87Þ, and the other is on the eastern coastnear the transition from high bench to boul-der beach (50-60-03-2065) ðn ¼ 48Þ (Figure1). Smaller amounts of Cellana spp. were alsofound in several sites in the center of the pen-insula, including a temple (heiau) (50-60-03-294) ðn ¼ 48Þ, a structure interpreted as a
shrine (50-60-03-2297) ðn ¼ 16Þ on the bor-der between two communities, and a simplehouse site (50-60-03-2249) ðn ¼ 20Þ likelyoccupied in the past by commoner-class peo-ple. In addition, at a site in the western com-munity territory (ahupua‘a) called Kalaupapaseveral large specimens (C. talcosa) were foundintentionally placed under floor paving stones(50-60-03-2303). Historic-Period collectionsinclude a large number of shellfish from twohabitation sites including later-period depos-its at the same site referred to earlier on theNıhoa Landshelf (50-60-03-2110) ðn ¼ 121Þand a different eastern-coast house site adja-cent to high-bench shoreline (50-60-03-1967) ðn ¼ 36Þ.
The length of specimens was measured bycaliper, converted into 5 mm size categories,and reported as percentages by size class. Be-cause archaeological collections lacked distin-guishing color markings due to their age,only C. talcosa could be identified reliably.In total, 381 individual specimens from ar-chaeological collections were examined forthis study.
results
Results of analysis are presented here in termsof two empirical questions: (1) What geo-graphic variability is evident in modern Cel-lana spp. within the study area? and (2) Howhas average Cellana spp. length changed overthe last 350 yr?
TABLE 1
Summary of Archaeological Site Excavations, Kalaupapa Region, Hawai‘i
CommunityTerritory
SiteFunction
StateSite No. Layer/Level Era
Kalaupapa Habitation 2110 I/2 to I/4 Proto-Historic (A.D. 1650–1795)Kalaupapa Habitation 2110 I/1 Early Historic (A.D. 1795–1866)Kalaupapa Habitation 2303 I/1 to I/2 Expansion Period (ca. A.D. 1150)Makanalua Ritual 294 I/1 to II/4 and Fea. 1 Traditional Era (A.D. 800–1795)Makanalua Habitation 2249 I/1 to II/2 Proto-Historic (A.D. 1650–1795)Makanalua Ritual 2297 I/1 to II/3 Traditional Era (A.D. 800–1795)Kalawao Habitation 2065 I/1 to II/2 Proto-Historic (A.D. 1650–1795)Kalawao Habitation 1967 I/1 to I/2 Early Historic (A.D. 1795–1866)
Source: McCoy (2003, 2004).
26 PACIFIC SCIENCE . January 2008
Cellana spp. Geographic Variation
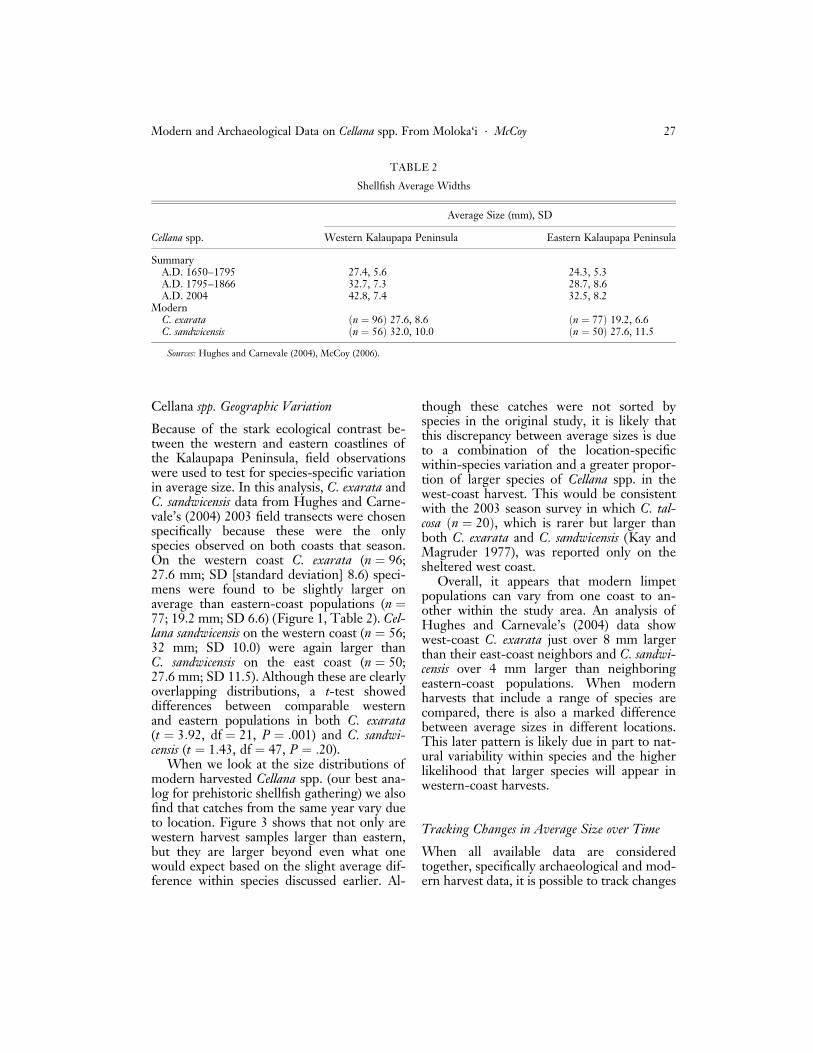
Because of the stark ecological contrast be-tween the western and eastern coastlines ofthe Kalaupapa Peninsula, field observationswere used to test for species-specific variationin average size. In this analysis, C. exarata andC. sandwicensis data from Hughes and Carne-vale’s (2004) 2003 field transects were chosenspecifically because these were the onlyspecies observed on both coasts that season.On the western coast C. exarata (n ¼ 96;27.6 mm; SD [standard deviation] 8.6) speci-mens were found to be slightly larger onaverage than eastern-coast populations (n ¼77; 19.2 mm; SD 6.6) (Figure 1, Table 2). Cel-lana sandwicensis on the western coast (n ¼ 56;32 mm; SD 10.0) were again larger thanC. sandwicensis on the east coast (n ¼ 50;27.6 mm; SD 11.5). Although these are clearlyoverlapping distributions, a t-test showeddifferences between comparable westernand eastern populations in both C. exarata(t ¼ 3:92, df ¼ 21, P ¼ :001) and C. sandwi-censis (t ¼ 1:43, df ¼ 47, P ¼ :20).
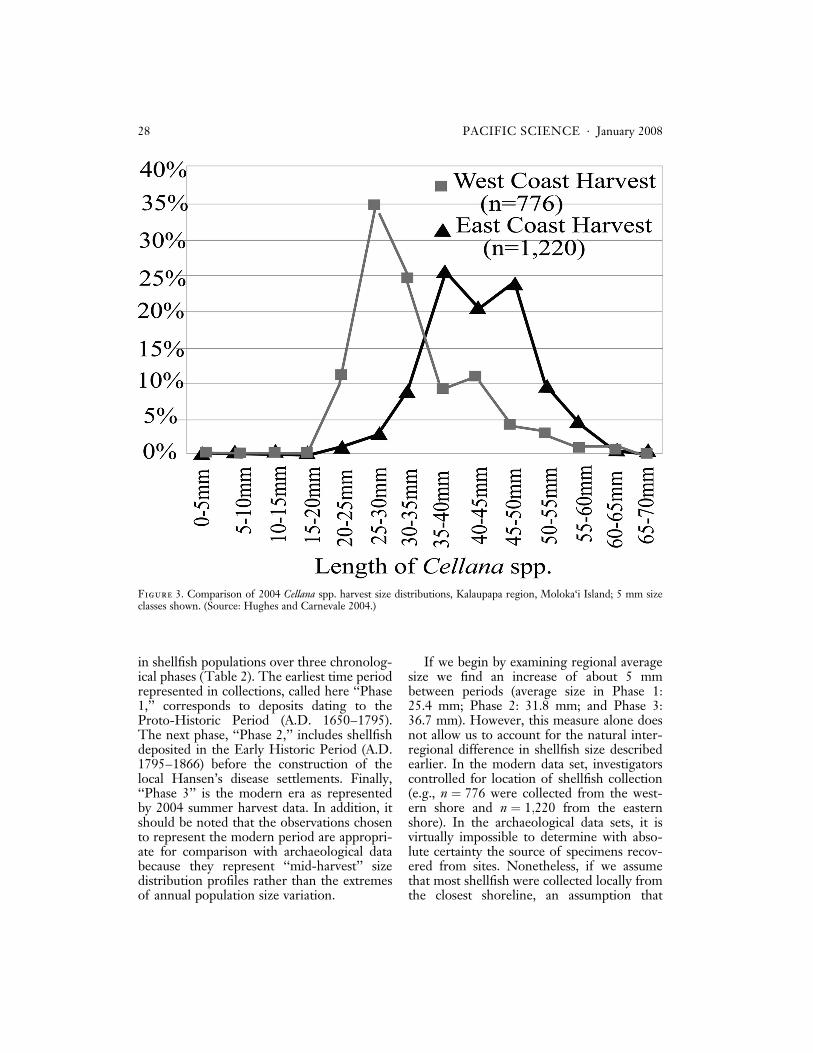
When we look at the size distributions ofmodern harvested Cellana spp. (our best ana-log for prehistoric shellfish gathering) we alsofind that catches from the same year vary dueto location. Figure 3 shows that not only arewestern harvest samples larger than eastern,but they are larger beyond even what onewould expect based on the slight average dif-ference within species discussed earlier. Al-
though these catches were not sorted byspecies in the original study, it is likely thatthis discrepancy between average sizes is dueto a combination of the location-specificwithin-species variation and a greater propor-tion of larger species of Cellana spp. in thewest-coast harvest. This would be consistentwith the 2003 season survey in which C. tal-cosa ðn ¼ 20Þ, which is rarer but larger thanboth C. exarata and C. sandwicensis (Kay andMagruder 1977), was reported only on thesheltered west coast.
Overall, it appears that modern limpetpopulations can vary from one coast to an-other within the study area. An analysis ofHughes and Carnevale’s (2004) data showwest-coast C. exarata just over 8 mm largerthan their east-coast neighbors and C. sandwi-censis over 4 mm larger than neighboringeastern-coast populations. When modernharvests that include a range of species arecompared, there is also a marked differencebetween average sizes in different locations.This later pattern is likely due in part to nat-ural variability within species and the higherlikelihood that larger species will appear inwestern-coast harvests.
Tracking Changes in Average Size over Time
When all available data are consideredtogether, specifically archaeological and mod-ern harvest data, it is possible to track changes
TABLE 2
Shellfish Average Widths
Average Size (mm), SD
Cellana spp. Western Kalaupapa Peninsula Eastern Kalaupapa Peninsula
SummaryA.D. 1650–1795 27.4, 5.6 24.3, 5.3A.D. 1795–1866 32.7, 7.3 28.7, 8.6A.D. 2004 42.8, 7.4 32.5, 8.2
ModernC. exarata ðn ¼ 96Þ 27.6, 8.6 ðn ¼ 77Þ 19.2, 6.6C. sandwicensis ðn ¼ 56Þ 32.0, 10.0 ðn ¼ 50Þ 27.6, 11.5
Sources: Hughes and Carnevale (2004), McCoy (2006).
Modern and Archaeological Data on Cellana spp. From Moloka‘i . McCoy 27
in shellfish populations over three chronolog-ical phases (Table 2). The earliest time periodrepresented in collections, called here ‘‘Phase1,’’ corresponds to deposits dating to theProto-Historic Period (A.D. 1650–1795).The next phase, ‘‘Phase 2,’’ includes shellfishdeposited in the Early Historic Period (A.D.1795–1866) before the construction of thelocal Hansen’s disease settlements. Finally,‘‘Phase 3’’ is the modern era as representedby 2004 summer harvest data. In addition, itshould be noted that the observations chosento represent the modern period are appropri-ate for comparison with archaeological databecause they represent ‘‘mid-harvest’’ sizedistribution profiles rather than the extremesof annual population size variation.
If we begin by examining regional averagesize we find an increase of about 5 mmbetween periods (average size in Phase 1:25.4 mm; Phase 2: 31.8 mm; and Phase 3:36.7 mm). However, this measure alone doesnot allow us to account for the natural inter-regional difference in shellfish size describedearlier. In the modern data set, investigatorscontrolled for location of shellfish collection(e.g., n ¼ 776 were collected from the west-ern shore and n ¼ 1;220 from the easternshore). In the archaeological data sets, it isvirtually impossible to determine with abso-lute certainty the source of specimens recov-ered from sites. Nonetheless, if we assumethat most shellfish were collected locally fromthe closest shoreline, an assumption that
Figure 3. Comparison of 2004 Cellana spp. harvest size distributions, Kalaupapa region, Moloka‘i Island; 5 mm sizeclasses shown. (Source: Hughes and Carnevale 2004.)
28 PACIFIC SCIENCE . January 2008
ideally should be tested in future using inde-pendent data, then it is possible to tenta-tively group prehistoric and historic-periodcollections by shoreline (e.g., in Phase 1,n ¼ 87 assigned to the western shore, n ¼68 to the eastern shore; in Phase 2, n ¼ 121assigned to the western shore, n ¼ 36 tothe eastern shore). Following this grouping,observed modern interregional size differencewas used as a benchmark to assess the degreeof geographic segregation represented. Thiswas based on the assumption that if shellfishfrom archaeological sites are dominated bylocal catches, then the difference betweenwestern and eastern sites should be similar tothe observed modern average difference indirectionality (i.e., western larger than eastern
shellfish) and degree (i.e., ca. 3–10 mm differ-ence in average size). In all, it appears thatthese groupings are reasonable, if imperfect,proxy evidence for local catches because inboth prehistoric and historic deposits westernshellfish are larger than eastern shellfish andthis size difference is within the low end ofthe range observed in modern catches (i.e.,3–4 mm).
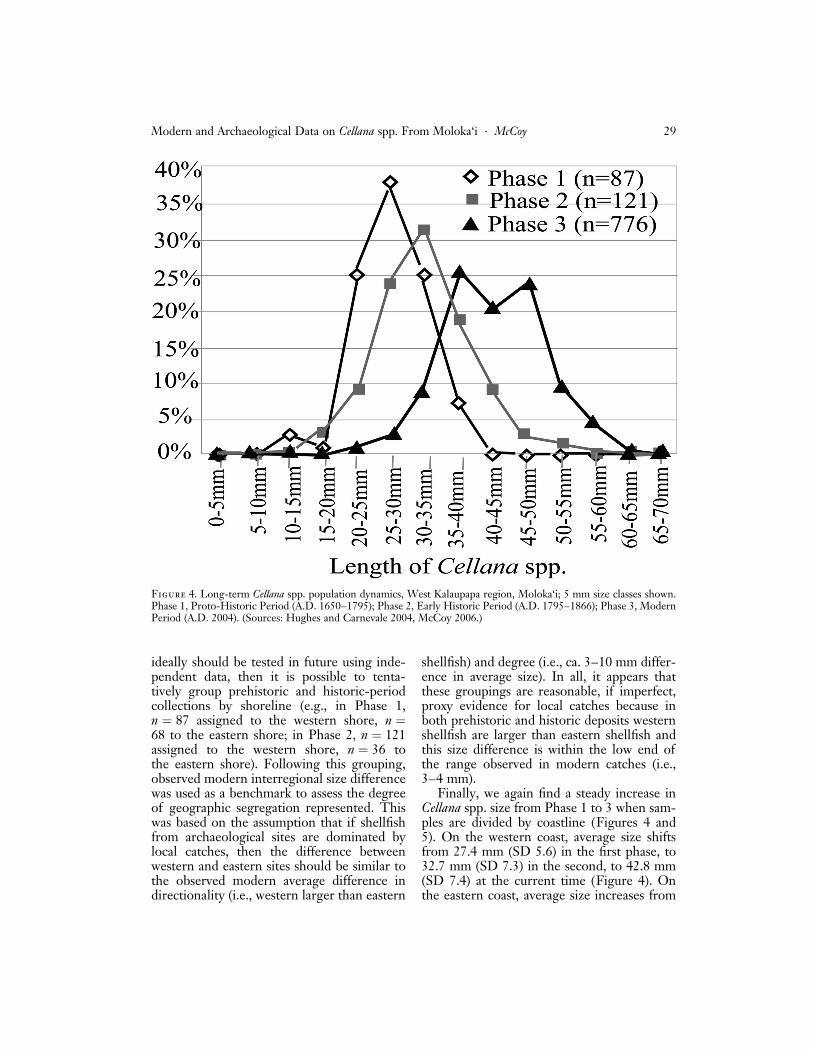
Finally, we again find a steady increase inCellana spp. size from Phase 1 to 3 when sam-ples are divided by coastline (Figures 4 and5). On the western coast, average size shiftsfrom 27.4 mm (SD 5.6) in the first phase, to32.7 mm (SD 7.3) in the second, to 42.8 mm(SD 7.4) at the current time (Figure 4). Onthe eastern coast, average size increases from
Figure 4. Long-term Cellana spp. population dynamics, West Kalaupapa region, Moloka‘i; 5 mm size classes shown.Phase 1, Proto-Historic Period (A.D. 1650–1795); Phase 2, Early Historic Period (A.D. 1795–1866); Phase 3, ModernPeriod (A.D. 2004). (Sources: Hughes and Carnevale 2004, McCoy 2006.)
Modern and Archaeological Data on Cellana spp. From Moloka‘i . McCoy 29
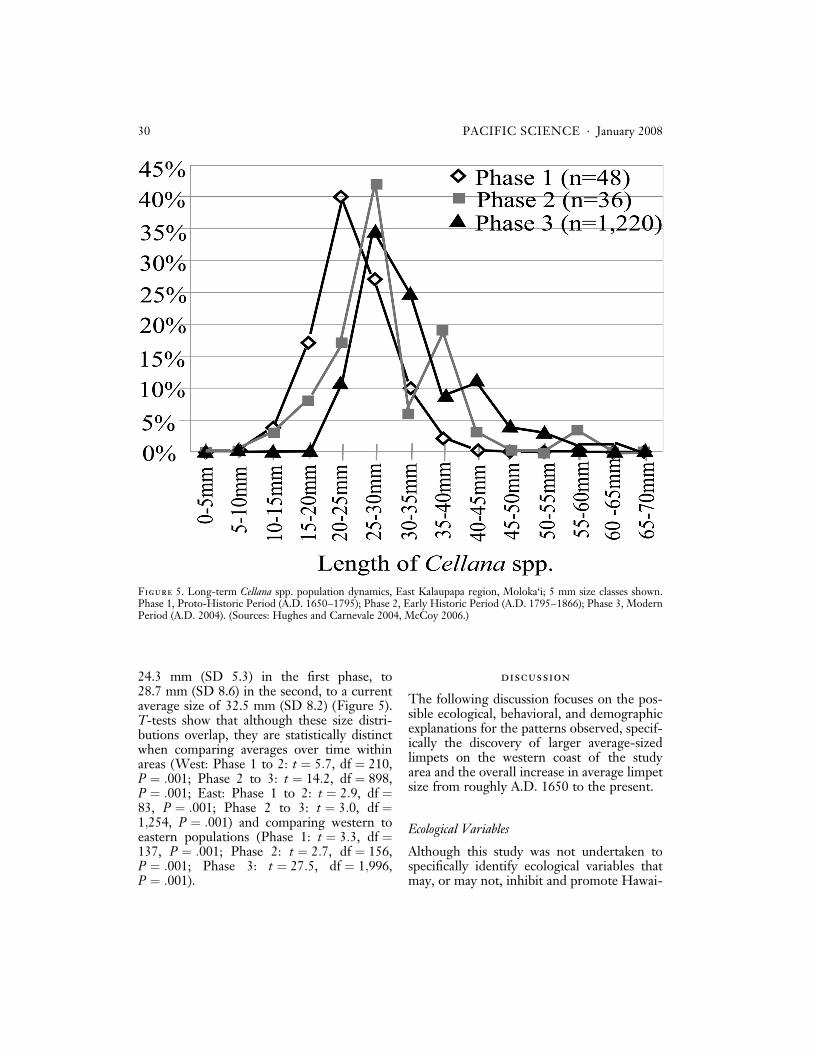
24.3 mm (SD 5.3) in the first phase, to28.7 mm (SD 8.6) in the second, to a currentaverage size of 32.5 mm (SD 8.2) (Figure 5).T-tests show that although these size distri-butions overlap, they are statistically distinctwhen comparing averages over time withinareas (West: Phase 1 to 2: t ¼ 5:7, df ¼ 210,P ¼ :001; Phase 2 to 3: t ¼ 14:2, df ¼ 898,P ¼ :001; East: Phase 1 to 2: t ¼ 2:9, df ¼83, P ¼ :001; Phase 2 to 3: t ¼ 3:0, df ¼1;254, P ¼ :001) and comparing western toeastern populations (Phase 1: t ¼ 3:3, df ¼137, P ¼ :001; Phase 2: t ¼ 2:7, df ¼ 156,P ¼ :001; Phase 3: t ¼ 27:5, df ¼ 1;996,P ¼ :001).
discussion
The following discussion focuses on the pos-sible ecological, behavioral, and demographicexplanations for the patterns observed, specif-ically the discovery of larger average-sizedlimpets on the western coast of the studyarea and the overall increase in average limpetsize from roughly A.D. 1650 to the present.
Ecological Variables
Although this study was not undertaken tospecifically identify ecological variables thatmay, or may not, inhibit and promote Hawai-
Figure 5. Long-term Cellana spp. population dynamics, East Kalaupapa region, Moloka‘i; 5 mm size classes shown.Phase 1, Proto-Historic Period (A.D. 1650–1795); Phase 2, Early Historic Period (A.D. 1795–1866); Phase 3, ModernPeriod (A.D. 2004). (Sources: Hughes and Carnevale 2004, McCoy 2006.)
30 PACIFIC SCIENCE . January 2008
ian limpet (Cellana spp.) growth, it is impor-tant to qualify the study’s findings in termsof ecological variables that may influencegrowth: water turbidity and soil erosion, seasurface temperature, and sea level and shore-line change.
First, water turbidity and soil erosion fromterrestrial sources are considered in concerthere because they share the same vector ofpotential impact on limpet growth—anincrease in the inorganic content of water.Previous studies have linked increases in inor-ganic material in water with increased energyexpenditure on separating out nonnutritiousfrom nutritious material, in some cases result-ing in smaller-sized limpets (Griffiths 1980).In the study area, there are two major factorsimpacting ocean water turbidity at any onetime and place: seasonal variation and levelof exposure to ocean currents and tradewinds. In this regard, although both coastshave turbulent winter seas, the western coasthas greater natural shelter from northeasterntrade winds and currents provided by theKalaupapa Peninsula. In their recent studyof Kalaupapa limpets, Kay et al. (2005) tenta-tively linked local ocean conditions on thewestern coast and limpet growth. They (Kayet al. 2005:6–7) described the area as ‘‘unique,in that it is generally tidally dominated in thesummer, being protected from trade winds.In the winter, it is fully exposed to the North-west swell. . . . The proportion of spent C.exarata and C. sandwicensis at KALA duringthe initial sampling was 0.6 and 1.0, respec-tively, and much greater than that at theother sites. This indicates that a major spawn-ing event preceded the initial sampling time,coinciding with the end of the wave season.It is currently unclear what role waves playin the spawning of these two species, but itwould appear that this is an avenue of inquiryworth pursuing. The relatively special waveconditions exhibited at KALA would be in-strumental in such a study.’’
In terms of soil erosion, what impacterosion may, or may not, have had on marineenvironments is poorly known. The two pri-mary local vectors of erosion that may impactmarine environments are colluvial mass wast-
ing from sea cliffs and wind erosion of theKalaupapa Peninsula’s fine, dry soils. Thenorth-shore cliffs themselves formed over1.5 million yr ago as a product of the WailauLandslide, one of the world’s most dramaticerosional events (Clague et al. 1982, Mac-donald et al. 1983). Indeed, it is still an activecolluvial environment from the base of thecliffs to the coastline. Shifting focus to theKalaupapa Peninsula itself, a recent study hasshown that wind erosion increased due to in-tensive farming during the Proto-HistoricPeriod (McCoy and Hartshorn 2007). How-ever, consistent northeast trade winds ensurethat sediment is deposited in a predictablepattern on the central and western peninsulawith presumably little contribution to the lee-ward marine environment.
Second, although lower sea temperatureis known to promote mollusks’ growth, un-fortunately existing direct measurements ofsea surface temperature cannot be used todistinguish variation within the study area.The closest ocean surface buoy is NorthernMoloka‘i (Station ID no. 51026; 21.35� N,156.93� W ), located over 30 miles (48.3 km)north of the Kalaupapa Peninsula at the tran-sition between the western and eastern coasts;thus it can only give us a general idea of therange of average temperatures in the studyarea (from January 1993 to November 1996,highest temperatures were in August–September, 27�C, and lowest in February–March, 23�C [source: http://www.ndbc.noaa.gov/station_page.php?station=51026]).Terrestrial-based measures of solar radia-tion, although not a direct measure of seasurface temperature, show higher levels onthe western half of Moloka‘i’s north coast(400–500 estimated solar calories per cm2
per day) versus the eastern half (300 esti-mated solar calories per cm2 per day)(source: http://www.hawaii.gov/dbedt/gis).This pattern is likely due to the shading ef-fects of deep eastern valleys, and it is un-clear how this may, or may not, impact seasurface temperature.
One potentially good proxy indicator forsea surface temperature in the study area iscoral reef development. The eastern coast has
Modern and Archaeological Data on Cellana spp. From Moloka‘i . McCoy 31
no substantial reef development, but the westcoast has an estimated 40.75 ha (100.7 acres)of coral reef, a rarity on the island’s northcoast, which certainly suggests warmer con-ditions, perhaps due to the natural shelterprovided by the Kalaupapa Peninsula fromcolder, northern Pacific waters. Overall, al-though this indirect evidence of sea surfacetemperature suggests that the eastern shoremay have a cooler temperature regime bettersuited for mollusk growth, this does not helpexplain why western limpets are on averagelarger. Turning to the historical pattern ofincreased size, climate change effects on seasurface temperature since A.D. 1650 couldindeed be influencing the mean size of shell-fish, but again this remains untestable withcurrent data.
Third, sea level and shoreline change havebeen the center of a number of studies acrossthe Hawaiian Islands (see Juvik and Juvik1998:37–96). However, there is little fine-grained data on the study area with the excep-tion of a geological study on the northeastcoast of the Kalaupapa Peninsula (Fletcher1994). The results of that limited study wereequivocal on the topic of shoreline changeduring the time period in question. However,Fletcher (1994:6) did note that althoughKalaupapa series soil substrate ‘‘probablydates from the glacial lowstand of the seaaround 18 ka . . . the marine conglomeratelayer is a product of overwash during theKapapa Stand about 4 to 5 ka,’’ suggestingthat much of the Kalaupapa Peninsula’scoastline has been relatively stable in the re-cent past. In sum, more research is needed toeliminate a shift in the character of the coast-line as a factor impacting geographic andtemporal patterns observed.
Overall, it seems likely that the naturallyhigher water turbidity of the eastern shore,and the relative shelter of the western shorefrom ocean currents and trade winds, is re-sponsible for the observed geographic pattern(see Kay et al. 2005). There are no knownecological factors that can account for thetemporal pattern observed; however furtherwork is necessary to definitively eliminatethe influence of climate change, geomorpho-logically active shorelines, and soil erosion.
Harvesting Behavior
Historical and archaeological data speak tothe question of how much harvesting behav-iors can account for the patterns observed.To begin, it is important to keep in mindthat in Jackson et al.’s (2001) terms, the Ka-laupapa region has maintained an aboriginaltype of marine harvesting ethic from the pre-historic through to the modern period due toits natural isolation and a unique nineteenth-century phenomenon that ended commercialenterprises in the area—the establishment ofa leprosarium in 1866. However, just beforethat period, as the Hawaiian Kingdom wasdrawn in to the global economy, there wasan increase in agricultural exports from theKalaupapa region due to the soaring demandfor food in Gold Rush–era markets of Cali-fornia (Ladefoged 1993, McCoy 2005a).However, this was short-lived, probably notlasting long after the market for exportedcommodities returned to near pre–GoldRush levels in the early 1850s. Newspaper re-ports from the time referred to the high agri-cultural fertility of the area, but no mentionwas made of the exploitation of marine re-sources for commercial proposes or other-wise. Today, government agencies overseethe management of natural resources andonly small-scale local fishing is allowed.
Nonetheless, if harvesters’ shellfish sizepreference shifted toward larger individualsover time, or consistently favored relativelylarger individuals on the western coast, thismight explain the geographic and temporalpatterns found. However, as noted earlier,the analysis of invertebrates found in Kaupi-kiawa Cave deposits does not show major evi-dence for an active shift in the compositionof shellfish gathered (Kirch et al. 2003). Nat-urally, it is difficult to know with certaintythat this relative stability in diet breadth ex-tends to choice of size. In terms of moderncatches, there are no reported preferencesthat would help explain this pattern. Furtherethnographic work similar to Glazier’s (2007)study of modern Hawaiian fishing would cer-tainly help qualify the results in terms of har-vesting strategies.
Overall, although all current historic and
32 PACIFIC SCIENCE . January 2008
archaeological evidence points to relativelystable harvesting behavior over time, there isa need for more ethnographic research ontraditional harvesting.
Demography
Studies of Hawaiian paleodemography haveproduced peak Native Hawaiian populationestimates ranging from 120,000, to 400,000,to over one million (Stannard 1989, Dye andKomori 1992). However, the natural isolationof the Kalaupapa region makes it an ideallocation to quantify human population size.The first census of the region, reported bymissionaries in 1836, placed local population,probably including the Waikolu Valley,at around 2,700 (The Missonary Herald1836:18), accounting for roughly 30% of theisland’s total population. This is a remarkablyhigh estimate given that the population ofthe entire Waialua District on O‘ahu in1831–1832 was roughly the same at 2,640(Schmitt 1973:9, as cited in Kirch and Sahlins1992:96), and at 130 people per square kilo-meter (2,700 over 20.8 km2) Kalaupapa wouldhave been extremely more populous than themost sparsely populated areas of Hawai‘i,such as historic Kahikinui, Maui, at 7.2people per square kilometer (Kirch et al.2004). Census data increased in frequencyand quality over the next 30 yr as Kalaupapareceived its first missionary minister in 1839(Hitchcock 1841, Somers 1985:25, Ladefoged1990:9), people began to report to the Mahaleland commission (Kirch 2002, Coulter1931:20), and the region became a homefor leprosy patients in 1866 (Greene 1985).Overall, except for the peak in population af-ter 1900 due to the cumulative number of pa-tients sent to Kalaupapa, the general historictrend of depopulation is on the same orderas the decrease in Moloka‘i’s population overthe same period. For example, in 1836 islandpopulation was estimated at 8,700, whereasby 1853 it was only 3,607 (The MissionaryHerald 1836:18, Coulter 1931:20).
A shockingly high initial estimate byGoodwin (1994:38) of the peak pre–European contact Native Hawaiian popula-tion for the Kalaupapa region of 5,000 to
10,000 assumed a historic-period popula-tion decline on the order of 50–90% due tointroduced disease before the first census(Schmitt 1968:15–45, Stannard 1989:12, 54–58). However, if one accepts Emory’s (1953)population estimate of 10,500 for Moloka‘iin 1778 (as cited in Summers 1971), a figurebased on a total population of around300,000 for the Hawaiian Islands, and thefirst missionary census of 8,700, then theisland experienced only a 17% populationdecrease in the first 57 yr after contact (seeSummers 1971:3). Summers (1971:3), whosupports that scenario, attributed this rela-tively small decrease compared with that ofother islands to Moloka‘i ‘‘being one of thelesser islands . . . [with] poor anchorage . . .[and] not frequently visited by white men.’’Turning back to the Kalaupapa region, if the1778 population is proportional to the figuresin the first census (i.e., with the regionaccounting for 30% of the total islandpopulation), then using Emory’s (1953) esti-mate, contact population would have been3,260, much lower than Goodwin’s (1994:38)estimate.
Further, it is possible to estimate the over-all peak Proto-Historic Period density ofpopulation of the study area based on archae-ological surface-survey data on habitationsites (see McCoy 2005b for a review of sur-veys). First, if we consider the number ofProto-Historic Period habitation sites persquare kilometer in each individual surveytract we find that the densities of the twolowest-density sections are similar to the pub-lished density of 120 structures per squarekilometer in the Kahikinui District of Maui(Kirch et al. 2004), and one large surveyin the permanently occupied section of thepeninsula showed almost three times the den-sity at 330 structures per square kilometer(Kirch 2002), with smaller surveys and surveysof intermittent-use areas showing densitiesranging between 600 and 840 structures persquare kilometer. From this, the averagedensity was calculated as 279 structures persquare kilometer over roughly 0.6 km2. Ifactual population density is proportional topeak estimated Kahikinui population density(43–57 per square kilometer, an estimate
Modern and Archaeological Data on Cellana spp. From Moloka‘i . McCoy 33
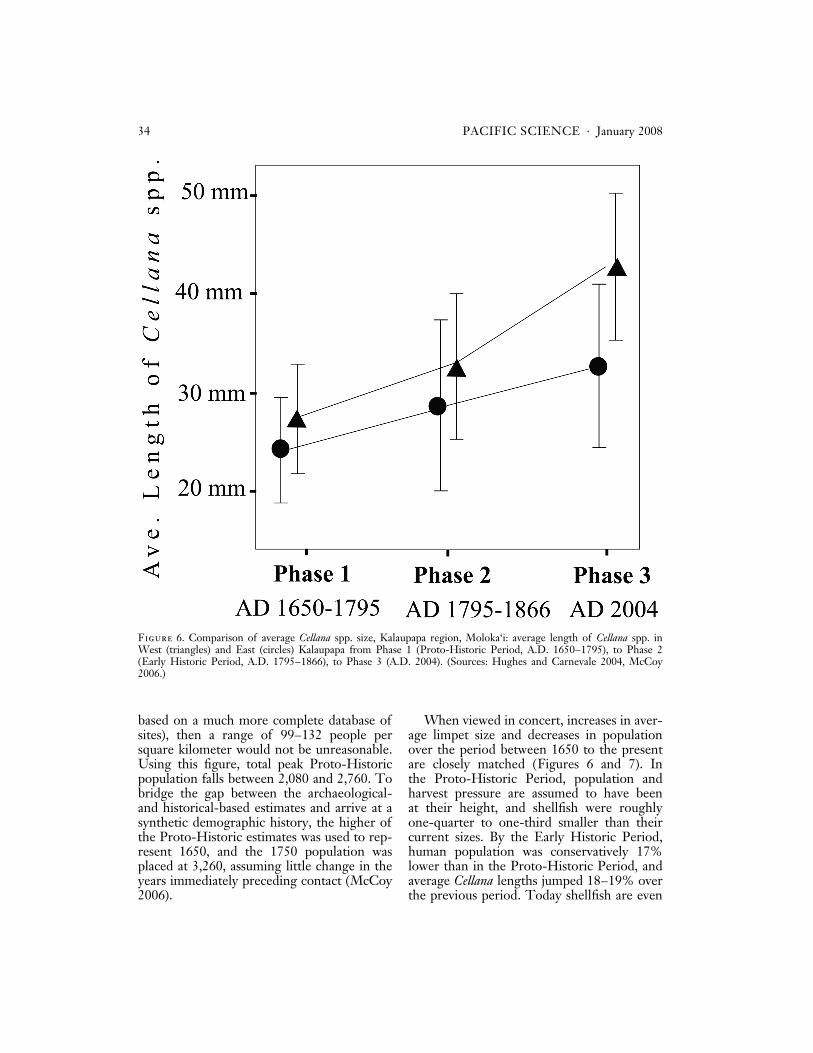
based on a much more complete database ofsites), then a range of 99–132 people persquare kilometer would not be unreasonable.Using this figure, total peak Proto-Historicpopulation falls between 2,080 and 2,760. Tobridge the gap between the archaeological-and historical-based estimates and arrive at asynthetic demographic history, the higher ofthe Proto-Historic estimates was used to rep-resent 1650, and the 1750 population wasplaced at 3,260, assuming little change in theyears immediately preceding contact (McCoy2006).
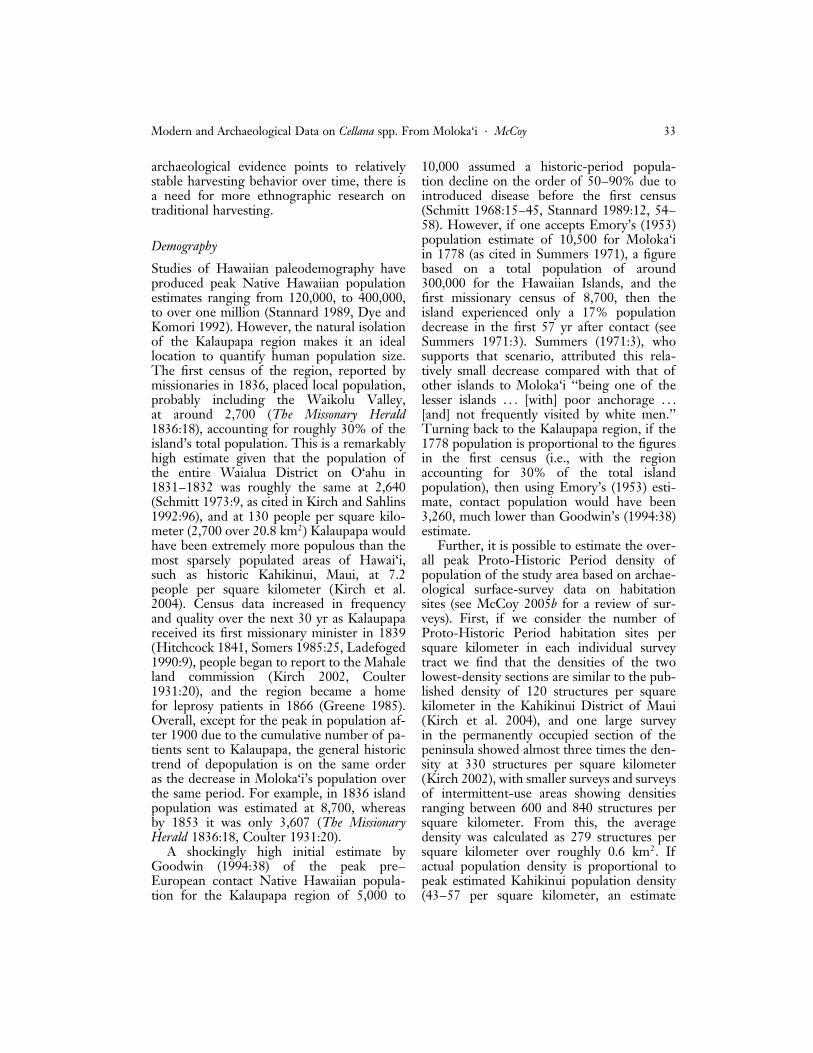
When viewed in concert, increases in aver-age limpet size and decreases in populationover the period between 1650 to the presentare closely matched (Figures 6 and 7). Inthe Proto-Historic Period, population andharvest pressure are assumed to have beenat their height, and shellfish were roughlyone-quarter to one-third smaller than theircurrent sizes. By the Early Historic Period,human population was conservatively 17%lower than in the Proto-Historic Period, andaverage Cellana lengths jumped 18–19% overthe previous period. Today shellfish are even
Figure 6. Comparison of average Cellana spp. size, Kalaupapa region, Moloka‘i: average length of Cellana spp. inWest (triangles) and East (circles) Kalaupapa from Phase 1 (Proto-Historic Period, A.D. 1650–1795), to Phase 2(Early Historic Period, A.D. 1795–1866), to Phase 3 (A.D. 2004). (Sources: Hughes and Carnevale 2004, McCoy2006.)
34 PACIFIC SCIENCE . January 2008
larger, up 14–30% compared with the earlyhistoric era. However, when one accounts forthe rates of demographic decline and shellfishrecovery it appears that ‘‘bounce back’’ wasswiftest during the most extreme phase ofthe demographic crash. In the transition be-tween the Proto-Historic and Early HistoricPeriods, population declined at a dramaticrate and average shellfish size increasedat about 0.4% per year. In the following de-cades, population continued to decline slowlywith only minimal Cellana size increases (0.1–0.2% per year). This is consistent with ascenario in which the benefits of lesseningharvest pressure are greatest at first, but re-covery continues over a long period of time.
Overall, it appears that at the time settle-ment expanded onto the Kalaupapa Peninsulain 1650, or soon afterward, shellfish exploita-tion was intense. Indeed, this is consistentwith Kirch et al.’s (2003) detailed analysis of
Kaupikiawa Cave (50-60-03-312) that showedinitially dense shellfish deposits concurrentwith the first occupation of the site (depositsthat diminished into the historic period) aswell as the possible overexploitation of C.exarata. Further, it appears that the increasein average size of Cellana spp. detected at thesite by Pearson et al. (1974), but left pru-dently unexplained, is simply part of this gen-eral trend.
conclusions
Overall, modern and archaeological datashow the following: (1) Within the Kalaupaparegion Cellana spp. are on average slightlylarger on the sheltered western coast, sug-gesting that there are local environmentalconditions affecting growth rates. Likely fac-tors include relative shelter from trade windsand ocean currents. More testing is necessary
Figure 7. Estimated total population of Kalaupapa region, Moloka‘i (A.D. 1650–2000). (Sources: McCoy 2006, U.S.Census Bureau).
Modern and Archaeological Data on Cellana spp. From Moloka‘i . McCoy 35
to definitively link ecological variables to theobserved phenomenon. (2) Cellana spp. inthe Kalaupapa region recovered from inten-sive Proto-Historic Period (A.D. 1650–1795)exploitation at a rate of þ0.4% per year(average length) concurrent with local demo-graphic collapse during the Early HistoricPeriod (A.D. 1795–1866). This process likelycontinued at a lesser recovery rate of þ0.1 to0.2% per year (average length) as humanpopulations stabilized at a low level in thelater historic period.
In sum, results suggest that future modernstudies should take a microscale approach todescribe variation in Cellana spp. populationsto account for intraregional variation due tohabitat. In addition, future archaeological re-search should report sizes of intact Cellanaspp. with the ultimate goal of determiningchange over time and attempting to accountfor the impact of population change onmarine resources. Moreover, these resultssuggest that further research is necessary todetermine what impacts prehistoric Hawaiianpopulation growth, and subsequent historic-period decline, may have had on marineresources.
acknowledgments
I thank Chris Bird, Eric Brown, Maria Car-nevale, Jennifer Cerny, Guy Hughes, WalterKaiama, Patrick Kirch, and the many volun-teers who gave their time to measure thou-sands of ‘opihi. Thanks also to anonymousreviewers for their insightful, constructivecomments.
Literature Cited
Alexander, D. 1996. Managing historic re-sources in an evolving Hawaiian commu-nity, Kalaupapa NHP. Cult. Resour. Mag.19:40–43.
Bird, D. W., and R. L. B. Bird. 1997. Con-temporary shellfish gathering strategiesamong the Meriam of the Torres StraitIslands, Australia: Testing predictions of acentral place foraging model. J. Archaeol.Sci. 24:39–63.
Bird, D. W., J. L. Richardson, and P. M.Veth. 2002. Explaining shellfish variabilityin middens on the Meriam Islands, TorresStrait, Australia. J. Archaeol. Sci. 29:457–469.
Bowdler, S. 2006. Mollusks and other shells.Pages 316–337 in J. Balme and A. Pater-son, eds. Archaeology in practice. Black-well Publishing, London.
Canfield, J. E. 1990. Description and mapof the plant communities of the Northeastcoastal spray zone of Kalaupapa NationalHistorical Park. Cooperative NationalPark Resources Studies Unit, Honolulu.
Claassen, C. 1998. Shells. Cambridge Man-uals in Archaeology. Cambridge Univer-sity Press, Cambridge, United Kingdom.
Clague, D. A., C. Dao-gong, R. Murnane,M. H. Beeson, A. Lanphere, G. B. Dal-rymple, W. Friesen, and R. T. Holcomb.1982. Age and petrology of KalaupapaBasalt, Molokai, Hawaii. Pac. Sci. 36:411–420.
Coulter, J. W. 1931. Population and utiliza-tion of land and sea in Hawaii, 1853. Ber-nice P. Bishop Museum Press, Honolulu.
Dye, T. S., and E. Komori. 1992. A pre-censal population history of Hawaii. N. Z.J. Archaeol. 14:113–128.
Erlandson, J. M. 1988. The role of shellfishin prehistoric economies: A protein per-spective. Am. Antiquity 53:102–109.
Fletcher, C. H. 1994. Letter report on geol-ogy of Kalaupapa, Hawai‘i. Pages 1–17,Vol. 2 in C. Goodwin, A Kalaupapa sweetpotato farm: Report on archaeological datarecovery operations, Kalaupapa AirportImprovement Project, Kalaupapa, Molo-ka‘i, Hawai‘i. International ArchaeologicalResearch Institute, Inc., Honolulu.
Glazier, E. W. 2007. Hawaiian fisherman:Case studies in cultural anthropology.Wadsworth Publishing Company, Bel-mont, California.
Goodwin, C. M. 1994. A Kalaupapa sweetpotato farm: Report on archaeological datarecovery operations, Kalaupapa AirportImprovement Project, Kalaupapa, Molo-ka‘i, Hawai‘i. International ArchaeologicalResearch Institute, Inc., Honolulu.
36 PACIFIC SCIENCE . January 2008
Greene, L. W. 1985. Exile in paradise: Theisolation of Hawai‘i’s leprosy victims anddevelopment of Kalaupapa Settlement,1865 to present. National Park Service,Denver.
Griffiths, R. J. 1980. Natural food availabilityand assimilation in the bivalve Choromytilusmeridionalis. Mar. Ecol. Prog. Ser. 3:151–156.
Hirata, J., and L. Potts. 1967. A preliminarystudy based on midden analysis: Cave 1,Kalaupapa Peninsula, Molokai. Manu-script for Anthropology 521, June 1, 1967,Anthropology Department, University ofHawai‘i at Manoa, Honolulu. Available atHamilton Library, Hawai‘i Pacific Col-lection, University of Hawai‘i at Manoa,Honolulu.
Hitchcock, H. 1841. Notations made in Mo-lokai Station Reports 1833–1849. Manu-script on file at Mission Houses MuseumResearch Library, Honolulu. Available atHamilton Library, Hawai‘i Pacific Col-lection, University of Hawai‘i at Manoa,Honolulu.
Hughes, G. D., and M. Carnevale. 2004.Protocol development—assessing Opihi(Cellana spp.) densities and populationstructure at Kalaupapa National HistoricalPark. Progress report on file with andavailable from the National Park Service.
Jackson, J. B. C., M. X. Kirby, W. H. Berger,K. A. Bjorndal, L. W. Botsford, B. J. Bour-que, R. H. Bradbury, R. Cooke, J. Ear-landson, J. A. Estes, T. P. Hughes,S. Kidwell, C. B. Lange, H. S. Lenihan,J. M. Pandolfi, C. H. Peterson, R. S.Steneck, M. J. Tegner, and R. R.Warner. 2001. Historical overfishing andthe recent collapse of coastal ecosystems.Science (Washington, D.C.) 293:629–638.
Jerardino, A. 1997. Changes in shellfish spe-cies composition and mean shell size froma Late-Holocene record of the west coastof southern Africa. J. Archaeol. Sci.24:1031–1044.
Juvik, S. P., and J. O. Juvik, eds. 1998. Atlasof Hawai‘i. 3rd ed. University of Hawai‘iPress, Honolulu.
Kay, E. A., C. E. Bird, B. S. Holland,and C. M. Smith. 2005. Final report:NPS PICRP Graduate Research Project:Growth rates, reproductive cycles, andpopulation genetics of Opihi from the Na-tional Parks in the Hawaiian Islands. Re-port on file with and available from theNational Park Service.
Kay, E. A., and W. Magruder. 1977. Thebiology of opihi (October 1975–October1976). Department of Planning and Eco-nomic Development, State of Hawai‘i,Honolulu.
Kingdom of Hawai‘i, Board of Health. 1886.Leprosy in Hawaii: Extracts from reportsof presidents of the Board of Health,government physicians and others fromofficial records, in regards to leprosy.Daily Bulletin Stream Printing Office,Honolulu.
Kirch, P. V. 2000. On the road of the winds:An archaeological history of the Pacific Is-lands before European contact. Universityof California Press, Berkeley.
———. 2002. From the ‘‘Cliffs of Keolewa’’to the ‘‘Sea of Papaloa’’: An archaeologicalreconnaissance of portions of the Kalau-papa National Historical Park, Moloka‘i,Hawaiian Islands. Archaeological ResearchFacility, University of California, Berke-ley.
———. 2005. Archaeology and global change:The Holocene record. Annu. Rev. Envi-ron. Res. 30:409–440.
Kirch, P. V., A. S. Hartshorn, O. A. Chad-wick, P. M. Vitousek, D. R. Sherrod, J.Coil, L. Holm, and W. D. Sharp. 2004.Environment, agriculture, and settlementpatterns in a marginal Polynesian land-scape. Proc. Natl. Acad. Sci. U.S.A.101:9936–9941.
Kirch, P. V., and S. J. O’Day. 2003. New ar-chaeological insights into food and status:A case study from pre-contact Hawaii.World Archaeol. 343:487–497.
Kirch, P. V., S. J. O’Day, J. H. Coil, M.Morgenstein, K. Kawelu, and S. Miller-strom. 2003. The Kaupikiawa Rockshelter,Kalaupapa Peninsula, Moloka‘i: New in-vestigations and reinterpretation of its sig-
Modern and Archaeological Data on Cellana spp. From Moloka‘i . McCoy 37
nificance for Hawaiian prehistory. PeopleCult. Oceania 19:1–27.
Kirch, P. V., and M. Sahlins. 1992. Anahulu:The anthropology of history in the King-dom of Hawaii. Vol. 2. University of Chi-cago Press, Chicago.
Klein, R. G. 1999. The human career: Hu-man biological and cultural origins. Uni-versity of Chicago Press, Chicago.
Krech, S. 1999. The ecological Indian: Mythand history. Norton, New York.
Ladefoged, T. N. 1990. A dryland agri-cultural system at Kalaupapa, Moloka‘i:Archaeological inventory survey, AirportImprovement Project. International Ar-chaeological Research Institute, Inc., Ho-nolulu.
———. 1993. Hawaiian dryland agriculturalintensification and the Pacific economy.Pac. Stud. 16:119–131.
Macdonald, G. A., A. T. Abbott, and F. L.Peterson. 1983. Volcanoes in the sea: Thegeology of Hawaii. 2nd ed. University ofHawai‘i Press, Honolulu.
Magruder, W. H., and E. A. Kay. 1983.Growth rates of the limpets Cellana exar-ata (Reeve) and C. sandwicensis (Pease)in the Hawaiian Islands (Mollusca: Gastro-poda). Venus Jpn. J. Malacol. 42:174–182.
Manning, E., and E. Neller. In press. Chap-ters 2–6 in M. D. McCoy, ed. Kalaupapaarchaeology: A collection of five surveysin the Kalaupapa National Historical Park.Research Corporation of the University ofHawai‘i and National Park Service, U.S.Department of the Interior, Honolulu.
Mannino, M. A., and K. D. Thomas. 2002.Depletion of a resource? The impact ofprehistoric human foraging on intertidalmollusc communities and its significancefor human settlement, mobility and dis-persal. World Archaeol. 33:452–474.
McCoy, M. D. 2002. Report on KalaupapaPeninsula Archaeological Project (KPAP)fieldwork. Report on file with and availablefrom the U.S. National Park Service andHawai‘i State Historic Preservation Office,Honolulu.
———. 2003. Report on Kalaupapa Penin-sula Archaeological Project (KPAP) field-
work. Report on file with and availablefrom the U.S. National Park Service andHawai‘i State Historic Preservation Office,Honolulu.
———. 2004. Report on Kalaupapa Penin-sula Archaeological Project (KPAP) field-work. Report on file with and availablefrom the U.S. National Park Service andHawai‘i State Historic Preservation Office,Honolulu.
———. 2005a. The chronology of the Ka-laupapa Field System, Moloka‘i Island,Hawai‘i. J. Polynesian Soc. 114:339–358.
———. 2005b. The lands of Hina: An ar-chaeological overview and assessment ofKalaupapa National Historical Park, Mo-loka‘i Island. Honolulu, Technical Report135, Pacific Cooperative Studies Unit ofthe University of Hawai‘i and NationalPark Service, U.S. Department of the In-terior, Honolulu.
———. 2006. Landscape, social memory, andsociety: An ethnohistoric-archaeologicalstudy of three Hawaiian communities.Ph.D. diss., University of California,Berkeley.
McCoy, M. D., and A. S. Hartshorn. 2007.Wind erosion and intensive prehistoric ag-riculture: A case study from the KalaupapaField System, Moloka‘i Island, Hawai‘i.Geoarchaeology 22 (5): 511–532.
Missionary Herald, The. 1836. Mission to theSandwich Islands. 32:17–21. Boston.
Pearson, R., J. Hirata, L. Potts, and F. Harby.1974. Test pitting of Cave 1, KalaupapaPeninsula, Molokai, Hawaii. N. Z. Ar-chaeol. Assoc. Newsl. 17:44–49.
Schmitt, R. C. 1968. Demographic statisticsof Hawaii, 1778–1965. University of Ha-wai‘i Press, Honolulu.
Somers, G. F. 1985. Kalaupapa, More than aleprosy settlement: Archaeology at Kalau-papa National Historical Park. NationalPark Service, Tucson.
Stannard, D. 1989. Before the horror: Thepopulation of Hawai‘i on the eve of West-ern contact. Social Science Research Insti-tute, University of Hawai‘i, Honolulu.
Summers, C. C. 1971. Moloka‘i: A site sur-vey. Bernice P. Bishop Museum Press,Honolulu.
38 PACIFIC SCIENCE . January 2008