hazard registers and deficiency databases workshop€¦ · hazard registers and deficiency...
TRANSCRIPT
1
1
Hazard Registers and Deficiency DatabasesWorkshop
2
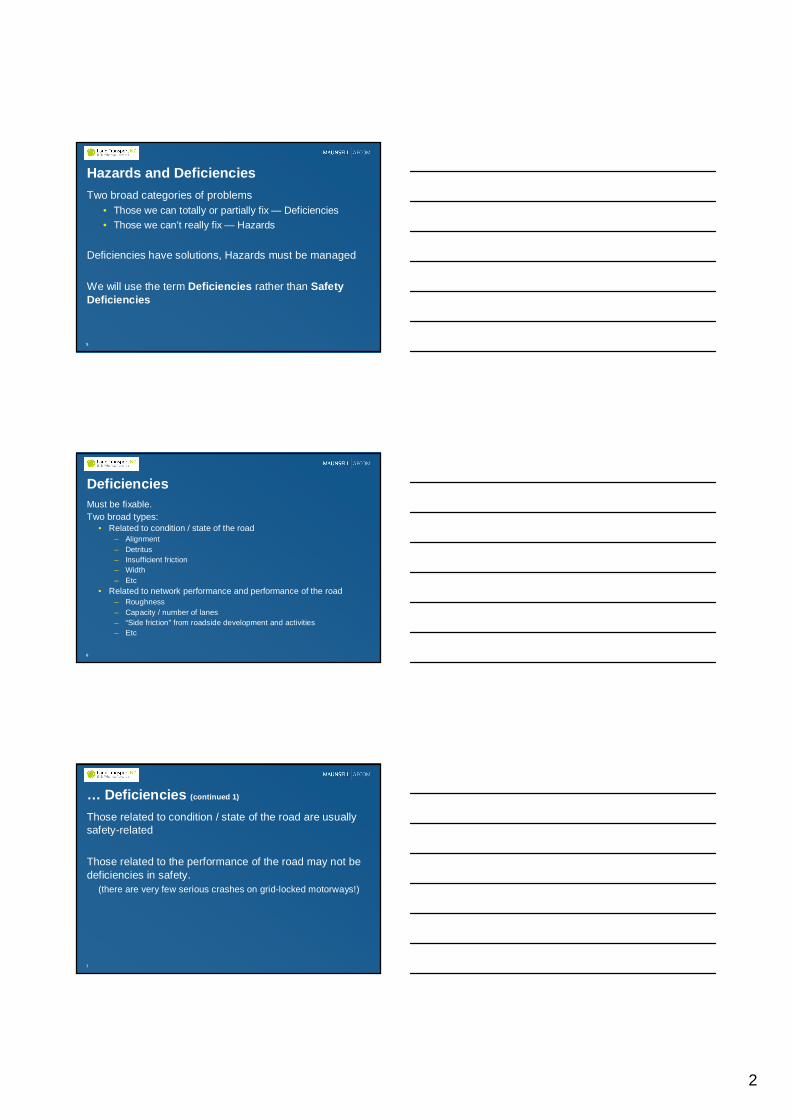
Outline of Today’s Workshop• Understand the context• Understand the differences between Hazards and Deficiencies• Introduction to Risk• Prioritization Tools
– Available methods– Risk based prioritization– Risk and BCR– Actual or “real”problems — v — potential problems and concerns
• Data Needs– New– Existing– Influence of Routine Maintenance
• Available Systems– Current– Future
• A spreadsheet solution
4
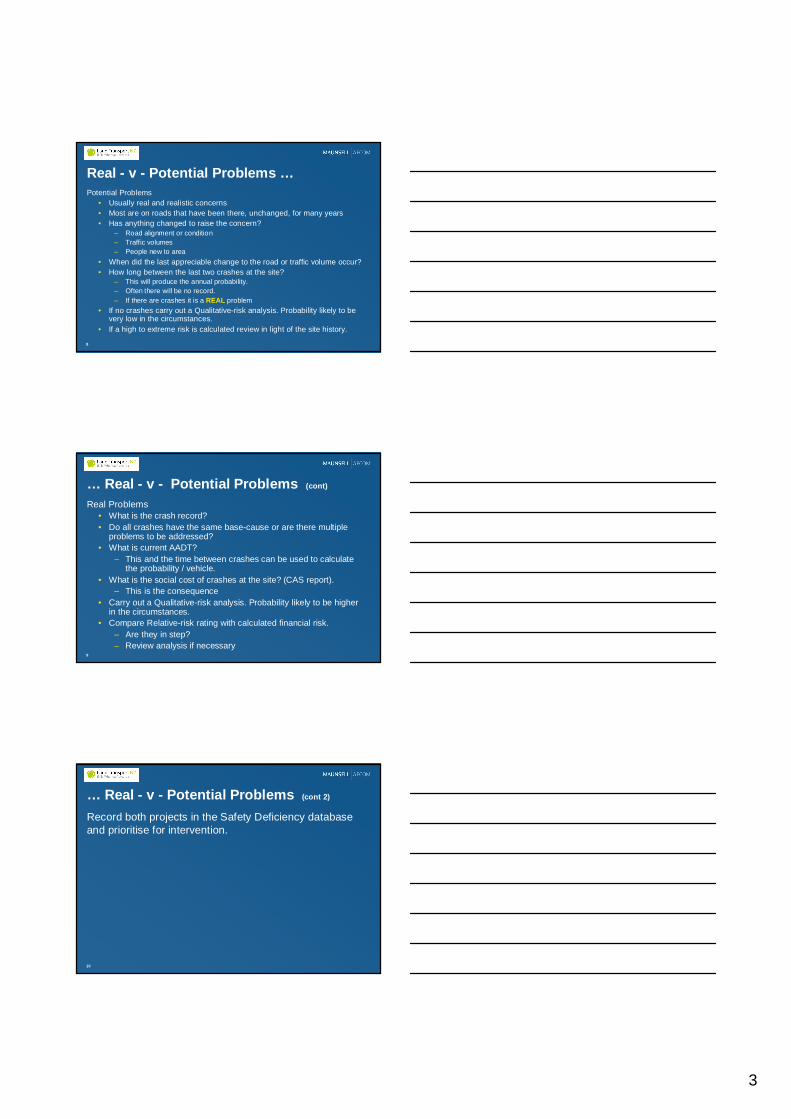
ContextRoad Safety to 2010 set the Government's objectives
• <300 fatalities• <4,500 hospital admissions
Adoption of Safety Management Systems• 72 out of 73 TLAs have or will have an SMS by June 2007• All SMSs require safety deficiencies to be identified
Sect 353 of the LGA 1974• The council shall take all sufficient precautions for the general
safety of the public and traffic and workmen employed on or nearany road and, in particular, shall—
2
5
Hazards and DeficienciesTwo broad categories of problems
• Those we can totally or partially fix — Deficiencies• Those we can’t really fix — Hazards
Deficiencies have solutions, Hazards must be managed
We will use the term Deficiencies rather than SafetyDeficiencies
6
DeficienciesMust be fixable.Two broad types:
• Related to condition / state of the road– Alignment– Detritus– Insufficient friction– Width– Etc
• Related to network performance and performance of the road– Roughness– Capacity / number of lanes– “Side friction”from roadside development and activities– Etc
7
… Deficiencies (continued 1)
Those related to condition / state of the road are usuallysafety-related
Those related to the performance of the road may not bedeficiencies in safety.
(there are very few serious crashes on grid-locked motorways!)
3
8
Real - v - Potential Problems …Potential Problems
• Usually real and realistic concerns• Most are on roads that have been there, unchanged, for many years• Has anything changed to raise the concern?
– Road alignment or condition– Traffic volumes– People new to area
• When did the last appreciable change to the road or traffic volume occur?• How long between the last two crashes at the site?
– This will produce the annual probability.– Often there will be no record.– If there are crashes it is a REAL problem
• If no crashes carry out a Qualitative-risk analysis. Probability likely to bevery low in the circumstances.
• If a high to extreme risk is calculated review in light of the site history.
9
… Real - v - Potential Problems (cont)
Real Problems• What is the crash record?• Do all crashes have the same base-cause or are there multiple
problems to be addressed?• What is current AADT?
– This and the time between crashes can be used to calculatethe probability / vehicle.
• What is the social cost of crashes at the site? (CAS report).– This is the consequence
• Carry out a Qualitative-risk analysis. Probability likely to be higherin the circumstances.
• Compare Relative-risk rating with calculated financial risk.– Are they in step?– Review analysis if necessary
10
… Real - v - Potential Problems (cont 2)
Record both projects in the Safety Deficiency databaseand prioritise for intervention.
4
12
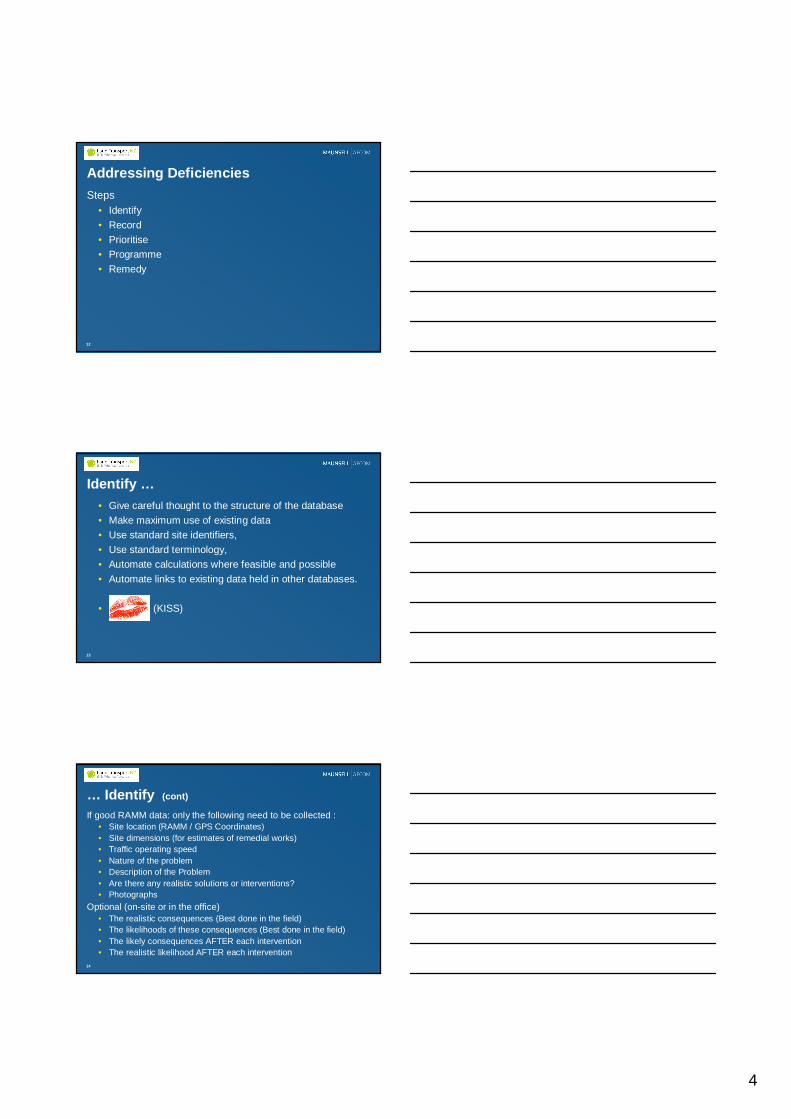
Addressing DeficienciesSteps
• Identify• Record• Prioritise• Programme• Remedy
13
Identify …• Give careful thought to the structure of the database• Make maximum use of existing data• Use standard site identifiers,• Use standard terminology,• Automate calculations where feasible and possible• Automate links to existing data held in other databases.
• (KISS)
14
… Identify (cont)
If good RAMM data: only the following need to be collected :• Site location (RAMM / GPS Coordinates)• Site dimensions (for estimates of remedial works)• Traffic operating speed• Nature of the problem• Description of the Problem• Are there any realistic solutions or interventions?• Photographs
Optional (on-site or in the office)• The realistic consequences (Best done in the field)• The likelihoods of these consequences (Best done in the field)• The likely consequences AFTER each intervention• The realistic likelihood AFTER each intervention
5
15
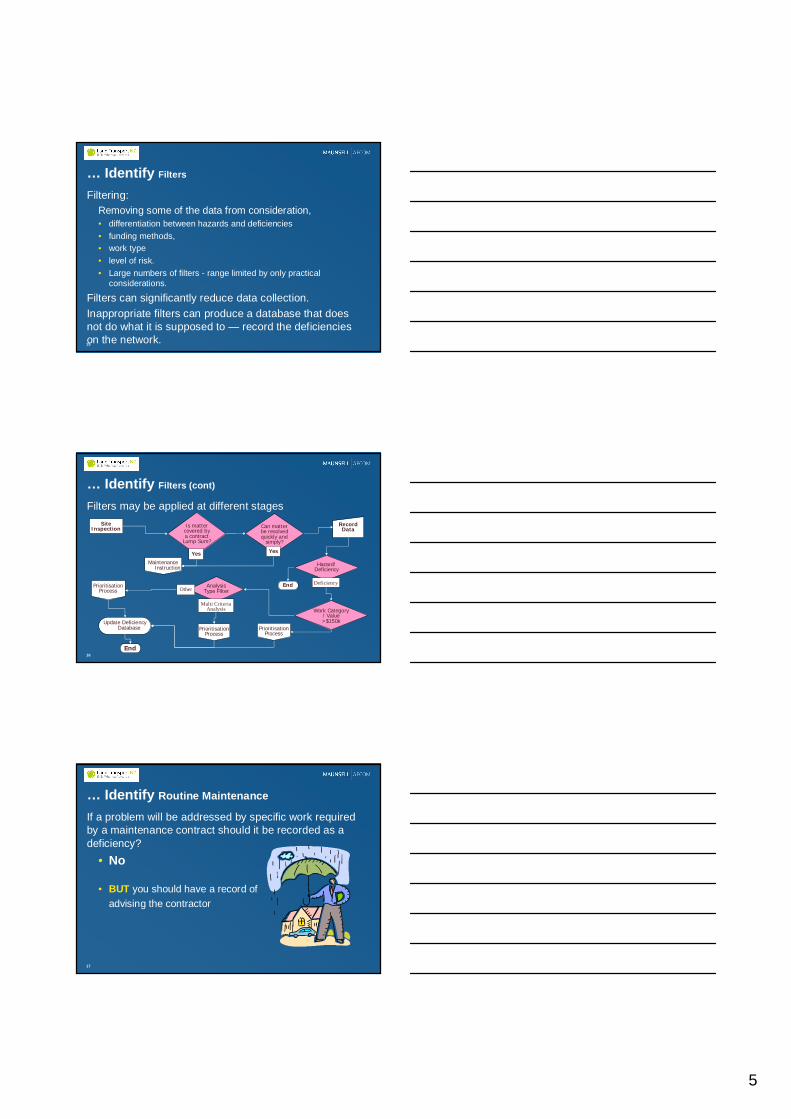
… Identify Filters
Filtering:Removing some of the data from consideration,• differentiation between hazards and deficiencies• funding methods,• work type• level of risk.• Large numbers of filters - range limited by only practical
considerations.
Filters can significantly reduce data collection.Inappropriate filters can produce a database that doesnot do what it is supposed to — record the deficiencieson the network.
16
… Identify Filters (cont)
Filters may be applied at different stagesSite
InspectionRecord
Data
Work Category/ Value>$150k
PrioritisationProcess
PrioritisationProcess
Update DeficiencyDatabase Prioritisation
Process
MaintenanceInstruction
Is mattercovered bya contract
Lump Sum?
Yes
Can matterbe resolvedquickly and
simply?
Yes
End
Hazard/Deficiency
DeficiencyAnalysisType Filter
Multi CriteriaAnalysis
Other
End
17
… Identify Routine Maintenance
If a problem will be addressed by specific work requiredby a maintenance contract should it be recorded as adeficiency?
•No
• BUT you should have a record ofadvising the contractor
6
18
RiskWhat is it?
• A measure of the exposure to the consequences of anadverse event
Two components —• Likelihood (or Probability) of the adverse event occurring• The consequences of the event
Measures —• Quantitative (e.g. monetary / financial)• Qualitative (relative / judgement)
19
Risk MeasuresQuantitative
• Calculated / mathematical basisQualitative
• Judgement based• Used by most Local Authorities and Transit• NZS AS/NZS 4360:2004 Risk management and
associated documents (SNZ HB 4360:2000 RiskManagement for Local Government etc)
20
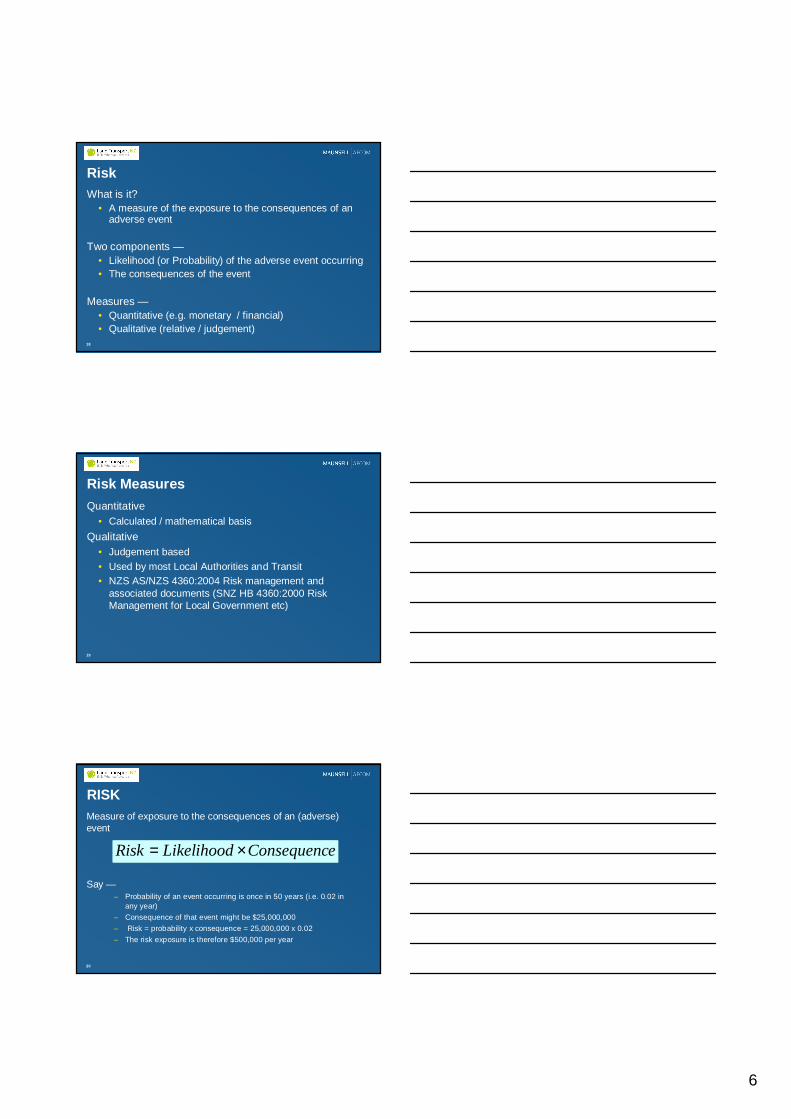
RISKMeasure of exposure to the consequences of an (adverse)event
Say —– Probability of an event occurring is once in 50 years (i.e. 0.02 in
any year)– Consequence of that event might be $25,000,000– Risk = probability x consequence = 25,000,000 x 0.02– The risk exposure is therefore $500,000 per year
eConsequencLikelihoodRisk ×=
7
21
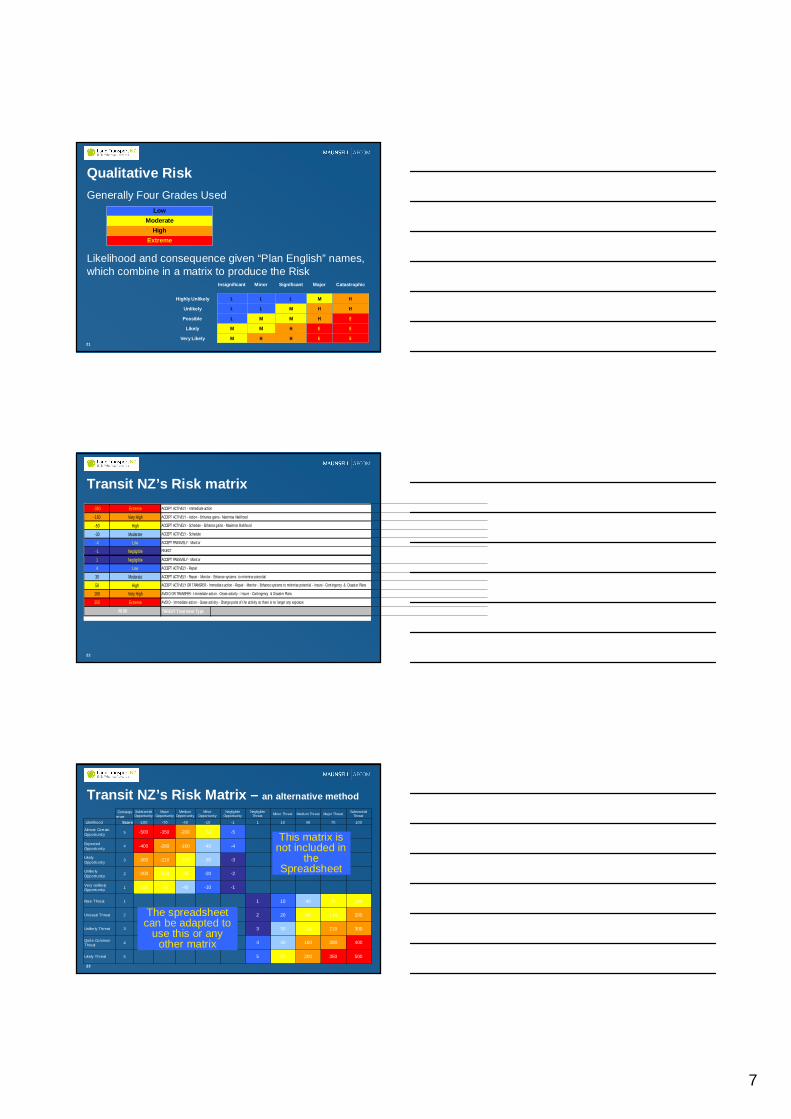
Generally Four Grades Used
Likelihood and consequence given “Plan English”names,which combine in a matrix to produce the Risk
Qualitative Risk
EEHHMVery Likely
EEHMMLikely
EHMMLPossible
HHMLLUnlikely
HMLLLHighly Unlikely
CatastrophicMajorSignificantMinorInsignificant
ExtremeHigh
ModerateLow
22
Transit NZ’s Risk matrix-350 Extreme
-160 Very High
-50 High
-30 Moderate
-4 Low
-1 Negligible
1 Negligible
4 Low
30 Moderate
50 High
160 Very High
350 Extreme
THREAT Treatment Type
ACCEPT ACTIVELY - Immediate action
ACCEPT ACTIVELY - Action - Enhance gains - Maximise likelihood
ACCEPT ACTIVELY - Schedule - Enhance gains - Maximise likelihood
ACCEPT ACTIVELY - Schedule
ACCEPT PASSIVELY - Monitor
REJECT
ACCEPT PASSIVELY - Monitor
AVOID - Immediate action - Cease activity - Change parts of the activity so there is no longer any exposure
RISK
ACCEPT ACTIVELY - Repair
ACCEPT ACTIVELY - Repair - Monitor - Enhance systems to minimise potential
ACCEPT ACTIVELY OR TRANSFER - Immediate action - Repair - Monitor - Enhance systems to minimise potential - Insure - Contingency & Disaster Plans
AVOID OR TRANSFER - Immediate action - Cease activity - Insure - Contingency & Disaster Plans
23
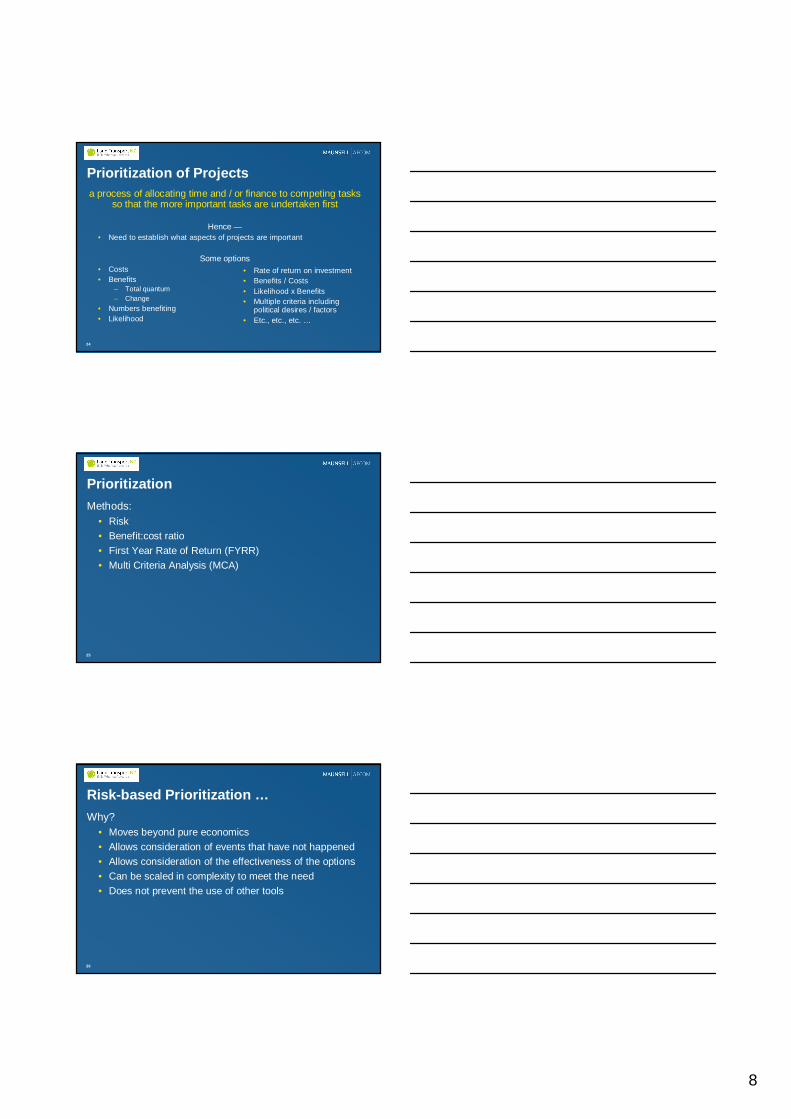
Transit NZ’s Risk Matrix –an alternative method
5003502005055Likely Threat
4002801604044Quite CommonThreat
3002101203033Unlike ly Threat
200140802022Unusual Threat
10070401011Rare Threat
-1-10-40-70-1001Very UnlikelyOpportunity
-2-20-80-140-2002Unlike lyOpportunity
-3-30-120-210-3003LikelyOpportunity
-4-40-160-280-4004ExpectedOpportunity
-5-50-200-350-5005Almost CertainOpportunity
1007040101-1-10-40-70-100ScoreLikelihood
SubstantialThreatMajor ThreatMedium ThreatMinor Threat
NegligibleThreat
NegligibleOpportunity
MinorOpportunity
MediumOpportunity
MajorOpportunity
SubstantialOpportunity
Consequence
This matrix isnot included in
theSpreadsheet
The spreadsheetcan be adapted to
use this or anyother matrix
8
24
Prioritization of Projectsa process of allocating time and / or finance to competing tasks
so that the more important tasks are undertaken first
Hence —• Need to establish what aspects of projects are important
Some options• Costs• Benefits
– Total quantum– Change
• Numbers benefiting• Likelihood
• Rate of return on investment• Benefits / Costs• Likelihood x Benefits• Multiple criteria including
political desires / factors• Etc., etc., etc. …
25
PrioritizationMethods:
• Risk• Benefit:cost ratio• First Year Rate of Return (FYRR)• Multi Criteria Analysis (MCA)
26
Risk-based Prioritization …Why?
• Moves beyond pure economics• Allows consideration of events that have not happened• Allows consideration of the effectiveness of the options• Can be scaled in complexity to meet the need• Does not prevent the use of other tools
9
27
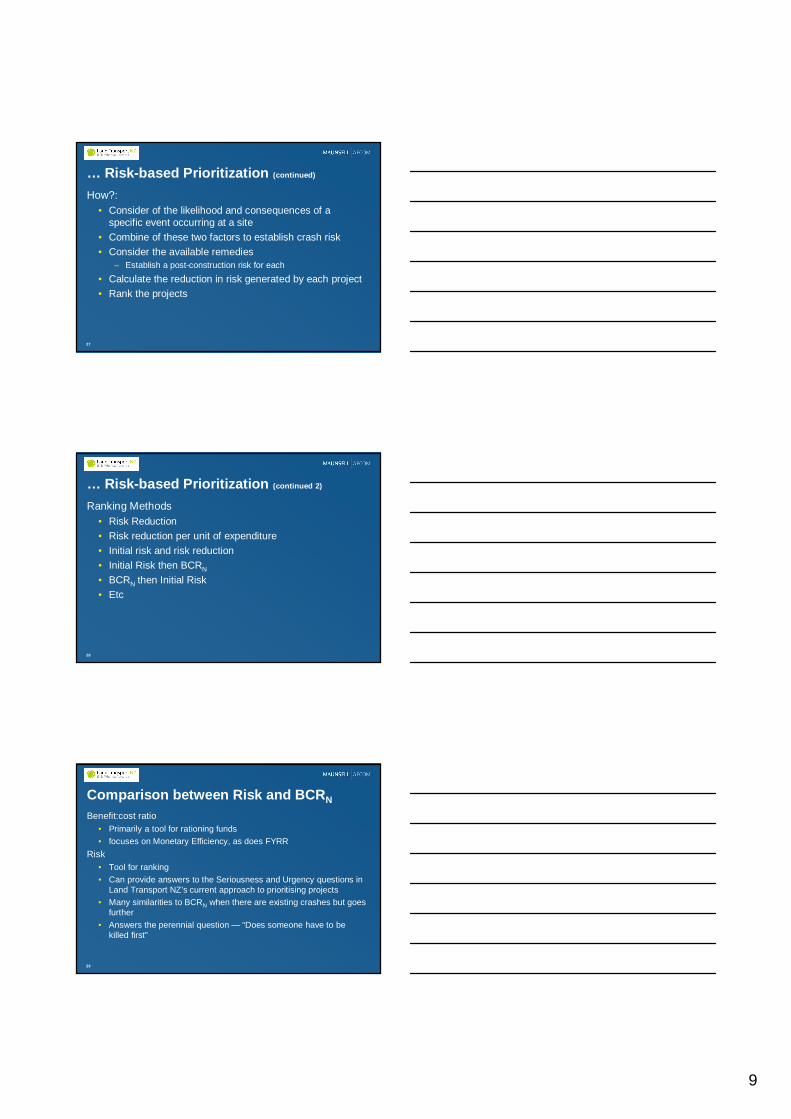
… Risk-based Prioritization (continued)
How?:• Consider of the likelihood and consequences of a
specific event occurring at a site• Combine of these two factors to establish crash risk• Consider the available remedies
– Establish a post-construction risk for each
• Calculate the reduction in risk generated by each project• Rank the projects
28
… Risk-based Prioritization (continued 2)
Ranking Methods• Risk Reduction• Risk reduction per unit of expenditure• Initial risk and risk reduction• Initial Risk then BCRN
• BCRN then Initial Risk• Etc
29
Comparison between Risk and BCRNBenefit:cost ratio
• Primarily a tool for rationing funds• focuses on Monetary Efficiency, as does FYRR
Risk• Tool for ranking• Can provide answers to the Seriousness and Urgency questions in
Land Transport NZ’s current approach to prioritising projects• Many similarities to BCRN when there are existing crashes but goes
further• Answers the perennial question — “Does someone have to be
killed first”
10
30
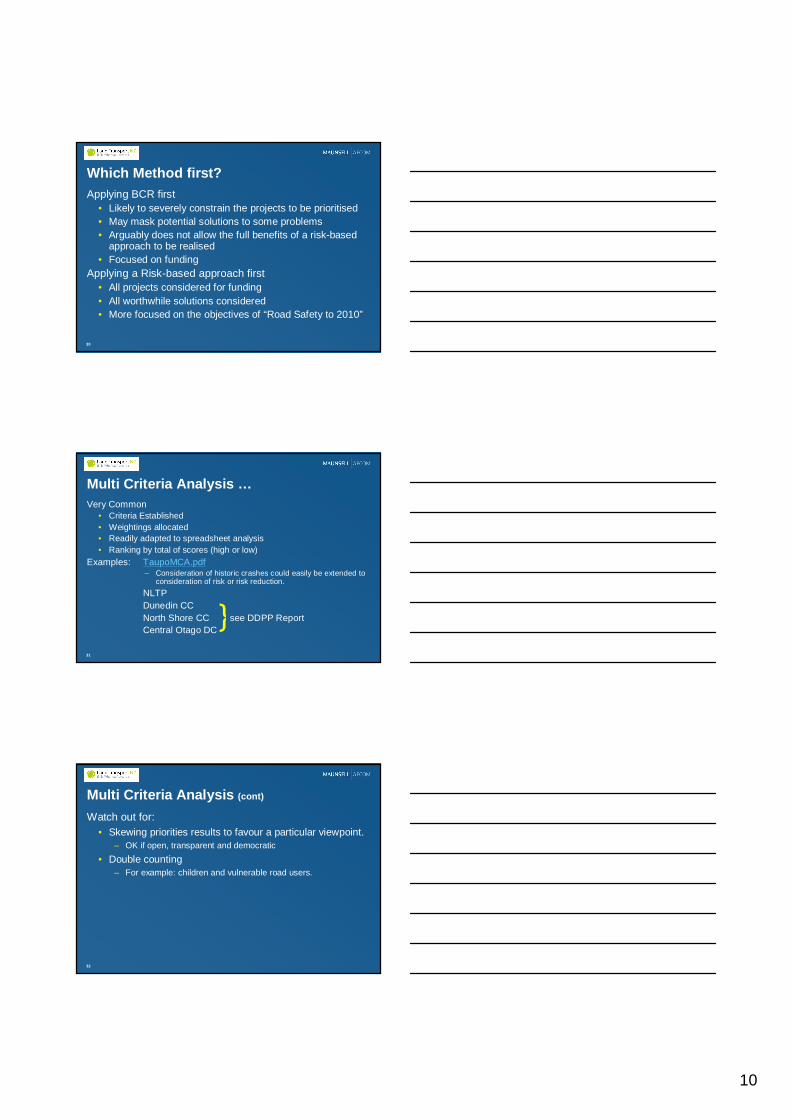
Which Method first?Applying BCR first
• Likely to severely constrain the projects to be prioritised• May mask potential solutions to some problems• Arguably does not allow the full benefits of a risk-based
approach to be realised• Focused on funding
Applying a Risk-based approach first• All projects considered for funding• All worthwhile solutions considered• More focused on the objectives of “Road Safety to 2010”
31
Multi Criteria Analysis …Very Common
• Criteria Established• Weightings allocated• Readily adapted to spreadsheet analysis• Ranking by total of scores (high or low)
Examples: TaupoMCA.pdf– Consideration of historic crashes could easily be extended to
consideration of risk or risk reduction.NLTPDunedin CCNorth Shore CC see DDPP ReportCentral Otago DC
}
32
Multi Criteria Analysis (cont)
Watch out for:• Skewing priorities results to favour a particular viewpoint.
– OK if open, transparent and democratic
• Double counting– For example: children and vulnerable road users.
11
33
Break
34
Bringing it Together …Recap:
• Road Safety to 2010• SMSs• LGA 1974• Land Transport Management Act 2003• Sustainable Transport solutions• Various prioritisation tools• Risk can address Serious and Urgency whereas BCRN
cannot do so directly
35
… Bringing it Together (continued 1)
• We cannot meet our obligations, and show that we willdo so, by relying on our memories, experience, and“grubby pieces of paper”
• Hazard and Deficiency Registers are a means ofmanaging the data we have to meet individual council’sand the Government’s goals.
• If we structure our register correctly it can save us workand simplify our work in future.
12
36
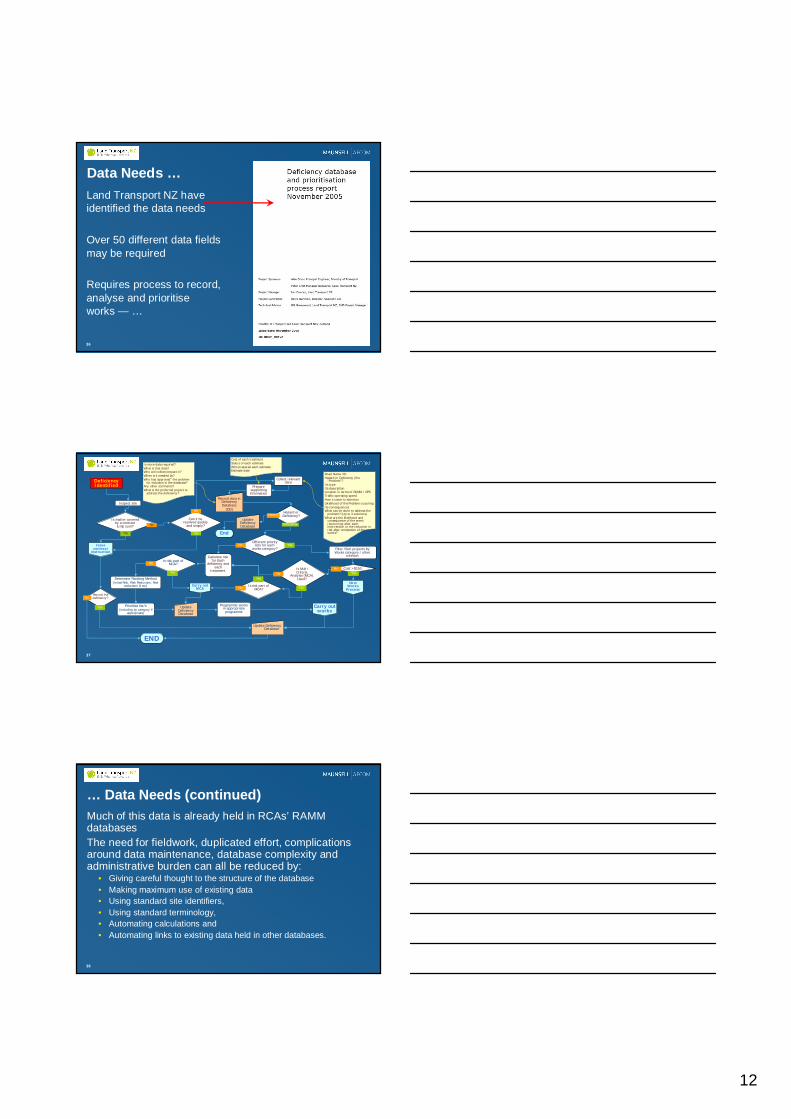
Data Needs …Land Transport NZ haveidentified the data needs
Over 50 different data fieldsmay be required
Requires process to record,analyse and prioritiseworks — …
37
DeficiencyIdentified
Inspect site
Collect relevantdata
Record data inDeficiencyDatabase
(DD)
Road Name /IDHazard or Deficiency (the
“Problem”?Its typeIts descriptionLocation in terms of RAMM / GPSTraffic operating speedHow it came to attentionLikelihood of the Problem occurringIts consequencesWhat can be done to address the
problem? (Up to 3 solutions)What are the likelihood and
consequence of the eventreoccurring after eachintervention or the reduction inrisk after completion of theworks?
Is more data required?What is that data?Who will collect/prepare it?When is it needed by?Who has ‘approved”the problem
for inclusion in the database?Any other comments?What is the preferred project to
address the deficiency?
Cost of each treatmentStatus of each estimateWho prepared each estimateEstimate date
Preparesupportinginformation
Carry outMCA
UpdateDeficiencyDatabase
NewWorks
Process
Determine Ranking Method(Initial Risk, Risk Reduction, Risk
reduction/ $ etc)
Cost >$150k
Filter /Sort projects byWorks category / other
criterionCalculate riskfor Each
deficiency andeach
treatment
Prioritise list/s(including by category if
appropriate)
Programme worksin appropriateprogramme
Carry outworks
Issuecontract
instruction
Update DeficiencyDatabase
Can it beresolved quickly
and simply?
Yes
No
Is matter coveredby a contractlump sum? No
Yes
YesNo
Is risk part ofMCA?No
Yes
Yes
No
Hazard orDeficiency?Hazard
Deficiency
End
END
Is Mult iCriteria
Analysis (MCA)Used?
Yes
No
Different prioritylists for each
works category?No Yes
Record thedeficiency?
Yes
No
YesNo Cost >$150k
YesNo
Is risk part ofMCA?
Yes
No
UpdateDeficiencyDatabase
38
… Data Needs (continued)Much of this data is already held in RCAs’RAMMdatabasesThe need for fieldwork, duplicated effort, complicationsaround data maintenance, database complexity andadministrative burden can all be reduced by:
• Giving careful thought to the structure of the database• Making maximum use of existing data• Using standard site identifiers,• Using standard terminology,• Automating calculations and• Automating links to existing data held in other databases.
13
39
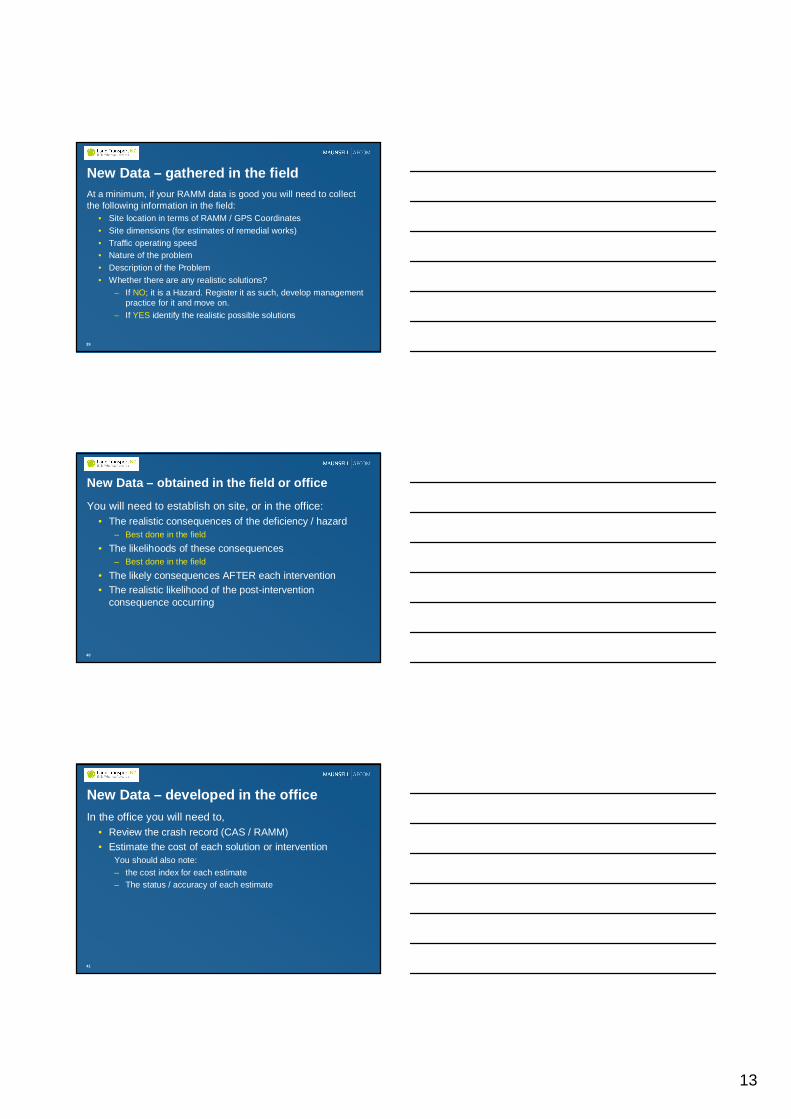
New Data –gathered in the fieldAt a minimum, if your RAMM data is good you will need to collectthe following information in the field:
• Site location in terms of RAMM / GPS Coordinates• Site dimensions (for estimates of remedial works)• Traffic operating speed• Nature of the problem• Description of the Problem• Whether there are any realistic solutions?
– If NO; it is a Hazard. Register it as such, develop managementpractice for it and move on.
– If YES identify the realistic possible solutions
40
New Data –obtained in the field or office
You will need to establish on site, or in the office:• The realistic consequences of the deficiency / hazard
– Best done in the field
• The likelihoods of these consequences– Best done in the field
• The likely consequences AFTER each intervention• The realistic likelihood of the post-intervention
consequence occurring
41
New Data –developed in the officeIn the office you will need to,
• Review the crash record (CAS / RAMM)• Estimate the cost of each solution or intervention
You should also note:– the cost index for each estimate– The status / accuracy of each estimate
14
42
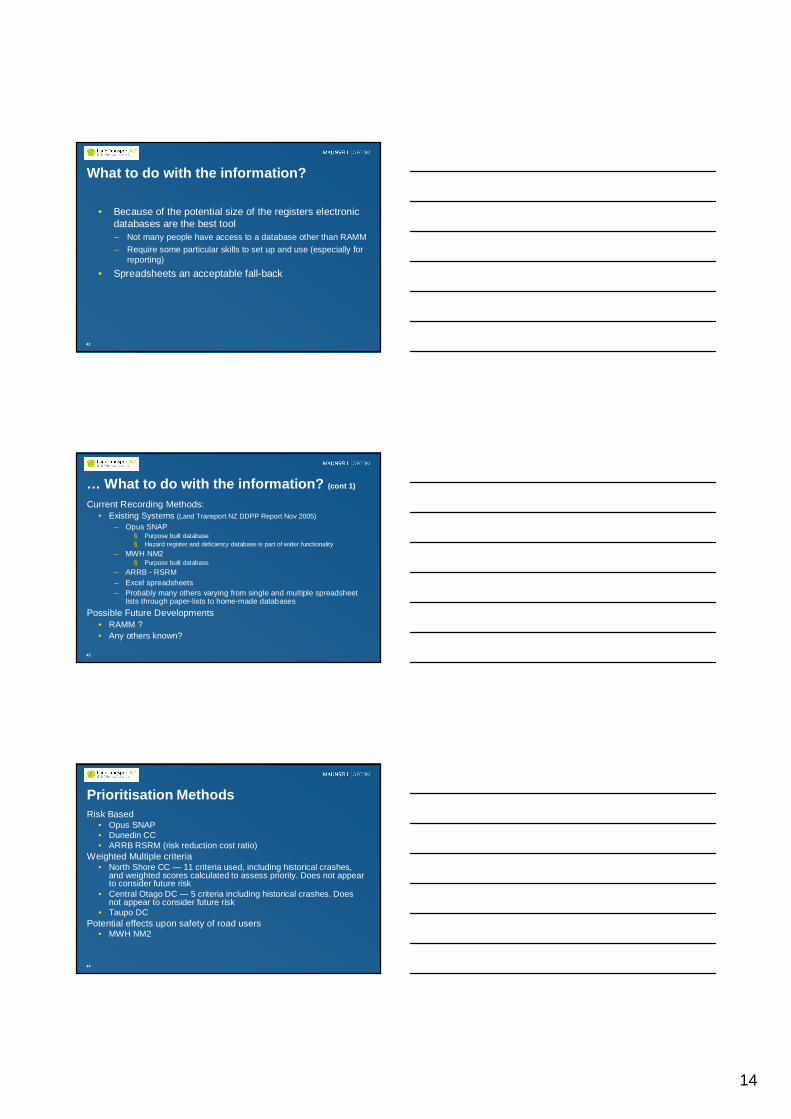
What to do with the information?
• Because of the potential size of the registers electronicdatabases are the best tool– Not many people have access to a database other than RAMM– Require some particular skills to set up and use (especially for
reporting)
• Spreadsheets an acceptable fall-back
43
… What to do with the information? (cont 1)
Current Recording Methods:• Existing Systems (Land Transport NZ DDPP Report Nov 2005)
– Opus SNAP§ Purpose built database§ Hazard register and deficiency database is part of wider functionality
– MWH NM2§ Purpose built database
– ARRB - RSRM– Excel spreadsheets– Probably many others varying from single and multiple spreadsheet
lists through paper-lists to home-made databasesPossible Future Developments
• RAMM ?• Any others known?
44
Prioritisation MethodsRisk Based
• Opus SNAP• Dunedin CC• ARRB RSRM (risk reduction cost ratio)
Weighted Multiple criteria• North Shore CC — 11 criteria used, including historical crashes,
and weighted scores calculated to assess priority. Does not appearto consider future risk
• Central Otago DC — 5 criteria including historical crashes. Doesnot appear to consider future risk
• Taupo DCPotential effects upon safety of road users
• MWH NM2

15
45
… Prioritisation (cont)
• Don’t get hung-up on prioritisation too soon.• Have a basic system (probably exists already), document it and
record it in the SMS as a Procedure• Different issues can be prioritised separately, e.g.
– Rural seal extension– Urban seal extension
• Whatever system used it will be more efficient to have it formallyadopted by the Council rather than having to justify eachrecommendation and debate changes each year.
• Need to consider how to deal with relative changes in priority.– For example: When an item previously at number 4 (say) is
superseded by a newly discovered problem coming in at 3.
46
BREAK
47
A spreadsheet Hazard Register andDeficiency Database
• Excel® spreadsheet enclosed with the course book• Hazard Register and Deficiency Database• Follows the processes discussed
16
48
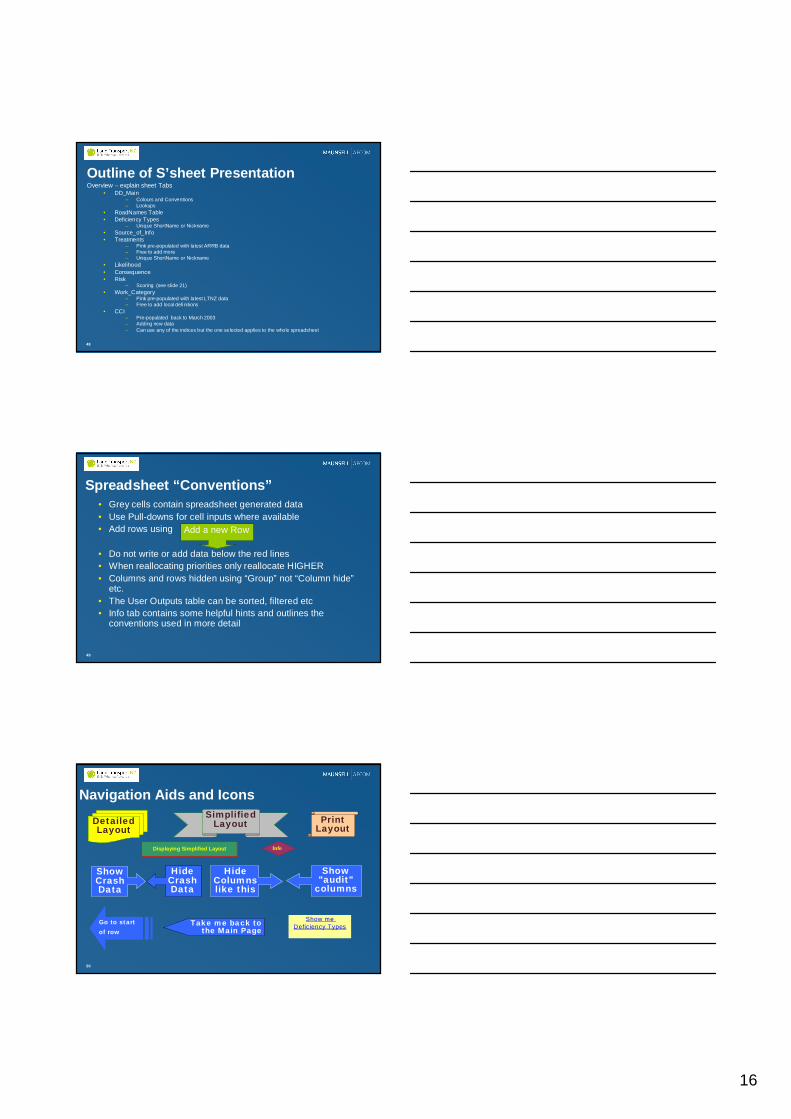
Outline of S’sheet PresentationOverview –explain sheet Tabs
• DD_Main– Colours and Conventions– Lookups
• RoadNames Table• Deficiency Types
– Unique ShortName or Nickname• Source_of_Info• Treatments
– Pink pre-populated with latest ARRB data– Free to add more– Unique ShortName or Nickname
• Likelihood• Consequence• Risk
– Scoring (see slide 21)• Work_Category
– Pink pre-populated with latest LTNZ data– Free to add local definitions
• CCI– Pre-populated back to March 2003– Adding new data– Can use any of the indices but the one selected applies to the whole spreadsheet
49
Spreadsheet “Conventions”• Grey cells contain spreadsheet generated data• Use Pull-downs for cell inputs where available• Add rows using
• Do not write or add data below the red lines• When reallocating priorities only reallocate HIGHER• Columns and rows hidden using “Group”not “Column hide”
etc.• The User Outputs table can be sorted, filtered etc• Info tab contains some helpful hints and outlines the
conventions used in more detail
Add a new Row
50
Navigation Aids and IconsSimplified
Layout PrintLayout
ShowCrashData
Show"audit"
columns
HideCrashData
HideColumnslike this
Take me back tothe Main Page
Show meDeficiency Types
DetailedLayout
Go to startof row
Displaying Simplified Layout Info
17
51
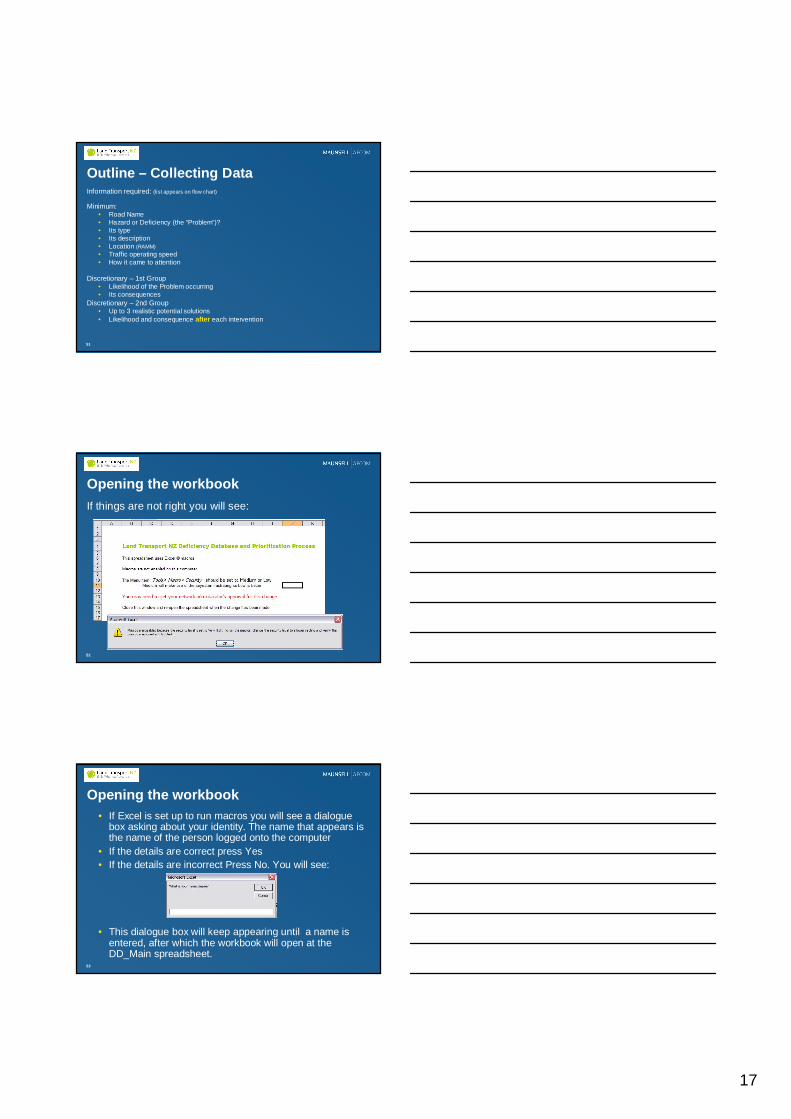
Outline –Collecting DataInformation required: (list appears on flow chart)
Minimum:• Road Name• Hazard or Deficiency (the “Problem”)?• Its type• Its description• Location (RAMM)• Traffic operating speed• How it came to attention
Discretionary –1st Group• Likelihood of the Problem occurring• Its consequences
Discretionary –2nd Group• Up to 3 realistic potential solutions• Likelihood and consequence after each intervention
52
Opening the workbookIf things are not right you will see:
53
Opening the workbook• If Excel is set up to run macros you will see a dialogue
box asking about your identity. The name that appears isthe name of the person logged onto the computer
• If the details are correct press Yes• If the details are incorrect Press No. You will see:
• This dialogue box will keep appearing until a name isentered, after which the workbook will open at theDD_Main spreadsheet.
18
54
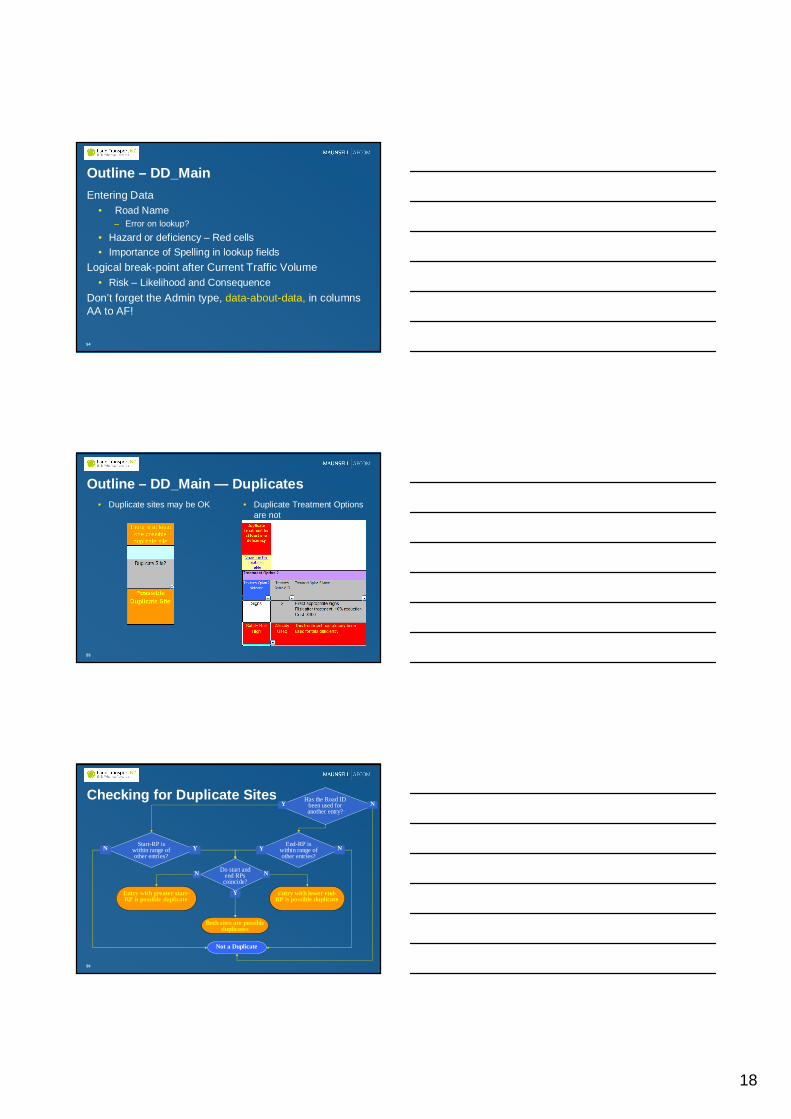
Outline –DD_MainEntering Data
• Road Name– Error on lookup?
• Hazard or deficiency –Red cells• Importance of Spelling in lookup fields
Logical break-point after Current Traffic Volume• Risk –Likelihood and Consequence
Don’t forget the Admin type, data-about-data, in columnsAA to AF!
55
Outline –DD_Main — Duplicates• Duplicate sites may be OK • Duplicate Treatment Options
are not
56
Checking for Duplicate Sites
Not a Duplicate
Entry with greater start-RP is possible duplicate
Entry with lower end-RP is possible duplicate
Both sites are possibleduplicates
End-RP iswithin range ofother entries?
Y N
Y
Do start andend RPscoincide?
NN
Start-RP iswithin range ofother entries?
N Y
Has the Road IDbeen used foranother entry?
Y N

19
57
Outline –TreatmentsData in two places
• Costing info in DD_Main –variable site to site• Treatment Type and post-treatment risk in Treatments
Treatments Table• Risk reduction -v- assessed risks• Create new treatments if required• If run out of rows copy formulae down to new rows
Input Treatments• Key is the Nickname –spelling conventions apply• Cost data
58
Outline –Prioritisation …“First shoot your pheasant”
• Selected the preferred treatment from the options listed• Use Pull-down
S’sheet then calcs:• Current cost –based on estimate and CCI
– Choosing which index to use
• Risk Reduction %• Risk Reduction % / $k• Cost/vehicle over 1 year
59
Outline –Prioritization (cont)
Cumulative Rank• Weightings• Basis
– Sum of (individual ranking * x weighting) for each of RiskReduction %, Risk Reduction % / $k, Cost/vehicle over 1 year§ Cost /veh is ranked lowest to highest,§ Others highest to lowest
Overall Ranking
20
60
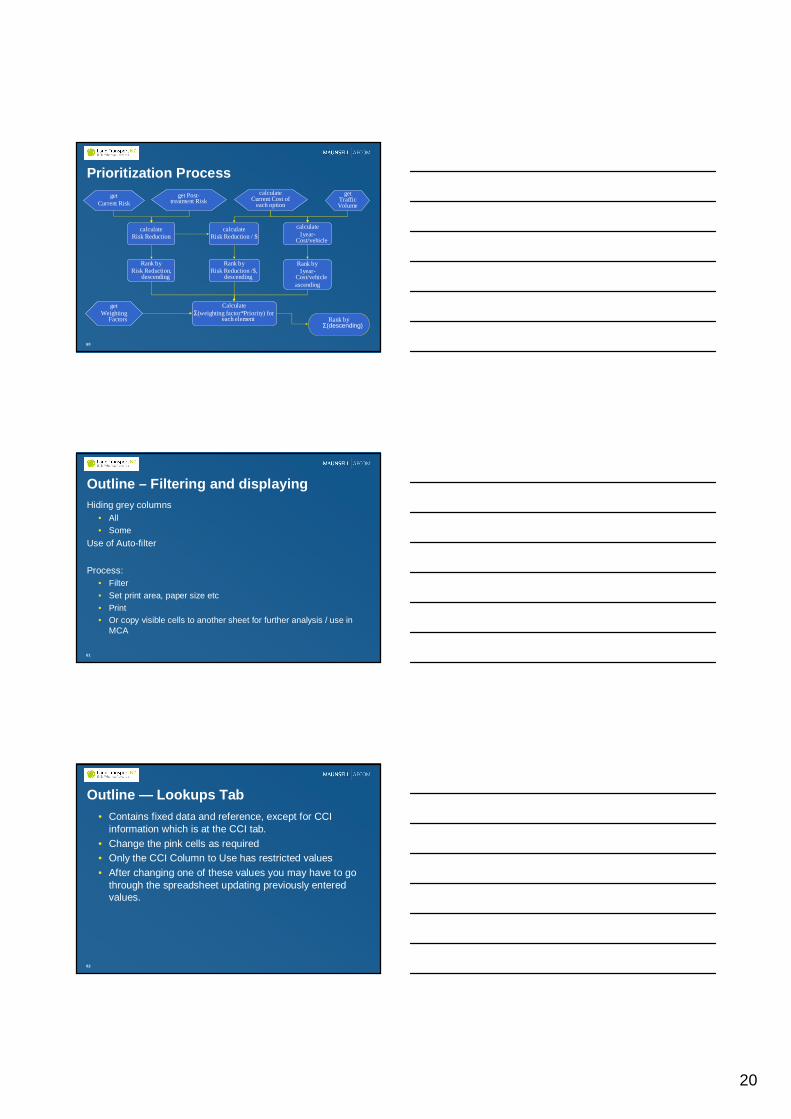
Prioritization Processcalculate
Current Cost ofeach option
getCurrent Risk
get Post-treatment Risk
calculateRisk Reduction
getTrafficVolume
calculateRisk Reduction / $
calculate1year-
Cost/vehicle
getWeighting
Factors
Rank byRisk Reduction,
descending
Rank byRisk Reduction /$,
descending
Rank by1year-
Cost/vehicleascending
Calculate(weighting factor*Priority) for
each element Rank by(descending)
61
Outline –Filtering and displayingHiding grey columns
• All• Some
Use of Auto-filter
Process:• Filter• Set print area, paper size etc• Print• Or copy visible cells to another sheet for further analysis / use in
MCA
62
Outline — Lookups Tab• Contains fixed data and reference, except for CCI
information which is at the CCI tab.• Change the pink cells as required• Only the CCI Column to Use has restricted values• After changing one of these values you may have to go
through the spreadsheet updating previously enteredvalues.