hazop studies using a functional modeling framework
TRANSCRIPT
Ian David Lockhart Bogle and Michael Fairweather (Editors), Proceedings of the 22nd European Symposium on Computer Aided Process Engineering, 17-20 June 2012, London.
HAZOP studies using a functional modeling framework José Luis de la Mata Manuel Rodriguez
Abstract In this paper we present a tool to perform guided HAZOP studies using a functional modeling framework: D-higraphs. It is a formalism that gathers in a single model structural (ontological) and functional information about the process considered. In this paper it is applied to an industrial case showing that the proposed methodology fits its purposes and fulfills some of the gaps and drawbacks existing in previous reported HAZOP assistant tools.
Keywords: Functional modeling; HAZOP; Risk assessment.
1. Introduction
There are a lot of important aspects involved in the consequences of accidents: environmental impact, pollution, operators' occupational health and economy. Avoiding accidents saves money because the losses associated to shutdowns, reparations, compensations or fines are reduced. At the same time, incomes are increased because productivity does. The other aspects also benefit from a safe operation. Process Hazard Analyses (PHA) are carried out to identify the potential safely problems of a process plant in order to provide possible solutions such as process changes, new control strategies or the use of safety instrumentation. There are a broad variety of methods but the most widely used are HAZOP studies (Zhao et al., 2005). However, they consume a lot of time an effort so in the last decades a lot of work and resources has been put to develop tools that automate this process. In this work a new HAZOP assistant is developed based on the D-higraphs methodology, which considers structural and functional information of the system under analysis. Besides, this approach takes into account in a natural way the process itself together with its control system.
2. D-higraphs: merging function and structure
2.1. From Higraphs to D-higraphs Higraphs are a general kind of diagramming objects well suited to the behavioral specification of complex concurrent systems, first presented in Harel (1987). However they are not well suited to represent process system specifications. D-higraphs are an adaptation (dualization) of Higraphs. They consist of blobs, representing transitions, and edges, representing states. They were first presented in Rodriguez & Sanz (2009) as a functional modeling technique that merges functional and structural information of the system modeled. Disjoint blobs imply an AND relation (both transitions between states take place) while orthogonal blobs represent an OR relation (only one of the transitions takes place). It has to be noticed that a D-higraph is NOT a dual higraph in the same way of dual graph,
obtained from changing blobs by edges and edges by blobs. The duality lies in the interpretation of blobs, edges, and properties.
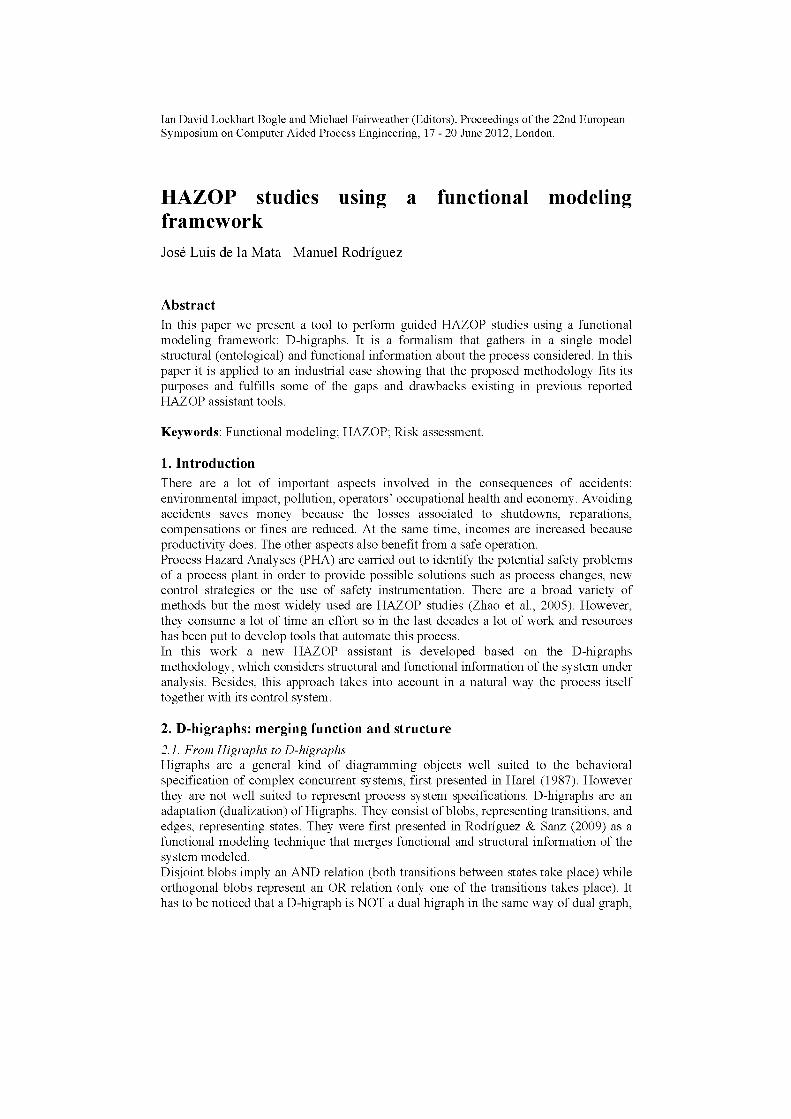
2.2. Blobs and Edges Blobs and their basic elements are depicted in the left-hand-side of Fig. 1 and the different types of edges are shown in the center of Fig. 1. Blobs represent functions (transitions) that are performed by an ACTOR producing state/s 2 if the state/s 1 is enabled and if the condition is true. Edges represent flows of mass, energy, or information, which are responsible of all the interactions in a process system (Lind, 1994). Mass, energy and information edges are depicted differently, but the type of flow does not affect the behavior of the model, it is a just a visual aid. The main properties of blobs and edges are: • Blob connection. An edge always links two blobs. Under certain conditions, one of
the blobs cannot be represented (elliptic blob), but it exists. • Blob inclusion. Blobs can be included inside of other blobs (Venn diagram
inclusion). This means that the inner blob performs a function that is necessary for the function of the outer blob (representation of functions hierarchy).
• Partitioning blobs. A blob can be partitioned into orthogonal components, establishing an OR condition between the partitions.
state 1
, function ,
ACTOR
condition
state 2 ^ mass edge
energy edge
information edge
affluent flowing
F3
T 3
r— store liquid —
DECANTER L d ™ ; T d T 3
effluent flowing
F 4 L d
T 4 T d
Fig. 1. Basic blob and different types of edges.
2.3. Causal and qualitative reasoning The main objective of D-higraphs is not only the representation of knowledge about process systems. De la Mata & Rodríguez (2010a,b) provide a series of causation rules relating two events that allow us to track the evolution and propagation of failures across the system. This rules combined with sensor data of the plant enables the possibility of performing FDI analysis using D-higraph models. However, certain analyses require the use of deviations and not only failures, like HAZOP studies. In a certain way, we need to simulate qualitatively the system in order to propagate these deviations. The description of a system is made in three different layers (Kuipers, 1984): 1. Structural description: variables that characterize the system, such as flow (F),
pressure (P), temperature (T), composition (x), energy (E), information (I), level (L), valve opening (A), etc. The symbols in brackets will be used in D-higraphs.
2. Behavioral description: potential behavior of the system as a network. The M+ and M~ constraints (Kuipers, 1986) provide this information and they we will use the following compacted compacted notation:
z%££" <=> M + ( X „ Z ) A M - ( 7 „ Z ) V U (Eq. 1)
3. Functional description: purpose of a structural component of connections; provided by the D-higraphs layout.
The three layers of this representation are shown in the right-hand-side of Fig. 1, where there is a physical device (DECANTER) whose main purpose is to store liquid. The decanter has two characteristic variables: level (Ld) and temperature (Td). Ld is affected by the inflow F3 with variations of the same sign (an increment of F3 increases Ld) and by the outflow F4 in the opposite way. In the same way, the flow F4 is affected by the level of the decanter in the same direction (see Eq. 1).

3. D-higraphs HAZOP Assistant
D-higraphs are developed using the environment shown in Fig. 2. The models are implemented using a graphic tool Alvarez (2010). This tool has as input the P&ID of the process and it uses a D-higraphs built in template. Once the model has been developed, it is loaded into the expert system. The HAZOP study is performed feeding the deviations to the reasoning engine. The result of the analysis, a causal tree, is provided to the user and they can be fed back to the modeling tool in order to make changes into the process and/or D-higraph.
Fig. 2. D-higraphs environment.
Fig. 3. Light ends recovery unit.
4. Light Ends Separation (case study)
The light ends unit is designed to separate those factions of the crude oil that have a boiling point below cyclohexane (Jones and Pujado, 2006). In this paper we are going to use an example that appears in Hyatt (2003), which also provides a conventional HAZOP analysis of the unit. A simplified P&ID of the unit is shown in Fig. 3.
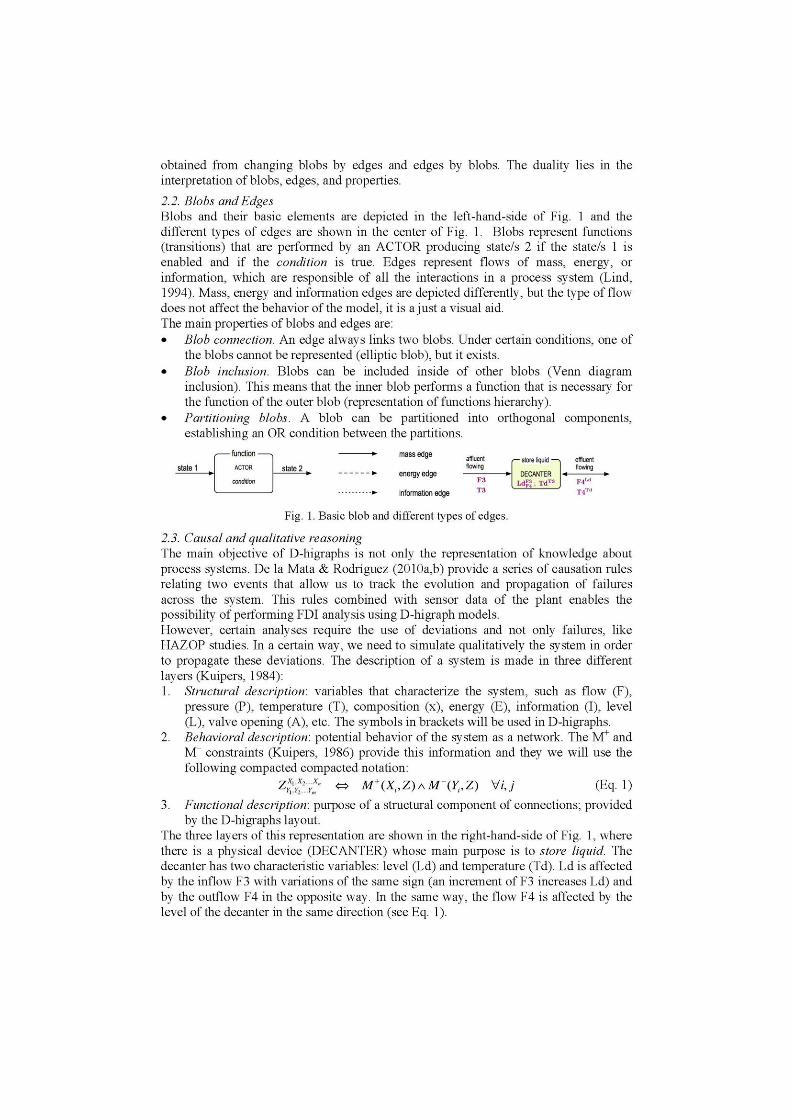
4.1. Functional decomposition The main goal of the overall unit, as said in the process description, is "to recover the light ends fraction under operation conditions". To that end, the system can be divided into sub-systems that provide the necessary subgoals: (1) Feed section: Provide a constant feed into operation conditions; (2) Reflux section: Provide reflux to the stripper and remove non-condensables; (3) Bottoms section: Provide vapor to the stripper and remove bottoms; and (4) Column section: Separate light ends. This functional decomposition is continued until the level of detail desired is obtained. With this decomposition and the P&ID the D-higraph can ben developed. In this paper,
due to space constraints, only a small part of the overall D-higraph is shown: the reflux section of the recovery unit (see Fig. 4).
Fig. 4. Reflux section D-higraph.
F61 : inc
T 6 1 : dec
F11 : ¡nc
T11 : ¡nc
gy transfer.
F53 : ¡nc <
^ F 5 1 : ¡nc < xF52:inc < ^
N"-A2:inc I22:inc —
Deviation 2: High reflux flow.
-F32: inc
~ F 4 1 : inc
Deviation 1: Condenser low energy transfer.
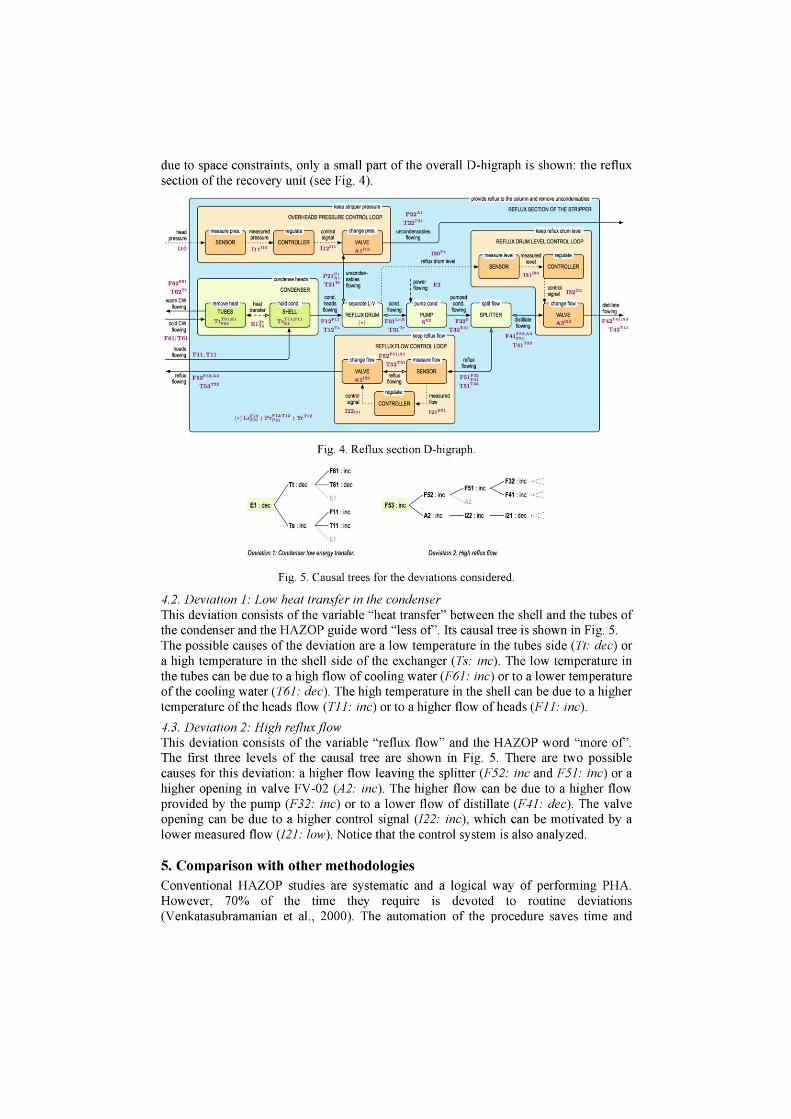
Fig. 5. Causal trees for the deviations considered.
4.2. Deviation 1: Low heat transfer in the condenser This deviation consists of the variable "heat transfer" between the shell and the tubes of the condenser and the HAZOP guide word "less of. Its causal tree is shown in Fig. 5. Fhe possible causes of the deviation are a low temperature in the tubes side (Tt: dec) or a high temperature in the shell side of the exchanger (Ts: inc). Fhe low temperature in the tubes can be due to a high flow of cooling water (F61: inc) or to a lower temperature of the cooling water (T61: dec). Fhe high temperature in the shell can be due to a higher temperature of the heads flow (Til: inc) or to a higher flow of heads (FIT. inc).
4.3. Deviation 2: High reflux flow Fhis deviation consists of the variable "reflux flow" and the HAZOP word "more of. Fhe first three levels of the causal tree are shown in Fig. 5. There are two possible causes for this deviation: a higher flow leaving the splitter (F52: inc and F51: inc) or a higher opening in valve FV-02 (A2: inc). The higher flow can be due to a higher flow provided by the pump (F32: inc) or to a lower flow of distillate (F41: dec). The valve opening can be due to a higher control signal (122: inc), which can be motivated by a lower measured flow (121: low). Notice that the control system is also analyzed.
5. Comparison with other methodologies
Conventional HAZOP studies are systematic and a logical way of performing PHA. However, 70% of the time they require is devoted to routine deviations (Venkatasubramanian et al., 2000). The automation of the procedure saves time and

hence money. Automating HAZOP, the team can spend their time in analyzing the deviations, causes, consequences and the possible solutions and not in obtaining them. Another advantage of automated HAZOPs is that no nodes are left unexplored. The proposed assistant only needs a model (a D-higraph) of the process and not a model for each node of the HAZOP analysis, like the MFM HAZOP assistant (Rossing et al., 2010). The rule database is also common for all of the process because it is related to the relations between the elements of the model and not to the process itself, like HAZOPExpert (Venkatasubramanian et a l , 2000), however, HAZOPExpert is able to deal with batch processes. Another advantage of this approach, when compared with the MFM methodology, is that the conclusions of the study can be directly mapped to the devices and equipment of the process. This is a consequence of the functional and structural integration.
6. Conclusions and further work
In this paper we have presented a tool to perform systematic guided HAZOP studies based on D-higraphs, a functional modeling technique that merges functional and structural information. To show its applicability we have analyzed an industrial process and it has been compared with other existing approaches. The analyses are more complete, easier to perform and directly related to the process under consideration. Future work will be devoted to the implementation of a "translator", which will transform P&IDs to D-higraph models. Further work will also involve the application of this methodology to online FDI and its integration with quantitative models.
References Alvarez, M. E. 2010. Diagnosis de fallos en procesos químicos mediante modelos D-higraph.
Final Project. Department of Chemical Engineering, Technical University of Madrid. CLIPS. 2011. CLIPS, A Tool for Building Expert Systems, http://clipsrules.sourceforge.net De la Mata, J. L., Rodríguez, M. 2010a. Abnormal situation diagnosis using D-higraphs. Proc. of
the 20 European Symposium on Computer Aided Process Engineering, pp. 1477-1482. De la Mata, J. L., Rodríguez, M. 2010b. D-higraphs. ASLab Report, http://www.aslab.org Harel, D. 1987. Statecharts: A visual formalism for complex systems. Sci. Comput. Program., 8. Jones, D. S. J., Pujado, P. R., 2006. Handbook of Petroleum Processing. Springer Link. Kuipers, B. 1984. Commonsense reasoning about causality. Artificial Intelligence, 24. Kuipers, B. 1986. Qualitative simulation. Artifiial Intelligence, 29. Lind, M. 1994. Modeling goals and functions of complex Industrial plant. Applied Artificial
Intelligence, 8 (2). Lind, M. 2005. Modeling goals and functions of control and safety systems. NKS Report. Hyatt, N. 2003. Guidelines for Proc. Haz. Anal., Haz. Identification and Risk Anal. CRC Press. Rodriguez, M., Sanz, R. 2009. Development of integrated functional-structural models. Computer
Aided Process Engineering, 27. Rossing, N. L., Lind, M., Jensen, N., Jorgensen, S. B. 2010. A functional HAZOP methodology.
Computers and Chemical Engineering, 34 (2). Venkatasubramanian, V., Zhao, C , Viswanathan, S. 2000. Intelligent systems for HAZOP
analysis of complex process plants. Computers and Chemical Engineering, 24 (9-10). Zhao, C , Bhushan, M, & Venkatasubramanian, V. 2005. PHASuite: An Automated HAZOP
Analysis Tool for Chemical Processes. Process Safety and Environment Protection, 83 (6).