hcps master plan 2012 annual update - harford county public
TRANSCRIPT

Bridge to Excellence
Harford County Public Schools
Master Plan
2012 Annual Update
Robert M. Tomback, Ph.D. Superintendent of Schools
102 S. Hickory Avenue Bel Air, Maryland 21014
October 15, 2012

i
Dear School Community,
For over a decade, public schools in this country have engaged in multiple efforts to improve the
quality of service they provide to students. The focus of these initiatives is to improve learning
for all students – uplifting the academic achievement of all. The Maryland State Department of
Education has been aggressive in its leadership in improving Maryland’s public schools.
Since the inception of the Maryland School Performance Program in 1990, Harford County
students have performed well on all indicators. As a result of the bi-partisan Federal law, the No
Child Left Behind Act, and the Maryland law, the Bridge to Excellence Act, school systems
have been involved in an even more intensive school improvement era. Academic standards have
been set requiring all students to meet or exceed proficient or advanced levels of performance.
Following intensive study of the state funding program for public education, the Maryland
General Assembly enacted The Bridge to Excellence Act, which required each local school
system to develop a Master Plan to address the requirements of the federal and state laws. This
plan communicates those strategies that will support all students meeting or exceeding academic
standards.
The Bridge to Excellence Master Plan for Harford County Public Schools has become a living
document for improving teaching and student achievement. The underlying principles of No
Child Left Behind are grounded in helping all students achieve academic success. HCPS updates
this Master Plan annually based on performance data. Public input continues to be sought
through formal and informal means and comments are welcome regarding student programs and
services at any time. This feedback will be used as the plan is updated each year.
(www.hcps.org).
As we have moved into a new school year, HCPS has recently completed the eighth annual
update of our system’s Bridge to Excellence Master Plan. In this update, we continue to report
our progress and to identify our challenges. This document continues to be a blueprint
encapsulating the programs and strategies that will ensure continued system and school
improvement.
We recognize and appreciate the commitment of our Board of Education, County Executive, and
County Council in supporting a quality education program for the students of Harford County.
Robert M. Tomback, Ph.D.
Superintendent of Schools

ii
Harford County Public Schools
Bridge to Excellence Master Plan
Vision
Harford County Public Schools will be a community of learners in which our public schools,
families, public officials, businesses, community organizations, and other citizens work
collaboratively to prepare all of our students to succeed academically and socially in a diverse,
democratic, change-oriented, and global society.
Mission
The mission of the Harford County Public Schools is to promote excellence in instructional
leadership and teaching and to provide facilities and instructional materials that support
teaching and learning for the 21st century. The Harford County Board of Education will support
this mission by fostering a climate for deliberate change and monitoring progress through
measurable indicators.
Master Plan Goals
To prepare every student for success in postsecondary education and a career.
To encourage and monitor engagement between the school system and the community to
support student achievement.
To hire and support skilled staff who are committed to increasing student achievement.
To provide safe, secure, and healthy learning environments that are conducive to
effective teaching and learning.
Members of the Board of Education
2012-2013
Vacancy, Appointed Member-at-Large, President
Francis F. Grambo, III, Interim Vice President
Alysson L. Krchnavy
Nancy Reynolds
Joseph A. Hau
James D. Thornton
Thomas Fitzpatrick
Robert L. Frisch
Cassandra R. Beverly, Esquire
Panashe Mutombo, Student Representative
Robert M. Tomback, Ph.D.
SUPERINTENDENT OF SCHOOLS 102 S. Hickory Ave.
Bel Air, Maryland 21014

iii
Harford County Public Schools
Bridge to Excellence Master Plan
Strategies to Manage the Master Plan
Development and Implementation of the Master Plan
The development of the HCPS Master Plan involved a number of stakeholders. The ideas,
beliefs, perceptions, and recommendations of representatives of the various groups were
collected and assimilated into the Master Plan.
HCPS personnel will continue to communicate and collaborate with the stakeholders with regard
to implementation of the plan and progress towards achieving the goals set forth by the HCPS
Board of Education.
The list below identifies the variety of forums utilized to gather data from and communicate with
stakeholders:
Town meetings open to all citizens;
Harford County Regional Association of Student Councils town meeting with
Superintendent and Leadership Team;
Board of Education’s Citizen Advisory Committees;
Harford County Business Roundtable;
Harford County Council of PTA’s presentations;
Harford County Council of PTA’s monthly meetings with Superintendent;
Superintendent’s meetings with Harford County Education Association;
Superintendent and Board of Education’s meetings with Harford Community
College Board of Directors;
Superintendent’s meetings with state delegates and senators;
Superintendent’s monthly meetings with County Executive;
Superintendent’s weekly leadership meetings;
Departmental Citizen Advisory meetings; and
HCPS Website - Internet feedback forum.

iv
Harford County Public Schools
Bridge to Excellence Master Plan
The Harford County Public School System’s Bridge to Excellence Master Plan is the result of
the insights and contributions of many Harford County educators and citizens, who came
together to envision a strong, viable future for the school system and to identify resources needed
to achieve that vision. While it is not possible to cite the names of everyone involved in the
preparation of HCPS’ Master Plan, special appreciation is expressed to the following individuals
who contributed to the 2012 Annual Update.
Acknowledgements
Tamela Abbate Assistant Supervisor of English, Reading, and
Related Language Arts K-12
Edward Fields
Director of Budget
Darlene Amos Executive Assistant, Office of Curriculum and
Instruction
Susan Garrett Supervisor of Career Programs and Art
Kimberly Banks Supervisor of Foreign Language and ESOL
Keri Guilbault, Ed. D. Coordinator of Accelerated Learning
James Boord, III Supervisor of Music
Joyce Jablecki Administrative Assistant, Office of Curriculum
and Instructional Grants
Cornell Brown, Jr. Assistant Superintendent for Operations
James Jewell Assistant Superintendent for Business Services
Jonathan Brown, Ed. D. Director of Community Engagement and Cultural
Proficiency
Sharon Kachur Assistant Supervisor of Mathematics
Susan Brown, Ed. D. Coordinator of Intervention
Teri Kranefeld Manager of Communications
Barbara Canavan Executive Director of Middle Schools
Howard Kutcher, Ed. D. Senior Manager of Human Resources
Eric Clark Grants Accountant
William A. Lawrence Associate Superintendent for Curriculum,
Instruction, and Assessment
Howard Eakes
Assistant Supervisor of Science Stephen C. Lentowski Director of Student Services
Mary Edmunds Budget Specialist
Joseph P. Licata Chief of Administration

v
Acknowledgements
Jean Mantegna
Assistant Superintendent for Human Resources
Kristine Scarry Supervisor of English, Reading, and Related
Language Arts K-12
Andrew Moore, II Director of Information and Technology
Joseph Schmitz
Executive Director of Secondary Education
Sarah Morris Supervisor of Mathematics
Leeann Schubert Coordinator of School Improvement
Angela Morton Executive Director of Elementary Education
Ginny Smith Coordinator, Early Childhood
Alicia Palmer
Coordinator of Grants and Medicaid Phillip Snyder Supervisor of Accountability
Bradley Palmer Supervisor of Title I
Anne-Marie Spakowski Director of Special Education
Jeannine Ravenscraft Budget Analyst
Patrick Spicer, Esq.
General Counsel
Karen Redding
Administrative Assistant, Office of Intervention Mary Beth Stapleton Coordinator of Grants
Theresa Reilly
Coordinator of Teacher Induction Gary Stone
HRIS Team Leader
Andrew Renzulli Supervisor of Science
Jacqueline Tarbert Coordinator of Leadership and Professional
Development
Charlotte Ryan
Administrative Assistant, Executive Director of
Community Engagement and Cultural Proficiency
George Toepfer Supervisor of Social Studies
Sara Saacks Assistant Supervisor of Accountability
Thomas Webber Assistant Supervisor, Office of Compensatory
Education/Title I

vi
Harford County Public Schools
Bridge to Excellence Master Plan
Essential Vocabulary
AP Advanced Placement
AGB Alternative Governance Board
AYP Adequate Yearly Progress – The amount of annual progress on academic
assessments and other indicators, defined by the state, which will ensure all
students are “proficient” by the year 2014
BOE Board of Education
BRAC Base Realignment and Closing
BTE Bridge to Excellence
CFIP Classroom-focused Improvement Process
CIP Capital Improvement Program
CLG Core Learning Goals – The high school content standards that form the
knowledge base for the Maryland High School Assessments
COMAR Code of Maryland Regulations
Common Core
Standards
State Board-adopted standards that detail what students should know in the
academic areas kindergarten through grade twelve
CPD Continuing Professional Development
CSSRP Comprehensive Secondary School Reform Program
CTE Career and Technology Education
ELL English Language Learners
EEA Educator Effectiveness Academy
ESEA Elementary and Secondary Education Act – Federal legislation, also known as
No Child Left Behind (NCLB), which requires an emphasis on and funding for
the objectives and action plans of this report
ESOL English for Speakers of Other Languages
ETM Education That Is Multicultural – Information that offers insights and
sensitivity to all cultures so that instruction can be better planned to embrace
diversity in classrooms

vii
Harford County Public Schools
Bridge to Excellence Master Plan
Essential Vocabulary
FARMS Free and Reduced Meals
Formative
Assessments
Classroom assessment that assists teachers in planning the next steps for
instruction of individual students
GCC General Curriculum Committee
HBCU Historically Black Colleges and Universities
HCEA Harford County Education Association
HCPS Harford County Public Schools
Highly Qualified
Paraprofessionals
Paraprofessionals who deliver instructional services to students and who have
either completed two years of study at an institution of higher education,
obtained an associate’s or higher degree, or met a rigorous standard of quality
and can demonstrate knowledge through a formal assessment
Highly Qualified
Teachers
Public elementary or secondary school teachers who have full state certification
or have passed a state licensing examination, are licensed to teach in the state,
and have not had certification or licensure requirements waived on an
emergency, temporary, or provisional basis
HSA High School Assessment
IDMS Instructional Data Management System
IDS Instructional Data Specialist – central office position associated with Race to
the Top
IEP Individualized Education Plan
IF Instructional Facilitator – school-based position with evaluative duties
ILA Integrated Language Arts
IIS Instructional Improvement System
ILT Instructional Leadership Team – Principal, Assistant Principal(s), Instructional
Facilitator, and Teacher Mentor
Instructional
Technology
Software that supports the instructional program

viii
Harford County Public Schools
Bridge to Excellence Master Plan
Essential Vocabulary
LEA Local Educational Agency – the Harford County Public School System
LRE Least Restrictive Environment
LTDB Longitudinal Test Database
MMSR Maryland Model of School Readiness
MSA Maryland School Assessment
MSAP Maryland Student Assistance Program
MSDE Maryland State Department of Education
MTLSS Maryland Technology Literacy Standards for Students
NCLB No Child Left Behind – Elementary and Secondary Education Act of 2002
PARCC Partnership for College and Career Readiness
PBIS Positive Behavior Interventions and Supports
PD Professional Development
PDS Professional Development School
Performance Levels Categories of student performance on state academic tests: Basic, Proficient,
and Advanced levels
PLC Professional Learning Community
PM Performance Matters
PS Performance Series – Web-based assessment in reading and/or mathematics to
determine student performance levels (scaled scores) and student performance
growth over time
RFP Request for Proposal
RTTT Race to the Top
SC State Curriculum
SIS Student Information System
SMI Scholastic Mathematics Inventory
SRI Scholastic Reading Inventory
Table of Contents
1
Introduction: Integration of Race to the Top with Maryland’s Bridge to Excellence
Master Plan 3
Section A Executive Summary and State Success Factors 7
Introduction
Finance
Instructions for Local Scope of Work Action Plans
Race to the Top Scope of Work Update
Section B Standards and Assessments 32
Race to the Top Scope of Work Update 32
Maryland’s Accountability Plan 43
o Priority, Focus, and Reward Schools 44
o Annual Measurable Objectives 45
o Science and Social Studies 47
o High School Assessments 52
o Strands 55
Specific Student Groups in Bridge to Excellence 58
o English Language Learners 58
o Career and Technology Education 60
o Early Learning 66
o Gifted and Talented Education 70
o Special Education 78
o Education that is Multicultural 79
Section C Data Systems to Support Instruction 104
Race to the Top Scope of Work Update 104
Section D Great Teachers and Leaders 109
Race to the Top Scope of Work Update 109
Highly Qualified/Highly Effective Staff 120
High Quality Professional Development 123
Persistently Dangerous Schools 132
Attendance 133
Graduation and Dropout Rates 135
Section E Turning Around Lowest Performing Schools 138
Race to the Top Scope of Work Update 138

Table of Contents
2
Appendices
Appendix A: Transition Plan for the New Maryland Common Core
State Curriculum 142
Appendix B: Transition to the New Teacher and Principal Evaluation
System 150
List of Tables 151

3
Integration of Race to the Top with
Maryland’s Bridge to Excellence Master Plan
Authorization
Section 5-401, Comprehensive Master Plans, Education Article of the Annotated Code of Maryland
Public Law 111-5, American Recovery and Reinvestment Act of 2009
Introduction
Beginning in 2011, Maryland integrated the Race to the Top (RTTT) Local Scopes of Work with the
existing Bridge to Excellence Master Plan (BTE) and reviewed and approved the Scopes of Work within
the Master Plan review infrastructure in accordance with RTTT and BTE guidelines. The purpose of
this integration was to allow Maryland’s Local Education Agencies (LEAs) to streamline their efforts
under these programs to increase student achievement and eliminate achievement gaps by implementing
ambitious plans in the four RTTT reform areas. This integration also enabled the Maryland State
Department of Education to leverage personnel resources to ensure that all Scopes of Work receive
comprehensive programmatic and fiscal reviews.
Background
In 2002, the Maryland General Assembly enacted the Bridge to Excellence in Public Schools Act. This
legislation provides a powerful framework for all 24 school systems to increase student achievement for
all students and to close the achievement gap. The Bridge to Excellence legislation significantly
increased State Aid to public education and required each LEA to develop a comprehensive Master Plan,
to be updated annually, which links school finance directly and centrally to decisions about improving
student learning. By design, the legislation requires school systems to integrate State, federal, and local
funding and initiatives into the Master Plan. Under Bridge to Excellence, academic programming and
fiscal alignment are carefully monitored by the Master Plan review process.
In August 2010, Maryland was awarded one of the Race to the Top (RTTT) education grants. The grant
provided an additional $250 million in funds over four years and will be used to implement Maryland’s
Third Wave of Reform, moving the State from national leader to World Class. Local RTTT Scopes of
Work have been developed by Maryland school systems and are closely aligned with the overall State
plan to guide the implementation of educational reforms. In 2012, local Scopes of Work were integrated
and reviewed as part of the BTE Master Plan.
In May 2012, the United States Department of Education approved Maryland’s application for flexibility
from some of the long-standing requirements of No Child Left Behind. The flexibility waiver is intended
to support the education reform already underway through programs like Race to the Top. The Master
Plan has been adjusted to address the demands of Maryland’s new accountability structure.


5
Local Planning Team Members
Use this page to identify the members of the school system’s Bridge to Excellence/Race to the
Top planning team. Please include affiliation or title where applicable.
Name Affiliation/Title
Kimberly Banks Supervisor of World Languages and ESOL
James Boord, III Supervisor of Music
Jonathan D. Brown, Ed. D. Executive Director of Community Engagement and Cultural
Proficiency
Susan Brown, Ed. D Coordinator of Intervention
Eric Clark Grants Accountant
Mary Edmunds Budget Specialist
Edward Fields Director of Budget
Susan Garrett Supervisor of Career Programs and Art
Keri Guilbault, Ed. D. Coordinator of Accelerated Learning
Howard Kutcher, Ed. D. Senior Manager – Human Resources
William Lawrence Associate Superintendent of Curriculum, Instruction and
Assessment
Steve Lentowski Director of Student Services
Jean Mantegna Assistant Superintendent for Human Resources
Sarah Morris Supervisor of Mathematics
Alicia Palmer Coordinator of Grants and Medicaid
Bradley Palmer Supervisor of Title I
Jeannine Ravenscraft Budget Analyst
Andrew Renzulli Supervisor of Science

6
Name Affiliation/Title
Kristine Scarry Supervisor of English, Reading, and Related Language Arts
K-12
Joseph Schmitz Executive Director of Secondary Education
Leeann Schubert Coordinator of School Improvement
Ginny Smith Coordinator of Early Childhood
Phillip Snyder Supervisor of Accountability
Anne-Marie Spakowski Director of Special Education
Mary Beth Stapleton Coordinator of Grants
George Toepfer Supervisor of Social Studies
Robert Tomback, Ph.D. Superintendent of Harford County Public Schools
7
Section A: Executive Summary and State Success Factors
I.A
Introduction
Harford County Public Schools (HCPS) is a diverse jurisdiction serving over 38,000 students in
34 elementary schools, nine middle schools, nine high schools, one technical/vocational high
school, a school for students with disabilities, and an alternative education school.
The Harford County Board of Education (BOE) is accelerating efforts and making necessary
changes to the current way of doing business, and has approved a Strategic Plan that aligns with
Maryland’s Race to the Top (RTTT) goals. HCPS believes all students can meet high standards.
To that end, HCPS commits to the following elements of the State’s reform plan as described in
the American Recovery and Reinvestment Act (ARRA):
Supporting the transition to enhanced standards and high-quality assessments;
Using data to improve instruction;
Supporting great teachers and great leaders; and
Turning around HCPS lowest-achieving schools.
The mission of HCPS is to promote excellence in instructional leadership and teaching and to
provide facilities and instructional materials that support learning for the 21st century. The
Harford County BOE supports this mission by fostering a climate that supports deliberate change
and monitoring progress through measurable indicators. Although many students achieve
academic success, HCPS is dedicated to ensuring that ALL students are successful. RTTT
allows for intentional efforts to address some of the most concerning challenges:
Students with disabilities are continually challenged to achieve proficiency on MSA.
Students receiving free and reduced meals and African-American students continue to
score well below the Harford County proficiency percent in MSA Reading and
Mathematics, as well as the Algebra/Data Analysis High School Assessment (HSA).
Job-embedded professional development for teachers with respect to educational
technology, continual funding shortfalls to maintain existing implemented technologies,
and an aging infrastructure which cannot meet the growing demand of online and multi-
media instructional resources remain a challenge.
In order to address these challenges, and ensure every student is prepared for post-secondary
education and a career, four arching goals are identified in the Harford County BOE Strategic
Plan:
Goal 1: To prepare every student for success in postsecondary education and a career.
Goal 2: To encourage and monitor engagement between the school system and the
community to support student achievement.
Goal 3: To hire and support skilled staff who are committed to increasing student
achievement.

8
Goal 4: To provide safe, secure, and healthy learning environments that are conducive to
effective teaching and learning.
These goals align with the RTTT goals of increasing student achievement, graduation rates, and
college enrollment identified in Section A of the State’s application. By school year 2020, HCPS
will:
Increase student achievement from current rates to 100% proficient in English/Language
Arts and Mathematics.
Increase the graduation rate.
Increase the percent of graduates who register as full or part-time post-secondary
students.
Increase the number of students earning college credit at institutions of higher learning
prior to graduation.
Increase the number of college credit courses offered in HCPS including Advanced
Placement (AP), International Baccalaureate (IB) and online.
Increase the number of graduates who meet the MSDE University System of Maryland
Completer.
Meet or exceed the national average for critical reading, mathematics, and writing scores
on the SAT or the ACT.
Furthermore, in order to support the “pipeline” of students ready for STEM careers, HCPS is
developing a coordinated, integrated, comprehensive K-12 STEM Education Strategy. Local
leaders of industry, government, community, and subject content experts are in the process of
developing recommendations that will change STEM education in Harford County. These
recommendations will align with the State’s more rigorous common core standards. The result
of this planning process will be to ensure more students are better prepared for post-secondary
STEM careers.
Budget Narrative
Harford County Public Schools is a fiscally dependent school system with an actual enrollment
of 38,437 students in Fiscal Year (FY) 2012. HCPS is the 140th
largest school system of the
17,735 regular school districts in the country when ranked by enrollment1. This places HCPS in
the top one percent of school districts by size. HCPS is ranked 8th
of the 24 school districts in
the State of Maryland. The student body will be served by a projected 5,370.0 FTE faculty and
staff positions for FY 2013.
Harford County has 54 public schools along with 47 non-public schools2 located within the
county. Citizens in the County have a choice of public or private schools. Approximately 39,000
students attend HCPS, while the number of students attending private schools is unknown. The
2010 population of Harford County was 246,433 and is projected to increase to 252,477 by
1 U.S. Department of Education, National Center for Education Statistics, Common Core of Data (CCD), "Public Elementary/Secondary School
Universe Survey," 2008–09, Version 1a, and "Local Education Agency Universe Survey," 2008–09, Version 1a. 2 Maryland State Department of Education Fact Book for the Fiscal Year 2010-2011.

9
20153. According to the Bureau of Census, the school age population in 2000 was 45,189, of
which 39,540 or 87.5% attended public schools. School enrollment was 35,963 in 1994 and
reached a peak in 2006 of 40,294 and has declined slightly to 38,437.
The Harford County Board of Education adopted FY 2013 Budget for Harford County Public
Schools addresses the essential components of federal legislation known as No Child Left Behind
(NCLB), state legislation known as the Bridge to Excellence Act (BTE), and continues to address
the school systems Strategic Plan and Master Plan. Meeting the educational needs of a growing
and diverse community so that no child is left behind requires vision, knowledge, organization,
effective planning, sufficient coordinated resources, and commitment from all stakeholders.
Since FY 2010, Harford County Public Schools operating costs have increased $48.6 million. In
the same time period, revenue has decreased $6.0 million for a net budgetary shortfall of 54.6
million. The primary increase in expenditures represented costs deemed necessary to provide
mandated services, meet contractual obligations, and to maintain the integrity of instructional
programs. In FY 2013, HCPS employees received their first salary increase since July 1, 2008.
With decreasing revenue, the Unrestricted Fund budget required innovative thinking in order to
cover the additional costs. In response to this challenge, all areas of the budget were examined
with an emphasis on preserving critical programs related to student achievement, creating greater
efficiencies in all operating areas, and making difficult decisions on cost reductions that would
least impact students.
The FY 2013 budget includes a $10 million wage package, the first wage increase for HCPS
employees since July 2008, a $5.5 million increase in teacher pension cost, and other cost of
doing business expenses of $0.8 million. Combined with a decrease in revenue of $7.1 million,
HCPS was faced with a budgetary shortfall of $23.4 million. The shortfall was absorbed via
employee turnover savings of $2.9 million, position reductions through attrition of $3.9 million,
operating cost reductions of $9.2 million, and elimination of non-recurring costs of $8.1 million.
These difficult decisions were part of the Board of Education’s goal of maintaining a competitive
salary structure for all HCPS employees. The negotiated wage package was accepted by the five
employee bargaining units effective July 1, 2012 for FY 2013.
Every effort was made to be fiscally conservative in preparing the FY 2013 Budget. This
budget required difficult decisions in order to align projected expenditures with projected
revenue. The FY 2013 approved Unrestricted Operating, Restricted, and Capital budgets are
$427.8 million, $26.5 million and $14.9 million, respectively.
The fiscal situation addressed in the budget, including the reallocation of existing resources to
cover new expenses, will impact our schools, our students, and all employees of Harford County
Public Schools.
3 www.harfordbusiness.org
10
2011-2012 Race to the Top Summaries and Accomplishments
Section A: State Success Factors
In order to monitor HCPS progress toward achieving the goals outlined in the HCPS
Race to the Top (RTTT) application, HCPS appointed a Project Manager. The Project
Manager oversees HCPS implementation of the state’s reform plan and HCPS projects
designed to address the criteria associated with the four reform areas. Additionally, the
Project Manager works in conjunction with the state’s evaluator to ensure all three phases
of evaluation are completed efficiently and effectively. Finally, the Project Manager
closely monitors the implementation of the K-12 STEM Education Strategy to ensure that
progress is achieved and aligned with all RTTT initiatives.
Projects and tasks accomplished during Year 2 of RTTT:
Attended all MSDE meetings associated with teacher and principal effectiveness,
Common Core State Standards, and the Educator Effectiveness Academies
(EEA).
Assisted MSDE with the set-up and implementation of the EEA.
Organized and facilitated the follow-up professional development to the EEA
provided by HCPS.
Organized the College Board pre-AP workshops for middle school teachers.
Co-chaired the Harford County Educator Effectiveness Council sub-committee on
teacher evaluation.
Organized and facilitated RTTT Work Group meetings including all stakeholders
identified in the Communication Chart.
*See each action plan projects and tasks accomplished in Year 2 under each reform area. All
were overseen by RTTT Project Manager.
Section B: Standards and Assessments
HCPS hired Model Department Chairpersons in Mathematics, English, Science and Social
Studies. HCPS requested the Mathematics and Science chairs be supported by RTTT as they
will play a key role in the creation and implementation of the HCPS STEM initiative and content
delivery, including transition to Common Core Standards and high-quality assessments. The
Model Chairpersons are assigned to work with principals and Core Content Supervisors to
provide supplementary content specific evaluative services at four high schools.
In order to ensure college readiness, HCPS partnered with College Board to address needs and
identify strategies designed to increase the number of students ready for college ensuring higher
quality standards and assessments. Some of those strategies could include parental outreach, AP
practice exams, SAT assistance and preparation.
Projects and tasks accomplished during Year 2 of RTTT:
Identified the principal and three teacher leaders from all 54 schools who participated in
the EEA.

11
Hosted, assisted, and participated in the 2012 EEA.
Provided follow-up professional development for administrators and teachers unable to
attend the EEA.
Facilitated professional development workshops through the College Board for
middle school teachers with regard to Pre-AP Effective Thinking Strategies and
Pre-AP Argumentation and the Writing Process for middle school teachers.
Facilitated professional development to other department chairs in the school
system regarding the teacher appraisal process.
Facilitated professional development using MSDE Universal Design for Learning course
to all administrators.
Section C: Data Systems to Improve Instruction
In order to fully implement the new Instructional Improvement System, and ensure that teachers
are able to access timely data and resources, HCPS hired an Instructional Data Specialist who
works under the direction of the RTTT Project Manager. In coordination with the Office of
Technology, the new Instructional Data Specialist works with MSDE to coordinate the
implementation of data management in determining existing infrastructure needs and detail the
educational technology solutions in order for HCPS teachers to use the new Instructional
Improvement System.
HCPS purchased eSchoolPlus, a Student Information System (SIS) in the second year of the
grant. This new system is a version upgrade to HCPS existing “end of life” SIS which has no
enhancement track to accommodate the data collection required by current and future
state/federal reporting.
Projects and tasks accomplished during Year 2 of RTTT:
Continued work with the Instructional Data Specialist (IDS) to provide immediate
support for all HCPS teachers currently learning to analyze assessment data to inform
instructional practice.
Hosted and coordinated HCPS participation in the Educator Effectiveness Academies.
Continued to identify and address gaps in current HCPS data system and technological
infrastructure, in coordination with MSDE, to support efforts in the successful
development and eventual HCPS transition to the IIS.
Purchased eSchoolPlus upgrade.
Section D: Great Teachers and Leaders
HCPS hired a Coordinator of Teacher Induction who reports to the Coordinator of Leadership
and Professional Development. The Coordinator of Teacher Induction is charged with:
participating in the State’s Induction Program Academies and sending HCPS mentors as
allowable by the state; overseeing a comprehensive teacher induction program based on the
model shared at the Teacher Induction Academies; supervising the implementation of the mentor
teacher program; evaluating mentor teachers in collaboration with school administrators;
collaborating with the Office of Education Services to assess school needs and to assign mentor
teachers as appropriate; and serving as a liaison with MSDE.

12
HCPS ensured all 54 schools sent teams to participate in the Educator Effectiveness Academies
(EEA). These teams will be identified by the RTTT Project Manager in concert with the
Executive Directors of Elementary, Middle, and High School Performance. As follow up from
the EEA, school-based teams will identify additional key staff unable to attend the academy and
train them in the information presented. These staff will be core content teachers and/or special
educators. Throughout all four years of the grant, all teachers will be trained in the new
Instructional Improvement System.
Projects and tasks accomplished during Year 2 of RTTT:
Created the Harford County Educator Effectiveness Council.
Implemented the teacher and principal evaluation pilots.
Identified the principal and three teacher leaders from all 54 schools who participated in
the EEA.
Organized and facilitated the follow-up professional development to the EEA
provided by HCPS.
Implemented the HCPS Teacher Induction Program.
Participated in MSDEs Teacher Induction Academy for LEA Coordinators.
Participated in MSDEs Aspiring Leaders’ Academy and Executive Officer professional
development opportunities.
Provided professional development for mentors and instructional facilitators.
Assessed school needs regarding new teachers and assigned current mentor teachers as
appropriate.
Section E: Turning Around Lowest Performing Schools
The RTTT Project Manager, Executive Directors of Secondary School Performance, the
Executive Director of Community Engagement and Cultural Proficiency, and the Coordinator of
School Improvement planned and implemented secondary school improvement initiatives during
year two of the RTTT grant. The HCPS Coordinator of School Improvement used lessons
learned through the State Breakthrough model and replicated those efforts in secondary schools
which included, Classroom-focused Improvement Process (CFIP), and Universal Design for
Learning (UDL), and Common Core State Standards.
Projects and tasks accomplished during Year 2 of RTTT:
Planned and implemented a hybrid online MSDE Universal Design for Learning course
targeting secondary school teachers working in schools on HCPS identified list.
Applied UDL principles to the Common Core Framework for SY 2012-13 instructional
planning.

13
Maryland’s Accountability System Components, Cross Cutting Themes, and Specific
Student Groups in Bridge to Excellence
Review of 2011-2012 Goal Progress: Identified Successes and Challenges
The Maryland School Assessment (MSA), a measure of student proficiency in reading,
mathematics, and science, was administered in the spring 2012 to students enrolled in grades 3
through 8. High school students were measured in these areas by the High School Assessment
Tests (HSA): Algebra/Data Analysis, Biology, and English 10. Performance in the elementary
and middle schools in reading and mathematics remained generally stable from 2011 to 2012.
Maryland State Assessment - Reading
In the elementary grades, approximately 92% of students scored proficient or advanced in
reading. The largest gains were shown by American Indian students (increase of 10 points) and
Hawaiian/Pacific Islander students (increase of 25 points). The lowest performing subgroup at
this level was ELL, and 83% of these students scored proficient or advanced. At the middle
school level, nearly 87% of students scored proficient or advanced in reading. Subgroup
performance stayed relatively the same as 2011, except for ELL students. The proficiency rate
for ELL students declined from 65% to 30%; however, only 30 ELL students were assessed in
2012.
Maryland State Assessment - Mathematics
Approximately 91% of elementary students scored proficient or advanced in mathematics, up
nearly two points from 2011. American Indian and Hawaiian/Pacific Islander students also
showed the greatest increase from 2011 of 10 points and 12 points, respectively. The lowest
performing subgroup at this level was students with disabilities with a proficiency rate of 63%.
At the middle school level, nearly 82% of the students scored proficient or advanced. This is an
increase of three points from 2011 and an increase of 5 points from 2010. 94% of Asian students
scored proficient or advanced, which makes them the highest performing subgroup. The students
with disabilities subgroup was the lowest performing subgroup, with a proficiency rate of 45%.
However, this subgroup showed an increase of 11 points from 2011.
Maryland State Assessment – Science
In science, fifth grade performance in the aggregate stayed relatively the same as 2011.
Approximately 77% of students scored proficient or advanced in 2012. This is approximately a
five point increase from 2009. Students with disabilities, ELL, and FARMS proficiency stayed
relatively the same as 2011. ELL proficiency increased 20 points compared to 2010, and
FARMS proficiency increased by three points. The lowest performing subgroups at this level
were students with disabilities and ELL subgroups, with proficiency rates of 41% and 39%,
respectively. Eighth grade performance in science also stayed relatively the same as 2011. The
most significant gain in proficiency occurred with Asian students, with an increase of seven
points. Students with disabilities performance in eighth grade increased over two points. The
lowest performing subgroup was ELL students with a 20% proficiency rate.

14
Alternative Maryland School Assessment
Students with disabilities participating in the Alternate Maryland School Assessment (Alt-MSA)
demonstrate mastery of individually-selected indicators and objectives from the reading,
mathematics and science content standards.
Rates for students achieving advanced or proficient on the Alt-MSA reading measure exceeded
90% for all grades at the elementary and middle school levels. Overall trends data for this
assessment reflect increases in and/or maintenance of the number of students scoring advanced
and proficient as they move through the grades.
Rates for students achieving advanced or proficient on the Alt-MSA mathematics measure
exceeded 90% for all grades at the elementary and middle school levels with the exception of
eighth grade. Overall trends data for this assessment reflect increases in and/or maintenance of
the number of students scoring advanced and proficient as they move through the grades.
Rates for students achieving advanced or proficient on the Alt-MSA science measure exceeded
90% for eighth and tenth graders.
High School Assessment - English
The High School Assessment (HSA) in English is given to students in tenth grade. Overall
performance on this assessment is relatively stable from 2011. Nearly 83% passed this
assessment by the end of their sophomore year. Approximately 84% passed this assessment by
the end of their senior year.
In 2012, the highest performing subgroup for this assessment was American Indian students with
a 93% proficiency rate. Students with disabilities achieved the lowest performance with a
proficiency rate of 44%. This subgroup dropped three points from 2011.
High School Assessment – Algebra
The High School Assessment in Algebra/Data Analysis is given to students upon completion of
Algebra I or Algebra B. Performance in 2012 for all students was identical to 2011, with a
proficiency rate of 89%. Approximately 88% of high school students passed this assessment by
the end of their tenth grade year.
In 2012, the highest performing subgroup for this assessment was the Asian population with a
proficiency rate of 97%. Students with disabilities scored the lowest with a proficiency rate of
53%. However, this subgroup gained over two points from 2011.
High School Assessment – Biology
In 2012, the majority of students completed Biology in their tenth grade year. Proficiency
dropped two points from 2011 at the aggregate level. Asian students performed the highest, with
15
a proficiency rate of 95%. Students with disabilities performed the lowest, with a proficiency
rate of 48%. This subgroup dropped three points from 2011.
High School Assessment Graduation Requirements
79% of seniors met the HSA graduation requirements by passing all assessments. This is an
increase of one point from 2011. Approximately 16% of seniors met this requirement through
the combined score option. Approximately 5% of students met this requirement through the
Bridge Plan for Academic Validation. Only three seniors received a waiver for the high school
requirements in 2012.
Attendance
The overall end-of-year attendance rate for all students was 93.8% for 2012. This is a slight
decrease from 94.9% in 2011. The high school attendance rate in 2012 was 93.4%. This was a
slight increase from 2011 from 93.2%. Elementary students have the highest attendance rate by
level – 95.8%.
Graduation Rate
HCPS students exceeded the 2012 AMO for the four-year cohort graduation rate which is based
upon the class of 2011. The 2012 graduation rate was 87.4%, an increase of 1.7 points from
2011. By 2020, the AMO increases to 90.3%. The subgroup with the lowest graduation rate is
students with disabilities. The 2012 graduation rate for this subgroup is 63.3%, an increase of
over six points from 2011. By 2020, the AMO for this subgroup is 76%. The graduation rate for
African-American students increased nearly six points from 74.7% in 2011 to 80.4% in 2012.
The FARMS graduation rate increased three points from 73.1% in 2011 to 76.7% in 2012.
Challenges
Performance has improved significantly since the inception of the annual assessment of student
proficiency in reading and mathematics under the NCLB. In 2004, approximately 75% of
students in grades 3 and 8 scored proficient or advanced in reading, and approximately 70%
scored at that level in mathematics. However, over the past two years, close to 90% of all
students system-wide have performed at proficient or advanced in reading, and 85% have
performed that well in mathematics. Clearly, growth rates have slowed over the past three years.
Harford County’s biggest challenge for mathematics and reading performance is student
participating in special education services. Three elementary schools failed to achieve the 2012
AMO in this subgroup for reading performance. All middle schools achieved their 2012 AMO
for their students with disabilities. However, an achievement gap exists between this subgroup
and all students. In reading at the middle school level, 56% of students with disabilities achieved
proficiency compared to 87% at the aggregate level. At the high school level, 44% of students
with disabilities achieved proficiency compared to 84% at the aggregate level.
16
Mathematics performance is similar to the performance in reading. 45% of students with
disabilities at the middle school level achieved proficiency compared with 82% at the aggregate
level. 53% of students with disabilities in high school achieved proficiency on HSA
Algebra/Data Analysis compared with 89% at the aggregate level. Performance in mathematics
in the students with disabilities did increase from last year at all three levels. Performance of
students with disabilities at the elementary and middle levels stayed relatively the same (73%
and 56%, respectively). Performance at the high school level dropped from 47% to 44%.
Another challenge in HCPS is performance of ELL students. Although all elementary schools
met the 2012 AMO for this subgroup, two middle schools did not. Although this population is
relatively small in HCPS, the achievement gap is the greatest in reading at the middle school
level (30% compared to the aggregate at 87%). In 2012, HCPS had 30 test takers at the middle
school and only nine were proficient. In mathematics, ELL population performed well at the
elementary level with a proficiency rate of 84%. However, proficiency rates at the middle and
high school levels were 60% and 57%, respectively.
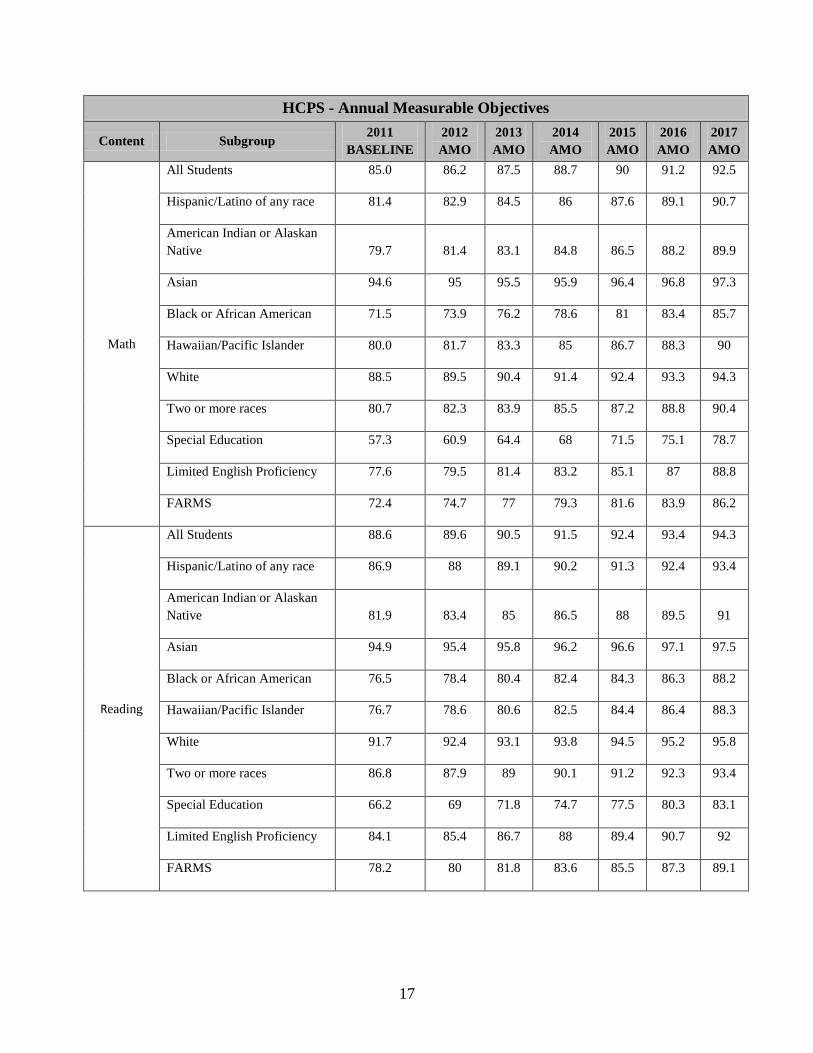
Annual Measurable Objectives
System-wide data for the 2012 AMOs are not yet available. However, HCPS has been provided
AMOs based upon 2011 baseline data. The AMOs increase slightly over the next few years,
with the goal to reduce the percentage of students performing basic in half by 2017. The system-
wide data regarding AMOs is reflected in the table below. Individual school AMO data has been
provided to each school’s administrative team and they are incorporating their goals into their
school improvement plan.
17
HCPS - Annual Measurable Objectives
Content Subgroup 2011
BASELINE
2012
AMO
2013
AMO
2014
AMO
2015
AMO
2016
AMO
2017
AMO
Math
All Students 85.0 86.2 87.5 88.7 90 91.2 92.5
Hispanic/Latino of any race 81.4 82.9 84.5 86 87.6 89.1 90.7
American Indian or Alaskan
Native 79.7 81.4 83.1 84.8 86.5 88.2 89.9
Asian 94.6 95 95.5 95.9 96.4 96.8 97.3
Black or African American 71.5 73.9 76.2 78.6 81 83.4 85.7
Hawaiian/Pacific Islander 80.0 81.7 83.3 85 86.7 88.3 90
White 88.5 89.5 90.4 91.4 92.4 93.3 94.3
Two or more races 80.7 82.3 83.9 85.5 87.2 88.8 90.4
Special Education 57.3 60.9 64.4 68 71.5 75.1 78.7
Limited English Proficiency 77.6 79.5 81.4 83.2 85.1 87 88.8
FARMS 72.4 74.7 77 79.3 81.6 83.9 86.2
Reading
All Students 88.6 89.6 90.5 91.5 92.4 93.4 94.3
Hispanic/Latino of any race 86.9 88 89.1 90.2 91.3 92.4 93.4
American Indian or Alaskan
Native 81.9 83.4 85 86.5 88 89.5 91
Asian 94.9 95.4 95.8 96.2 96.6 97.1 97.5
Black or African American 76.5 78.4 80.4 82.4 84.3 86.3 88.2
Hawaiian/Pacific Islander 76.7 78.6 80.6 82.5 84.4 86.4 88.3
White 91.7 92.4 93.1 93.8 94.5 95.2 95.8
Two or more races 86.8 87.9 89 90.1 91.2 92.3 93.4
Special Education 66.2 69 71.8 74.7 77.5 80.3 83.1
Limited English Proficiency 84.1 85.4 86.7 88 89.4 90.7 92
FARMS 78.2 80 81.8 83.6 85.5 87.3 89.1

18
LEA Level AMO Analysis for Reading and Mathematics
SY 2011-12 data reflect that thirty elementary schools out of thirty-four schools (91.1%) met all
English/Language Arts AMOs. In SY 2010-11, twenty- four of the thirty-three elementary
schools made AYP (72.7%).
The SY 2011-12 data indicates that five out of nine (55.5%) of the district‘s middle schools met
all English/Language Arts AMOs. In SY 2010-11, two out of nine (22.2%) of the district‘s
middle schools met AYP.
Although Harford County Public School is pleased with the improvements in meeting AMOs at
both the elementary and middle school levels, the system faces several challenges related to
English/Language Arts. HCPS seeks continued growth for all subgroups while ensuring a focus
on those subgroups not achieving AYP. All Harford County Public Schools continue to focus on
data driven instructional decision making for all students. Schools were initially trained in the
Classroom Focused Improvement Process (CFIP) during SY 2009-10 and continue to receive
leadership and site based professional development to support the ongoing and effective
implementation of CFIP. All School Improvement Plans are reviewed centrally to ensure that
each school maintains a focus on increasing teacher capacity in planning and delivering high
quality instruction that is supported by data driven instructional decision making in the area of
Reading/Language Arts.
Number and Percentage of all HCPS Schools Making Adequate Yearly Progress
(Reading and Mathematics)
Year
Elementary Middle High
Total #
of
Schools
Schools
Making AYP
Total #
of
Schools
Schools
Making AYP
Total #
of
Schools
Schools
Making AYP
# % # % # %
2004 33 33 100 8 5 62.5 10 8 80
2005 33 32 96.9 8 7 87.5 10 6 60
2006 33 31 93.9 8 7 87.5 10 8 80
2007 33 31 93.9 8 5 62.5 10 6 60
2008 33 30 90.9 9 3 33.3 10 9 90
2009 33 29 87.8 9 3 33.3 10 7 70
2010 33 28 84.8 9 4 44.4 11 5 45.4
2011 33 24 72.7 9 2 22.2 11 6 54.5
Number and Percentage of all HCPS Schools Meeting AMOs in
Reading/Language Arts
Year
Elementary Middle High
Total #
of
Schools
Schools
Meeting
AMOs
Total #
of
Schools
Schools
Meeting
AMOs
Total #
of
Schools
Schools
Meeting
AMOs
# % # % # %
2012 34 31 91.1% 9 5 55.5% 10 TBD TBD

19
Listed below are changes and/or adjustments that Harford County Public Schools will make to
ensure student progress.
HCPS School Improvement Measures
2012-2013
School Timeline School Improvement Measure
All Schools July 2012-
June 2013
Use MSA data and other measures of school
performance to develop the School Improvement
Plan (SIP).
Design the SIP to address:
o Scientifically based research strategies that
will bring all students to proficiency in
reading and mathematics.
o Professional development that meets the
MD Teacher professional Development
standards.
o Parent involvement.
o Measurable annual objectives for progress
by each subgroup of students.
o Activities that extend beyond the school
day/year.
o Incorporation of a teacher mentoring
program.
o Implementation responsibilities.
Provide parents and school staff the opportunity to
participate in the development of the SIP.
Submit SIP to the Executive Director of
Elementary/Middle/High School Performance and
Coordinator of School Improvement.
Conduct weekly ILT meetings to analyze student
achievement data, identify students and staff needs,
and plan professional development activities.
Conduct monthly/quarterly SIT meetings to
monitor the development and implementation of the
school’s SIP to ensure that it reflects the previous
and current data and analysis.
Review and analyze student data Instructional Data
Management System (Performance Matters) in
efforts to make decisions about appropriate
intervention programs and instructional strategies
to meet the needs of all learners.
Develop and implement an interventions plan
targeting any student not performing at the
proficient level with specific emphasis on
individual student monitoring.
20
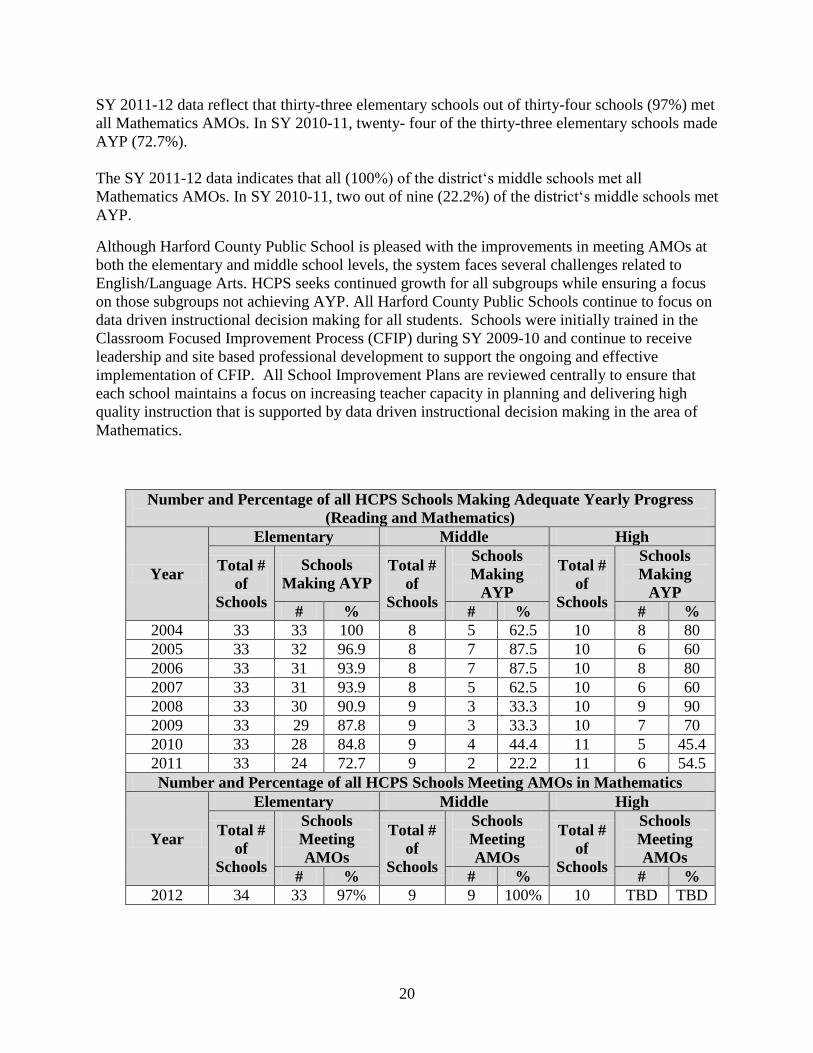
SY 2011-12 data reflect that thirty-three elementary schools out of thirty-four schools (97%) met
all Mathematics AMOs. In SY 2010-11, twenty- four of the thirty-three elementary schools made
AYP (72.7%).
The SY 2011-12 data indicates that all (100%) of the district‘s middle schools met all
Mathematics AMOs. In SY 2010-11, two out of nine (22.2%) of the district‘s middle schools met
AYP.
Although Harford County Public School is pleased with the improvements in meeting AMOs at
both the elementary and middle school levels, the system faces several challenges related to
English/Language Arts. HCPS seeks continued growth for all subgroups while ensuring a focus
on those subgroups not achieving AYP. All Harford County Public Schools continue to focus on
data driven instructional decision making for all students. Schools were initially trained in the
Classroom Focused Improvement Process (CFIP) during SY 2009-10 and continue to receive
leadership and site based professional development to support the ongoing and effective
implementation of CFIP. All School Improvement Plans are reviewed centrally to ensure that
each school maintains a focus on increasing teacher capacity in planning and delivering high
quality instruction that is supported by data driven instructional decision making in the area of
Mathematics.
Number and Percentage of all HCPS Schools Making Adequate Yearly Progress
(Reading and Mathematics)
Year
Elementary Middle High
Total #
of
Schools
Schools
Making AYP
Total #
of
Schools
Schools
Making
AYP
Total #
of
Schools
Schools
Making
AYP
# % # % # %
2004 33 33 100 8 5 62.5 10 8 80
2005 33 32 96.9 8 7 87.5 10 6 60
2006 33 31 93.9 8 7 87.5 10 8 80
2007 33 31 93.9 8 5 62.5 10 6 60
2008 33 30 90.9 9 3 33.3 10 9 90
2009 33 29 87.8 9 3 33.3 10 7 70
2010 33 28 84.8 9 4 44.4 11 5 45.4
2011 33 24 72.7 9 2 22.2 11 6 54.5
Number and Percentage of all HCPS Schools Meeting AMOs in Mathematics
Year
Elementary Middle High
Total #
of
Schools
Schools
Meeting
AMOs
Total #
of
Schools
Schools
Meeting
AMOs
Total #
of
Schools
Schools
Meeting
AMOs
# % # % # %
2012 34 33 97% 9 9 100% 10 TBD TBD

21
Listed below are changes and/or adjustments that Harford County Public Schools will make to
ensure student progress.
HCPS School Improvement Measures
2012-2013
School Timeline School Improvement Measure
All Schools July 2012-
June 2013
Use MSA data and other measures of school
performance to develop the School Improvement Plan
(SIP).
Design the SIP to address:
o Scientifically based research strategies that will
bring all students to proficiency in reading and
mathematics.
o Professional development that meets the MD
Teacher professional Development standards.
o Parent involvement.
o Measurable annual objectives for progress by
each subgroup of students.
o Activities that extend beyond the school
day/year.
o Incorporation of a teacher mentoring program.
o Implementation responsibilities.
Provide parents and school staff the opportunity to
participate in the development of the SIP.
Submit SIP to the Executive Director of
Elementary/Middle/High School Performance and
Coordinator of School Improvement.
Conduct weekly ILT meetings to analyze student
achievement data, identify students and staff needs, and
plan professional development activities.
Conduct monthly/quarterly SIT meetings to monitor the
development and implementation of the school’s SIP to
ensure that it reflects the previous and current data and
analysis.
Review and analyze student data Instructional Data
Management System (Performance Matters) in efforts to
make decisions about appropriate intervention programs
and instructional strategies to meet the needs of all
learners.
Develop and implement an interventions plan targeting
any student not performing at the proficient level with
specific emphasis on individual student monitoring.
22
Special Education Services
HCPS is committed to providing a full continuum of supports, resources and services enabling
all students the opportunity to achieve to their full potential in instructional environments that
acknowledge and respond to individual needs. Students with disabilities receive supports and
services by means of specialized instruction as determined by the Individualized Educational
Plan/Individualized Family Service Plan (IEP/IFSP) Team process. The goal of the IEP /IFSP
process is the provision of services in least restrictive environment; ensuring that students with
disabilities are educated to the maximum extent appropriate with children who are nondisabled.
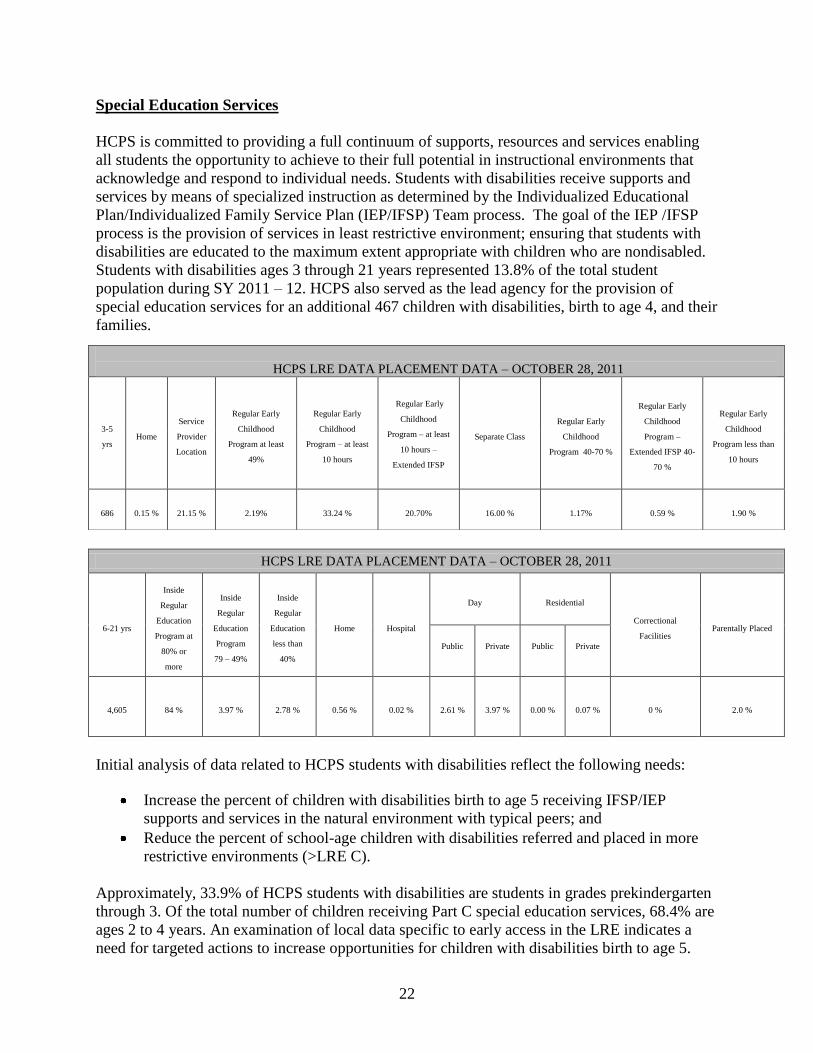
Students with disabilities ages 3 through 21 years represented 13.8% of the total student
population during SY 2011 – 12. HCPS also served as the lead agency for the provision of
special education services for an additional 467 children with disabilities, birth to age 4, and their
families.
HCPS LRE DATA PLACEMENT DATA – OCTOBER 28, 2011
6-21 yrs
Inside
Regular
Education
Program at
80% or
more
Inside
Regular
Education
Program
79 – 49%
Inside
Regular
Education
less than
40%
Home Hospital
Day Residential
Correctional
Facilities Parentally Placed
1. Public 2. Private 3. Public 4. Private
4,605 84 % 3.97 % 2.78 % 0.56 % 0.02 % 2.61 % 3.97 % 0.00 % 0.07 % 0 % 2.0 %
Initial analysis of data related to HCPS students with disabilities reflect the following needs:
Increase the percent of children with disabilities birth to age 5 receiving IFSP/IEP
supports and services in the natural environment with typical peers; and
Reduce the percent of school-age children with disabilities referred and placed in more
restrictive environments (>LRE C).
Approximately, 33.9% of HCPS students with disabilities are students in grades prekindergarten
through 3. Of the total number of children receiving Part C special education services, 68.4% are
ages 2 to 4 years. An examination of local data specific to early access in the LRE indicates a
need for targeted actions to increase opportunities for children with disabilities birth to age 5.
HCPS LRE DATA PLACEMENT DATA – OCTOBER 28, 2011
3-5
yrs Home
Service
Provider
Location
Regular Early
Childhood
Program at least
49%
Regular Early
Childhood
Program – at least
10 hours
Regular Early
Childhood
Program – at least
10 hours –
Extended IFSP
Separate Class
Regular Early
Childhood
Program 40-70 %
Regular Early
Childhood
Program –
Extended IFSP 40-
70 %
Regular Early
Childhood
Program less than
10 hours
686 0.15 % 21.15 % 2.19% 33.24 % 20.70% 16.00 % 1.17% 0.59 % 1.90 %
23
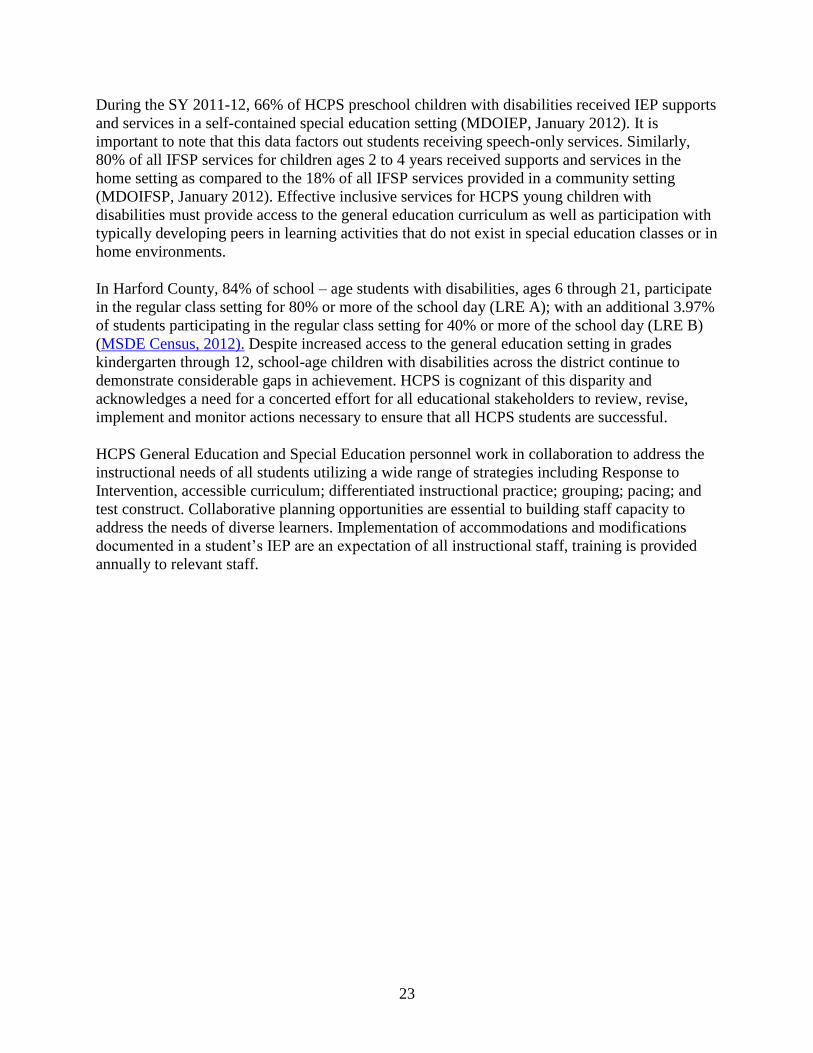
During the SY 2011-12, 66% of HCPS preschool children with disabilities received IEP supports
and services in a self-contained special education setting (MDOIEP, January 2012). It is
important to note that this data factors out students receiving speech-only services. Similarly,
80% of all IFSP services for children ages 2 to 4 years received supports and services in the
home setting as compared to the 18% of all IFSP services provided in a community setting
(MDOIFSP, January 2012). Effective inclusive services for HCPS young children with
disabilities must provide access to the general education curriculum as well as participation with
typically developing peers in learning activities that do not exist in special education classes or in
home environments.
In Harford County, 84% of school – age students with disabilities, ages 6 through 21, participate
in the regular class setting for 80% or more of the school day (LRE A); with an additional 3.97%
of students participating in the regular class setting for 40% or more of the school day (LRE B)
(MSDE Census, 2012). Despite increased access to the general education setting in grades
kindergarten through 12, school-age children with disabilities across the district continue to
demonstrate considerable gaps in achievement. HCPS is cognizant of this disparity and
acknowledges a need for a concerted effort for all educational stakeholders to review, revise,
implement and monitor actions necessary to ensure that all HCPS students are successful.
HCPS General Education and Special Education personnel work in collaboration to address the
instructional needs of all students utilizing a wide range of strategies including Response to
Intervention, accessible curriculum; differentiated instructional practice; grouping; pacing; and
test construct. Collaborative planning opportunities are essential to building staff capacity to
address the needs of diverse learners. Implementation of accommodations and modifications
documented in a student’s IEP are an expectation of all instructional staff, training is provided
annually to relevant staff.

24
I.B
Finance Section
Introduction
The Master Plan Annual Updates provide insight into the work that school systems engage in on
a daily basis, demonstrating their commitment to accelerating student achievement and
eliminating achievement gaps. The finance section, in conjunction with the budget narrative
information in the Executive Summary, includes a Current Year Variance Table, a Prior Year
Variance Table, Race to the Top Scope of Work grant documents and Project Budget
workbooks, and analyzing questions. Together, these documents illustrate the local school
system’s alignment of the annual budget with the Master Plan priorities.
Background
In FY 2009, the finance structure created through the Bridge to Excellence Act was fully phased-
in. In August of 2010, Maryland was awarded a federal Race to the Top grant which is assisting
the State and its participating LEAs implement Maryland’s third wave of education reform. The
focus of the finance section will be the total budget and all budgetary changes (retargeted funds,
redistributed resources, and new funds) as opposed to only looking at uses of new funds. This
focus is indicated in the Executive Summary and the supporting tables.
Definitions of Key Terms
1. Original Approved Budget – budget as approved at the beginning (July 1) of the fiscal
year
2. Final Approved Budget – budget as approved at the end (June 30) of the fiscal year
3. Redistributed Funds – funds that were once used for a different purpose, now being used
for a new purpose
4. Retargeted Resources – resources that are being used for a new purpose without a change
in funding
Revenue Analysis
1. Did actual FY 2012 revenue meet expectations as anticipated in the Master Plan
Update for 2011? If not, identify the changes and the impact any changes had on
the FY 2012 budget and on the system’s progress towards achieving Master Plan
goals. Please include any subsequent appropriations in your comparison table and
narrative analysis.
Yes, revenues finished slightly higher than originally planned due to:
Additional restricted fund awards subsequent to the approval of the budget.
One-time bonus for employees funded by the Harford County Government.
One-time reimbursements of excess insurance costs by third party and federal
government which was redistributed to the Other Post-Employment Benefits
(OPEB) fund.

25
2. Please provide a comparison of the planned versus actual expenditures for each
local goal provided in the Prior Year Variance Table. Identify changes in
expenditures and provide a narrative discussion of the impact of the changes.
The costs of instructional salaries exceeded the planned budget is sections B, D, and E
but the additional expenditures in this category is attributed to the one- time bonus
payment funding from the Harford County Government. In the mandatory costs of doing
business fixed charges exceeded the planned budget, the additional expenses occurred
when one-time reimbursements for excess insurance costs were redirected to the OPEB
funds in support of future retirees costs.
3. Please describe what the influx of flexible ARRA SFSF funds has allowed the school
system to accomplish this year, regardless of whether or not the SFS funds were
directly used to fund an initiative. (For example: A school system plans to use SFS
funds to pay for utilities, and that decision, in turn, is allowing the district to
allocate funds to a different program or initiative.)
Non-applicable to Harford County Public Schools.
4. If the State Fiscal Stabilization (SFS) funds were used for specific construction
projects, please provide a list of the specific construction projects (ARRA Division,
A, Section 14008) and the corresponding resource allocations.
Non-applicable to Harford County Public Schools.
5. Please describe, if applicable, one-time uses of SFSF funds. Include individual
activities and corresponding resource allocations in your description. Since the
SFSF funds have expired, is there a need for a plan of sustainability? If so, please
briefly describe the plan.
Non-applicable to Harford County Public Schools.
6. Please describe the steps that the school system proposes to take to permit students,
teachers, and other program beneficiaries to overcome barriers that impede access
to, or participation in, a program or activity.
Non-applicable to Harford County Public Schools.
7. How has the potential “funding cliff” impacted current discussions and subsequent
decisions regarding the most effective use of ARRA funds?
New positions hired with ARRA funds were closely reviewed. Those positions deemed
essential to sustain were absorbed via other funding sources.
26
Race to the Top Monitoring Questions
1. Is a balance available in any project at the end of Project Year 2? If so, please
provide the reason for the balance for each project.
No balances are projected on any projects at the end of year two.
2. How did the availability of unused funds at the conclusion of Project Year 2 impact
the LEA’s planning for Project Year 3 and beyond?
Non-applicable to Harford County Public Schools.
3. What programmatic changes or accelerations have been made to ensure that
activities and goals are met within the grant period?
HCPS has added one project reallocating funds from several projects, in order to support
an upgrade of the Performance Matters Initiative.
4. What will the LEA do differently in Project Year 3 as a result of lessons learned in
implementing Project Year 2?
HCPS does not anticipate changes to the goals and activities originally proposed except
for the addition of the Performance Matters Initiative.
5. Does the LEA anticipate any challenges in implementing Project Year 3? If so,
please identify the challenges at the grant and project level, if applicable.
HCPS does not anticipate any major challenges in implementing Project Year 2.
27
Race to the Top Scope of Work Narratives and Action Plans
Section A: State Success Factors
Narrative
In the 2010-2011 school year, HCPS administration was reconfigured under the leadership of the
Superintendent. The Associate Superintendent for Curriculum, Instruction and Assessment, now
oversees the Offices of Accountability, Content Supervisors, Professional Development, Special
Education, and Student Services, as well as the Executive Directors of Elementary, Middle, and
High School Performance. This organizational structure supports an efficient decision-making
process regarding Race to the Top (RTTT) oversight and implementation. In addition, the HCPS
leadership team chaired by the Superintendent meets weekly to address any inter-departmental
concerns or issues and receives updates regarding RTTT initiatives.
When grant funds were awarded in March 2011, HCPS appointed a Project Manager to monitor
HCPS progress toward achieving the goals and activities outlined in the RTTT application. The
RTTT Project Manager sits on the Superintendent’s Leadership Team and dedicates 75% of her
current work to oversee RTTT and 25 % overseeing all HCPS intervention services. The RTTT
Project Manager oversees the HCPS implementation of Maryland’s reform plan, as well as the
specific projects outlined in the RTTT Scopes of Work.
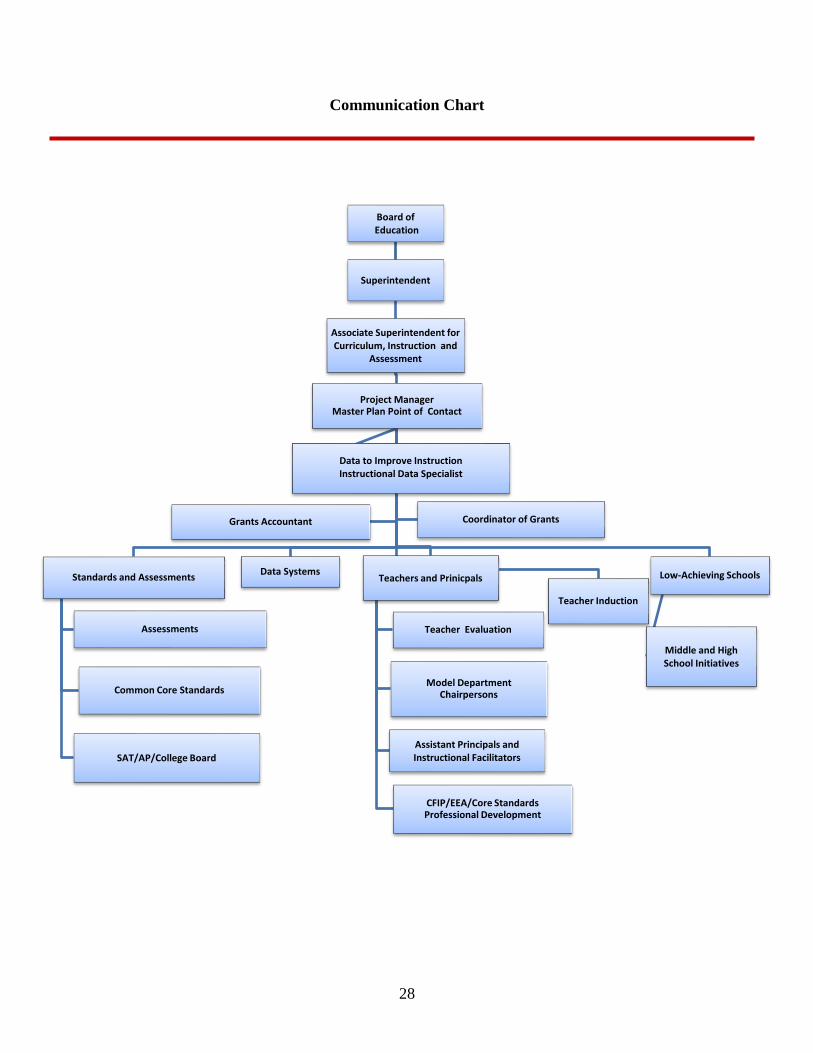
The Coordinator of Grants, the Grants Accountant, and the RTTT Project Manager work
together to ensure all current and future funding streams and expenditures are aligned with RTTT
Scopes of Work, including the Master Plan 2012 Update, and will work in concert with MSDEs
RTTT evaluator. Finally, the RTTT Project Monitor closely monitors the implementation of the
K-12 STEM Education Strategy to ensure that progress is achieved and aligned with all RTTT
initiatives. A chart reflecting HCPS internal RTTT communication and oversight is as follows:
28
Communication Chart
Board of Education
Superintendent
Associate Superintendent for Curriculum, Instruction and
Assessment
Project Manager Master Plan Point of Contact
Standards and Assessments
Common Core Standards
SAT/AP/College Board
Assessments
Data Systems Teachers and Prinicpals
Teacher Evaluation
Model Department Chairpersons
Assistant Principals and Instructional Facilitators
CFIP/EEA/Core Standards Professional Development
Teacher Induction
Low-Achieving Schools
Middle and High School Initiatives
Grants Accountant Coordinator of Grants
Data to Improve Instruction Instructional Data Specialist
29
Projects and tasks accomplished during Year 2 of RTTT:
Attended all MSDE meetings associated with teacher and principal effectiveness,
Common Core State Standards, and the Educator Effectiveness Academies (EEA).
Assisted MSDE with the set-up and implementation of the EEA.
Organized and facilitated the follow-up professional development to the EEA provided
by HCPS.
Organized the College Board pre-AP workshops for middle school teachers.
Co-chaired the Harford County Educator Effectiveness Council sub-committee on
teacher evaluation.
Organized and facilitated RTTT Work Group meetings including all stakeholders
identified in the Communication Chart.
*See each action plan projects and tasks accomplished in Year 2 under each reform area. All were
overseen by RTTT Project Manager.

30
Action Plan: Section A
Goal(s):
Increase student achievement from current rates to 100% proficient in English/Language Arts and Mathematics.
Increase the graduation rate.
Increase the percent of graduates who register as full or part-time post-secondary students.
Increase the number of students earning college credit at institutions of higher learning prior to graduation.
Increase the number of college credit courses offered in HCPS including AP, IB and online.
Increase the number of graduates who meet the MSDE University System of Maryland Completer.
Meet or exceed the national average for critical reading, mathematics, and writing scores on the SAT or the ACT.
Section A:
State Success Factors
Correlation
to State Plan
Project
Number
Start
Date
End
Date
Key
Personnel
Performance
Measure
Recurring
Expense:
Y/N
MOU Requirements:
(No)
Additional Required
Activities:
1. Cooperate with
national and statewide
evaluation.
(A)(2) 10/01/12 9/30/13 RTTT Project
Manager
Supervisor of
Accountability
National and
statewide evaluation
completed
N
31
Section A:
State Success Factors
Correlation
to State Plan
Project
Number
Start
Date
End
Date
Key
Personnel
Performance
Measure
Recurring
Expense:
Y/N
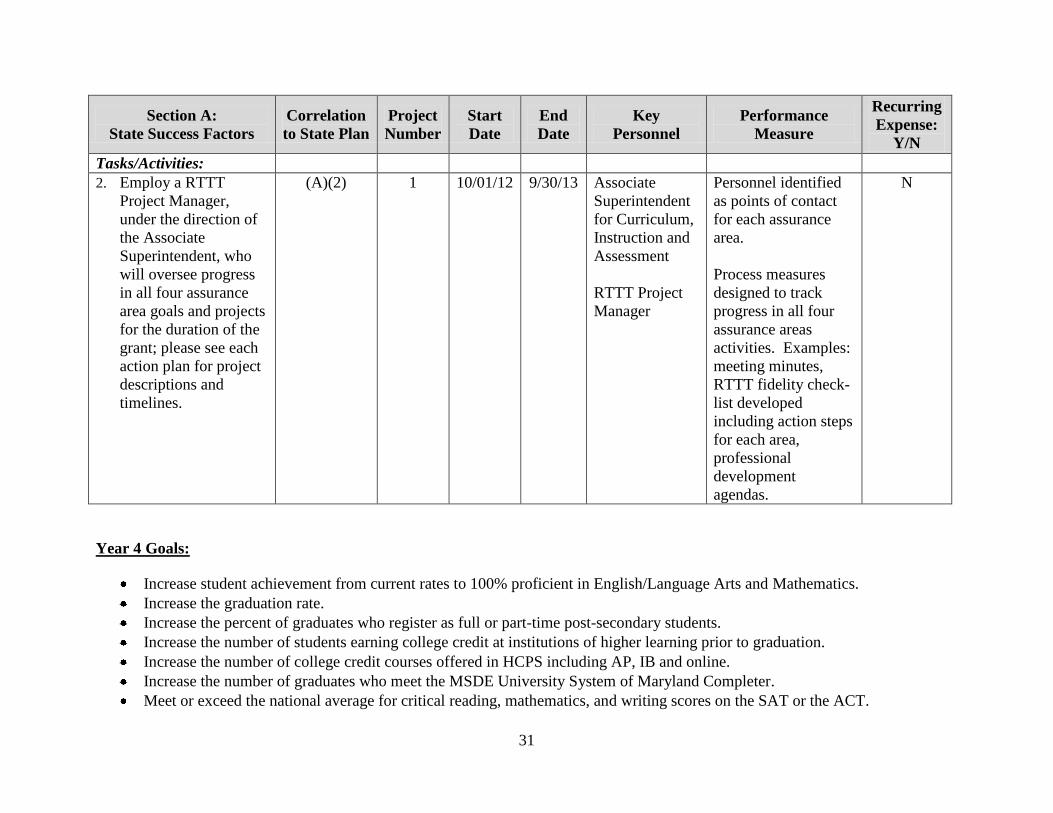
Tasks/Activities:
2. Employ a RTTT
Project Manager,
under the direction of
the Associate
Superintendent, who
will oversee progress
in all four assurance
area goals and projects
for the duration of the
grant; please see each
action plan for project
descriptions and
timelines.
(A)(2) 1 10/01/12 9/30/13 Associate
Superintendent
for Curriculum,
Instruction and
Assessment
RTTT Project
Manager
Personnel identified
as points of contact
for each assurance
area.
Process measures
designed to track
progress in all four
assurance areas
activities. Examples:
meeting minutes,
RTTT fidelity check-
list developed
including action steps
for each area,
professional
development
agendas.
N
Year 4 Goals:
Increase student achievement from current rates to 100% proficient in English/Language Arts and Mathematics.
Increase the graduation rate.
Increase the percent of graduates who register as full or part-time post-secondary students.
Increase the number of students earning college credit at institutions of higher learning prior to graduation.
Increase the number of college credit courses offered in HCPS including AP, IB and online.
Increase the number of graduates who meet the MSDE University System of Maryland Completer.
Meet or exceed the national average for critical reading, mathematics, and writing scores on the SAT or the ACT.

32
Section B: Standards and Assessments
Narrative
Harford County Public Schools (HCPS) has committed to working with the Maryland State
Department of Education (MSDE) in the alignment of curriculum, instruction, and assessment
with regard to the Maryland Content Standards and the State Curriculum to ensure academic
rigor for all students since 2003. In the past, HCPS devoted time and resources regarding the
development and implementation of the State Curriculum, as well as the vital instructional tools
currently located on the Online Instructional Toolkit through multiple professional development
opportunities with teachers. As MSDE transitions to the Common Core State Standards, HCPS
has committed staff resources and expertise to the state’s efforts to ensure world class standards
and engaging curriculum is offered in every Maryland classroom.
HCPS content supervisors and master teachers are working with MSDE on the Gap Analysis
alignment between the State Curriculum and the Common Core State Standards. This
curriculum development was adopted by the State Board of Education in June 2011, and it is
essential for HCPS administrators and supervisors to ensure all teachers fully embrace the
Common Core State Standards. In order to ensure HCPS administrators and staff are ready to
transition to these high quality standards and assessments, the activities described in sections B
and D will be implemented in Year 3 of Race to the Top (RTTT).
HCPS is committed to improving classroom instruction so all students are ready to succeed in
both college and career. Recognizing the core of Maryland’s education reform efforts center
around technology systems, processes and resources, HCPS embraces the nine-step Instructional
Improvement System (IIS). During the summer of 2010, HCPS provided professional
development for all HCPS teachers on the use of the Performance Matters data management
system as an instructional tool. The RTTT Project Manager built on this foundation and worked
with MSDE and HCPS leadership to identify the most appropriate school-based teams to
participate in the MSDE Educator Effectiveness Academy and other pertinent MSDE
professional development.
HCPS will participate in all professional development in order to ensure all teachers are trained
and knowledgeable about the Common Core Standards, and the IIS. This includes ensuring
teacher access to online professional development opportunities, as well as hosting the EEA.
HCPS is in the process of investigating how Science, Technology, Engineering and Mathematics
(STEM) education is provided to students. The Harford County Board of Education, the
Superintendent, industry partners, parents, and school-based leadership agree to increase the
number of HCPS students fully prepared to pursue successful STEM related careers. To that
end, HCPS is in the process of developing a K-12 STEM Education Strategy that infuses the
work accomplished at the State regarding interdisciplinary STEM-based curriculum. HCPS
continues to work to identify specific curricular connections and opportunities and change
current course offerings as needed. As described in Section D, the Model Mathematics and
Science Department Chairpersons will oversee much of this work to ensure the use of STEM
standards and project-based lessons.
33
HCPS requires current students to obtain four mathematics credits as part of their high school
graduation requirements. Furthermore, HCPS agrees to adopt the college and career readiness
assessments, work with MSDE to develop an agreed upon growth model for college and career
readiness and include college and career ready and STEM endorsements on the high school
diploma.
In 2011, HCPS contracted with College Board to increase the strategies currently offered in our
schools regarding college preparedness, including parental outreach, SAT/ACT preparation and
successful student completion of AP exams.
Professional Development
HCPS will participate in all professional development in order to ensure all teachers are trained
and knowledgeable about the Common Core Standards, this includes ensuring teacher access to
online professional development opportunities, as well as hosting the EEA.
Currently, all HCPS curricula include formative and summative assessments that are expected to
be administered by teachers to measure student achievement. District assessments may be
scored by the classroom teacher or scored electronically, as overseen by the Office of
Curriculum, Instruction, and Assessment. Data obtained from assessments are utilized by
classroom teachers to identify learning needs of each student and instruction is subsequently
differentiated to address those needs.
Professional development for administrators and school-based staff has focused on increasing
teacher efficacy and capacity to analyze data and adjust instructional practices to meet the needs
of students. Over the past two years, professional development has focused on understanding
and implementing the Classroom-focused Improvement Process (CFIP), an MSDE sponsored
initiative, in conjunction with Performance Matters. Performance Matters provides the tool,
CFIP provides a process, and curriculum benchmark assessments provide the data for teachers’
and administrators’ use to make decisions regarding instruction.
As the high-quality assessments are provided by MSDE, HCPS will work to ensure teachers use
the formative assessment data as part of the IIS. The availability of high-quality assessments
also provides teachers with the essential tools to address the needs of students with disabilities
and other subgroups of students. Teachers and administrators will continue to refine their
expertise in the area of data analysis for the purpose of data-driven instructional decision
making. Teachers’ ability to effectively use their students’ formative assessment results will be
considered a high priority in determining on-going professional development and instructional
modification.
Projects and tasks accomplished during Year 2 of RTTT:
Identified the principal and three teacher leaders from all 54 schools who participated in
the EEA.
Hosted, assisted, and participated in the 2012 EEA.
Provided follow-up professional development for administrators and teachers unable to
attend the EEA.

34
Facilitated professional development workshops through the College Board for
middle school teachers with regard to Pre-AP Effective Thinking Strategies and
Pre-AP Argumentation and the Writing Process for middle school teachers.
Facilitated professional development to other department chairs in the school
system regarding the teacher appraisal process.
Facilitated professional development using MSDE Universal Design for Learning course
to all administrators.
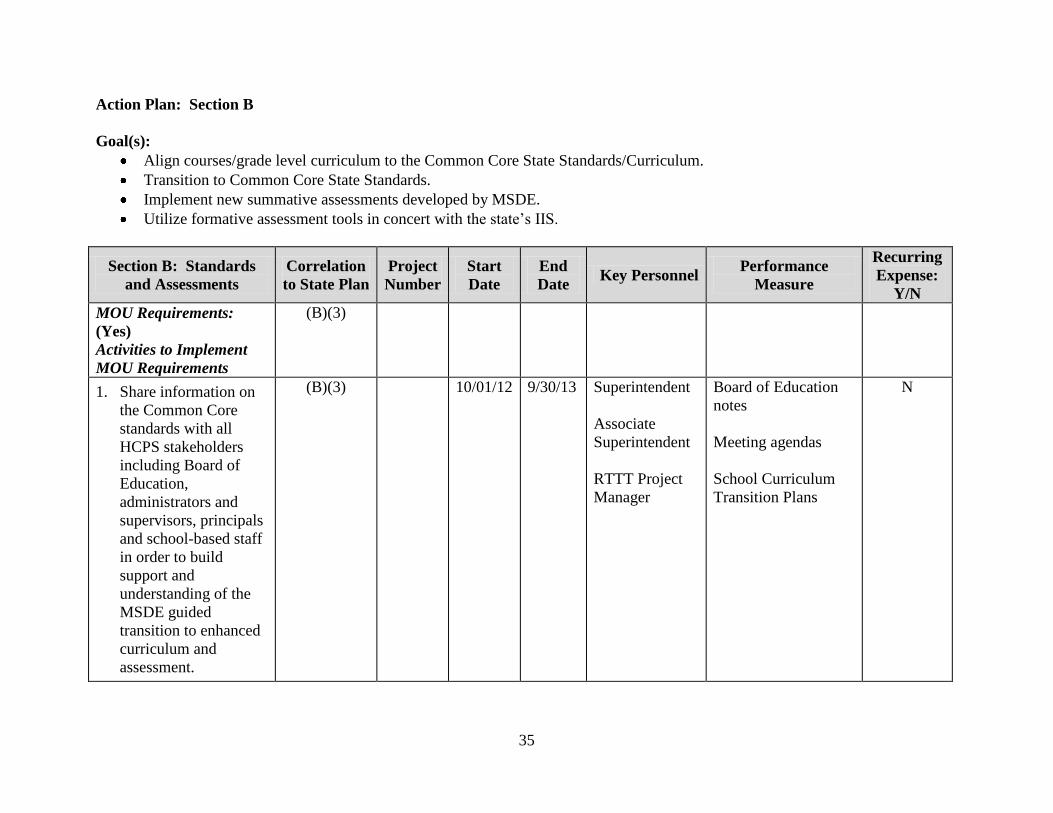
35
Action Plan: Section B
Goal(s):
Align courses/grade level curriculum to the Common Core State Standards/Curriculum.
Transition to Common Core State Standards.
Implement new summative assessments developed by MSDE.
Utilize formative assessment tools in concert with the state’s IIS.
Section B: Standards
and Assessments
Correlation
to State Plan
Project
Number
Start
Date
End
Date Key Personnel
Performance
Measure
Recurring
Expense:
Y/N
MOU Requirements:
(Yes)
Activities to Implement
MOU Requirements
(B)(3)
1. Share information on
the Common Core
standards with all
HCPS stakeholders
including Board of
Education,
administrators and
supervisors, principals
and school-based staff
in order to build
support and
understanding of the
MSDE guided
transition to enhanced
curriculum and
assessment.
(B)(3) 10/01/12 9/30/13 Superintendent
Associate
Superintendent
RTTT Project
Manager
Board of Education
notes
Meeting agendas
School Curriculum
Transition Plans
N
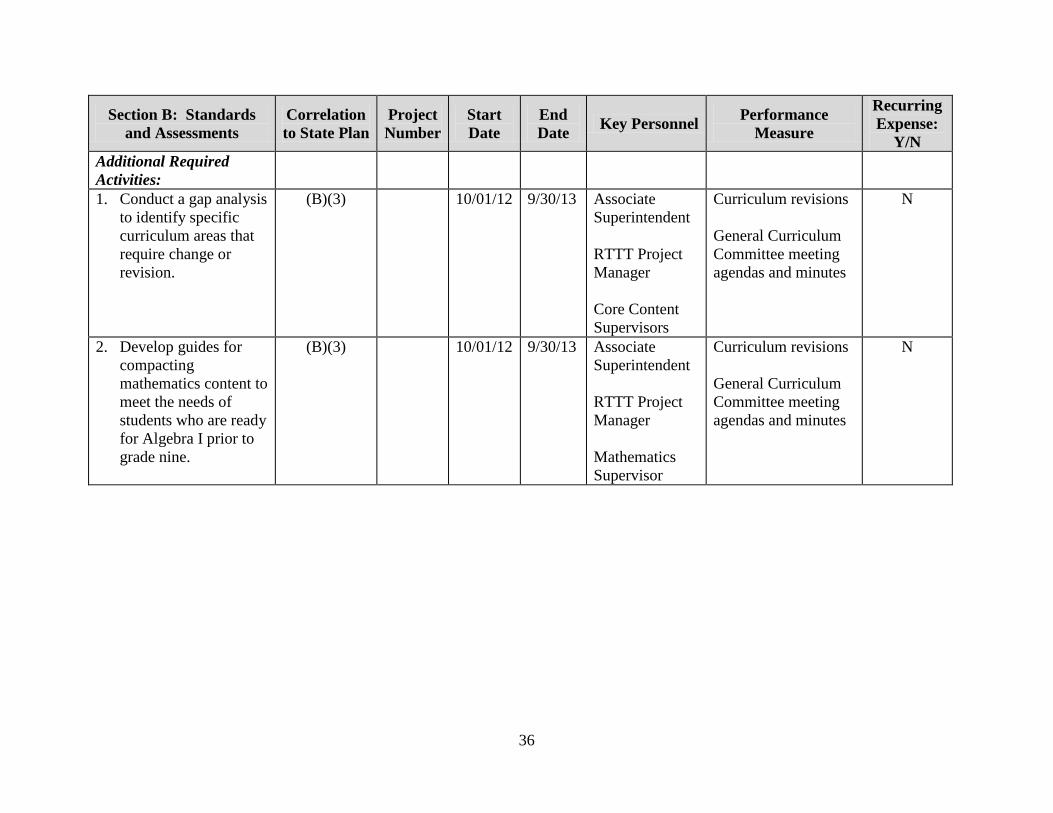
36
Section B: Standards
and Assessments
Correlation
to State Plan
Project
Number
Start
Date
End
Date Key Personnel
Performance
Measure
Recurring
Expense:
Y/N
Additional Required
Activities:
1. Conduct a gap analysis
to identify specific
curriculum areas that
require change or
revision.
(B)(3) 10/01/12 9/30/13 Associate
Superintendent
RTTT Project
Manager
Core Content
Supervisors
Curriculum revisions
General Curriculum
Committee meeting
agendas and minutes
N
2. Develop guides for
compacting
mathematics content to
meet the needs of
students who are ready
for Algebra I prior to
grade nine.
(B)(3) 10/01/12 9/30/13 Associate
Superintendent
RTTT Project
Manager
Mathematics
Supervisor
Curriculum revisions
General Curriculum
Committee meeting
agendas and minutes
N
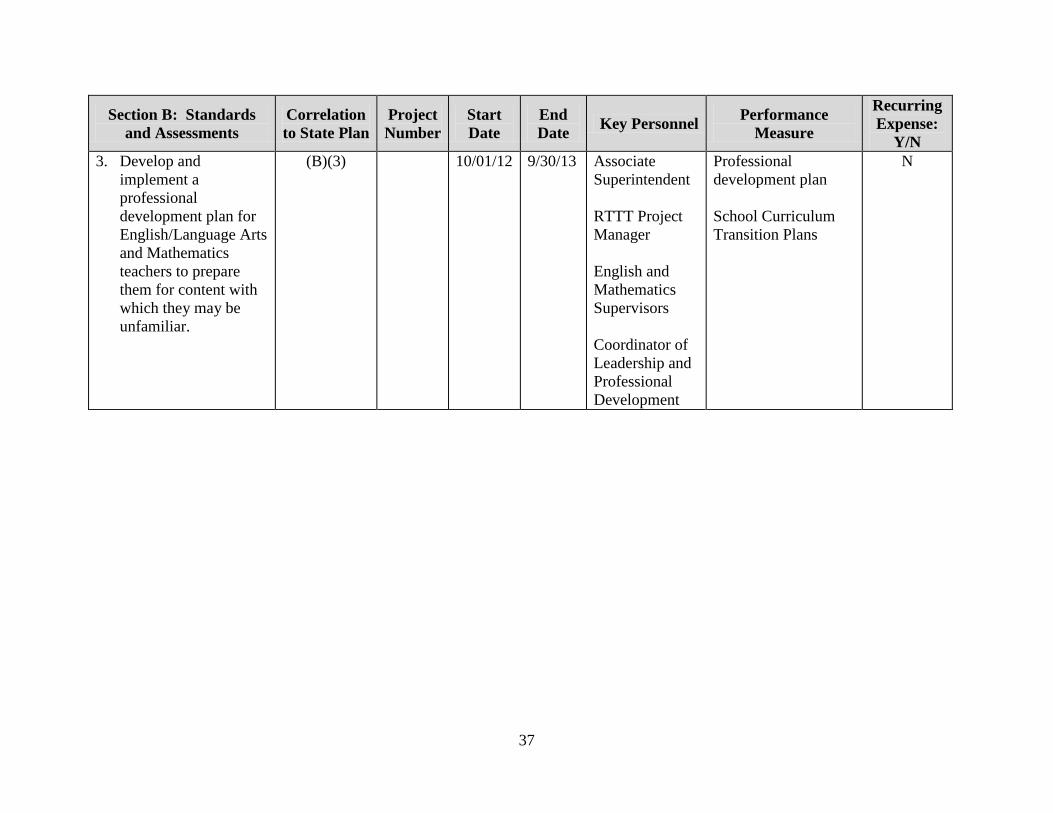
37
Section B: Standards
and Assessments
Correlation
to State Plan
Project
Number
Start
Date
End
Date Key Personnel
Performance
Measure
Recurring
Expense:
Y/N
3. Develop and
implement a
professional
development plan for
English/Language Arts
and Mathematics
teachers to prepare
them for content with
which they may be
unfamiliar.
(B)(3) 10/01/12 9/30/13 Associate
Superintendent
RTTT Project
Manager
English and
Mathematics
Supervisors
Coordinator of
Leadership and
Professional
Development
Professional
development plan
School Curriculum
Transition Plans
N
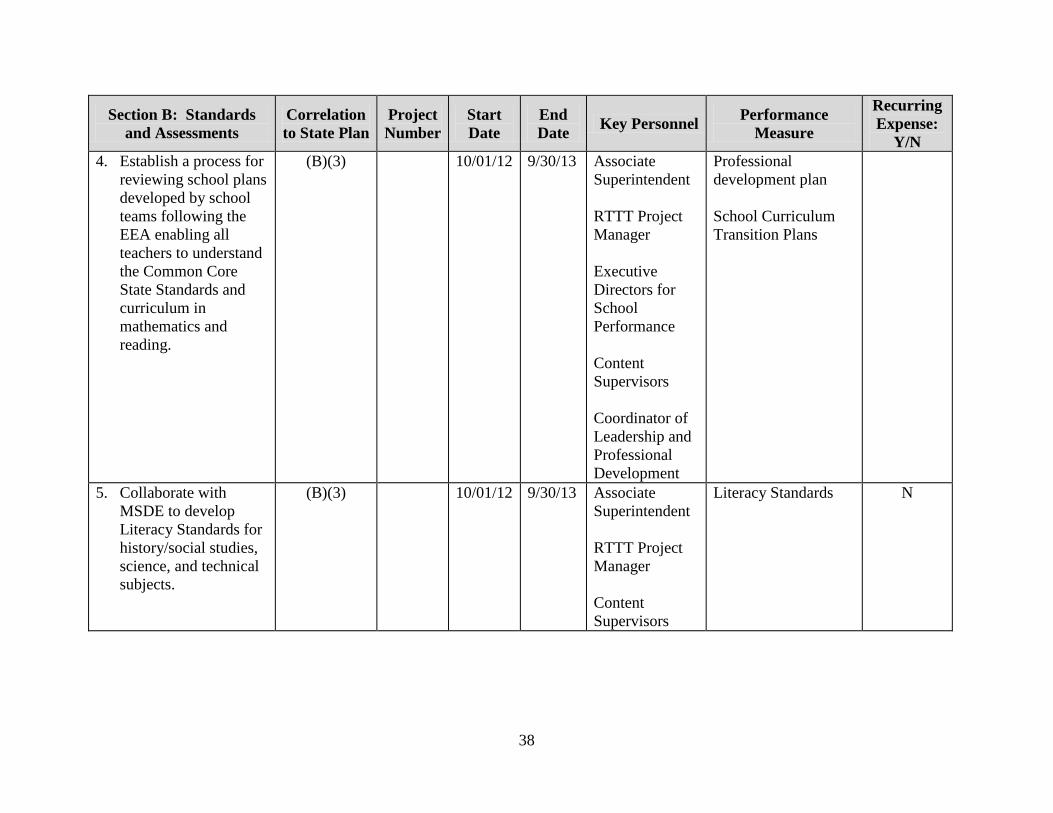
38
Section B: Standards
and Assessments
Correlation
to State Plan
Project
Number
Start
Date
End
Date Key Personnel
Performance
Measure
Recurring
Expense:
Y/N
4. Establish a process for
reviewing school plans
developed by school
teams following the
EEA enabling all
teachers to understand
the Common Core
State Standards and
curriculum in
mathematics and
reading.
(B)(3) 10/01/12 9/30/13 Associate
Superintendent
RTTT Project
Manager
Executive
Directors for
School
Performance
Content
Supervisors
Coordinator of
Leadership and
Professional
Development
Professional
development plan
School Curriculum
Transition Plans
5. Collaborate with
MSDE to develop
Literacy Standards for
history/social studies,
science, and technical
subjects.
(B)(3) 10/01/12 9/30/13 Associate
Superintendent
RTTT Project
Manager
Content
Supervisors
Literacy Standards
N
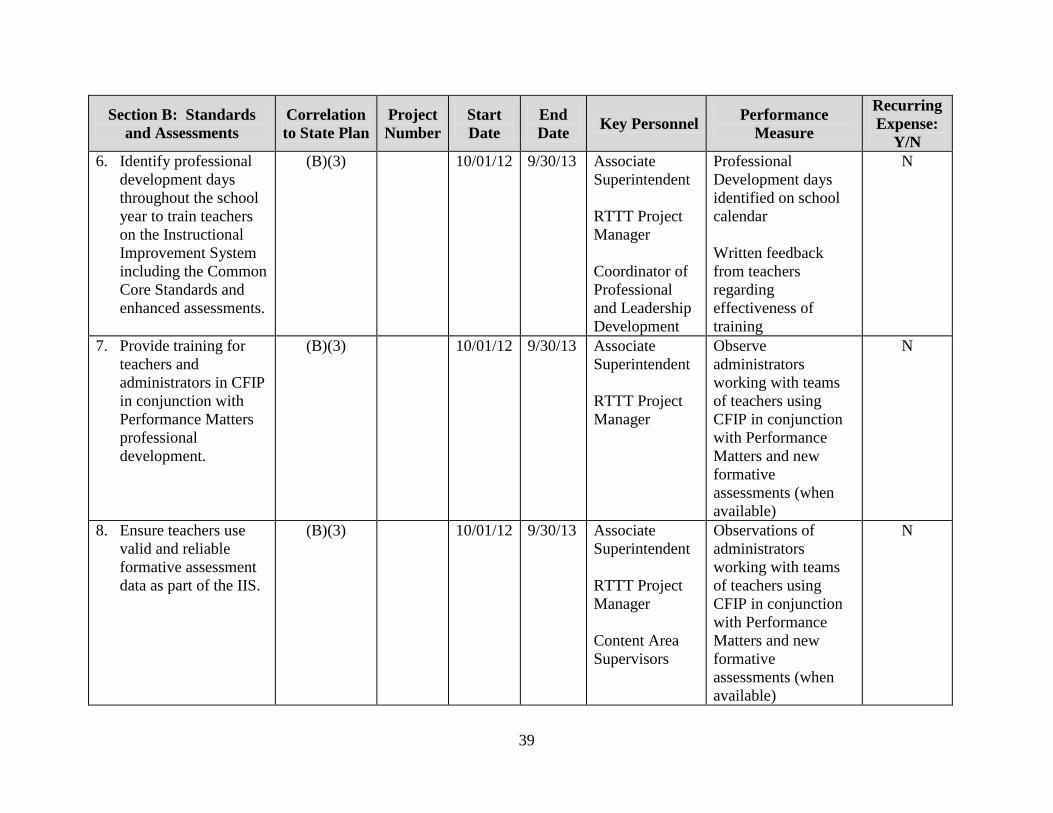
39
Section B: Standards
and Assessments
Correlation
to State Plan
Project
Number
Start
Date
End
Date Key Personnel
Performance
Measure
Recurring
Expense:
Y/N
6. Identify professional
development days
throughout the school
year to train teachers
on the Instructional
Improvement System
including the Common
Core Standards and
enhanced assessments.
(B)(3) 10/01/12 9/30/13 Associate
Superintendent
RTTT Project
Manager
Coordinator of
Professional
and Leadership
Development
Professional
Development days
identified on school
calendar
Written feedback
from teachers
regarding
effectiveness of
training
N
7. Provide training for
teachers and
administrators in CFIP
in conjunction with
Performance Matters
professional
development.
(B)(3) 10/01/12 9/30/13 Associate
Superintendent
RTTT Project
Manager
Observe
administrators
working with teams
of teachers using
CFIP in conjunction
with Performance
Matters and new
formative
assessments (when
available)
N
8. Ensure teachers use
valid and reliable
formative assessment
data as part of the IIS.
(B)(3) 10/01/12 9/30/13 Associate
Superintendent
RTTT Project
Manager
Content Area
Supervisors
Observations of
administrators
working with teams
of teachers using
CFIP in conjunction
with Performance
Matters and new
formative
assessments (when
available)
N
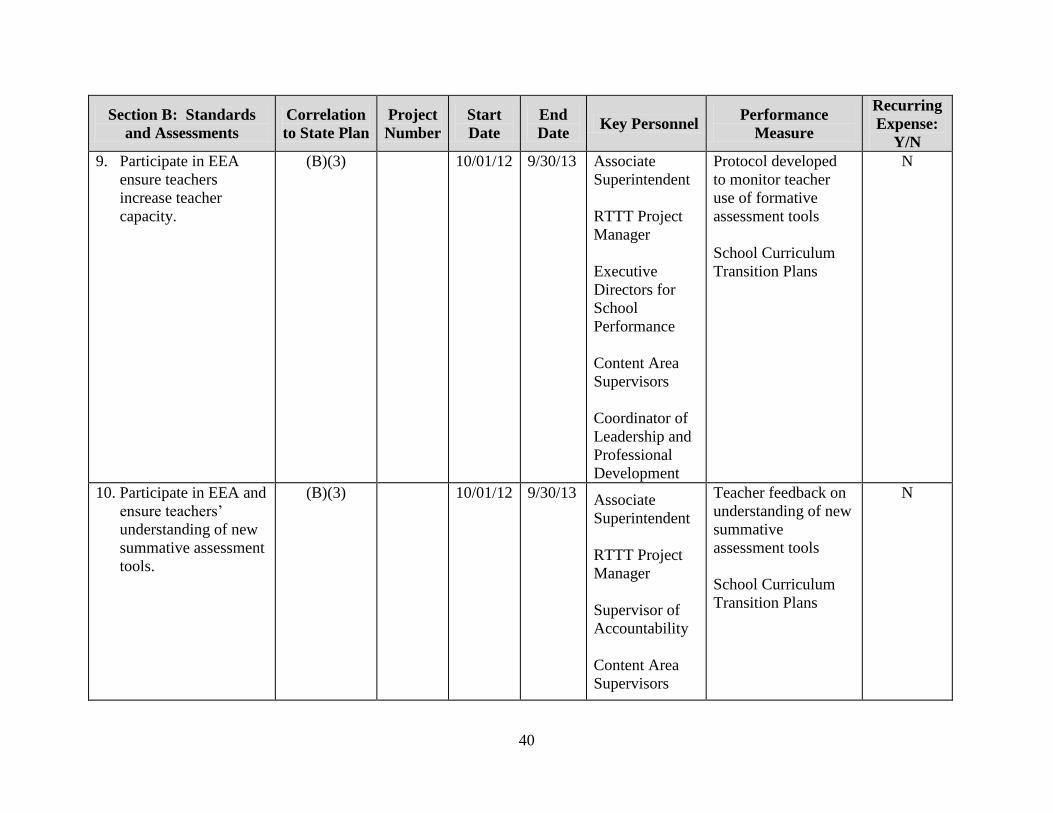
40
Section B: Standards
and Assessments
Correlation
to State Plan
Project
Number
Start
Date
End
Date Key Personnel
Performance
Measure
Recurring
Expense:
Y/N
9. Participate in EEA
ensure teachers
increase teacher
capacity.
(B)(3) 10/01/12 9/30/13 Associate
Superintendent
RTTT Project
Manager
Executive
Directors for
School
Performance
Content Area
Supervisors
Coordinator of
Leadership and
Professional
Development
Protocol developed
to monitor teacher
use of formative
assessment tools
School Curriculum
Transition Plans
N
10. Participate in EEA and
ensure teachers’
understanding of new
summative assessment
tools.
(B)(3) 10/01/12 9/30/13 Associate
Superintendent
RTTT Project
Manager
Supervisor of
Accountability
Content Area
Supervisors
Teacher feedback on
understanding of new
summative
assessment tools
School Curriculum
Transition Plans
N

41
Section B: Standards
and Assessments
Correlation
to State Plan
Project
Number
Start
Date
End
Date Key Personnel
Performance
Measure
Recurring
Expense:
Y/N
Tasks/Activities:
1. Participate in MSDE
work groups to create
grade-specific
expectations aligned to
the Common Core
State Standards.
(B)(3) 10/01/12 9/30/13 Associate
Superintendent
RTTT Project
Manager
Core Content
Supervisors
Common Core State
Standards adopted
Meeting agendas
N
2. Train Model
Department
Chairpersons in the
implementation of the
HCPS Common Core
Standards, school-
based STEM standards
and high quality
assessments.
(B)(3) 2 10/01/12 9/30/13 Associate
Superintendent
Executive
Director of
High School
Performance
Coordinator of
Leadership and
Professional
Development
Teachers’ instruction
reflects use of new
STEM Common Core
Standards and
curriculum
Y
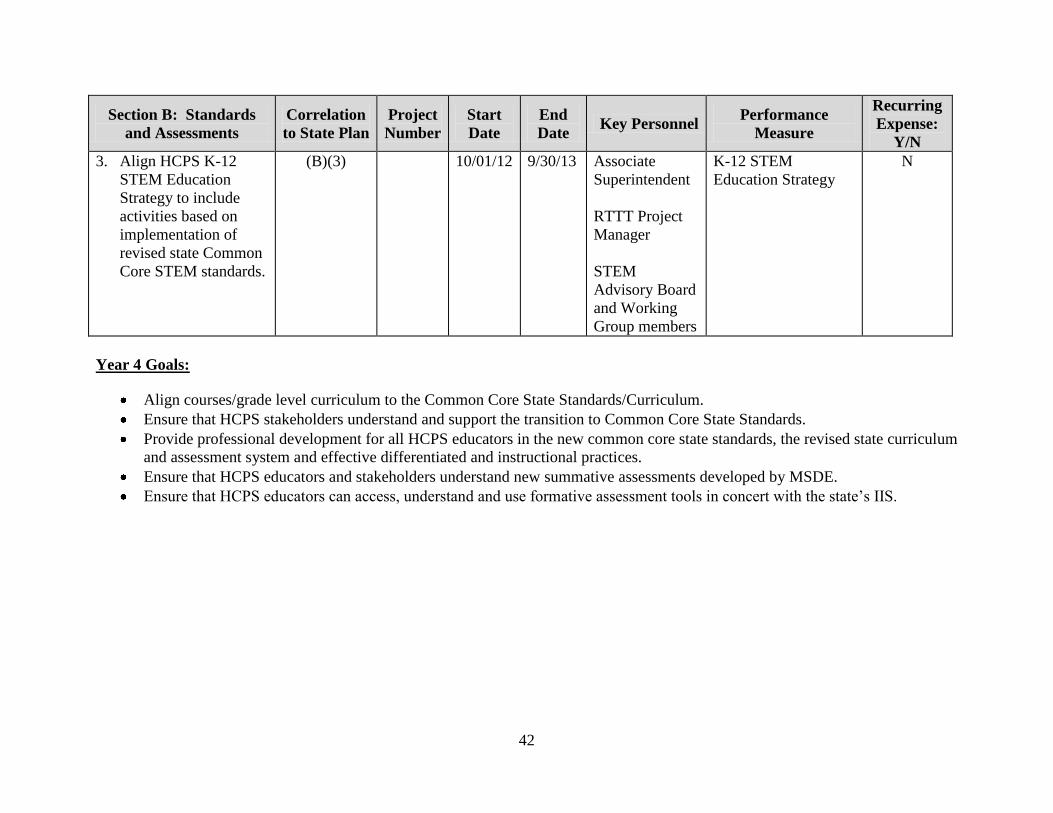
42
Section B: Standards
and Assessments
Correlation
to State Plan
Project
Number
Start
Date
End
Date Key Personnel
Performance
Measure
Recurring
Expense:
Y/N
3. Align HCPS K-12
STEM Education
Strategy to include
activities based on
implementation of
revised state Common
Core STEM standards.
(B)(3) 10/01/12 9/30/13 Associate
Superintendent
RTTT Project
Manager
STEM
Advisory Board
and Working
Group members
K-12 STEM
Education Strategy
N
Year 4 Goals:
Align courses/grade level curriculum to the Common Core State Standards/Curriculum.
Ensure that HCPS stakeholders understand and support the transition to Common Core State Standards.
Provide professional development for all HCPS educators in the new common core state standards, the revised state curriculum
and assessment system and effective differentiated and instructional practices.
Ensure that HCPS educators and stakeholders understand new summative assessments developed by MSDE.
Ensure that HCPS educators can access, understand and use formative assessment tools in concert with the state’s IIS.
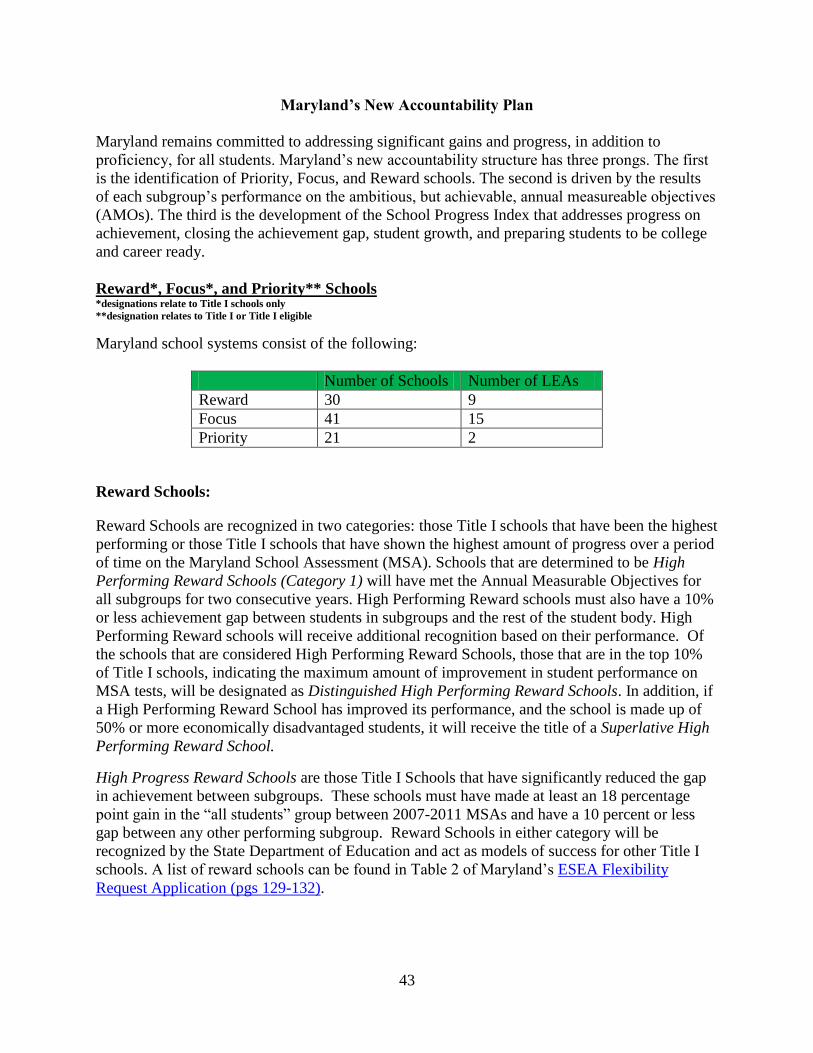
43
Maryland’s New Accountability Plan
Maryland remains committed to addressing significant gains and progress, in addition to
proficiency, for all students. Maryland’s new accountability structure has three prongs. The first
is the identification of Priority, Focus, and Reward schools. The second is driven by the results
of each subgroup’s performance on the ambitious, but achievable, annual measureable objectives
(AMOs). The third is the development of the School Progress Index that addresses progress on
achievement, closing the achievement gap, student growth, and preparing students to be college
and career ready.
Reward*, Focus*, and Priority** Schools *designations relate to Title I schools only **designation relates to Title I or Title I eligible
Maryland school systems consist of the following:
Number of Schools Number of LEAs
Reward 30 9
Focus 41 15
Priority 21 2
Reward Schools:
Reward Schools are recognized in two categories: those Title I schools that have been the highest
performing or those Title I schools that have shown the highest amount of progress over a period
of time on the Maryland School Assessment (MSA). Schools that are determined to be High
Performing Reward Schools (Category 1) will have met the Annual Measurable Objectives for
all subgroups for two consecutive years. High Performing Reward schools must also have a 10%
or less achievement gap between students in subgroups and the rest of the student body. High
Performing Reward schools will receive additional recognition based on their performance. Of
the schools that are considered High Performing Reward Schools, those that are in the top 10%
of Title I schools, indicating the maximum amount of improvement in student performance on
MSA tests, will be designated as Distinguished High Performing Reward Schools. In addition, if
a High Performing Reward School has improved its performance, and the school is made up of
50% or more economically disadvantaged students, it will receive the title of a Superlative High
Performing Reward School.
High Progress Reward Schools are those Title I Schools that have significantly reduced the gap
in achievement between subgroups. These schools must have made at least an 18 percentage
point gain in the “all students” group between 2007-2011 MSAs and have a 10 percent or less
gap between any other performing subgroup. Reward Schools in either category will be
recognized by the State Department of Education and act as models of success for other Title I
schools. A list of reward schools can be found in Table 2 of Maryland’s ESEA Flexibility
Request Application (pgs 129-132).

44
1. Describe the LEA’s strategies to recognize Reward schools (if applicable).
Non-applicable to Harford County Public Schools.
Focus Schools:
Focus Schools are the ten percent of all Title I schools having the largest gap between the “all
students” subgroup and the lowest performing subgroup or a Title I eligible high school with
graduation rates 60% or lower. These schools are unique in that they do not require whole
school reform measures, rather they require school interventions that will focus on one or two
subgroups that are low achieving and contribute to an increased achievement gap between other
subgroups of students in the school. Many of these students in the focus schools have unique
challenges. Focus schools will be expected to collect and analyze data to identify problematic
areas of instruction and learning. This will allow schools and LEAs to address the particular
areas through professional development, parental involvement, instructional teams, and the
development of other specialized strategies that the LEA deems necessary.
Note: Questions related to planning and support for Focus Schools are contained in
Attachment 7 of Part II of the Master Plan and School Improvement Grant reporting
documents.
Priority Schools:
Priority Schools are the five percent of all Title I schools or School Improvement Grant (SIG)
schools that are the lowest achieving on MSA. These schools have not reached adequate
performance standards in reading and mathematics for the “all students” subgroup, not just for
low-performing subgroup populations. Schools or local education agencies have the option to
use one of the USDE approved “turnaround models” or they can develop their own measures to
improve the school. If schools choose to use their own model they must address the seven
turnaround principles including strong leadership, effective teachers and instruction, additional
time for student learning, school instructional programs, a safe school environment, and family
and community engagement.
The Maryland State Department of Education expects that school districts with Priority Schools
will use a certain portion of their Title I funding from the federal government to implement their
choice of turnaround models or turnaround plans for intervention. Maryland has identified 21
Priority Schools. Sixteen of the Priority Schools are currently being served with funds from Title
I, Section 1003(g). The additional five schools will be served using Title I, Part A funds
reserved by the district. All Priority Schools are eligible to receive between $50,000 and $2
million per year for the next three years to help execute their turnaround models or interventions.
Since these Priority Schools will take additional measures of attention and support, it is expected
that these schools will implement multifaceted plans for school reform including recruiting staff,
enriching instructional programs, professional development, and developing a system of
accountability that will help turnaround models and intervention measures. All Priority Schools
will be monitored by the LEA and MSDE.

45
Note: Questions related to planning and support for Priority Schools are contained in
Attachment 7 of Part II of the Master Plan and School Improvement Grant reporting
documents
2012 Annual Measurable Objectives (AMOs)
Annual Measurable Objective targets are unique to specific schools and subgroups; schools are
striving to meet their individual targets to support the achievement of all students while closing
the achievement gap and decreasing the number of non-proficient students. Through
Maryland’s ESEA Flexibility Waiver, each Maryland school will reduce its percent of non-
proficient students for each of its subgroups and overall by half in the upcoming six years
(2017).
LEA Level AMO Analysis for Reading and Mathematics:
1. Based on available trend data, describe the challenges in Reading/Language Arts.
In your response, identify challenges in terms of subgroups.
Elementary
The students receiving special education services continue to be a challenge for meeting
the AMO.
Middle
Overall scores in reading decreased for middle school with the following subgroups
identified: African American, Native Hawaiian, Special Education, and Limited English
Proficient.
2. Describe the changes or adjustments that will be made to ensure progress and
include timelines where appropriate. Include a description of corresponding
resource allocations.
Continue to implement intervention reading programs for identified students grades
K-8.
Monitor and support school improvement initiatives at schools identified as in need of
assistance in reading performance.
Implement extended day and summer reading programs.
Continue regular professional development sessions with the elementary reading
specialists and middle school language arts department chairs.
Train teachers and reading specialists for identified elementary and middle school
reading intervention programs.
Administer TPRI early reading assessment at the kindergarten level.
Implement newly revised quarterly benchmark reading assessments Grades 1-8.
Use professional development days for teachers to share best practices in conference
style format.
Utilize the newly assigned position of middle school language arts model department
chair to support instructional practices.

46
Implement a new on-line reading assessment, Scholastic Reading Inventory (SRI), in
identified schools to gather more reliable and valid data for identifying students in
need and for providing an opportunity for progress monitoring.
Create annotated scoring tools for quarterly benchmarks to provide teachers with
models for consistent scoring and ideas for instruction.
Review additional intervention programs for implementation in order to meet the
needs of students.
Stress access to rigor within the general curriculum utilizing research-based
instructional practices and a focus on their effective implementation including the
CCS- Application to Students with Disabilities recommendations.
Utilize a reflective root - cause analysis to determine instructional factors impacting
overall achievement of students with disabilities participating in the general education
curriculum which may include: accessible curriculum; differentiated instructional
practice; grouping; pacing; and test construct.
3. Based on available trend data, describe the challenges in Mathematics. In your
response, identify challenges in terms of subgroups.
Thirty-two of the 33 elementary schools and all of the nine middle schools met the
mathematics AMO for all subgroups. One elementary school did not meet the AMO
benchmark for all students, white students, and special education students. In order to
achieve the AMO, 12 additional students need to be proficient. Eleven of the twelve
students are special education students. Therefore, the challenge is to provide targeted
assistance, with emphasis on the achievement of special education students, to the
elementary school that is working to achieve their AMO while providing ongoing
assistance to other elementary schools and the middle schools who are working exceed
their AMO.
There is a need to examine instructional factors such as: accessible curriculum;
differentiated instructional practice; grouping; pacing; and test construct which impact
the overall achievement of students with disabilities participating in the general education
curriculum. Exploration of the Common Core Standards recommendations for students
with disabilities is necessary to ensure a hierarchy of instructional supports including
UDL, instructional accommodations and assistive technologies.
4. Describe the changes or adjustments that will be made to ensure progress and
include timelines where appropriate. Include a description of corresponding
resource allocations.
The identified elementary school met with central office mathematics personnel in early
September 2012 to review the approved mathematics intervention programs. This school
began a year-long during-the-day intervention program for grades 3-5 and will target
identified students. The after-school intervention program will begin by November 2012.

47
Science
1. Based on available trend data, describe the challenges in science for grades 5 and 8.
In your response, identify challenges in terms of subgroups.
Grade 5
Students within the Special Education and LEP subgroups perform far below
peers.
Achievement gaps exist in the following subgroups: African American, Special
Education, LEP and FARMS.
Grade 8
Students within the Special Education and LEP subgroups perform far below
peers.
Achievement gaps exist in the following subgroups: African American, Special
Education, American Indian, Native Hawaiian, LEP and FARMS.
2. Describe the changes or adjustments that will be made to ensure sufficient progress.
Include a discussion of corresponding resource allocations, and incorporate
timelines where appropriate.
Professional development will be provided for the purpose of analyzing MSA Science
data.
Time allocations within the elementary school day will be examined.
Middle school benchmark assessment data will be used to guide instructional
improvements at the teacher and central office levels.
Attention will continue to be targeted to ensure alignment between the taught and
tested curriculum at both the elementary and middle school levels.
Development of system-wide resources that ensure access and rigor for all students
by identifying and implementing a hierarchy of strategies and structures considering
the needs of all learners.
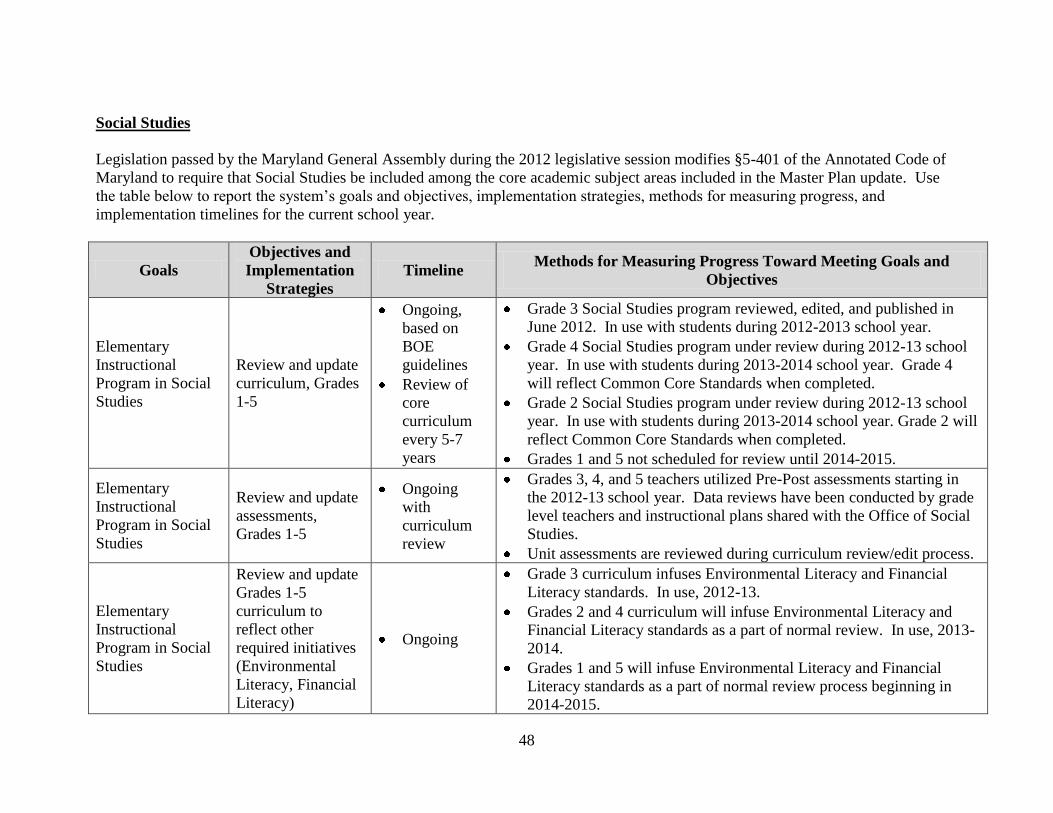
48
Social Studies
Legislation passed by the Maryland General Assembly during the 2012 legislative session modifies §5-401 of the Annotated Code of
Maryland to require that Social Studies be included among the core academic subject areas included in the Master Plan update. Use
the table below to report the system’s goals and objectives, implementation strategies, methods for measuring progress, and
implementation timelines for the current school year.
Goals
Objectives and
Implementation
Strategies
Timeline Methods for Measuring Progress Toward Meeting Goals and
Objectives
Elementary
Instructional
Program in Social
Studies
Review and update
curriculum, Grades
1-5
Ongoing,
based on
BOE
guidelines
Review of
core
curriculum
every 5-7
years
Grade 3 Social Studies program reviewed, edited, and published in
June 2012. In use with students during 2012-2013 school year.
Grade 4 Social Studies program under review during 2012-13 school
year. In use with students during 2013-2014 school year. Grade 4
will reflect Common Core Standards when completed.
Grade 2 Social Studies program under review during 2012-13 school
year. In use with students during 2013-2014 school year. Grade 2 will
reflect Common Core Standards when completed.
Grades 1 and 5 not scheduled for review until 2014-2015.
Elementary
Instructional
Program in Social
Studies
Review and update
assessments,
Grades 1-5
Ongoing
with
curriculum
review
Grades 3, 4, and 5 teachers utilized Pre-Post assessments starting in
the 2012-13 school year. Data reviews have been conducted by grade
level teachers and instructional plans shared with the Office of Social
Studies.
Unit assessments are reviewed during curriculum review/edit process.
Elementary
Instructional
Program in Social
Studies
Review and update
Grades 1-5
curriculum to
reflect other
required initiatives
(Environmental
Literacy, Financial
Literacy)
Ongoing
Grade 3 curriculum infuses Environmental Literacy and Financial
Literacy standards. In use, 2012-13.
Grades 2 and 4 curriculum will infuse Environmental Literacy and
Financial Literacy standards as a part of normal review. In use, 2013-
2014.
Grades 1 and 5 will infuse Environmental Literacy and Financial
Literacy standards as a part of normal review process beginning in
2014-2015.
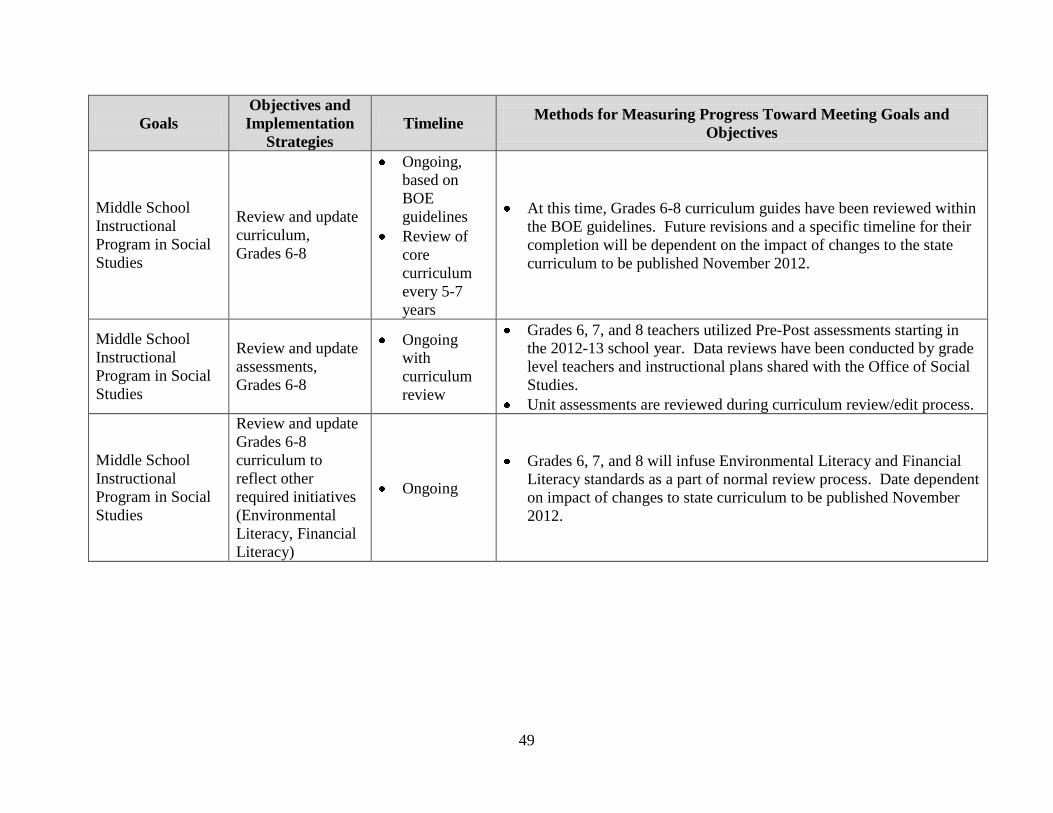
49
Goals
Objectives and
Implementation
Strategies
Timeline Methods for Measuring Progress Toward Meeting Goals and
Objectives
Middle School
Instructional
Program in Social
Studies
Review and update
curriculum,
Grades 6-8
Ongoing,
based on
BOE
guidelines
Review of
core
curriculum
every 5-7
years
At this time, Grades 6-8 curriculum guides have been reviewed within
the BOE guidelines. Future revisions and a specific timeline for their
completion will be dependent on the impact of changes to the state
curriculum to be published November 2012.
Middle School
Instructional
Program in Social
Studies
Review and update
assessments,
Grades 6-8
Ongoing
with
curriculum
review
Grades 6, 7, and 8 teachers utilized Pre-Post assessments starting in
the 2012-13 school year. Data reviews have been conducted by grade
level teachers and instructional plans shared with the Office of Social
Studies.
Unit assessments are reviewed during curriculum review/edit process.
Middle School
Instructional
Program in Social
Studies
Review and update
Grades 6-8
curriculum to
reflect other
required initiatives
(Environmental
Literacy, Financial
Literacy)
Ongoing
Grades 6, 7, and 8 will infuse Environmental Literacy and Financial
Literacy standards as a part of normal review process. Date dependent
on impact of changes to state curriculum to be published November
2012.
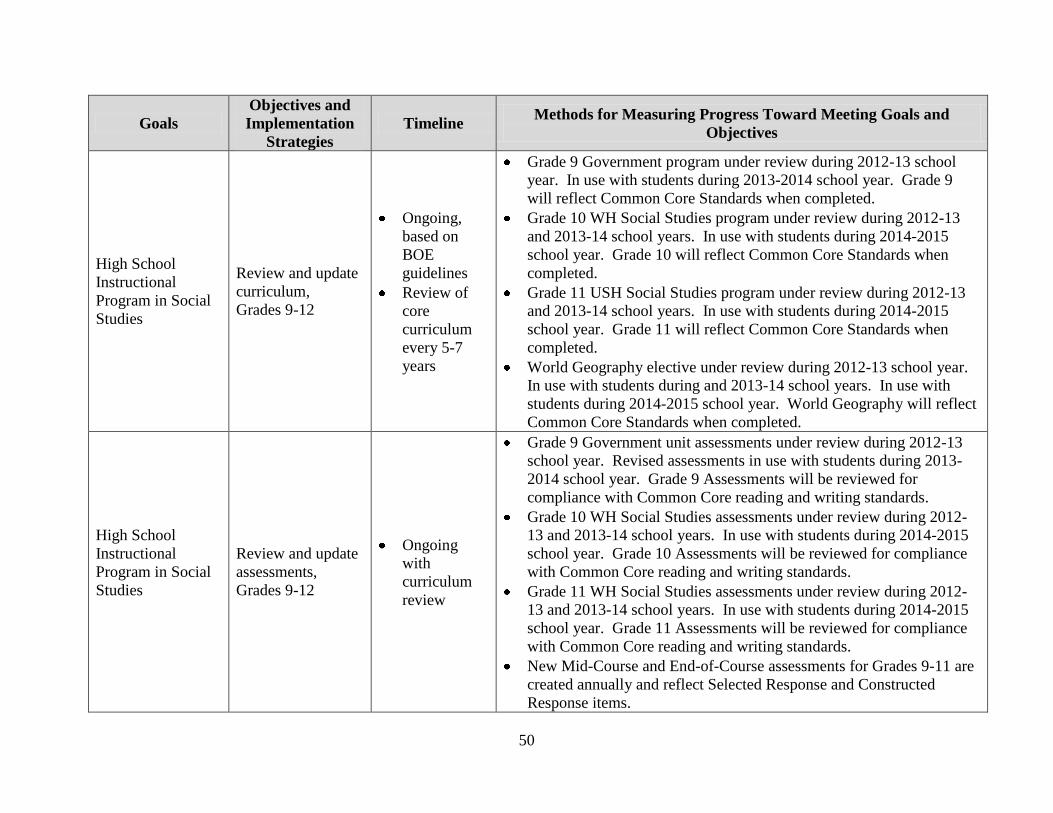
50
Goals
Objectives and
Implementation
Strategies
Timeline Methods for Measuring Progress Toward Meeting Goals and
Objectives
High School
Instructional
Program in Social
Studies
Review and update
curriculum,
Grades 9-12
Ongoing,
based on
BOE
guidelines
Review of
core
curriculum
every 5-7
years
Grade 9 Government program under review during 2012-13 school
year. In use with students during 2013-2014 school year. Grade 9
will reflect Common Core Standards when completed.
Grade 10 WH Social Studies program under review during 2012-13
and 2013-14 school years. In use with students during 2014-2015
school year. Grade 10 will reflect Common Core Standards when
completed.
Grade 11 USH Social Studies program under review during 2012-13
and 2013-14 school years. In use with students during 2014-2015
school year. Grade 11 will reflect Common Core Standards when
completed.
World Geography elective under review during 2012-13 school year.
In use with students during and 2013-14 school years. In use with
students during 2014-2015 school year. World Geography will reflect
Common Core Standards when completed.
High School
Instructional
Program in Social
Studies
Review and update
assessments,
Grades 9-12
Ongoing
with
curriculum
review
Grade 9 Government unit assessments under review during 2012-13
school year. Revised assessments in use with students during 2013-
2014 school year. Grade 9 Assessments will be reviewed for
compliance with Common Core reading and writing standards.
Grade 10 WH Social Studies assessments under review during 2012-
13 and 2013-14 school years. In use with students during 2014-2015
school year. Grade 10 Assessments will be reviewed for compliance
with Common Core reading and writing standards.
Grade 11 WH Social Studies assessments under review during 2012-
13 and 2013-14 school years. In use with students during 2014-2015
school year. Grade 11 Assessments will be reviewed for compliance
with Common Core reading and writing standards.
New Mid-Course and End-of-Course assessments for Grades 9-11 are
created annually and reflect Selected Response and Constructed
Response items.
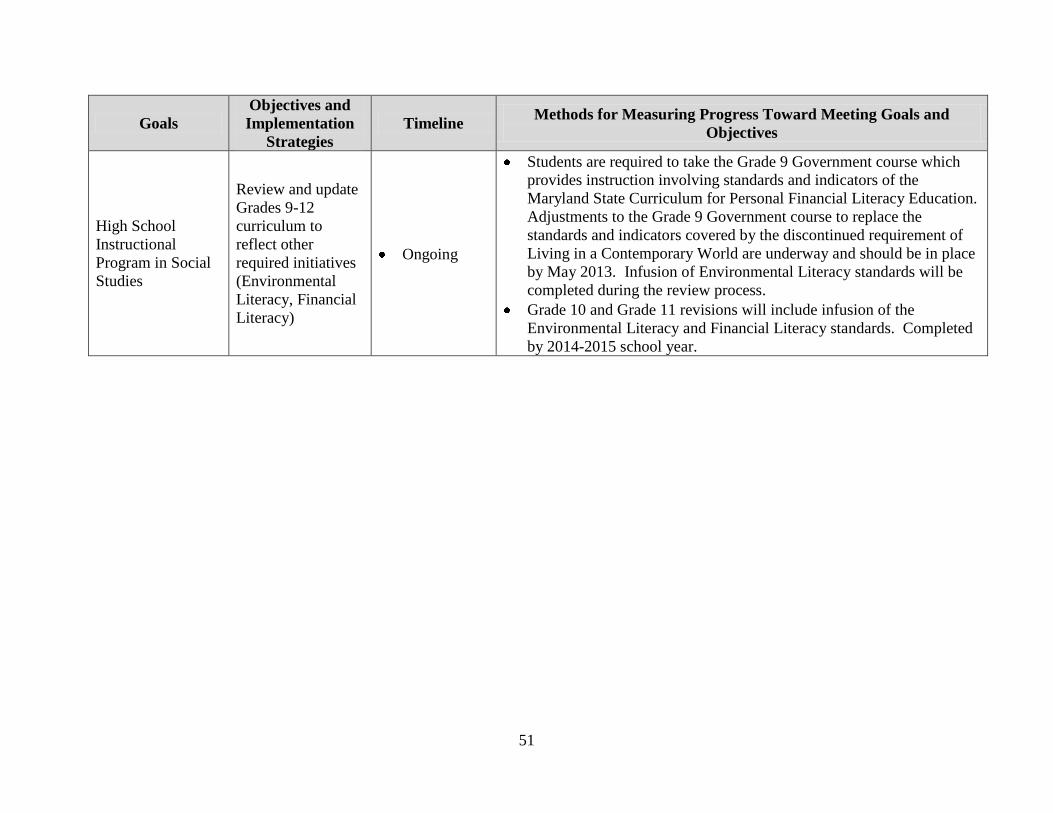
51
Goals
Objectives and
Implementation
Strategies
Timeline Methods for Measuring Progress Toward Meeting Goals and
Objectives
High School
Instructional
Program in Social
Studies
Review and update
Grades 9-12
curriculum to
reflect other
required initiatives
(Environmental
Literacy, Financial
Literacy)
Ongoing
Students are required to take the Grade 9 Government course which
provides instruction involving standards and indicators of the
Maryland State Curriculum for Personal Financial Literacy Education.
Adjustments to the Grade 9 Government course to replace the
standards and indicators covered by the discontinued requirement of
Living in a Contemporary World are underway and should be in place
by May 2013. Infusion of Environmental Literacy standards will be
completed during the review process.
Grade 10 and Grade 11 revisions will include infusion of the
Environmental Literacy and Financial Literacy standards. Completed
by 2014-2015 school year.

52
Maryland High School Assessment (HSA)
English High School Assessment
1. Based on available trend data, describe the challenges in English. In your response,
identify challenges in terms of subgroups.
Achievement gaps exist in the following subgroups: African American, Limited English
Proficient and Special Education.
2. Describe the changes or adjustments that will be made to ensure sufficient progress.
Include a discussion of corresponding resource allocations, and incorporate
timelines where appropriate.
Implement reading intervention courses for students identified in ninth and tenth
grade.
Train teachers on effective practices for meeting the needs of students.
Collaborate with Department of Special Education on effective placement and
pedagogy for students with disabilities continuing to experience difficulties.
System-wide benchmarks were implemented in 2010-11 in grades 6-12. Performance
is being analyzed to direct instruction in all English classes.
Utilize a reflective root - cause analysis to determine instructional factors impacting
overall achievement of students with disabilities participating in the general education
curriculum which may include: accessible curriculum; differentiated instructional
practice; grouping; pacing; and test construct.
Development of system-wide resources that ensure access and rigor for all students
by identifying and implementing a hierarchy of strategies and structures considering
the needs of all learners.
Based on the examination of 2011 High School Assessment (HSA) results for English:
1. Identify any additional challenges that are evident.
The loss of the secondary reading coaches continues to be a challenge. Coaches were
extremely effective in doing on-the-job training of teachers and identifying appropriate
strategies for improving individual student performance.
2. Describe what, if anything, the school system will do differently than in past years to
address the challenges identified. Include a discussion of corresponding resource
allocations.
This year English Department Chairs will receive additional training and will participate
in the appraisal process. This change will allow for content expertise and for curriculum
validation at the school level. Due to release time in their teaching schedule, department

53
chairs will be able to conduct more informal instructional walkthroughs and will be able
to co-plan and model for peers.
Algebra/Data Analysis
1. Based on available trend data, describe the challenges in Algebra/Data Analysis. In
your response, identify challenges in terms of subgroups.
From May 2009 to May 2011, the percent of students passing the May administration
of Algebra/Data Analysis HSA increased from 79% to 83%.
The Special Education and African American subgroups, especially African
American Males continue to score well below the Harford County proficiency
percent.
2. Describe the changes or adjustments that will be made to ensure sufficient progress.
Include a discussion of the corresponding resource allocations, and incorporate
timelines where appropriate.
Identify at-risk students using past MSA scores, prior HSA administration data,
midterm and end-of-year examinations, SMI data, course grades, attendance record,
disciplinary records, and teacher recommendation prior to entering high school.
Implement intervention mathematics programs for all at-risk students at all levels.
Allocate time within the school day to work with students in need of assistance.
Provide appropriate staffing, as well as appropriate professional development.
Provide transportation for students beyond the school day.
Examine instructional factors such as: accessible curriculum; differentiated
instructional practice; grouping; pacing; and test construct which impact the overall
achievement of students with disabilities participating in the general education
curriculum.
Based on the examination of 2011 High School Assessment results for Algebra/Data
Analysis:
1. Identify any additional challenges that are evident.
As the percent of students who pass the Algebra/Data Analysis increases, each student
who does not pass the assessment becomes an individual case. For some schools, all
students reach that goal by Grade 10, while other schools have larger cohorts of students
requiring special attention. Balancing resources and supporting individual student
circumstances has become a challenge.

54
2. Describe what, if anything, the school system will do differently than in past years to
address the challenges identified. Include a discussion of corresponding resource
allocations.
During the 2012-13 School Year, all middle school mathematics students will have the
opportunity to engage in an extended unit on Ratio and Proportionality. This unit is
designed to build conceptual understanding of the underpinnings of many concepts
assessed on the Algebra/Data Analysis High School Assessment. HCPS systemically
purchased materials for this unit and provided professional development for each middle
school teacher.
For students already in high school, the following strategies will continue to be
implemented:
Adjust and monitor the criteria for students to enroll in Ramp Up to Algebra so more
students have the opportunity for intervention in high school.
Encourage more students to enroll in summer school and make that offer earlier in the
school year, so students and parents can better plan their summer.
Carefully monitor which students are using the Bridge Plan as an alternative to
earning a passing score on the assessment.
Biology
1. Based on available trend data, describe the challenges in Biology. In your
response, identify challenges in terms of subgroups.
An achievement gap exists with the Special Education, FARMS, and LEP subgroups.
The need to further identify differentiated instructional strategies supporting the
variety of needs presented by learners within the African American and Special
Education subgroups.
Identifying additional professional development time in order to enhance the capacity
of teachers to effectively address student needs.
2. Describe what, if anything, the school system will do differently than in past
years to address the challenges identified. Include a discussion of corresponding
resource allocations.
Gather information on how current assessment data is used and promote strategies
which support teachers.
Visit select schools to gather and analyze additional information on best practices.

55
Strands
Each school will receive data on whether they met their targets for the School Progress Index in
achievement, closing the achievement gap , student growth (in ES and MS) and college and
career readiness (in HS) . Based on this information, schools will fall into strands for both SEA
and LEA support. There are 5 strands (1-5) with 1 being the highest and 5 the lowest. Schools
are grouped by strands so that school systems are uniquely poised to provide systemic support to
schools that may share similar challenges.
1. How will the system organize internally to support schools in Strands 1-5? (e.g., what is
the system’s plan to review quality School Improvement Plans? What is the system’s
plan to ensure there is adequate support and resources available for schools in all 5
strands? How will system level human resources be redistributed and/or enhanced to
support the success of schools in strands 1-5?). Descriptions of these strands can be
found on pages 94 to 101 in Maryland’s ESEA Flexibility Request.
To support in Strands 1-5, Harford County Public Schools will take a tiered approach to
school support. All HCPS School Improvement Plans are reviewed biannually by a Central
Office team including representatives from School Improvement, Intervention, Professional
Development, Special Education, Reading/Language Arts, Mathematics, Gifted and Talented
Education, and several special areas. The chart below outlines the differentiated support
provided to HCPS schools by strand:
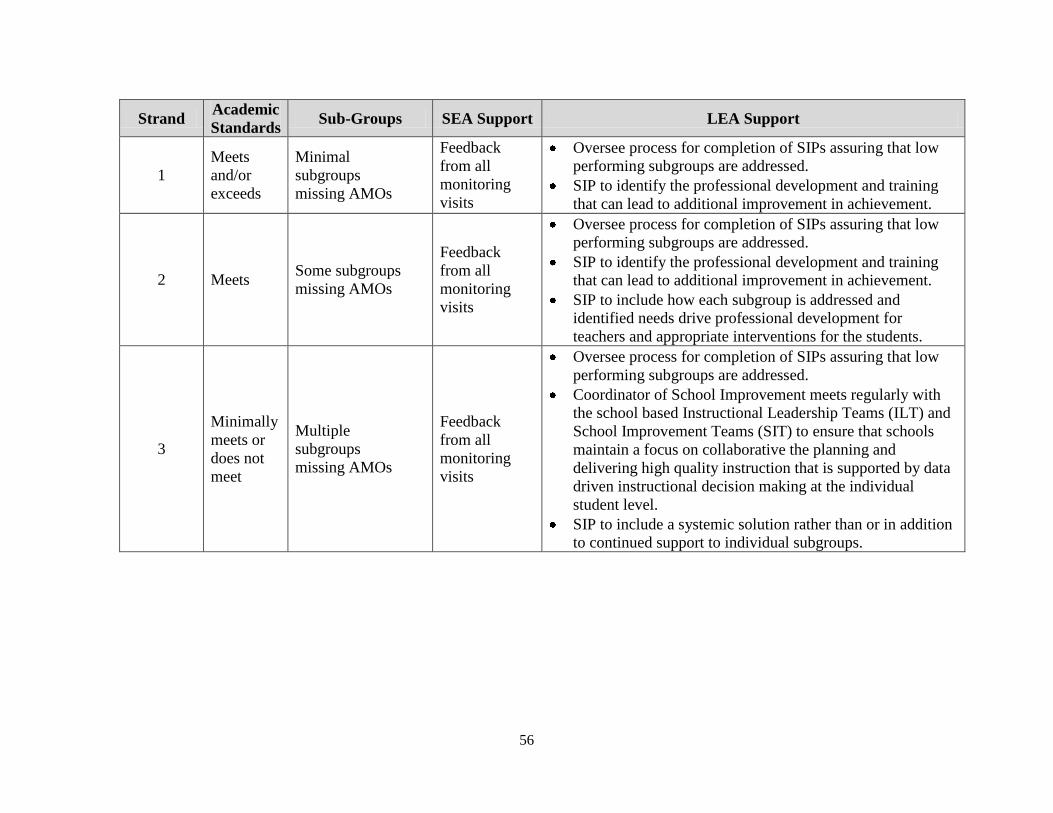
56
Strand Academic
Standards Sub-Groups SEA Support LEA Support
1
Meets
and/or
exceeds
Minimal
subgroups
missing AMOs
Feedback
from all
monitoring
visits
Oversee process for completion of SIPs assuring that low
performing subgroups are addressed.
SIP to identify the professional development and training
that can lead to additional improvement in achievement.
2 Meets Some subgroups
missing AMOs
Feedback
from all
monitoring
visits
Oversee process for completion of SIPs assuring that low
performing subgroups are addressed.
SIP to identify the professional development and training
that can lead to additional improvement in achievement.
SIP to include how each subgroup is addressed and
identified needs drive professional development for
teachers and appropriate interventions for the students.
3
Minimally
meets or
does not
meet
Multiple
subgroups
missing AMOs
Feedback
from all
monitoring
visits
Oversee process for completion of SIPs assuring that low
performing subgroups are addressed.
Coordinator of School Improvement meets regularly with
the school based Instructional Leadership Teams (ILT) and
School Improvement Teams (SIT) to ensure that schools
maintain a focus on collaborative the planning and
delivering high quality instruction that is supported by data
driven instructional decision making at the individual
student level.
SIP to include a systemic solution rather than or in addition
to continued support to individual subgroups.
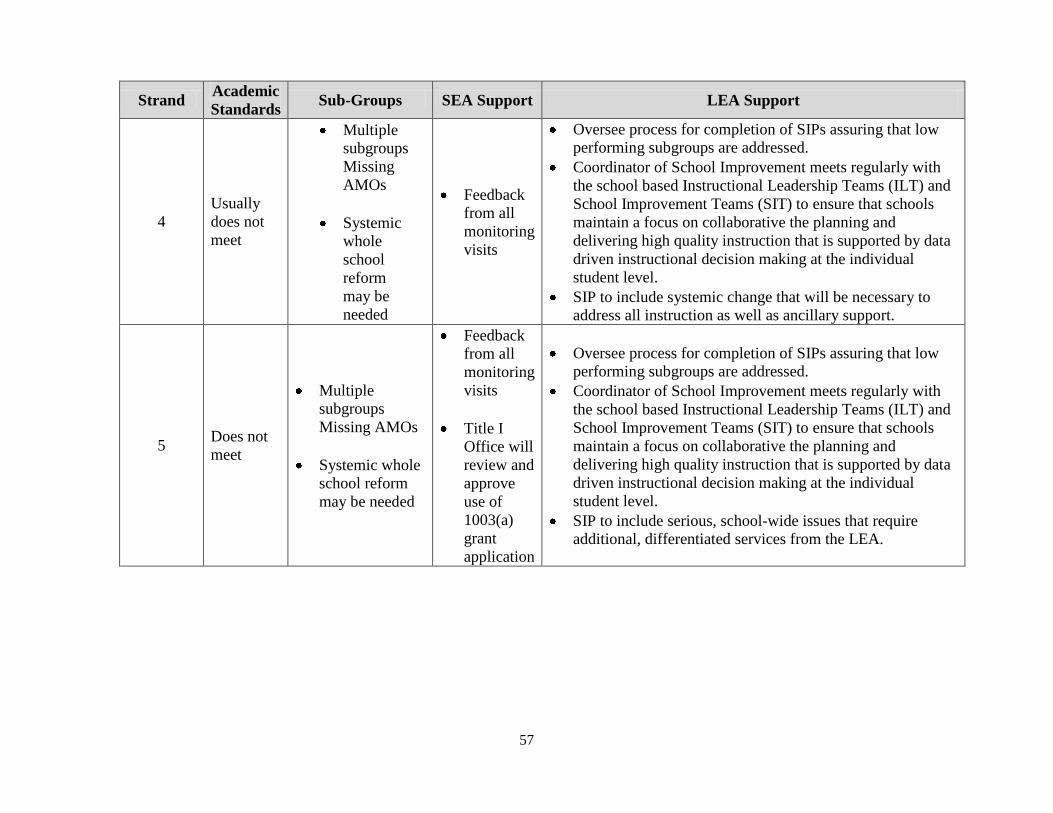
57
Strand Academic
Standards Sub-Groups SEA Support LEA Support
4
Usually
does not
meet
Multiple
subgroups
Missing
AMOs
Systemic
whole
school
reform
may be
needed
Feedback
from all
monitoring
visits
Oversee process for completion of SIPs assuring that low
performing subgroups are addressed.
Coordinator of School Improvement meets regularly with
the school based Instructional Leadership Teams (ILT) and
School Improvement Teams (SIT) to ensure that schools
maintain a focus on collaborative the planning and
delivering high quality instruction that is supported by data
driven instructional decision making at the individual
student level.
SIP to include systemic change that will be necessary to
address all instruction as well as ancillary support.
5 Does not
meet
Multiple
subgroups
Missing AMOs
Systemic whole
school reform
may be needed
Feedback
from all
monitoring
visits
Title I
Office will
review and
approve
use of
1003(a)
grant
application
Oversee process for completion of SIPs assuring that low
performing subgroups are addressed.
Coordinator of School Improvement meets regularly with
the school based Instructional Leadership Teams (ILT) and
School Improvement Teams (SIT) to ensure that schools
maintain a focus on collaborative the planning and
delivering high quality instruction that is supported by data
driven instructional decision making at the individual
student level.
SIP to include serious, school-wide issues that require
additional, differentiated services from the LEA.
58
Addressing Specific Student Groups
Limited English Proficient Students
For the 2012 submission only: In the 2011-2012 school year, LEAs in the state of Maryland
administered a new English language proficiency assessment, ACCESS for ELLs, from February 26 –
March 23, 2012.
In the summer of 2012, a linking study will be conducted of ELL student results on the new ACCESS for
ELLs as compared to results on the LAS Links, our previous English proficiency assessment, for domain
scores (reading, writing, listening, and speaking) and composite scores. The next step includes
analyzing the results of this study with the goal of setting AMAO 1 and AMAO 2 targets for 2012
through the 2015-2016 school year.
For the AMAO 1 calculation of ELL students new to the state of Maryland in the 2011-2012
school year, data point one becomes the first administration of ACCESS for ELLs.
For the AMAO 2 calculation, exit criteria for the 2011-2012 school year is an overall score of
5.0 on the ACCESS for ELLs. These criteria will be revisited by a committee this summer or
early fall and revised if deemed necessary.
As a result of the steps indicated above, LEAs will not have AMAO 1 or AMAO 2 targets available
during the time the 2012-2013 Master Plan is being completed. Therefore, LEAs will submit
information on the performance of limited English proficient students for AMAO 1, AMAO 2, and
AMAO 3 when the targets have been set for the 2012 administration of the ACCESS for ELLs.
LEAs will be notified when the targets are available and respond directly to the Title III Office at
MSDE.
The following information first provides the No Child Left Behind Goal for the performance of English
language learners. This is followed by a description of the annual measurable achievement objectives
(AMAOs) derived from ELL student performance in (1) making progress learning English, (2) attaining
proficiency in English, and (3) meeting the overall AMO target for limited English proficient students.
This is followed by the action required on the part of any LEAs who fail to meet these targets.
No Child Left Behind Goal 2: All limited English proficient students will become proficient in English
and reach high academic standards, at a minimum attaining proficiency or better in reading/language
arts and mathematics.
VIII. No Child Left Behind Indicator 2.1: The percentage of limited English proficient students who
have attained English proficiency by the end of the school year.
IX. No Child Left Behind Indicator 2.2: The percentage of limited English proficient students who
are at or above the proficient level in reading/language arts on the state's assessment, as reported
for performance indicator 1.1.

59
X. No Child Left Behind Indicator 2.3: The percentage of limited English proficient students who
are at or above the proficient level in mathematics on the state's assessment, as reported for
performance indicator 1.2.
This section reports the progress of Limited English Proficient students in developing and attaining
English language proficiency and making Adequate Measurable Objective (AMO) targets. School
systems are asked to analyze their data on the following Annual Measurable Achievement Objectives
(AMAOs):
AMAO 1 is used to demonstrate the percentages of Limited English Proficient students
progressing toward English proficiency. For making AMAO 1 progress, Maryland uses a
composite score obtained from the ACCESS for ELLs assessment. This measure and its target
for 2012 have yet to be defined.
AMAO 2 is used to demonstrate the percentages of Limited English Proficient students attaining
English proficiency by the end of each school year. For calculating AMAO 2, Maryland uses a
composite score obtained from the ACCESS for ELLs assessment: 5.0 (bridging or advanced) or
higher. The AMAO 2 target for school year 2011-2012 has yet to be defined.
AMAO 3 represents Adequate Yearly Progress of LEAs for the Limited English Proficient
student subgroup. The AMAO 3 target for school year 2011-12 has yet to be defined pending
approval of Maryland’s ESEA Flexibility Waiver Request.
The No Child Left Behind regulations require that an improvement plan is in place based on the
conditions outlined below for any local school systems that failed to make progress on the AMAOs.
For any fiscal year. The school system must separately inform a parent or the parents of a child
identified for participation in or participating in a language instruction educational program of
the system’s failure to show progress. The law stipulates that this notification is to take place not
later than 30 days after such failure occurs. The law further requires that the information be
provided in an understandable and uniform format and, to the extent practicable, in a language
that the parent can understand.
For two or three consecutive years. The school system must develop an improvement plan that
will ensure that the system meets such objectives. The plan shall specifically address the factors
that prevented the system from achieving the objectives.
For four consecutive years. The state shall require the local system to modify the curriculum
program and method of instruction or determine whether or not the local school system shall
continue to receive funds related to the system’s failure to meet the objectives, and require the
local system to replace educational personnel relevant to the system’s failure to meet the
objectives.

60
2012 Annual Update to the Bridge to Excellence Master Plan
Addressing Specific Student Groups: Career and Technology Education
The Bridge to Excellence legislation requires that the Master Plan “shall include goals,
objectives, and strategies” for the performance of students enrolled in Career and Technology
Education (CTE) programs.
1. Describe the school system’s progress on the implementation and expansion of
Maryland CTE Programs of Study within Career Clusters as a strategy to prepare
more students who graduate ready for entry into college and careers. Include plans
for industry certification and early college credit.
The Harford County Public School (HCPS) system has taken the ten Maryland Career
Clusters and collapsed them into four: Arts, Media, and Communication; Business,
Finance and Information Technology; Health and Human Services; and Science,
Engineering and Technology. Each Career Cluster has three or four Career Pathways
which provide recommended sequences of courses and suggested electives. CTE
programs are embedded in the Career Pathways. One of the HCPS strategies for
preparing students who graduate ready for entry into college and careers is the
implementation of local graduation requirements that include a fourth mathematics
course and four courses within a Career Pathway.
Some former career completer programs have already been realigned to meet the standards
of Maryland High School CTE Programs of Study, i.e., Academy of Finance, Careers in
Cosmetology, Automotive Technology, Teacher Academy of Maryland, Homeland Security
and Emergency Preparedness, Fire Science: Maryland Fire and Rescue Institute, Biomedical
Sciences, Finance and Accounting, Marketing, Business Administrative Services, Business
Management, Printing Technologies, Food and Beverage Management (ProStart), Career
Research and Development, and PLTW Engineering.
The current Health Occupations program is in the process of being realigned to meet the
Academy of Health Professions standards and the Industrial Electronics program is being
updated to the IT Networking Academy (CISCO-Cyber Security pathway). Future programs
on our Secondary Five-Year Planned Improvement Chart include: Academy of Information
Technology and Communication and Broadcast Technology. A locally developed magnet
program in Natural Resources and Agricultural Sciences was approved to start in 2012-13.
The adoption of these new CTE Programs of Study, which offer students additional industry
certifications and postsecondary credit, is another HCPS strategy for preparing students who
graduate ready for entry into college and careers.
In addition, a line item is designated in the Harford County Public Schools operating budget
to fund all mandatory industry certification exams. All CTE students are now required to
take the industry exam if appropriate and available in a program (some exams are
administered off site and students cannot be mandated to take them).

61
2. What actions are included in the Master Plan to ensure access to CTE programs
and success for every student in CTE Program of Study, including students who are
members of special populations?
The Harford County Public Schools has established the following objectives for its Career
and Technology Education Programs. These support the Board of Education’s Strategic Plan
Goals and are embedded in the county’s Master Plan (as identified in the open bulleted
strategies) to ensure success for all students in CTE programs.
A. Expose students to career awareness and exploration opportunities beginning in
elementary and continuing through secondary school and beyond.
Utilize the career clusters as a means of managing programs of study for grades
9-12 and as a means for implementing the delivery of required courses.
Include Career Development for Instruction in Grades Prekindergarten-Grade
12, as per COMAR 13A.04.10.01.
Provide annual career counseling and postsecondary educational planning
opportunities for students, grades 8-12, using a 6-year planning tool.
B. Support the development of work related and decision-making skills including
learning, thinking, communication, technology and interpersonal.
Develop and/or identify materials for use with special needs students.
Continue to implement strategies for utilizing technology in all curriculums
to support the MSDE Student Technology Literacy Standards for Students
(MTLSS).
Increase challenging academic offerings.
Include Career Development for Instruction in Grades Prekindergarten-
Grade 12, as per COMAR 13A.04.10.01.
Integrate digital content into all instruction, as appropriate, to support
teaching and learning.
Enable all students to demonstrate mastery of technology literacy as
specified in the Maryland Student Technology Literacy Standards, School
Library Media state curriculum, and Technology Education state
curriculum.
Implement policies and procedures to address equivalent accessibility to
technology-based products for students, as defined by Education Article 7-
910 of the Public Schools-Technology for Education Act.
Provide professional development to educators serving students with
disabilities.
C. Blend skills, concepts and information from all disciplines in order for the school
community and the community-at-large to make the connection between classroom
instruction and the work environment.
Update curriculum and ensure alignment with state standards.
Evaluate and analyze student assessment data to improve instruction.
Establish, implement and monitor initiatives to address the STEM plan.
Enhance career and technology education programs.
62
Include Career Development for Instruction in Grades Prekindergarten-
Grade 12, as per COMAR 13A.04.10.01.
D. Provide students with the information, training, tools, and technologies to prepare
them for their future education and career of choice.
Seek state and local funding for the Capital Improvements Program that
includes projects to increase the capacity of facilities to relieve overcrowding,
system deficiencies as well as to address curriculum and instruction program
requirements.
Provide professional development for teachers with regard to new programs
and for new teachers in regards to existing programs.
Update curriculum and ensure alignment with state standards.
Evaluate and analyze student assessment data to improve instruction.
Enhance career and technology education programs.
Monitor and report the number of students participating in non-traditional
CTE programs.
Integrate digital content into all instruction, as appropriate, to support teaching
and learning.
Allow students access to instructional resources that incorporate universal
design.
Enable all students to demonstrate mastery of technology literacy as specified
in the Maryland Student Technology Literacy Standards, School Library
Media state curriculum, and Technology Education State curriculum.
Implement policies and procedures to address equivalent accessibility to
technology-based products for students, as defined by Education Article 7-910
of the Public Schools-Technology for Education Act.
Provide opportunities for instructional personnel to attend and participate in
professional development training, including webinars and conference.
E. Promote partnerships between schools, businesses, communities, postsecondary
educational institutions and families.
Identify, implement, evaluate and refine approved magnet and specialized
programs.
Offer coursework that supports student postsecondary activities.
Provide, through HCPS website, coordinated access to information and
resources through collaboration with and linkages to other portal providers.
Maintain and expand partnerships.
Maintain informed citizen advisory committees.
Expand parent awareness of educational initiatives.
Continue to promote internal collaboration aimed at increasing partnerships to
support student learning.
Enhance teaching and learning by providing opportunities for educators to
utilize linkages between today’s business environment and the classroom.
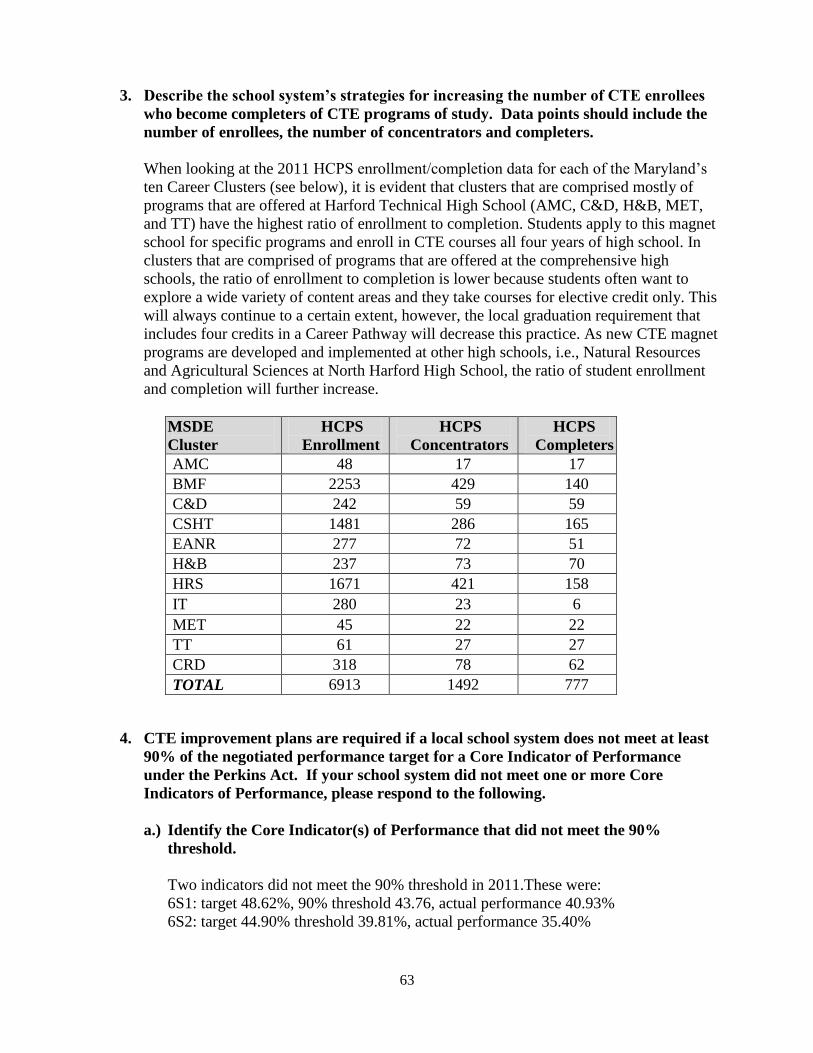
63
3. Describe the school system’s strategies for increasing the number of CTE enrollees
who become completers of CTE programs of study. Data points should include the
number of enrollees, the number of concentrators and completers.
When looking at the 2011 HCPS enrollment/completion data for each of the Maryland’s
ten Career Clusters (see below), it is evident that clusters that are comprised mostly of
programs that are offered at Harford Technical High School (AMC, C&D, H&B, MET,
and TT) have the highest ratio of enrollment to completion. Students apply to this magnet
school for specific programs and enroll in CTE courses all four years of high school. In
clusters that are comprised of programs that are offered at the comprehensive high
schools, the ratio of enrollment to completion is lower because students often want to
explore a wide variety of content areas and they take courses for elective credit only. This
will always continue to a certain extent, however, the local graduation requirement that
includes four credits in a Career Pathway will decrease this practice. As new CTE magnet
programs are developed and implemented at other high schools, i.e., Natural Resources
and Agricultural Sciences at North Harford High School, the ratio of student enrollment
and completion will further increase.
MSDE
Cluster
HCPS
Enrollment
HCPS
Concentrators
HCPS
Completers
AMC 48 17 17
BMF 2253 429 140
C&D 242 59 59
CSHT 1481 286 165
EANR 277 72 51
H&B 237 73 70
HRS 1671 421 158
IT 280 23 6
MET 45 22 22
TT 61 27 27
CRD 318 78 62
TOTAL 6913 1492 777
4. CTE improvement plans are required if a local school system does not meet at least
90% of the negotiated performance target for a Core Indicator of Performance
under the Perkins Act. If your school system did not meet one or more Core
Indicators of Performance, please respond to the following.
a.) Identify the Core Indicator(s) of Performance that did not meet the 90%
threshold.
Two indicators did not meet the 90% threshold in 2011.These were:
6S1: target 48.62%, 90% threshold 43.76, actual performance 40.93%
6S2: target 44.90% threshold 39.81%, actual performance 35.40%
64
b.) Analyze why the indicator was not met, including any disparities or gaps in
performance between any category of students and performance of all students.
Indicator 6S1 Non-traditional Participation:
Although performance on this indicator increased from 28.79% in 2010 to 40.93% in
2011, it was not enough gain to meet the 90% threshold. Every subpopulation group
increased from 2010 to 2011 except LEP (-19.67%) and Female (-3.3%). Students in
19 programs did not meet the 90% threshold for this indicator. All of the following
programs had 0%: Masonry, Carpentry, Electricity, Plumbing, HVAC, Cosmetology,
and CAM. Although we make every effort to market our programs to appeal to all
students, it is evident that there are still programs that are single sex dominated,
particularly the construction trades at Harford Technical High School.
Indicator 6S2 Non-traditional Completion
Counter to state performance, local performance on this indicator increased from
31.04% in 2010 to 35.40% in 2011, but it was not enough to meet the 90% threshold.
Every subpopulation group increased from 2010 to 2011 except Female (-.88%),
Asian (-14.38%), and Hispanic (-12.6%). The introduction of a new category (Multi)
may account for some of the decrease in the other categories. Students in 19 programs
did not meet the 90% threshold for this indicator. All of the following programs had
0%: Masonry, Carpentry, Electricity, Plumbing, HVAC, Cosmetology, Fire Rescue,
CAM and Auto Body. Although we make every effort to market our programs to
appeal to all students, it is evident that there are still programs that are single sex
dominated, particularly the construction trades at Harford Technical High School.
c.) For FY 13, indicate the section/subsection in the CTE Local Plan for Program
Improvement where the improvement plan/strategy is described.
Indicator 6S1 Non-traditional Participation Strategy Worksheet A for the Construction and Development; Health and
Biosciences; Human Resource Services; Manufacturing, Engineering and
Technology; and Transportation Technologies Clusters reference activities related to
Core Indictor 6S1. Planned improvement activities include: marketing tools are
utilized to promote programs to females; marketing tools are utilized to promote
programs to males; facilities, including equipment, materials and supplies are in
place to implement programs to appeal to non-traditional students; MSDE approval
of AHP program proposal including allied health internship pathway to encourage
male enrollment; nontraditional teachers are recruited; and teachers participate in on-
going professional development for instructional strategies which appeal to non-
traditional students.
Strategy Worksheet B-1 references activities related to Core Indicator 6S1. Planned
improvement activities include: an Open House to inform middle school students
and parents of programs is held at HTHS and follow-up conferences are scheduled
for interested students.
65
Indicator 6S2 Non-traditional Completion Strategy Worksheet A for the Construction and Development; Health and
Biosciences; Human Resource Services; Manufacturing, Engineering and
Technology; and Transportation Technologies Clusters reference activities related to
Core Indictor 6S2. Planned improvement activities include: marketing tools are
utilized to promote programs to females; marketing tools are utilized to promote
programs to males; facilities, including equipment, materials and supplies are in
place to implement programs to appeal to non-traditional students; MSDE approval
of AHP program proposal including allied health internship pathway to encourage
male enrollment; nontraditional teachers are recruited; and teachers participate in on-
going professional development for instructional strategies which appeal to non-
traditional students.
Strategy Worksheet B-1 references activities related to Core Indicator 6S2. Planned
improvement activities include: an Open House to inform middle school students
and parents of programs is held at HTHS and follow-up conferences are scheduled
for interested students.
d.) Describe how the Improvement Plan is being monitored to ensure progress
toward meeting the 90% threshold for each Core Indicator of Performance that
was not met.
As referenced in the CTE Local Plan for Program Improvement strategies, every
effort is being made to increase the number of non-traditional students enrolling in
and completing existing CTE programs. In addition, careful consideration is being
given to adding new CTE programs which appeal to both male and female students,
including Biomedical Sciences, Academy of Health Professions, Natural Resources
and Agricultural Sciences, and Pre-Engineering. With an 42% increase on Core
Indicator of Performance 6S1 and a 14% increase on Core Indicator of Performance
6S2 between 2010 and 2011, it is evident that progress is being made. Justification
for revisions to the Local Agreed upon Performance Levels for 2011-12 will be
based on this progress.
e.) If this is the third consecutive year that the same Core Indicator of
Performance did not meet the 90% threshold, describe what new actions and
strategies are being implemented to ensure progress toward meeting the 90%
threshold.
Non-applicable to Harford County Public Schools.

66
Early Learning
A. Based on the examination of 2011-2012 MMSR Kindergarten Assessment Data:
Describe the school system’s plans, including any changes or adjustments that will
be made, for ensuring the progress of students who begin kindergarten either not
ready or approaching readiness as determined by the Maryland Model for School
Readiness Kindergarten Assessment. Please include a discussion of the
corresponding resource allocations and include timelines for use of allocations
where appropriate.
Analyzing the data on Table 8.1 indicates that overall children are entering kindergarten
better prepared from prior care experiences. Children are making gains in all areas of the
Maryland Model for School Readiness Assessment: Language and Literacy,
Mathematical Thinking, Scientific Thinking, Social and Personal, Social Studies, and the
Arts and Physical Development. Harford County Public Schools composite score of 87%,
which is above the state average, indicates the majority of children enter school Fully
Ready for school experiences. Two of the areas, Language and Literacy and Scientific
Thinking, remain in the 70% range indicating more significant curriculum and targeted
work needs to occur in the prior care experience. Since 2009-2010, the data for
Approaching Readiness remains very low, which indicates more work is occurring for
our lowest performing children in prior care experiences. However, while scores are not
decreasing in the Language and Literacy and Scientific Thinking components, much
more work needs to be done in both areas for young children.
Several factors contribute to the data findings for Fully Ready: 1) prekindergarten
teachers continue to receive more specific professional development in assessing young
children in the beginning of the year; 2) more rigorous curriculum has been developed or
adopted with more critical thinking and exposure to a wider range of concepts; 3)
prekindergarten teachers have received professional development in working with low
performing, high-risk populations of children; and 4) data indicates the high-risk group of
children entering school are lower performing at the start than in years past.
Table 8.2, Percentage of Kindergarten Students with Previous Prekindergarten, seems to
validate the work of providing more rigorous curriculum is having an impact. The trend
in Table 8.2 shows a continual increase in the scores. More children seem to be moving
into the Fully Ready category from the Approaching Readiness category. The category
Developing Readiness remains somewhat stagnant; indicating more intense interventions
need to be established to provide support for the students to increase readiness skills. As
the economy has remained in decline and more families are having economic difficulties,
high-risk students are being given less opportunities for improvement. High-quality
childcare centers may not be affordable prior to public prekindergarten, and few three-
year old programs exist. Families are spending their income on life necessities and cannot
afford childcare.

67
Prekindergarten classes only accept children from low-socioeconomic status and the
number of applicants continues to increase. Class sizes are increasing in the Title I school
areas, as well as some of the rural schools. Public school only accepts about one-third of
all the four-year olds in Harford County and children who are at higher-risk may not be
receiving any support in prior care. More issues of social and emotional well-being, and
higher incidences of mental health concerns, are apparent in the classes of
prekindergarten children.
Maintaining lower student-to-teacher ratios would enable students to receive more
intensive work to be more fully ready for kindergarten or to assist with social and
emotional modeling and coaching. An expansion of prekindergarten sites in public
schools would also enable more children to attend high-quality, free programs.
Describe how the school system is working in collaboration with other early
childhood partners/programs (i.e., Preschool Special Education; Head Start;
Childcare Programs) to ensure that children are entering kindergarten “ready to
learn”?
Currently Harford County Public Schools has an MOU with Head Start, which addresses
transporting children to our schools for programs or services. An ongoing relationship
has been established and both agencies continue to foster new ways of working with each
other to benefit the most high-risk students. Children attend public prekindergarten half-
day and Head Start the remainder of the day; this model has worked well in providing
services and in teaching readiness skills. Professional development is continuing to
evolve for both groups of teachers. Data indicates that scores of the student students
coming from Head Start have risen significantly.
The Office of Early Childhood maintains regular Program Committee meetings with
teachers to address the concerns and issues for the purpose of high-quality professional
development to achieve more rigorous curriculum, as well as providing available
resources. Teachers also visit private childcare facilities to provide workshops to staff
and parents about expectations of kindergarten students. A Transition Form was jointly
developed between private childcare providers and public school teachers to ensure that
all partners, and ideas, were represented. The Coordinator hosts and attends regular
meetings with local childcare providers to share initiatives from the school and state that
will impact both groups. Aligning of services and curriculum to address the needs of the
families and students has been increasingly successful.
Two prekindergarten inclusion programs continue to offer a high-quality program for
children with special needs and general education students. The number of children
served in this setting is relatively small, but has a huge impact for all children involved.
The majority of prior care data from these two programs indicates that our high-risk
children in both categories (special needs and general education) scores are performing in
the Fully Ready category. Children in the Approaching Readiness category are
functioning well in kindergarten and with less support needed.

68
Each year, the efforts to reach our most at-risk children seem to be more targeted and
successful, especially since our class sizes continue to increase. The Early Childhood
Office takes every opportunity to do outreach in a more systemic approach with schools,
childcare, and communities. Sharing information at meetings, local and state conferences,
fliers, and newspaper articles continue to be venues with success. Research indicates that
children are more successful in the primary grades when they attend high-quality
childcare programs, which are aligned with the local school system for curriculum and
professional development, as well as provide transition procedures for families.
During the SY 2011-12, 66% of HCPS preschool children with disabilities received IEP
supports and services in a self-contained special education setting (MDOIEP, January
2012). It is important to note that this data factors out students receiving speech-only
services. Similarly, 80% of all IFSP services for children ages 2 to 4 years received
supports and services in the home setting as compared to the 18% of all IFSP services
provided in a community setting (MDOIFSP, January 2012). Effective inclusive services
for HCPS young children with disabilities must provide access to the general education
curriculum as well as participation with typically developing peers in learning activities
that do not exist in special education classes or in home environments. Further support of
need is evidenced by student achievement outcomes included in Maryland's 2011-12
school readiness data with a -27% difference in readiness outcomes for children with
disabilities and their typical kindergarten peers (Ready at Five, 2012). Specific gaps are
represented in performance related to State performance indicators measuring social
relationships, acquisition/use of knowledge and skills, and behavior for preschool
children with disabilities. These skill areas are typically identified as precursors for later
success in school, the workplace, and the community.
B. Based on the examination of the 2011-2012 Public Prekindergarten Enrollment Data
(Table 8.3)
1. Please verify the accuracy of the Prekindergarten enrollment data, as it was
provided to the MSDE, Division of Early Childhood Development Early Learning
Office for school year 2011-2012.
As reported by the office of Early Childhood, data presented in Table 8.3 Prekindergarten
enrollment is correct.
2. Describe the policies and practices put in place to ensure the enrollment of all
eligible children into the Public Prekindergarten Program as described in COMAR
13A.06.02.
Harford County Public Schools Office of Early Childhood has made considerable strides
in tightening policies and practices for internal and external individuals concerning the
enrollment of all eligible children into the prekindergarten program. All children accepted
into the program qualify as high-risk students that meet the criteria for poverty, homeless,
or foster care. Several prekindergarten programs are special education inclusion classes
69
that enable students with disabilities and general education students (who qualify by
application) have been firmly established.
Staff involved with the application process, lead school secretaries, prekindergarten
teachers, and pupil personnel workers have received professional development involving
the prekindergarten application process. Numerous resource materials have been
developed for use at the school level to insure FAQs are addressed, flyers have been
distributed advertising prekindergarten application period and qualifications, and
continued oversight and availability by telephone and email from the Office of Early
Childhood is present. Timelines have been established for all procedures concerning the
application process. The application has been designed for ease of information, materials
needed to verify income or other services, and an overall wealth of information has been
publicly distributed.
3. Describe any policies the school system has put in place to work collaboratively with
other early learning and development programs to provide a prekindergarten
program for all eligible children.
Harford County Public Schools currently has an MOU with the local Head Start enabling
children to attend both programs with transportation provided. The MOU was established
several years ago and it continues to serve the population well.
The Office of Early Childhood works with local childcare facilities to provide
professional development to their staff about prekindergarten curriculum and the
application process. Referrals are made to programs for children and families that do not
qualify for public prekindergarten. A good relationship has been established to enable
childcare programs to receive referrals. The childcare center directors and the
prekindergarten teachers, as well as the Coordinator of Early Childhood, have designed a
transition form for children who will enroll in public school programs.

70
Gifted and Talented Programs
The Annotated Code of Maryland §8-201 defines a gifted and talented student as “an elementary
or secondary student who is identified by professionally qualified individuals as: (1) Having
outstanding talent and performing, or showing the potential for performing, at remarkably high
levels of accomplishment when compared with other students of a similar age, experience, or
environment; (2) Exhibiting high performance capability in intellectual, creative, or artistic
areas; (3) Possessing an unusual leadership capacity; or (4) Excelling in specific academic
fields.”
COMAR 13A.04.07 Gifted and Talented Education establishes the minimum standards for
student identification, programs and services, professional development, and reporting
requirements
COMAR 13A.04.07 §06 specifies that local school systems shall in accordance with Education
Article §5-401 (c) report in their Bridge to Excellence Master Plans their “goals, objectives, and
strategies regarding the performance of gifted and talented students along with timelines for
implementation and methods for measuring progress.”
The school system’s Master Plan Update on the Gifted and Talented Program will report the
system’s progress on these three goals from COMAR 13A.04.07.
Goal 1. Student Identification
Each local school system shall establish a process for identifying gifted and talented students as
they are defined in the Educational Article §8-201 [13A.04.07 §.02 (A)].
Goal 2. Programs and Services
Each local school system shall provide different services beyond those normally provided by the
regular school program in order to develop the gifted and talented student’s potential [13A.04.07
§.03 (A)]l.
Goal 3. Professional Development
Teachers and other personnel assigned to work specifically with students identified as gifted and
talented shall engage in professional development aligned with the competencies specified by
13A 12.03.12 Gifted and Talented Education Specialist.

71
List the 2011-2012 initiatives for gifted and talented students which support the implementation of the COMAR 13A.04.07 Gifted
and Talented Education.
Goals Objectives and
Implementation Strategies Timeline
Methods for
Measuring
Progress
Assessment of
Progress (Met,
Partially Met,
Not Met)
Student
Identification
Reference
COMAR
13A.04.07
§.02, A-F
Adherence to these principles and to the procedures which
follow ensures consistency throughout Harford County Public
Schools. The purpose of these principles and procedures is to
identify the level of service appropriate to the students’ needs.
The identification process is an effective and efficient process
which includes the following four stages:
Screening - a process using multiple criteria which is
designed to yield a pool of candidates which includes all
possible students that are candidates for G&T services.
In-Depth Data Analysis - a process designed to analyze the
data from the screening stage and then to determine which
services are a best fit to meet the student’s needs.
Placement - a process in which students are placed in the
appropriate level of service.
Review - a process undertaken annually or as needed to
reassess the pool of candidates eligible for G&T Services.
The overall responsibility for the identification process lies with
each school’s Gifted & Talented Services Committee.
The formal identification of Level 3 and 4 services begins in the
spring of second grade and continues as an ongoing process
through grade five and continue in grades nine through twelve.
On-going
(see table
below)
Schools report
identified students
to the office of
Accelerated
Learning in
September and in
May.
Met for grades K-5
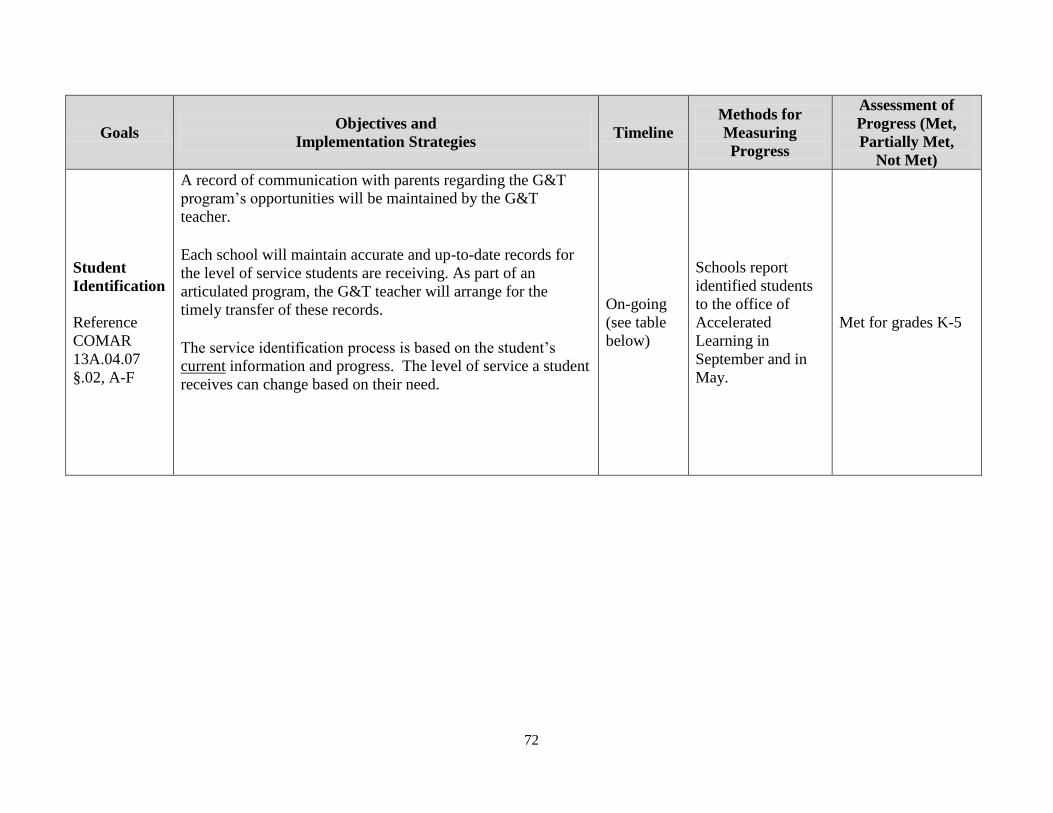
72
Goals Objectives and
Implementation Strategies Timeline
Methods for
Measuring
Progress
Assessment of
Progress (Met,
Partially Met,
Not Met)
Student
Identification
Reference
COMAR
13A.04.07
§.02, A-F
A record of communication with parents regarding the G&T
program’s opportunities will be maintained by the G&T
teacher.
Each school will maintain accurate and up-to-date records for
the level of service students are receiving. As part of an
articulated program, the G&T teacher will arrange for the
timely transfer of these records.
The service identification process is based on the student’s
current information and progress. The level of service a student
receives can change based on their need.
On-going
(see table
below)
Schools report
identified students
to the office of
Accelerated
Learning in
September and in
May.
Met for grades K-5
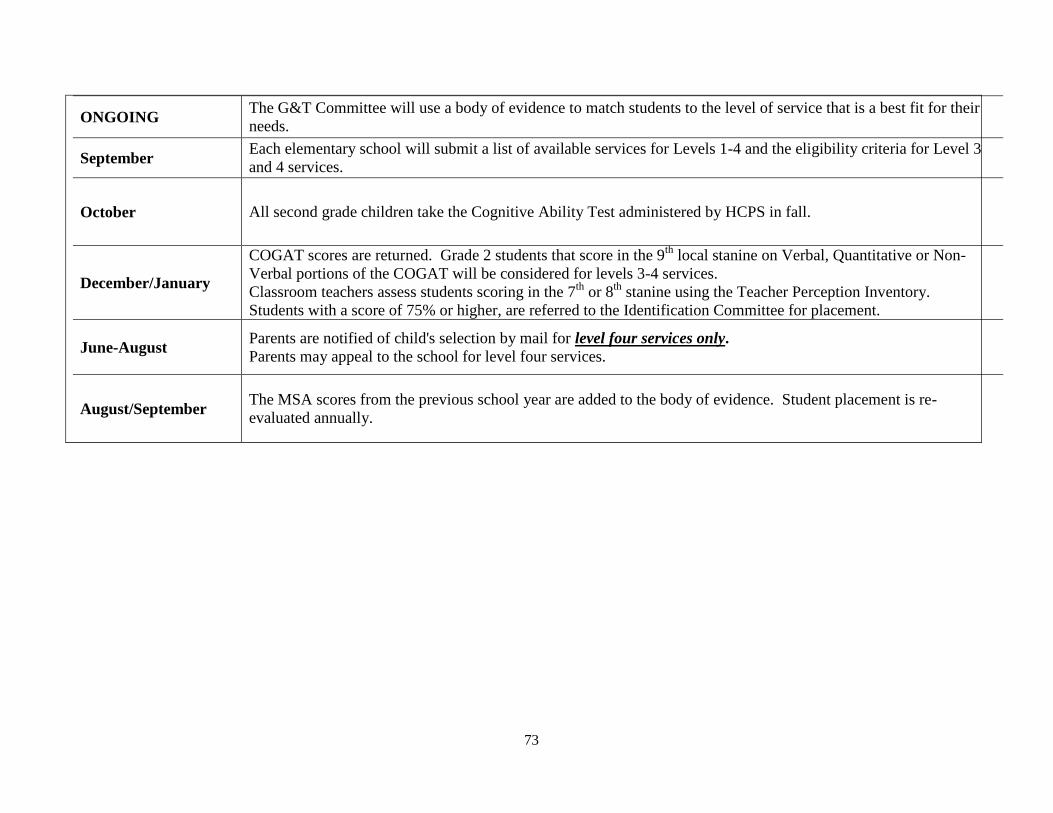
73
ONGOING The G&T Committee will use a body of evidence to match students to the level of service that is a best fit for their
needs.
September Each elementary school will submit a list of available services for Levels 1-4 and the eligibility criteria for Level 3
and 4 services.
October All second grade children take the Cognitive Ability Test administered by HCPS in fall.
December/January
COGAT scores are returned. Grade 2 students that score in the 9th
local stanine on Verbal, Quantitative or Non-
Verbal portions of the COGAT will be considered for levels 3-4 services.
Classroom teachers assess students scoring in the 7th
or 8th
stanine using the Teacher Perception Inventory.
Students with a score of 75% or higher, are referred to the Identification Committee for placement.
June-August Parents are notified of child's selection by mail for level four services only.
Parents may appeal to the school for level four services.
August/September The MSA scores from the previous school year are added to the body of evidence. Student placement is re-
evaluated annually.
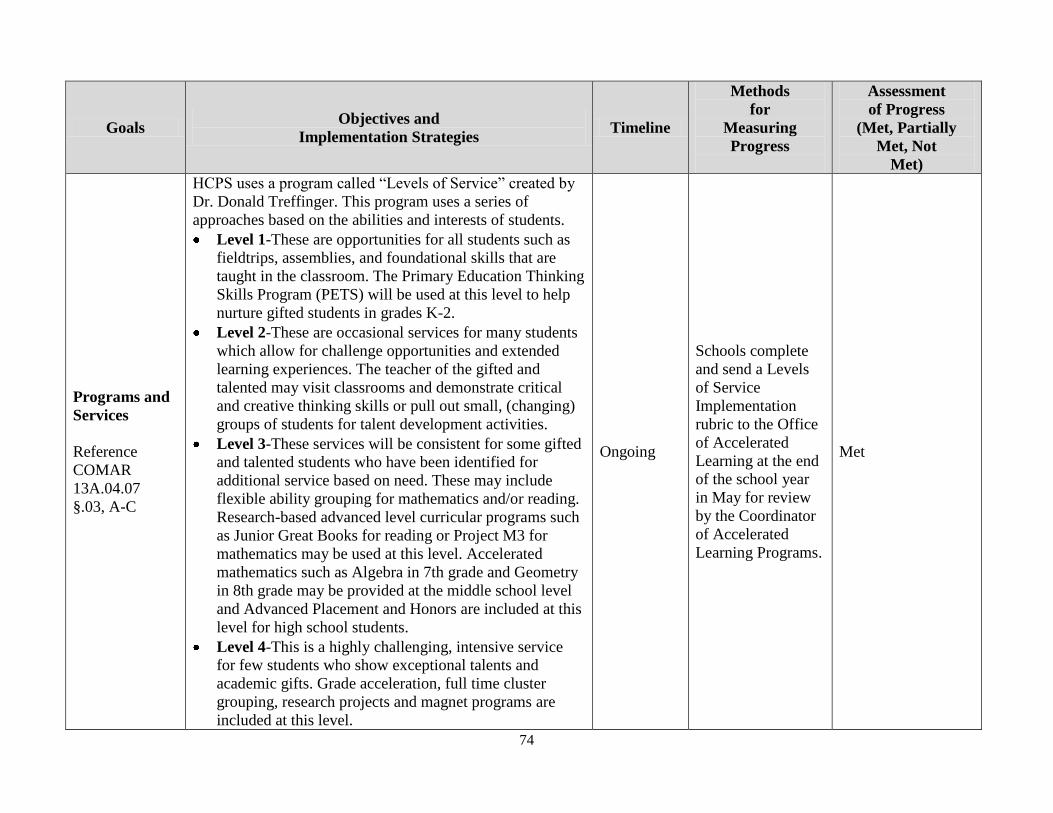
74
Goals Objectives and
Implementation Strategies Timeline
Methods
for
Measuring
Progress
Assessment
of Progress
(Met, Partially
Met, Not
Met)
Programs and
Services
Reference
COMAR
13A.04.07
§.03, A-C
HCPS uses a program called “Levels of Service” created by
Dr. Donald Treffinger. This program uses a series of
approaches based on the abilities and interests of students.
Level 1-These are opportunities for all students such as
fieldtrips, assemblies, and foundational skills that are
taught in the classroom. The Primary Education Thinking
Skills Program (PETS) will be used at this level to help
nurture gifted students in grades K-2.
Level 2-These are occasional services for many students
which allow for challenge opportunities and extended
learning experiences. The teacher of the gifted and
talented may visit classrooms and demonstrate critical
and creative thinking skills or pull out small, (changing)
groups of students for talent development activities.
Level 3-These services will be consistent for some gifted
and talented students who have been identified for
additional service based on need. These may include
flexible ability grouping for mathematics and/or reading.
Research-based advanced level curricular programs such
as Junior Great Books for reading or Project M3 for
mathematics may be used at this level. Accelerated
mathematics such as Algebra in 7th grade and Geometry
in 8th grade may be provided at the middle school level
and Advanced Placement and Honors are included at this
level for high school students.
Level 4-This is a highly challenging, intensive service
for few students who show exceptional talents and
academic gifts. Grade acceleration, full time cluster
grouping, research projects and magnet programs are
included at this level.
Ongoing
Schools complete
and send a Levels
of Service
Implementation
rubric to the Office
of Accelerated
Learning at the end
of the school year
in May for review
by the Coordinator
of Accelerated
Learning Programs.
Met
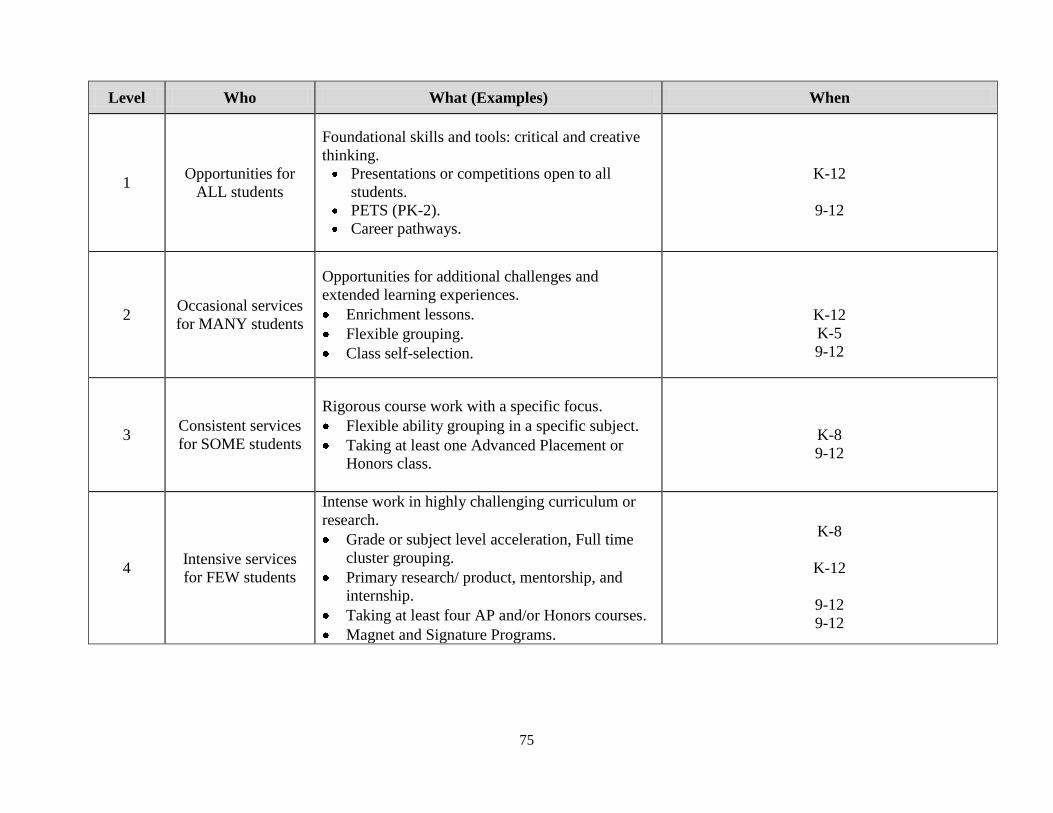
75
Level Who What (Examples) When
1 Opportunities for
ALL students
Foundational skills and tools: critical and creative
thinking.
Presentations or competitions open to all
students.
PETS (PK-2).
Career pathways.
K-12
9-12
2 Occasional services
for MANY students
Opportunities for additional challenges and
extended learning experiences.
Enrichment lessons.
Flexible grouping.
Class self-selection.
K-12
K-5
9-12
3 Consistent services
for SOME students
Rigorous course work with a specific focus.
Flexible ability grouping in a specific subject.
Taking at least one Advanced Placement or
Honors class.
K-8
9-12
4 Intensive services
for FEW students
Intense work in highly challenging curriculum or
research.
Grade or subject level acceleration, Full time
cluster grouping.
Primary research/ product, mentorship, and
internship.
Taking at least four AP and/or Honors courses.
Magnet and Signature Programs.
K-8
K-12
9-12
9-12

76
Goals Objectives and
Implementation Strategies Timeline
Methods
for
Measuring
Progress
Assessment
of Progress
(Met, Partially
Met, Not
Met)
Professional
Development
Reference
COMAR
13A.04.07
§.04, A-B
Elementary Gifted and Talented Resource teachers met four
times during the 2011-2012 school year on county-wide
professional development days. Focus topics included:
Project M3 training, Web 2.0 tools, College and Career
Readiness, and meeting the needs of gifted learners on a full
time basis through the Cluster Grouping Model
August
2011
November
2011
January
2012
May 2012
Surveys and
exit tickets from
GT teachers to
evaluate needs
and progress,
observations,
and
participation
sign in sheets
Met
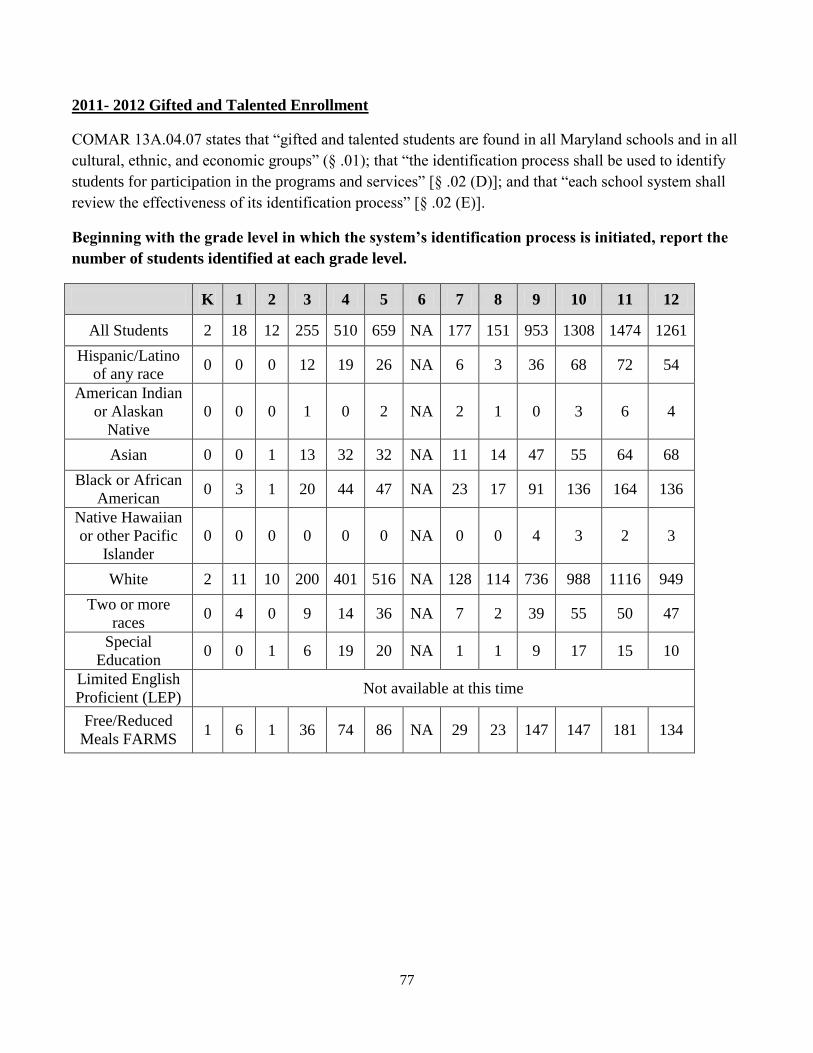
77
2011- 2012 Gifted and Talented Enrollment
COMAR 13A.04.07 states that “gifted and talented students are found in all Maryland schools and in all
cultural, ethnic, and economic groups” (§ .01); that “the identification process shall be used to identify
students for participation in the programs and services” [§ .02 (D)]; and that “each school system shall
review the effectiveness of its identification process” [§ .02 (E)].
Beginning with the grade level in which the system’s identification process is initiated, report the
number of students identified at each grade level.
K 1 2 3 4 5 6 7 8 9 10 11 12
All Students 2 18 12 255 510 659 NA 177 151 953 1308 1474 1261
Hispanic/Latino
of any race 0 0 0 12 19 26 NA 6 3 36 68 72 54
American Indian
or Alaskan
Native
0 0 0 1 0 2 NA 2 1 0 3 6 4
Asian 0 0 1 13 32 32 NA 11 14 47 55 64 68
Black or African
American 0 3 1 20 44 47 NA 23 17 91 136 164 136
Native Hawaiian
or other Pacific
Islander
0 0 0 0 0 0 NA 0 0 4 3 2 3
White 2 11 10 200 401 516 NA 128 114 736 988 1116 949
Two or more
races 0 4 0 9 14 36 NA 7 2 39 55 50 47
Special
Education 0 0 1 6 19 20 NA 1 1 9 17 15 10
Limited English
Proficient (LEP) Not available at this time
Free/Reduced
Meals FARMS 1 6 1 36 74 86 NA 29 23 147 147 181 134
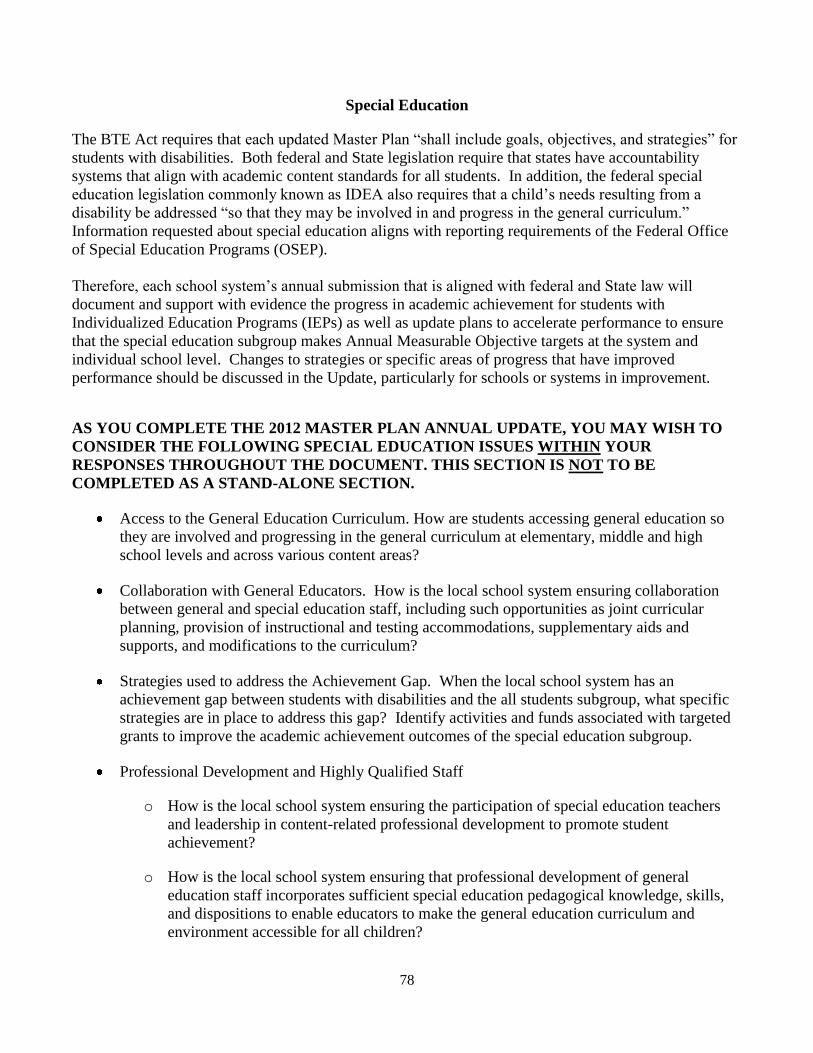
78
Special Education
The BTE Act requires that each updated Master Plan “shall include goals, objectives, and strategies” for
students with disabilities. Both federal and State legislation require that states have accountability
systems that align with academic content standards for all students. In addition, the federal special
education legislation commonly known as IDEA also requires that a child’s needs resulting from a
disability be addressed “so that they may be involved in and progress in the general curriculum.”
Information requested about special education aligns with reporting requirements of the Federal Office
of Special Education Programs (OSEP).
Therefore, each school system’s annual submission that is aligned with federal and State law will
document and support with evidence the progress in academic achievement for students with
Individualized Education Programs (IEPs) as well as update plans to accelerate performance to ensure
that the special education subgroup makes Annual Measurable Objective targets at the system and
individual school level. Changes to strategies or specific areas of progress that have improved
performance should be discussed in the Update, particularly for schools or systems in improvement.
AS YOU COMPLETE THE 2012 MASTER PLAN ANNUAL UPDATE, YOU MAY WISH TO
CONSIDER THE FOLLOWING SPECIAL EDUCATION ISSUES WITHIN YOUR
RESPONSES THROUGHOUT THE DOCUMENT. THIS SECTION IS NOT TO BE
COMPLETED AS A STAND-ALONE SECTION.
Access to the General Education Curriculum. How are students accessing general education so
they are involved and progressing in the general curriculum at elementary, middle and high
school levels and across various content areas?
Collaboration with General Educators. How is the local school system ensuring collaboration
between general and special education staff, including such opportunities as joint curricular
planning, provision of instructional and testing accommodations, supplementary aids and
supports, and modifications to the curriculum?
Strategies used to address the Achievement Gap. When the local school system has an
achievement gap between students with disabilities and the all students subgroup, what specific
strategies are in place to address this gap? Identify activities and funds associated with targeted
grants to improve the academic achievement outcomes of the special education subgroup.
Professional Development and Highly Qualified Staff
o How is the local school system ensuring the participation of special education teachers
and leadership in content-related professional development to promote student
achievement?
o How is the local school system ensuring that professional development of general
education staff incorporates sufficient special education pedagogical knowledge, skills,
and dispositions to enable educators to make the general education curriculum and
environment accessible for all children?

79
MARYLAND LOCAL SCHOOL SYSTEM
COMPLIANCE STATUS REPORT
EDUCATION THAT IS MULTICULTURAL AND ACHIEVEMENT (ETMA)
Local School System: Harford County Public Schools
ETMA Contact Person: Jonathan D. Brown, Ed.D.
Title/Position: Director-Office of Community Engagement, Equity and Cultural Proficiency_
Address: 102 S. Hickory Avenue, Bel Air, MD 21014
Phone: 410-809-6065 Fax: 410-588-5370_
E-Mail: [email protected]
Date completed: August 6, 2012
80
BRIDGE TO EXCELLENCE
CROSS-CUTTING THEME
EDUCATION THAT IS MULTICULTURAL (ETM)
INTRODUCTION
The Compliance Status Report on the following pages presents the criteria for the assessment of
Education that is Multicultural and Achievement (ETMA) implementation in Maryland local public
schools. The assessment categories relate to the level of compliance with the ETM Regulation
(COMAR 13A.04.05) with emphasis on equity, access, support for success, academic achievement, and
diversity in educational opportunities. This report will identify and measure ways to enhance
educators’ cultural proficiency and to implement culturally relevant leadership and teaching strategies.
The ETMA goals for all of Maryland’s diverse students are to eliminate achievement gaps, accelerate
academic achievement, promote personal growth and development, and prepare for college and career
readiness.
ETMA BRIDGE TO EXCELLENCE REPORT EXECUTIVE SUMMARY
After completion of the Maryland Local School System Compliance Status Report: Education That Is
Multicultural (ETMA) form, provide the following summary information.
1. List your Local School System’s major ETMA strengths identified.
2. List your Local School System’s major ETMA areas identified that need improvement.
3. List your three major Local School System ETMA goals for the next school year.
4. Provide comments related to the compliance status report form, noting any
recommendations for suggested revisions.
1. List your Local School System’s major ETMA strengths identified:
Continued implementation of Professional Learning Communities and Classroom-
Focused Improvement Process (CFIP) that examines student performance based upon
subgroups and staff members examining the data, assigning student names and
implementing instructional strategies to improve academic performance for all students.
Use of Performance Matters, a data system that allows staff members to examine
individual academic data to identify student strengths and weaknesses and create an
instructional plan that will increase student performance.
Graduating students must complete four years of mathematics with a math course in each
year beginning at the ninth grade level.
Implementation of Engineering is Elementary curriculum, professional development and
assessment at all elementary schools for grades 1-5.
AVID (Advancement Via Individual Determination) currently at two middle schools
which examines students not currently performing at their potential, providing them with
additional tools such as note taking, language arts and reading skills to be successful, as
well as support for taking advanced placement courses.

81
All teachers newly hired by HCPS must complete, within the first two years of
employment, a three credit course entitled Education That Is Multicultural in the
Classroom of the 21st Century.
Cultural proficiency staff development is provided to new bus drivers, food and nutrition
workers, custodians, clerical and instructional employees.
2. List your LSS major ETMA areas identified that need improvement:
Increase the number of students participating in advanced placement courses.
Increase the number of students taking the advanced placement examination scoring 3 or
better.
Continue to increase the number of juniors and seniors taking the SAT.
Improve the student scores on the SAT in math, reading, and writing.
3. List your three major LSS ETMA goals for the next school year:
Improve academic performance for all students.
Increase number of students participating in advanced placement courses.
Increase number of students taking the advanced placement examination scoring 3 or
better.
Continue implementation of AVID at the middle school level and Engineering is
Elementary for grades 1-5.
4. Provide comments related to the compliance status report form, noting any
recommendations for suggested revisions.
Opportunity to have districts focus on closing the achievement gaps.

82
I. Mission/Vision/Leadership
Beginning Embedding Sustaining
No action has
been taken
Efforts are
being initiated
Initial
results are
being gained
Efforts and
results are
being
enhanced and
supported
Practices are
evident,
policies are in
place, and
results are
increasing
1. The LSS has a written mission or vision
statement that includes a stated
commitment to:
Diversity
Education that is Multicultural
Accelerating and enhancing student
achievement
Eliminating student achievement gaps
X
2. The LSS’s mission statement is integral
to the operation of the schools and is
regularly communicated to all staff,
students, parents, and the community.
X
3. A culturally diverse group (including
the LSS ETM liaison) actively engages
in the development of the Bridge to
Excellence (BTE) or other management
plan.
X
4. The Bridge to Excellence Master Plan
includes specific references (Cross-
cutting Themes) related to Education
that is Multicultural and minority
achievement initiatives.
X

83
II. Curriculum
Beginning Embedding Sustaining
No action has
been taken
Efforts are
being initiated
Initial
results are
being gained
Efforts and
results are
being
enhanced and
supported
Practices are
evident,
policies are in
place, and
results are
increasing
1. Curriculum provides information which
enables students to demonstrate an
understanding of and an appreciation
for cultural groups in the United States
as an integral part of education for a
culturally pluralistic society.
X
2. Practices and programs promote values,
attitudes, and behaviors, which promote
cultural sensitivity:
X
a. Curriculum content includes
information regarding history of
cultural groups and their
contributions in Maryland, the
United States and the world.
X
b. Multiple cultural perspectives of
history are represented.
X
3. As reflected in the State Curriculum, all
schools provide opportunities for
students to demonstrate the following
attitudes and actions:
X
a. valuing one’s own heritage. X
b. valuing the richness of cultural
diversity and commonality.
X
c. valuing the uniqueness of cultures
other than one’s own.
X
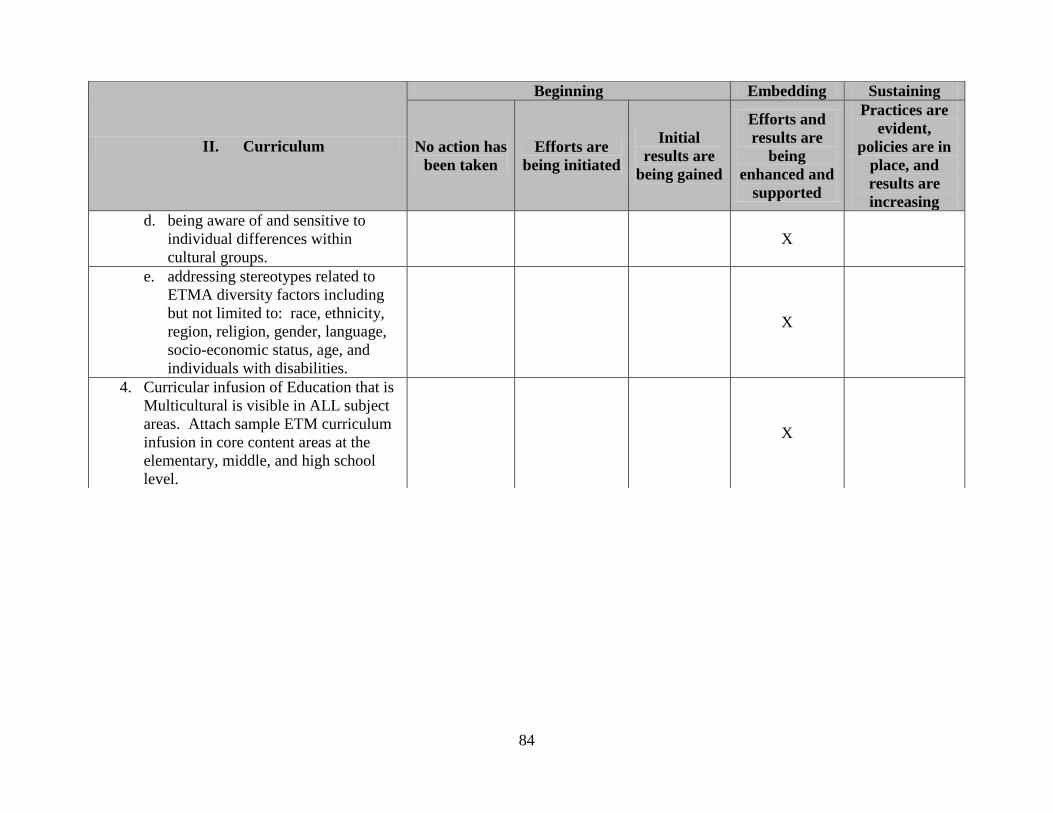
84
II. Curriculum
Beginning Embedding Sustaining
No action has
been taken
Efforts are
being initiated
Initial
results are
being gained
Efforts and
results are
being
enhanced and
supported
Practices are
evident,
policies are in
place, and
results are
increasing
d. being aware of and sensitive to
individual differences within
cultural groups.
X
e. addressing stereotypes related to
ETMA diversity factors including
but not limited to: race, ethnicity,
region, religion, gender, language,
socio-economic status, age, and
individuals with disabilities.
X
4. Curricular infusion of Education that is
Multicultural is visible in ALL subject
areas. Attach sample ETM curriculum
infusion in core content areas at the
elementary, middle, and high school
level.
X
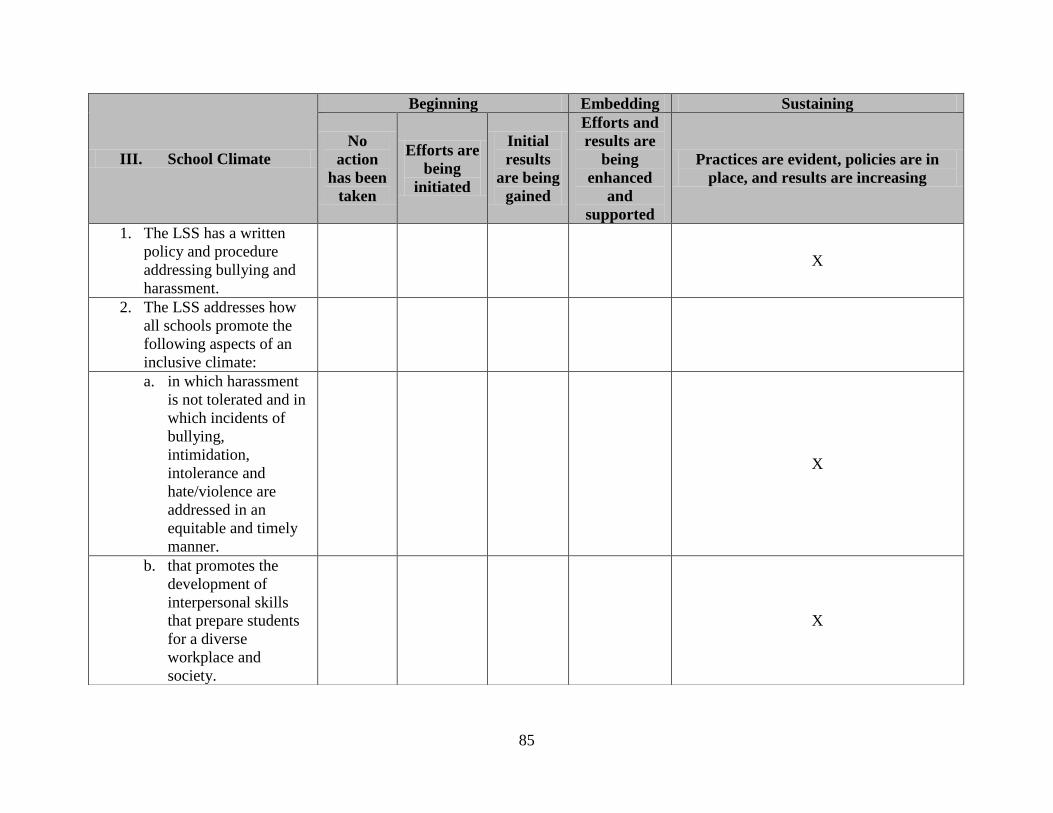
85
III. School Climate
Beginning Embedding Sustaining
No
action
has been
taken
Efforts are
being
initiated
Initial
results
are being
gained
Efforts and
results are
being
enhanced
and
supported
Practices are evident, policies are in
place, and results are increasing
1. The LSS has a written
policy and procedure
addressing bullying and
harassment.
X
2. The LSS addresses how
all schools promote the
following aspects of an
inclusive climate:
a. in which harassment
is not tolerated and in
which incidents of
bullying,
intimidation,
intolerance and
hate/violence are
addressed in an
equitable and timely
manner.
X
b. that promotes the
development of
interpersonal skills
that prepare students
for a diverse
workplace and
society.
X

86
III. School Climate
Beginning Embedding Sustaining
No
action
has been
taken
Efforts are
being
initiated
Initial
results
are being
gained
Efforts and
results are
being
enhanced
and
supported
Practices are evident, policies are in
place, and results are increasing
c. that reflects the
diversity of the LSS
and community
through school
activities such as
School Improvement
Teams (SIT),
PTA/PTO/PTSO,
planning committees,
advisory groups,
etc…
X
d. in which diverse
linguistic patterns are
respected.
X
e. in which students,
instructional staff,
support staff, parents,
community members,
and central office
staff are made to feel
welcomed and
actively involved in
the entire
instructional program
X
f. that reflects
relationships of
mutual respect.
X

87
III. School Climate
Beginning Embedding Sustaining
No
action
has been
taken
Efforts are
being
initiated
Initial
results
are being
gained
Efforts and
results are
being
enhanced
and
supported
Practices are evident, policies are in
place, and results are increasing
g. that includes activities
and strategies to
prevent bullying,
harassment, racism,
sexism, bias,
discrimination, and
prejudice.
X
h. that includes
multicultural
assemblies, programs,
and speakers
X
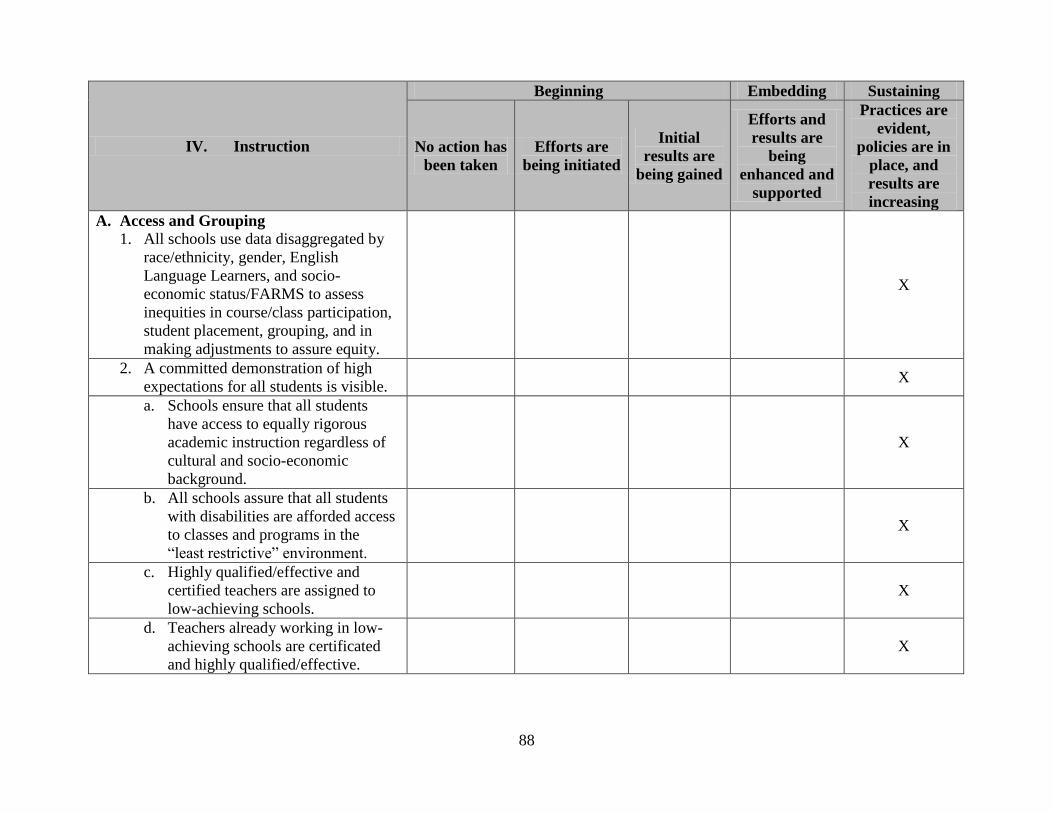
88
IV. Instruction
Beginning Embedding Sustaining
No action has
been taken
Efforts are
being initiated
Initial
results are
being gained
Efforts and
results are
being
enhanced and
supported
Practices are
evident,
policies are in
place, and
results are
increasing
A. Access and Grouping
1. All schools use data disaggregated by
race/ethnicity, gender, English
Language Learners, and socio-
economic status/FARMS to assess
inequities in course/class participation,
student placement, grouping, and in
making adjustments to assure equity.
X
2. A committed demonstration of high
expectations for all students is visible.
X
a. Schools ensure that all students
have access to equally rigorous
academic instruction regardless of
cultural and socio-economic
background.
X
b. All schools assure that all students
with disabilities are afforded access
to classes and programs in the
“least restrictive” environment.
X
c. Highly qualified/effective and
certified teachers are assigned to
low-achieving schools.
X
d. Teachers already working in low-
achieving schools are certificated
and highly qualified/effective.
X
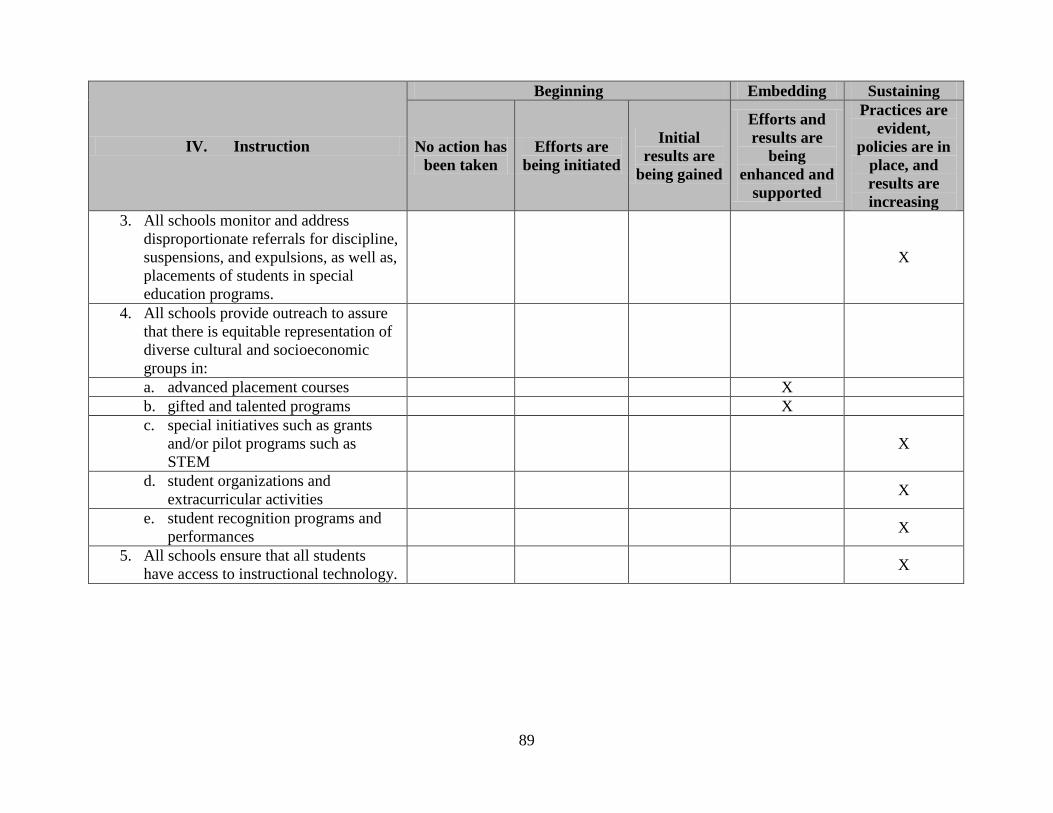
89
IV. Instruction
Beginning Embedding Sustaining
No action has
been taken
Efforts are
being initiated
Initial
results are
being gained
Efforts and
results are
being
enhanced and
supported
Practices are
evident,
policies are in
place, and
results are
increasing
3. All schools monitor and address
disproportionate referrals for discipline,
suspensions, and expulsions, as well as,
placements of students in special
education programs.
X
4. All schools provide outreach to assure
that there is equitable representation of
diverse cultural and socioeconomic
groups in:
a. advanced placement courses X
b. gifted and talented programs X
c. special initiatives such as grants
and/or pilot programs such as
STEM
X
d. student organizations and
extracurricular activities
X
e. student recognition programs and
performances
X
5. All schools ensure that all students
have access to instructional technology.
X
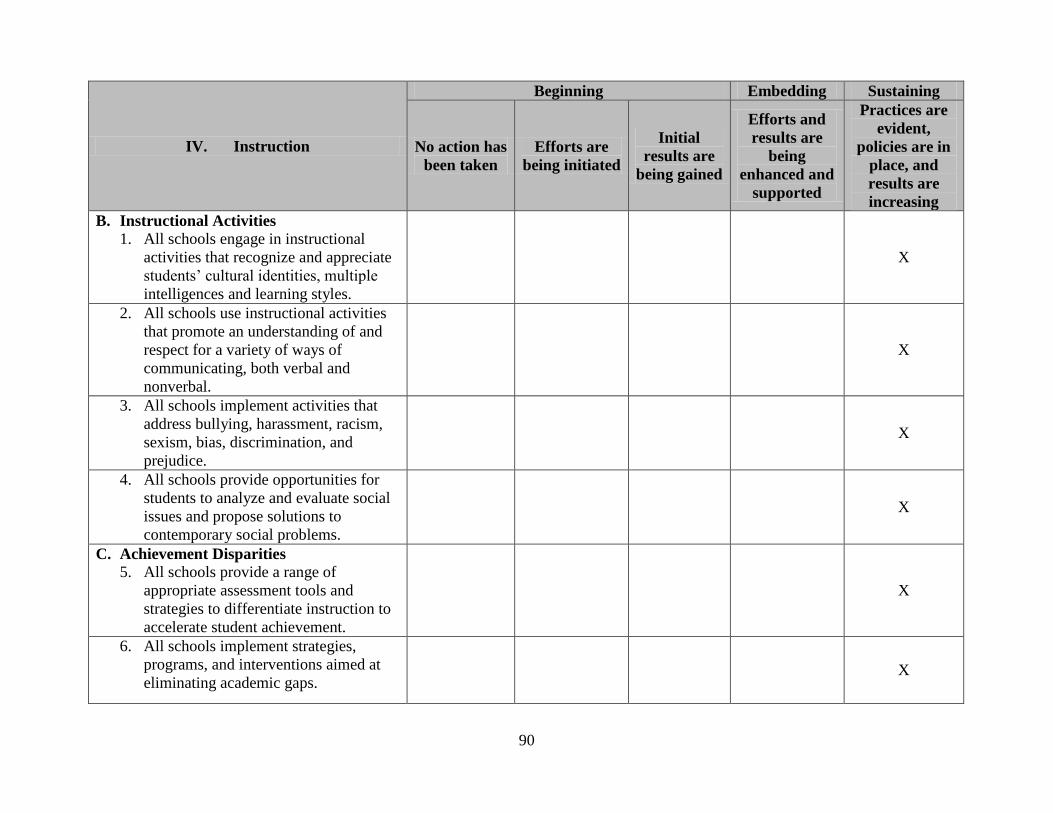
90
IV. Instruction
Beginning Embedding Sustaining
No action has
been taken
Efforts are
being initiated
Initial
results are
being gained
Efforts and
results are
being
enhanced and
supported
Practices are
evident,
policies are in
place, and
results are
increasing
B. Instructional Activities
1. All schools engage in instructional
activities that recognize and appreciate
students’ cultural identities, multiple
intelligences and learning styles.
X
2. All schools use instructional activities
that promote an understanding of and
respect for a variety of ways of
communicating, both verbal and
nonverbal.
X
3. All schools implement activities that
address bullying, harassment, racism,
sexism, bias, discrimination, and
prejudice.
X
4. All schools provide opportunities for
students to analyze and evaluate social
issues and propose solutions to
contemporary social problems.
X
C. Achievement Disparities
5. All schools provide a range of
appropriate assessment tools and
strategies to differentiate instruction to
accelerate student achievement.
X
6. All schools implement strategies,
programs, and interventions aimed at
eliminating academic gaps.
X
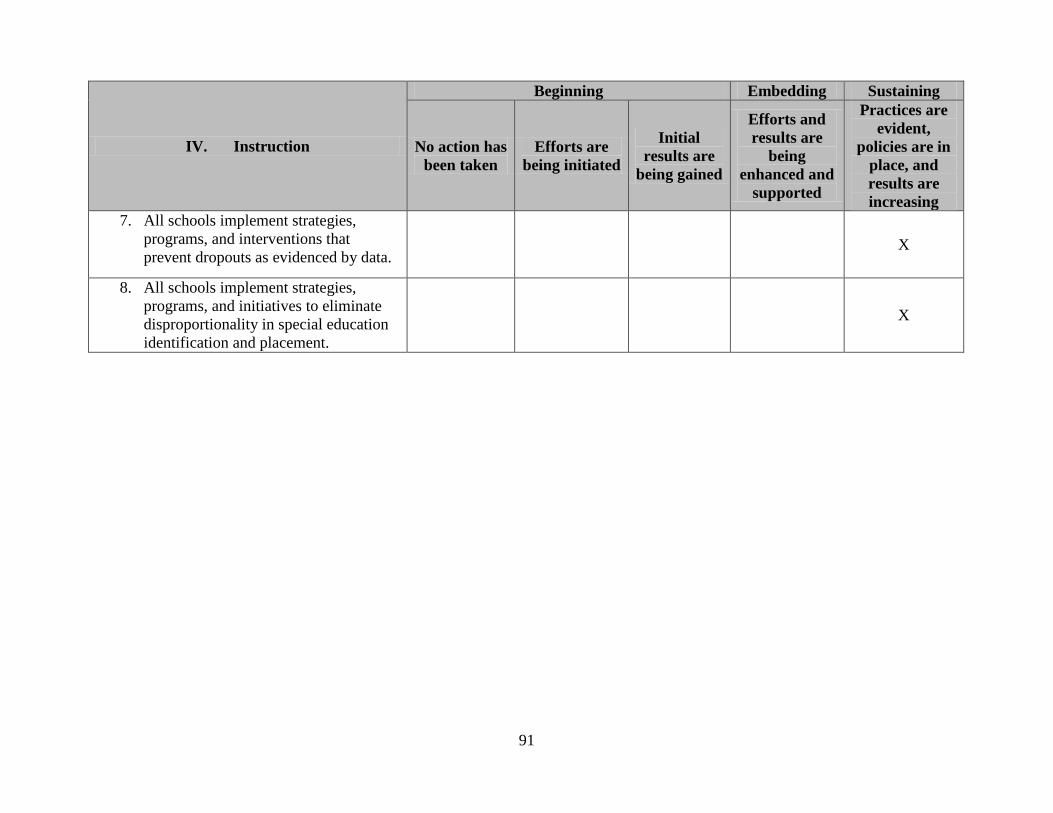
91
IV. Instruction
Beginning Embedding Sustaining
No action has
been taken
Efforts are
being initiated
Initial
results are
being gained
Efforts and
results are
being
enhanced and
supported
Practices are
evident,
policies are in
place, and
results are
increasing
7. All schools implement strategies,
programs, and interventions that
prevent dropouts as evidenced by data.
X
8. All schools implement strategies,
programs, and initiatives to eliminate
disproportionality in special education
identification and placement.
X

92
V. Staff Development
Beginning Embedding Sustaining
No action has
been taken
Efforts are
being initiated
Initial
results are
being gained
Efforts and
results are
being
enhanced and
supported
Practices are
evident,
policies are in
place, and
results are
increasing
1. ETMA staff development includes
involvement of all staff: (check all that
apply)
Administrators X
central office staff X
teachers X
support staff X
instructional assistants/paraeducators X
substitutes ___
bus drivers X
custodians X
cafeteria workers X
volunteers ___
X
2. Staff development utilizes the MSDE
Professional Development
Competencies for Enhancing Teacher
Efficacy in Implementing Education
That is Multicultural (ETM) and
accelerating minority achievement.
X
3. The LSS coordinates and facilitates
ETMA programs and activities:
Voluntary ETM courses are offered
(attach a list of courses)
X
Mandatory ETM courses are offered
(attach a list of courses)
X

93
V. Staff Development
Beginnings Embedding Sustaining
No action has
been taken
Efforts are
being initiated
Initial
results are
being gained
Efforts and
results are
being
enhanced and
supported
Practices are
evident,
policies are in
place, and
results are
increasing
ETMAworkshops or seminars are
provided during the year (attach a list
of programs)
X
4. The LSS and relevant area offices
ensure ETMA Staff Development
provided by all schools includes
involvement of all staff in training that:
a. explores attitudes and beliefs about
their own cultural identity.
X
b. identifies equity strategies,
techniques, and materials
appropriate for their work
assignment.
X
5. All schools provide training:
a. in assessing the prior knowledge,
attitudes, abilities, and learning
styles of students from varied
backgrounds in order to ensure
compliance with ETM practices.
X
b. to recognize, prevent and address
bullying, harassment, stereotyping,
prejudice, discrimination, and bias
that impedes student achievement.
X
c. to explore attitudes and beliefs
about other cultures to foster greater
inter-group understanding.
X

94
V. Staff Development
Beginning Embedding Sustaining
No action has
been taken
Efforts are
being initiated
Initial
results are
being gained
Efforts and
results are
being
enhanced and
supported
Practices are
evident,
policies are in
place, and
results are
increasing
d. to identify and implement
instructional strategies, techniques,
and materials appropriate for
ETMA.
X
e. to recognize and correct inequitable
participation in school activities by
students and staff from different
backgrounds and redress inequity in
instances of occurrence.
X
6. All schools provide appropriate
opportunities for staff to attend and
participate in local, state, regional, and
national ETMA conferences, seminars,
and workshops.
X
7. All schools provide professional
development workshops and courses
that include an ETMA focus.
X
8. All schools maintain current
professional development references
for educators, support staff and
administrators on education that is
multicultural and student achievement.
X

95
VI. Instructional Resources & Materials
Beginning Embedding Sustaining
No action has
been taken
Efforts are
being initiated
Initial
results are
being gained
Efforts and
results are
being
enhanced and
supported
Practices are
evident,
policies are in
place, and
results are
increasing
1. LSS maintains a system-wide resource
center with materials for schools at all
grade levels that reflect cultural
diversity and inclusiveness.
X
2. The LSS uses resource organizations
that promote cultural and ethnic
understanding.
X
3. The LSS uses instructional materials
that reinforce the concept of the United
States as a pluralistic society within a
globally interdependent world, while
recognizing our common ground as a
nation.
X
4. Information about available ETMA
resources is communicated throughout
the LSS using a variety of mechanisms
such as newsletters/monthly/and/or
quarterly publications.
X
5. All schools incorporate multicultural
instructional materials in all subject
areas.
X
6. All schools encourage, have
representation, and utilize parents and
community members from diverse
backgrounds in school events and
activities and as resources.
X

96
VI. Instructional Resources & Materials
Beginning Embedding Sustaining
No action has
been taken
Efforts are
being initiated
Initial
results are
being gained
Efforts and
results are
being
enhanced and
supported
Practices are
evident,
policies are in
place, and
results are
increasing
7. All schools maintain a library inclusive
of current instructional supplementary
references and/or materials for teachers
and administrators on Education that is
Multicultural and student achievement
X
8. All schools provide instructional
resources to assist students in gaining a
better understanding and developing of
an appreciation for cultural groups (i.e.
cultural groups, holidays, historical
events).
X
9. All schools have a process for selection
of instructional resources that includes
the following criteria:
a. materials that avoid stereotyping
and bias.
X
b. materials that reflect the diverse
experiences of cultural groups and
individuals.
X
c. individuals from diverse
backgrounds were involved in the
review and selection of materials.
X
10. All school media centers include print
and non-print materials that reflect
diversity and the multi-cultural nature
of the community.
X

97
VII. Physical Environment
Beginning Embedding Sustaining
No action has
been taken
Efforts are
being initiated
Initial
results are
being gained
Efforts and
results are
being
enhanced and
supported
Practices are
evident,
policies are in
place, and
results are
increasing
1. All schools are barrier free and
accessible for people with disabilities.
X
2. The physical environment in all schools
reflects diversity and inclusiveness in
displays and materials.
X

98
VIII. Policies
Beginning Embedding Sustaining
No action has
been taken
Efforts are
being initiated
Initial
results are
being gained
Efforts and
results are
being
enhanced and
supported
Practices are
evident,
policies are in
place, and
results are
increasing
1. The LSS has written policies and
practices that prohibit discrimination
against students and staff based on the
disability and diversity factors.
X
2. The LSS has non-discrimination
policies and statements included in staff
and student handbooks, on websites
and publications throughout the school
system.
X
3. The LSS has established procedures for
students and staff to report
discrimination complaints based on any
of the diversity factors.
X
4. School system policies assure that all
school publications use bias free,
gender fair language and visual images
which reflect cultural diversity and
inclusiveness.
X
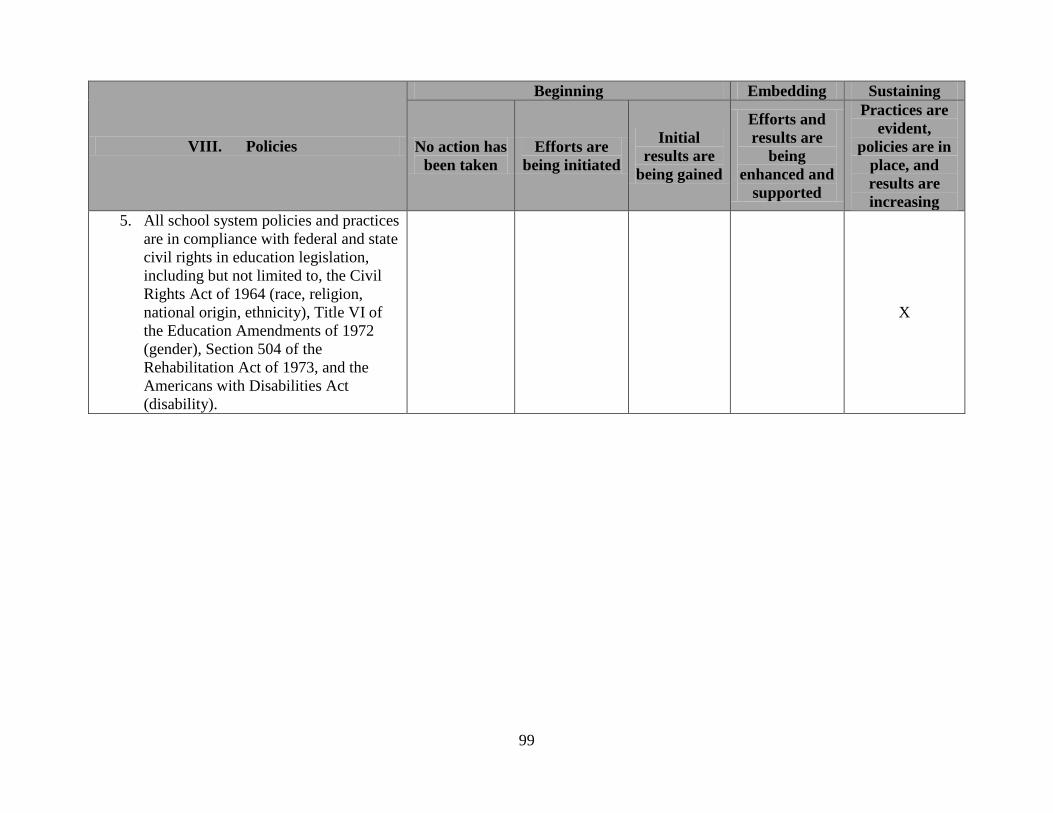
99
VIII. Policies
Beginning Embedding Sustaining
No action has
been taken
Efforts are
being initiated
Initial
results are
being gained
Efforts and
results are
being
enhanced and
supported
Practices are
evident,
policies are in
place, and
results are
increasing
5. All school system policies and practices
are in compliance with federal and state
civil rights in education legislation,
including but not limited to, the Civil
Rights Act of 1964 (race, religion,
national origin, ethnicity), Title VI of
the Education Amendments of 1972
(gender), Section 504 of the
Rehabilitation Act of 1973, and the
Americans with Disabilities Act
(disability).
X
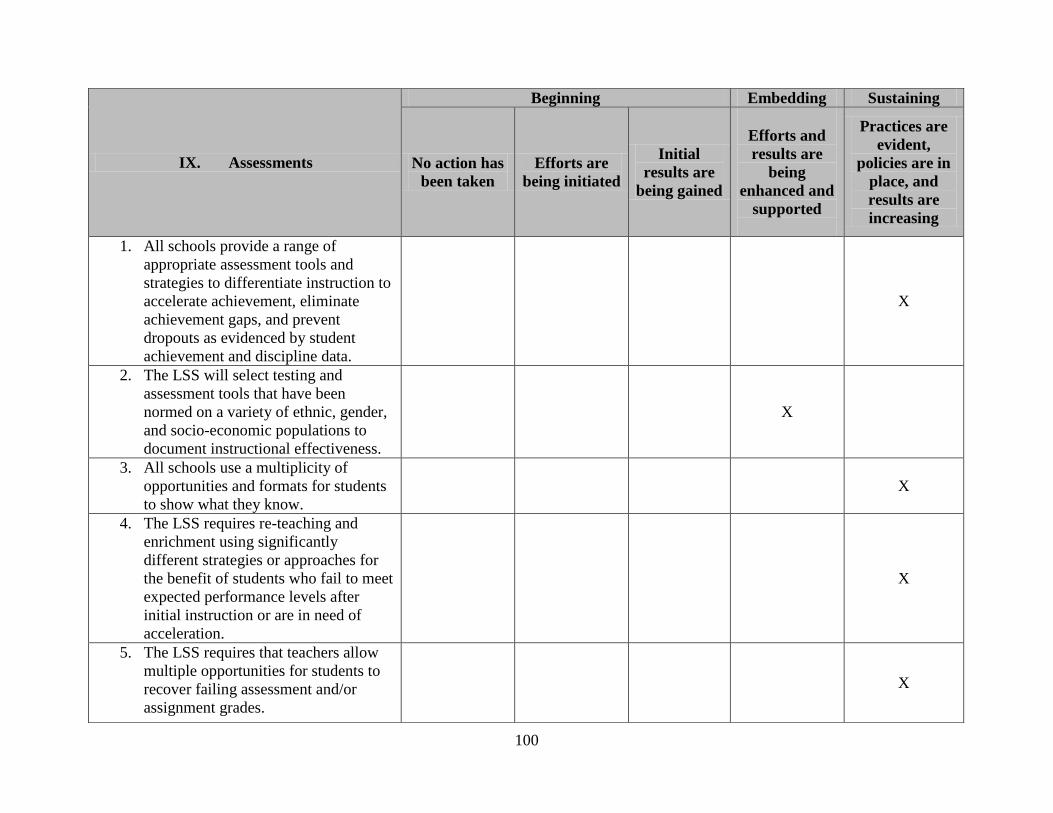
100
IX. Assessments
Beginning Embedding Sustaining
No action has
been taken
Efforts are
being initiated
Initial
results are
being gained
Efforts and
results are
being
enhanced and
supported
Practices are
evident,
policies are in
place, and
results are
increasing
1. All schools provide a range of
appropriate assessment tools and
strategies to differentiate instruction to
accelerate achievement, eliminate
achievement gaps, and prevent
dropouts as evidenced by student
achievement and discipline data.
X
2. The LSS will select testing and
assessment tools that have been
normed on a variety of ethnic, gender,
and socio-economic populations to
document instructional effectiveness.
X
3. All schools use a multiplicity of
opportunities and formats for students
to show what they know.
X
4. The LSS requires re-teaching and
enrichment using significantly
different strategies or approaches for
the benefit of students who fail to meet
expected performance levels after
initial instruction or are in need of
acceleration.
X
5. The LSS requires that teachers allow
multiple opportunities for students to
recover failing assessment and/or
assignment grades.
X
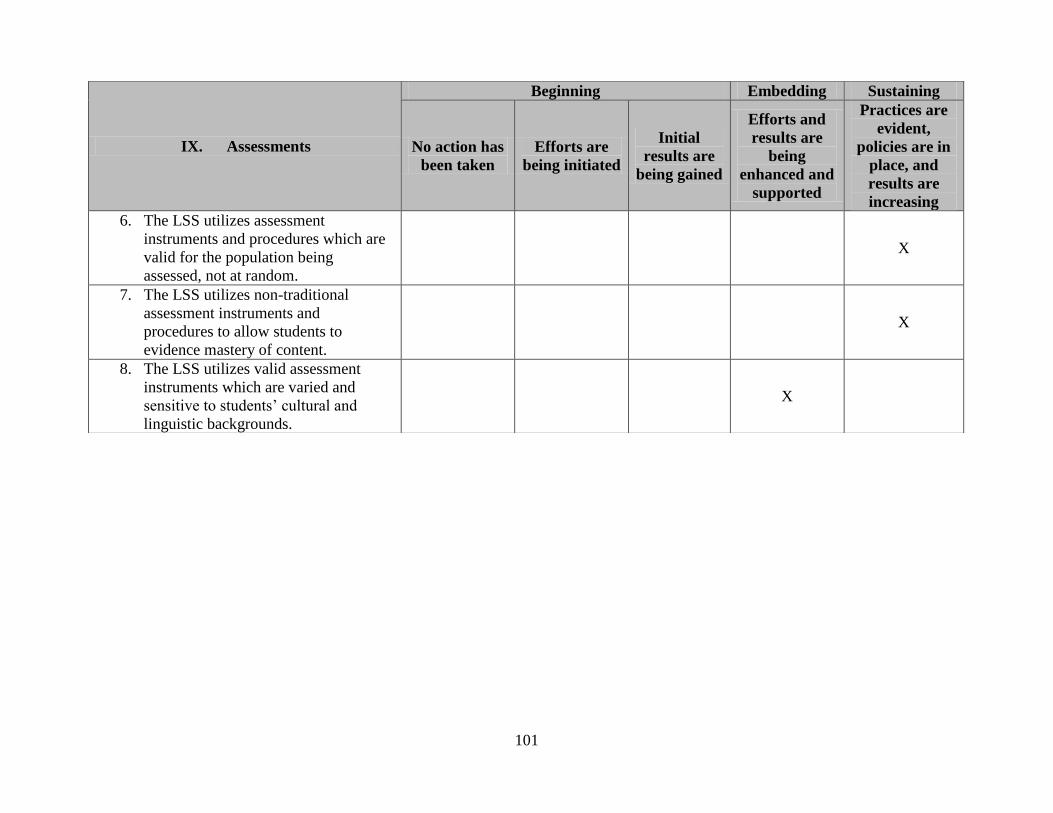
101
IX. Assessments
Beginning Embedding Sustaining
No action has
been taken
Efforts are
being initiated
Initial
results are
being gained
Efforts and
results are
being
enhanced and
supported
Practices are
evident,
policies are in
place, and
results are
increasing
6. The LSS utilizes assessment
instruments and procedures which are
valid for the population being
assessed, not at random.
X
7. The LSS utilizes non-traditional
assessment instruments and
procedures to allow students to
evidence mastery of content.
X
8. The LSS utilizes valid assessment
instruments which are varied and
sensitive to students’ cultural and
linguistic backgrounds.
X
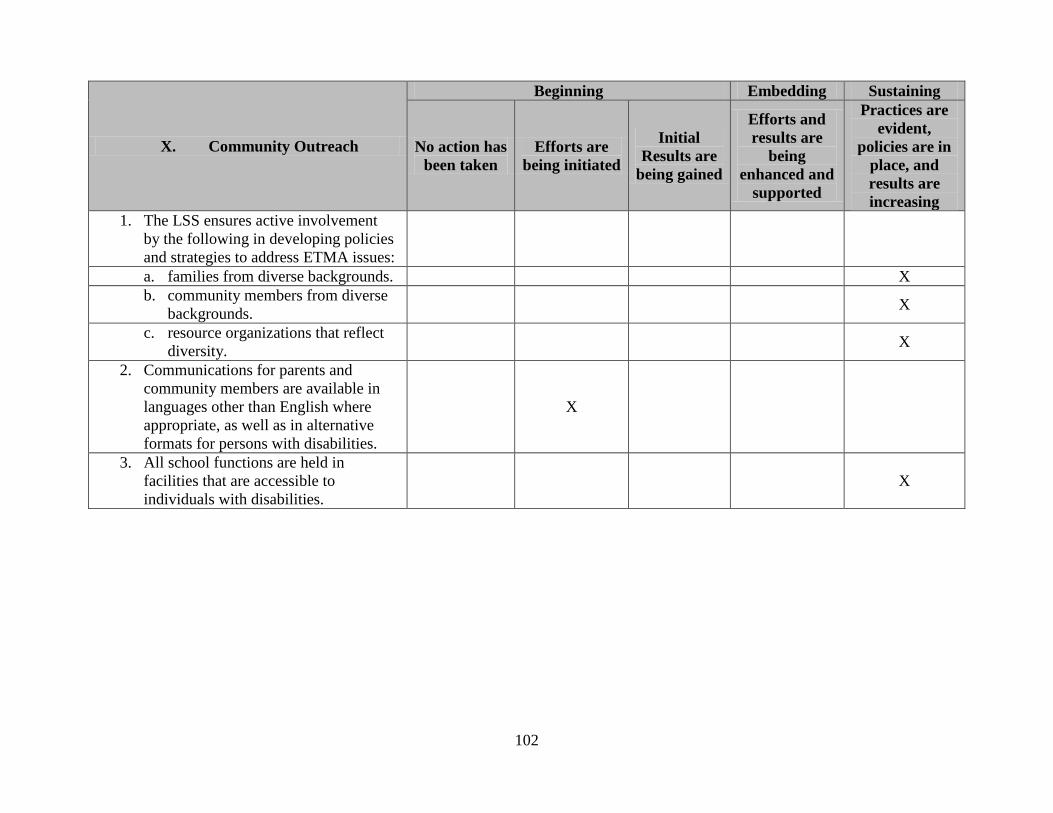
102
X. Community Outreach
Beginning Embedding Sustaining
No action has
been taken
Efforts are
being initiated
Initial
Results are
being gained
Efforts and
results are
being
enhanced and
supported
Practices are
evident,
policies are in
place, and
results are
increasing
1. The LSS ensures active involvement
by the following in developing policies
and strategies to address ETMA issues:
a. families from diverse backgrounds. X
b. community members from diverse
backgrounds.
X
c. resource organizations that reflect
diversity.
X
2. Communications for parents and
community members are available in
languages other than English where
appropriate, as well as in alternative
formats for persons with disabilities.
X
3. All school functions are held in
facilities that are accessible to
individuals with disabilities.
X

103
ETM mandatory and/or ETM voluntary courses offered:
Education That is Multicultural in the Classroom of the 21st Century – a MSDE approved, three-
credit course
Learning Styles in the Classroom of the 21st Century – a MSDE approved, one-credit course
A Framework for Understanding Poverty – a MSDE approved, three –credit course
Professional Development ETMA workshops or seminars provided during the school year:
Cultural Proficiency for new support staff – clerical, custodians, paraeducators, technicians, bus
drivers, and food service
Individuals contributing to the completion of the Compliance Report
Print Name Job Title
Kimberly Banks Supervisor of World Languages
Jim Boord Supervisor of Music
Cornell Brown Assistant Superintendent for Operations
Jonathan Brown Director of Community Engagement, Equity and Cultural
Proficiency
Kevin Ensor Supervisor of School Counseling
Susan Garrett Supervisor of Career Programs and Art
William Lawrence Associate Superintendent for Curriculum, Instruction and
Assessment
Sarah Morris Supervisor of Mathematics
Patricia O’Donnell Supervisor of Library Services
Bradley Palmer Supervisor of Title I Office
LaVerne Pitts Supervisor of Business and Technology Education
Andrew Renzulli Supervisor of Science
Kristine Scarry Supervisor of English/Language Arts
Leeann Schubert Coordinator of School Improvement
Ginny Smith Coordinator for Early Childhood Programs
Phillip Snyder Supervisor of Accountability
Jacqueline Tarbert Coordinator of Leadership and Professional Development
George Toepfer Supervisor of Social Studies

104
Section C: Data Systems to Support Instruction
Narrative
Recognizing that the state’s high-quality Instructional Improvement System (IIS) is the focus of
Maryland’s reform agenda, Harford County Public Schools (HCPS) committed resources and personnel
to guarantee the implementation of this system in classrooms. Maryland’s current vision for this system
places the teacher at its center and HCPS is ensuring teachers’ access to the nine-step process as
described in Section (C)(3) of the state’s Race to the Top (RTTT) plan for strengthening classroom
instruction.
In order to fully implement the IIS, and to ensure teachers are able to access timely data and resources,
HCPS is working with MSDE to assess current gaps within data systems. The Director of Information
Technology assigned staff to work with MSDE to coordinate the implementation of data management in
determining existing infrastructure needs and detail the educational technology solutions in order for
HCPS teachers to use the IIS. In addition, HCPS will purchase eSchoolPlus, a Student Information
System (SIS), in the second year of the grant. This system is a version upgrade to HCPS existing “end
of life” SIS which has no enhancement track to accommodate the data collection required by current and
future state/federal reporting. HCPS will identify funding through the operating budget to sustain the
SIS.
It is essential that HCPS central office have the capacity to provide technical support and assistance to
teachers in the use of the IIS. Currently, the Office of Accountability provides assistance to teachers as
they work to use Performance Matters, the HCPS current instructional database management and
assessment system. Before receiving RTTT funding, HCPS did not have staffing to provide the
technical assistance that will be required as teachers begin to access the system. RTTT funds have
allowed HCPS to hire an Instructional Data Specialist (IDS) who reports directly to the RTTT Project
Manager. This tech support person works with the Office of Technology, Content Supervisors, the
Office of Accountability and is assigned to assist teachers as HCPS works to transition to the IIS. This
position provides quarterly updates on teachers’ successes and challenges with the use of the IIS and
Performance Matters and works with leadership to provide solutions as needed. HCPS will identify
funding through the operating budget to sustain this position after the grant ends as this position will be
needed to continue to identify system needs and provide teachers with timely technical support in the
proficient use of the IIS and Performance Matters.
The RTTT Project Manager will continue to work with the Coordinator of Leadership and Professional
Development to facilitate teachers’ use of these tools in every school and will identify professional
development days throughout the school year to ensure classroom teachers receive intensive
professional development on the use of the IIS. These professional development activities will engage
teachers in basic information regarding key aspects of the IIS and Performance Matters (curriculum,
assessments, data management, and online resources).
Throughout Year 3 of the RTTT grant, the IIS will become part of school-based professional
development activities as follow-up from the Educator Effectiveness Academies (EEA). The
technology infrastructure will also allow teachers to participate in independent professional development
and HCPS will sustain the data integration system and future costs associated with this infrastructure
through the operating budget after the RTTT funding ends.
105
HCPS has recently been successful in providing school-based professional development on the
Classroom-focused Improvement Process (CFIP) and the use of Performance Matters system-wide.
Recent progress in teachers using data to inform instruction will provide the strong foundation needed
for the IIS.
Projects and tasks accomplished during Year 2 of RTTT:
Continued work with the Instructional Data Specialist (IDS) to provide immediate support for all
HCPS teachers currently learning to analyze assessment data to inform instructional practice.
Hosted and coordinated HCPS participation in the Educator Effectiveness Academies.
Continued to identify and address gaps in current HCPS data system and technological
infrastructure, in coordination with MSDE, to support efforts in the successful development and
eventual HCPS transition to the IIS.
Purchased eSchoolPlus upgrade.
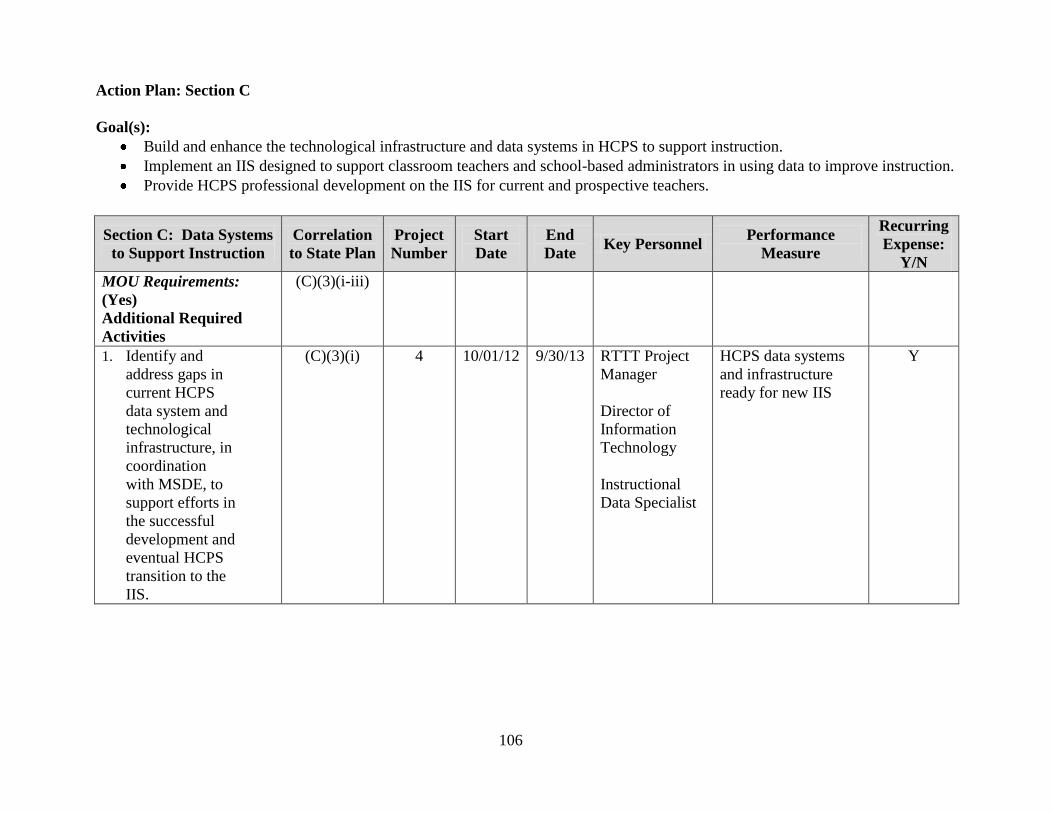
106
Action Plan: Section C
Goal(s):
Build and enhance the technological infrastructure and data systems in HCPS to support instruction.
Implement an IIS designed to support classroom teachers and school-based administrators in using data to improve instruction.
Provide HCPS professional development on the IIS for current and prospective teachers.
Section C: Data Systems
to Support Instruction
Correlation
to State Plan
Project
Number
Start
Date
End
Date Key Personnel
Performance
Measure
Recurring
Expense:
Y/N
MOU Requirements:
(Yes)
Additional Required
Activities
(C)(3)(i-iii)
1. Identify and
address gaps in
current HCPS
data system and
technological
infrastructure, in
coordination
with MSDE, to
support efforts in
the successful
development and
eventual HCPS
transition to the
IIS.
(C)(3)(i) 4 10/01/12 9/30/13 RTTT Project
Manager
Director of
Information
Technology
Instructional
Data Specialist
HCPS data systems
and infrastructure
ready for new IIS
Y

107
Section C: Data Systems
to Support Instruction
Correlation
to State Plan
Project
Number
Start
Date
End
Date Key Personnel
Performance
Measure
Recurring
Expense:
Y/N
2. Develop school-
based
professional
development
plan and identify
professional
development
calendar days to
ensure training
on use of data is
available in the
IIS.
(C)(3)(ii) 1 10/01/12 9/30/13 RTTT Project
Manager
Coordinator of
Professional
and Leadership
Development
School year calendar
published with EEA
professional
development follow
up days
N
3. Participate in
data requests to
support research
on effectiveness
as determined by
new MSDE
governance
process.
(C)(3)(iii) 1 10/01/12 9/30/13 RTTT Project
Manager
Supervisor
Office of
Accountability
Data provided to
MSDE and
researchers
N
Tasks/Activities:
1. Along with the RTTT
Project Manager,
Instructional Data
Specialist will help
identify current system
needs and
technological
infrastructure to
support HCPS hosting
of EEA.
(C)(3)(i) 4 10/01/12 9/30/13 RTTT Project
Manager
Director of
Information
Technology
Instructional
Data Specialist
Needs identified and
addressed
Y

108
Section C: Data Systems
to Support Instruction
Correlation
to State Plan
Project
Number
Start
Date
End
Date Key Personnel
Performance
Measure
Recurring
Expense:
Y/N
2. Provide timely and
meaningful assistance
to schools in support
of their work using the
IIS and Performance
Matters.
(C)(3)(ii) 4 10/01/12 9/30/13 RTTT Project
Manager
Supervisor of
Accountability
Instructional
Data Specialist
Data management
solutions resolved
Teachers provide
feedback regarding
“customer service”
provided and
proficient use of new
IIS and Performance
Matters
Y
3. Upload the data from
the IIS so it is
available and
accessible to MSDE
researchers to evaluate
IIS effectiveness.
(C)(3)(ii) 5 10/01/12 9/30/13 Director of
Information
Technology
Instructional
Data Specialist
Data uploaded N
Year 4 Goals:
Enhance the technological infrastructure and data systems in HCPS.
Implement an IIS designed to support classroom teachers and school-based administrators in using data to improve instruction.
Provide HCPS professional development on the IIS for current and prospective teachers.
109
Section D: Great Teachers and Leaders
Narrative
As mandated by the Maryland Education Reform Act of 2010, Harford County Public Schools (HCPS)
will ensure the new performance evaluation system for teachers and principals is operational by
September 2013. Based on the timeline provided, HCPS leadership, including the Race to the Top
(RTTT) Project Manager, closely followed the progress of the Maryland Model Performance Evaluation
System throughout school year 2010-11.
In March 2011, HCPS hired Model Department Chairpersons in high school Mathematics, English,
Science and Social Studies. HCPS requested the Mathematics and Science Chairs be supported by
RTTT funds, as they play a key role in the creation and implementation of the HCPS STEM initiative
and content delivery. The Model Chairpersons have been assigned to work with four principals and core
content supervisors to provide supplementary content specific evaluative services at four high schools.
In addition to the high school assignment, the Model Department Chairperson collaborates with the
Office of Leadership and Professional Development in the development of programs to facilitate the
preparation and transition of department chairpersons to their new role.
Through years 1 and 2 of the RTTT grant, three Model Department Chairs were hired at the high school
level to support STEM initiatives. These department chair positions are being expanded to all ten high
school in the county and the salaries will be covered through the FY13 operating budget. Therefore,
HCPS is requesting a budget amendment to support the salaries of three middle school Model
Department Chairs in the areas of English/Related Language Arts, Mathematics, and Science to support
the transition to the Common Core Standards, as well as STEM initiatives for years 3 and 4 of the RTTT
grant. In addition to the middle school assignments, the Model Department Chairpersons will
collaborate with the Office of Leadership and Professional Development in the development of
programs to facilitate the preparation and transition of future department chairpersons to their new role.
In terms of ensuring equitable distribution of effective teachers and principals, HCPS is fortunate not to
struggle with staffing issues in high-poverty, low-achieving schools. The Office of Compensatory
Education has been diligent in ensuring 100% of staff at these schools are considered highly qualified.
HCPS continues to ensure that all teachers in high-poverty, low-achieving schools are deemed highly
effective as we move from highly qualified teachers to highly effective teachers and principals.
In March 2011, HCPS hired a Coordinator of Teacher Induction who reports to the Coordinator of
Leadership and Professional Development. The Coordinator of Teacher Induction is charged with:
participating in the State’s Induction Program Academies and sending HCPS mentors as allowable by
the state; overseeing a comprehensive teacher induction program based on the model shared at the
Teacher Induction Academies; supervising the continuation of the mentor teacher program; evaluating
mentor teachers in collaboration with school administrators; collaborating with the Office of Education
Services to assess school needs and assigning mentor teachers as appropriate; and serving as a liaison
with MSDE.
From March to August 2011, the Coordinator of Teacher Induction worked with both the RTTT Project
Manager and Coordinator of Leadership and Professional Development to revise and expand the HCPS
Teacher Induction Program based on COMAR 13A.07.01, as well as lessons learned from the MSDE

110
Teacher Induction Academy. HCPS already provides extensive support to new teachers including:
professional development orientation conference; three hour after school workshops throughout the
year; opportunities to observe a model classroom and teacher; and job embedded professional
development. The creation of the new Coordinator of Teacher Induction position enhances the work of
the mentor teachers and allows for additional supports provided for new teachers. Clerical support is
also provided for the Coordinator of Teacher Induction through RTTT funds.
It is the intent of HCPS to sustain the Coordinator of Teacher Induction position through operating funds
the school year after the RTTT funding ends. It is anticipated that there will be an ongoing need for the
Coordinator of Teacher Induction to: revise the induction program for new teachers; assess school needs
regarding new teachers and assigning of mentors as appropriate; provide ongoing training for mentors;
and assist principals in evaluation of mentors.
HCPS is in compliance with COMAR as we have identified a cadre of full-time mentor teachers and
adhere to the requirements established in Section .05, Mentoring Component of the Comprehensive
Induction Program. We continue to comply with all the requirements of the COMAR 13A.07.01
regulation as we work to expand our mentor program.
Educator Effectiveness Academies
As discussed in Section B, HCPS participated in the Educator Effectiveness Academies (EEA). From
March to July 2011, the RTTT Project Manager oversaw the identification and participation of school-
based teams from all 54 schools.
HCPS hosted one of the EEA at C. Milton Wright High School July 11-13, 2011. Principals and three
teacher leaders from each school attended the event, as well as the following Central Office Staff:
Director of Special Education; Supervisor of Mathematics; Supervisor of English and Related Language
Arts; President of Harford County Education Association; Coordinator of Professional Development;
and the RTTT Project Manager. The Superintendent, a Board of Education member, the Assistant
Superintendent for Curriculum, Instruction, and Assessment, the Executive Directors of High, Middle,
and Elementary School Performance walked-through the Academy multiple times throughout the three-
days. HCPS provided an optional follow-up professional development to the EEA in an effort to build
capacity for administrators and faculty who were unable to participate in the Academy.
Throughout all four years of the grant, all teachers will be trained in the new IIS. School-based teams
are using the information provided in the EEA to build on the professional development done system-
wide using the CFIP. HCPS is currently working to ensure all teachers and administrators use this six-
step process as they meet in various work groups to discuss student achievement and school
improvement initiatives. HCPS has trained all teachers, supervisory staff, and administrators on
Performance Matters so they may access real-time student data as they work through CFIP and address
individual student performance.
Teacher Evaluation Pilot
In order to support HCPS 2012-13 Teacher Evaluation Pilot, HCPS will contract with Performance
Matters to purchase Faste Observer to support teacher observation, evaluation, and professional
growth in the third year of the grant. This new program compliments Performance Matters, HCPS

111
instructional data warehouse and will assist principals and teachers in the observation/evaluation
process.
Projects and tasks accomplished during Year 2 of RTTT:
Created the Harford County Educator Effectiveness Council to establish sub-committees and
other responsibilities of the committee regarding the Teacher Evaluation Pilot.
Began the teacher and principal evaluation pilots.
Identified the principal and three teacher leaders from all 54 schools who participated in the
EEA.
Organized and facilitated the follow-up professional development to the EEA provided
by HCPS.
Facilitated a workshop for teachers who have 5-15 years experience regarding Student
Empowerment utilizing the Common Core State Standards.
Implemented the HCPS Teacher Induction Program.
Participated in MSDEs Teacher Induction Academy for LEA Coordinators.
Participated in MSDEs Aspiring Leaders’ Academy and Executive Officer professional
development opportunities.
Provided professional development for mentors and instructional facilitators.
Assessed school needs regarding new teachers and assigned current mentor teachers as
appropriate.
June 20 Student Empowerment utilizing the Common Core State Standards workshop. The
purpose of this workshop is to develop the capacity of mid-level experienced teachers that
empower students and address the rigor required of the Common Core State Standards.

112
Action Plan: Section D
Goal(s):
Design an educator evaluation system/process that is aligned to the recommendations of the Maryland Council for Educator
Effectiveness.
Provide effective professional development regarding the EEA, IIS, CFIP and Performance Matters for teachers and principals.
Implement a Teacher Induction Program.
Section D: Great
Teachers and Leaders
Correlation
to State
Plan
Project
Number
Start
Date
End
Date Key Personnel
Performance
Measure
Recurring
Expense:
Y/N
MOU Requirements:
(Yes)
Activities to Implement
MOU Requirements
(D)(2)(i–iv)
(D)(3)(i-ii)
(D)(5)(i-ii)
1. Review MSDE
framework to begin
revising teacher and
principal evaluations
based on final
approved statewide
measures for student
growth.
(D)(2)(i) 10/01/12 9/30/13 Associate
Superintendent
of Curriculum,
Instruction and
Assessment
Assistant
Superintendent
of Human
Resources
RTTT Project
Manager
Teacher and principal
evaluations align to the
State Framework
N
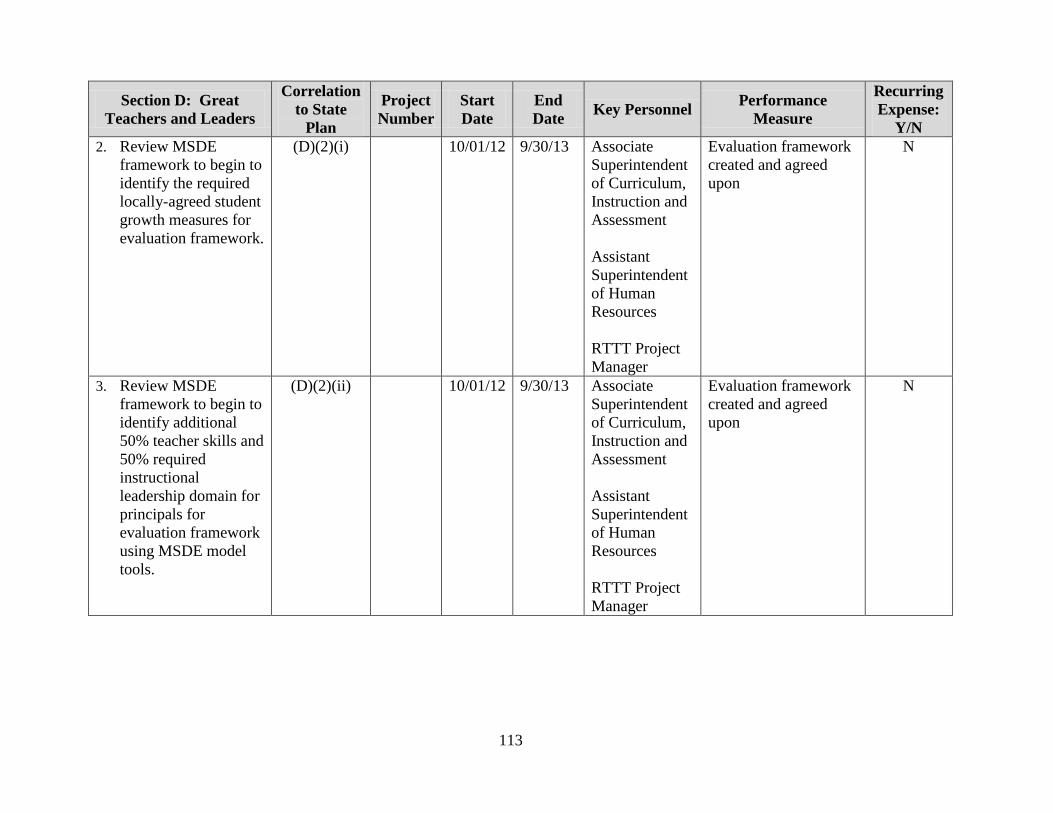
113
Section D: Great
Teachers and Leaders
Correlation
to State
Plan
Project
Number
Start
Date
End
Date Key Personnel
Performance
Measure
Recurring
Expense:
Y/N
2. Review MSDE
framework to begin to
identify the required
locally-agreed student
growth measures for
evaluation framework.
(D)(2)(i) 10/01/12 9/30/13 Associate
Superintendent
of Curriculum,
Instruction and
Assessment
Assistant
Superintendent
of Human
Resources
RTTT Project
Manager
Evaluation framework
created and agreed
upon
N
3. Review MSDE
framework to begin to
identify additional
50% teacher skills and
50% required
instructional
leadership domain for
principals for
evaluation framework
using MSDE model
tools.
(D)(2)(ii) 10/01/12 9/30/13 Associate
Superintendent
of Curriculum,
Instruction and
Assessment
Assistant
Superintendent
of Human
Resources
RTTT Project
Manager
Evaluation framework
created and agreed
upon
N
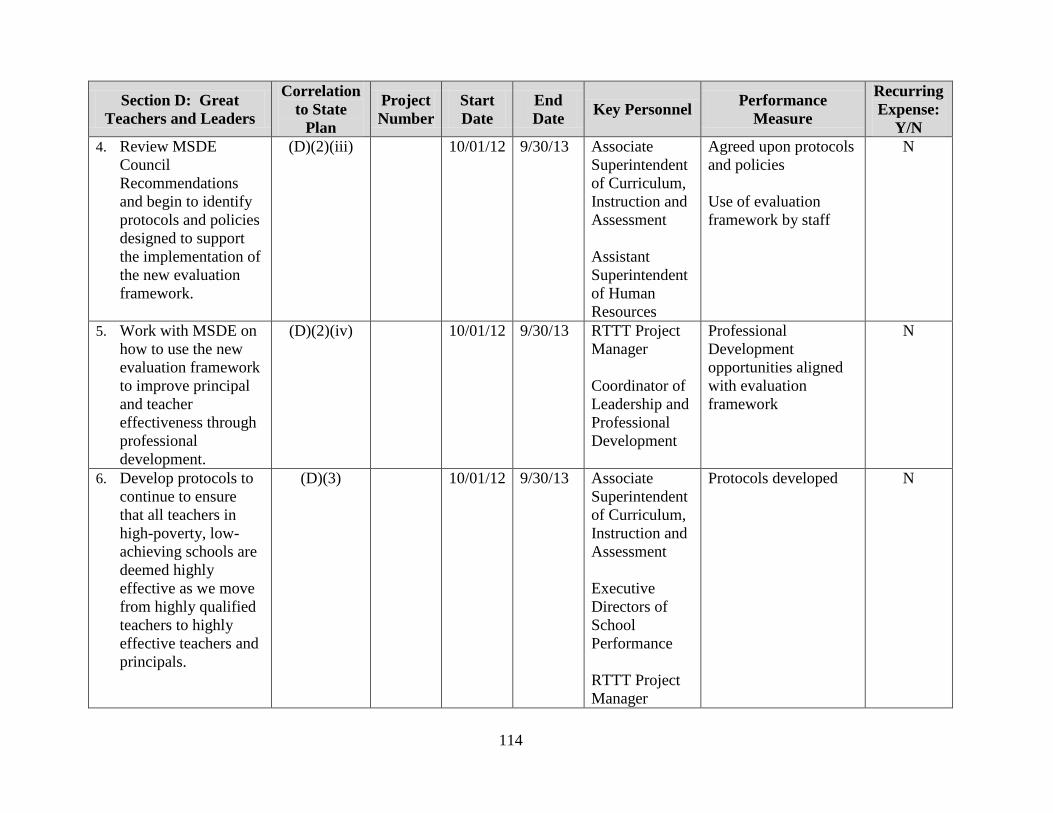
114
Section D: Great
Teachers and Leaders
Correlation
to State
Plan
Project
Number
Start
Date
End
Date Key Personnel
Performance
Measure
Recurring
Expense:
Y/N
4. Review MSDE
Council
Recommendations
and begin to identify
protocols and policies
designed to support
the implementation of
the new evaluation
framework.
(D)(2)(iii) 10/01/12 9/30/13 Associate
Superintendent
of Curriculum,
Instruction and
Assessment
Assistant
Superintendent
of Human
Resources
Agreed upon protocols
and policies
Use of evaluation
framework by staff
N
5. Work with MSDE on
how to use the new
evaluation framework
to improve principal
and teacher
effectiveness through
professional
development.
(D)(2)(iv) 10/01/12 9/30/13 RTTT Project
Manager
Coordinator of
Leadership and
Professional
Development
Professional
Development
opportunities aligned
with evaluation
framework
N
6. Develop protocols to
continue to ensure
that all teachers in
high-poverty, low-
achieving schools are
deemed highly
effective as we move
from highly qualified
teachers to highly
effective teachers and
principals.
(D)(3) 10/01/12 9/30/13 Associate
Superintendent
of Curriculum,
Instruction and
Assessment
Executive
Directors of
School
Performance
RTTT Project
Manager
Protocols developed N
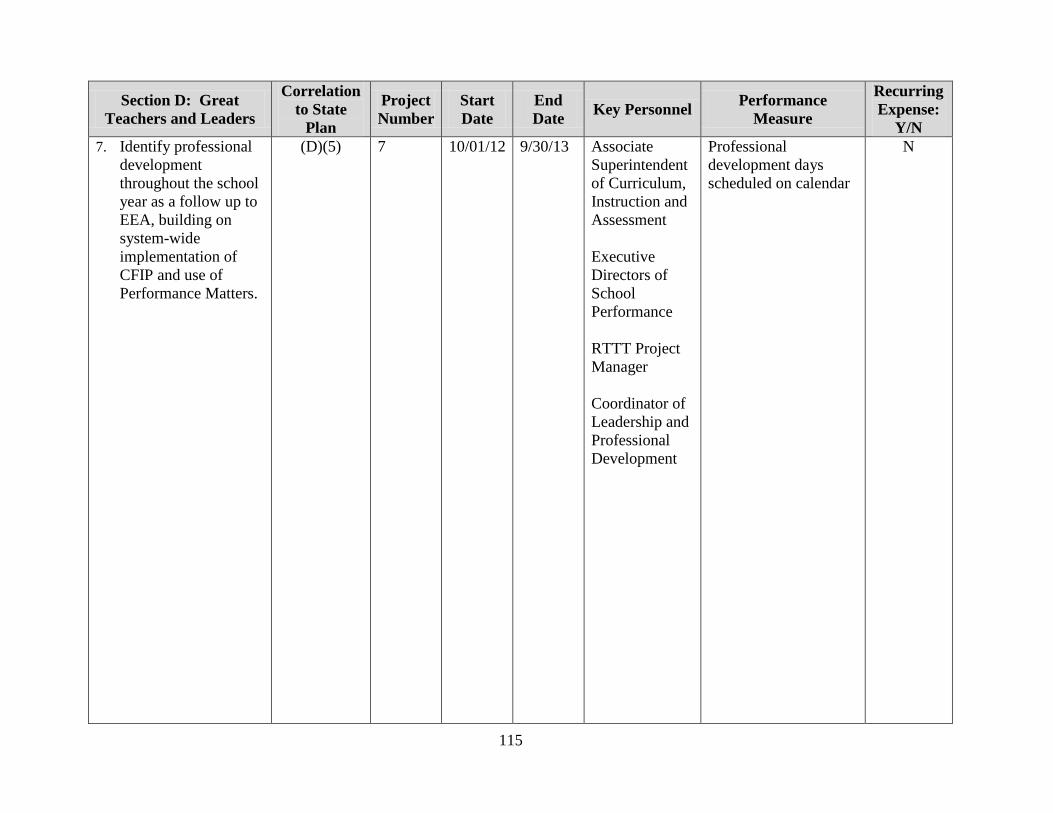
115
Section D: Great
Teachers and Leaders
Correlation
to State
Plan
Project
Number
Start
Date
End
Date Key Personnel
Performance
Measure
Recurring
Expense:
Y/N
7. Identify professional
development
throughout the school
year as a follow up to
EEA, building on
system-wide
implementation of
CFIP and use of
Performance Matters.
(D)(5) 7 10/01/12 9/30/13 Associate
Superintendent
of Curriculum,
Instruction and
Assessment
Executive
Directors of
School
Performance
RTTT Project
Manager
Coordinator of
Leadership and
Professional
Development
Professional
development days
scheduled on calendar
N
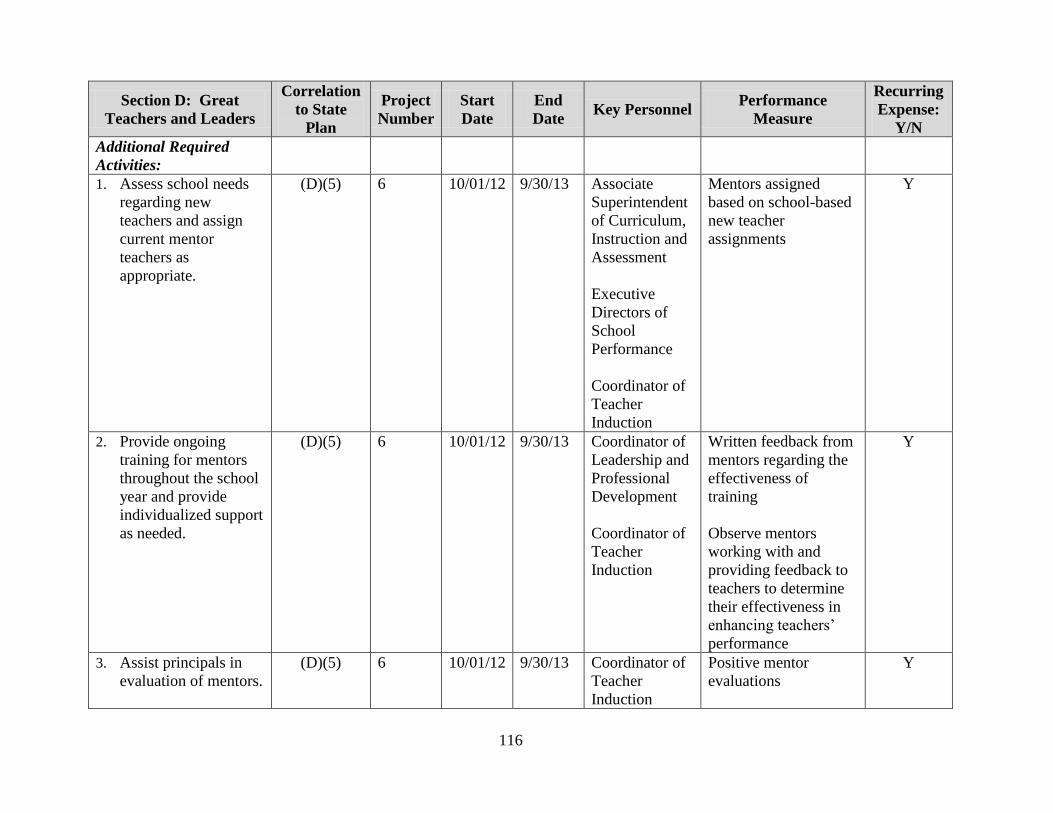
116
Section D: Great
Teachers and Leaders
Correlation
to State
Plan
Project
Number
Start
Date
End
Date Key Personnel
Performance
Measure
Recurring
Expense:
Y/N
Additional Required
Activities:
1. Assess school needs
regarding new
teachers and assign
current mentor
teachers as
appropriate.
(D)(5) 6 10/01/12 9/30/13 Associate
Superintendent
of Curriculum,
Instruction and
Assessment
Executive
Directors of
School
Performance
Coordinator of
Teacher
Induction
Mentors assigned
based on school-based
new teacher
assignments
Y
2. Provide ongoing
training for mentors
throughout the school
year and provide
individualized support
as needed.
(D)(5) 6 10/01/12 9/30/13 Coordinator of
Leadership and
Professional
Development
Coordinator of
Teacher
Induction
Written feedback from
mentors regarding the
effectiveness of
training
Observe mentors
working with and
providing feedback to
teachers to determine
their effectiveness in
enhancing teachers’
performance
Y
3. Assist principals in
evaluation of mentors.
(D)(5) 6 10/01/12 9/30/13 Coordinator of
Teacher
Induction
Positive mentor
evaluations
Y
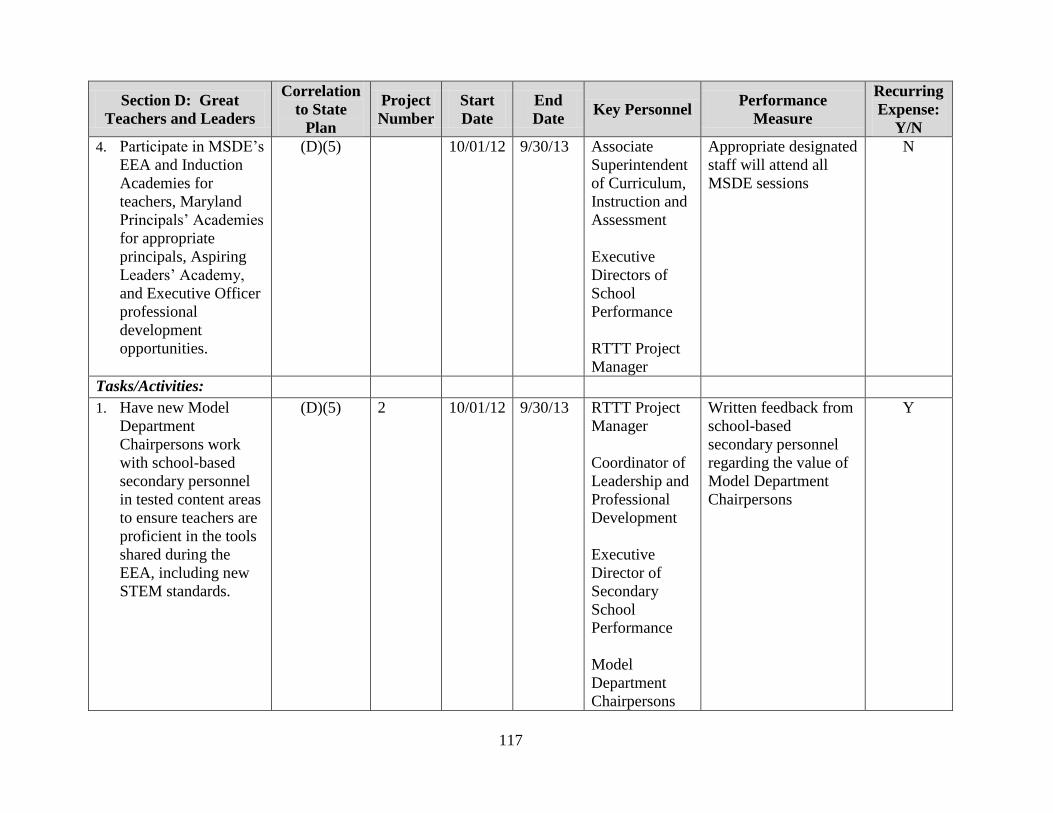
117
Section D: Great
Teachers and Leaders
Correlation
to State
Plan
Project
Number
Start
Date
End
Date Key Personnel
Performance
Measure
Recurring
Expense:
Y/N
4. Participate in MSDE’s
EEA and Induction
Academies for
teachers, Maryland
Principals’ Academies
for appropriate
principals, Aspiring
Leaders’ Academy,
and Executive Officer
professional
development
opportunities.
(D)(5) 10/01/12 9/30/13 Associate
Superintendent
of Curriculum,
Instruction and
Assessment
Executive
Directors of
School
Performance
RTTT Project
Manager
Appropriate designated
staff will attend all
MSDE sessions
N
Tasks/Activities:
1. Have new Model
Department
Chairpersons work
with school-based
secondary personnel
in tested content areas
to ensure teachers are
proficient in the tools
shared during the
EEA, including new
STEM standards.
(D)(5) 2 10/01/12 9/30/13 RTTT Project
Manager
Coordinator of
Leadership and
Professional
Development
Executive
Director of
Secondary
School
Performance
Model
Department
Chairpersons
Written feedback from
school-based
secondary personnel
regarding the value of
Model Department
Chairpersons
Y
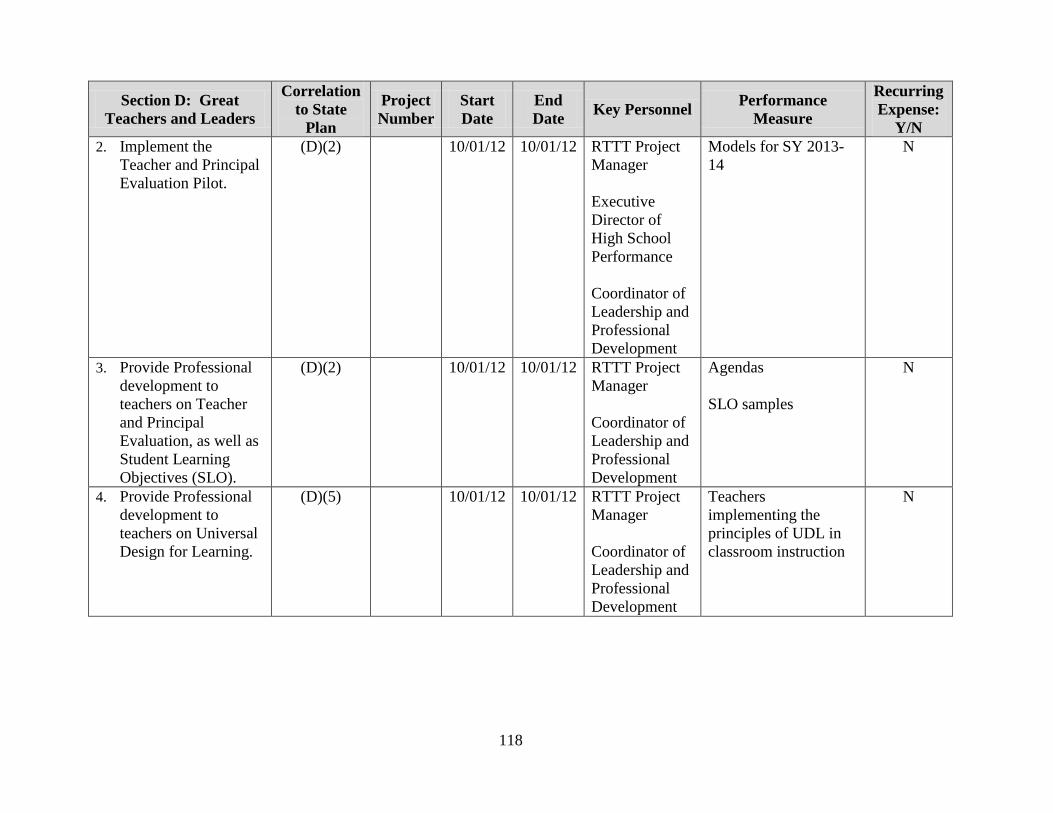
118
Section D: Great
Teachers and Leaders
Correlation
to State
Plan
Project
Number
Start
Date
End
Date Key Personnel
Performance
Measure
Recurring
Expense:
Y/N
2. Implement the
Teacher and Principal
Evaluation Pilot.
(D)(2) 10/01/12 10/01/12 RTTT Project
Manager
Executive
Director of
High School
Performance
Coordinator of
Leadership and
Professional
Development
Models for SY 2013-
14
N
3. Provide Professional
development to
teachers on Teacher
and Principal
Evaluation, as well as
Student Learning
Objectives (SLO).
(D)(2) 10/01/12 10/01/12 RTTT Project
Manager
Coordinator of
Leadership and
Professional
Development
Agendas
SLO samples
N
4. Provide Professional
development to
teachers on Universal
Design for Learning.
(D)(5) 10/01/12 10/01/12 RTTT Project
Manager
Coordinator of
Leadership and
Professional
Development
Teachers
implementing the
principles of UDL in
classroom instruction
N

119
Section D: Great
Teachers and Leaders
Correlation
to State
Plan
Project
Number
Start
Date
End
Date Key Personnel
Performance
Measure
Recurring
Expense:
Y/N
5. Purchase Faste
Observer from
Performance Matters
to support teacher
observation,
evaluation, and
professional growth.
(D)(2) 9 10/01/12 9/30/13 RTTT Project
Manager
Coordinator of
Leadership and
Professional
Development
Principals utilizing the
new
observation/evaluation
instruments in
Performance Matters
N
6. Train staff members
on the new
enhancement.
(D)(2) 9 10/01/12 9/30/13 RTTT Project
Manager
Coordinator of
Leadership and
Professional
Development
Staff members
attending professional
development, as well
as utilizing the new
observation/evaluation
instruments
N
Year 4 Goals:
Implement an educator evaluation system/process that is aligned to the recommendations of the Maryland Council for
Educator Effectiveness.
Provide effective professional development regarding the Teacher and Principal Effectiveness Pilots, EEA, IIS, SLO, CFIP
and Performance Matters for teachers and principals.
Implement a Teacher Induction Program.
120
Highly Qualified Staff
No Child Left Behind Goal 3: By 2005-2006, all students will be taught by highly qualified
teachers.
No Child Left Behind Indicator 3.1: The percentage of classes being taught by “highly
qualified” teachers, in the aggregate and in “high-poverty” schools.
No Child Left Behind Indicator 3.3: The percentage of paraprofessionals working in Title I
schools (excluding those whose sole duties are translators and parental involvement
assistants) who are qualified.
Under No Child Left Behind (NCLB), LSSs are required to report the percentages of core academic
subject (CAS) classes being taught by highly qualified teachers, and the percentages of CAS classes
being taught by highly qualified teachers in high-poverty schools compared to low-poverty schools.
High-poverty schools are defined as schools in the top quartile of poverty in the State, and low-poverty
schools as schools in the bottom quartile of poverty in the State. NCLB also requires that school
systems ensure that economically disadvantaged and minority students are not taught at higher rates than
other students by inexperienced, unqualified, or out-of-field teachers.
Plans for Reaching the 100% Highly Qualified Teacher (HQT) Goal
LSS responses to Section I.D.vi in Part I and the Title II, Part A attachment in Part II will continue to
serve as the school system’s Highly Qualified Teacher Improvement Plan.4 In this section, each LSS
should address the factors that prevent the district from attaining the HQT benchmark goals.
4 Section 2141(a) of the Elementary and Secondary Education Act.
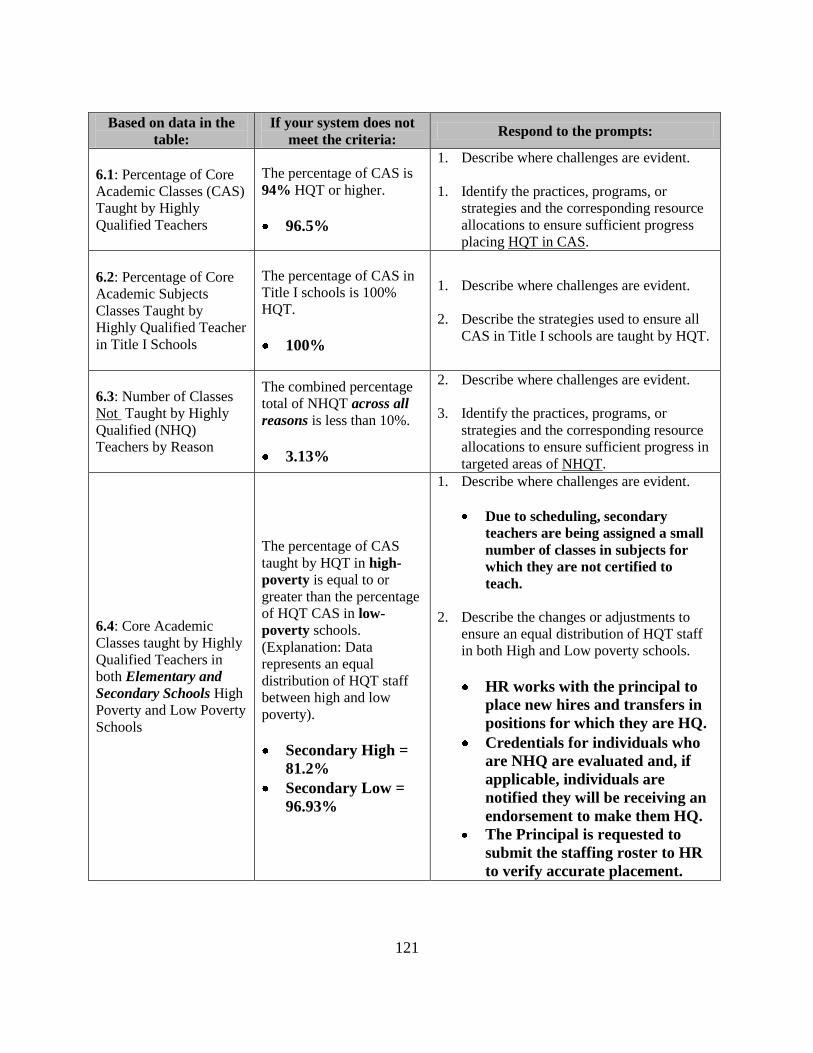
121
Based on data in the
table:
If your system does not
meet the criteria: Respond to the prompts:
6.1: Percentage of Core
Academic Classes (CAS)
Taught by Highly
Qualified Teachers
The percentage of CAS is
94% HQT or higher.
96.5%
1. Describe where challenges are evident.
1. Identify the practices, programs, or
strategies and the corresponding resource
allocations to ensure sufficient progress
placing HQT in CAS.
6.2: Percentage of Core
Academic Subjects
Classes Taught by
Highly Qualified Teacher
in Title I Schools
The percentage of CAS in
Title I schools is 100%
HQT.
100%
1. Describe where challenges are evident.
2. Describe the strategies used to ensure all
CAS in Title I schools are taught by HQT.
6.3: Number of Classes
Not Taught by Highly
Qualified (NHQ)
Teachers by Reason
The combined percentage
total of NHQT across all
reasons is less than 10%.
3.13%
2. Describe where challenges are evident.
3. Identify the practices, programs, or
strategies and the corresponding resource
allocations to ensure sufficient progress in
targeted areas of NHQT.
6.4: Core Academic
Classes taught by Highly
Qualified Teachers in
both Elementary and
Secondary Schools High
Poverty and Low Poverty
Schools
The percentage of CAS
taught by HQT in high-
poverty is equal to or
greater than the percentage
of HQT CAS in low-
poverty schools.
(Explanation: Data
represents an equal
distribution of HQT staff
between high and low
poverty).
Secondary High =
81.2%
Secondary Low =
96.93%
1. Describe where challenges are evident.
Due to scheduling, secondary
teachers are being assigned a small
number of classes in subjects for
which they are not certified to
teach.
2. Describe the changes or adjustments to
ensure an equal distribution of HQT staff
in both High and Low poverty schools.
HR works with the principal to
place new hires and transfers in
positions for which they are HQ.
Credentials for individuals who
are NHQ are evaluated and, if
applicable, individuals are
notified they will be receiving an
endorsement to make them HQ.
The Principal is requested to
submit the staffing roster to HR
to verify accurate placement.
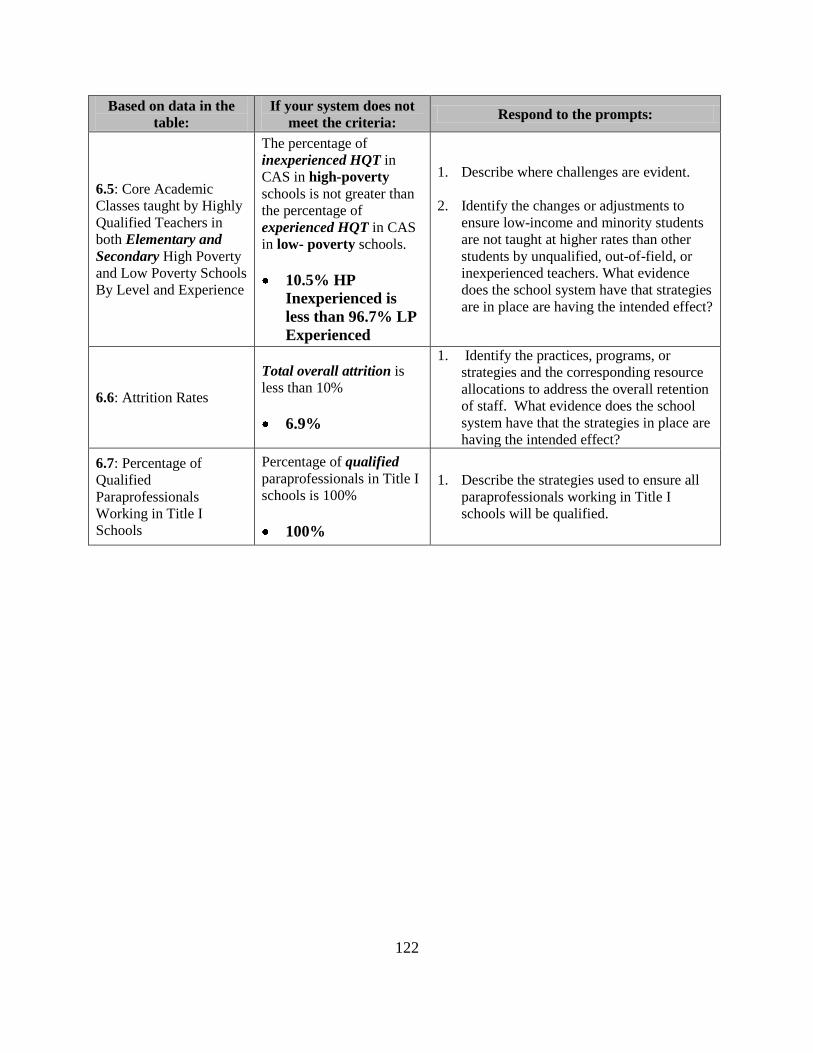
122
Based on data in the
table:
If your system does not
meet the criteria: Respond to the prompts:
6.5: Core Academic
Classes taught by Highly
Qualified Teachers in
both Elementary and
Secondary High Poverty
and Low Poverty Schools
By Level and Experience
The percentage of
inexperienced HQT in
CAS in high-poverty
schools is not greater than
the percentage of
experienced HQT in CAS
in low- poverty schools.
10.5% HP
Inexperienced is
less than 96.7% LP
Experienced
1. Describe where challenges are evident.
2. Identify the changes or adjustments to
ensure low-income and minority students
are not taught at higher rates than other
students by unqualified, out-of-field, or
inexperienced teachers. What evidence
does the school system have that strategies
are in place are having the intended effect?
6.6: Attrition Rates
Total overall attrition is
less than 10%
6.9%
1. Identify the practices, programs, or
strategies and the corresponding resource
allocations to address the overall retention
of staff. What evidence does the school
system have that the strategies in place are
having the intended effect?
6.7: Percentage of
Qualified
Paraprofessionals
Working in Title I
Schools
Percentage of qualified
paraprofessionals in Title I
schools is 100%
100%
1. Describe the strategies used to ensure all
paraprofessionals working in Title I
schools will be qualified.

123
High Quality Professional Development
No Child Left Behind Indicator 3.2: The percentage of teachers receiving high quality
professional development.
Professional Development
Please provide your District Professional Development Plan (or the pertinent pages from your
website). In a brief narrative, describe how your plan addresses:
1. Underperforming populations;
2. The transition to the new Maryland Common Core State Curriculum; and
3. The transition to the new teacher and principal evaluation system.
Harford County Public Schools (HCPS) sees a direct connection between all three topics. The new
teacher and principal evaluation systems will provide a framework for ongoing professional growth and
development for our teachers to enhance instructional practices. Highly effective teachers will be able to
address the needs of underperforming populations of students through the use of rigorous, relevant
curriculum identified in the Maryland Common Core State Curriculum.
HCPS has taken a hybrid approach of both systemic and school-based professional development to meet
the needs of teachers and administrators during this period of transition. Professional development dates
and times are determined on the HCPS Master Calendar to secure dedicated time for system-wide and
school-based activities.
Underperforming Populations
HCPS General Education and Special Education personnel work in collaboration to address the
instructional needs of all students utilizing a wide range of strategies including Response to Intervention,
accessible curriculum; differentiated instructional practice; grouping; pacing; and test construct.
Collaborative planning opportunities are essential to building staff capacity to address the needs of
diverse learners. Implementation of accommodations and modifications documented in a student’s IEP
are an expectation of all instructional staff, training is provided annually to relevant staff.
Use professional development days for teachers to share best practices in conference style
format.
Utilize the newly assigned position of middle school model department chairs to support
instructional practices.
Utilize annotated scoring tools for quarterly benchmarks to provide models for consistent
scoring and ideas for instruction.
Stress access to rigor within the general curriculum utilizing research-based instructional
practices and a focus on their effective implementation including the CCS- Application to
Students with Disabilities recommendations.
Utilize a reflective root-cause analysis to determine instructional factors impacting overall
achievement of students with disabilities participating in the general education curriculum

124
which may include: accessible curriculum; differentiated instructional practice; grouping;
pacing; and test construct.
HCPS continues to enhance instructional practices by embedding the concepts of ETMA throughout
professional development opportunities. This approach will help to build capacity of all staff. Schools
and individual teams of teachers engage in professional learning communities and utilize the Classroom
Focused Improvement Process (CFIP). CFIP provides a structure for teachers to engage in purposeful
dialogue about the needs of students and the strengths and weaknesses of current instructional practices.
In these conversations it is expected to consider the needs of all students and to set clear instructional
targets for all students. Teachers learn from one another and continue to refine and enhance their
repertoire of best practices.
Transition to the new Maryland Common Core State Curriculum
HCPS plans for transition to the MCCSC are being led by the curriculum office. Elementary teachers
will receive content-specific professional development over the course of several years as more is
released by MSDE. Secondary teachers will receive content-specific professional development from the
curriculum supervisor and the department chairperson at the school. Schools have a portion of the
responsibility and will be utilizing materials and resources shared during the 2011 and 2012 Educator
Effectiveness Academies. The HCPS plan for this transition can be found in Appendix A.
Transition to the new teacher and principal evaluation system
During the 2012-13 school year, HCPS plans to determine the needs for professional development of all
teachers and principals while engaged in the pilot process. Feedback is being collected from the pilot
participants through the use of a blog, surveys, and personal interviews. Throughout the year,
professional development opportunities are planned for those involved in the pilots and in preparation
for implementation for 2013-14. The HCPS plan for this transition can be found in Appendix B.

125
HCPS Teacher Induction Program
“Induction is a process—a comprehensive, coherent, and sustained professional development
process—that is organized by a school district to train, support, and retain new teachers and
seamlessly progresses them into a lifelong learning program.” (Wong, 2004, p.42)
This comprehensive support of new teachers is essential as we work to improve student achievement.
HCPS believes that new teachers need intentional support and mentoring during the first three years of
teaching. This intentional mentoring not only provides support during the beginning years, but it fosters
a sense of continued professional growth which will last throughout the teacher’s career. A program has
been established to support new teachers as they learn and grow at the start of their careers.
Listed below are the Induction Activities for Teachers New to HCPS.
Induction
Activity Focus/Content Dates
Professional
Development
Orientation
Conference
Professional Development designed for educators of
different experience levels.
Orient teachers to HCPS culture and expectations.
Plan for the first day, week, year.
Work with experienced educators in a “model
classroom” format.
Content-specific professional development.
Meaningful integration of technology in instruction
and usage/navigation of technology systems.
August
(6 days)
Workshops
throughout the
year
Develop knowledge and skills related to teaching
Topics include (but are not limited to):
Reflecting on teaching practice.
Preparing for parent conferences.
Implementing curriculum.
Managing a classroom.
Planning for active learning.
Assessing student performance.
Maintaining certification.
Teaching ELL students.
Co-teaching.
Meaningful integration of technology in
instruction.
Periodic evenings
throughout the school
year
New teacher
visitations
Observe experienced teachers teach the curriculum.
Conference and plan with experienced educators.
At least one time within
the first year
Elementary classroom
and special education
teachers visit classrooms
to observe integrated
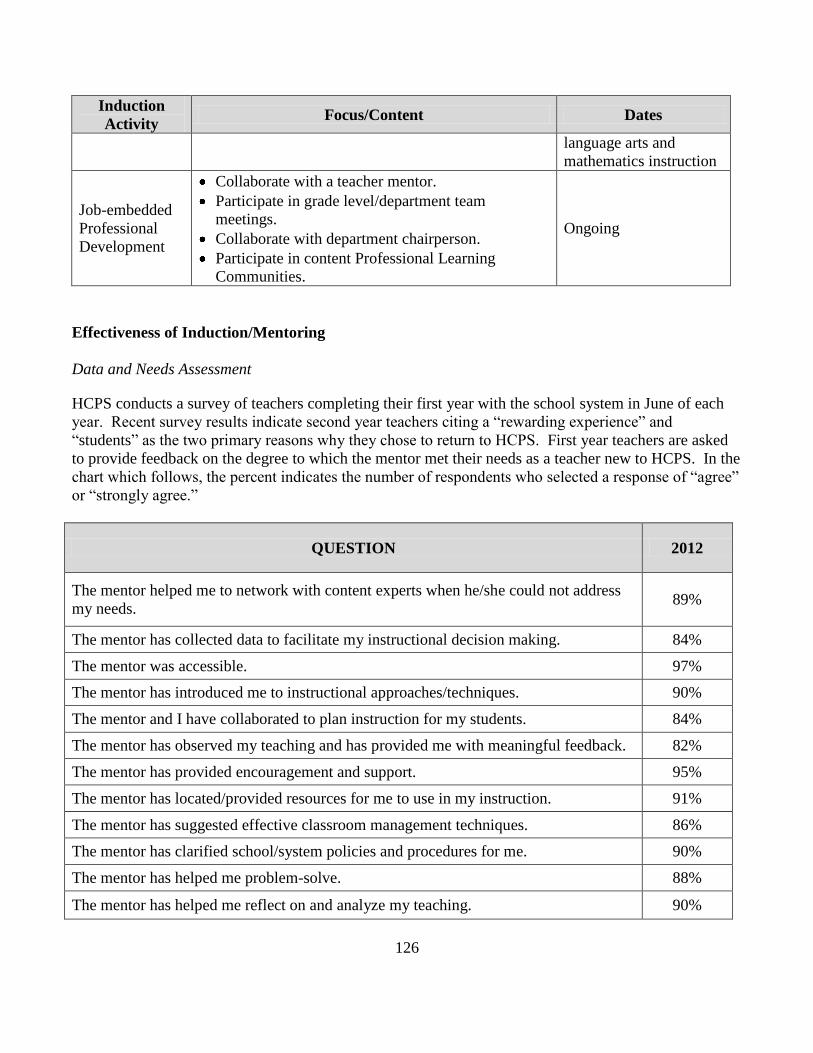
126
Induction
Activity Focus/Content Dates
language arts and
mathematics instruction
Job-embedded
Professional
Development
Collaborate with a teacher mentor.
Participate in grade level/department team
meetings.
Collaborate with department chairperson.
Participate in content Professional Learning
Communities.
Ongoing
Effectiveness of Induction/Mentoring
Data and Needs Assessment
HCPS conducts a survey of teachers completing their first year with the school system in June of each
year. Recent survey results indicate second year teachers citing a “rewarding experience” and
“students” as the two primary reasons why they chose to return to HCPS. First year teachers are asked
to provide feedback on the degree to which the mentor met their needs as a teacher new to HCPS. In the
chart which follows, the percent indicates the number of respondents who selected a response of “agree”
or “strongly agree.”
QUESTION 2012
The mentor helped me to network with content experts when he/she could not address
my needs. 89%
The mentor has collected data to facilitate my instructional decision making. 84%
The mentor was accessible. 97%
The mentor has introduced me to instructional approaches/techniques. 90%
The mentor and I have collaborated to plan instruction for my students. 84%
The mentor has observed my teaching and has provided me with meaningful feedback. 82%
The mentor has provided encouragement and support. 95%
The mentor has located/provided resources for me to use in my instruction. 91%
The mentor has suggested effective classroom management techniques. 86%
The mentor has clarified school/system policies and procedures for me. 90%
The mentor has helped me problem-solve. 88%
The mentor has helped me reflect on and analyze my teaching. 90%

127
A review of Maryland TELL Survey data reveals the following responses from teachers in their first
three years of teaching in HCPS:
QUESTION 2009 2011
Formally assigned a mentor. 91% 95%
Sessions specifically designed for new teachers. 91% 90%
Common planning time with other teachers. 25% 69%
Release time to observe other teachers. 49% 63%
Access to PLCs where I can discuss concerns. 54% 67%
Additional support I received as a new teacher improved my instructional
practice*. 65% 80%
Additional support I received as a new teacher helped me to impact my
students’ learning*. 64% 83%
*Percent indicates the number of respondents who selected a response of “agree” or “strongly agree.”
Analysis and Action
A review of recent survey data and suggested that not all probationary teachers were being given the
same type of support or to the same degree. In an effort to ensure that all probationary teachers have
equitable access to experiences with their mentors, HCPS worked in the 2011-12 school year to develop
Starting Strong: A Continuum of Experiences for Probationary Teachers. Mentors worked to identify a
set of six essential experiences:
Setting professional goals.
Planning and teaching collaboratively.
Observing instruction in others’ classrooms.
Developing a classroom management plan.
Participating in professional learning sessions.
Planning for and reflecting upon data from the mentor’s non-evaluative visits.
They then identified the responsibilities of both mentor and mentee with regard to these experiences and
suggested both best practices and resources. The product of their work was shared with school- and
central office-based administrators, who asked that considerations for administrators be added as well.
The final document was shared with all administrators at a June 2012 Leadership Academy and with all
new teachers at our August Orientation Conference. Mentors will log their participation in and time
with these experiences and will reflect on that data at our monthly meetings in an effort to improve
services to all probationary teachers.

128
Activities to Support New Teachers
The school system’s administrative staff is acutely aware of the need to support and retain
qualified teachers. To that end, the following is a listing of support provided to new hires:
1. Teacher Mentors (30 mentors) available in schools to work directly with teachers
a. Teach demonstration lessons
b. Assist in daily and unit planning and organization
c. Provide guidance in addressing classroom/behavior management
d. Guide the use of curricula and materials of instruction
e. Acclimate teachers to the protocols and procedures within their assigned school(s)
f. Address topics facing teachers new to teaching
Reporting student progress
Grading
Assessment
Parent conferencing/communication
Special education issues
2. Instructional Facilitators (17 Instructional Facilitators) available in schools to work directly with
teachers
a. Engage in informal and formal observations
b. Engage in the evaluation process
c. Guide the use of curricula and materials of instruction
d. Conduct demonstration lessons and model strategies and teaching techniques
e. Provide opportunities for teachers to visit other classrooms/teachers
f. Address topics facing teachers new to teaching
Reporting student progress
Grading
Assessment
Parent conferencing/communication
Special education issues
3. Content supervisors available to support professional growth within content areas
a. Provide curriculum guides, teacher texts, and other curricular materials
b. Complete informal instructional walk-throughs
c. Part of instructional appraisal team at the school level
d. Provide content-specific professional development as noted on the HCPS Professional
Development Calendar
e. Work with secondary Department Chairpersons to support teachers at the school level
f. Provide opportunities for teachers to visit other classrooms/teachers
4. Principals and Assistant Principals available in schools to work directly with teachers
a. Engage in informal and formal observation
b. Engage in the evaluation process
c. Guide the use of curricula and materials of instruction
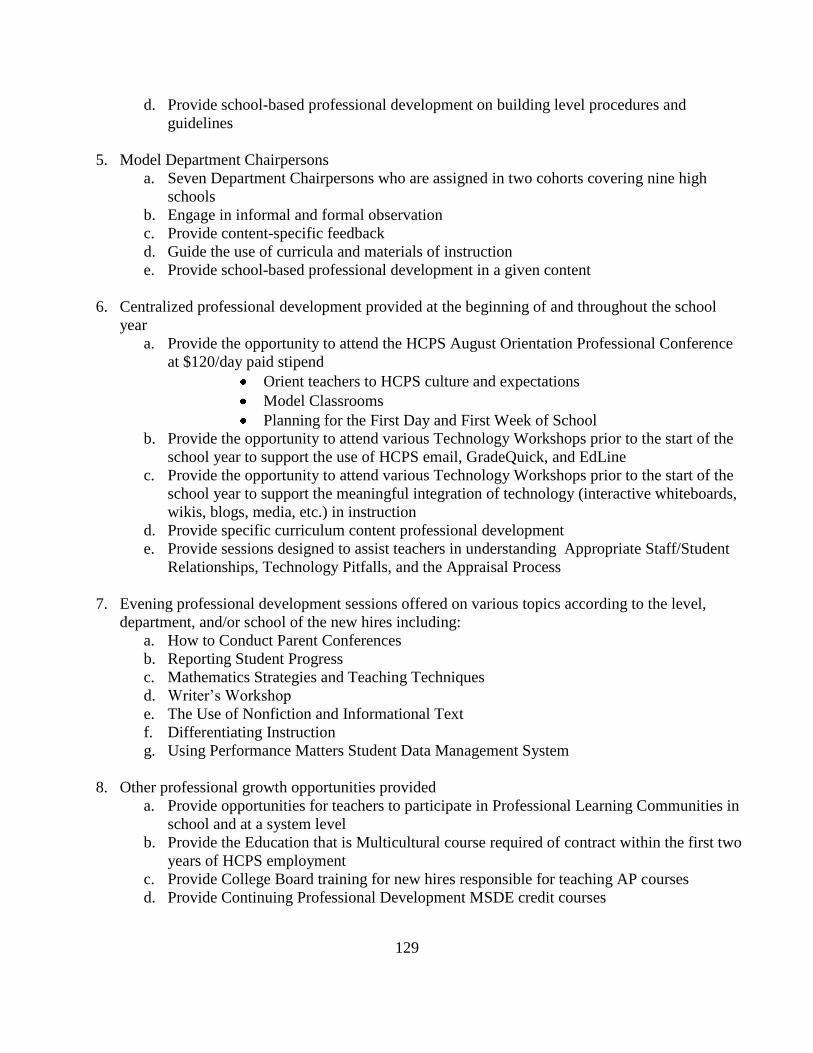
129
d. Provide school-based professional development on building level procedures and
guidelines
5. Model Department Chairpersons
a. Seven Department Chairpersons who are assigned in two cohorts covering nine high
schools
b. Engage in informal and formal observation
c. Provide content-specific feedback
d. Guide the use of curricula and materials of instruction
e. Provide school-based professional development in a given content
6. Centralized professional development provided at the beginning of and throughout the school
year
a. Provide the opportunity to attend the HCPS August Orientation Professional Conference
at $120/day paid stipend
Orient teachers to HCPS culture and expectations
Model Classrooms
Planning for the First Day and First Week of School
b. Provide the opportunity to attend various Technology Workshops prior to the start of the
school year to support the use of HCPS email, GradeQuick, and EdLine
c. Provide the opportunity to attend various Technology Workshops prior to the start of the
school year to support the meaningful integration of technology (interactive whiteboards,
wikis, blogs, media, etc.) in instruction
d. Provide specific curriculum content professional development
e. Provide sessions designed to assist teachers in understanding Appropriate Staff/Student
Relationships, Technology Pitfalls, and the Appraisal Process
7. Evening professional development sessions offered on various topics according to the level,
department, and/or school of the new hires including:
a. How to Conduct Parent Conferences
b. Reporting Student Progress
c. Mathematics Strategies and Teaching Techniques
d. Writer’s Workshop
e. The Use of Nonfiction and Informational Text
f. Differentiating Instruction
g. Using Performance Matters Student Data Management System
8. Other professional growth opportunities provided
a. Provide opportunities for teachers to participate in Professional Learning Communities in
school and at a system level
b. Provide the Education that is Multicultural course required of contract within the first two
years of HCPS employment
c. Provide College Board training for new hires responsible for teaching AP courses
d. Provide Continuing Professional Development MSDE credit courses

130
e. Encourage teachers to become involved in school and county committees, summer
curriculum writing, and summer professional development activities
Coordination of the Teacher Induction Program
The Coordinator of Teacher Induction is a member of the Office of Professional Development
and collaborates with the Coordinator of Leadership and Professional Development and the Executive
Directors of Elementary School, Middle School, and High School Performance. Deployment of teacher
mentors is directed by Central Office. HCPS mentors are released from the classroom and are full-time
mentors. Once assigned to each school based upon the total number of teachers to support -- both
tenured and probationary -- currently, mentors are now assigned to schools according to the number of
probationary teachers on staff. This is the result of budget cuts. HCPS used the COMAR regulations to
guide decisions about mentor assignments for 2012-13.
HCPS mentors are assigned to schools with the primary responsibility to support all probationary
teachers. Because the number of probationary teachers varies from school to school, some mentors are
assigned to one school, while others are assigned to two or three schools. Mentors also work with
teachers of plans of assistance, though their work in this regard is secondary to their work with
probationary teachers. Principals are asked to solicit support for teachers on plans of assistance from
other members of the instructional leadership team and from content supervisors and/or department
chairpersons.
Data regarding the delineation of probationary teachers and mentor support can be found in the
following chart:
Mentor Ratio 2012-13
1st Year
Teachers
2nd
Year
Teachers
3rd
year
teachers
Newly Hired
Experienced Teachers
Total # of
Teachers
Total # of
Mentors
M to T
Ratio
159 172 149 48 480 30 1:16
Mentor Identification and Training
Mentor positions are in the teacher category and fall under the negotiated contract with the Harford
County Education Association. Each spring the mentor job description is posted as a promotional
opportunity and follows the typical hiring process. As a part of the interview process, mentor candidates
are required to watch a DVD of a lesson and role play the conversation they would have with the
teacher. Interview teams are looking for approachability, knowledge of good instructional practice,
willingness to provide support, and a non-evaluative stance to comments and suggestions.

131
Mentors are provided with professional development geared to the relationships and interactions of this
unique position. Experience in the role is taken into consideration. Mentors in their 1st and 2
nd years in
the position have specialized training to teach the basic skills of coaching and mentoring. Experienced
mentors participate in on-going monthly professional development geared to enhance skills and
knowledge in coaching, content, and instructional practice. A cadre of mentors also attends the summer
MSDE Mentor Academy and participates in the online professional development which follows this
academy. Those who attend share the knowledge and skills gleaned from these academies with their
mentor colleagues.
Training for Central Office and School Based Administrators
Ongoing professional development and updates on the HCPS Teacher Induction Program occur
regularly. Principals will regularly attend professional development sessions held for the new teachers.
Leadership professional development schedules provide opportunity for periodical updates from the
Coordinator of Teacher Induction.
A survey is administered to all teachers completing their first year teaching for HCPS in May/June.
Data from this survey is shared and posted for all administrators to review. Content supervisors, school-
based administrators, and the Teacher Induction Committee are expected to review the data and consider
recommendations in evaluating the support provided to new teachers. Data will be shared with mentors
on October 25, 2012.
Special Teaching Considerations for New Teachers
Currently, HCPS does not have specific guidelines for teaching considerations for new teachers. The
COMAR guidelines have been reviewed and discussed with building administrators and many schools
are finding ways to support new teachers in the manner described. This is a change in thinking and in
some cases requires a different way of staffing and making teaching assignments. HCPS plans to
continue to review the guideline, engage in dialogue with building administrators, and review data from
the New Teacher Survey in an effort to provide support in this manner.

132
Persistently Dangerous Schools
No Child Left Behind Goal 4: All students will be educated in learning environments that are safe,
drug-free, and conducive to learning.
No Child Left Behind Indicator 4.1: The number of persistently dangerous schools, as
defined by the state.
NCLB requires states to identify persistently dangerous schools. In Maryland, a “persistently
dangerous” school means a school in which each year for a period of three consecutive school years
the total number of student suspensions for more than 10 days or expulsions equals two and one-half
percent (2½%) or more of the total number of students enrolled in the school, for any of the
following offenses: arson or fire; drugs; explosives; firearms; other guns; other weapons; physical
attack on a student; physical attack on a school system employee or other adult; and sexual assault.
Schools are placed into “persistently dangerous” status in a given school year based on their
suspension data in the prior year.
1. Where Persistently Dangerous Schools are identified, list the schools and describe what
steps are being taken by the school system to reverse this trend and prevent the
schools(s) from moving into probationary status.
No Harford County schools are identified as persistently dangerous.

133
Attendance
Based on the Examination of the Attendance Data:
1. Describe where challenges are evident. In your response, identify challenges in terms of
grade band(s) and subgroups.
High school attendance declined marginally for all students from 93.6 in 2010-11 to 93.4 in
2011-2012. All high school students and all high school subgroups except Asian students
and American Indian/Alaska native, failed to meet the AMO. Particular challenges exist
among Black/African American, Hispanic, two or more race, ELL and Special Education
populations.
Middle school attendance for all students continues to exceed the AMO of 95%. Subgroups
which fell short of the AMO include: Hispanic students, 94.9%; Black/African American
students, 94.8%; two or more races, 94.3%; Special Education, 93.7%; and FaRMS, 93.0;
and American Indian/Alaska Natives, 91.8%.
2. Describe the changes or adjustments that will be made along with the corresponding
resource allocations to ensure sufficient progress. Include timelines where appropriate.
(LEAs should include funding targeted to changes or adjustments in staffing, materials, or
other items for a particular program, initiative, or activity. The LEA should explain the
source of the funding as restricted or unrestricted. If the source is restricted IDEA, Title I
or ARRA funding – include the CFDA number, grant name, and the attributable
funds. Otherwise, identify the source as unrestricted and include attributable funds.)
Each Harford County Public School’s School Improvement Plan must address each area in
which it has failed to meet the AMO. Each School Improvement Team is required to
consider questions in analyzing school performance data as part of this process, including
those which could impact on attendance performance. All School Improvement Teams were
asked to include in their Plans strategies for reaching AMO in all areas including attendance.
Schools set targets for attendance that were to meet or exceed the AMO for all subgroups.
Some of the practices, programs, and strategies employed by schools include:
Investigating absences through parent contact.
Using school counselors and other services to provide interventions for individual
students.
Offering numerous academic interventions both during the day and through extended-
day and extended-year models to help students achieve academic success, remain on
track for graduation, and minimize frustration.
Mentoring programs.
Increasing student participation in programs of study with increased rigor and
relevance.
Training for faculty in Student Services Team referrals and processes.

134
In addition, at the high school level, HCPS has continued to develop and implement
programs which add relevance and appropriate to the high school course of study, such as
magnet programs (the Science and Math Academy at Aberdeen High School, The
International Baccalaureate at Edgewood High School, the Agricultural Sciences program at
North Harford High School, and CTE programs at Harford Technical High School) and
signature programs (the Bio-medical Sciences program at Bel Air High School and the
Homeland Security program at Joppatowne High School) and career pathways.

135
Graduation and Dropout Rates (4-Year Cohort)
No Child Left Behind Goal 5: All students will graduate from high school.
No Child Left Behind Indicator 5.1: The percentage of students who graduate each year
with a regular diploma.
No Child Left Behind Indicator 5.2: The percentage of students who drop out of school.
Graduation and dropout rates are now part of the Maryland School Progress Index.
Based on the Examination of Graduation and Dropout Rate Data:
1. Describe where challenges are evident. In your response, identify challenges in
terms of subgroups.
HCPS continues to work to increase the graduation rate for all students and student
subgroups. The graduation AMO of 87.41% was met for all students, but not met for the
Hispanic/Latino, Asian, and two or more races subgroups. These subgroups will require
particular attention either due to the percentage by which the subgroup fell short of the
AMO (Asian and two or more races subgroups) or the subgroup not making the AMO for
more than one year (Hispanic/Latino).
With regard to the dropout rate, HCPS’s greatest challenges are with the Black or African
American, Hispanic/Latino, Special Education, and FARMs subgroups.
2. Describe the changes or adjustments that will be made along with the corresponding
resource allocations to ensure sufficient progress. Include timelines where
appropriate. (LEAs should include funding targeted to changes or adjustments in
staffing, materials, or other items for a particular program, initiative, or activity. The
LEA should explain the source of the funding as restricted or unrestricted. If the
source is restricted IDEA, Title I or ARRA funding – include the CFDA number, grant
name, and the attributable funds. Otherwise, identify the source as unrestricted and
include attributable funds.)
The following 2012-2013 practices, programs, and strategies are in place to address
challenges and promote progress:
Identify and implement alternatives to suspensions based on appropriate data.
Implement school day and extended day learning opportunities for mentoring and
youth development programs.
Enhance the on-line course program and increase student participation.
Utilize career pathways as a means of managing programs of study for grades 9-
12 and as a mean of delivering required courses for 2012-2013.
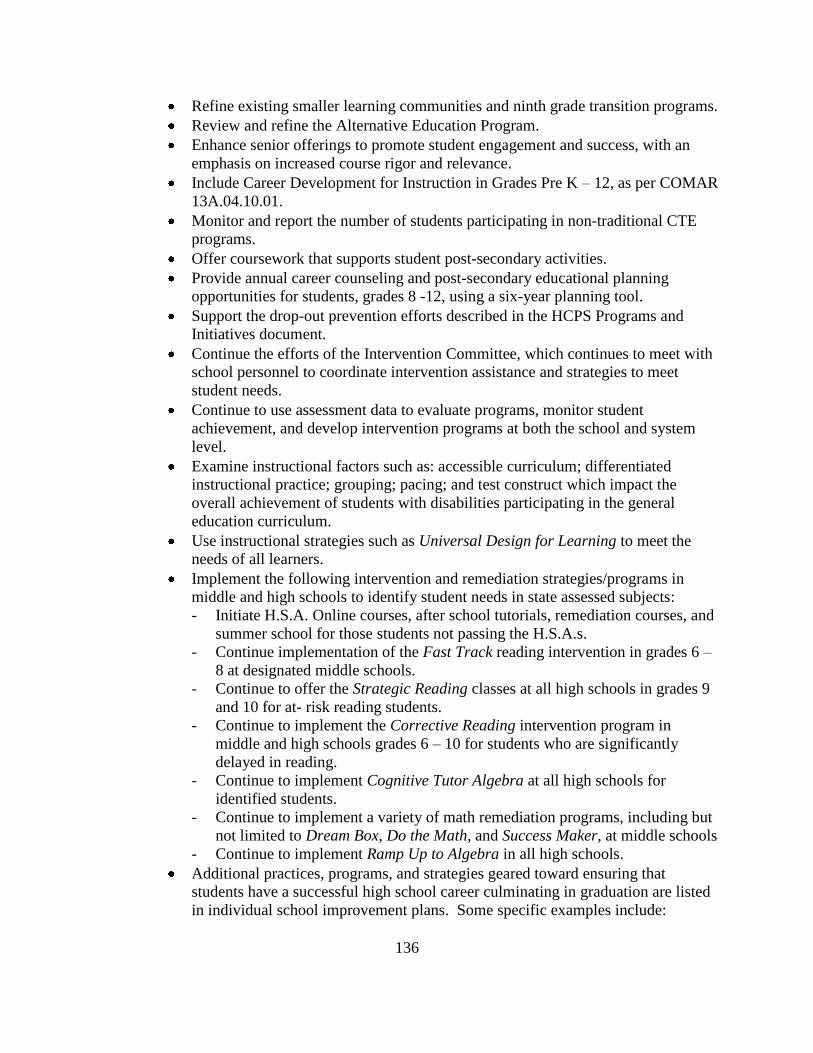
136
Refine existing smaller learning communities and ninth grade transition programs.
Review and refine the Alternative Education Program.
Enhance senior offerings to promote student engagement and success, with an
emphasis on increased course rigor and relevance.
Include Career Development for Instruction in Grades Pre K – 12, as per COMAR
13A.04.10.01.
Monitor and report the number of students participating in non-traditional CTE
programs.
Offer coursework that supports student post-secondary activities.
Provide annual career counseling and post-secondary educational planning
opportunities for students, grades 8 -12, using a six-year planning tool.
Support the drop-out prevention efforts described in the HCPS Programs and
Initiatives document.
Continue the efforts of the Intervention Committee, which continues to meet with
school personnel to coordinate intervention assistance and strategies to meet
student needs.
Continue to use assessment data to evaluate programs, monitor student
achievement, and develop intervention programs at both the school and system
level.
Examine instructional factors such as: accessible curriculum; differentiated
instructional practice; grouping; pacing; and test construct which impact the
overall achievement of students with disabilities participating in the general
education curriculum.
Use instructional strategies such as Universal Design for Learning to meet the
needs of all learners.
Implement the following intervention and remediation strategies/programs in
middle and high schools to identify student needs in state assessed subjects:
- Initiate H.S.A. Online courses, after school tutorials, remediation courses, and
summer school for those students not passing the H.S.A.s.
- Continue implementation of the Fast Track reading intervention in grades 6 –
8 at designated middle schools.
- Continue to offer the Strategic Reading classes at all high schools in grades 9
and 10 for at- risk reading students.
- Continue to implement the Corrective Reading intervention program in
middle and high schools grades 6 – 10 for students who are significantly
delayed in reading.
- Continue to implement Cognitive Tutor Algebra at all high schools for
identified students.
- Continue to implement a variety of math remediation programs, including but
not limited to Dream Box, Do the Math, and Success Maker, at middle schools
- Continue to implement Ramp Up to Algebra in all high schools.
Additional practices, programs, and strategies geared toward ensuring that
students have a successful high school career culminating in graduation are listed
in individual school improvement plans. Some specific examples include:
137
- Provide diverse opportunities for students to participate in both curricular and
extra-curricular activities.
- Implement a mentoring program for all students.
- Explore advocacy strategies for all students.
- Provide ninth grade support and transition academies.
- Provide before and after school help programs.
- Provide time periodically during the school day to provide students with the
opportunity to meet with teachers to secure make-up work and get additional
help.
- Schedule meetings for all students at risk of not graduating and their parents.
Develop graduation strategies using advisors, counselors, and counselors.
Explore the impact of post-secondary transition planning for students with
disabilities ages 14 and up to determine the connection to school completion,
post-secondary education and work.
Continue to implement systemic professional development to address state
priorities and master plan goals.

138
Race to the Top Scopes of Work
Section E: Turning Around Lowest Performing Schools
Narrative
In the Maryland State Department of Education’s (MSDE) Race to the Top (RTTT) application,
MSDE identifies 16 persistently lowest-achieving schools with whom they will work to turn
around student performance. Although Harford County Public Schools (HCPS) does not have
any schools identified as persistently low-achieving, there are schools engaged in the school
improvement process. These schools, listed in the chart below, have been supported through
both the operating budget and restricted funds to offer extended-day and -year programs to
students, to realign staff members, to administer the Teacher Capacity Needs Assessment
(TCNA), and to provide professional development opportunities for faculty, staff, and
administrators.
Level Harford County Public Schools
Focus Schools
Elementary William Paca Elementary School
Middle
Aberdeen Middle School
Edgewood Middle School
Havre de Grace Middle School
Magnolia Middle School
High
Aberdeen High School
Center for Alternative Education
Joppatowne High School
The Office of Compensatory Education has received Title I and School Improvement Funds to
address the needs HCPS Title I elementary schools in improvement. In an effort to focus much
needed resources to support secondary lowest-achieving schools, the RTTT Project Manager is
working with the Executive Directors of Secondary School Performance, the Executive Director
of Community Engagement and Cultural Proficiency, and the Coordinator of School
Improvement to plan and implement secondary school improvement initiatives during year two
of the RTTT grant.
Recognizing that there is a growing body of knowledge and best practices regarding effective
school improvement practices, the HCPS Coordinator of School Improvement will use lessons
learned through the State Breakthrough model and replicate those efforts in our secondary
schools. Some of these activities may include Positive Behavioral Interventions and Supports
(PBIS), Common Core Standards Initiative, Educational Instructional Improvement Academies
(EIIA), Classroom-focused Improvement Process (CFIP), Performance Matters, the new
Instructional Improvement System, and Science, Technology, Engineering, and Mathematics
(STEM). After reviewing School Improvement Plans during year two of the grant, activities will

139
be implemented in year three. After RTTT funding ends, HCPS will continue to identify
resources to support targeted interventions and supports for school in improvement.
Projects and tasks accomplished during Year 2 of RTTT:
Planned and implemented a hybrid online MSDE Universal Design for Learning course
targeting secondary school teachers working in schools on HCPS identified list.
Applied UDL principles to the Common Core Framework for SY 2012-13 instructional
planning.
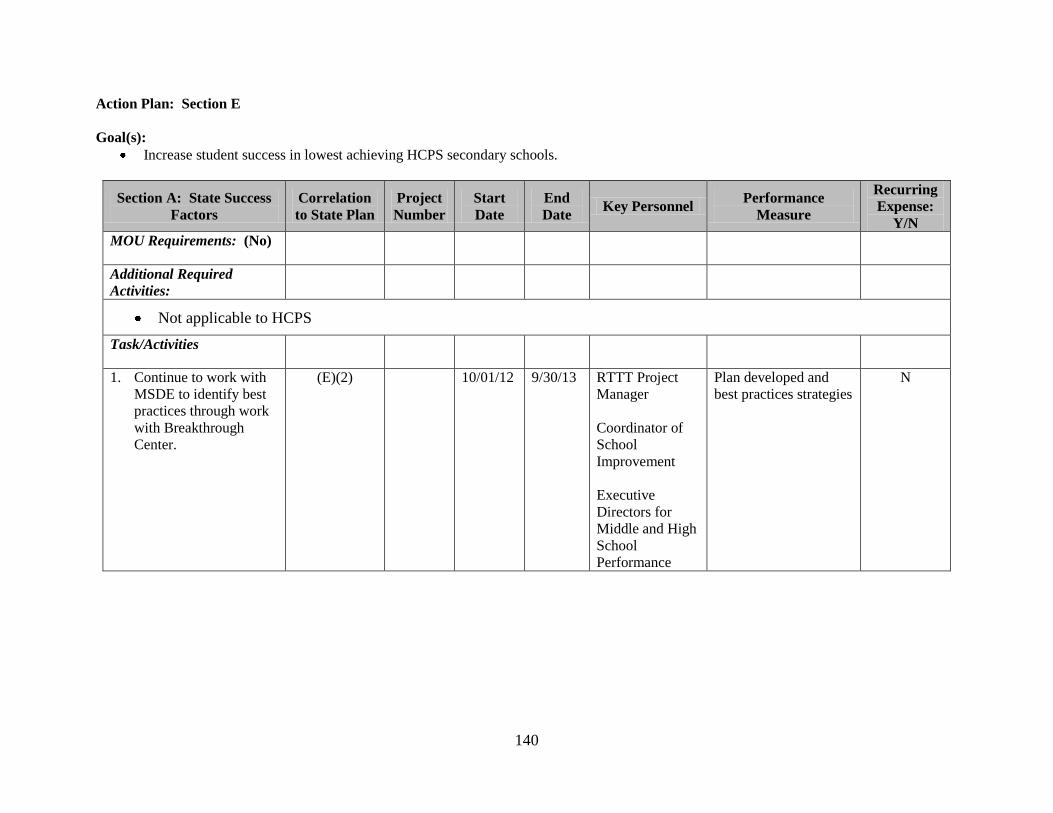
140
Action Plan: Section E
Goal(s):
Increase student success in lowest achieving HCPS secondary schools.
Section A: State Success
Factors
Correlation
to State Plan
Project
Number
Start
Date
End
Date Key Personnel
Performance
Measure
Recurring
Expense:
Y/N
MOU Requirements: (No)
Additional Required
Activities:
Not applicable to HCPS
Task/Activities
1. Continue to work with
MSDE to identify best
practices through work
with Breakthrough
Center.
(E)(2) 10/01/12 9/30/13 RTTT Project
Manager
Coordinator of
School
Improvement
Executive
Directors for
Middle and High
School
Performance
Plan developed and
best practices strategies
N

141
Section A: State Success
Factors
Correlation
to State Plan
Project
Number
Start
Date
End
Date Key Personnel
Performance
Measure
Recurring
Expense:
Y/N
2. Implement best practice
activities related to
Universal Design for
Learning and Co-
Teaching as part of
school improvement
plans and in support of
Common Core.
(E)(2) 10/01/12 9/30/13 RTTT Project
Manager
Coordinator of
School
Improvement
Executive
Directors for
Middle and High
School
Performance
Secondary
School Principals
Implementation of
activities based on best
practices
Increased student
achievement in
secondary schools
including AYP and
other indicators to be
determined
Y
3. Continue to provide
ongoing professional
development for focus
schools through the
School Improvement
Planning process in
planning and
developing instruction
using the Common
Core framework that
is anchored in the
core principles of
Universal Design for
Learning.
(E)(2) 10/01/12 9/30/13 RTTT Project
Manager
Coordinator of
School
Improvement
Executive
Directors for
Middle and High
School
Performance
Secondary
School Principals
Implementation of
activities based on best
practices.
Increased student
achievement in
secondary schools
including AYP and
other indicators to be
determined.
Y
Year 4 Goal(s):
Increase student success in lowest achieving HCPS secondary schools.

Appendix A
142
Our School’s Transition Plan for the New Maryland Common Core State Curriculum
*Revised from MSDE, June 2012*
By June 2013, EEA teams will:
Outcome #1: Facilitate opportunities for school staff to navigate the curriculum toolkits using English Language Arts model units
and model lessons and resources to support CCSC implementation.
Outcome #2: Facilitate opportunities for school staff to navigate the curriculum toolkits using Mathematics model units and model
lessons and resources, to support CCSC implementation.
Outcome #3: Create and deliver professional development that increases the skills and knowledge of school staff in the history/social
studies, science and technology literacy standards to support CCSC implementation.
Outcome #4: Create and deliver professional development that increases the skills and knowledge of school staff in the Maryland
STEM Standards of Practice and Frameworks.
Outcome #5: Provide to school staff PARCC assessment development, design and timeline as available.
Outcome #
What specific
activities are
we going to
include?
Who are the
identified faculty
members
involved?
What resources
are needed to
implement?
Who is lead team
member
responsible?
What is time
frame?
How will
outcome be
measured?
5 To be determined by Central Office
1-4
Universal
Design for
Learning
Principals
Instructional
Facilitators
Assistant
Principals
Central Office
Administrators
First two
modules of the
UDL course
Office of
Curriculum,
Instruction, and
Assessment
September 5, 2012 Course
Completion
1-4
Universal
Design for
Learning
Teachers
First two
modules of the
UDL course
EEA Team End of Semester I Course
Completion

Appendix A
143
Outcome #
What specific
activities are
we going to
include?
Who are the
identified faculty
members
involved?
What resources
are needed to
implement?
Who is lead team
member
responsible?
What is time
frame?
How will
outcome be
measured?
1-4 Instructional
Shifts
Principals
Instructional
Facilitators
Central Office
Professional
Development
Plan
Office of
Curriculum,
Instruction, and
Assessment
October 3, 2012
Educational
Leadership
Agenda
1-4 Instructional
Shifts
Assistant
Principals
Central Office
Professional
Development
Plan
Office of
Curriculum,
Instruction, and
Assessment
October 10, 2012
Educational
Leadership
Agenda
1-4
Common Core
Curriculum
Updates
Administrators
Central Office
Professional
Development
Plan
Office of
Curriculum,
Instruction, and
Assessment
SY 2012-13
Educational
Leadership
Agenda
3
Addressing the
Literacy
Standards
Administrators
Central Office
Professional
Development
Plan
Office of
Curriculum,
Instruction, and
Assessment
SY 2012-13
Education
Leadership
Agendas
1-4
Linking
Literacy,
Mathematics,
and STEM
Standards of
Practice
All faculty and
staff
Central Office
Professional
Development
Plan
Curriculum,
Instruction, and
Assessment
EEA Team
September/October
Faculty Meeting
20-30 minutes
completed prior to
November 2
Faculty Agenda
Suggestions for schools
By second semester, teachers should become familiar with the curriculum toolkits.
Any activities from the 2011-12 Academy that you didn’t get a chance to do during the 2011-12 school year.
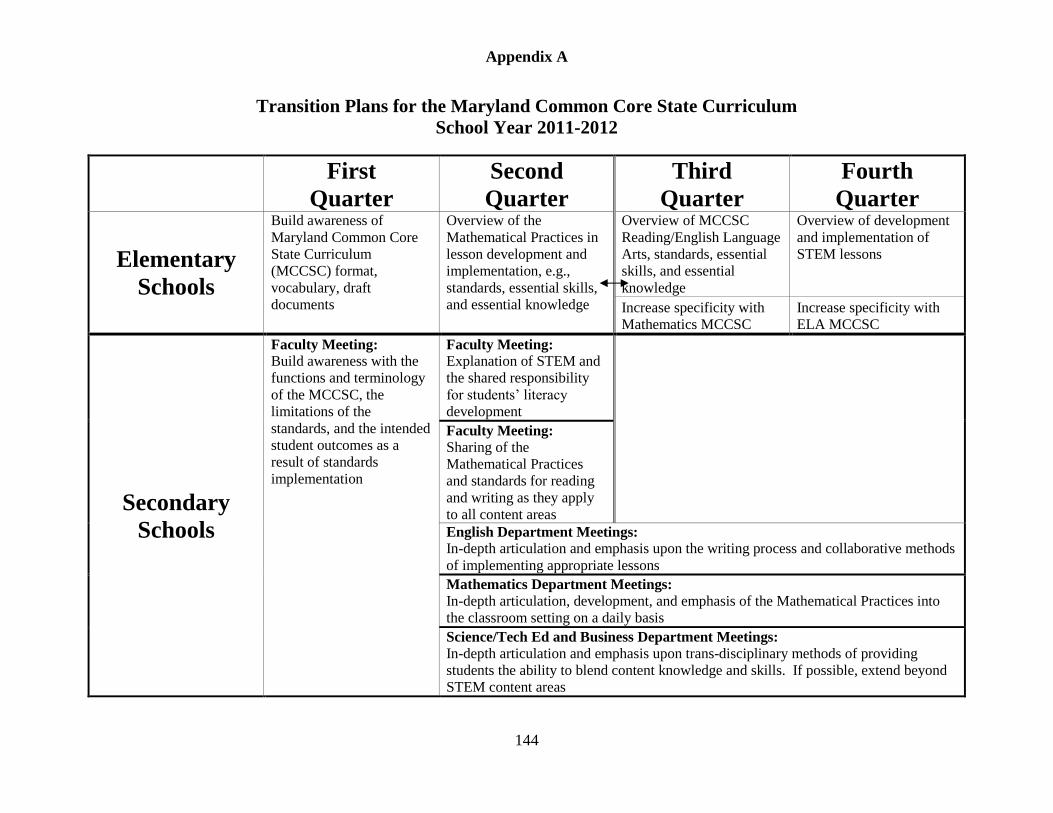
Appendix A
144
Transition Plans for the Maryland Common Core State Curriculum
School Year 2011-2012
First
Quarter
Second
Quarter
Third
Quarter
Fourth
Quarter
Elementary
Schools
Build awareness of
Maryland Common Core
State Curriculum
(MCCSC) format,
vocabulary, draft
documents
Overview of the
Mathematical Practices in
lesson development and
implementation, e.g.,
standards, essential skills,
and essential knowledge
Overview of MCCSC
Reading/English Language
Arts, standards, essential
skills, and essential
knowledge
Overview of development
and implementation of
STEM lessons
Increase specificity with
Mathematics MCCSC
Increase specificity with
ELA MCCSC
Secondary
Schools
Faculty Meeting: Build awareness with the
functions and terminology
of the MCCSC, the
limitations of the
standards, and the intended
student outcomes as a
result of standards
implementation
Faculty Meeting: Explanation of STEM and
the shared responsibility
for students’ literacy
development
Faculty Meeting: Sharing of the
Mathematical Practices
and standards for reading
and writing as they apply
to all content areas
English Department Meetings: In-depth articulation and emphasis upon the writing process and collaborative methods
of implementing appropriate lessons
Mathematics Department Meetings: In-depth articulation, development, and emphasis of the Mathematical Practices into
the classroom setting on a daily basis
Science/Tech Ed and Business Department Meetings: In-depth articulation and emphasis upon trans-disciplinary methods of providing
students the ability to blend content knowledge and skills. If possible, extend beyond
STEM content areas
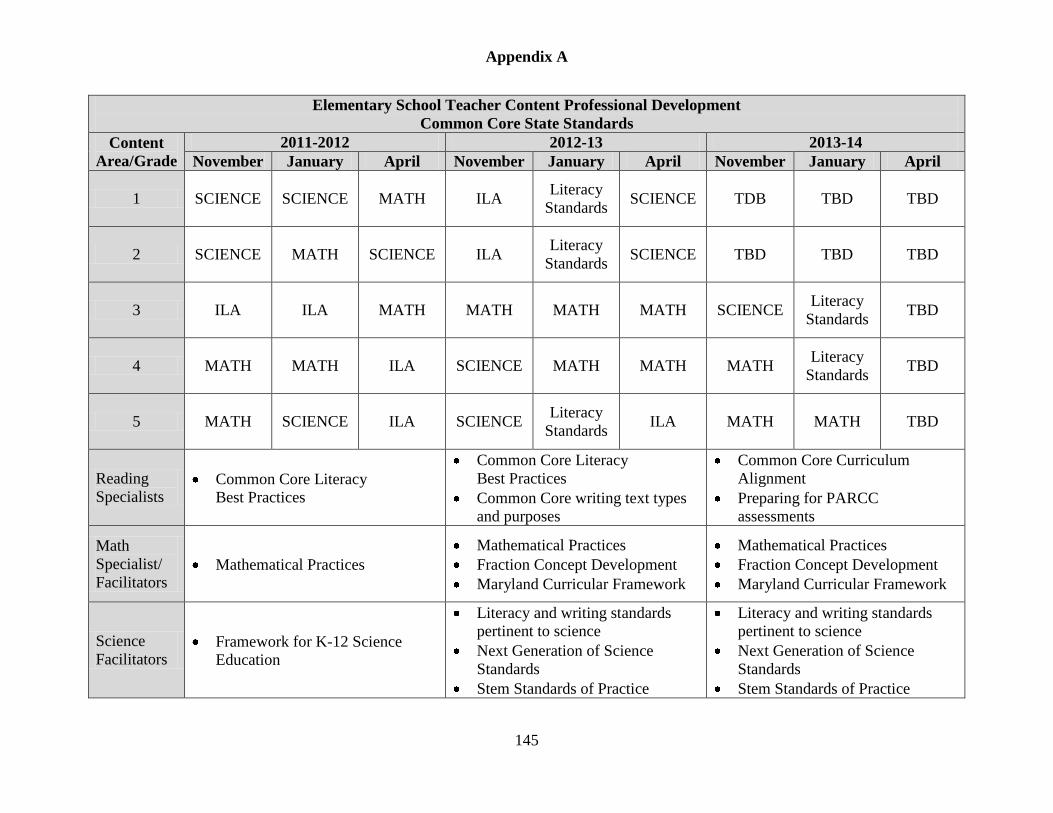
Appendix A
145
Elementary School Teacher Content Professional Development
Common Core State Standards
Content
Area/Grade
2011-2012 2012-13 2013-14
November January April November January April November January April
1 SCIENCE SCIENCE MATH ILA Literacy
Standards SCIENCE TDB TBD TBD
2 SCIENCE MATH SCIENCE ILA Literacy
Standards SCIENCE TBD TBD TBD
3 ILA ILA MATH MATH MATH MATH SCIENCE Literacy
Standards TBD
4 MATH MATH ILA SCIENCE MATH MATH MATH Literacy
Standards TBD
5 MATH SCIENCE ILA SCIENCE Literacy
Standards ILA MATH MATH TBD
Reading
Specialists Common Core Literacy
Best Practices
Common Core Literacy
Best Practices
Common Core writing text types
and purposes
Common Core Curriculum
Alignment
Preparing for PARCC
assessments
Math
Specialist/
Facilitators Mathematical Practices
Mathematical Practices
Fraction Concept Development
Maryland Curricular Framework
Mathematical Practices
Fraction Concept Development
Maryland Curricular Framework
Science
Facilitators Framework for K-12 Science
Education
Literacy and writing standards
pertinent to science
Next Generation of Science
Standards
Stem Standards of Practice
Literacy and writing standards
pertinent to science
Next Generation of Science
Standards
Stem Standards of Practice

Appendix A
146
Middle School Teacher Content Professional Development
Common Core State Standards
Content
Area/Grade 2011-2012 2012-13 2013-14
ILA/English
Teachers
Close reading of literary text
Text analysis and discussion
Supporting arguments
Close reading/analysis of literary
non-fiction texts
Writing arguments, explanatory
texts, and narratives
English
Department
Chairs
Lesson planning using authentic
literacy practices
Literary non-fiction texts and
model lesson plans
Writing skill sequence and model
essays
Mathematics
Teachers Mathematical Practices Mathematical Practices
Mathematical Practices
Ratio and Proportionality
Mathematics
Department
Chairs Mathematical Practices
Mathematical Practices
Maryland Curricular Framework
Mathematical Practices
Maryland Curricular Framework
Ratio and Proportionality
Science
Teachers Framework for K-12 Science
Education
Literacy in History/Social Studies,
Science, and Technical
Common Core Writing Standards
Next Generation of Science
Standards
Stem Standards of Practice
Literacy and writing standards
pertinent to science
Next Generation of Science
Standards
Stem Standards of Practice
Science
Department
Chairs
Framework for K-12 Science
Education
Literacy in History/Social Studies,
Science, and Technical
Common Core Writing Standards
Next Generation of Science
Standards
Stem Standards of Practice
Literacy and writing standards
pertinent to science
Next Generation of Science
Standards
Stem Standards of Practice
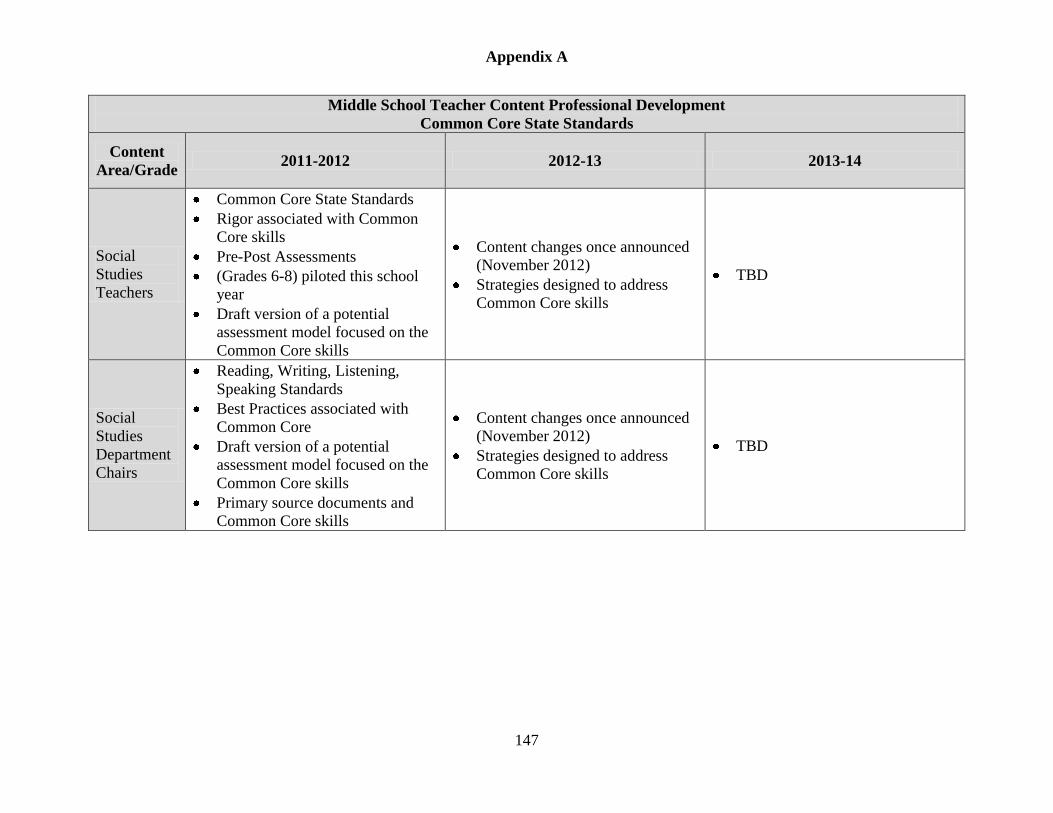
Appendix A
147
Middle School Teacher Content Professional Development
Common Core State Standards
Content
Area/Grade 2011-2012 2012-13 2013-14
Social
Studies
Teachers
Common Core State Standards
Rigor associated with Common
Core skills
Pre-Post Assessments
(Grades 6-8) piloted this school
year
Draft version of a potential
assessment model focused on the
Common Core skills
Content changes once announced
(November 2012)
Strategies designed to address
Common Core skills
TBD
Social
Studies
Department
Chairs
Reading, Writing, Listening,
Speaking Standards
Best Practices associated with
Common Core
Draft version of a potential
assessment model focused on the
Common Core skills
Primary source documents and
Common Core skills
Content changes once announced
(November 2012)
Strategies designed to address
Common Core skills
TBD

Appendix A
148
High School Teacher Content Professional Development
Common Core State Standards
Content
Area/Grade 2011-2012 2012-13 2013-14
ILA/English
Teachers
Close reading of literary text
Text analysis and discussion
Supporting arguments
Close reading/analysis of literary
non-fiction texts
Writing arguments, explanatory
texts, and narratives
English
Department
Chairs
Lesson planning using authentic
literacy practices
Literary non-fiction texts and
model lesson plans
Writing skill sequence and model
essays
Mathematics
Teachers Mathematical Practices Mathematical Practices
Mathematical Practices
Explanation, Justification, and
Proof
Mathematics
Department
Chairs Mathematical Practices
Mathematical Practices
Maryland Curricular Framework
Mathematical Practices
Maryland Curricular Framework
Explanation, Justification, and
Proof
Science
Teachers Framework for K-12 Science
Education
Literacy in History/Social Studies,
Science, and Technical
Common Core writing standards
Next Generation of Science
Standards
Stem Standards of Practice
Literacy and writing standards
pertinent to science
Next Generation of Science
Standards
Stem Standards of Practice
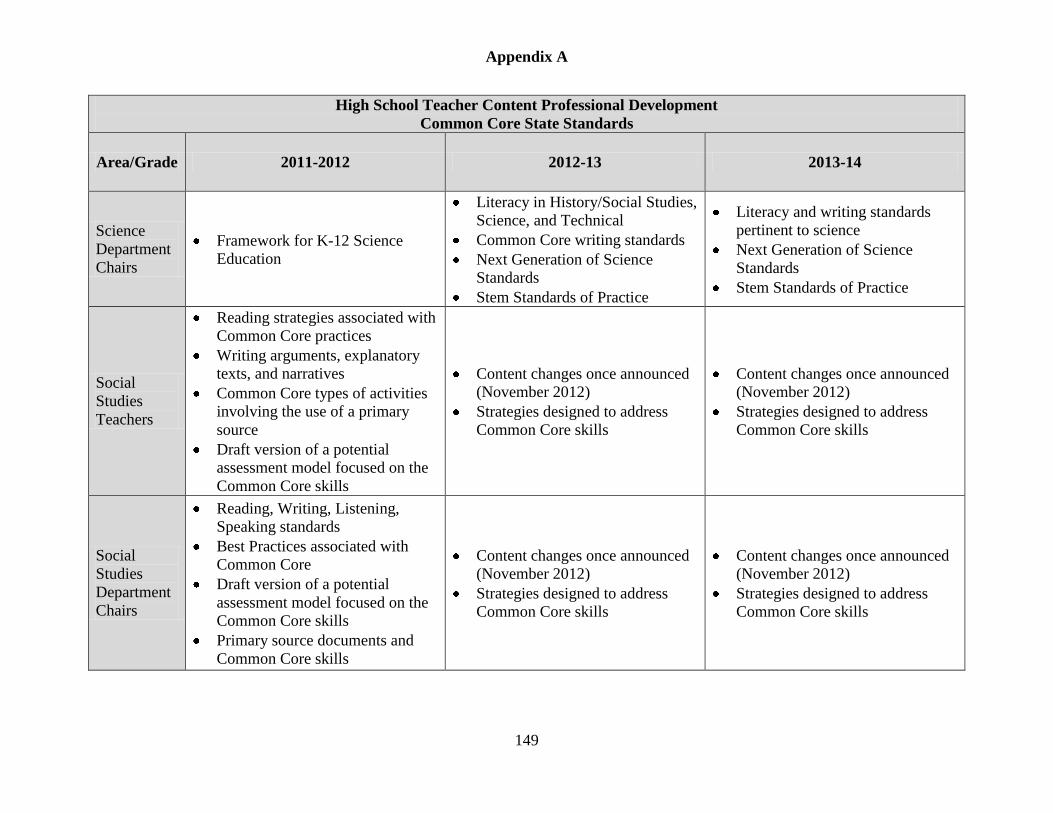
Appendix A
149
High School Teacher Content Professional Development
Common Core State Standards
Area/Grade 2011-2012 2012-13 2013-14
Science
Department
Chairs
Framework for K-12 Science
Education
Literacy in History/Social Studies,
Science, and Technical
Common Core writing standards
Next Generation of Science
Standards
Stem Standards of Practice
Literacy and writing standards
pertinent to science
Next Generation of Science
Standards
Stem Standards of Practice
Social
Studies
Teachers
Reading strategies associated with
Common Core practices
Writing arguments, explanatory
texts, and narratives
Common Core types of activities
involving the use of a primary
source
Draft version of a potential
assessment model focused on the
Common Core skills
Content changes once announced
(November 2012)
Strategies designed to address
Common Core skills
Content changes once announced
(November 2012)
Strategies designed to address
Common Core skills
Social
Studies
Department
Chairs
Reading, Writing, Listening,
Speaking standards
Best Practices associated with
Common Core
Draft version of a potential
assessment model focused on the
Common Core skills
Primary source documents and
Common Core skills
Content changes once announced
(November 2012)
Strategies designed to address
Common Core skills
Content changes once announced
(November 2012)
Strategies designed to address
Common Core skills
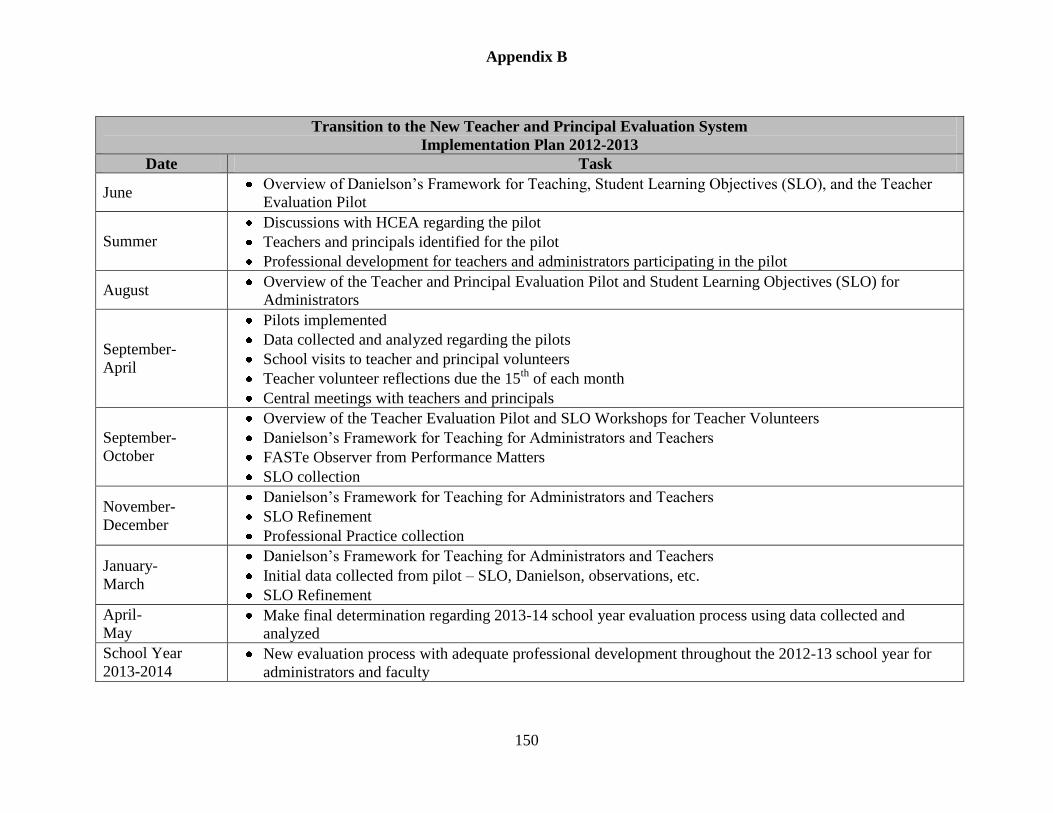
Appendix B
150
Transition to the New Teacher and Principal Evaluation System
Implementation Plan 2012-2013
Date Task
June Overview of Danielson’s Framework for Teaching, Student Learning Objectives (SLO), and the Teacher
Evaluation Pilot
Summer
Discussions with HCEA regarding the pilot
Teachers and principals identified for the pilot
Professional development for teachers and administrators participating in the pilot
August Overview of the Teacher and Principal Evaluation Pilot and Student Learning Objectives (SLO) for
Administrators
September-
April
Pilots implemented
Data collected and analyzed regarding the pilots
School visits to teacher and principal volunteers
Teacher volunteer reflections due the 15th
of each month
Central meetings with teachers and principals
September-
October
Overview of the Teacher Evaluation Pilot and SLO Workshops for Teacher Volunteers
Danielson’s Framework for Teaching for Administrators and Teachers
FASTe Observer from Performance Matters
SLO collection
November-
December
Danielson’s Framework for Teaching for Administrators and Teachers
SLO Refinement
Professional Practice collection
January-
March
Danielson’s Framework for Teaching for Administrators and Teachers
Initial data collected from pilot – SLO, Danielson, observations, etc.
SLO Refinement
April-
May Make final determination regarding 2013-14 school year evaluation process using data collected and
analyzed
School Year
2013-2014 New evaluation process with adequate professional development throughout the 2012-13 school year for
administrators and faculty

151
List of Tables
Table
Number Table Name
1.1A Current Year Variance
1.1B Prior Year Variance Table (Comparison of Prior Year Expenditures)
2.1 Maryland School Assessment Performance Results – Reading –
Elementary
2.2 Maryland School Assessment Performance Results – Read – Middle
2.3 Maryland High School Assessment Performance Results – Reading –
High (English II)
2.4 Maryland School Assessment Performance Results – Math –
Elementary
2.5 Maryland School Assessment Performance Results – Math – Middle
2.6 Maryland High School Assessment Performance Results – Math –
High (Algebra/Data Analysis)
2.7 Maryland School Assessment Performance Results – Science –
Elementary (Grade 5)
2.8 Maryland School Assessment Performance Results – Science –
Middle (Grade 8)
2.9 Maryland High School Assessment Performance Results – Science –
High (Biology)
3.1 HSA Test Participation and Status – English 2011 (Grade 10)
3.2 HSA Test Participation and Status – English 2011 (Grade 11)
3.3 HSA Test Participation and Status – English 2011 (Grade 12)
3.4 HSA Test Participation and Status – Algebra/Data Analysis
(Grade 10)
3.5 HSA Test Participation and Status – Algebra/Data Analysis
(Grade 11)
3.6 HSA Test Participation and Status – Algebra/Data Analysis
(Grade 12)
3.7 HSA Test Participation and Status – Biology (Grade 10)
3.8 HSA Test Participation and Status – Biology (Grade 11)
3.9 HSA Test Participation and Status – Biology (Grade 12)
3.10 HSA Test Participation and Status – Government (Grade 10)
3.11 HSA Test Participation and Status – Government (Grade 11)
3.12 HSA Test Participation and Status – Government (Grade 12)
4.1 Four-Year Cohort Graduation Rate
4.2 Four-Year Cohort Dropout Rate
5.1 Attendance Rates
6.1 Percentage of Core Academic Subject Classes Taught by Highly
Qualified Teachers (HQT)
6.2
Percentage of Core Academic Subject Classes Taught by Highly
Qualified Teachers (HQT) in Title I Schools Funded with AARA
Funds
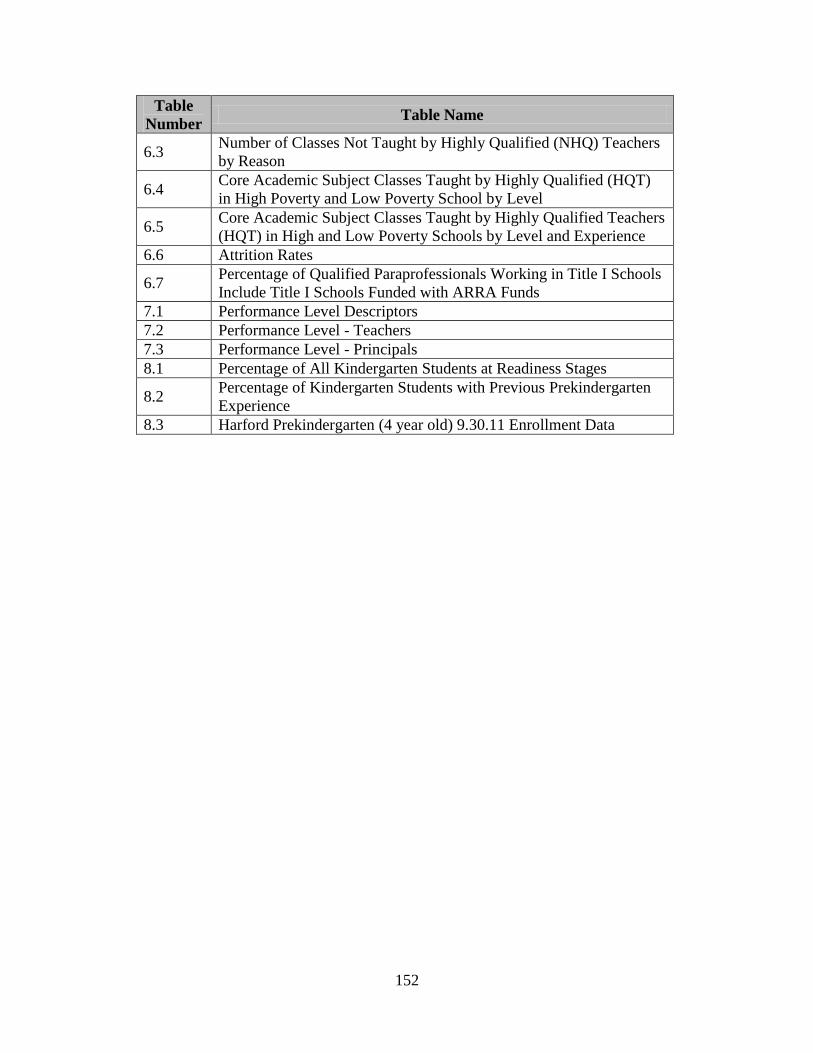
152
Table
Number Table Name
6.3 Number of Classes Not Taught by Highly Qualified (NHQ) Teachers
by Reason
6.4 Core Academic Subject Classes Taught by Highly Qualified (HQT)
in High Poverty and Low Poverty School by Level
6.5 Core Academic Subject Classes Taught by Highly Qualified Teachers
(HQT) in High and Low Poverty Schools by Level and Experience
6.6 Attrition Rates
6.7 Percentage of Qualified Paraprofessionals Working in Title I Schools
Include Title I Schools Funded with ARRA Funds
7.1 Performance Level Descriptors
7.2 Performance Level - Teachers
7.3 Performance Level - Principals
8.1 Percentage of All Kindergarten Students at Readiness Stages
8.2 Percentage of Kindergarten Students with Previous Prekindergarten
Experience
8.3 Harford Prekindergarten (4 year old) 9.30.11 Enrollment Data
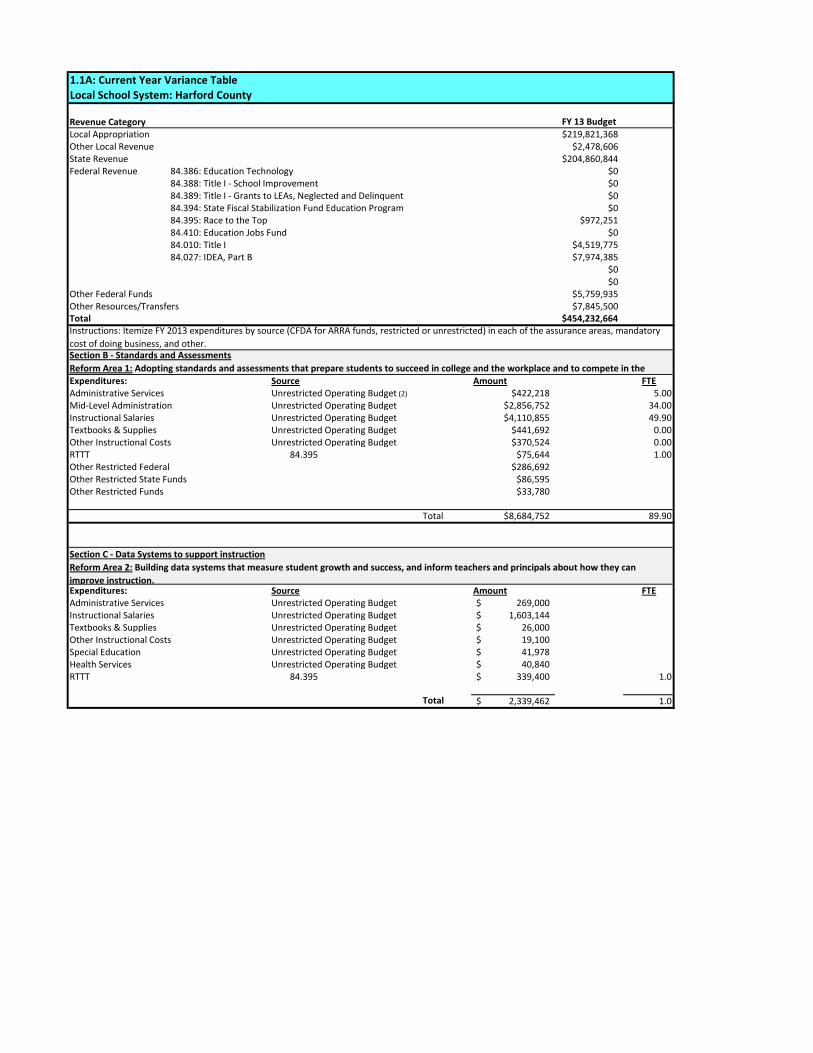
1.1A: Current Year Variance Table
Local School System: Harford County
Revenue CategoryLocal Appropriation $219,821,368Other Local Revenue $2,478,606State Revenue $204,860,844Federal Revenue 84.386: Education Technology $0
84.388: Title I - School Improvement $084.389: Title I - Grants to LEAs, Neglected and Delinquent $084.394: State Fiscal Stabilization Fund Education Program $084.395: Race to the Top $972,25184.410: Education Jobs Fund $084.010: Title I $4,519,77584.027: IDEA, Part B $7,974,385
$0$0
Other Federal Funds $5,759,935Other Resources/Transfers $7,845,500Total $454,232,664
Expenditures: Source Amount FTEAdministrative Services Unrestricted Operating Budget (2) $422,218 5.00Mid-Level Administration Unrestricted Operating Budget $2,856,752 34.00Instructional Salaries Unrestricted Operating Budget $4,110,855 49.90Textbooks & Supplies Unrestricted Operating Budget $441,692 0.00Other Instructional Costs Unrestricted Operating Budget $370,524 0.00RTTT 84.395 $75,644 1.00Other Restricted Federal $286,692Other Restricted State Funds $86,595Other Restricted Funds $33,780
Total $8,684,752 89.90
Expenditures: Source Amount FTEAdministrative Services Unrestricted Operating Budget 269,000$ Instructional Salaries Unrestricted Operating Budget 1,603,144$ Textbooks & Supplies Unrestricted Operating Budget 26,000$ Other Instructional Costs Unrestricted Operating Budget 19,100$ Special Education Unrestricted Operating Budget 41,978$ Health Services Unrestricted Operating Budget 40,840$ RTTT 84.395 339,400$ 1.0
Total 2,339,462$ 1.0
Section C - Data Systems to support instruction
Reform Area 2: Building data systems that measure student growth and success, and inform teachers and principals about how they can
improve instruction.
Section B - Standards and Assessments
Reform Area 1: Adopting standards and assessments that prepare students to succeed in college and the workplace and to compete in the
FY 13 Budget
Instructions: Itemize FY 2013 expenditures by source (CFDA for ARRA funds, restricted or unrestricted) in each of the assurance areas, mandatory
cost of doing business, and other.
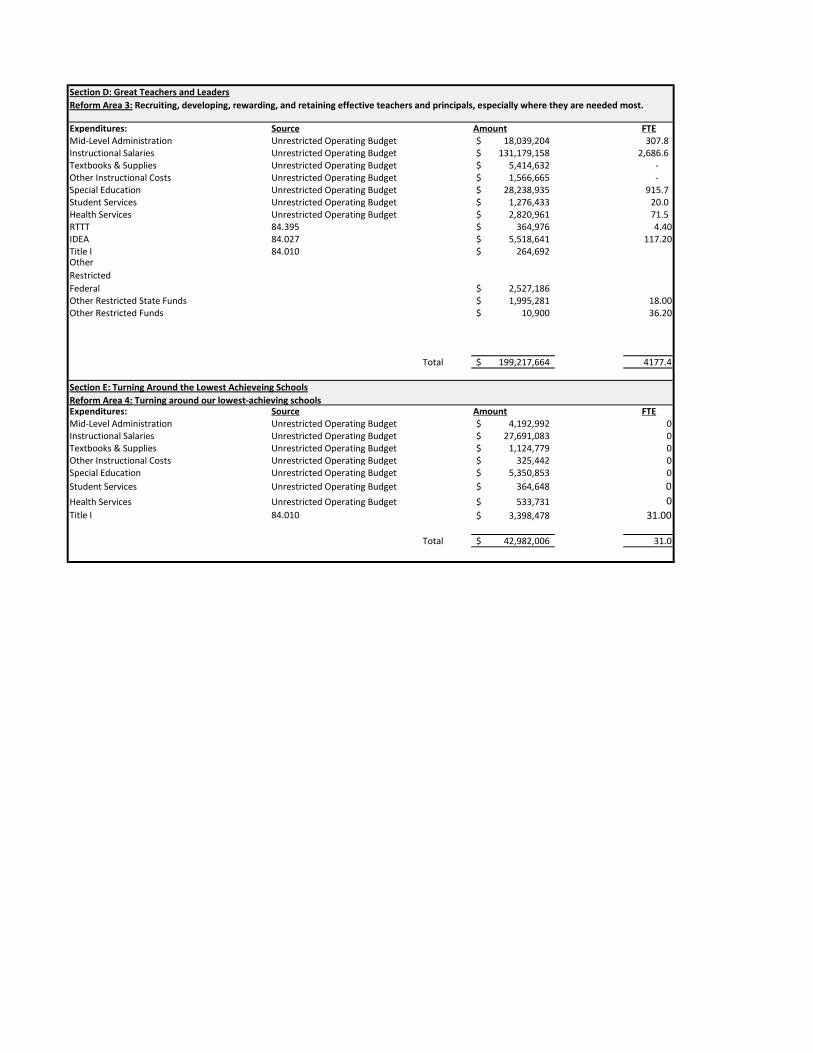
Expenditures: Source Amount FTEMid-Level Administration Unrestricted Operating Budget 18,039,204$ 307.8 Instructional Salaries Unrestricted Operating Budget 131,179,158$ 2,686.6 Textbooks & Supplies Unrestricted Operating Budget 5,414,632$ - Other Instructional Costs Unrestricted Operating Budget 1,566,665$ - Special Education Unrestricted Operating Budget 28,238,935$ 915.7 Student Services Unrestricted Operating Budget 1,276,433$ 20.0 Health Services Unrestricted Operating Budget 2,820,961$ 71.5 RTTT 84.395 364,976$ 4.40IDEA 84.027 5,518,641$ 117.20Title I 84.010 264,692$ Other
Restricted
Federal 2,527,186$ Other Restricted State Funds 1,995,281$ 18.00Other Restricted Funds 10,900$ 36.20
Total 199,217,664$ 4177.4
Expenditures: Source Amount FTEMid-Level Administration Unrestricted Operating Budget 4,192,992$ 0Instructional Salaries Unrestricted Operating Budget 27,691,083$ 0Textbooks & Supplies Unrestricted Operating Budget 1,124,779$ 0Other Instructional Costs Unrestricted Operating Budget 325,442$ 0Special Education Unrestricted Operating Budget 5,350,853$ 0
Student Services Unrestricted Operating Budget 364,648$ 0
Health Services Unrestricted Operating Budget 533,731$ 0
Title I 84.010 3,398,478$ 31.00
Total 42,982,006$ 31.0
Section D: Great Teachers and Leaders
Reform Area 3: Recruiting, developing, rewarding, and retaining effective teachers and principals, especially where they are needed most.
Section E: Turning Around the Lowest Achieveing Schools
Reform Area 4: Turning around our lowest-achieving schools
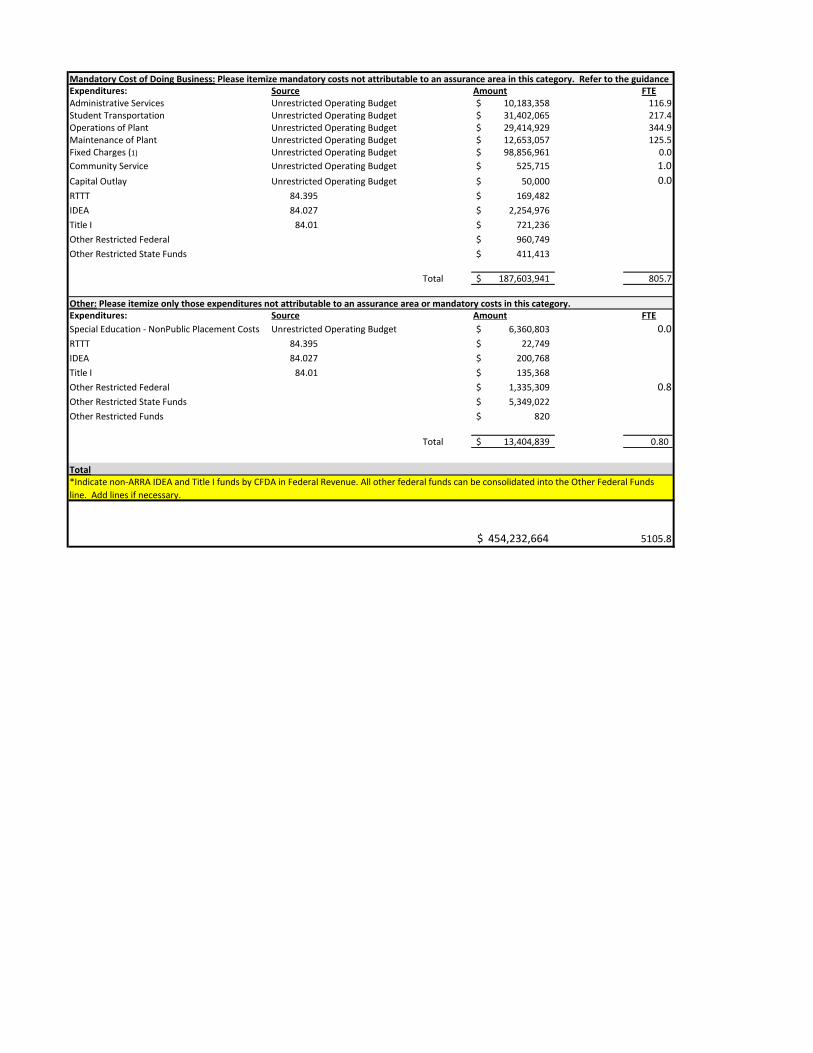
Expenditures: Source Amount FTEAdministrative Services Unrestricted Operating Budget 10,183,358$ 116.9Student Transportation Unrestricted Operating Budget 31,402,065$ 217.4Operations of Plant Unrestricted Operating Budget 29,414,929$ 344.9Maintenance of Plant Unrestricted Operating Budget 12,653,057$ 125.5Fixed Charges (1) Unrestricted Operating Budget 98,856,961$ 0.0
Community Service Unrestricted Operating Budget 525,715$ 1.0
Capital Outlay Unrestricted Operating Budget 50,000$ 0.0
RTTT 84.395 169,482$
IDEA 84.027 2,254,976$
Title I 84.01 721,236$
Other Restricted Federal 960,749$
Other Restricted State Funds 411,413$
Total 187,603,941$ 805.7
Expenditures: Source Amount FTE
Special Education - NonPublic Placement Costs Unrestricted Operating Budget 6,360,803$ 0.0
RTTT 84.395 22,749$
IDEA 84.027 200,768$
Title I 84.01 135,368$
Other Restricted Federal 1,335,309$ 0.8
Other Restricted State Funds 5,349,022$
Other Restricted Funds 820$
Total 13,404,839$ 0.80
454,232,664$ 5105.8
*Indicate non-ARRA IDEA and Title I funds by CFDA in Federal Revenue. All other federal funds can be consolidated into the Other Federal Funds
line. Add lines if necessary.
Mandatory Cost of Doing Business: Please itemize mandatory costs not attributable to an assurance area in this category. Refer to the guidance
Other: Please itemize only those expenditures not attributable to an assurance area or mandatory costs in this category.
Total
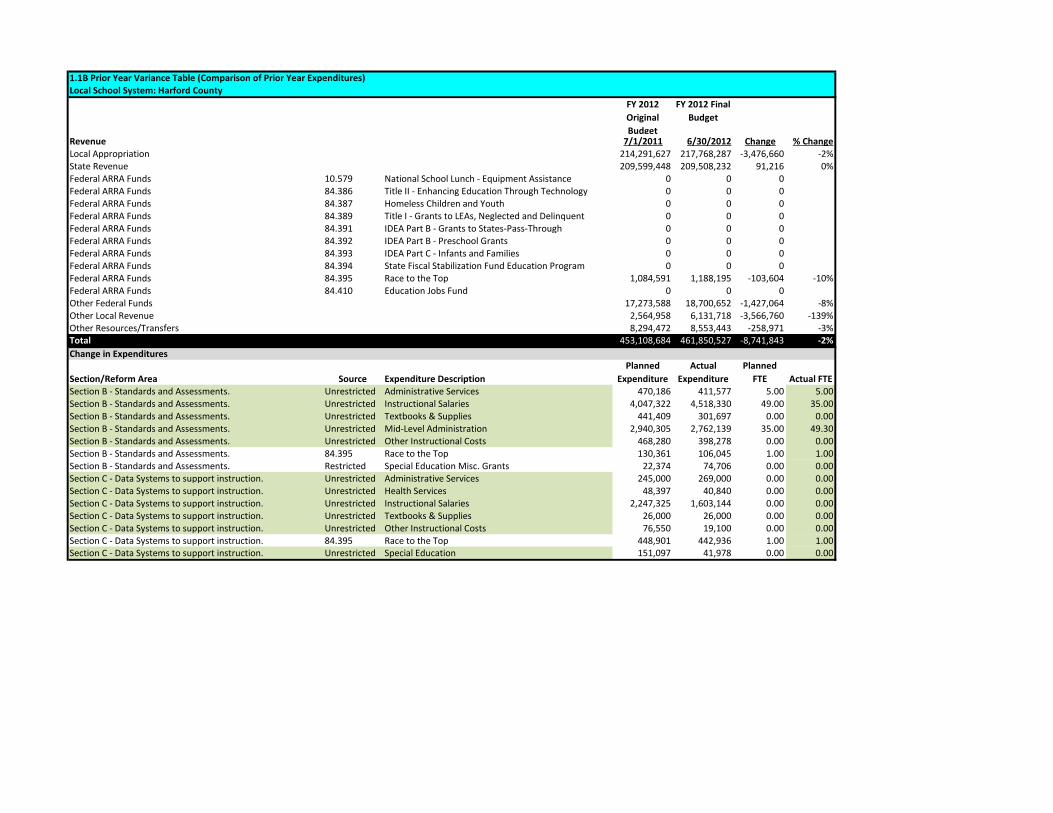
1.1B Prior Year Variance Table (Comparison of Prior Year Expenditures)Local School System: Harford County
FY 2012
Original
Budget
FY 2012 Final
Budget
Revenue 7/1/2011 6/30/2012 Change % ChangeLocal Appropriation 214,291,627 217,768,287 -3,476,660 -2%State Revenue 209,599,448 209,508,232 91,216 0%Federal ARRA Funds 10.579 National School Lunch - Equipment Assistance 0 0 0Federal ARRA Funds 84.386 Title II - Enhancing Education Through Technology 0 0 0Federal ARRA Funds 84.387 Homeless Children and Youth 0 0 0Federal ARRA Funds 84.389 Title I - Grants to LEAs, Neglected and Delinquent 0 0 0Federal ARRA Funds 84.391 IDEA Part B - Grants to States-Pass-Through 0 0 0Federal ARRA Funds 84.392 IDEA Part B - Preschool Grants 0 0 0Federal ARRA Funds 84.393 IDEA Part C - Infants and Families 0 0 0Federal ARRA Funds 84.394 State Fiscal Stabilization Fund Education Program 0 0 0Federal ARRA Funds 84.395 Race to the Top 1,084,591 1,188,195 -103,604 -10%Federal ARRA Funds 84.410 Education Jobs Fund 0 0 0Other Federal Funds 17,273,588 18,700,652 -1,427,064 -8%Other Local Revenue 2,564,958 6,131,718 -3,566,760 -139%Other Resources/Transfers 8,294,472 8,553,443 -258,971 -3%Total 453,108,684 461,850,527 -8,741,843 -2%
Change in Expenditures
Section/Reform Area Source Expenditure Description
Planned
Expenditure
Actual
Expenditure
Planned
FTE Actual FTESection B - Standards and Assessments. Unrestricted Administrative Services 470,186 411,577 5.00 5.00Section B - Standards and Assessments. Unrestricted Instructional Salaries 4,047,322 4,518,330 49.00 35.00Section B - Standards and Assessments. Unrestricted Textbooks & Supplies 441,409 301,697 0.00 0.00Section B - Standards and Assessments. Unrestricted Mid-Level Administration 2,940,305 2,762,139 35.00 49.30Section B - Standards and Assessments. Unrestricted Other Instructional Costs 468,280 398,278 0.00 0.00Section B - Standards and Assessments. 84.395 Race to the Top 130,361 106,045 1.00 1.00Section B - Standards and Assessments. Restricted Special Education Misc. Grants 22,374 74,706 0.00 0.00Section C - Data Systems to support instruction. Unrestricted Administrative Services 245,000 269,000 0.00 0.00Section C - Data Systems to support instruction. Unrestricted Health Services 48,397 40,840 0.00 0.00Section C - Data Systems to support instruction. Unrestricted Instructional Salaries 2,247,325 1,603,144 0.00 0.00Section C - Data Systems to support instruction. Unrestricted Textbooks & Supplies 26,000 26,000 0.00 0.00Section C - Data Systems to support instruction. Unrestricted Other Instructional Costs 76,550 19,100 0.00 0.00Section C - Data Systems to support instruction. 84.395 Race to the Top 448,901 442,936 1.00 1.00Section C - Data Systems to support instruction. Unrestricted Special Education 151,097 41,978 0.00 0.00
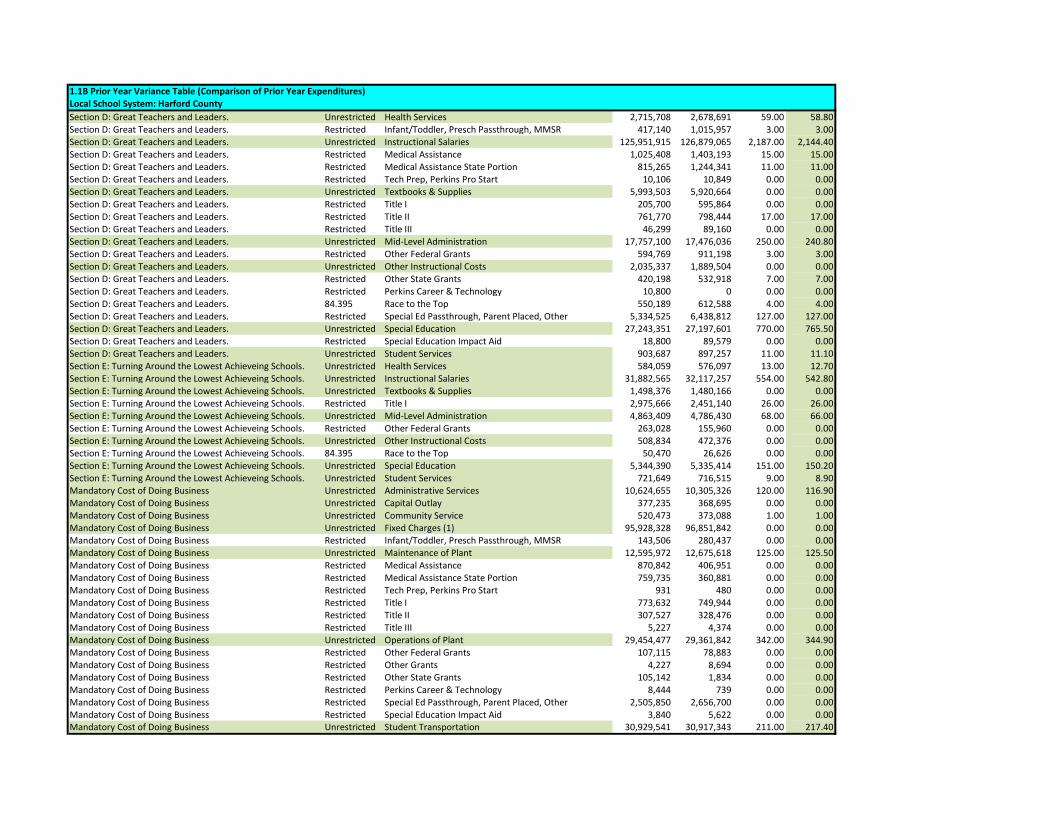
1.1B Prior Year Variance Table (Comparison of Prior Year Expenditures)Local School System: Harford County
Section D: Great Teachers and Leaders. Unrestricted Health Services 2,715,708 2,678,691 59.00 58.80Section D: Great Teachers and Leaders. Restricted Infant/Toddler, Presch Passthrough, MMSR 417,140 1,015,957 3.00 3.00Section D: Great Teachers and Leaders. Unrestricted Instructional Salaries 125,951,915 126,879,065 2,187.00 2,144.40Section D: Great Teachers and Leaders. Restricted Medical Assistance 1,025,408 1,403,193 15.00 15.00Section D: Great Teachers and Leaders. Restricted Medical Assistance State Portion 815,265 1,244,341 11.00 11.00Section D: Great Teachers and Leaders. Restricted Tech Prep, Perkins Pro Start 10,106 10,849 0.00 0.00Section D: Great Teachers and Leaders. Unrestricted Textbooks & Supplies 5,993,503 5,920,664 0.00 0.00Section D: Great Teachers and Leaders. Restricted Title I 205,700 595,864 0.00 0.00Section D: Great Teachers and Leaders. Restricted Title II 761,770 798,444 17.00 17.00Section D: Great Teachers and Leaders. Restricted Title III 46,299 89,160 0.00 0.00Section D: Great Teachers and Leaders. Unrestricted Mid-Level Administration 17,757,100 17,476,036 250.00 240.80Section D: Great Teachers and Leaders. Restricted Other Federal Grants 594,769 911,198 3.00 3.00Section D: Great Teachers and Leaders. Unrestricted Other Instructional Costs 2,035,337 1,889,504 0.00 0.00Section D: Great Teachers and Leaders. Restricted Other State Grants 420,198 532,918 7.00 7.00Section D: Great Teachers and Leaders. Restricted Perkins Career & Technology 10,800 0 0.00 0.00Section D: Great Teachers and Leaders. 84.395 Race to the Top 550,189 612,588 4.00 4.00Section D: Great Teachers and Leaders. Restricted Special Ed Passthrough, Parent Placed, Other 5,334,525 6,438,812 127.00 127.00Section D: Great Teachers and Leaders. Unrestricted Special Education 27,243,351 27,197,601 770.00 765.50Section D: Great Teachers and Leaders. Restricted Special Education Impact Aid 18,800 89,579 0.00 0.00Section D: Great Teachers and Leaders. Unrestricted Student Services 903,687 897,257 11.00 11.10Section E: Turning Around the Lowest Achieveing Schools. Unrestricted Health Services 584,059 576,097 13.00 12.70Section E: Turning Around the Lowest Achieveing Schools. Unrestricted Instructional Salaries 31,882,565 32,117,257 554.00 542.80Section E: Turning Around the Lowest Achieveing Schools. Unrestricted Textbooks & Supplies 1,498,376 1,480,166 0.00 0.00Section E: Turning Around the Lowest Achieveing Schools. Restricted Title I 2,975,666 2,451,140 26.00 26.00Section E: Turning Around the Lowest Achieveing Schools. Unrestricted Mid-Level Administration 4,863,409 4,786,430 68.00 66.00Section E: Turning Around the Lowest Achieveing Schools. Restricted Other Federal Grants 263,028 155,960 0.00 0.00Section E: Turning Around the Lowest Achieveing Schools. Unrestricted Other Instructional Costs 508,834 472,376 0.00 0.00Section E: Turning Around the Lowest Achieveing Schools. 84.395 Race to the Top 50,470 26,626 0.00 0.00Section E: Turning Around the Lowest Achieveing Schools. Unrestricted Special Education 5,344,390 5,335,414 151.00 150.20Section E: Turning Around the Lowest Achieveing Schools. Unrestricted Student Services 721,649 716,515 9.00 8.90Mandatory Cost of Doing Business Unrestricted Administrative Services 10,624,655 10,305,326 120.00 116.90Mandatory Cost of Doing Business Unrestricted Capital Outlay 377,235 368,695 0.00 0.00Mandatory Cost of Doing Business Unrestricted Community Service 520,473 373,088 1.00 1.00Mandatory Cost of Doing Business Unrestricted Fixed Charges (1) 95,928,328 96,851,842 0.00 0.00Mandatory Cost of Doing Business Restricted Infant/Toddler, Presch Passthrough, MMSR 143,506 280,437 0.00 0.00Mandatory Cost of Doing Business Unrestricted Maintenance of Plant 12,595,972 12,675,618 125.00 125.50Mandatory Cost of Doing Business Restricted Medical Assistance 870,842 406,951 0.00 0.00Mandatory Cost of Doing Business Restricted Medical Assistance State Portion 759,735 360,881 0.00 0.00Mandatory Cost of Doing Business Restricted Tech Prep, Perkins Pro Start 931 480 0.00 0.00Mandatory Cost of Doing Business Restricted Title I 773,632 749,944 0.00 0.00Mandatory Cost of Doing Business Restricted Title II 307,527 328,476 0.00 0.00Mandatory Cost of Doing Business Restricted Title III 5,227 4,374 0.00 0.00Mandatory Cost of Doing Business Unrestricted Operations of Plant 29,454,477 29,361,842 342.00 344.90Mandatory Cost of Doing Business Restricted Other Federal Grants 107,115 78,883 0.00 0.00Mandatory Cost of Doing Business Restricted Other Grants 4,227 8,694 0.00 0.00Mandatory Cost of Doing Business Restricted Other State Grants 105,142 1,834 0.00 0.00Mandatory Cost of Doing Business Restricted Perkins Career & Technology 8,444 739 0.00 0.00Mandatory Cost of Doing Business Restricted Special Ed Passthrough, Parent Placed, Other 2,505,850 2,656,700 0.00 0.00Mandatory Cost of Doing Business Restricted Special Education Impact Aid 3,840 5,622 0.00 0.00Mandatory Cost of Doing Business Unrestricted Student Transportation 30,929,541 30,917,343 211.00 217.40
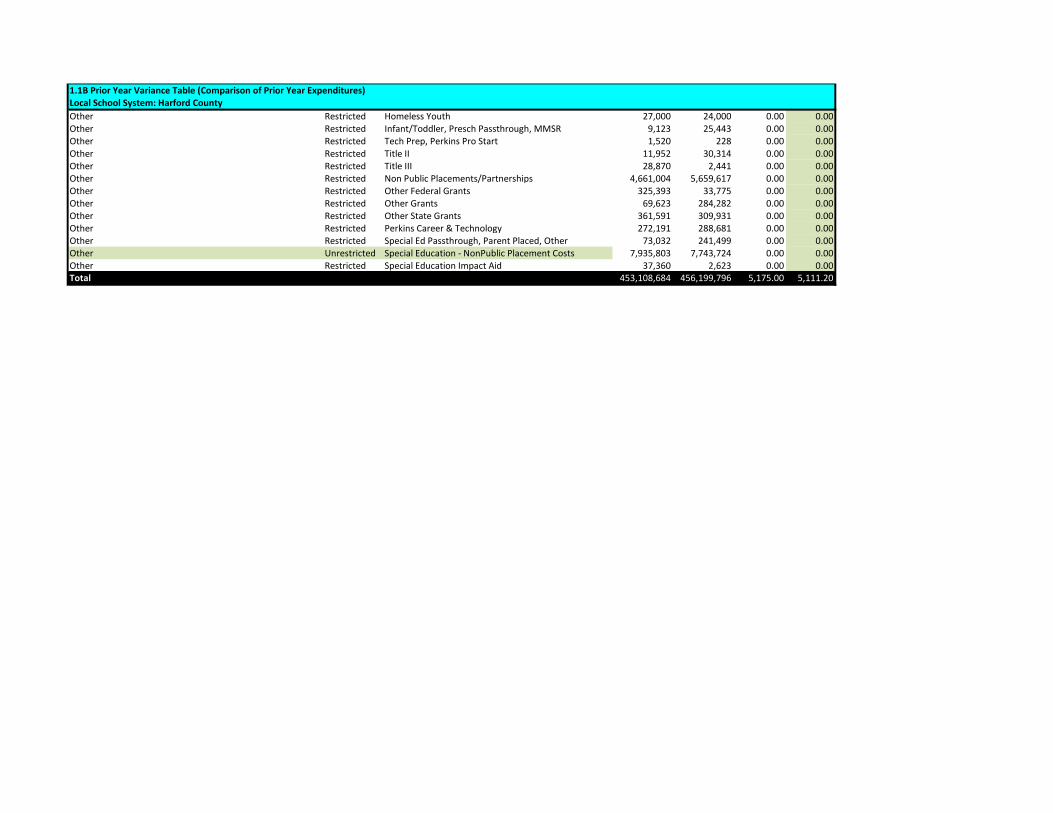
1.1B Prior Year Variance Table (Comparison of Prior Year Expenditures)Local School System: Harford County
Other Restricted Homeless Youth 27,000 24,000 0.00 0.00Other Restricted Infant/Toddler, Presch Passthrough, MMSR 9,123 25,443 0.00 0.00Other Restricted Tech Prep, Perkins Pro Start 1,520 228 0.00 0.00Other Restricted Title II 11,952 30,314 0.00 0.00Other Restricted Title III 28,870 2,441 0.00 0.00Other Restricted Non Public Placements/Partnerships 4,661,004 5,659,617 0.00 0.00Other Restricted Other Federal Grants 325,393 33,775 0.00 0.00Other Restricted Other Grants 69,623 284,282 0.00 0.00Other Restricted Other State Grants 361,591 309,931 0.00 0.00Other Restricted Perkins Career & Technology 272,191 288,681 0.00 0.00Other Restricted Special Ed Passthrough, Parent Placed, Other 73,032 241,499 0.00 0.00Other Unrestricted Special Education - NonPublic Placement Costs 7,935,803 7,743,724 0.00 0.00Other Restricted Special Education Impact Aid 37,360 2,623 0.00 0.00Total 453,108,684 456,199,796 5,175.00 5,111.20

HARFORD COUNTY PUBLIC SCHOOLS
FINAL SCOPE OF WORK PLAN
Part II: Budgets
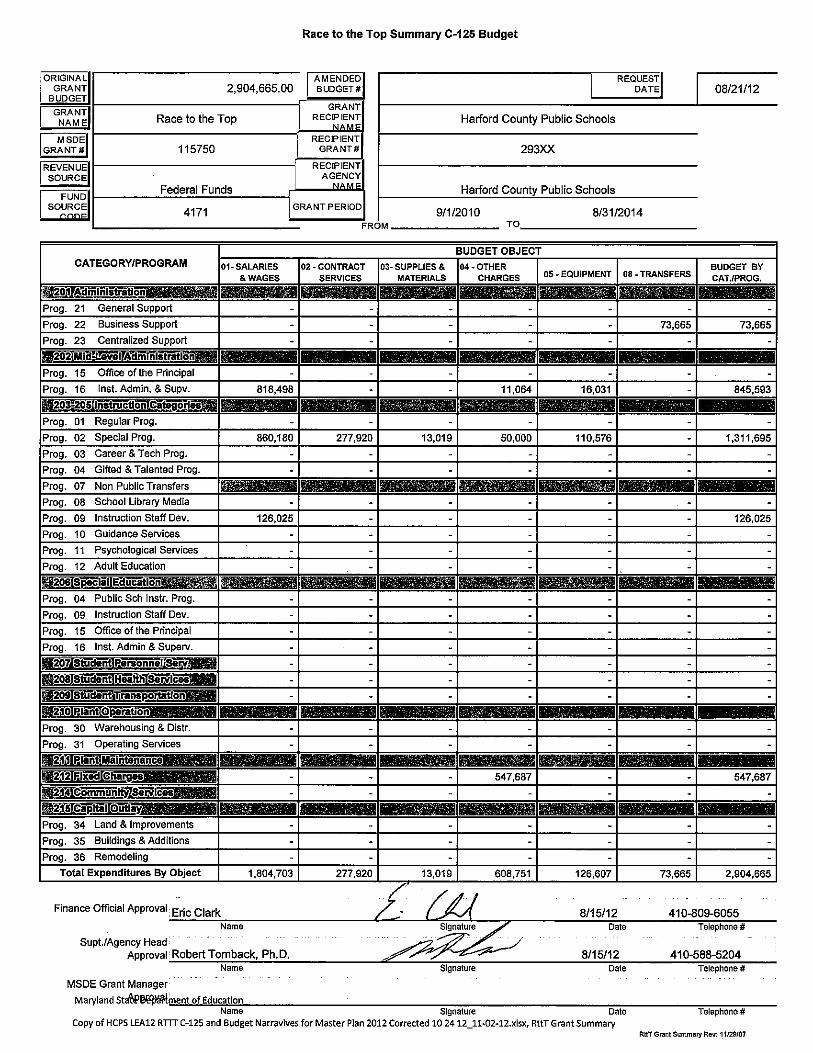
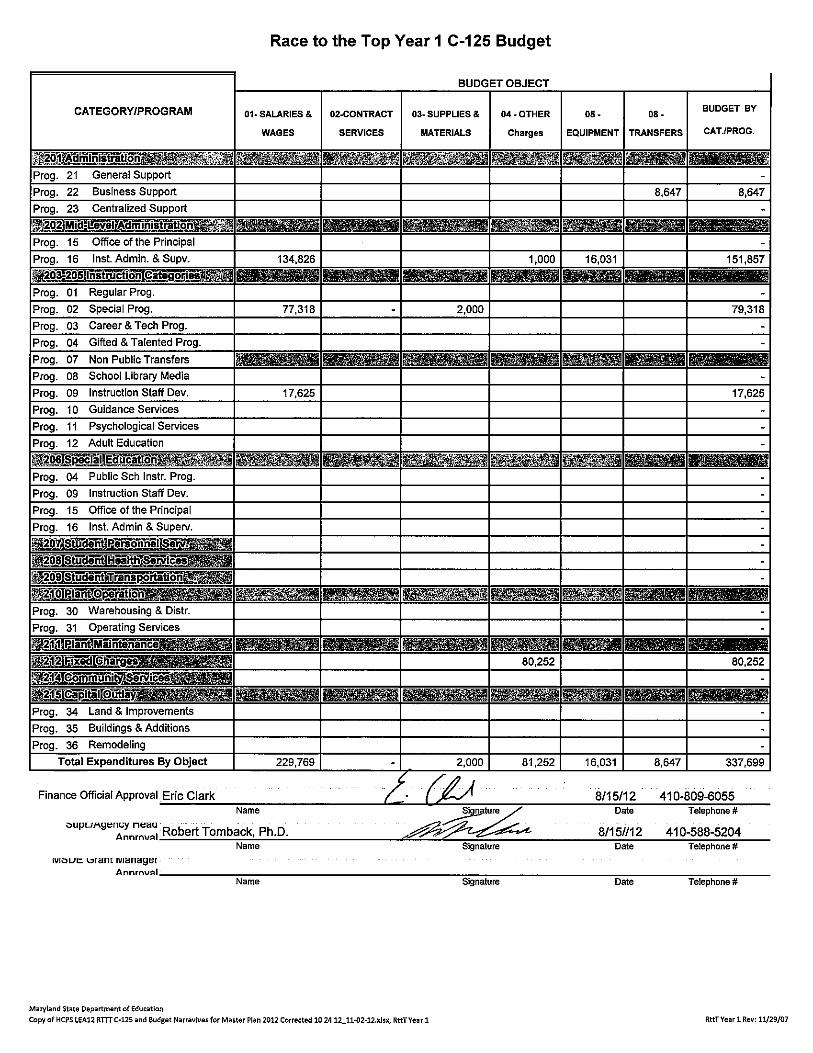
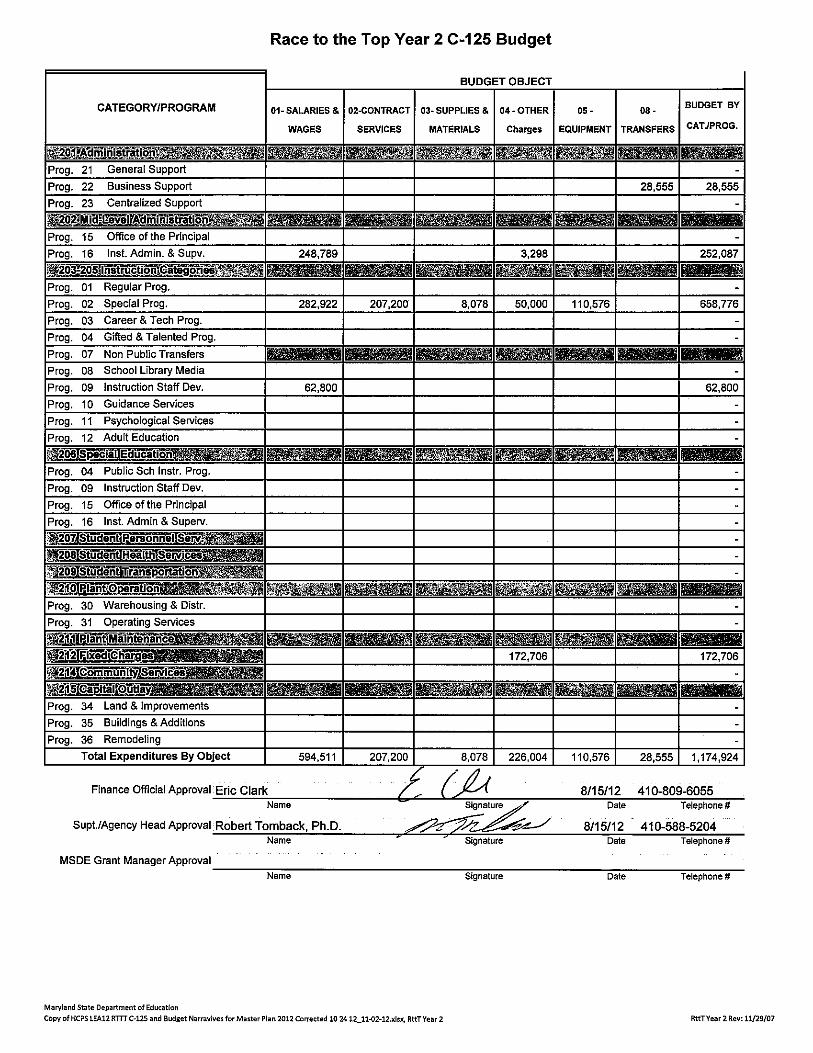
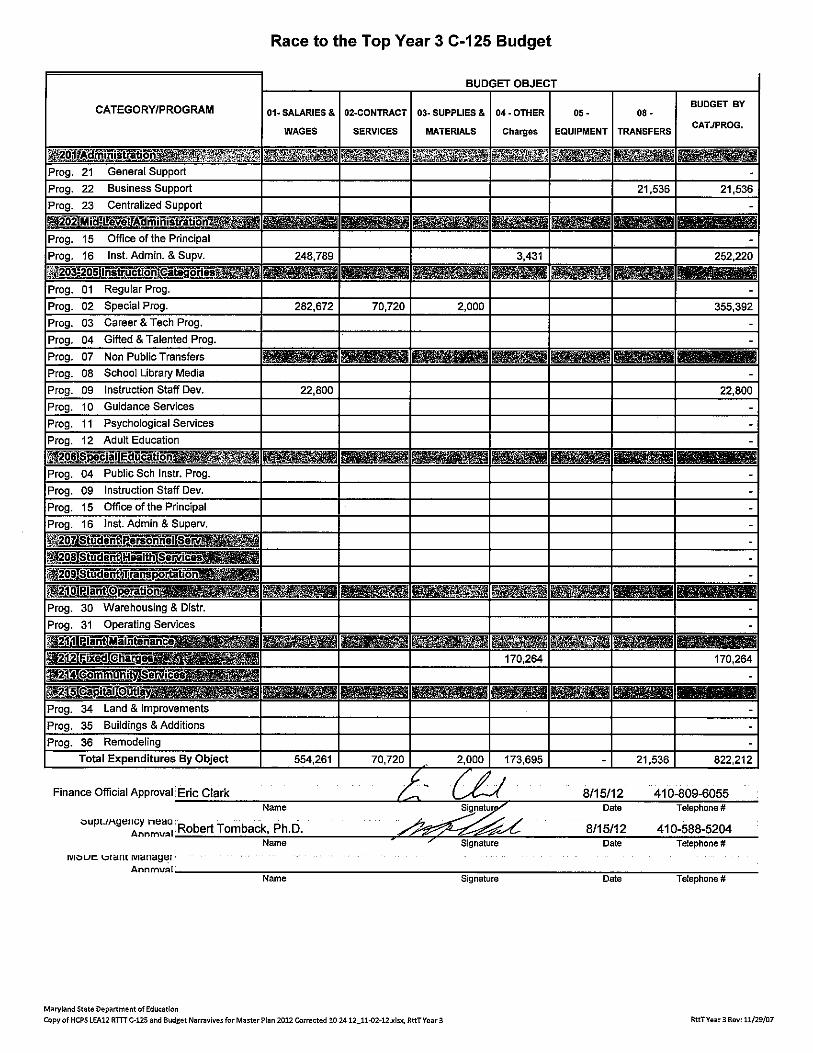
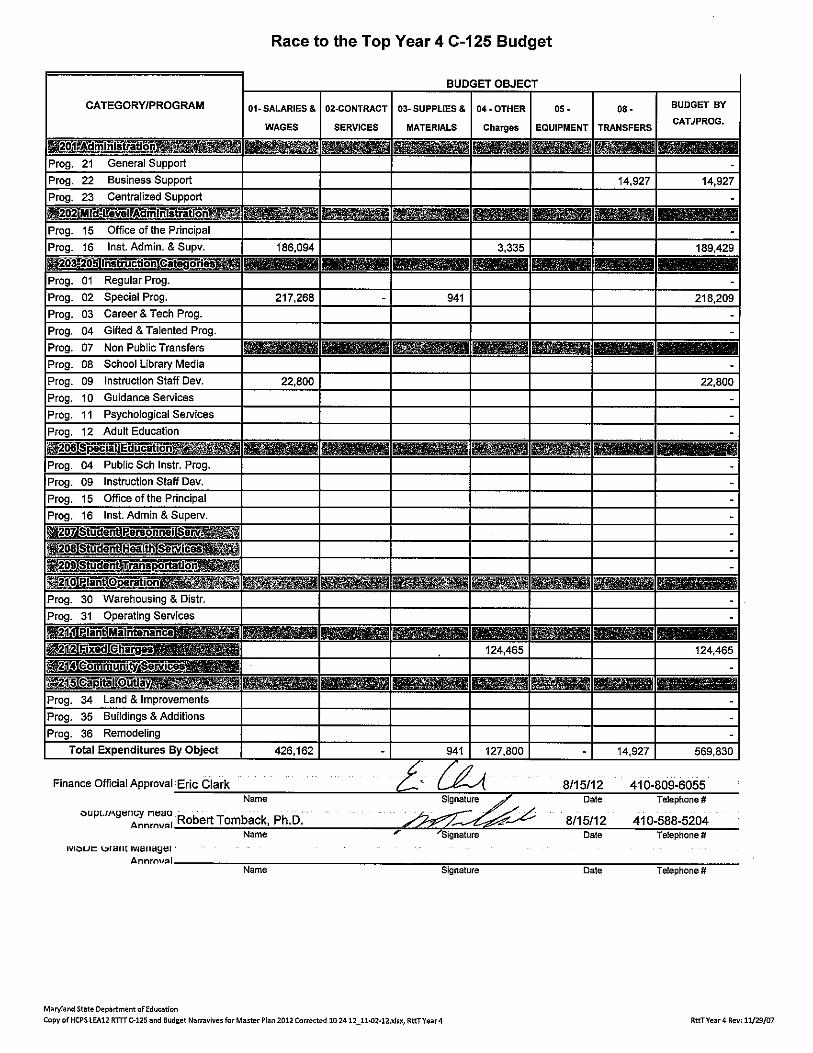

Local School System: Harford County Public Schools
Project Name: Race to the Top Project Manager
Associated with Criteria:
Project Number: 1
Project Project Project Project
Year 1 Year 2 Year 3 Year 4 Total(a) (b) (c) (d) (e)
1. Salaries and Wages 42,564 75,644 75,644 53,193 247,045
2. Contract Services - - - - -
3. Supplies and Materials - - - - -
4. Other Charges 15,696 29,208 29,236 20,072 94,212
5. Property - - - - -
6. Transfers (Indirect
Costs) 1,608 2,849 2,821 1,971 9,249
7. Total Costs (lines 1-6) 59,868 107,701 107,701 75,236 350,506
Column (e): Show the total amount requested for all project years.
Project Budget Summary Table
Budget Categories
Columns (a) through (d): For each project year for which funding is requested, show the total amount requested for each applicable
budget object.
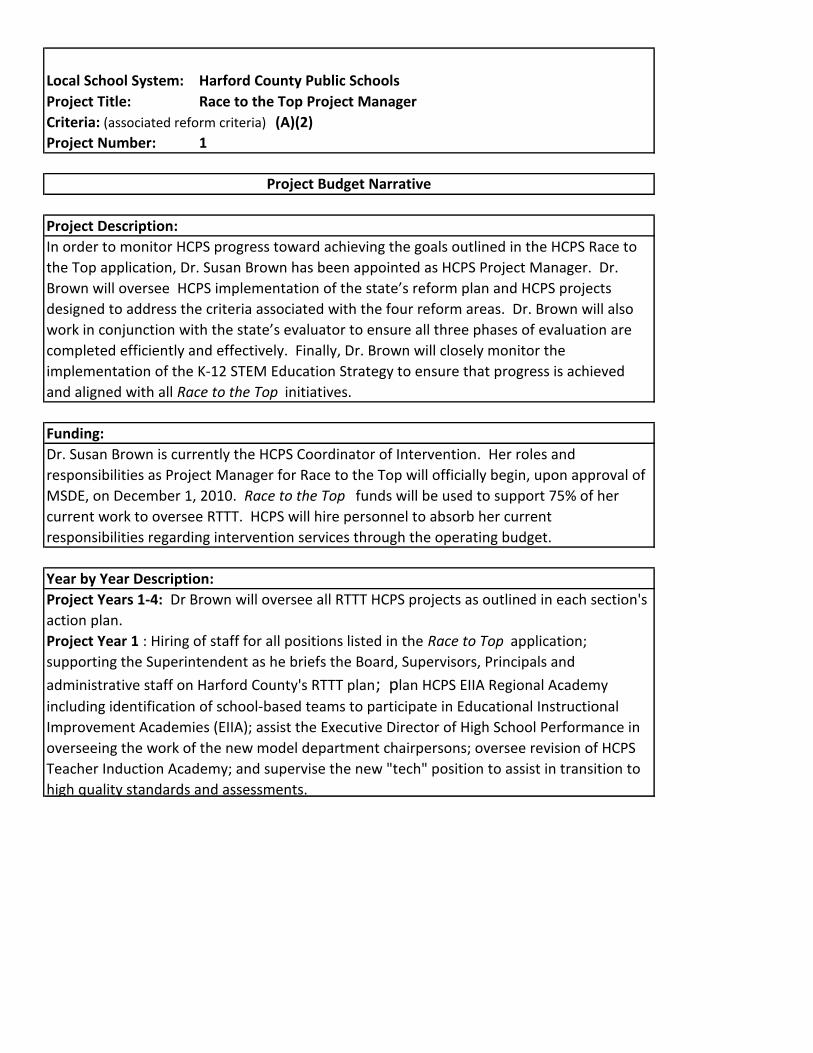
Local School System: Harford County Public Schools
Project Title: Race to the Top Project Manager
Criteria: (associated reform criteria) (A)(2)
1
Funding:
Dr. Susan Brown is currently the HCPS Coordinator of Intervention. Her roles and
responsibilities as Project Manager for Race to the Top will officially begin, upon approval of
MSDE, on December 1, 2010. Race to the Top funds will be used to support 75% of her
current work to oversee RTTT. HCPS will hire personnel to absorb her current
responsibilities regarding intervention services through the operating budget.
Year by Year Description:
Project Years 1-4: Dr Brown will oversee all RTTT HCPS projects as outlined in each section's
action plan.
Project Year 1 : Hiring of staff for all positions listed in the Race to Top application;
supporting the Superintendent as he briefs the Board, Supervisors, Principals and
administrative staff on Harford County's RTTT plan; plan HCPS EIIA Regional Academy
including identification of school-based teams to participate in Educational Instructional
Improvement Academies (EIIA); assist the Executive Director of High School Performance in
overseeing the work of the new model department chairpersons; oversee revision of HCPS
Teacher Induction Academy; and supervise the new "tech" position to assist in transition to
high quality standards and assessments.
Project Number:
Project Budget Narrative
Project Description:
In order to monitor HCPS progress toward achieving the goals outlined in the HCPS Race to
the Top application, Dr. Susan Brown has been appointed as HCPS Project Manager. Dr.
Brown will oversee HCPS implementation of the state’s reform plan and HCPS projects
designed to address the criteria associated with the four reform areas. Dr. Brown will also
work in conjunction with the state’s evaluator to ensure all three phases of evaluation are
completed efficiently and effectively. Finally, Dr. Brown will closely monitor the
implementation of the K-12 STEM Education Strategy to ensure that progress is achieved
and aligned with all Race to the Top initiatives.
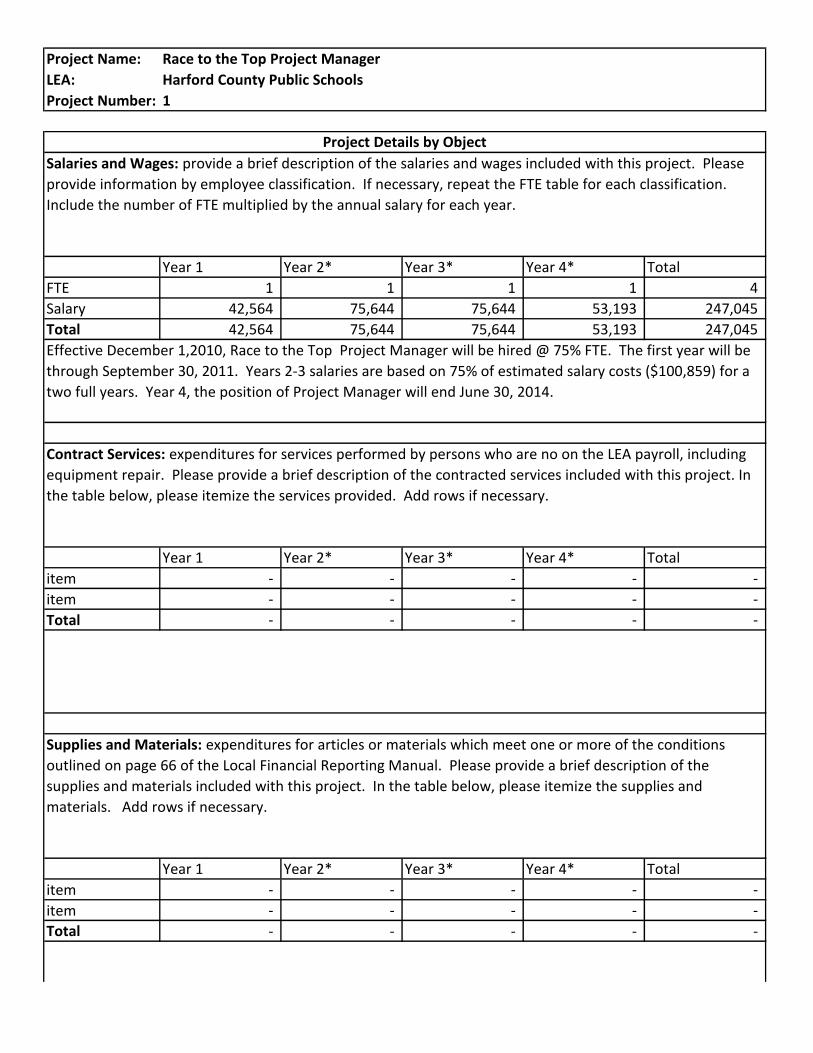
Project Name: Race to the Top Project Manager
LEA: Harford County Public Schools
Project Number: 1
Year 1 Year 2* Year 3* Year 4* Total
FTE 1 1 1 1 4
Salary 42,564 75,644 75,644 53,193 247,045
Total 42,564 75,644 75,644 53,193 247,045
Year 1 Year 2* Year 3* Year 4* Total
item - - - - -
item - - - - -
Total - - - - -
Year 1 Year 2* Year 3* Year 4* Total
item - - - - -
item - - - - -
Total - - - - -
Project Details by Object
Effective December 1,2010, Race to the Top Project Manager will be hired @ 75% FTE. The first year will be
through September 30, 2011. Years 2-3 salaries are based on 75% of estimated salary costs ($100,859) for a
two full years. Year 4, the position of Project Manager will end June 30, 2014.
Supplies and Materials: expenditures for articles or materials which meet one or more of the conditions
outlined on page 66 of the Local Financial Reporting Manual. Please provide a brief description of the
supplies and materials included with this project. In the table below, please itemize the supplies and
materials. Add rows if necessary.
Contract Services: expenditures for services performed by persons who are no on the LEA payroll, including
equipment repair. Please provide a brief description of the contracted services included with this project. In
the table below, please itemize the services provided. Add rows if necessary.
Salaries and Wages: provide a brief description of the salaries and wages included with this project. Please
provide information by employee classification. If necessary, repeat the FTE table for each classification.
Include the number of FTE multiplied by the annual salary for each year.
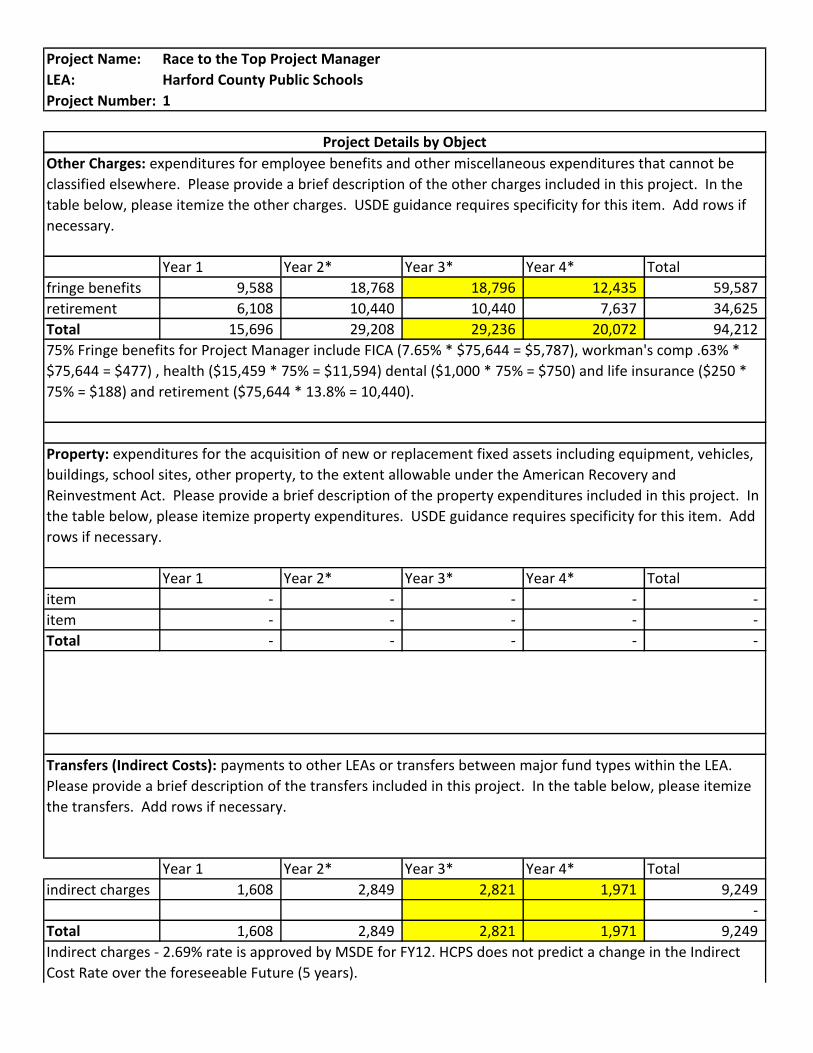
Project Name: Race to the Top Project Manager
LEA: Harford County Public Schools
Project Number: 1
Project Details by Object
Year 1 Year 2* Year 3* Year 4* Total
fringe benefits 9,588 18,768 18,796 12,435 59,587
retirement 6,108 10,440 10,440 7,637 34,625
Total 15,696 29,208 29,236 20,072 94,212
Year 1 Year 2* Year 3* Year 4* Total
item - - - - -
item - - - - -
Total - - - - -
Year 1 Year 2* Year 3* Year 4* Total
indirect charges 1,608 2,849 2,821 1,971 9,249
-
Total 1,608 2,849 2,821 1,971 9,249
Indirect charges - 2.69% rate is approved by MSDE for FY12. HCPS does not predict a change in the Indirect
Cost Rate over the foreseeable Future (5 years).
75% Fringe benefits for Project Manager include FICA (7.65% * $75,644 = $5,787), workman's comp .63% *
$75,644 = $477) , health ($15,459 * 75% = $11,594) dental ($1,000 * 75% = $750) and life insurance ($250 *
75% = $188) and retirement ($75,644 * 13.8% = 10,440).
Other Charges: expenditures for employee benefits and other miscellaneous expenditures that cannot be
classified elsewhere. Please provide a brief description of the other charges included in this project. In the
table below, please itemize the other charges. USDE guidance requires specificity for this item. Add rows if
necessary.
Transfers (Indirect Costs): payments to other LEAs or transfers between major fund types within the LEA.
Please provide a brief description of the transfers included in this project. In the table below, please itemize
the transfers. Add rows if necessary.
Property: expenditures for the acquisition of new or replacement fixed assets including equipment, vehicles,
buildings, school sites, other property, to the extent allowable under the American Recovery and
Reinvestment Act. Please provide a brief description of the property expenditures included in this project. In
the table below, please itemize property expenditures. USDE guidance requires specificity for this item. Add
rows if necessary.
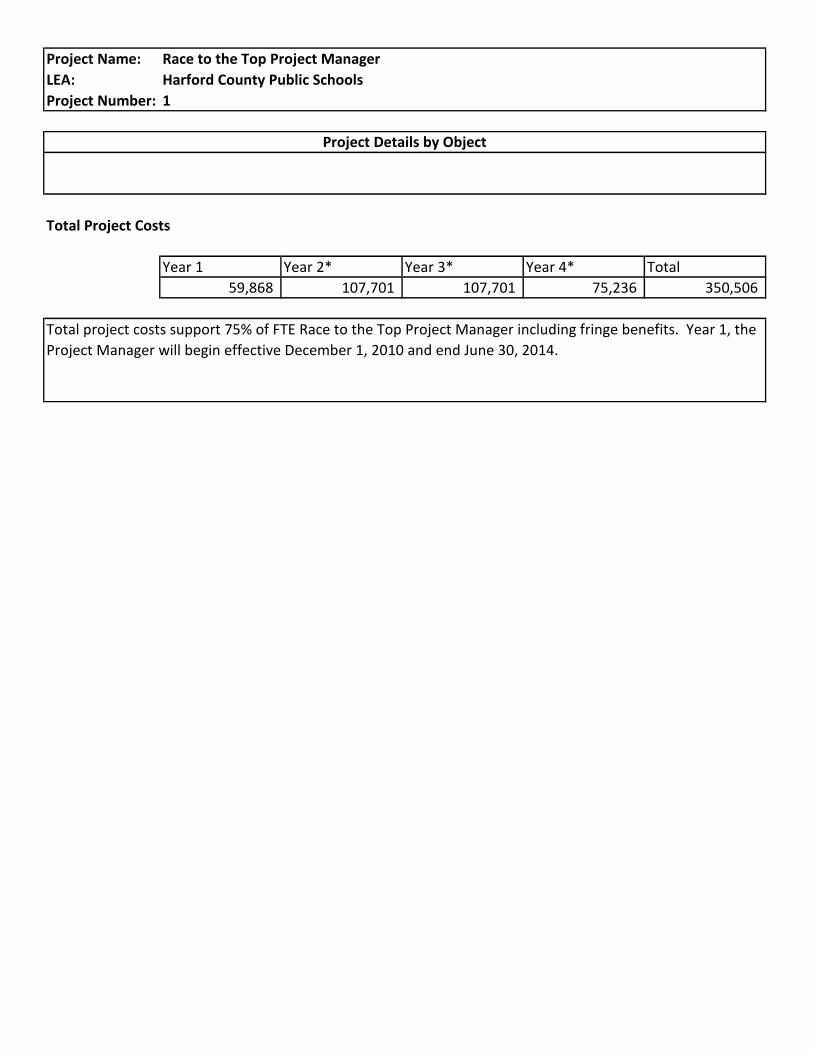
Project Name: Race to the Top Project Manager
LEA: Harford County Public Schools
Project Number: 1
Project Details by Object
Total Project Costs
Year 1 Year 2* Year 3* Year 4* Total
59,868 107,701 107,701 75,236 350,506
Indirect charges - 2.69% rate is approved by MSDE for FY12. HCPS does not predict a change in the Indirect
Cost Rate over the foreseeable Future (5 years).
Total project costs support 75% of FTE Race to the Top Project Manager including fringe benefits. Year 1, the
Project Manager will begin effective December 1, 2010 and end June 30, 2014.
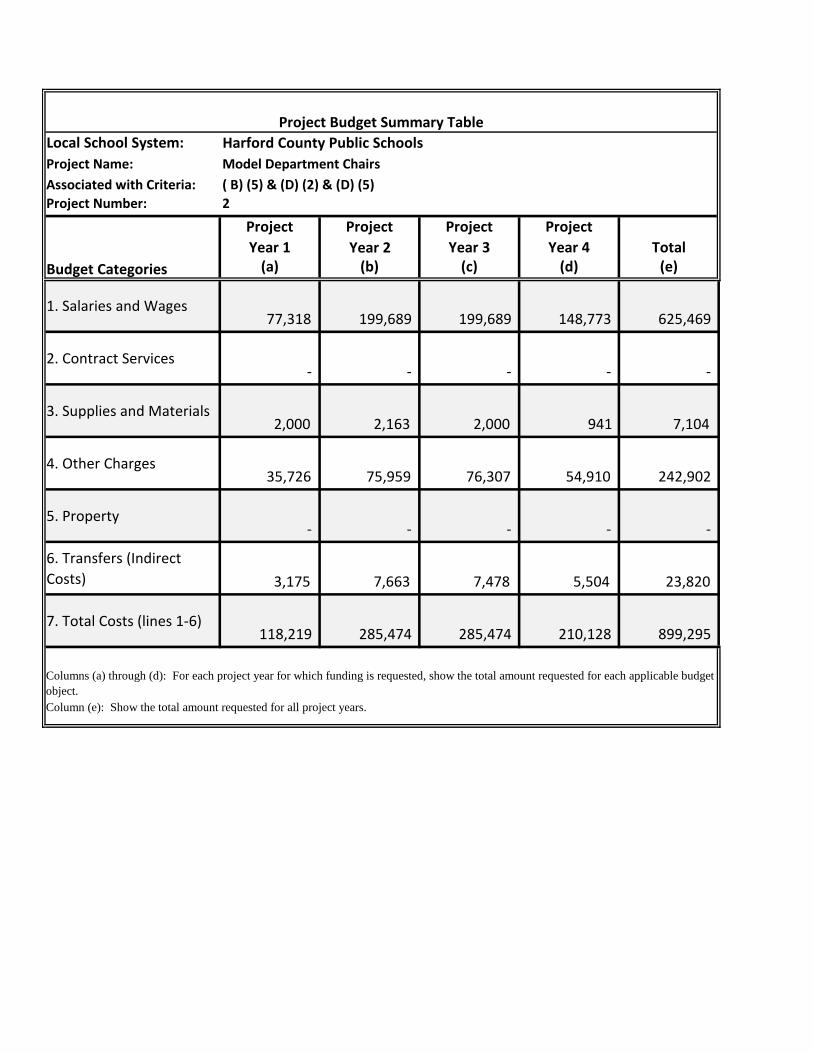
Local School System: Harford County Public Schools
Project Name: Model Department Chairs
Associated with Criteria: ( B) (5) & (D) (2) & (D) (5)
Project Number: 2
Project Project Project Project
Year 1 Year 2 Year 3 Year 4 Total(a) (b) (c) (d) (e)
1. Salaries and Wages 77,318 199,689 199,689 148,773 625,469
2. Contract Services - - - - -
3. Supplies and Materials 2,000 2,163 2,000 941 7,104
4. Other Charges 35,726 75,959 76,307 54,910 242,902
5. Property - - - - -
6. Transfers (Indirect
Costs) 3,175 7,663 7,478 5,504 23,820
7. Total Costs (lines 1-6) 118,219 285,474 285,474 210,128 899,295
Column (e): Show the total amount requested for all project years.
Project Budget Summary Table
Budget Categories
Columns (a) through (d): For each project year for which funding is requested, show the total amount requested for each applicable budget
object.

Local School System: Harford County Public Schools
Project Title: Model Department Chairs
Criteria: (associated reform criteria) (B) (5) & (D) (2) & (D) (5)
2
Year by Year Description:
Project Year 1: The new Department Chairs will be hired. Department Chairs will be
assigned to work with four high schools to implement the Model Department Chair initiative
including the transition to the Common Core Standards, teacher observations, and STEM
content delivery.
Project Years 2- 4: Assist in school-based follow-up of EIIA ensuring teacher use of new
Instructional Improvement System. Transition to new performance based observations and
provide expertise in effective content delivery.
Project Number:
Project Budget Narrative
Project Description:
HCPS is currently hiring Model Department Chairpersons in high school Mathematics,
English, Science and Social Studies. HCPS is requesting the Mathematics chair and Science
chair be supported by Race to the Top as they will play a key role in the creation and
implementation of the HCPS STEM initiative and content delivery, including transition to
Common Core Standards and high quality assessments. The Model Chairperson will be
assigned to work with four principals and Core Content Supervisors to provide
supplementary content specific evaluative services at four high schools.
Funding:
Effective December 1, 2010, Race to the Top funding will support two of the four model
department chairs through the end of the grant. The two positions will be in Mathematics
and Science. The other two positions, Social Studies and English, will be paid out of
operating funds. HCPS will sustain these positions as they will be essential to ensuring
teachers are proficient in the use of the Instructional Improvement System.

Project Name: Model Department Chairs
LEA: Harford County Public Schools
Project Number: 2
Year 1 Year 2* Year 3* Year 4* Total
FTE 2 3 3 3
Salary 38,659 66,563 66,563 49,591
Total 77,318 199,689 199,689 148,773 625,469
Year 1 Year 2* Year 3* Year 4* Total
item - - - - -
item - - - - -
Total - - - - -
Year 1 Year 2* Year 3* Year 4* Total
supplies 2,000 2,163 2,000 941 7,104
item - - - - -
Total 2,000 2,163 2,000 941 7,104
Supplies and Materials: Expenditures for articles or materials which meet one or more of the conditions
outlined on page 66 of the Local Financial Reporting Manual. Please provide a brief description of the supplies
and materials included with this project. In the table below, please itemize the supplies and materials. Add
rows if necessary.
Years 1-4 costs associated with new employee need for computer and office supplies. Estimates for each year
are: Fifteen cases of copy paper @ $38 per case $570; Color laser jet cartridges 4 @ $131 per cartridge $524;
Miscellaneous supplies-- folders, pencils, pens, highlighters, paperclips, hanging folders, etc. @ $906 $1,069
per year
Project Details by Object
Salaries and Wages: provide a brief description of the salaries and wages included with this project. Please
provide information by employee classification. If necessary, repeat the FTE table for each classification.
Include the number of FTE multiplied by the annual salary for each year.
Two Model Department Chairpersons will be hired effective December 1, 2010, upon approval by MSDE.
Salaries are based on HCPS teacher salary pay scale. Years 2 & 3 are full ten month salaries. Year 4, RTTT will
fund 75% of salary and general funds will support the additional 25%.
Contract Services: expenditures for services performed by persons who are no on the LEA payroll, including
equipment repair. Please provide a brief description of the contracted services included with this project. In
the table below, please itemize the services provided. Add rows if necessary.
Please provide complete details for year 1. For years 2-4, please provide an estimate of costs and also provide
the basis for this estimate here.
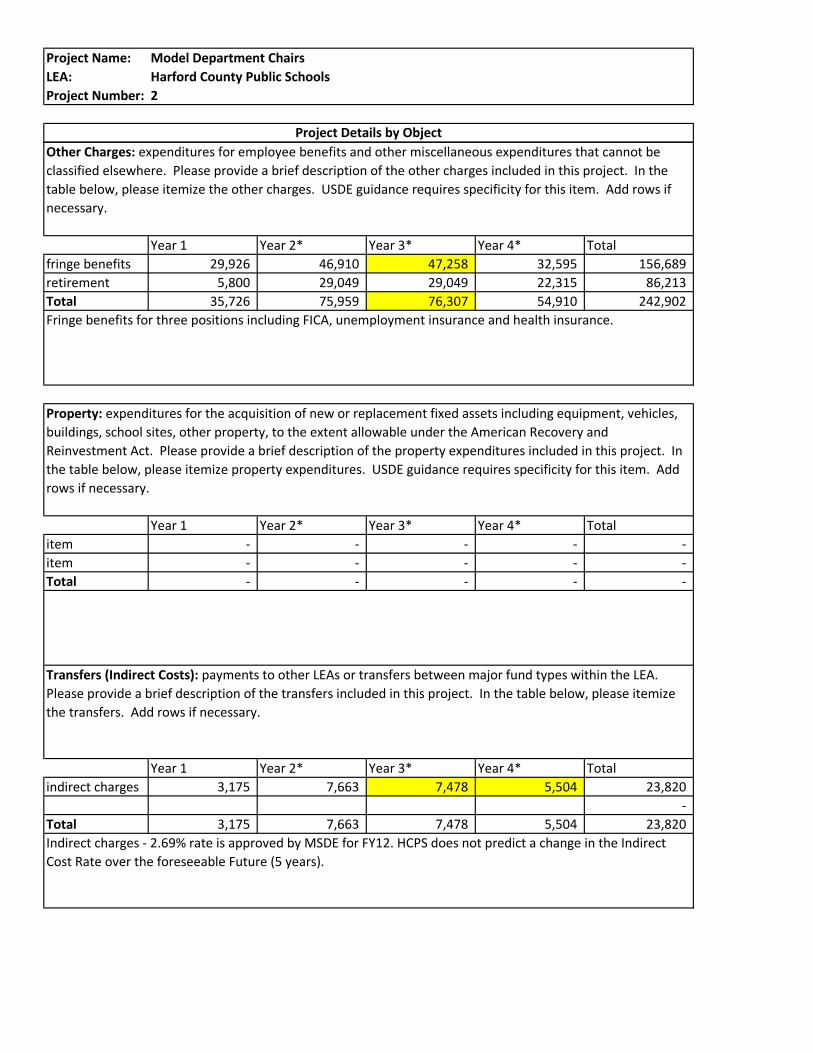
Project Name: Model Department Chairs
LEA: Harford County Public Schools
Project Number: 2
Project Details by Object
Year 1 Year 2* Year 3* Year 4* Total
fringe benefits 29,926 46,910 47,258 32,595 156,689
retirement 5,800 29,049 29,049 22,315 86,213
Total 35,726 75,959 76,307 54,910 242,902
Year 1 Year 2* Year 3* Year 4* Total
item - - - - -
item - - - - -
Total - - - - -
Year 1 Year 2* Year 3* Year 4* Total
indirect charges 3,175 7,663 7,478 5,504 23,820
-
Total 3,175 7,663 7,478 5,504 23,820
Indirect charges - 2.69% rate is approved by MSDE for FY12. HCPS does not predict a change in the Indirect
Cost Rate over the foreseeable Future (5 years).
Other Charges: expenditures for employee benefits and other miscellaneous expenditures that cannot be
classified elsewhere. Please provide a brief description of the other charges included in this project. In the
table below, please itemize the other charges. USDE guidance requires specificity for this item. Add rows if
necessary.
Fringe benefits for three positions including FICA, unemployment insurance and health insurance.
Property: expenditures for the acquisition of new or replacement fixed assets including equipment, vehicles,
buildings, school sites, other property, to the extent allowable under the American Recovery and
Reinvestment Act. Please provide a brief description of the property expenditures included in this project. In
the table below, please itemize property expenditures. USDE guidance requires specificity for this item. Add
rows if necessary.
Transfers (Indirect Costs): payments to other LEAs or transfers between major fund types within the LEA.
Please provide a brief description of the transfers included in this project. In the table below, please itemize
the transfers. Add rows if necessary.

Project Name: Model Department Chairs
LEA: Harford County Public Schools
Project Number: 2
Project Details by Object
Total Project Costs
Year 1 Year 2* Year 3* Year 4* Total
118,219 285,474 285,474 210,128 899,295
Total costs include salaries for two FTE Model Department Chairpersons, Supplies and materials to support
their work and fringe benefits.
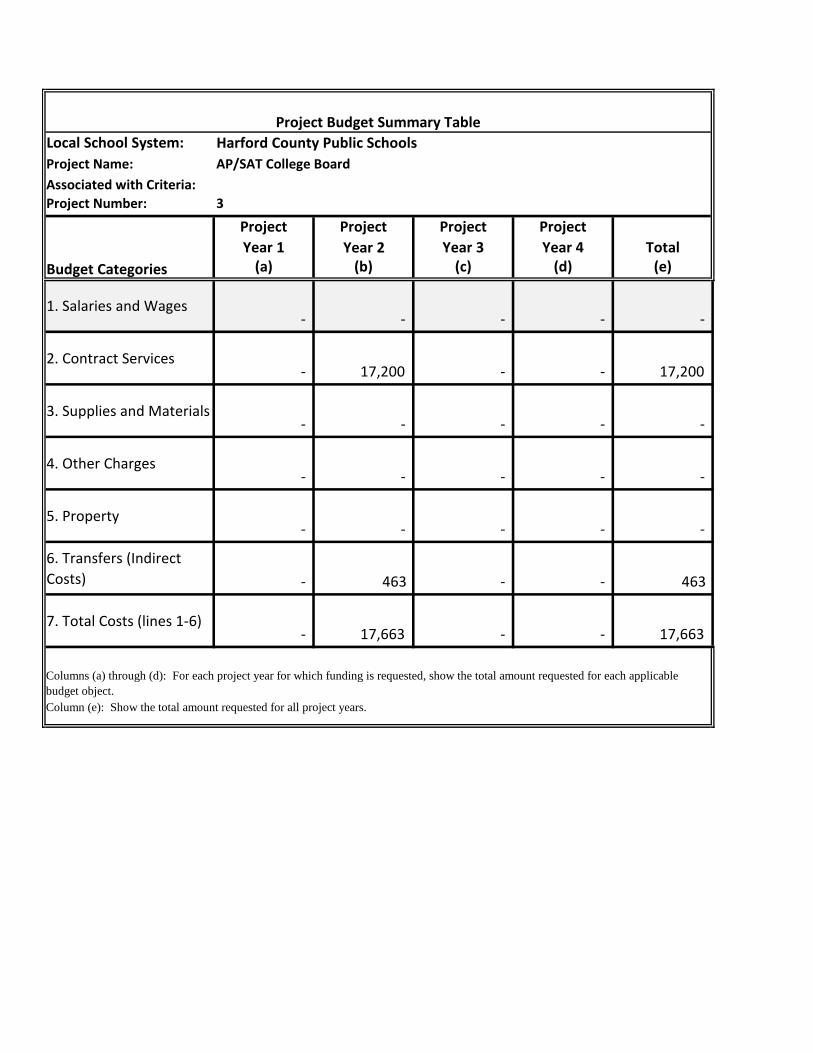
Local School System: Harford County Public Schools
Project Name: AP/SAT College Board
Associated with Criteria:
Project Number: 3
Project Project Project Project
Year 1 Year 2 Year 3 Year 4 Total(a) (b) (c) (d) (e)
1. Salaries and Wages - - - - -
2. Contract Services - 17,200 - - 17,200
3. Supplies and Materials - - - - -
4. Other Charges - - - - -
5. Property - - - - -
6. Transfers (Indirect
Costs) - 463 - - 463
7. Total Costs (lines 1-6) - 17,663 - - 17,663
Column (e): Show the total amount requested for all project years.
Project Budget Summary Table
Budget Categories
Columns (a) through (d): For each project year for which funding is requested, show the total amount requested for each applicable
budget object.

Local School System: Harford County Public Schools
Project Title: AP/SAT College Board
Criteria: (associated reform criteria) (B) (3)
3
Year by Year Description:
Project Number:
Project Budget Narrative
Project Description:
In order to ensure college readiness, HCPS will work with College Board to address our needs
and identify strategies designed to increase the number of students ready for college
ensuring higher quality standards and assessments. Some of those strategies could include
parental outreach, AP practice exams, SAT assistance and preparation.
Funding:
Race to the Top funds will be used to contract with College Board $22,000 for Years 1-4
Years 1 - 2. Funds will provide capacity to increase college readiness opportunities for
students and will not need to be sustained after the grant period ends.
Race to the Top Project Budget Narrative

Project Name: AP/SAT College Board
LEA: Harford County Public Schools
Project Number: 3
Year 1 Year 2* Year 3* Year 4* Total
FTE - - - - -
Salary - - - - -
Total - - - - -
Year 1 Year 2* Year 3* Year 4* Total
SAT/AP College
Board 17,200 - - 17,200
- - - - -
Total - 17,200 - - 17,200
Year 1 Year 2* Year 3* Year 4* Total
item - - - - -
item - - - - -
Total - - - - -
Supplies and Materials: expenditures for articles or materials which meet one or more of the conditions
outlined on page 66 of the Local Financial Reporting Manual. Please provide a brief description of the supplies
and materials included with this project. In the table below, please itemize the supplies and materials. Add
rows if necessary.
Please provide complete details for year 1. For years 2-4, please provide an estimate of costs and also provide
the basis for this estimate here.
Project Details by Object
Salaries and Wages: provide a brief description of the salaries and wages included with this project. Please
provide information by employee classification. If necessary, repeat the FTE table for each classification.
Include the number of FTE multiplied by the annual salary for each year.
Please provide complete details for year 1. For years 2-4, please provide an estimate of costs and also provide
the basis for this estimate here.
Contract Services: expenditures for services performed by persons who are no on the LEA payroll, including
equipment repair. Please provide a brief description of the contracted services included with this project. In
the table below, please itemize the services provided. Add rows if necessary.
Years 1-4 Years 1-2: Contract with College Board to provide increased school-based activities designed to
increase number of students taking SAT/ACT and parental outreach initiative. Each of the four years, HCPS will
allocate $2,100 $2,105.10 to our 10 high schools and $1,000 to our Alternative Education Center to support
the SAT/AP initiatives. Funds from Years 3-4 will be utilized to fund Project #9, Performance Matters Faste
Observer to assist with teacher observation and evaluation.
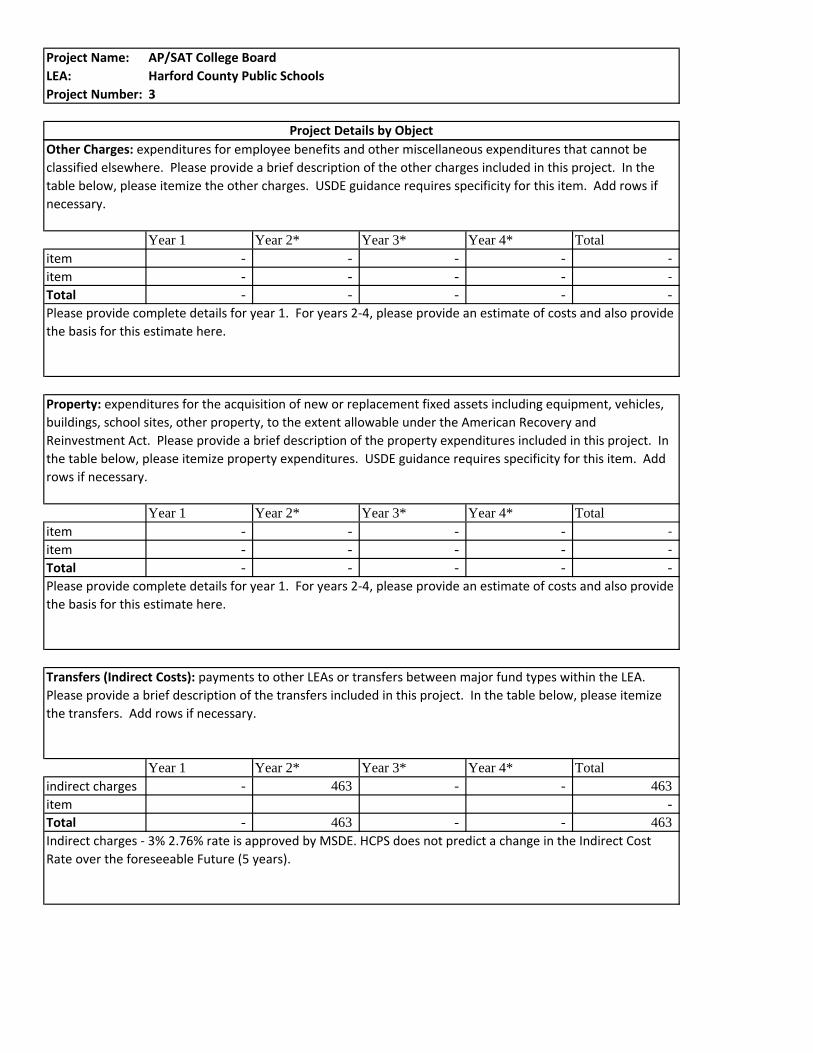
Project Name: AP/SAT College Board
LEA: Harford County Public Schools
Project Number: 3
Project Details by Object
Year 1 Year 2* Year 3* Year 4* Total
item - - - - -
item - - - - -
Total - - - - -
Year 1 Year 2* Year 3* Year 4* Total
item - - - - -
item - - - - -
Total - - - - -
Year 1 Year 2* Year 3* Year 4* Total
indirect charges - 463 - - 463
item -
Total - 463 - - 463
Indirect charges - 3% 2.76% rate is approved by MSDE. HCPS does not predict a change in the Indirect Cost
Rate over the foreseeable Future (5 years).
Other Charges: expenditures for employee benefits and other miscellaneous expenditures that cannot be
classified elsewhere. Please provide a brief description of the other charges included in this project. In the
table below, please itemize the other charges. USDE guidance requires specificity for this item. Add rows if
necessary.
Please provide complete details for year 1. For years 2-4, please provide an estimate of costs and also provide
the basis for this estimate here.
Property: expenditures for the acquisition of new or replacement fixed assets including equipment, vehicles,
buildings, school sites, other property, to the extent allowable under the American Recovery and
Reinvestment Act. Please provide a brief description of the property expenditures included in this project. In
the table below, please itemize property expenditures. USDE guidance requires specificity for this item. Add
rows if necessary.
Please provide complete details for year 1. For years 2-4, please provide an estimate of costs and also provide
the basis for this estimate here.
Transfers (Indirect Costs): payments to other LEAs or transfers between major fund types within the LEA.
Please provide a brief description of the transfers included in this project. In the table below, please itemize
the transfers. Add rows if necessary.

Project Name: AP/SAT College Board
LEA: Harford County Public Schools
Project Number: 3
Project Details by Object
Total Project Costs
Year 1 Year 2* Year 3* Year 4* Total
- 17,663 - - 17,663
Please provide complete details for year 1. For years 2-4, please provide an estimate of costs and also provide
the basis for this estimate here.
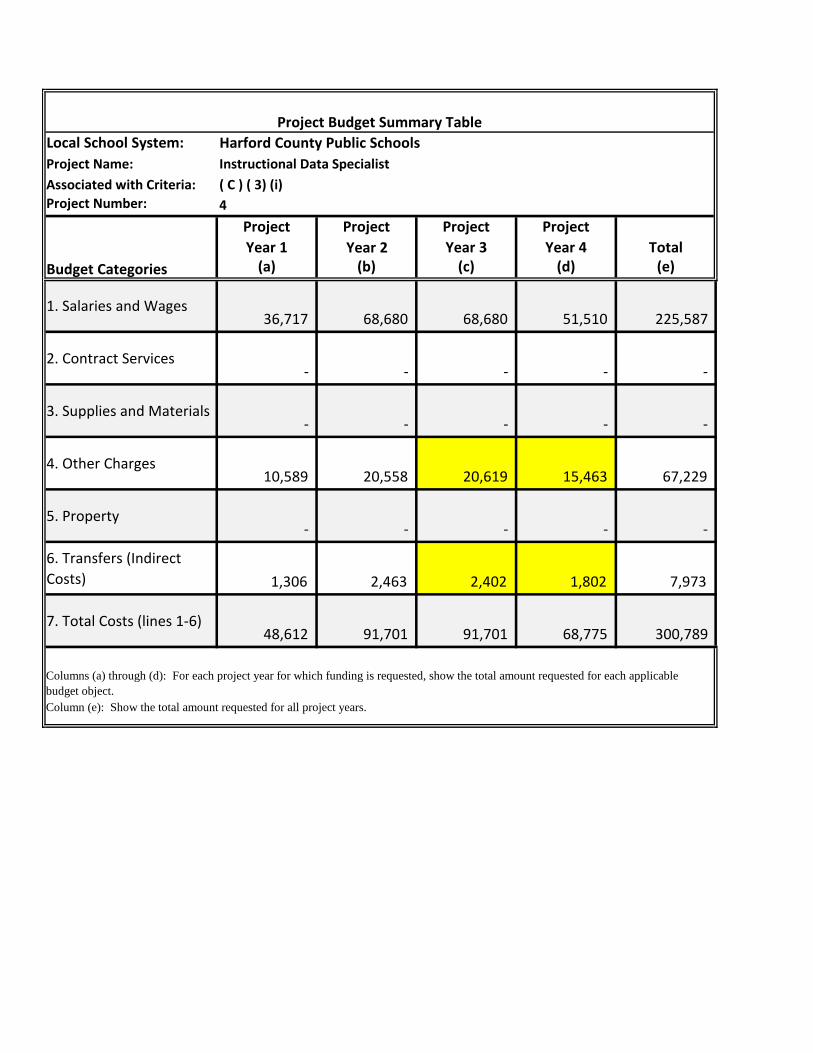
Local School System: Harford County Public Schools
Project Name: Instructional Data Specialist
Associated with Criteria: ( C ) ( 3) (i)
Project Number: 4
Project Project Project Project
Year 1 Year 2 Year 3 Year 4 Total(a) (b) (c) (d) (e)
1. Salaries and Wages 36,717 68,680 68,680 51,510 225,587
2. Contract Services - - - - -
3. Supplies and Materials - - - - -
4. Other Charges 10,589 20,558 20,619 15,463 67,229
5. Property - - - - -
6. Transfers (Indirect
Costs) 1,306 2,463 2,402 1,802 7,973
7. Total Costs (lines 1-6) 48,612 91,701 91,701 68,775 300,789
Column (e): Show the total amount requested for all project years.
Project Budget Summary Table
Budget Categories
Columns (a) through (d): For each project year for which funding is requested, show the total amount requested for each applicable
budget object.
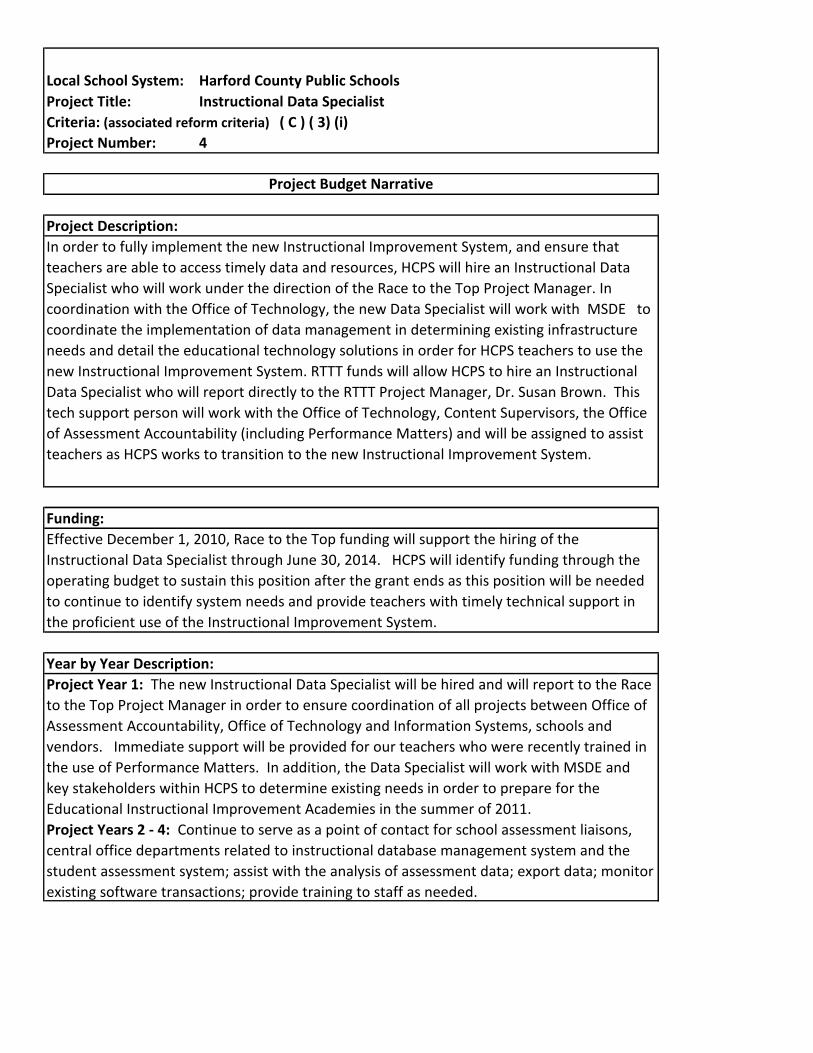
Local School System: Harford County Public Schools
Project Title: Instructional Data Specialist
Criteria: (associated reform criteria) ( C ) ( 3) (i)
4
Year by Year Description:
Project Year 1: The new Instructional Data Specialist will be hired and will report to the Race
to the Top Project Manager in order to ensure coordination of all projects between Office of
Assessment Accountability, Office of Technology and Information Systems, schools and
vendors. Immediate support will be provided for our teachers who were recently trained in
the use of Performance Matters. In addition, the Data Specialist will work with MSDE and
key stakeholders within HCPS to determine existing needs in order to prepare for the
Educational Instructional Improvement Academies in the summer of 2011.
Project Years 2 - 4: Continue to serve as a point of contact for school assessment liaisons,
central office departments related to instructional database management system and the
student assessment system; assist with the analysis of assessment data; export data; monitor
existing software transactions; provide training to staff as needed.
Project Number:
Project Budget Narrative
Project Description:
In order to fully implement the new Instructional Improvement System, and ensure that
teachers are able to access timely data and resources, HCPS will hire an Instructional Data
Specialist who will work under the direction of the Race to the Top Project Manager. In
coordination with the Office of Technology, the new Data Specialist will work with MSDE to
coordinate the implementation of data management in determining existing infrastructure
needs and detail the educational technology solutions in order for HCPS teachers to use the
new Instructional Improvement System. RTTT funds will allow HCPS to hire an Instructional
Data Specialist who will report directly to the RTTT Project Manager, Dr. Susan Brown. This
tech support person will work with the Office of Technology, Content Supervisors, the Office
of Assessment Accountability (including Performance Matters) and will be assigned to assist
teachers as HCPS works to transition to the new Instructional Improvement System.
Funding:
Effective December 1, 2010, Race to the Top funding will support the hiring of the
Instructional Data Specialist through June 30, 2014. HCPS will identify funding through the
operating budget to sustain this position after the grant ends as this position will be needed
to continue to identify system needs and provide teachers with timely technical support in
the proficient use of the Instructional Improvement System.

Project Name: Instructional Data Specialist
LEA: Harford County Public Schools
Project Number: 4
Year 1 Year 2* Year 3* Year 4* Total
FTE 1 1 1 1 4
Salary 36,717 68,680 68,680 51,510 225,587
Total 36,717 68,680 68,680 51,510 225,587
Year 1 Year 2* Year 3* Year 4* Total
item - - - - -
item - - - - -
Total - - - - -
Year 1 Year 2* Year 3* Year 4* Total
item - - - - -
item - - - - -
Total - - - - -
Supplies and Materials: expenditures for articles or materials which meet one or more of the conditions
outlined on page 66 of the Local Financial Reporting Manual. Please provide a brief description of the supplies
and materials included with this project. In the table below, please itemize the supplies and materials. Add
rows if necessary.
Project Details by Object
Salaries and Wages: provide a brief description of the salaries and wages included with this project. Please
provide information by employee classification. If necessary, repeat the FTE table for each classification.
Include the number of FTE multiplied by the annual salary for each year.
One Instructional Data Specialist will be hired effective December 1, 2010, upon MSDE approval, and will work
through June 30, 2014. Years 2 & 3 are twelve month salaries. Year 4, the position will end June 30, 2014.
Contract Services: expenditures for services performed by persons who are no on the LEA payroll, including
equipment repair. Please provide a brief description of the contracted services included with this project. In
the table below, please itemize the services provided. Add rows if necessary.
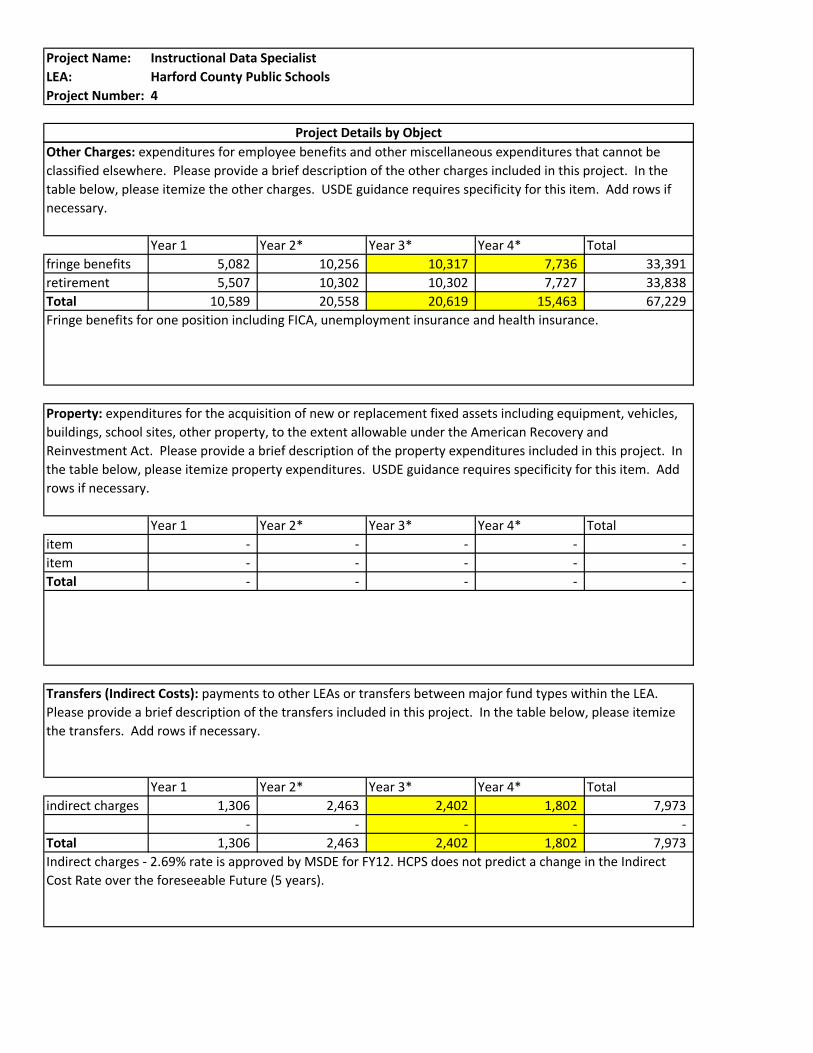
Project Name: Instructional Data Specialist
LEA: Harford County Public Schools
Project Number: 4
Project Details by Object
Year 1 Year 2* Year 3* Year 4* Total
fringe benefits 5,082 10,256 10,317 7,736 33,391
retirement 5,507 10,302 10,302 7,727 33,838
Total 10,589 20,558 20,619 15,463 67,229
Year 1 Year 2* Year 3* Year 4* Total
item - - - - -
item - - - - -
Total - - - - -
Year 1 Year 2* Year 3* Year 4* Total
indirect charges 1,306 2,463 2,402 1,802 7,973
- - - - -
Total 1,306 2,463 2,402 1,802 7,973
Indirect charges - 2.69% rate is approved by MSDE for FY12. HCPS does not predict a change in the Indirect
Cost Rate over the foreseeable Future (5 years).
Other Charges: expenditures for employee benefits and other miscellaneous expenditures that cannot be
classified elsewhere. Please provide a brief description of the other charges included in this project. In the
table below, please itemize the other charges. USDE guidance requires specificity for this item. Add rows if
necessary.
Fringe benefits for one position including FICA, unemployment insurance and health insurance.
Property: expenditures for the acquisition of new or replacement fixed assets including equipment, vehicles,
buildings, school sites, other property, to the extent allowable under the American Recovery and
Reinvestment Act. Please provide a brief description of the property expenditures included in this project. In
the table below, please itemize property expenditures. USDE guidance requires specificity for this item. Add
rows if necessary.
Transfers (Indirect Costs): payments to other LEAs or transfers between major fund types within the LEA.
Please provide a brief description of the transfers included in this project. In the table below, please itemize
the transfers. Add rows if necessary.

Project Name: Instructional Data Specialist
LEA: Harford County Public Schools
Project Number: 4
Project Details by Object
Total Project Costs
Year 1 Year 2* Year 3* Year 4* Total
48,612 91,701 91,701 68,775 300,789
Total costs include salary to support FTE Instructional Data Specialist and fringe benefits.
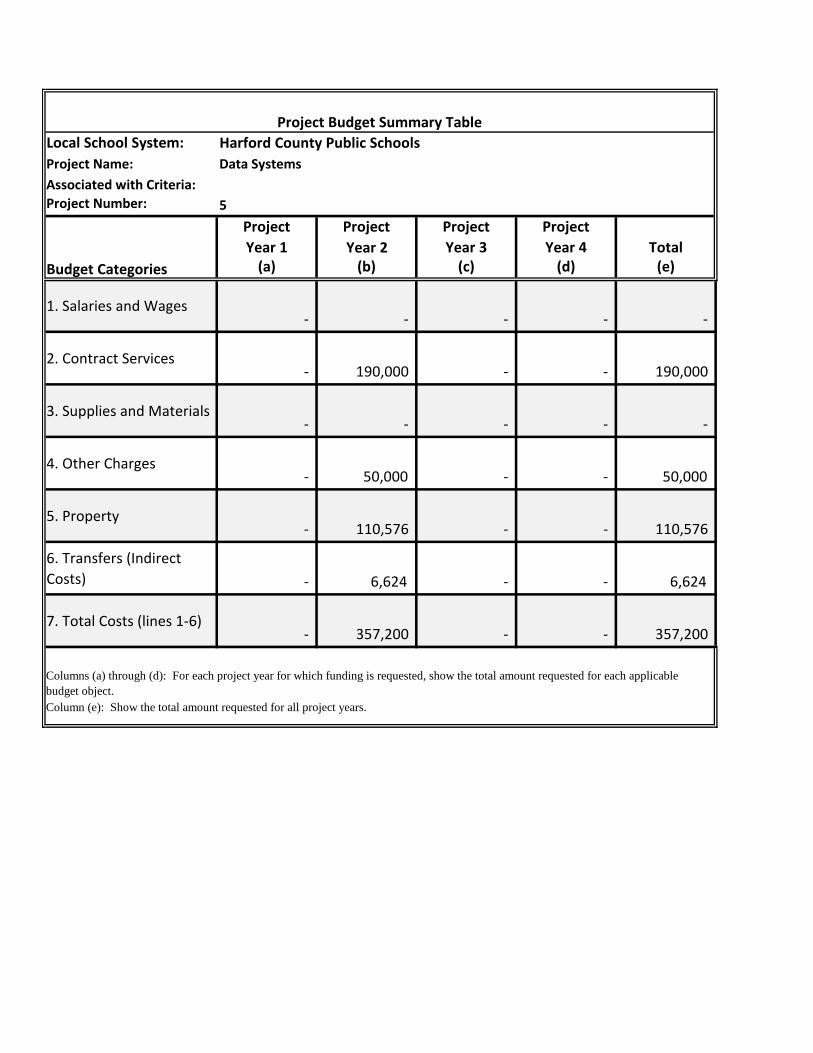
Local School System: Harford County Public Schools
Project Name: Data Systems
Associated with Criteria:
Project Number: 5
Project Project Project Project
Year 1 Year 2 Year 3 Year 4 Total(a) (b) (c) (d) (e)
1. Salaries and Wages - - - - -
2. Contract Services - 190,000 - - 190,000
3. Supplies and Materials - - - - -
4. Other Charges - 50,000 - - 50,000
5. Property - 110,576 - - 110,576
6. Transfers (Indirect
Costs) - 6,624 - - 6,624
7. Total Costs (lines 1-6) - 357,200 - - 357,200
Column (e): Show the total amount requested for all project years.
Project Budget Summary Table
Budget Categories
Columns (a) through (d): For each project year for which funding is requested, show the total amount requested for each applicable
budget object.
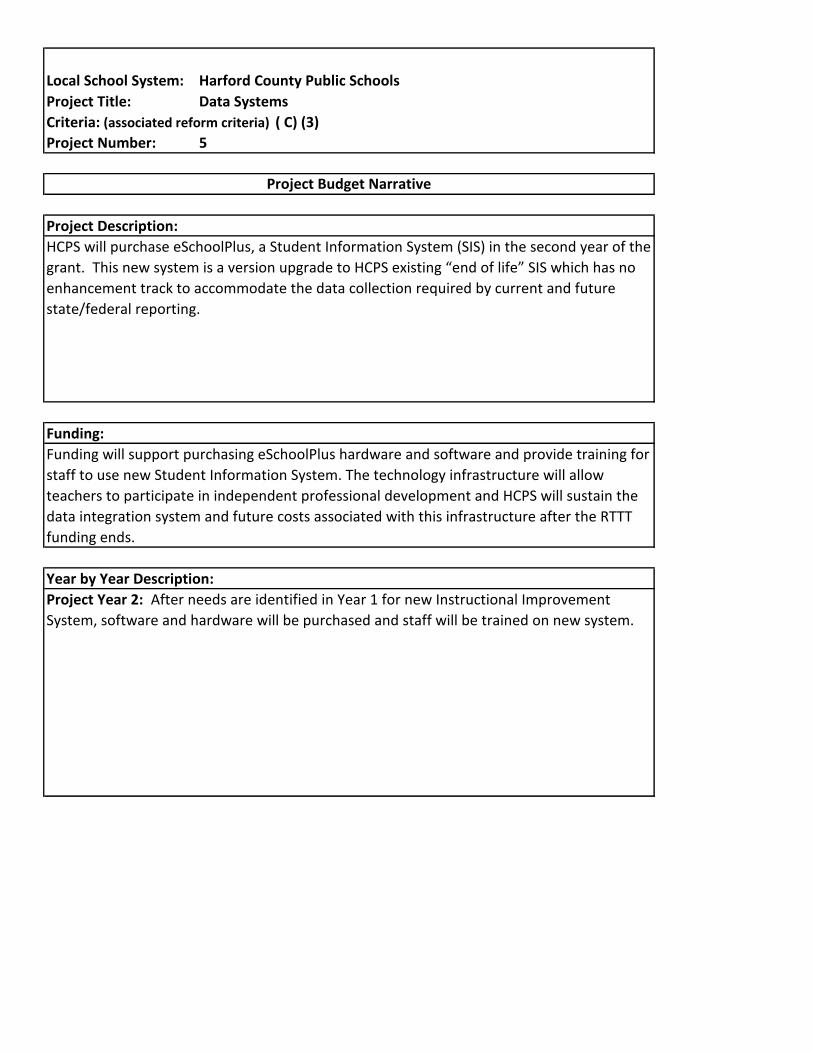
Local School System: Harford County Public Schools
Project Title: Data Systems
Criteria: (associated reform criteria) ( C) (3)
5
Year by Year Description:
Project Year 2: After needs are identified in Year 1 for new Instructional Improvement
System, software and hardware will be purchased and staff will be trained on new system.
Project Number:
Project Budget Narrative
Project Description:
HCPS will purchase eSchoolPlus, a Student Information System (SIS) in the second year of the
grant. This new system is a version upgrade to HCPS existing “end of life” SIS which has no
enhancement track to accommodate the data collection required by current and future
state/federal reporting.
Funding:
Funding will support purchasing eSchoolPlus hardware and software and provide training for
staff to use new Student Information System. The technology infrastructure will allow
teachers to participate in independent professional development and HCPS will sustain the
data integration system and future costs associated with this infrastructure after the RTTT
funding ends.

Project Name: Data Systems
LEA: Harford County Public Schools
Project Number: 5
Year 1 Year 2* Year 3* Year 4* Total
FTE - - - - -
Salary - - - - -
Total - - - - -
Year 1 Year 2* Year 3* Year 4* Total
eSchoolPlus
software - 165,000 - - 165,000
eSchoolPlus - 25,000 - - 25,000
Total - 190,000 - - 190,000
Year 1 Year 2* Year 3* Year 4* Total
item - - - - -
item - - - - -
Total - - - - -
Supplies and Materials: expenditures for articles or materials which meet one or more of the conditions
outlined on page 66 of the Local Financial Reporting Manual. Please provide a brief description of the supplies
and materials included with this project. In the table below, please itemize the supplies and materials. Add
rows if necessary.
Please provide complete details for year 1. For years 2-4, please provide an estimate of costs and also provide
the basis for this estimate here.
Project Details by Object
Salaries and Wages: provide a brief description of the salaries and wages included with this project. Please
provide information by employee classification. If necessary, repeat the FTE table for each classification.
Include the number of FTE multiplied by the annual salary for each year.
Please provide complete details for year 1. For years 2-4, please provide an estimate of costs and also provide
the basis for this estimate here.
Contract Services: expenditures for services performed by persons who are no on the LEA payroll, including
equipment repair. Please provide a brief description of the contracted services included with this project. In
the table below, please itemize the services provided. Add rows if necessary.
Year 2: Contract with eSchoolPlus to provide software and support for new Student Information System.
Estimate of costs are: (No Suggestions) Applications $125,000; IBM Cognos 8 Base Bundle - Upgrade for
impromptu or ReportNet Customers $26,600, SunGard Learning Center $12,900; Implementation
Coordination $12,000; and Data Conversion Services-(No Suggestions) Migrations $13,500
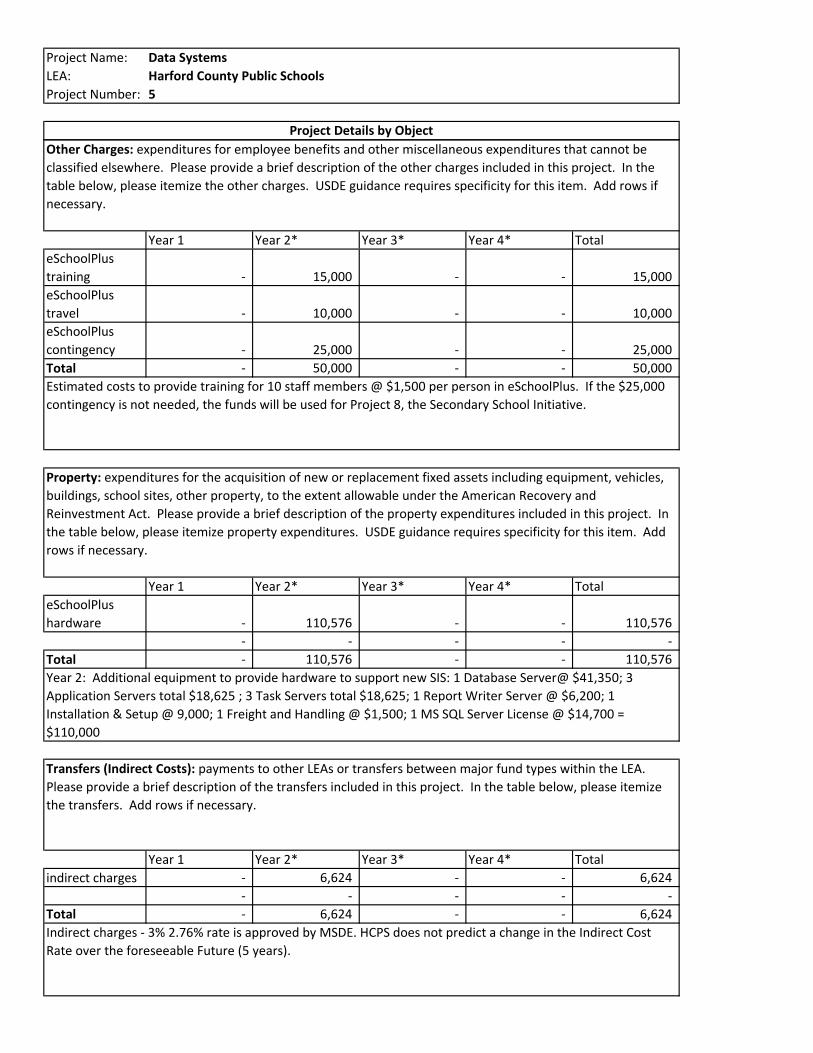
Project Name: Data Systems
LEA: Harford County Public Schools
Project Number: 5
Project Details by Object
Year 1 Year 2* Year 3* Year 4* Total
eSchoolPlus
training - 15,000 - - 15,000
eSchoolPlus
travel - 10,000 - - 10,000
eSchoolPlus
contingency - 25,000 - - 25,000
Total - 50,000 - - 50,000
Year 1 Year 2* Year 3* Year 4* Total
eSchoolPlus
hardware - 110,576 - - 110,576
- - - - -
Total - 110,576 - - 110,576
Year 1 Year 2* Year 3* Year 4* Total
indirect charges - 6,624 - - 6,624
- - - - -
Total - 6,624 - - 6,624
Indirect charges - 3% 2.76% rate is approved by MSDE. HCPS does not predict a change in the Indirect Cost
Rate over the foreseeable Future (5 years).
Other Charges: expenditures for employee benefits and other miscellaneous expenditures that cannot be
classified elsewhere. Please provide a brief description of the other charges included in this project. In the
table below, please itemize the other charges. USDE guidance requires specificity for this item. Add rows if
necessary.
Estimated costs to provide training for 10 staff members @ $1,500 per person in eSchoolPlus. If the $25,000
contingency is not needed, the funds will be used for Project 8, the Secondary School Initiative.
Property: expenditures for the acquisition of new or replacement fixed assets including equipment, vehicles,
buildings, school sites, other property, to the extent allowable under the American Recovery and
Reinvestment Act. Please provide a brief description of the property expenditures included in this project. In
the table below, please itemize property expenditures. USDE guidance requires specificity for this item. Add
rows if necessary.
Year 2: Additional equipment to provide hardware to support new SIS: 1 Database Server@ $41,350; 3
Application Servers total $18,625 ; 3 Task Servers total $18,625; 1 Report Writer Server @ $6,200; 1
Installation & Setup @ 9,000; 1 Freight and Handling @ $1,500; 1 MS SQL Server License @ $14,700 =
$110,000
Transfers (Indirect Costs): payments to other LEAs or transfers between major fund types within the LEA.
Please provide a brief description of the transfers included in this project. In the table below, please itemize
the transfers. Add rows if necessary.

Project Name: Data Systems
LEA: Harford County Public Schools
Project Number: 5
Project Details by Object
Total Project Costs
Year 1 Year 2* Year 3* Year 4* Total
- 357,200 - - 357,200
Project Year 2: Estimated costs to support purchasing eSchoolPlus.
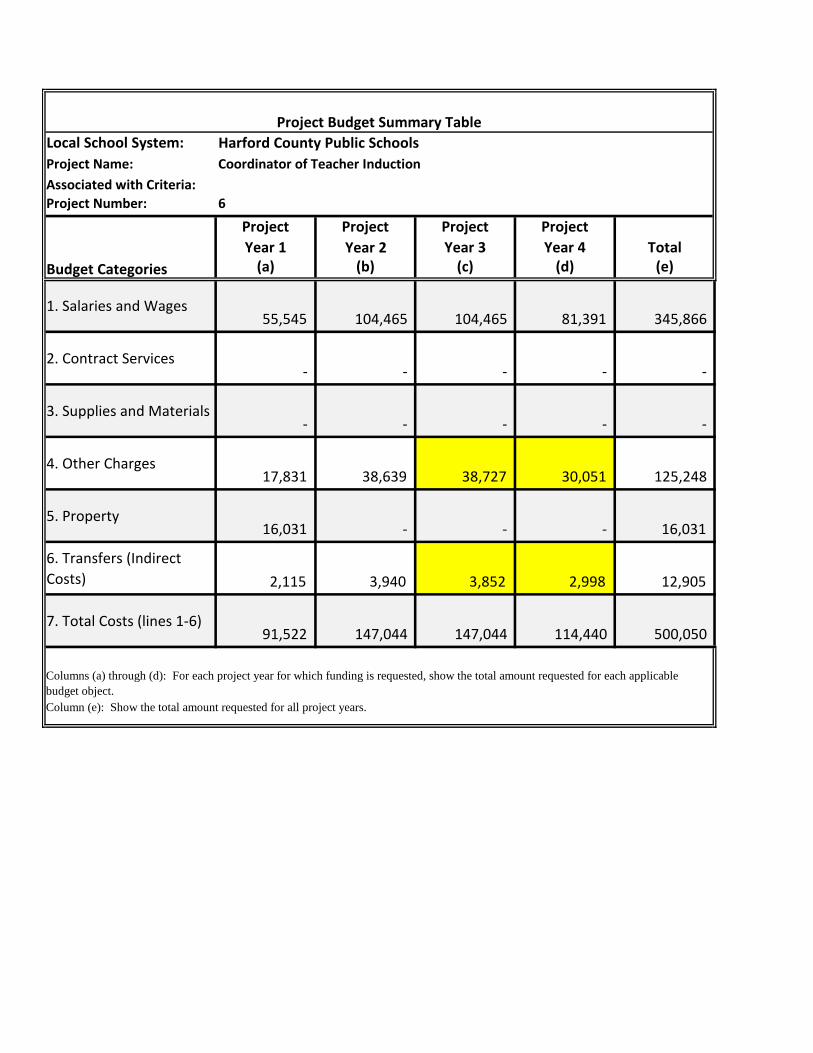
Local School System: Harford County Public Schools
Project Name: Coordinator of Teacher Induction
Associated with Criteria:
Project Number: 6
Project Project Project Project
Year 1 Year 2 Year 3 Year 4 Total(a) (b) (c) (d) (e)
1. Salaries and Wages 55,545 104,465 104,465 81,391 345,866
2. Contract Services - - - - -
3. Supplies and Materials - - - - -
4. Other Charges 17,831 38,639 38,727 30,051 125,248
5. Property 16,031 - - - 16,031
6. Transfers (Indirect
Costs) 2,115 3,940 3,852 2,998 12,905
7. Total Costs (lines 1-6) 91,522 147,044 147,044 114,440 500,050
Column (e): Show the total amount requested for all project years.
Project Budget Summary Table
Budget Categories
Columns (a) through (d): For each project year for which funding is requested, show the total amount requested for each applicable
budget object.
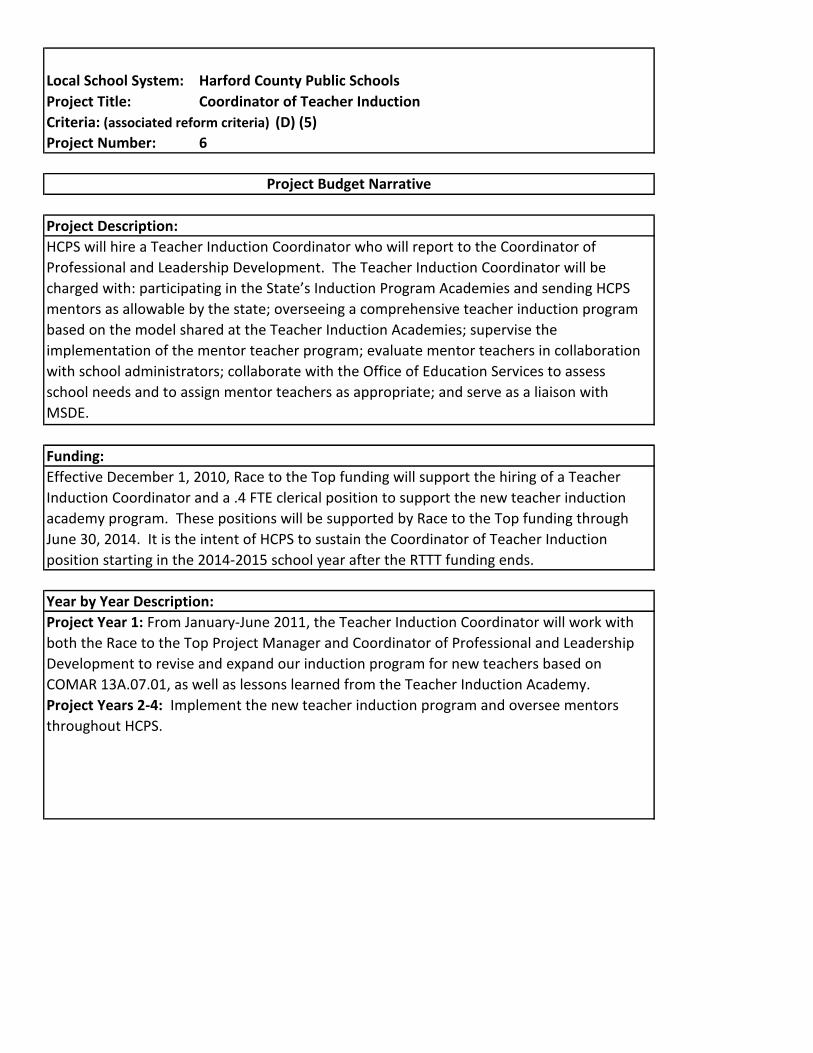
Local School System: Harford County Public Schools
Project Title: Coordinator of Teacher Induction
Criteria: (associated reform criteria) (D) (5)
6
Year by Year Description:
Project Year 1: From January-June 2011, the Teacher Induction Coordinator will work with
both the Race to the Top Project Manager and Coordinator of Professional and Leadership
Development to revise and expand our induction program for new teachers based on
COMAR 13A.07.01, as well as lessons learned from the Teacher Induction Academy.
Project Years 2-4: Implement the new teacher induction program and oversee mentors
throughout HCPS.
Project Number:
Project Budget Narrative
Project Description:
HCPS will hire a Teacher Induction Coordinator who will report to the Coordinator of
Professional and Leadership Development. The Teacher Induction Coordinator will be
charged with: participating in the State’s Induction Program Academies and sending HCPS
mentors as allowable by the state; overseeing a comprehensive teacher induction program
based on the model shared at the Teacher Induction Academies; supervise the
implementation of the mentor teacher program; evaluate mentor teachers in collaboration
with school administrators; collaborate with the Office of Education Services to assess
school needs and to assign mentor teachers as appropriate; and serve as a liaison with
MSDE.
Funding:
Effective December 1, 2010, Race to the Top funding will support the hiring of a Teacher
Induction Coordinator and a .4 FTE clerical position to support the new teacher induction
academy program. These positions will be supported by Race to the Top funding through
June 30, 2014. It is the intent of HCPS to sustain the Coordinator of Teacher Induction
position starting in the 2014-2015 school year after the RTTT funding ends.
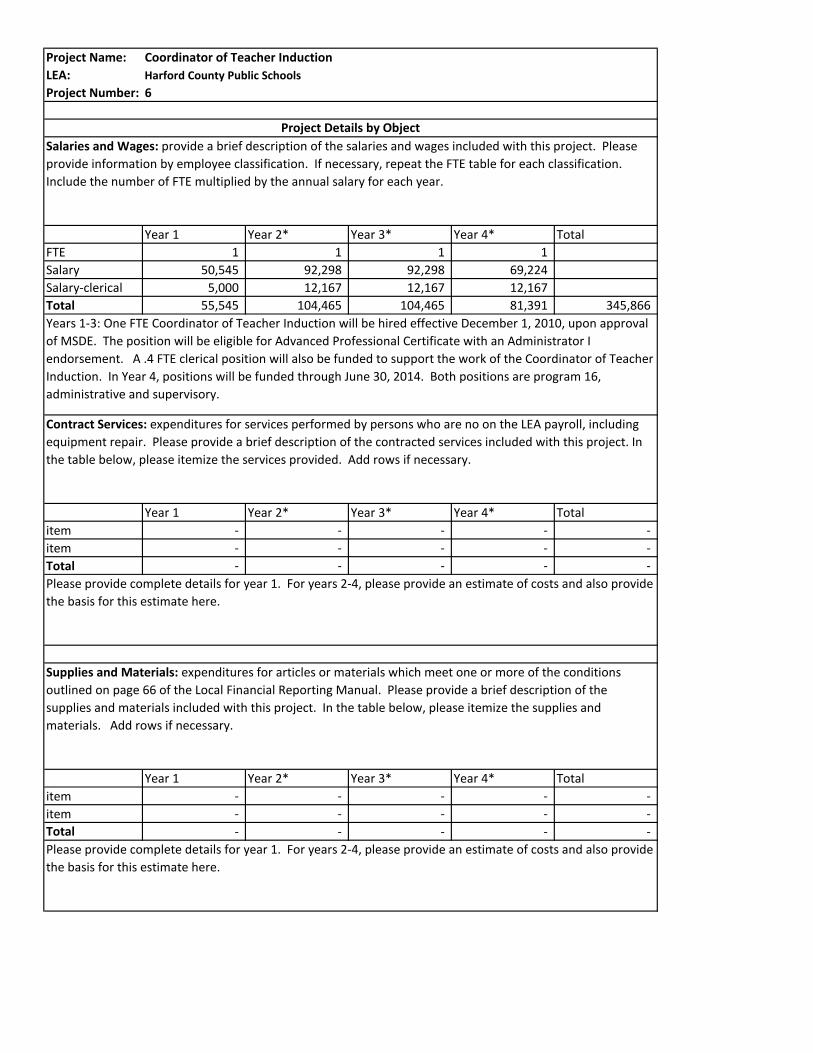
Project Name: Coordinator of Teacher Induction
LEA: Harford County Public Schools
Project Number: 6
Year 1 Year 2* Year 3* Year 4* Total
FTE 1 1 1 1
Salary 50,545 92,298 92,298 69,224
Salary-clerical 5,000 12,167 12,167 12,167
Total 55,545 104,465 104,465 81,391 345,866
Year 1 Year 2* Year 3* Year 4* Total
item - - - - -
item - - - - -
Total - - - - -
Year 1 Year 2* Year 3* Year 4* Total
item - - - - -
item - - - - -
Total - - - - -
Supplies and Materials: expenditures for articles or materials which meet one or more of the conditions
outlined on page 66 of the Local Financial Reporting Manual. Please provide a brief description of the
supplies and materials included with this project. In the table below, please itemize the supplies and
materials. Add rows if necessary.
Project Details by Object
Salaries and Wages: provide a brief description of the salaries and wages included with this project. Please
provide information by employee classification. If necessary, repeat the FTE table for each classification.
Include the number of FTE multiplied by the annual salary for each year.
Years 1-3: One FTE Coordinator of Teacher Induction will be hired effective December 1, 2010, upon approval
of MSDE. The position will be eligible for Advanced Professional Certificate with an Administrator I
endorsement. A .4 FTE clerical position will also be funded to support the work of the Coordinator of Teacher
Induction. In Year 4, positions will be funded through June 30, 2014. Both positions are program 16,
administrative and supervisory.
Contract Services: expenditures for services performed by persons who are no on the LEA payroll, including
equipment repair. Please provide a brief description of the contracted services included with this project. In
the table below, please itemize the services provided. Add rows if necessary.
Please provide complete details for year 1. For years 2-4, please provide an estimate of costs and also provide
the basis for this estimate here.
Please provide complete details for year 1. For years 2-4, please provide an estimate of costs and also provide
the basis for this estimate here.
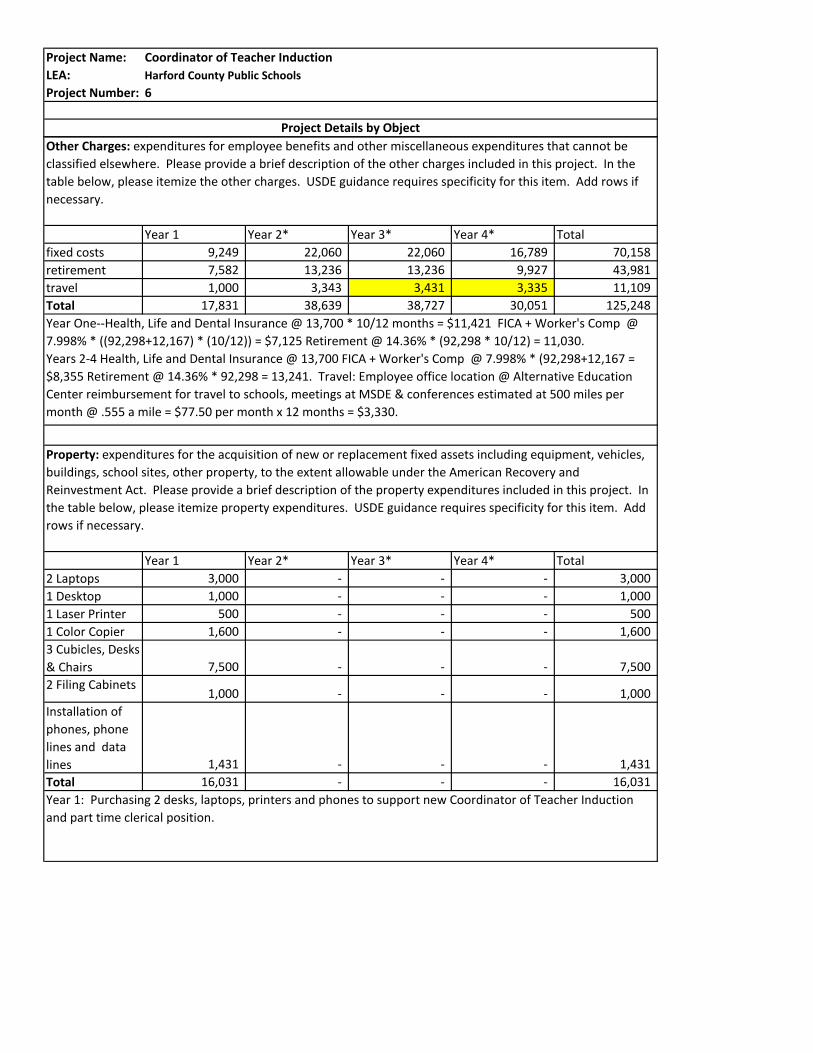
Project Name: Coordinator of Teacher Induction
LEA: Harford County Public Schools
Project Number: 6
Project Details by Object
Year 1 Year 2* Year 3* Year 4* Total
fixed costs 9,249 22,060 22,060 16,789 70,158
retirement 7,582 13,236 13,236 9,927 43,981
travel 1,000 3,343 3,431 3,335 11,109
Total 17,831 38,639 38,727 30,051 125,248
Year 1 Year 2* Year 3* Year 4* Total
2 Laptops 3,000 - - - 3,000
1 Desktop 1,000 - - - 1,000
1 Laser Printer 500 - - - 500
1 Color Copier 1,600 - - - 1,600
3 Cubicles, Desks
& Chairs 7,500 - - - 7,500
2 Filing Cabinets1,000 - - - 1,000
Installation of
phones, phone
lines and data
lines 1,431 - - - 1,431
Total 16,031 - - - 16,031
Other Charges: expenditures for employee benefits and other miscellaneous expenditures that cannot be
classified elsewhere. Please provide a brief description of the other charges included in this project. In the
table below, please itemize the other charges. USDE guidance requires specificity for this item. Add rows if
necessary.
Year One--Health, Life and Dental Insurance @ 13,700 * 10/12 months = $11,421 FICA + Worker's Comp @
7.998% * ((92,298+12,167) * (10/12)) = $7,125 Retirement @ 14.36% * (92,298 * 10/12) = 11,030.
Years 2-4 Health, Life and Dental Insurance @ 13,700 FICA + Worker's Comp @ 7.998% * (92,298+12,167 =
$8,355 Retirement @ 14.36% * 92,298 = 13,241. Travel: Employee office location @ Alternative Education
Center reimbursement for travel to schools, meetings at MSDE & conferences estimated at 500 miles per
month @ .555 a mile = $77.50 per month x 12 months = $3,330.
Property: expenditures for the acquisition of new or replacement fixed assets including equipment, vehicles,
buildings, school sites, other property, to the extent allowable under the American Recovery and
Reinvestment Act. Please provide a brief description of the property expenditures included in this project. In
the table below, please itemize property expenditures. USDE guidance requires specificity for this item. Add
rows if necessary.
Year 1: Purchasing 2 desks, laptops, printers and phones to support new Coordinator of Teacher Induction
and part time clerical position.
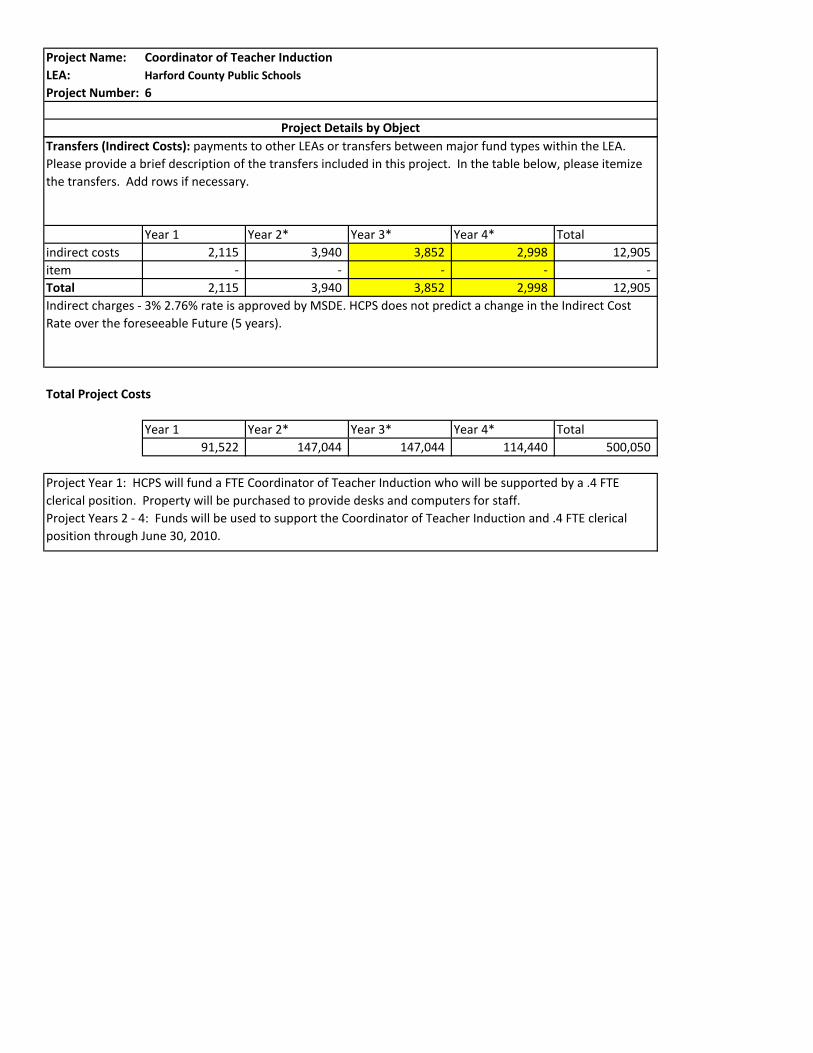
Project Name: Coordinator of Teacher Induction
LEA: Harford County Public Schools
Project Number: 6
Project Details by Object
Year 1 Year 2* Year 3* Year 4* Total
indirect costs 2,115 3,940 3,852 2,998 12,905
item - - - - -
Total 2,115 3,940 3,852 2,998 12,905
Total Project Costs
Year 1 Year 2* Year 3* Year 4* Total
91,522 147,044 147,044 114,440 500,050
Transfers (Indirect Costs): payments to other LEAs or transfers between major fund types within the LEA.
Please provide a brief description of the transfers included in this project. In the table below, please itemize
the transfers. Add rows if necessary.
Indirect charges - 3% 2.76% rate is approved by MSDE. HCPS does not predict a change in the Indirect Cost
Rate over the foreseeable Future (5 years).
Project Year 1: HCPS will fund a FTE Coordinator of Teacher Induction who will be supported by a .4 FTE
clerical position. Property will be purchased to provide desks and computers for staff.
Project Years 2 - 4: Funds will be used to support the Coordinator of Teacher Induction and .4 FTE clerical
position through June 30, 2010.
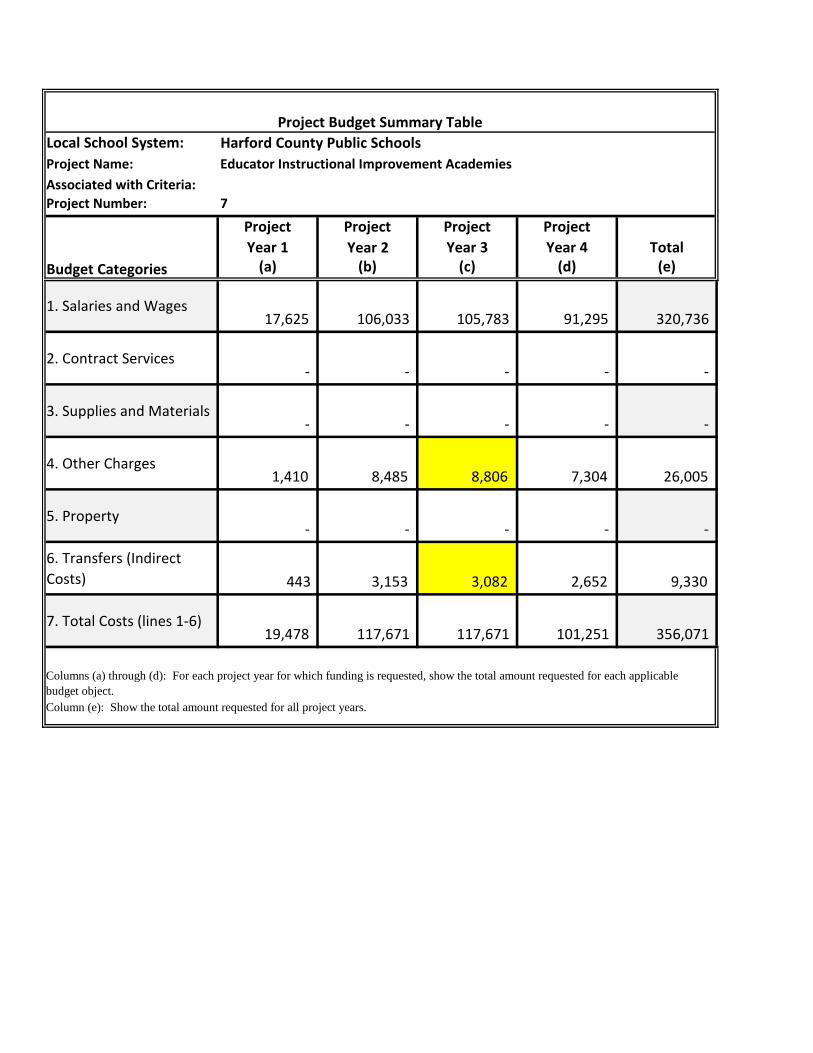
Local School System: Harford County Public Schools
Project Name: Educator Instructional Improvement Academies
Associated with Criteria:
Project Number: 7
Project Project Project Project
Year 1 Year 2 Year 3 Year 4 Total(a) (b) (c) (d) (e)
1. Salaries and Wages 17,625 106,033 105,783 91,295 320,736
2. Contract Services - - - - -
3. Supplies and Materials - - - - -
4. Other Charges 1,410 8,485 8,806 7,304 26,005
5. Property - - - - -
6. Transfers (Indirect
Costs) 443 3,153 3,082 2,652 9,330
7. Total Costs (lines 1-6) 19,478 117,671 117,671 101,251 356,071
Column (e): Show the total amount requested for all project years.
Project Budget Summary Table
Budget Categories
Columns (a) through (d): For each project year for which funding is requested, show the total amount requested for each applicable
budget object.

Local School System: Harford County Public Schools
Project Title: Educator Instructional Improvement Academies
Criteria: (associated reform criteria) (D) (5)
7
Year by Year Description:
Project Years 1 - 4: In September 2011, secondary Master Teachers will be paid to provide
additional support for the "roll out" of the Instructional Improvement System in their
schools.
Project Years 2 - 4: Substitute teachers will be available so that all HCPS classroom teachers
can receive professional development during the school day in the information presented at
the EIIA.
Project Number:
Project Budget Narrative
Project Description:
HCPS will ensure all 53 schools send teams to participate in the Educator Instructional
Improvement Academies. These teams will be identified by the RTTT Project Manager in
concert with the Executive Directors of Middle School and High School Performance. As
follow up from the EIIA, secondary school-based teams will identify additional key staff
unable to attend the academy and train them in the information presented. These staff will
be core content teachers and/or special educators. Throughout all four years of the grant, all
teachers will be trained in the new Instructional Improvement System.
Funding:
Race to the Top funding will provide stipends for 2 additional Master Teachers in each
secondary school to be trained in the EIIA model and assist in the teacher use of the
Instructional Improvement System. Funds will also provide substitutes (one sub per 2
teachers) so that teachers can attend 3 hours of professional development during the school
year.
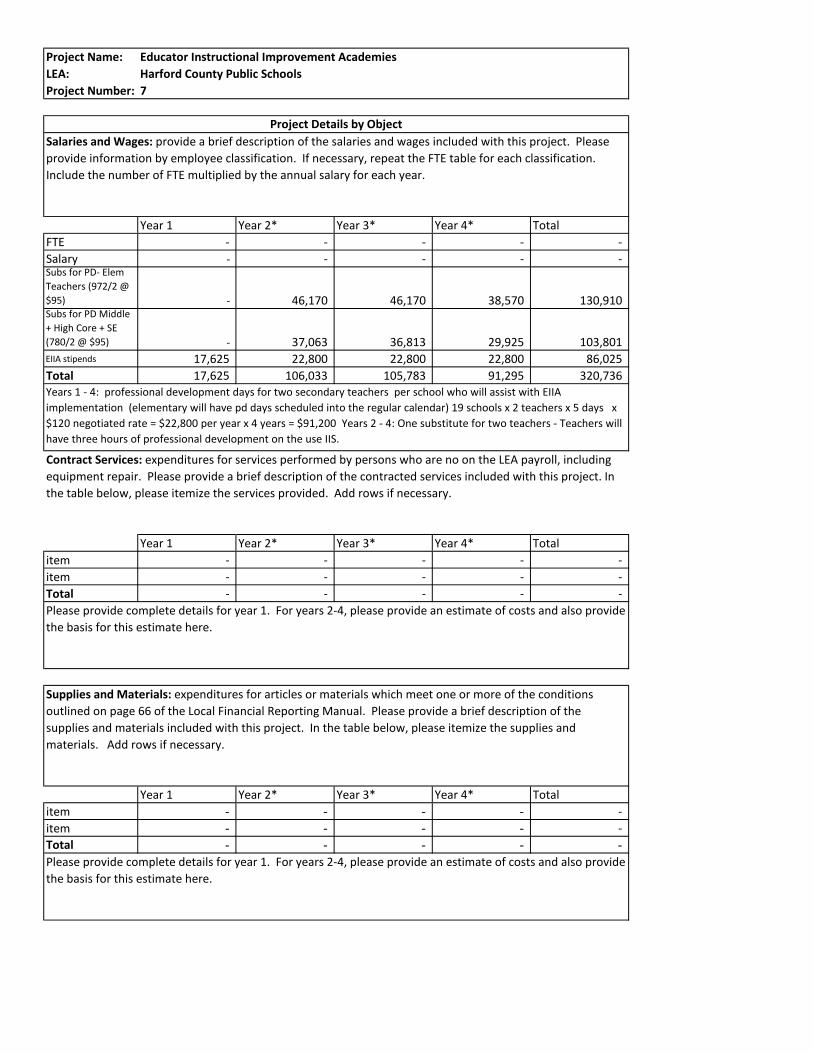
Project Name: Educator Instructional Improvement Academies
LEA: Harford County Public Schools
Project Number: 7
Year 1 Year 2* Year 3* Year 4* Total
FTE - - - - -
Salary - - - - - Subs for PD- Elem
Teachers (972/2 @
$95) - 46,170 46,170 38,570 130,910 Subs for PD Middle
+ High Core + SE
(780/2 @ $95) - 37,063 36,813 29,925 103,801 EIIA stipends 17,625 22,800 22,800 22,800 86,025
Total 17,625 106,033 105,783 91,295 320,736
Year 1 Year 2* Year 3* Year 4* Total
item - - - - -
item - - - - -
Total - - - - -
Year 1 Year 2* Year 3* Year 4* Total
item - - - - -
item - - - - -
Total - - - - -
Supplies and Materials: expenditures for articles or materials which meet one or more of the conditions
outlined on page 66 of the Local Financial Reporting Manual. Please provide a brief description of the
supplies and materials included with this project. In the table below, please itemize the supplies and
materials. Add rows if necessary.
Please provide complete details for year 1. For years 2-4, please provide an estimate of costs and also provide
the basis for this estimate here.
Project Details by Object
Salaries and Wages: provide a brief description of the salaries and wages included with this project. Please
provide information by employee classification. If necessary, repeat the FTE table for each classification.
Include the number of FTE multiplied by the annual salary for each year.
Years 1 - 4: professional development days for two secondary teachers per school who will assist with EIIA
implementation (elementary will have pd days scheduled into the regular calendar) 19 schools x 2 teachers x 5 days x
$120 negotiated rate = $22,800 per year x 4 years = $91,200 Years 2 - 4: One substitute for two teachers - Teachers will
have three hours of professional development on the use IIS.
Contract Services: expenditures for services performed by persons who are no on the LEA payroll, including
equipment repair. Please provide a brief description of the contracted services included with this project. In
the table below, please itemize the services provided. Add rows if necessary.
Please provide complete details for year 1. For years 2-4, please provide an estimate of costs and also provide
the basis for this estimate here.
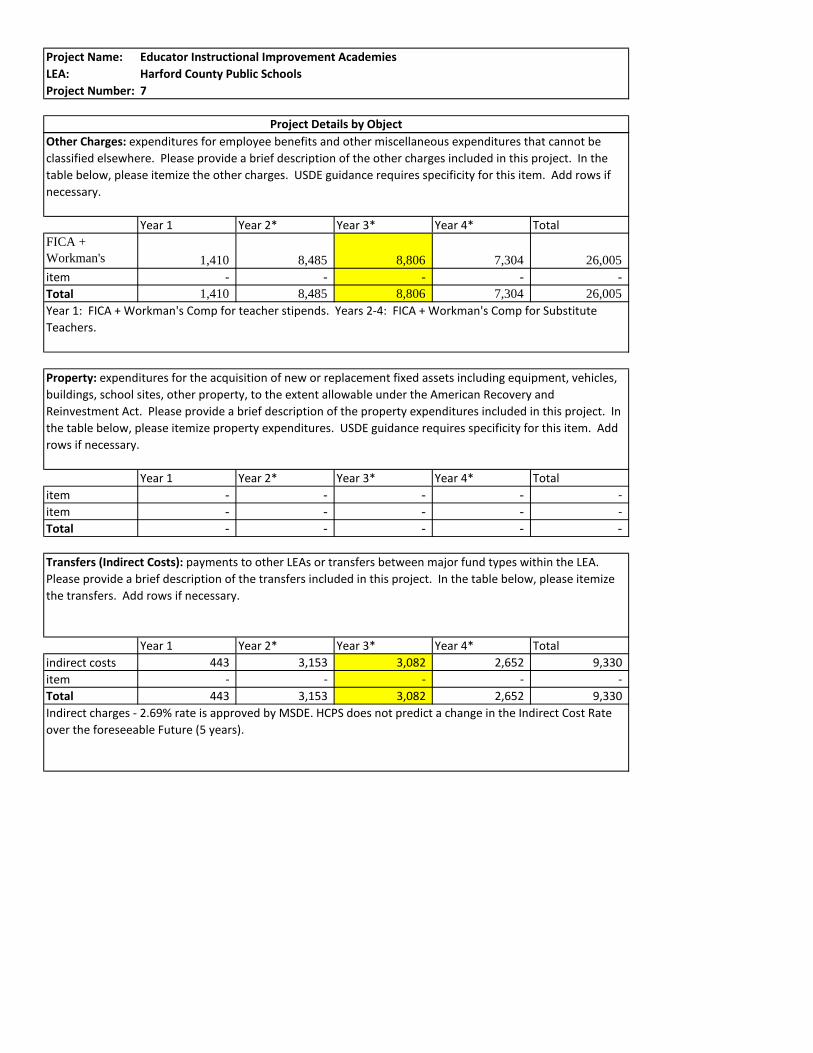
Project Name: Educator Instructional Improvement Academies
LEA: Harford County Public Schools
Project Number: 7
Project Details by Object
Year 1 Year 2* Year 3* Year 4* Total
FICA +
Workman's
Comp1,410 8,485 8,806 7,304 26,005
item - - - - -
Total 1,410 8,485 8,806 7,304 26,005
Year 1 Year 2* Year 3* Year 4* Total
item - - - - -
item - - - - -
Total - - - - -
Year 1 Year 2* Year 3* Year 4* Total
indirect costs 443 3,153 3,082 2,652 9,330
item - - - - -
Total 443 3,153 3,082 2,652 9,330
Other Charges: expenditures for employee benefits and other miscellaneous expenditures that cannot be
classified elsewhere. Please provide a brief description of the other charges included in this project. In the
table below, please itemize the other charges. USDE guidance requires specificity for this item. Add rows if
necessary.
Year 1: FICA + Workman's Comp for teacher stipends. Years 2-4: FICA + Workman's Comp for Substitute
Teachers.
Property: expenditures for the acquisition of new or replacement fixed assets including equipment, vehicles,
buildings, school sites, other property, to the extent allowable under the American Recovery and
Reinvestment Act. Please provide a brief description of the property expenditures included in this project. In
the table below, please itemize property expenditures. USDE guidance requires specificity for this item. Add
rows if necessary.
Transfers (Indirect Costs): payments to other LEAs or transfers between major fund types within the LEA.
Please provide a brief description of the transfers included in this project. In the table below, please itemize
the transfers. Add rows if necessary.
Indirect charges - 2.69% rate is approved by MSDE. HCPS does not predict a change in the Indirect Cost Rate
over the foreseeable Future (5 years).

Project Name: Educator Instructional Improvement Academies
LEA: Harford County Public Schools
Project Number: 7
Project Details by Object
Total Project Costs
Year 1 Year 2* Year 3* Year 4* Total
19,478 117,671 117,671 101,251 356,071
Project supports school- implementation of EIIA providing stipends and substitutes for teachers throughout
four years of the grant.
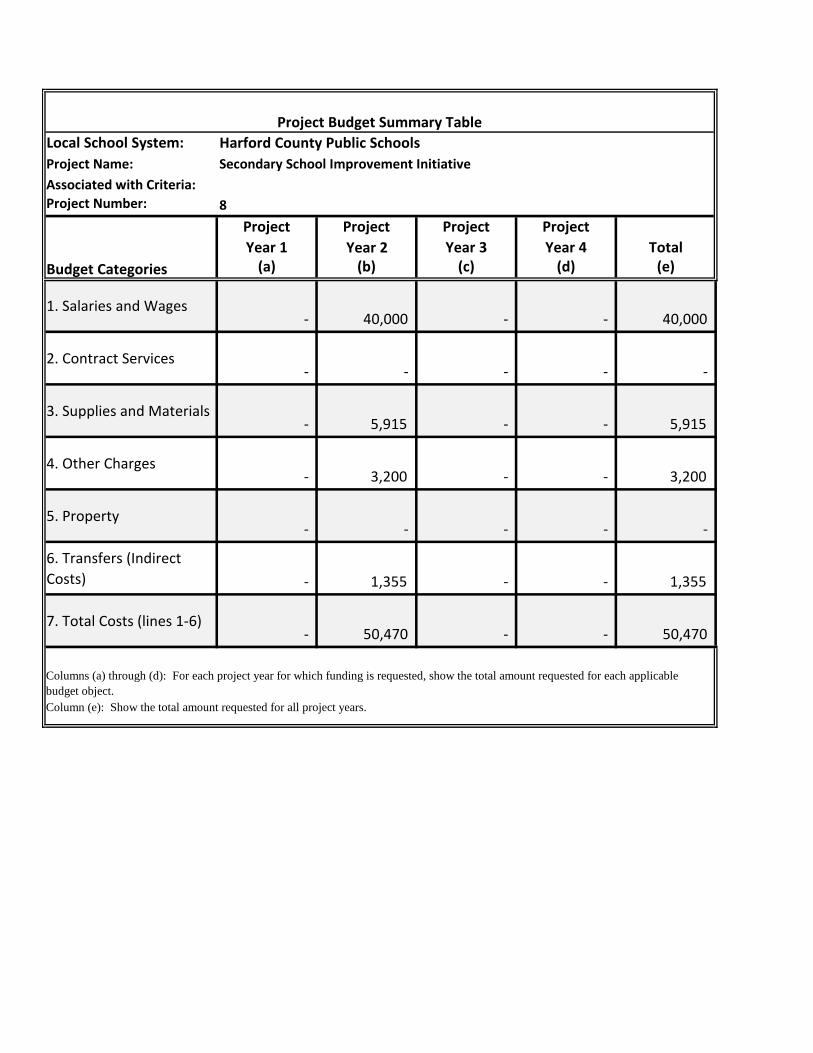
Local School System: Harford County Public Schools
Project Name: Secondary School Improvement Initiative
Associated with Criteria:
Project Number: 8
Project Project Project Project
Year 1 Year 2 Year 3 Year 4 Total(a) (b) (c) (d) (e)
1. Salaries and Wages - 40,000 - - 40,000
2. Contract Services - - - - -
3. Supplies and Materials - 5,915 - - 5,915
4. Other Charges - 3,200 - - 3,200
5. Property - - - - -
6. Transfers (Indirect
Costs) - 1,355 - - 1,355
7. Total Costs (lines 1-6) - 50,470 - - 50,470
Column (e): Show the total amount requested for all project years.
Project Budget Summary Table
Budget Categories
Columns (a) through (d): For each project year for which funding is requested, show the total amount requested for each applicable
budget object.
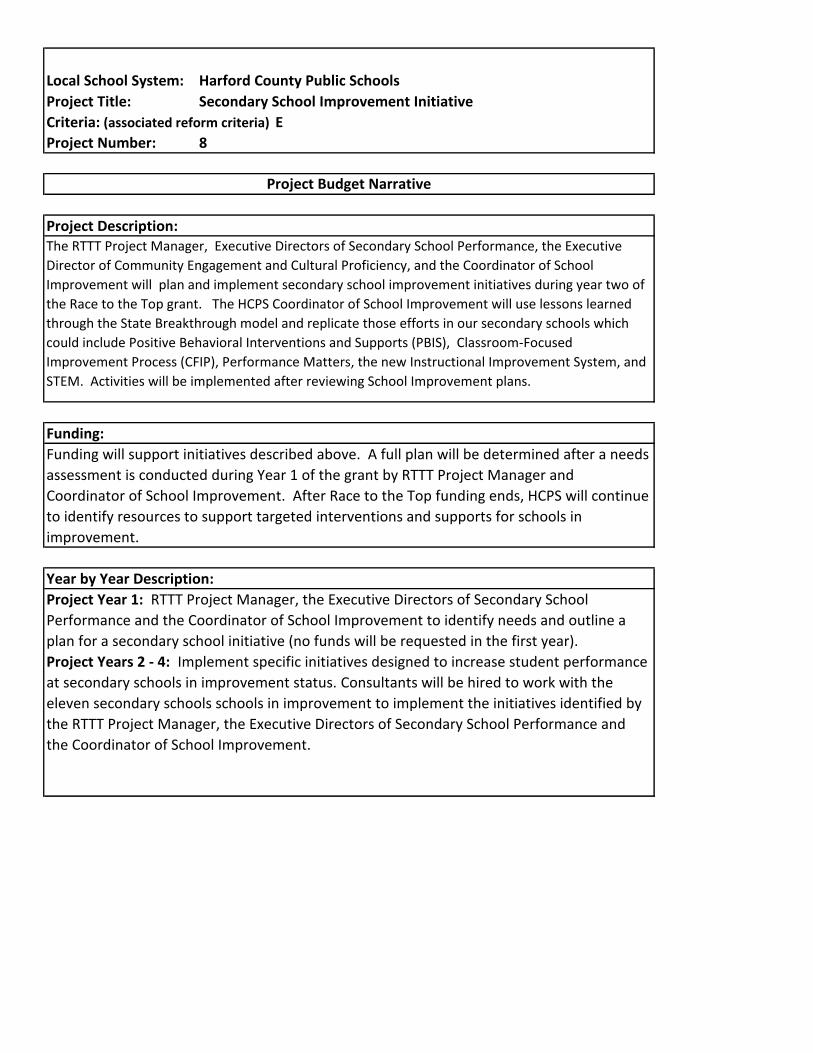
Local School System: Harford County Public Schools
Project Title: Secondary School Improvement Initiative
Criteria: (associated reform criteria) E
8
Year by Year Description:
Project Year 1: RTTT Project Manager, the Executive Directors of Secondary School
Performance and the Coordinator of School Improvement to identify needs and outline a
plan for a secondary school initiative (no funds will be requested in the first year).
Project Years 2 - 4: Implement specific initiatives designed to increase student performance
at secondary schools in improvement status. Consultants will be hired to work with the
eleven secondary schools schools in improvement to implement the initiatives identified by
the RTTT Project Manager, the Executive Directors of Secondary School Performance and
the Coordinator of School Improvement.
Project Number:
Project Budget Narrative
Project Description:The RTTT Project Manager, Executive Directors of Secondary School Performance, the Executive
Director of Community Engagement and Cultural Proficiency, and the Coordinator of School
Improvement will plan and implement secondary school improvement initiatives during year two of
the Race to the Top grant. The HCPS Coordinator of School Improvement will use lessons learned
through the State Breakthrough model and replicate those efforts in our secondary schools which
could include Positive Behavioral Interventions and Supports (PBIS), Classroom-Focused
Improvement Process (CFIP), Performance Matters, the new Instructional Improvement System, and
STEM. Activities will be implemented after reviewing School Improvement plans.
Funding:
Funding will support initiatives described above. A full plan will be determined after a needs
assessment is conducted during Year 1 of the grant by RTTT Project Manager and
Coordinator of School Improvement. After Race to the Top funding ends, HCPS will continue
to identify resources to support targeted interventions and supports for schools in
improvement.
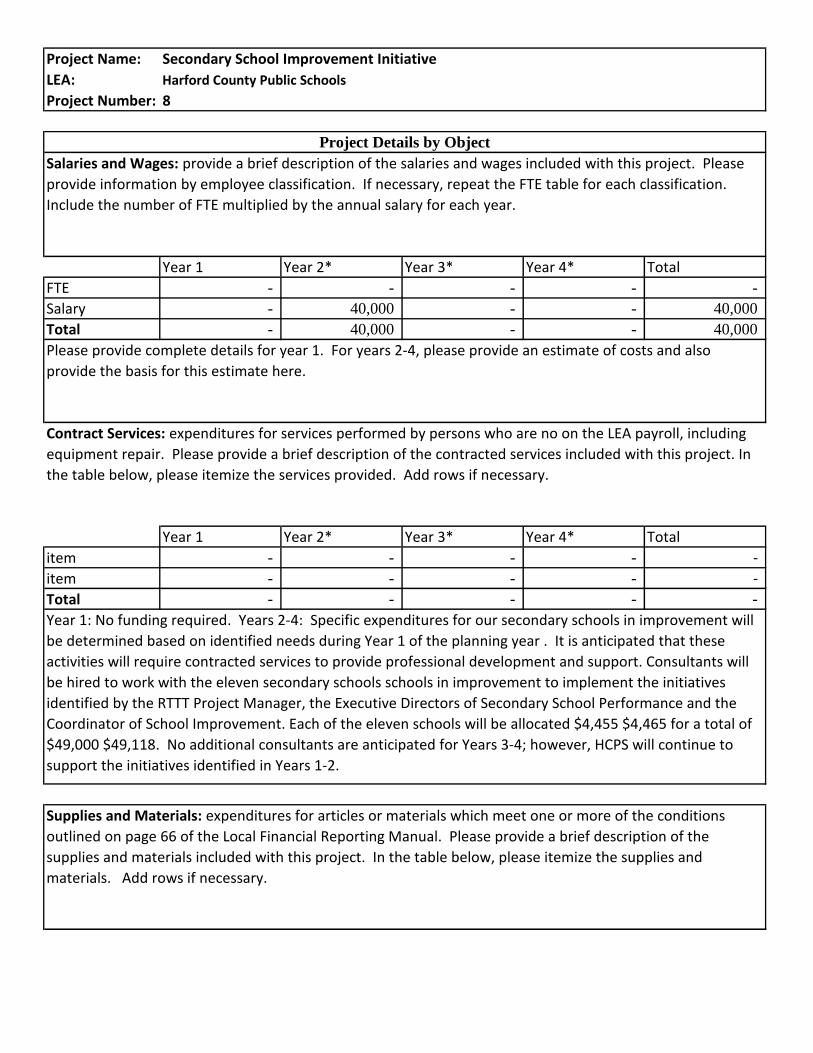
Project Name: Secondary School Improvement Initiative
LEA: Harford County Public Schools
Project Number: 8
Year 1 Year 2* Year 3* Year 4* Total
FTE - - - - -
Salary - 40,000 - - 40,000
Total - 40,000 - - 40,000
Year 1 Year 2* Year 3* Year 4* Total
item - - - - -
item - - - - -
Total - - - - -
Supplies and Materials: expenditures for articles or materials which meet one or more of the conditions
outlined on page 66 of the Local Financial Reporting Manual. Please provide a brief description of the
supplies and materials included with this project. In the table below, please itemize the supplies and
materials. Add rows if necessary.
Project Details by Object
Salaries and Wages: provide a brief description of the salaries and wages included with this project. Please
provide information by employee classification. If necessary, repeat the FTE table for each classification.
Include the number of FTE multiplied by the annual salary for each year.
Please provide complete details for year 1. For years 2-4, please provide an estimate of costs and also
provide the basis for this estimate here.
Contract Services: expenditures for services performed by persons who are no on the LEA payroll, including
equipment repair. Please provide a brief description of the contracted services included with this project. In
the table below, please itemize the services provided. Add rows if necessary.
Year 1: No funding required. Years 2-4: Specific expenditures for our secondary schools in improvement will
be determined based on identified needs during Year 1 of the planning year . It is anticipated that these
activities will require contracted services to provide professional development and support. Consultants will
be hired to work with the eleven secondary schools schools in improvement to implement the initiatives
identified by the RTTT Project Manager, the Executive Directors of Secondary School Performance and the
Coordinator of School Improvement. Each of the eleven schools will be allocated $4,455 $4,465 for a total of
$49,000 $49,118. No additional consultants are anticipated for Years 3-4; however, HCPS will continue to
support the initiatives identified in Years 1-2.
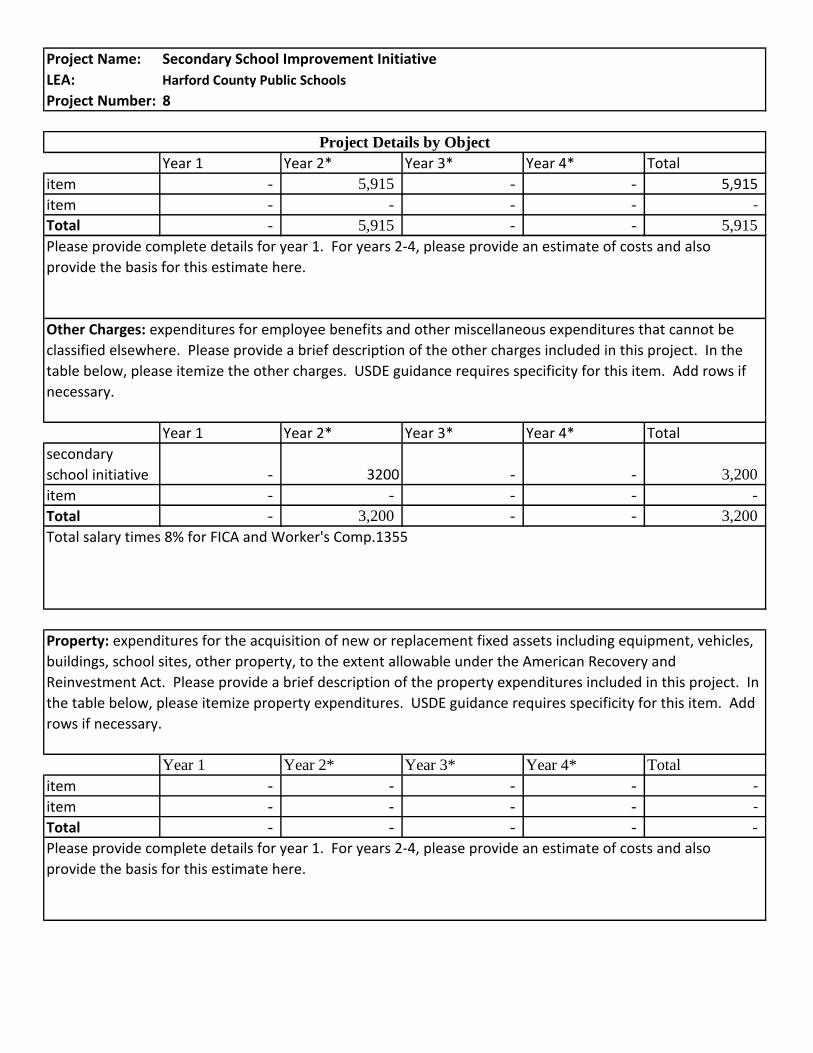
Project Name: Secondary School Improvement Initiative
LEA: Harford County Public Schools
Project Number: 8
Project Details by Object
Year 1 Year 2* Year 3* Year 4* Total
item - 5,915 - - 5,915
item - - - - -
Total - 5,915 - - 5,915
Year 1 Year 2* Year 3* Year 4* Total
secondary
school initiative - 3200 - - 3,200
item - - - - -
Total - 3,200 - - 3,200
Year 1 Year 2* Year 3* Year 4* Total
item - - - - -
item - - - - -
Total - - - - -
Please provide complete details for year 1. For years 2-4, please provide an estimate of costs and also
provide the basis for this estimate here.
Other Charges: expenditures for employee benefits and other miscellaneous expenditures that cannot be
classified elsewhere. Please provide a brief description of the other charges included in this project. In the
table below, please itemize the other charges. USDE guidance requires specificity for this item. Add rows if
necessary.
Total salary times 8% for FICA and Worker's Comp.1355
Property: expenditures for the acquisition of new or replacement fixed assets including equipment, vehicles,
buildings, school sites, other property, to the extent allowable under the American Recovery and
Reinvestment Act. Please provide a brief description of the property expenditures included in this project. In
the table below, please itemize property expenditures. USDE guidance requires specificity for this item. Add
rows if necessary.
Please provide complete details for year 1. For years 2-4, please provide an estimate of costs and also
provide the basis for this estimate here.
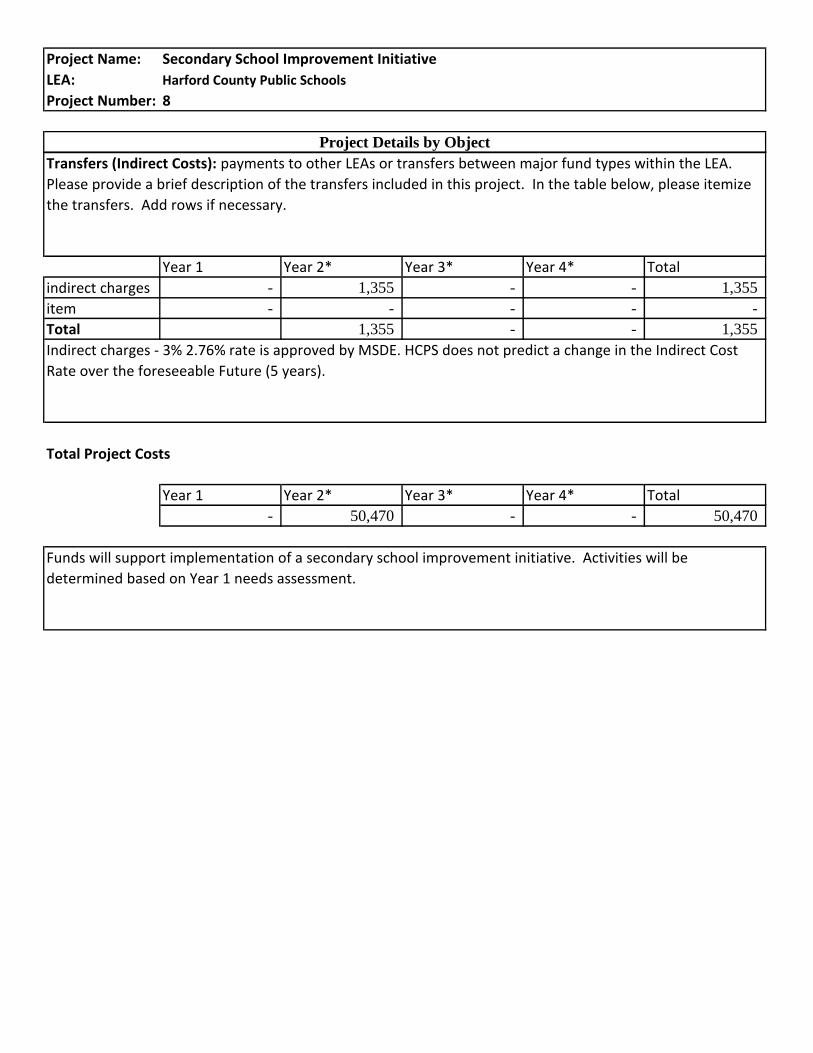
Project Name: Secondary School Improvement Initiative
LEA: Harford County Public Schools
Project Number: 8
Project Details by Object
Year 1 Year 2* Year 3* Year 4* Total
indirect charges - 1,355 - - 1,355
item - - - - -
Total 1,355 - - 1,355
Total Project Costs
Year 1 Year 2* Year 3* Year 4* Total
- 50,470 - - 50,470
Indirect charges - 3% 2.76% rate is approved by MSDE. HCPS does not predict a change in the Indirect Cost
Rate over the foreseeable Future (5 years).
Funds will support implementation of a secondary school improvement initiative. Activities will be
determined based on Year 1 needs assessment.
Transfers (Indirect Costs): payments to other LEAs or transfers between major fund types within the LEA.
Please provide a brief description of the transfers included in this project. In the table below, please itemize
the transfers. Add rows if necessary.
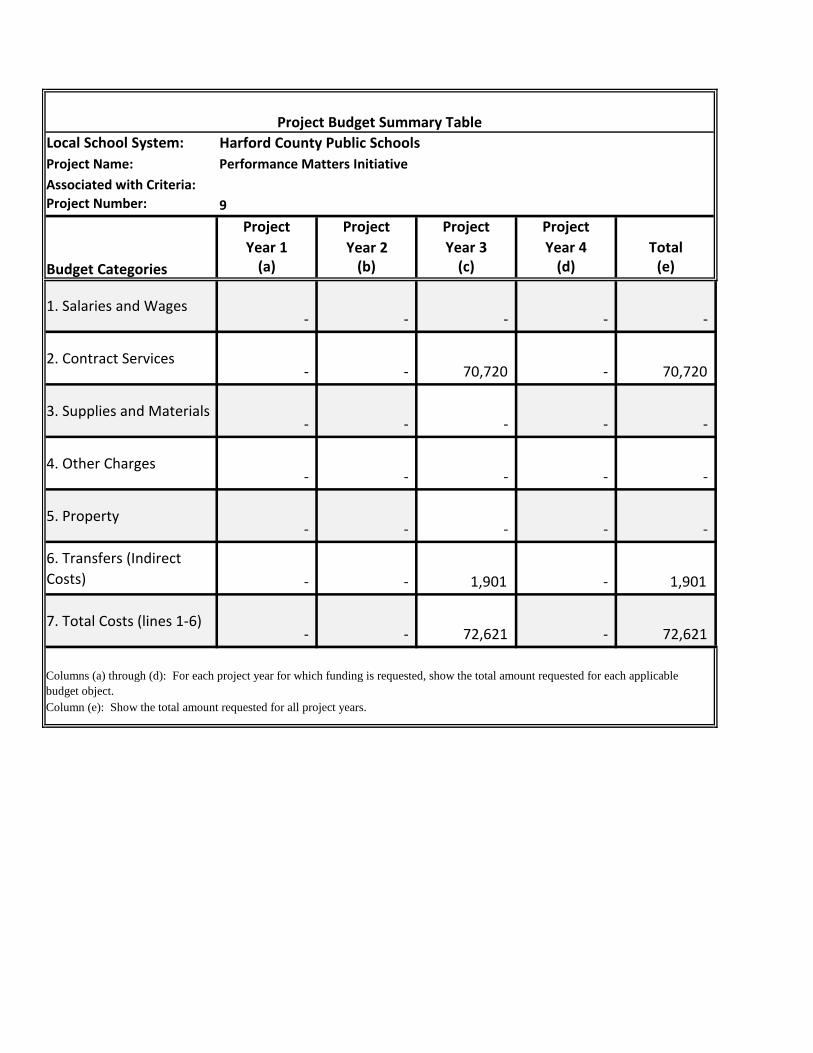
Local School System: Harford County Public Schools
Project Name: Performance Matters Initiative
Associated with Criteria:
Project Number: 9
Project Project Project Project
Year 1 Year 2 Year 3 Year 4 Total(a) (b) (c) (d) (e)
1. Salaries and Wages - - - - -
2. Contract Services - - 70,720 - 70,720
3. Supplies and Materials - - - - -
4. Other Charges - - - - -
5. Property - - - - -
6. Transfers (Indirect
Costs) - - 1,901 - 1,901
7. Total Costs (lines 1-6) - - 72,621 - 72,621
Column (e): Show the total amount requested for all project years.
Project Budget Summary Table
Budget Categories
Columns (a) through (d): For each project year for which funding is requested, show the total amount requested for each applicable
budget object.
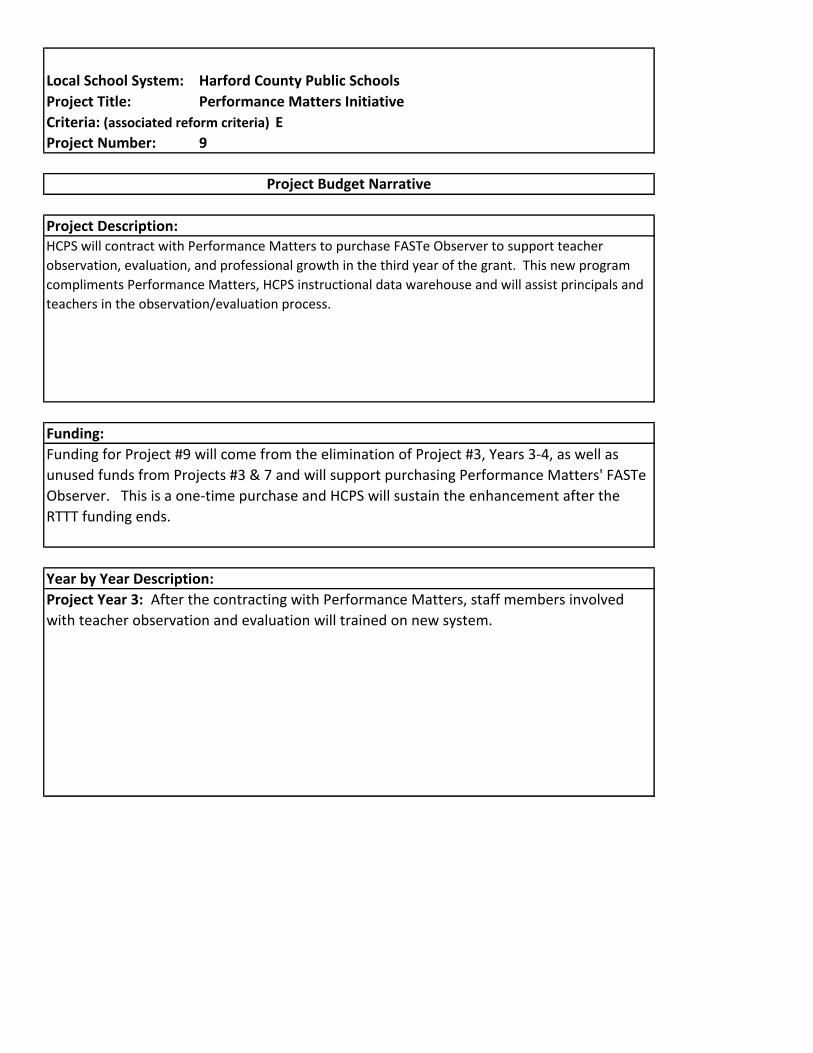
Local School System: Harford County Public Schools
Project Title: Performance Matters Initiative
Criteria: (associated reform criteria) E
9
Year by Year Description:
Project Year 3: After the contracting with Performance Matters, staff members involved
with teacher observation and evaluation will trained on new system.
Project Number:
Project Budget Narrative
Project Description:HCPS will contract with Performance Matters to purchase FASTe Observer to support teacher
observation, evaluation, and professional growth in the third year of the grant. This new program
compliments Performance Matters, HCPS instructional data warehouse and will assist principals and
teachers in the observation/evaluation process.
Funding:
Funding for Project #9 will come from the elimination of Project #3, Years 3-4, as well as
unused funds from Projects #3 & 7 and will support purchasing Performance Matters' FASTe
Observer. This is a one-time purchase and HCPS will sustain the enhancement after the
RTTT funding ends.

Project Name: Performance Matters Initiative
LEA: Harford County Public Schools
Project Number: 9
Year 1 Year 2* Year 3* Year 4* Total
FTE - - - - -
Salary - - - - -
Total - - - - -
Year 1 Year 2* Year 3* Year 4* Total
item - - 70,720 - 70,720
item - - - - -
Total - - 70,720 - 70,720
Supplies and Materials: expenditures for articles or materials which meet one or more of the conditions
outlined on page 66 of the Local Financial Reporting Manual. Please provide a brief description of the
supplies and materials included with this project. In the table below, please itemize the supplies and
materials. Add rows if necessary.
Project Details by Object
Salaries and Wages: provide a brief description of the salaries and wages included with this project. Please
provide information by employee classification. If necessary, repeat the FTE table for each classification.
Include the number of FTE multiplied by the annual salary for each year.
Please provide complete details for year 1. For years 2-4, please provide an estimate of costs and also
provide the basis for this estimate here.
Contract Services: expenditures for services performed by persons who are no on the LEA payroll, including
equipment repair. Please provide a brief description of the contracted services included with this project. In
the table below, please itemize the services provided. Add rows if necessary.
Year 1, 2, and 4 no funds needed. Year 3 $70,720 will be used to purchase FASTe Observer from Performance
Matters which will allow for HCPS to support teacher observation, evaluation, and professional growth in the
third year of the grant. This new program compliments Performance Matters, HCPS instructional data
warehouse and will assist principals and teachers in the observation/evaluation process.

Project Name: Performance Matters Initiative
LEA: Harford County Public Schools
Project Number: 9
Project Details by Object
Year 1 Year 2* Year 3* Year 4* Total
item - - - - -
item - - - - -
Total - - - - -
Year 1 Year 2* Year 3* Year 4* Total
secondary
school initiative - 0 - - -
item - - - - -
Total - - - - -
Year 1 Year 2* Year 3* Year 4* Total
item - - - - -
item - - - - -
Total - - - - -
Please provide complete details for year 1. For years 2-4, please provide an estimate of costs and also
provide the basis for this estimate here.
Other Charges: expenditures for employee benefits and other miscellaneous expenditures that cannot be
classified elsewhere. Please provide a brief description of the other charges included in this project. In the
table below, please itemize the other charges. USDE guidance requires specificity for this item. Add rows if
necessary.
Total salary times 8% for FICA and Worker's Comp.1355
Property: expenditures for the acquisition of new or replacement fixed assets including equipment, vehicles,
buildings, school sites, other property, to the extent allowable under the American Recovery and
Reinvestment Act. Please provide a brief description of the property expenditures included in this project. In
the table below, please itemize property expenditures. USDE guidance requires specificity for this item. Add
rows if necessary.
Please provide complete details for year 1. For years 2-4, please provide an estimate of costs and also
provide the basis for this estimate here.
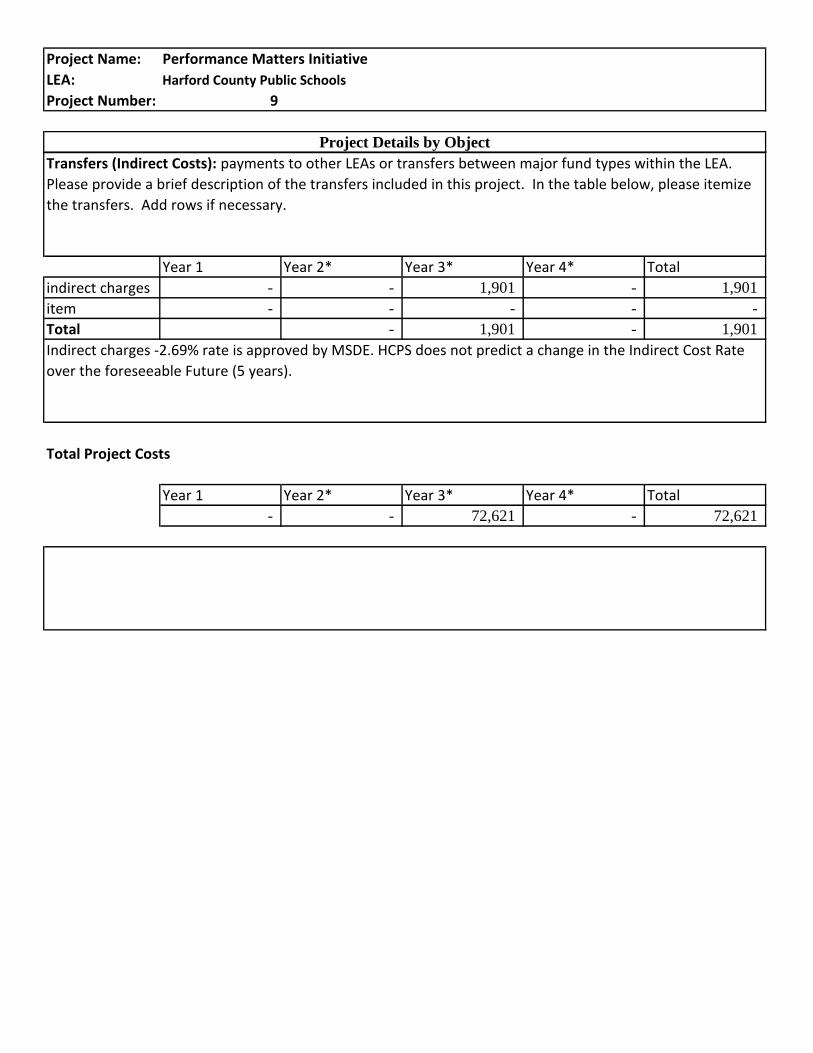
Project Name: Performance Matters Initiative
LEA: Harford County Public Schools
Project Number: 9
Project Details by Object
Year 1 Year 2* Year 3* Year 4* Total
indirect charges - - 1,901 - 1,901
item - - - - -
Total - 1,901 - 1,901
Total Project Costs
Year 1 Year 2* Year 3* Year 4* Total
- - 72,621 - 72,621
Indirect charges -2.69% rate is approved by MSDE. HCPS does not predict a change in the Indirect Cost Rate
over the foreseeable Future (5 years).
Transfers (Indirect Costs): payments to other LEAs or transfers between major fund types within the LEA.
Please provide a brief description of the transfers included in this project. In the table below, please itemize
the transfers. Add rows if necessary.
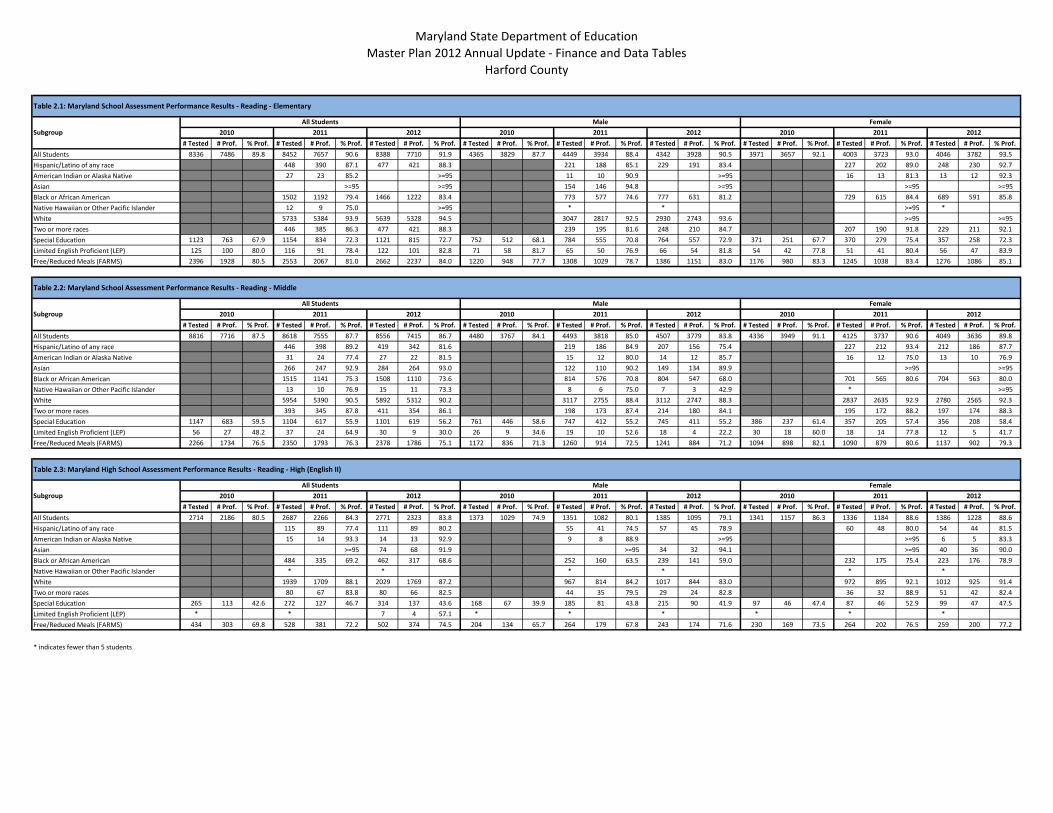
Maryland State Department of Education
Master Plan 2012 Annual Update - Finance and Data Tables
Harford County
# Tested # Prof. % Prof. # Tested # Prof. % Prof. # Tested # Prof. % Prof. # Tested # Prof. % Prof. # Tested # Prof. % Prof. # Tested # Prof. % Prof. # Tested # Prof. % Prof. # Tested # Prof. % Prof. # Tested # Prof. % Prof.
All Students 8336 7486 89.8 8452 7657 90.6 8388 7710 91.9 4365 3829 87.7 4449 3934 88.4 4342 3928 90.5 3971 3657 92.1 4003 3723 93.0 4046 3782 93.5
Hispanic/Latino of any race 448 390 87.1 477 421 88.3 221 188 85.1 229 191 83.4 227 202 89.0 248 230 92.7
American Indian or Alaska Native 27 23 85.2 >=95 11 10 90.9 >=95 16 13 81.3 13 12 92.3
Asian >=95 >=95 154 146 94.8 >=95 >=95 >=95
Black or African American 1502 1192 79.4 1466 1222 83.4 773 577 74.6 777 631 81.2 729 615 84.4 689 591 85.8
Native Hawaiian or Other Pacific Islander 12 9 75.0 >=95 * * >=95 *
White 5733 5384 93.9 5639 5328 94.5 3047 2817 92.5 2930 2743 93.6 >=95 >=95
Two or more races 446 385 86.3 477 421 88.3 239 195 81.6 248 210 84.7 207 190 91.8 229 211 92.1
Special Education 1123 763 67.9 1154 834 72.3 1121 815 72.7 752 512 68.1 784 555 70.8 764 557 72.9 371 251 67.7 370 279 75.4 357 258 72.3
Limited English Proficient (LEP) 125 100 80.0 116 91 78.4 122 101 82.8 71 58 81.7 65 50 76.9 66 54 81.8 54 42 77.8 51 41 80.4 56 47 83.9
Free/Reduced Meals (FARMS) 2396 1928 80.5 2553 2067 81.0 2662 2237 84.0 1220 948 77.7 1308 1029 78.7 1386 1151 83.0 1176 980 83.3 1245 1038 83.4 1276 1086 85.1
# Tested # Prof. % Prof. # Tested # Prof. % Prof. # Tested # Prof. % Prof. # Tested # Prof. % Prof. # Tested # Prof. % Prof. # Tested # Prof. % Prof. # Tested # Prof. % Prof. # Tested # Prof. % Prof. # Tested # Prof. % Prof.
All Students 8816 7716 87.5 8618 7555 87.7 8556 7415 86.7 4480 3767 84.1 4493 3818 85.0 4507 3779 83.8 4336 3949 91.1 4125 3737 90.6 4049 3636 89.8
Hispanic/Latino of any race 446 398 89.2 419 342 81.6 219 186 84.9 207 156 75.4 227 212 93.4 212 186 87.7
American Indian or Alaska Native 31 24 77.4 27 22 81.5 15 12 80.0 14 12 85.7 16 12 75.0 13 10 76.9
Asian 266 247 92.9 284 264 93.0 122 110 90.2 149 134 89.9 >=95 >=95
Black or African American 1515 1141 75.3 1508 1110 73.6 814 576 70.8 804 547 68.0 701 565 80.6 704 563 80.0
Native Hawaiian or Other Pacific Islander 13 10 76.9 15 11 73.3 8 6 75.0 7 3 42.9 * >=95
White 5954 5390 90.5 5892 5312 90.2 3117 2755 88.4 3112 2747 88.3 2837 2635 92.9 2780 2565 92.3
Two or more races 393 345 87.8 411 354 86.1 198 173 87.4 214 180 84.1 195 172 88.2 197 174 88.3
Special Education 1147 683 59.5 1104 617 55.9 1101 619 56.2 761 446 58.6 747 412 55.2 745 411 55.2 386 237 61.4 357 205 57.4 356 208 58.4
Limited English Proficient (LEP) 56 27 48.2 37 24 64.9 30 9 30.0 26 9 34.6 19 10 52.6 18 4 22.2 30 18 60.0 18 14 77.8 12 5 41.7
Free/Reduced Meals (FARMS) 2266 1734 76.5 2350 1793 76.3 2378 1786 75.1 1172 836 71.3 1260 914 72.5 1241 884 71.2 1094 898 82.1 1090 879 80.6 1137 902 79.3
# Tested # Prof. % Prof. # Tested # Prof. % Prof. # Tested # Prof. % Prof. # Tested # Prof. % Prof. # Tested # Prof. % Prof. # Tested # Prof. % Prof. # Tested # Prof. % Prof. # Tested # Prof. % Prof. # Tested # Prof. % Prof.
All Students 2714 2186 80.5 2687 2266 84.3 2771 2323 83.8 1373 1029 74.9 1351 1082 80.1 1385 1095 79.1 1341 1157 86.3 1336 1184 88.6 1386 1228 88.6
Hispanic/Latino of any race 115 89 77.4 111 89 80.2 55 41 74.5 57 45 78.9 60 48 80.0 54 44 81.5
American Indian or Alaska Native 15 14 93.3 14 13 92.9 9 8 88.9 >=95 >=95 6 5 83.3
Asian >=95 74 68 91.9 >=95 34 32 94.1 >=95 40 36 90.0
Black or African American 484 335 69.2 462 317 68.6 252 160 63.5 239 141 59.0 232 175 75.4 223 176 78.9
Native Hawaiian or Other Pacific Islander * * * * * *
White 1939 1709 88.1 2029 1769 87.2 967 814 84.2 1017 844 83.0 972 895 92.1 1012 925 91.4
Two or more races 80 67 83.8 80 66 82.5 44 35 79.5 29 24 82.8 36 32 88.9 51 42 82.4
Special Education 265 113 42.6 272 127 46.7 314 137 43.6 168 67 39.9 185 81 43.8 215 90 41.9 97 46 47.4 87 46 52.9 99 47 47.5
Limited English Proficient (LEP) * * 7 4 57.1 * * * * * *
Free/Reduced Meals (FARMS) 434 303 69.8 528 381 72.2 502 374 74.5 204 134 65.7 264 179 67.8 243 174 71.6 230 169 73.5 264 202 76.5 259 200 77.2
* indicates fewer than 5 students
Table 2.1: Maryland School Assessment Performance Results - Reading - Elementary
Subgroup
All Students Male Female
20102010 2011 2012 20102012 2011 2011 2012
Table 2.2: Maryland School Assessment Performance Results - Reading - Middle
Subgroup
All Students Male Female
20122012 2010 20112010 2011 2012 2010 2011
Table 2.3: Maryland High School Assessment Performance Results - Reading - High (English II)
Subgroup
All Students Male Female
2010 2011 2012 2010 2011 2012 2010 2011 2012
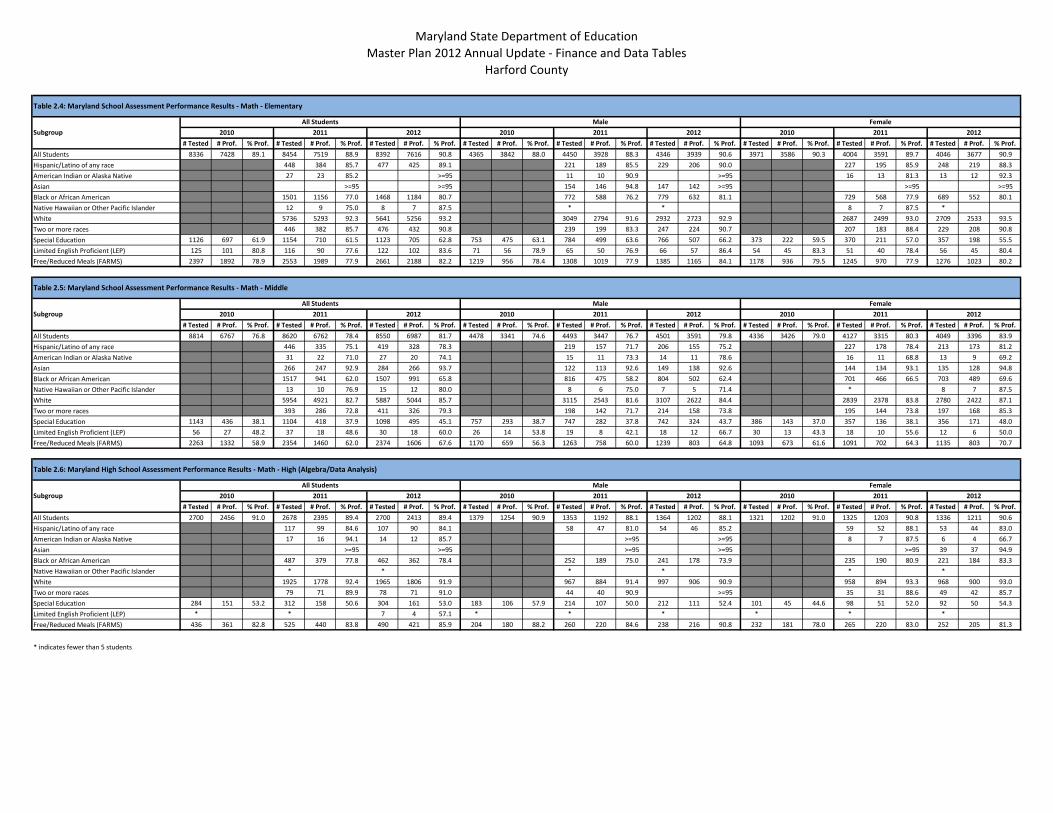
Maryland State Department of Education
Master Plan 2012 Annual Update - Finance and Data Tables
Harford County
# Tested # Prof. % Prof. # Tested # Prof. % Prof. # Tested # Prof. % Prof. # Tested # Prof. % Prof. # Tested # Prof. % Prof. # Tested # Prof. % Prof. # Tested # Prof. % Prof. # Tested # Prof. % Prof. # Tested # Prof. % Prof.
All Students 8336 7428 89.1 8454 7519 88.9 8392 7616 90.8 4365 3842 88.0 4450 3928 88.3 4346 3939 90.6 3971 3586 90.3 4004 3591 89.7 4046 3677 90.9
Hispanic/Latino of any race 448 384 85.7 477 425 89.1 221 189 85.5 229 206 90.0 227 195 85.9 248 219 88.3
American Indian or Alaska Native 27 23 85.2 >=95 11 10 90.9 >=95 16 13 81.3 13 12 92.3
Asian >=95 >=95 154 146 94.8 147 142 >=95 >=95 >=95
Black or African American 1501 1156 77.0 1468 1184 80.7 772 588 76.2 779 632 81.1 729 568 77.9 689 552 80.1
Native Hawaiian or Other Pacific Islander 12 9 75.0 8 7 87.5 * * 8 7 87.5 *
White 5736 5293 92.3 5641 5256 93.2 3049 2794 91.6 2932 2723 92.9 2687 2499 93.0 2709 2533 93.5
Two or more races 446 382 85.7 476 432 90.8 239 199 83.3 247 224 90.7 207 183 88.4 229 208 90.8
Special Education 1126 697 61.9 1154 710 61.5 1123 705 62.8 753 475 63.1 784 499 63.6 766 507 66.2 373 222 59.5 370 211 57.0 357 198 55.5
Limited English Proficient (LEP) 125 101 80.8 116 90 77.6 122 102 83.6 71 56 78.9 65 50 76.9 66 57 86.4 54 45 83.3 51 40 78.4 56 45 80.4
Free/Reduced Meals (FARMS) 2397 1892 78.9 2553 1989 77.9 2661 2188 82.2 1219 956 78.4 1308 1019 77.9 1385 1165 84.1 1178 936 79.5 1245 970 77.9 1276 1023 80.2
# Tested # Prof. % Prof. # Tested # Prof. % Prof. # Tested # Prof. % Prof. # Tested # Prof. % Prof. # Tested # Prof. % Prof. # Tested # Prof. % Prof. # Tested # Prof. % Prof. # Tested # Prof. % Prof. # Tested # Prof. % Prof.
All Students 8814 6767 76.8 8620 6762 78.4 8550 6987 81.7 4478 3341 74.6 4493 3447 76.7 4501 3591 79.8 4336 3426 79.0 4127 3315 80.3 4049 3396 83.9
Hispanic/Latino of any race 446 335 75.1 419 328 78.3 219 157 71.7 206 155 75.2 227 178 78.4 213 173 81.2
American Indian or Alaska Native 31 22 71.0 27 20 74.1 15 11 73.3 14 11 78.6 16 11 68.8 13 9 69.2
Asian 266 247 92.9 284 266 93.7 122 113 92.6 149 138 92.6 144 134 93.1 135 128 94.8
Black or African American 1517 941 62.0 1507 991 65.8 816 475 58.2 804 502 62.4 701 466 66.5 703 489 69.6
Native Hawaiian or Other Pacific Islander 13 10 76.9 15 12 80.0 8 6 75.0 7 5 71.4 * 8 7 87.5
White 5954 4921 82.7 5887 5044 85.7 3115 2543 81.6 3107 2622 84.4 2839 2378 83.8 2780 2422 87.1
Two or more races 393 286 72.8 411 326 79.3 198 142 71.7 214 158 73.8 195 144 73.8 197 168 85.3
Special Education 1143 436 38.1 1104 418 37.9 1098 495 45.1 757 293 38.7 747 282 37.8 742 324 43.7 386 143 37.0 357 136 38.1 356 171 48.0
Limited English Proficient (LEP) 56 27 48.2 37 18 48.6 30 18 60.0 26 14 53.8 19 8 42.1 18 12 66.7 30 13 43.3 18 10 55.6 12 6 50.0
Free/Reduced Meals (FARMS) 2263 1332 58.9 2354 1460 62.0 2374 1606 67.6 1170 659 56.3 1263 758 60.0 1239 803 64.8 1093 673 61.6 1091 702 64.3 1135 803 70.7
# Tested # Prof. % Prof. # Tested # Prof. % Prof. # Tested # Prof. % Prof. # Tested # Prof. % Prof. # Tested # Prof. % Prof. # Tested # Prof. % Prof. # Tested # Prof. % Prof. # Tested # Prof. % Prof. # Tested # Prof. % Prof.
All Students 2700 2456 91.0 2678 2395 89.4 2700 2413 89.4 1379 1254 90.9 1353 1192 88.1 1364 1202 88.1 1321 1202 91.0 1325 1203 90.8 1336 1211 90.6
Hispanic/Latino of any race 117 99 84.6 107 90 84.1 58 47 81.0 54 46 85.2 59 52 88.1 53 44 83.0
American Indian or Alaska Native 17 16 94.1 14 12 85.7 >=95 >=95 8 7 87.5 6 4 66.7
Asian >=95 >=95 >=95 >=95 >=95 39 37 94.9
Black or African American 487 379 77.8 462 362 78.4 252 189 75.0 241 178 73.9 235 190 80.9 221 184 83.3
Native Hawaiian or Other Pacific Islander * * * * * *
White 1925 1778 92.4 1965 1806 91.9 967 884 91.4 997 906 90.9 958 894 93.3 968 900 93.0
Two or more races 79 71 89.9 78 71 91.0 44 40 90.9 >=95 35 31 88.6 49 42 85.7
Special Education 284 151 53.2 312 158 50.6 304 161 53.0 183 106 57.9 214 107 50.0 212 111 52.4 101 45 44.6 98 51 52.0 92 50 54.3
Limited English Proficient (LEP) * * 7 4 57.1 * * * * * *
Free/Reduced Meals (FARMS) 436 361 82.8 525 440 83.8 490 421 85.9 204 180 88.2 260 220 84.6 238 216 90.8 232 181 78.0 265 220 83.0 252 205 81.3
* indicates fewer than 5 students
2010 2011 2012 2010 2011 2012
2011 2012
Table 2.6: Maryland High School Assessment Performance Results - Math - High (Algebra/Data Analysis)
Subgroup
All Students Male Female
2010 2011 2012
2011 2012 2010 2011 2012 2010
2012 2010 2011 2012
Table 2.5: Maryland School Assessment Performance Results - Math - Middle
Subgroup
All Students Male Female
2010
Table 2.4: Maryland School Assessment Performance Results - Math - Elementary
Subgroup
All Students Male Female
2010 2011 2012 2010 2011
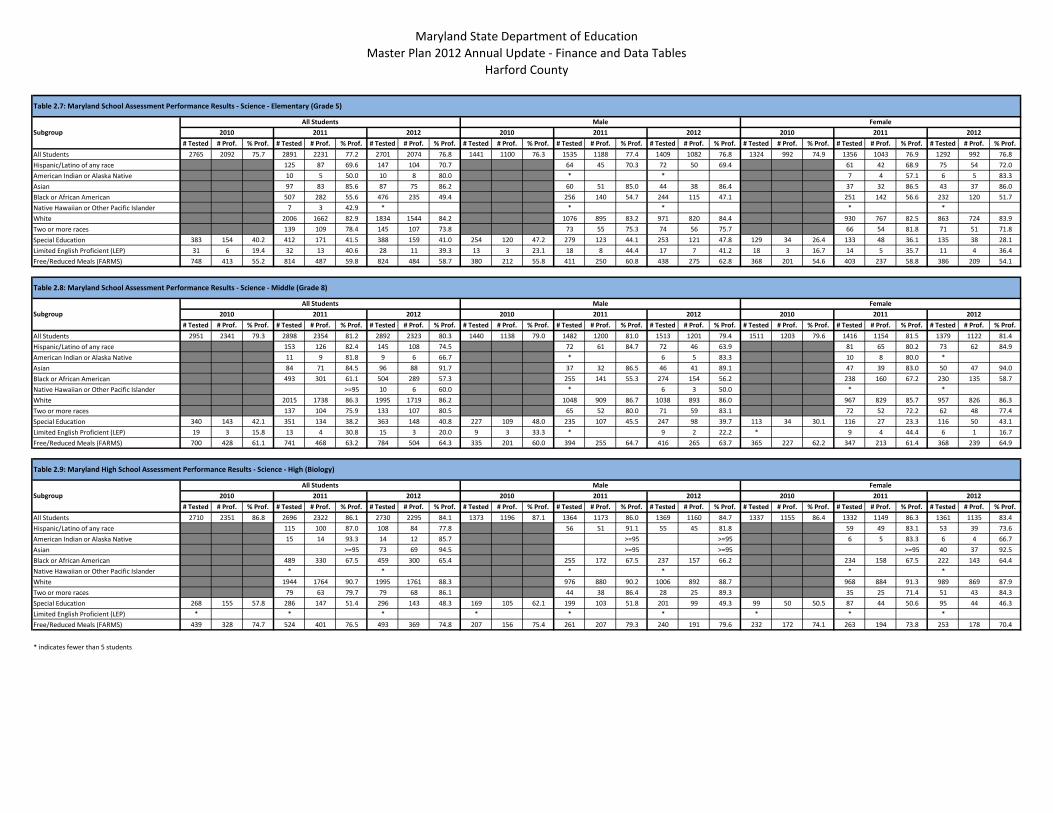
Maryland State Department of Education
Master Plan 2012 Annual Update - Finance and Data Tables
Harford County
# Tested # Prof. % Prof. # Tested # Prof. % Prof. # Tested # Prof. % Prof. # Tested # Prof. % Prof. # Tested # Prof. % Prof. # Tested # Prof. % Prof. # Tested # Prof. % Prof. # Tested # Prof. % Prof. # Tested # Prof. % Prof.
All Students 2765 2092 75.7 2891 2231 77.2 2701 2074 76.8 1441 1100 76.3 1535 1188 77.4 1409 1082 76.8 1324 992 74.9 1356 1043 76.9 1292 992 76.8
Hispanic/Latino of any race 125 87 69.6 147 104 70.7 64 45 70.3 72 50 69.4 61 42 68.9 75 54 72.0
American Indian or Alaska Native 10 5 50.0 10 8 80.0 * * 7 4 57.1 6 5 83.3
Asian 97 83 85.6 87 75 86.2 60 51 85.0 44 38 86.4 37 32 86.5 43 37 86.0
Black or African American 507 282 55.6 476 235 49.4 256 140 54.7 244 115 47.1 251 142 56.6 232 120 51.7
Native Hawaiian or Other Pacific Islander 7 3 42.9 * * * * *
White 2006 1662 82.9 1834 1544 84.2 1076 895 83.2 971 820 84.4 930 767 82.5 863 724 83.9
Two or more races 139 109 78.4 145 107 73.8 73 55 75.3 74 56 75.7 66 54 81.8 71 51 71.8
Special Education 383 154 40.2 412 171 41.5 388 159 41.0 254 120 47.2 279 123 44.1 253 121 47.8 129 34 26.4 133 48 36.1 135 38 28.1
Limited English Proficient (LEP) 31 6 19.4 32 13 40.6 28 11 39.3 13 3 23.1 18 8 44.4 17 7 41.2 18 3 16.7 14 5 35.7 11 4 36.4
Free/Reduced Meals (FARMS) 748 413 55.2 814 487 59.8 824 484 58.7 380 212 55.8 411 250 60.8 438 275 62.8 368 201 54.6 403 237 58.8 386 209 54.1
# Tested # Prof. % Prof. # Tested # Prof. % Prof. # Tested # Prof. % Prof. # Tested # Prof. % Prof. # Tested # Prof. % Prof. # Tested # Prof. % Prof. # Tested # Prof. % Prof. # Tested # Prof. % Prof. # Tested # Prof. % Prof.
All Students 2951 2341 79.3 2898 2354 81.2 2892 2323 80.3 1440 1138 79.0 1482 1200 81.0 1513 1201 79.4 1511 1203 79.6 1416 1154 81.5 1379 1122 81.4
Hispanic/Latino of any race 153 126 82.4 145 108 74.5 72 61 84.7 72 46 63.9 81 65 80.2 73 62 84.9
American Indian or Alaska Native 11 9 81.8 9 6 66.7 * 6 5 83.3 10 8 80.0 *
Asian 84 71 84.5 96 88 91.7 37 32 86.5 46 41 89.1 47 39 83.0 50 47 94.0
Black or African American 493 301 61.1 504 289 57.3 255 141 55.3 274 154 56.2 238 160 67.2 230 135 58.7
Native Hawaiian or Other Pacific Islander >=95 10 6 60.0 * 6 3 50.0 * *
White 2015 1738 86.3 1995 1719 86.2 1048 909 86.7 1038 893 86.0 967 829 85.7 957 826 86.3
Two or more races 137 104 75.9 133 107 80.5 65 52 80.0 71 59 83.1 72 52 72.2 62 48 77.4
Special Education 340 143 42.1 351 134 38.2 363 148 40.8 227 109 48.0 235 107 45.5 247 98 39.7 113 34 30.1 116 27 23.3 116 50 43.1
Limited English Proficient (LEP) 19 3 15.8 13 4 30.8 15 3 20.0 9 3 33.3 * 9 2 22.2 * 9 4 44.4 6 1 16.7
Free/Reduced Meals (FARMS) 700 428 61.1 741 468 63.2 784 504 64.3 335 201 60.0 394 255 64.7 416 265 63.7 365 227 62.2 347 213 61.4 368 239 64.9
# Tested # Prof. % Prof. # Tested # Prof. % Prof. # Tested # Prof. % Prof. # Tested # Prof. % Prof. # Tested # Prof. % Prof. # Tested # Prof. % Prof. # Tested # Prof. % Prof. # Tested # Prof. % Prof. # Tested # Prof. % Prof.
All Students 2710 2351 86.8 2696 2322 86.1 2730 2295 84.1 1373 1196 87.1 1364 1173 86.0 1369 1160 84.7 1337 1155 86.4 1332 1149 86.3 1361 1135 83.4
Hispanic/Latino of any race 115 100 87.0 108 84 77.8 56 51 91.1 55 45 81.8 59 49 83.1 53 39 73.6
American Indian or Alaska Native 15 14 93.3 14 12 85.7 >=95 >=95 6 5 83.3 6 4 66.7
Asian >=95 73 69 94.5 >=95 >=95 >=95 40 37 92.5
Black or African American 489 330 67.5 459 300 65.4 255 172 67.5 237 157 66.2 234 158 67.5 222 143 64.4
Native Hawaiian or Other Pacific Islander * * * * * *
White 1944 1764 90.7 1995 1761 88.3 976 880 90.2 1006 892 88.7 968 884 91.3 989 869 87.9
Two or more races 79 63 79.7 79 68 86.1 44 38 86.4 28 25 89.3 35 25 71.4 51 43 84.3
Special Education 268 155 57.8 286 147 51.4 296 143 48.3 169 105 62.1 199 103 51.8 201 99 49.3 99 50 50.5 87 44 50.6 95 44 46.3
Limited English Proficient (LEP) * * * * * * * * *
Free/Reduced Meals (FARMS) 439 328 74.7 524 401 76.5 493 369 74.8 207 156 75.4 261 207 79.3 240 191 79.6 232 172 74.1 263 194 73.8 253 178 70.4
* indicates fewer than 5 students
2010 2011 2012 2010 2011 2012
2011 2012
Table 2.9: Maryland High School Assessment Performance Results - Science - High (Biology)
Subgroup
All Students Male Female
2010 2011 2012
2011 2012 2010 2011 2012 2010
2012 2010 2011 2012
Table 2.8: Maryland School Assessment Performance Results - Science - Middle (Grade 8)
Subgroup
All Students Male Female
2010
Table 2.7: Maryland School Assessment Performance Results - Science - Elementary (Grade 5)
Subgroup
All Students Male Female
2010 2011 2012 2010 2011
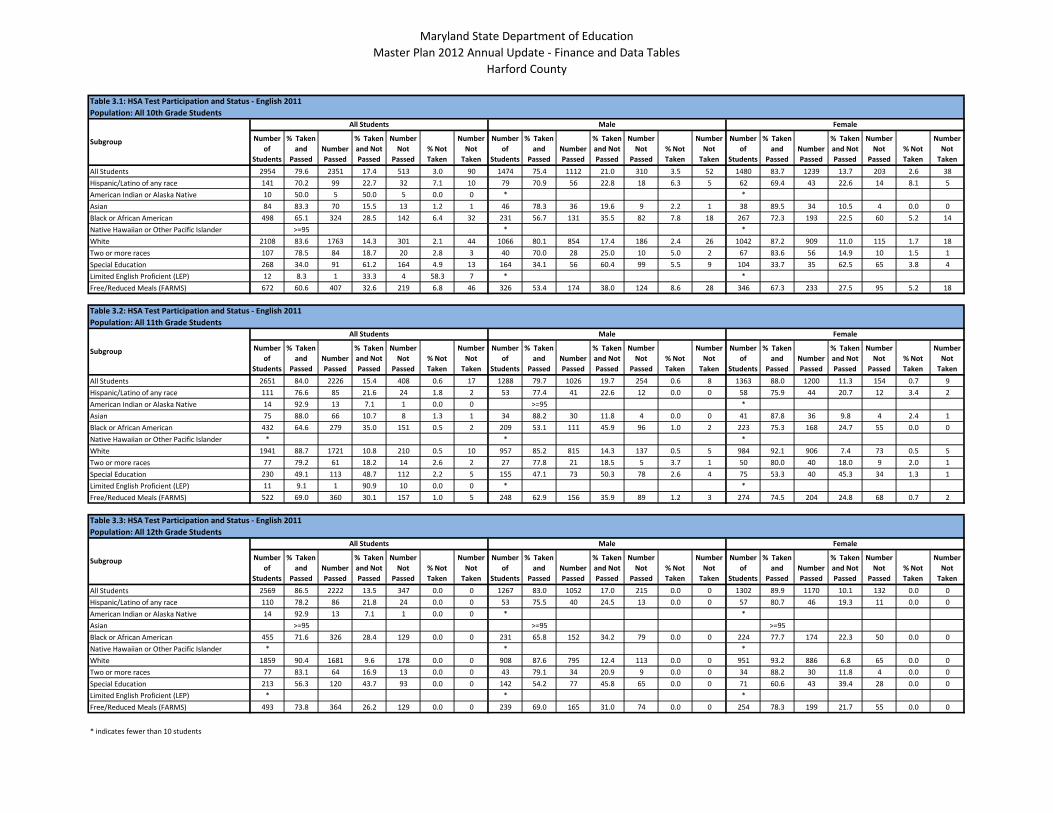
Maryland State Department of Education
Master Plan 2012 Annual Update - Finance and Data Tables
Harford County
Number
of
Students
% Taken
and
Passed
Number
Passed
% Taken
and Not
Passed
Number
Not
Passed
% Not
Taken
Number
Not
Taken
Number
of
Students
% Taken
and
Passed
Number
Passed
% Taken
and Not
Passed
Number
Not
Passed
% Not
Taken
Number
Not
Taken
Number
of
Students
% Taken
and
Passed
Number
Passed
% Taken
and Not
Passed
Number
Not
Passed
% Not
Taken
Number
Not
Taken
All Students 2954 79.6 2351 17.4 513 3.0 90 1474 75.4 1112 21.0 310 3.5 52 1480 83.7 1239 13.7 203 2.6 38
Hispanic/Latino of any race 141 70.2 99 22.7 32 7.1 10 79 70.9 56 22.8 18 6.3 5 62 69.4 43 22.6 14 8.1 5
American Indian or Alaska Native 10 50.0 5 50.0 5 0.0 0 * *
Asian 84 83.3 70 15.5 13 1.2 1 46 78.3 36 19.6 9 2.2 1 38 89.5 34 10.5 4 0.0 0
Black or African American 498 65.1 324 28.5 142 6.4 32 231 56.7 131 35.5 82 7.8 18 267 72.3 193 22.5 60 5.2 14
Native Hawaiian or Other Pacific Islander >=95 * *
White 2108 83.6 1763 14.3 301 2.1 44 1066 80.1 854 17.4 186 2.4 26 1042 87.2 909 11.0 115 1.7 18
Two or more races 107 78.5 84 18.7 20 2.8 3 40 70.0 28 25.0 10 5.0 2 67 83.6 56 14.9 10 1.5 1
Special Education 268 34.0 91 61.2 164 4.9 13 164 34.1 56 60.4 99 5.5 9 104 33.7 35 62.5 65 3.8 4
Limited English Proficient (LEP) 12 8.3 1 33.3 4 58.3 7 * *
Free/Reduced Meals (FARMS) 672 60.6 407 32.6 219 6.8 46 326 53.4 174 38.0 124 8.6 28 346 67.3 233 27.5 95 5.2 18
Number
of
Students
% Taken
and
Passed
Number
Passed
% Taken
and Not
Passed
Number
Not
Passed
% Not
Taken
Number
Not
Taken
Number
of
Students
% Taken
and
Passed
Number
Passed
% Taken
and Not
Passed
Number
Not
Passed
% Not
Taken
Number
Not
Taken
Number
of
Students
% Taken
and
Passed
Number
Passed
% Taken
and Not
Passed
Number
Not
Passed
% Not
Taken
Number
Not
Taken
All Students 2651 84.0 2226 15.4 408 0.6 17 1288 79.7 1026 19.7 254 0.6 8 1363 88.0 1200 11.3 154 0.7 9
Hispanic/Latino of any race 111 76.6 85 21.6 24 1.8 2 53 77.4 41 22.6 12 0.0 0 58 75.9 44 20.7 12 3.4 2
American Indian or Alaska Native 14 92.9 13 7.1 1 0.0 0 >=95 *
Asian 75 88.0 66 10.7 8 1.3 1 34 88.2 30 11.8 4 0.0 0 41 87.8 36 9.8 4 2.4 1
Black or African American 432 64.6 279 35.0 151 0.5 2 209 53.1 111 45.9 96 1.0 2 223 75.3 168 24.7 55 0.0 0
Native Hawaiian or Other Pacific Islander * * *
White 1941 88.7 1721 10.8 210 0.5 10 957 85.2 815 14.3 137 0.5 5 984 92.1 906 7.4 73 0.5 5
Two or more races 77 79.2 61 18.2 14 2.6 2 27 77.8 21 18.5 5 3.7 1 50 80.0 40 18.0 9 2.0 1
Special Education 230 49.1 113 48.7 112 2.2 5 155 47.1 73 50.3 78 2.6 4 75 53.3 40 45.3 34 1.3 1
Limited English Proficient (LEP) 11 9.1 1 90.9 10 0.0 0 * *
Free/Reduced Meals (FARMS) 522 69.0 360 30.1 157 1.0 5 248 62.9 156 35.9 89 1.2 3 274 74.5 204 24.8 68 0.7 2
Number
of
Students
% Taken
and
Passed
Number
Passed
% Taken
and Not
Passed
Number
Not
Passed
% Not
Taken
Number
Not
Taken
Number
of
Students
% Taken
and
Passed
Number
Passed
% Taken
and Not
Passed
Number
Not
Passed
% Not
Taken
Number
Not
Taken
Number
of
Students
% Taken
and
Passed
Number
Passed
% Taken
and Not
Passed
Number
Not
Passed
% Not
Taken
Number
Not
Taken
All Students 2569 86.5 2222 13.5 347 0.0 0 1267 83.0 1052 17.0 215 0.0 0 1302 89.9 1170 10.1 132 0.0 0
Hispanic/Latino of any race 110 78.2 86 21.8 24 0.0 0 53 75.5 40 24.5 13 0.0 0 57 80.7 46 19.3 11 0.0 0
American Indian or Alaska Native 14 92.9 13 7.1 1 0.0 0 * *
Asian >=95 >=95 >=95
Black or African American 455 71.6 326 28.4 129 0.0 0 231 65.8 152 34.2 79 0.0 0 224 77.7 174 22.3 50 0.0 0
Native Hawaiian or Other Pacific Islander * * *
White 1859 90.4 1681 9.6 178 0.0 0 908 87.6 795 12.4 113 0.0 0 951 93.2 886 6.8 65 0.0 0
Two or more races 77 83.1 64 16.9 13 0.0 0 43 79.1 34 20.9 9 0.0 0 34 88.2 30 11.8 4 0.0 0
Special Education 213 56.3 120 43.7 93 0.0 0 142 54.2 77 45.8 65 0.0 0 71 60.6 43 39.4 28 0.0 0
Limited English Proficient (LEP) * * *
Free/Reduced Meals (FARMS) 493 73.8 364 26.2 129 0.0 0 239 69.0 165 31.0 74 0.0 0 254 78.3 199 21.7 55 0.0 0
* indicates fewer than 10 students
Table 3.1: HSA Test Participation and Status - English 2011
Table 3.2: HSA Test Participation and Status - English 2011
Population: All 11th Grade Students
All Students Male Female
All Students Male Female
Population: All 10th Grade Students
Subgroup
Subgroup
Table 3.3: HSA Test Participation and Status - English 2011
Population: All 12th Grade Students
Subgroup
All Students Male Female

Maryland State Department of Education
Master Plan 2012 Annual Update - Finance and Data Tables
Harford County
Number
of
Students
% Taken
and
Passed
Number
Passed
% Taken
and Not
Passed
Number
Not
Passed
% Not
Taken
Number
Not
Taken
Number
of
Students
% Taken
and
Passed
Number
Passed
% Taken
and Not
Passed
Number
Not
Passed
% Not
Taken
Number
Not
Taken
Number
of
Students
% Taken
and
Passed
Number
Passed
% Taken
and Not
Passed
Number
Not
Passed
% Not
Taken
Number
Not
Taken
All Students 2860 86.2 2464 10.6 304 3.2 92 1429 85.9 1228 10.1 144 4.0 57 1431 86.4 1236 11.2 160 2.4 35
Hispanic/Latino of any race 135 83.7 113 12.6 17 3.7 5 76 90.8 69 7.9 6 1.3 1 59 74.6 44 18.6 11 6.8 4
American Indian or Alaska Native 10 60.0 6 30.0 3 10.0 1 * *
Asian 75 90.7 68 6.7 5 2.7 2 42 88.1 37 9.5 4 2.4 1 33 93.9 31 3.0 1 3.0 1
Black or African American 485 70.1 340 25.4 123 4.5 22 227 69.2 157 25.6 58 5.3 12 258 70.9 183 25.2 65 3.9 10
Native Hawaiian or Other Pacific Islander * * *
White 2047 90.0 1843 7.2 147 2.8 57 1034 89.5 925 6.9 71 3.7 38 1013 90.6 918 7.5 76 1.9 19
Two or more races 103 87.4 90 8.7 9 3.9 4 38 86.8 33 5.3 2 7.9 3 65 87.7 57 10.8 7 1.5 1
Special Education 267 48.3 129 38.6 103 13.1 35 163 46.6 76 37.4 61 16.0 26 104 51.0 53 40.4 42 8.7 9
Limited English Proficient (LEP) 10 20.0 2 60.0 6 20.0 2 * *
Free/Reduced Meals (FARMS) 663 73.0 484 21.3 141 5.7 38 319 73.4 234 18.2 58 8.5 27 344 72.7 250 24.1 83 3.2 11
Number
of
Students
% Taken
and
Passed
Number
Passed
% Taken
and Not
Passed
Number
Not
Passed
% Not
Taken
Number
Not
Taken
Number
of
Students
% Taken
and
Passed
Number
Passed
% Taken
and Not
Passed
Number
Not
Passed
% Not
Taken
Number
Not
Taken
Number
of
Students
% Taken
and
Passed
Number
Passed
% Taken
and Not
Passed
Number
Not
Passed
% Not
Taken
Number
Not
Taken
All Students 2576 90.5 2331 8.8 226 0.7 19 1264 91.0 1150 8.1 103 0.9 11 1312 90.0 1181 9.4 123 0.6 8
Hispanic/Latino of any race 105 82.9 87 16.2 17 1.0 1 50 90.0 45 10.0 5 0.0 0 55 76.4 42 21.8 12 1.8 1
American Indian or Alaska Native 14 78.6 11 21.4 3 0.0 0 * *
Asian >=95 >=95 39 92.3 36 7.7 3 0.0 0
Black or African American 425 76.5 325 22.4 95 1.2 5 207 75.4 156 23.2 48 1.4 3 218 77.5 169 21.6 47 0.9 2
Native Hawaiian or Other Pacific Islander * * *
White 1883 94.0 1770 5.4 101 0.6 12 938 94.0 882 5.2 49 0.7 7 945 94.0 888 5.5 52 0.5 5
Two or more races 75 89.3 67 9.3 7 1.3 1 27 92.6 25 3.7 1 3.7 1 48 87.5 42 12.5 6 0.0 0
Special Education 230 63.5 146 33.0 76 3.5 8 156 66.7 104 29.5 46 3.8 6 74 56.8 42 40.5 30 2.7 2
Limited English Proficient (LEP) 11 54.5 6 45.5 5 0.0 0 * *
Free/Reduced Meals (FARMS) 513 81.7 419 17.5 90 0.8 4 247 85.4 211 13.4 33 1.2 3 266 78.2 208 21.4 57 0.4 1
Number
of
Students
% Taken
and
Passed
Number
Passed
% Taken
and Not
Passed
Number
Not
Passed
% Not
Taken
Number
Not
Taken
Number
of
Students
% Taken
and
Passed
Number
Passed
% Taken
and Not
Passed
Number
Not
Passed
% Not
Taken
Number
Not
Taken
Number
of
Students
% Taken
and
Passed
Number
Passed
% Taken
and Not
Passed
Number
Not
Passed
% Not
Taken
Number
Not
Taken
All Students 2517 93.3 2348 6.7 169 0.0 0 1238 93.6 1159 6.4 79 0.0 0 1279 93.0 1189 7.0 90 0.0 0
Hispanic/Latino of any race 109 90.8 99 9.2 10 0.0 0 53 90.6 48 9.4 5 0.0 0 56 91.1 51 8.9 5 0.0 0
American Indian or Alaska Native 16 93.8 15 6.3 1 0.0 0 * *
Asian >=95 >=95 >=95
Black or African American 445 83.4 371 16.6 74 0.0 0 223 82.1 183 17.9 40 0.0 0 222 84.7 188 15.3 34 0.0 0
Native Hawaiian or Other Pacific Islander * * *
White >=95 >=95 >=95
Two or more races 75 90.7 68 9.3 7 0.0 0 42 92.9 39 7.1 3 0.0 0 33 87.9 29 12.1 4 0.0 0
Special Education 214 69.6 149 30.4 65 0.0 0 142 71.1 101 28.9 41 0.0 0 72 66.7 48 33.3 24 0.0 0
Limited English Proficient (LEP) * * * * * * * * * * * * * * * * * * * * *
Free/Reduced Meals (FARMS) 487 86.0 419 14.0 68 0.0 0 233 87.6 204 12.4 29 0.0 0 254 84.6 215 15.4 39 0.0 0
* indicates fewer than 10 students
Table 3.5: HSA Test Participation and Status - Algebra/Data Analysis 2011
Population: All 11th Grade Students
Subgroup
All Students Male Female
Table 3.4: HSA Test Participation and Status - Algebra/Data Analysis 2011
Population: All 10th Grade Students
Subgroup
All Students Male Female
Table 3.6: HSA Test Participation and Status - Algebra/Data Analysis 2011
Population: All 12th Grade Students
Subgroup
All Students Male Female

Maryland State Department of Education
Master Plan 2012 Annual Update - Finance and Data Tables
Harford County
Number
of
Students
% Taken
and
Passed
Number
Passed
% Taken
and Not
Passed
Number
Not
Passed
% Not
Taken
Number
Not
Taken
Number
of
Students
% Taken
and
Passed
Number
Passed
% Taken
and Not
Passed
Number
Not
Passed
% Not
Taken
Number
Not
Taken
Number
of
Students
% Taken
and
Passed
Number
Passed
% Taken
and Not
Passed
Number
Not
Passed
% Not
Taken
Number
Not
Taken
All Students 2925 83.1 2432 13.5 395 3.4 98 1458 83.7 1221 12.6 183 3.7 54 1467 82.5 1211 14.5 212 3.0 44
Hispanic/Latino of any race 139 81.3 113 13.7 19 5.0 7 78 88.5 69 7.7 6 3.8 3 61 72.1 44 21.3 13 6.6 4
American Indian or Alaska Native 10 70.0 7 30.0 3 0.0 0 * *
Asian 81 88.9 72 7.4 6 3.7 3 45 86.7 39 8.9 4 4.4 2 36 91.7 33 5.6 2 2.8 1
Black or African American 490 64.7 317 29.6 145 5.7 28 227 65.6 149 28.2 64 6.2 14 263 63.9 168 30.8 81 5.3 14
Native Hawaiian or Other Pacific Islander * * *
White 2094 87.6 1834 9.7 204 2.7 56 1056 87.6 925 9.3 98 3.1 33 1038 87.6 909 10.2 106 2.2 23
Two or more races 105 80.0 84 17.1 18 2.9 3 40 77.5 31 20.0 8 2.5 1 65 81.5 53 15.4 10 3.1 2
Special Education 267 47.6 127 45.3 121 7.1 19 163 51.5 84 39.3 64 9.2 15 104 41.3 43 54.8 57 3.8 4
Limited English Proficient (LEP) 10 20.0 2 30.0 3 50.0 5 * *
Free/Reduced Meals (FARMS) 669 64.3 430 28.4 190 7.3 49 323 65.0 210 26.6 86 8.4 27 346 63.6 220 30.1 104 6.4 22
Number
of
Students
% Taken
and
Passed
Number
Passed
% Taken
and Not
Passed
Number
Not
Passed
% Not
Taken
Number
Not
Taken
Number
of
Students
% Taken
and
Passed
Number
Passed
% Taken
and Not
Passed
Number
Not
Passed
% Not
Taken
Number
Not
Taken
Number
of
Students
% Taken
and
Passed
Number
Passed
% Taken
and Not
Passed
Number
Not
Passed
% Not
Taken
Number
Not
Taken
All Students 2629 85.4 2246 13.7 361 0.8 22 1284 87.5 1124 11.8 151 0.7 9 1345 83.4 1122 15.6 210 1.0 13
Hispanic/Latino of any race 109 76.1 83 22.0 24 1.8 2 53 81.1 43 18.9 10 0.0 0 56 71.4 40 25.0 14 3.6 2
American Indian or Alaska Native 14 78.6 11 21.4 3 0.0 0 * *
Asian 75 93.3 70 6.7 5 0.0 0 34 94.1 32 5.9 2 0.0 0 41 92.7 38 7.3 3 0.0 0
Black or African American 427 67.9 290 30.7 131 1.4 6 209 70.8 148 28.2 59 1.0 2 218 65.1 142 33.0 72 1.8 4
Native Hawaiian or Other Pacific Islander * * *
White 1927 89.5 1724 9.8 189 0.7 14 953 91.3 870 8.0 76 0.7 7 974 87.7 854 11.6 113 0.7 7
Two or more races 76 88.2 67 11.8 9 0.0 0 27 85.2 23 14.8 4 0.0 0 49 89.8 44 10.2 5 0.0 0
Special Education 231 59.7 138 38.1 88 2.2 5 156 63.5 99 33.3 52 3.2 5 75 52.0 39 48.0 36 0.0 0
Limited English Proficient (LEP) 11 36.4 4 63.6 7 0.0 0 * *
Free/Reduced Meals (FARMS) 518 72.2 374 26.1 135 1.7 9 249 78.3 195 20.5 51 1.2 3 269 66.5 179 31.2 84 2.2 6
Number
of
Students
% Taken
and
Passed
Number
Passed
% Taken
and Not
Passed
Number
Not
Passed
% Not
Taken
Number
Not
Taken
Number
of
Students
% Taken
and
Passed
Number
Passed
% Taken
and Not
Passed
Number
Not
Passed
% Not
Taken
Number
Not
Taken
Number
of
Students
% Taken
and
Passed
Number
Passed
% Taken
and Not
Passed
Number
Not
Passed
% Not
Taken
Number
Not
Taken
All Students 2562 88.6 2271 11.3 290 0.0 1 1265 89.5 1132 10.4 132 0.1 1 1297 87.8 1139 12.2 158 0.0 0
Hispanic/Latino of any race 111 87.4 97 12.6 14 0.0 0 54 90.7 49 9.3 5 0.0 0 57 84.2 48 15.8 9 0.0 0
American Indian or Alaska Native 14 92.9 13 7.1 1 0.0 0 * *
Asian >=95 >=95 >=95
Black or African American 451 71.6 323 28.2 127 0.2 1 227 72.7 165 26.9 61 0.4 1 224 70.5 158 29.5 66 0.0 0
Native Hawaiian or Other Pacific Islander * * *
White 1856 92.9 1725 7.1 131 0.0 0 909 93.5 850 6.5 59 0.0 0 947 92.4 875 7.6 72 0.0 0
Two or more races 76 81.6 62 18.4 14 0.0 0 43 86.0 37 14.0 6 0.0 0 33 75.8 25 24.2 8 0.0 0
Special Education 215 64.2 138 35.8 77 0.0 0 143 66.4 95 33.6 48 0.0 0 72 59.7 43 40.3 29 0.0 0
Limited English Proficient (LEP) * * *
Free/Reduced Meals (FARMS) 493 77.1 380 22.9 113 0.0 0 239 79.1 189 20.9 50 0.0 0 254 75.2 191 24.8 63 0.0 0
* indicates fewer than 10 students
Table 3.8: HSA Test Participation and Status - Biology 2011
Population: All 11th Grade Students
Subgroup
All Students Male Female
Table 3.7: HSA Test Participation and Status - Biology 2011
Population: All 10th Grade Students
Subgroup
All Students Male Female
Table 3.9: HSA Test Participation and Status - Biology 2011
Population: All 12th Grade Students
Subgroup
All Students Male Female
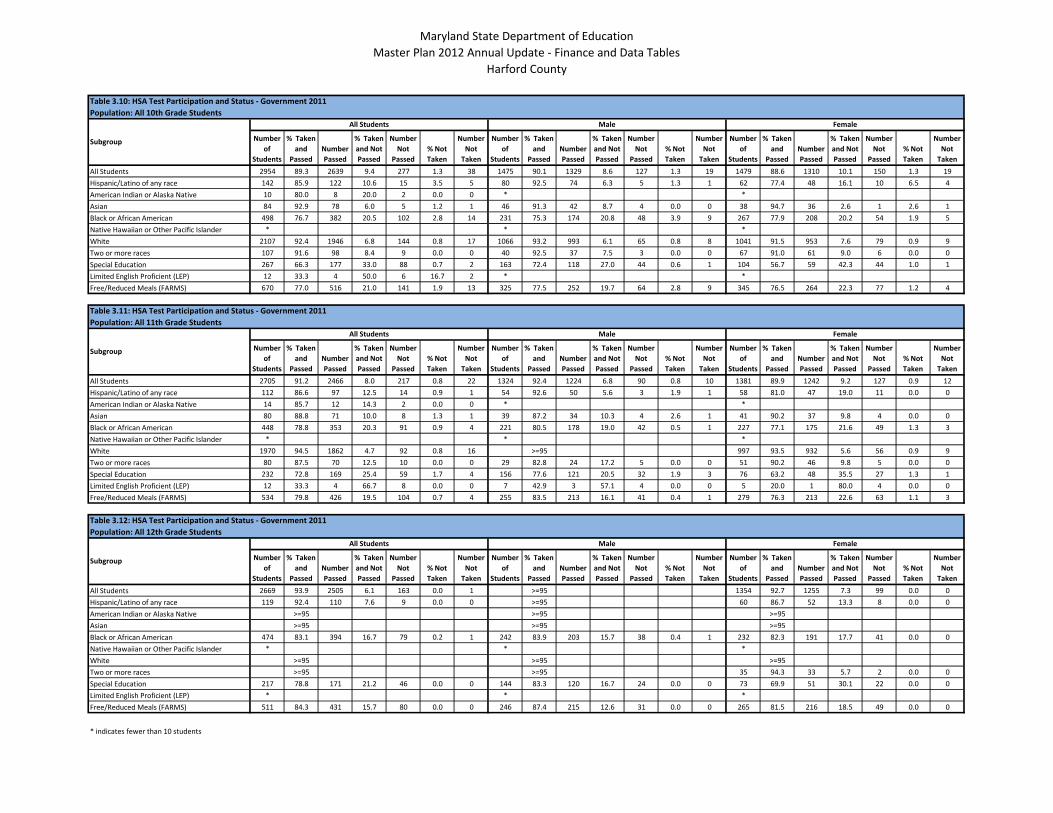
Maryland State Department of Education
Master Plan 2012 Annual Update - Finance and Data Tables
Harford County
Number
of
Students
% Taken
and
Passed
Number
Passed
% Taken
and Not
Passed
Number
Not
Passed
% Not
Taken
Number
Not
Taken
Number
of
Students
% Taken
and
Passed
Number
Passed
% Taken
and Not
Passed
Number
Not
Passed
% Not
Taken
Number
Not
Taken
Number
of
Students
% Taken
and
Passed
Number
Passed
% Taken
and Not
Passed
Number
Not
Passed
% Not
Taken
Number
Not
Taken
All Students 2954 89.3 2639 9.4 277 1.3 38 1475 90.1 1329 8.6 127 1.3 19 1479 88.6 1310 10.1 150 1.3 19
Hispanic/Latino of any race 142 85.9 122 10.6 15 3.5 5 80 92.5 74 6.3 5 1.3 1 62 77.4 48 16.1 10 6.5 4
American Indian or Alaska Native 10 80.0 8 20.0 2 0.0 0 * *
Asian 84 92.9 78 6.0 5 1.2 1 46 91.3 42 8.7 4 0.0 0 38 94.7 36 2.6 1 2.6 1
Black or African American 498 76.7 382 20.5 102 2.8 14 231 75.3 174 20.8 48 3.9 9 267 77.9 208 20.2 54 1.9 5
Native Hawaiian or Other Pacific Islander * * *
White 2107 92.4 1946 6.8 144 0.8 17 1066 93.2 993 6.1 65 0.8 8 1041 91.5 953 7.6 79 0.9 9
Two or more races 107 91.6 98 8.4 9 0.0 0 40 92.5 37 7.5 3 0.0 0 67 91.0 61 9.0 6 0.0 0
Special Education 267 66.3 177 33.0 88 0.7 2 163 72.4 118 27.0 44 0.6 1 104 56.7 59 42.3 44 1.0 1
Limited English Proficient (LEP) 12 33.3 4 50.0 6 16.7 2 * *
Free/Reduced Meals (FARMS) 670 77.0 516 21.0 141 1.9 13 325 77.5 252 19.7 64 2.8 9 345 76.5 264 22.3 77 1.2 4
Number
of
Students
% Taken
and
Passed
Number
Passed
% Taken
and Not
Passed
Number
Not
Passed
% Not
Taken
Number
Not
Taken
Number
of
Students
% Taken
and
Passed
Number
Passed
% Taken
and Not
Passed
Number
Not
Passed
% Not
Taken
Number
Not
Taken
Number
of
Students
% Taken
and
Passed
Number
Passed
% Taken
and Not
Passed
Number
Not
Passed
% Not
Taken
Number
Not
Taken
All Students 2705 91.2 2466 8.0 217 0.8 22 1324 92.4 1224 6.8 90 0.8 10 1381 89.9 1242 9.2 127 0.9 12
Hispanic/Latino of any race 112 86.6 97 12.5 14 0.9 1 54 92.6 50 5.6 3 1.9 1 58 81.0 47 19.0 11 0.0 0
American Indian or Alaska Native 14 85.7 12 14.3 2 0.0 0 * *
Asian 80 88.8 71 10.0 8 1.3 1 39 87.2 34 10.3 4 2.6 1 41 90.2 37 9.8 4 0.0 0
Black or African American 448 78.8 353 20.3 91 0.9 4 221 80.5 178 19.0 42 0.5 1 227 77.1 175 21.6 49 1.3 3
Native Hawaiian or Other Pacific Islander * * *
White 1970 94.5 1862 4.7 92 0.8 16 >=95 997 93.5 932 5.6 56 0.9 9
Two or more races 80 87.5 70 12.5 10 0.0 0 29 82.8 24 17.2 5 0.0 0 51 90.2 46 9.8 5 0.0 0
Special Education 232 72.8 169 25.4 59 1.7 4 156 77.6 121 20.5 32 1.9 3 76 63.2 48 35.5 27 1.3 1
Limited English Proficient (LEP) 12 33.3 4 66.7 8 0.0 0 7 42.9 3 57.1 4 0.0 0 5 20.0 1 80.0 4 0.0 0
Free/Reduced Meals (FARMS) 534 79.8 426 19.5 104 0.7 4 255 83.5 213 16.1 41 0.4 1 279 76.3 213 22.6 63 1.1 3
Number
of
Students
% Taken
and
Passed
Number
Passed
% Taken
and Not
Passed
Number
Not
Passed
% Not
Taken
Number
Not
Taken
Number
of
Students
% Taken
and
Passed
Number
Passed
% Taken
and Not
Passed
Number
Not
Passed
% Not
Taken
Number
Not
Taken
Number
of
Students
% Taken
and
Passed
Number
Passed
% Taken
and Not
Passed
Number
Not
Passed
% Not
Taken
Number
Not
Taken
All Students 2669 93.9 2505 6.1 163 0.0 1 >=95 1354 92.7 1255 7.3 99 0.0 0
Hispanic/Latino of any race 119 92.4 110 7.6 9 0.0 0 >=95 60 86.7 52 13.3 8 0.0 0
American Indian or Alaska Native >=95 >=95 >=95
Asian >=95 >=95 >=95
Black or African American 474 83.1 394 16.7 79 0.2 1 242 83.9 203 15.7 38 0.4 1 232 82.3 191 17.7 41 0.0 0
Native Hawaiian or Other Pacific Islander * * *
White >=95 >=95 >=95
Two or more races >=95 >=95 35 94.3 33 5.7 2 0.0 0
Special Education 217 78.8 171 21.2 46 0.0 0 144 83.3 120 16.7 24 0.0 0 73 69.9 51 30.1 22 0.0 0
Limited English Proficient (LEP) * * *
Free/Reduced Meals (FARMS) 511 84.3 431 15.7 80 0.0 0 246 87.4 215 12.6 31 0.0 0 265 81.5 216 18.5 49 0.0 0
* indicates fewer than 10 students
Table 3.11: HSA Test Participation and Status - Government 2011
Population: All 11th Grade Students
Subgroup
All Students Male Female
Table 3.10: HSA Test Participation and Status - Government 2011
Population: All 10th Grade Students
Subgroup
All Students Male Female
Table 3.12: HSA Test Participation and Status - Government 2011
Population: All 12th Grade Students
Subgroup
All Students Male Female
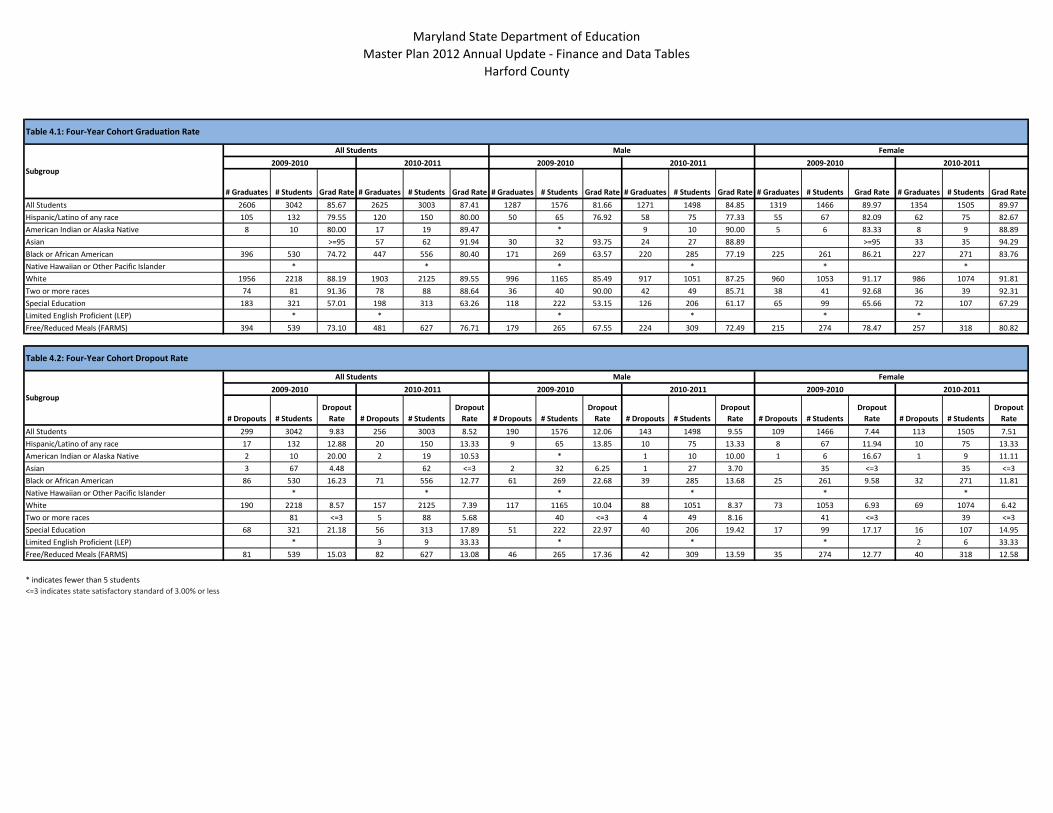
Maryland State Department of Education
Master Plan 2012 Annual Update - Finance and Data Tables
Harford County
# Graduates # Students Grad Rate # Graduates # Students Grad Rate # Graduates # Students Grad Rate # Graduates # Students Grad Rate # Graduates # Students Grad Rate # Graduates # Students Grad Rate
All Students 2606 3042 85.67 2625 3003 87.41 1287 1576 81.66 1271 1498 84.85 1319 1466 89.97 1354 1505 89.97
Hispanic/Latino of any race 105 132 79.55 120 150 80.00 50 65 76.92 58 75 77.33 55 67 82.09 62 75 82.67
American Indian or Alaska Native 8 10 80.00 17 19 89.47 * 9 10 90.00 5 6 83.33 8 9 88.89
Asian >=95 57 62 91.94 30 32 93.75 24 27 88.89 >=95 33 35 94.29
Black or African American 396 530 74.72 447 556 80.40 171 269 63.57 220 285 77.19 225 261 86.21 227 271 83.76
Native Hawaiian or Other Pacific Islander * * * * * *
White 1956 2218 88.19 1903 2125 89.55 996 1165 85.49 917 1051 87.25 960 1053 91.17 986 1074 91.81
Two or more races 74 81 91.36 78 88 88.64 36 40 90.00 42 49 85.71 38 41 92.68 36 39 92.31
Special Education 183 321 57.01 198 313 63.26 118 222 53.15 126 206 61.17 65 99 65.66 72 107 67.29
Limited English Proficient (LEP) * * * * * *
Free/Reduced Meals (FARMS) 394 539 73.10 481 627 76.71 179 265 67.55 224 309 72.49 215 274 78.47 257 318 80.82
# Dropouts # Students
Dropout
Rate # Dropouts # Students
Dropout
Rate # Dropouts # Students
Dropout
Rate # Dropouts # Students
Dropout
Rate # Dropouts # Students
Dropout
Rate # Dropouts # Students
Dropout
Rate
All Students 299 3042 9.83 256 3003 8.52 190 1576 12.06 143 1498 9.55 109 1466 7.44 113 1505 7.51
Hispanic/Latino of any race 17 132 12.88 20 150 13.33 9 65 13.85 10 75 13.33 8 67 11.94 10 75 13.33
American Indian or Alaska Native 2 10 20.00 2 19 10.53 * 1 10 10.00 1 6 16.67 1 9 11.11
Asian 3 67 4.48 62 <=3 2 32 6.25 1 27 3.70 35 <=3 35 <=3
Black or African American 86 530 16.23 71 556 12.77 61 269 22.68 39 285 13.68 25 261 9.58 32 271 11.81
Native Hawaiian or Other Pacific Islander * * * * * *
White 190 2218 8.57 157 2125 7.39 117 1165 10.04 88 1051 8.37 73 1053 6.93 69 1074 6.42
Two or more races 81 <=3 5 88 5.68 40 <=3 4 49 8.16 41 <=3 39 <=3
Special Education 68 321 21.18 56 313 17.89 51 222 22.97 40 206 19.42 17 99 17.17 16 107 14.95
Limited English Proficient (LEP) * 3 9 33.33 * * * 2 6 33.33
Free/Reduced Meals (FARMS) 81 539 15.03 82 627 13.08 46 265 17.36 42 309 13.59 35 274 12.77 40 318 12.58
* indicates fewer than 5 students
<=3 indicates state satisfactory standard of 3.00% or less
Table 4.1: Four-Year Cohort Graduation Rate
2009-2010 2010-2011
All Students Male
2009-2010 2010-2011
Table 4.2: Four-Year Cohort Dropout Rate
Subgroup
All Students Male
Female
2009-2010 2010-2011Subgroup
Female
2009-2010 2010-2011 2009-2010 2010-2011 2009-2010 2010-2011
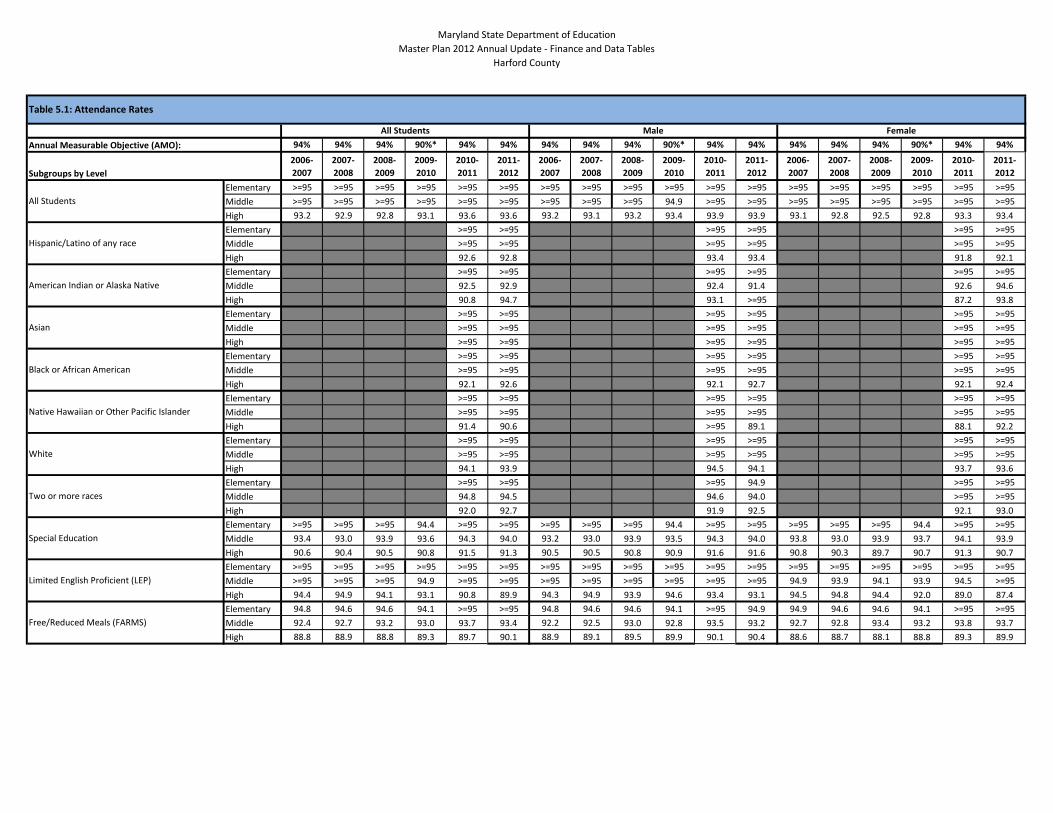
Maryland State Department of Education
Master Plan 2012 Annual Update - Finance and Data Tables
Harford County
94% 94% 94% 90%* 94% 94% 94% 94% 94% 90%* 94% 94% 94% 94% 94% 90%* 94% 94%
2006-
2007
2007-
2008
2008-
2009
2009-
2010
2010-
2011
2011-
2012
2006-
2007
2007-
2008
2008-
2009
2009-
2010
2010-
2011
2011-
2012
2006-
2007
2007-
2008
2008-
2009
2009-
2010
2010-
2011
2011-
2012
Elementary >=95 >=95 >=95 >=95 >=95 >=95 >=95 >=95 >=95 >=95 >=95 >=95 >=95 >=95 >=95 >=95 >=95 >=95
Middle >=95 >=95 >=95 >=95 >=95 >=95 >=95 >=95 >=95 94.9 >=95 >=95 >=95 >=95 >=95 >=95 >=95 >=95
High 93.2 92.9 92.8 93.1 93.6 93.6 93.2 93.1 93.2 93.4 93.9 93.9 93.1 92.8 92.5 92.8 93.3 93.4
Elementary >=95 >=95 >=95 >=95 >=95 >=95
Middle >=95 >=95 >=95 >=95 >=95 >=95
High 92.6 92.8 93.4 93.4 91.8 92.1
Elementary >=95 >=95 >=95 >=95 >=95 >=95
Middle 92.5 92.9 92.4 91.4 92.6 94.6
High 90.8 94.7 93.1 >=95 87.2 93.8
Elementary >=95 >=95 >=95 >=95 >=95 >=95
Middle >=95 >=95 >=95 >=95 >=95 >=95
High >=95 >=95 >=95 >=95 >=95 >=95
Elementary >=95 >=95 >=95 >=95 >=95 >=95
Middle >=95 >=95 >=95 >=95 >=95 >=95
High 92.1 92.6 92.1 92.7 92.1 92.4
Elementary >=95 >=95 >=95 >=95 >=95 >=95
Middle >=95 >=95 >=95 >=95 >=95 >=95
High 91.4 90.6 >=95 89.1 88.1 92.2
Elementary >=95 >=95 >=95 >=95 >=95 >=95
Middle >=95 >=95 >=95 >=95 >=95 >=95
High 94.1 93.9 94.5 94.1 93.7 93.6
Elementary >=95 >=95 >=95 94.9 >=95 >=95
Middle 94.8 94.5 94.6 94.0 >=95 >=95
High 92.0 92.7 91.9 92.5 92.1 93.0
Elementary >=95 >=95 >=95 94.4 >=95 >=95 >=95 >=95 >=95 94.4 >=95 >=95 >=95 >=95 >=95 94.4 >=95 >=95
Middle 93.4 93.0 93.9 93.6 94.3 94.0 93.2 93.0 93.9 93.5 94.3 94.0 93.8 93.0 93.9 93.7 94.1 93.9
High 90.6 90.4 90.5 90.8 91.5 91.3 90.5 90.5 90.8 90.9 91.6 91.6 90.8 90.3 89.7 90.7 91.3 90.7
Elementary >=95 >=95 >=95 >=95 >=95 >=95 >=95 >=95 >=95 >=95 >=95 >=95 >=95 >=95 >=95 >=95 >=95 >=95
Middle >=95 >=95 >=95 94.9 >=95 >=95 >=95 >=95 >=95 >=95 >=95 >=95 94.9 93.9 94.1 93.9 94.5 >=95
High 94.4 94.9 94.1 93.1 90.8 89.9 94.3 94.9 93.9 94.6 93.4 93.1 94.5 94.8 94.4 92.0 89.0 87.4
Elementary 94.8 94.6 94.6 94.1 >=95 >=95 94.8 94.6 94.6 94.1 >=95 94.9 94.9 94.6 94.6 94.1 >=95 >=95
Middle 92.4 92.7 93.2 93.0 93.7 93.4 92.2 92.5 93.0 92.8 93.5 93.2 92.7 92.8 93.4 93.2 93.8 93.7
High 88.8 88.9 88.8 89.3 89.7 90.1 88.9 89.1 89.5 89.9 90.1 90.4 88.6 88.7 88.1 88.8 89.3 89.9
Annual Measurable Objective (AMO):
All Students
Table 5.1: Attendance Rates
Limited English Proficient (LEP)
Male Female
Subgroups by Level
American Indian or Alaska Native
All Students
Hispanic/Latino of any race
Free/Reduced Meals (FARMS)
Special Education
White
Asian
Black or African American
Two or more races
Native Hawaiian or Other Pacific Islander
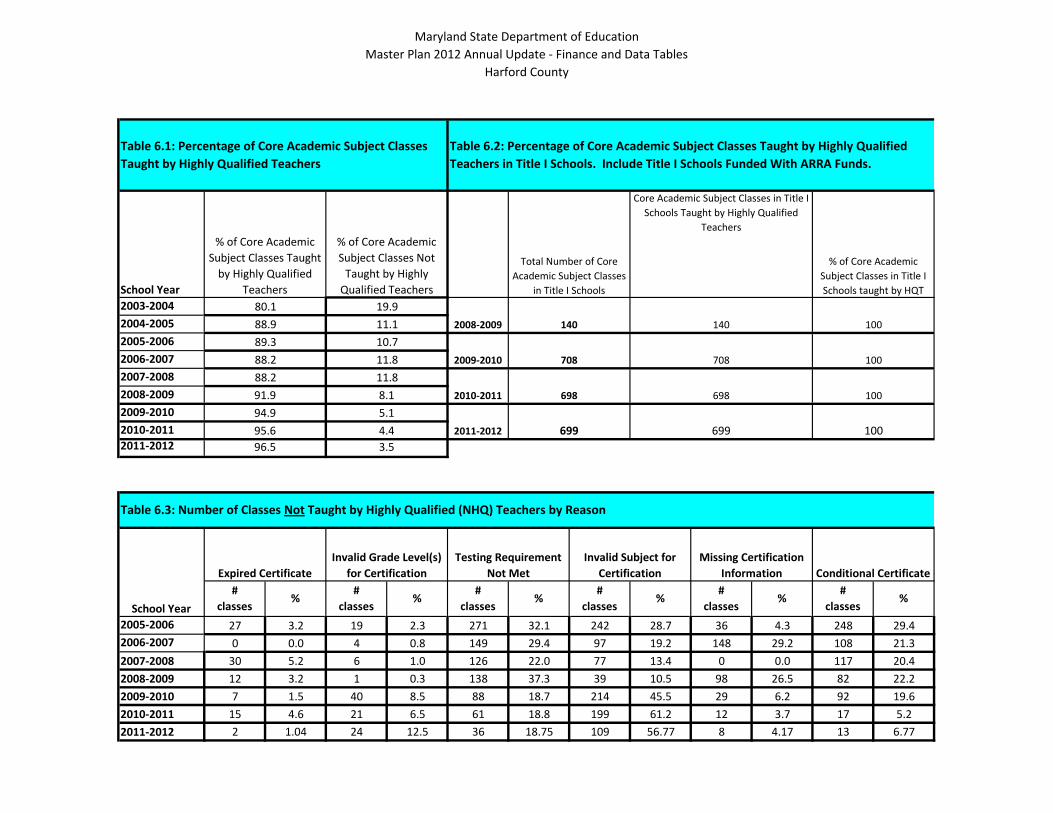
Maryland State Department of Education
Master Plan 2012 Annual Update - Finance and Data Tables
Harford County
2003-2004
2004-2005
2005-2006
2006-2007
2007-2008
2008-2009
2009-2010
2010-2011
2011-2012
2005-2006 27 3.2 19 2.3 271 32.1 242 28.7 36 4.3 248 29.4
2006-2007 0 0.0 4 0.8 149 29.4 97 19.2 148 29.2 108 21.3
2007-2008 30 5.2 6 1.0 126 22.0 77 13.4 0 0.0 117 20.4
2008-2009 12 3.2 1 0.3 138 37.3 39 10.5 98 26.5 82 22.2
2009-2010 7 1.5 40 8.5 88 18.7 214 45.5 29 6.2 92 19.6
2010-2011 15 4.6 21 6.5 61 18.8 199 61.2 12 3.7 17 5.2
2011-2012 2 1.04 24 12.5 36 18.75 109 56.77 8 4.17 13 6.77
100
8.1
94.9
708
5.1
2010-2011 698 698
699 699
Table 6.1: Percentage of Core Academic Subject Classes
Taught by Highly Qualified Teachers
Table 6.2: Percentage of Core Academic Subject Classes Taught by Highly Qualified
Teachers in Title I Schools. Include Title I Schools Funded With ARRA Funds.
School Year
% of Core Academic
Subject Classes Taught
by Highly Qualified
Teachers
% of Core Academic
Subject Classes Not
Taught by Highly
Qualified Teachers
Total Number of Core
Academic Subject Classes
in Title I Schools
Core Academic Subject Classes in Title I
Schools Taught by Highly Qualified
Teachers
% of Core Academic
Subject Classes in Title I
Schools taught by HQT
Conditional Certificate
#
classes
2008-2009 140 140 100
2009-2010 708
%#
classes
Missing Certification
Information
%
Table 6.3: Number of Classes Not Taught by Highly Qualified (NHQ) Teachers by Reason
2011-2012
100
100
#
classes
80.1
88.9
89.3
88.2
88.2
95.6
19.9
11.1
10.7
11.8
11.8
4.4
96.5 3.5
91.9
School Year
Expired Certificate
Invalid Grade Level(s)
for Certification
Testing Requirement
Not Met
Invalid Subject for
Certification
%#
classes%
#
classes%%
#
classes
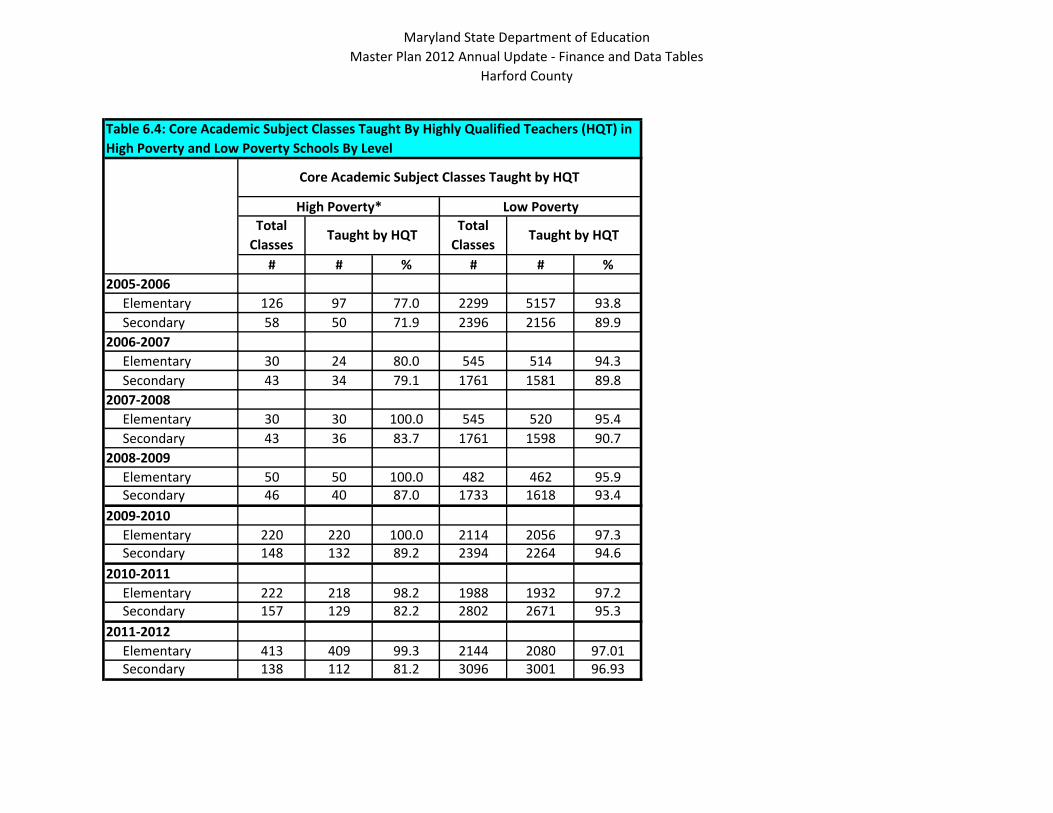
Maryland State Department of Education
Master Plan 2012 Annual Update - Finance and Data Tables
Harford County
# # % # # %
126 97 77.0 2299 5157 93.8
58 50 71.9 2396 2156 89.9
30 24 80.0 545 514 94.3
43 34 79.1 1761 1581 89.8
30 30 100.0 545 520 95.4
43 36 83.7 1761 1598 90.7
50 50 100.0 482 462 95.946 40 87.0 1733 1618 93.4
220 220 100.0 2114 2056 97.3148 132 89.2 2394 2264 94.6
222 218 98.2 1988 1932 97.2157 129 82.2 2802 2671 95.3
413 409 99.3 2144 2080 97.01138 112 81.2 3096 3001 96.93 Secondary
Secondary
2011-2012
Elementary
Secondary
2007-2008
Elementary
Core Academic Subject Classes Taught by HQT
High Poverty* Low Poverty
Total
ClassesTaught by HQT
Total
ClassesTaught by HQT
Table 6.4: Core Academic Subject Classes Taught By Highly Qualified Teachers (HQT) in
High Poverty and Low Poverty Schools By Level
2010-2011
Elementary
Secondary
Secondary
2008-2009
2009-2010
Elementary
Secondary Elementary
2005-2006
Elementary
Secondary
2006-2007
Elementary
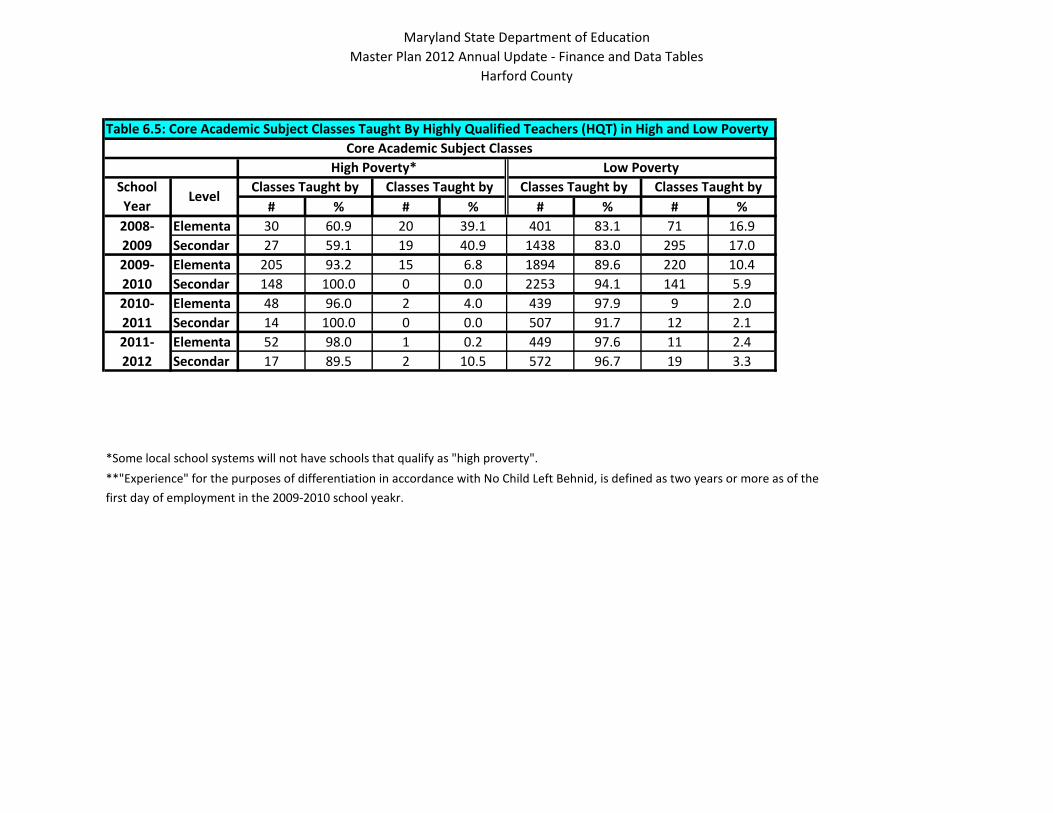
Maryland State Department of Education
Master Plan 2012 Annual Update - Finance and Data Tables
Harford County
# % # % # % # %
Elementa 30 60.9 20 39.1 401 83.1 71 16.9
Secondar 27 59.1 19 40.9 1438 83.0 295 17.0
Elementa 205 93.2 15 6.8 1894 89.6 220 10.4
Secondar 148 100.0 0 0.0 2253 94.1 141 5.9
Elementa 48 96.0 2 4.0 439 97.9 9 2.0
Secondar 14 100.0 0 0.0 507 91.7 12 2.1
Elementa 52 98.0 1 0.2 449 97.6 11 2.4
Secondar 17 89.5 2 10.5 572 96.7 19 3.3
**"Experience" for the purposes of differentiation in accordance with No Child Left Behnid, is defined as two years or more as of the
first day of employment in the 2009-2010 school yeakr.
Classes Taught by
High Poverty* Low Poverty
Table 6.5: Core Academic Subject Classes Taught By Highly Qualified Teachers (HQT) in High and Low Poverty
Core Academic Subject Classes
School
YearLevel
Classes Taught by Classes Taught by Classes Taught by
*Some local school systems will not have schools that qualify as "high proverty".
2008-
2009
2009-
2010
2010-
2011
2011-
2012

Maryland State Department of Education
Master Plan 2012 Annual Update - Finance and Data Tables
Harford County
Numer- Denom- % Numer- Denom- % Numer- Denom- % Numer- Denom- % %
2006-2007 84 3160 2.7 181 3160 5.7 4 3160 0.1 40 3160 1.3
2007-2008 60 3170 1.9 150 3170 4.7 5 3170 0.2 30 3170 0.7
2008-2009 71 3132 2.3 120 3132 3.8 14 3132 0.5 37 3132 0.1
2009-2010 63 3290 1.9 105 3290 3.2 3 3290 0.0 25 3290 0.1
2010-2011 73 3171 2.3 109 3171 3.4 3 3171 0.1 28 3171 0.1
2011-2012 73 3327 2.2 135 3327 4.1 2 3327 0.1 20 3327 0.6
___X_Entire teaching staff or
_____ Core Academic Subject area teachers
Use the data available as of September 1st following each of the school years to be reported. Report data for the entire teaching staff or for teachers of Core
Academic Subject areas if those data are available. Indicate the population reflected in the data:
Table 6.6: Attrition Rates
Total Overal Attrition
Attrition Due To
(Category):
Retirement Resignation Dismissal/Non-renewal Leaves

Maryland State Department of Education
Master Plan 2012 Annual Update - Finance and Data Tables
Harford County
2008-2009 165
2009-2010 108
2010-2011 85
2011-2012 73
2012-2013* 45
*As of July 1, 2012
100.0
85 100.0
73 100.0
108 100.0
165 100.0
45
Table 6.7: Percentage of Qualified Paraprofessionals Working in Title I Schools. Include Title I Schools Total Number of
Paraprofessionals
Working in Title I
Schools
Qualified Paraprofessionals Working in Title I Schools
# %
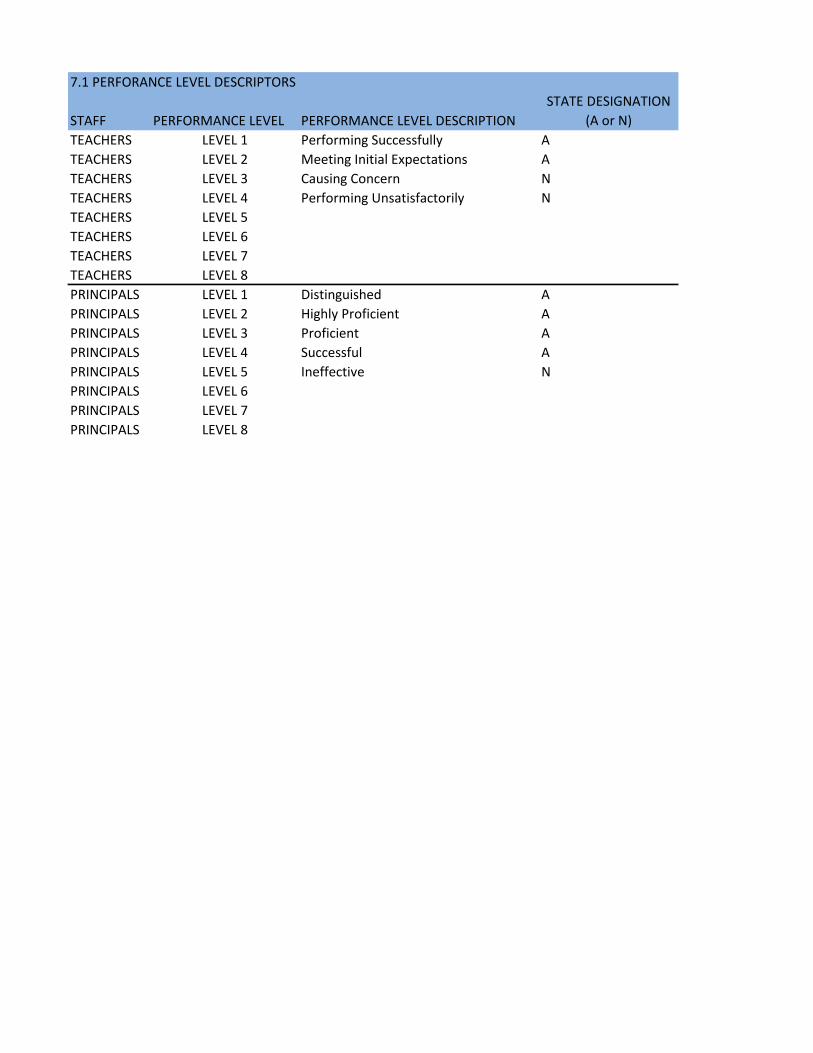
STAFF PERFORMANCE LEVEL PERFORMANCE LEVEL DESCRIPTION
STATE DESIGNATION
(A or N)
TEACHERS LEVEL 1 Performing Successfully A
TEACHERS LEVEL 2 Meeting Initial Expectations A
TEACHERS LEVEL 3 Causing Concern N
TEACHERS LEVEL 4 Performing Unsatisfactorily N
TEACHERS LEVEL 5
TEACHERS LEVEL 6
TEACHERS LEVEL 7
TEACHERS LEVEL 8
PRINCIPALS LEVEL 1 Distinguished A
PRINCIPALS LEVEL 2 Highly Proficient A
PRINCIPALS LEVEL 3 Proficient A
PRINCIPALS LEVEL 4 Successful A
PRINCIPALS LEVEL 5 Ineffective N
PRINCIPALS LEVEL 6
PRINCIPALS LEVEL 7
PRINCIPALS LEVEL 8
7.1 PERFORANCE LEVEL DESCRIPTORS
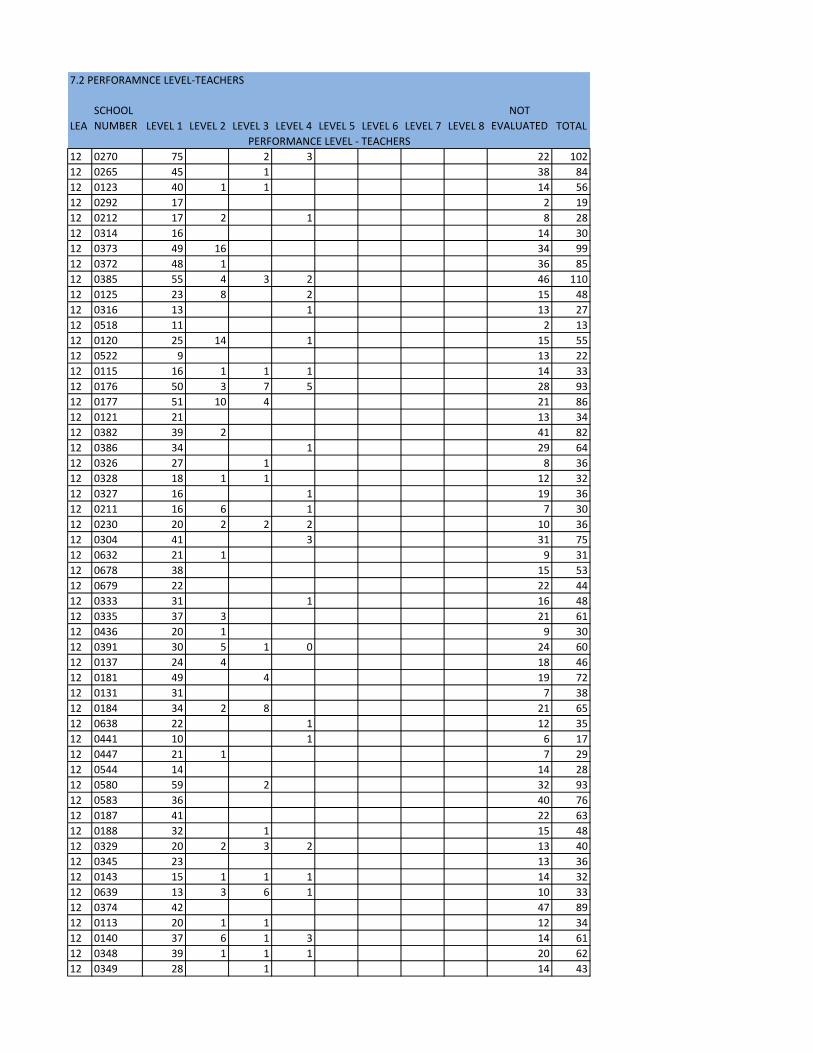
LEA
SCHOOL
NUMBER LEVEL 1 LEVEL 2 LEVEL 3 LEVEL 4 LEVEL 5 LEVEL 6 LEVEL 7 LEVEL 8
NOT
EVALUATED TOTAL
12 0270 75 2 3 22 102
12 0265 45 1 38 84
12 0123 40 1 1 14 56
12 0292 17 2 19
12 0212 17 2 1 8 28
12 0314 16 14 30
12 0373 49 16 34 99
12 0372 48 1 36 85
12 0385 55 4 3 2 46 110
12 0125 23 8 2 15 48
12 0316 13 1 13 27
12 0518 11 2 13
12 0120 25 14 1 15 55
12 0522 9 13 22
12 0115 16 1 1 1 14 33
12 0176 50 3 7 5 28 93
12 0177 51 10 4 21 86
12 0121 21 13 34
12 0382 39 2 41 82
12 0386 34 1 29 64
12 0326 27 1 8 36
12 0328 18 1 1 12 32
12 0327 16 1 19 36
12 0211 16 6 1 7 30
12 0230 20 2 2 2 10 36
12 0304 41 3 31 75
12 0632 21 1 9 31
12 0678 38 15 53
12 0679 22 22 44
12 0333 31 1 16 48
12 0335 37 3 21 61
12 0436 20 1 9 30
12 0391 30 5 1 0 24 60
12 0137 24 4 18 46
12 0181 49 4 19 72
12 0131 31 7 38
12 0184 34 2 8 21 65
12 0638 22 1 12 35
12 0441 10 1 6 17
12 0447 21 1 7 29
12 0544 14 14 28
12 0580 59 2 32 93
12 0583 36 40 76
12 0187 41 22 63
12 0188 32 1 15 48
12 0329 20 2 3 2 13 40
12 0345 23 13 36
12 0143 15 1 1 1 14 32
12 0639 13 3 6 1 10 33
12 0374 42 47 89
12 0113 20 1 1 12 34
12 0140 37 6 1 3 14 61
12 0348 39 1 1 1 20 62
12 0349 28 1 14 43
PERFORMANCE LEVEL - TEACHERS
7.2 PERFORAMNCE LEVEL-TEACHERS

LEA LEVEL 1 LEVEL 2 LEVEL 3 LEVEL 4 LEVEL 5 LEVEL 6 LEVEL 7 LEVEL 8
NOT
EVALUATED TOTAL
12 16 17 5 16 54
PERFORMANCE LEVEL - PRINCIPALS
7.3 PERFORMANCE LEVEL-PRINCIPALS

Maryland State Department of Education
Master Plan 2012 Annual Update - Finance and Data Tables
Harford County
SP LL MT ST SS TA PD Co
mp
osi
te
SP LL MT ST SS TA PD Co
mp
osi
te
SP LL MT ST SS TA PD Co
mp
osi
te
2004-2005 77 64 61 52 77 75 90 76 20 31 31 41 21 23 9 22 3 5 8 7 3 2 1 2
2005-2006 80 69 67 53 77 80 90 80 16 26 28 42 20 19 8 18 3 5 5 5 2 1 1 2
2006-2007 80 71 76 62 80 83 91 83 17 24 19 34 18 16 8 15 3 5 5 4 2 1 1 22007-2008 77 70 76 62 78 80 90 82 19 25 18 33 19 18 9 16 4 6 6 5 2 2 1 3
2008-2009 80 73 79 66 83 82 92 84 16 22 16 30 15 16 7 14 4 5 5 5 2 2 1 2
2009-2010 76 71 77 63 81 81 90 82 20 23 17 31 17 18 9 16 3 6 6 5 2 2 1 3
2010-2011 82 73 80 72 86 87 93 85 15 21 15 24 13 12 6 13 3 6 5 4 1 1 1 2
2011-2012 83 77 84 70 85 87 92 87 14 20 13 27 13 12 7 12 3 4 3 3 1 1 1 2
2004-2005 64 59 32 33 4 9
2005-2006 70 69 26 27 5 4
2006-2007 69 74 26 21 5 52007-2008 72 78 24 17 4 5
2008-2009 74 79 22 16 5 5
2009-2010 67 72 25 20 8 7
2010-2011 72 78 23 17 5 4
2011-2012 77 84 20 13 4 4
Table 8.2: Percentage of Kindergarten Students with Previous Prekindergarten
Experience
% Fully Ready % Approaching Readiness% Developing
Readiness
LL MT LL MT LL MT
Table 8.1: Percentage of All Kindergarten Students at Readiness Stages
% Fully Ready % Approaching Readiness % Developing Readiness

Maryland State Department of Education
Master Plan 2012 Annual Update - Finance and Data Tables
Harford County
SchoolHalf Day
Sessions
Total # Students
Enrolled 9.30.11
Income Eligible Students
13A.06.02.05 (A)
Students Enrolled Under
Other Criteria 13A.06.02.05 (B)
Number of
Students
Placed on Waiting
List
Number of
Students enrolled through
early admissio
n 13A.08.01.02 A(3)
If
available: Number
of
Students enrolled
with ISFP or IEP
Abingdon 2 36 36 0 0 0 0
Bakerfield 2 28 22 6 0 0 1
Bel Air 2 28 25 3 0 0 3
Church Creek 2 34 34 0 0 0 0
Deerfield 2 39 36 3 0 0 3
Dublin 2 21 14 7 0 0 2
Edgewood 2 30 6 24 0 0 24
George Lisby@ Hillsdale 2 42 39 3 0 0 3
Hall’s Cross Roads 2 33 28 5 0 0 5
Havre de Grace 2 39 35 4 0 0 3
Homestead/Wakefield 2 32 17 15 0 0 15
Joppatowne 2 26 26 0 0 0 0
Magnolia 4 48 40 8 0 0 5
Meadowvale 2 20 20 0 0 0 0
North Harford 2 44 21 23 0 0 0
Prospect Mill 2 26 24 2 0 0 2
Riverside 2 31 28 3 0 0 1
Roye Williams 2 32 32 0 0 0 0
William Paca/ Old Post
Road4 75 75 0 0 0 0
Total 42 664 558 106 0 0 67
8.3 Harford Prekindergarten (4 year old) 9.30.11 Enrollment Data

FY 2013 Part II: Attachments
2012 BTE Master Plan Update Harford County Public Schools

Table of Contents
INFORMATION PAGE
NUMBERS
Submission Cover Page Page 1
Attachments 4A – 6A Pages 3 – 11
Attachment 7: Title I, Part A Pages 1 – 29 and
Appendix Pages 1 - 71
Attachment 8: Title II, Part A Pages A8.1 – A8.72
Attachment 10: Title III, Part A Pages A10.1 – A10.70
Attachment 12: Title I, Part D Page A12.1
Attachment 13: Fine Arts Page A13.1 – A13.10
ADDITIONAL FEDERAL AND STATE REPORTING REQUIREMENTS
RR
Victims of Violent Criminal Offenses Report RR-1
Achieving Equity in Teacher and Principal Distribution RR-2 – RR-5
Transfer of School Records for Children in State-Supervised Care Annual Certification Statement
RR-6
Student Records Review and Update Verification Certification Statement
RR-7
FY 2013 Harford County Public Schools Page 2
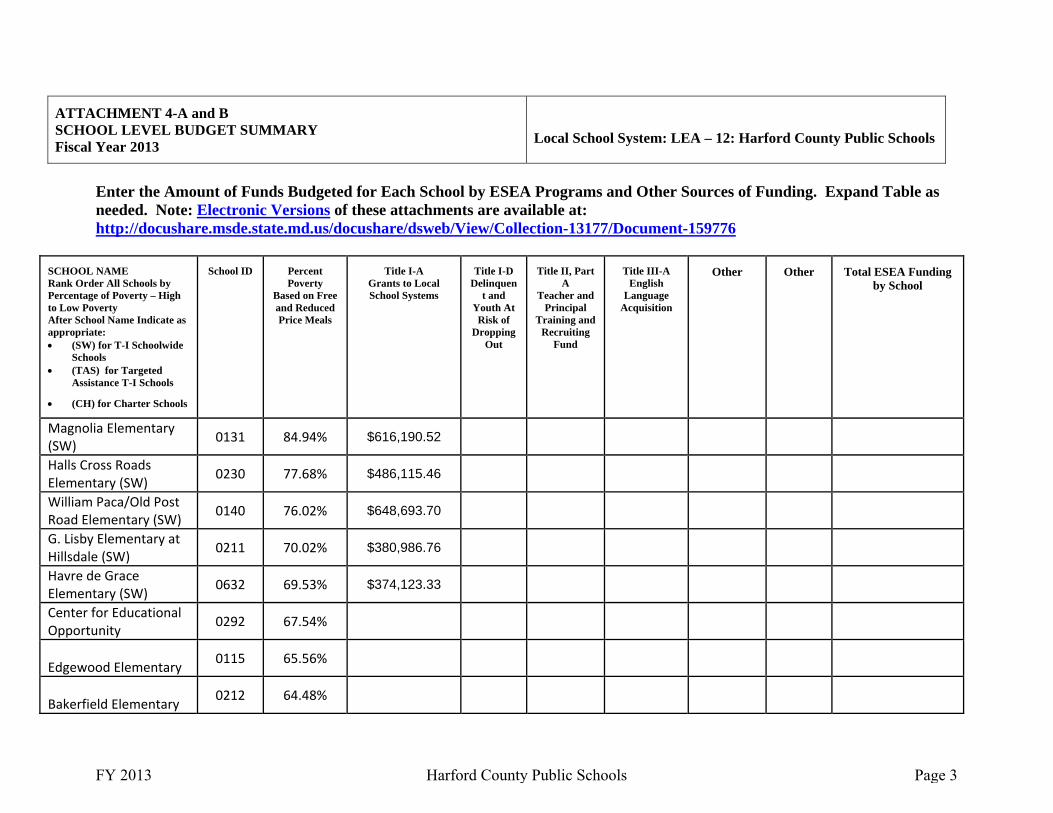
ATTACHMENT 4-A and B SCHOOL LEVEL BUDGET SUMMARY Fiscal Year 2013
Local School System: LEA – 12: Harford County Public Schools
Enter the Amount of Funds Budgeted for Each School by ESEA Programs and Other Sources of Funding. Expand Table as needed. Note: Electronic Versions of these attachments are available at: http://docushare.msde.state.md.us/docushare/dsweb/View/Collection-13177/Document-159776
SCHOOL NAME Rank Order All Schools by Percentage of Poverty – High to Low Poverty After School Name Indicate as appropriate: (SW) for T-I Schoolwide
Schools (TAS) for Targeted
Assistance T-I Schools
(CH) for Charter Schools
School ID Percent Poverty
Based on Free and Reduced Price Meals
Title I-A Grants to Local School Systems
Title I-D Delinquen
t and Youth At Risk of
Dropping Out
Title II, Part A
Teacher and Principal
Training and Recruiting
Fund
Title III-A English
Language Acquisition
Other Other Total ESEA Funding by School
Magnolia Elementary (SW) 0131 84.94% $616,190.52
Halls Cross Roads Elementary (SW) 0230 77.68% $486,115.46
William Paca/Old Post Road Elementary (SW) 0140 76.02% $648,693.70
G. Lisby Elementary at Hillsdale (SW) 0211 70.02% $380,986.76
Havre de Grace Elementary (SW) 0632 69.53% $374,123.33
Center for Educational Opportunity 0292 67.54%
Edgewood Elementary 0115 65.56%
Bakerfield Elementary 0212 64.48%
FY 2013 Harford County Public Schools Page 3
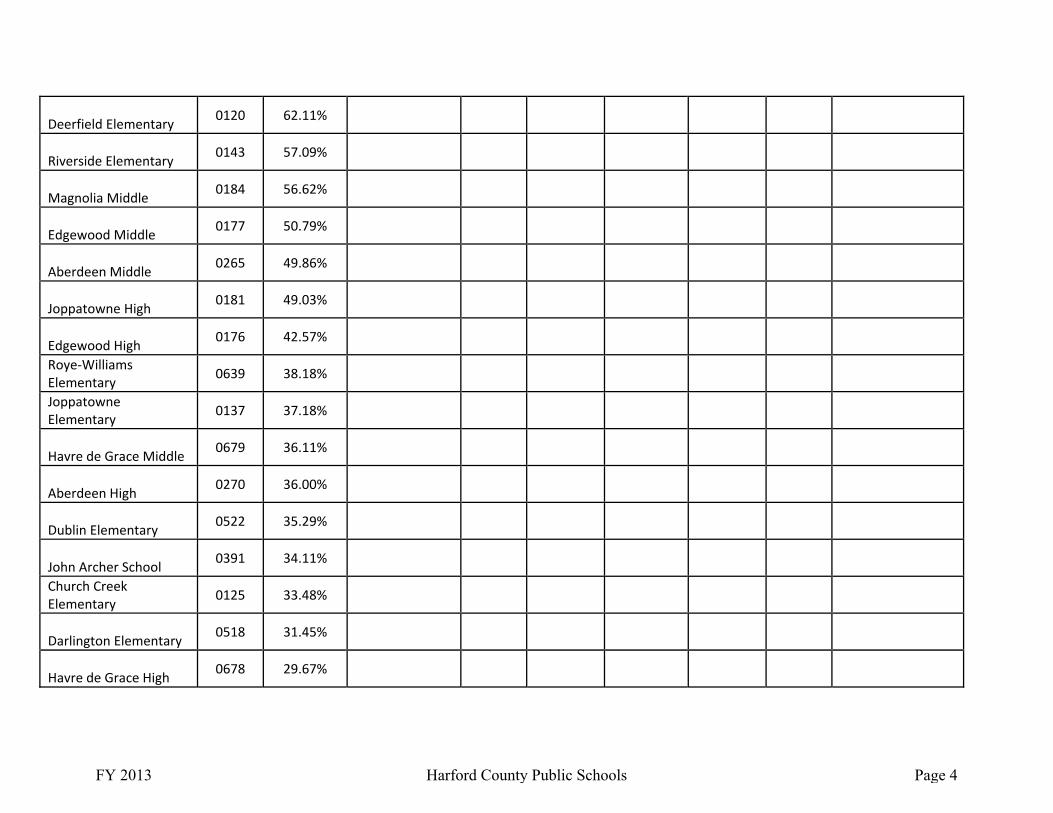
Deerfield Elementary 0120 62.11%
Riverside Elementary 0143 57.09%
Magnolia Middle 0184 56.62%
Edgewood Middle 0177 50.79%
Aberdeen Middle 0265 49.86%
Joppatowne High 0181 49.03%
Edgewood High 0176 42.57%
Roye‐Williams Elementary 0639 38.18%
Joppatowne Elementary 0137 37.18%
Havre de Grace Middle 0679 36.11%
Aberdeen High 0270 36.00%
Dublin Elementary 0522 35.29%
John Archer School 0391 34.11%
Church Creek Elementary 0125 33.48%
Darlington Elementary 0518 31.45%
Havre de Grace High 0678 29.67%
FY 2013 Harford County Public Schools Page 4

Meadowvale Elementary 0638 25.75%
Patterson Mill Middle School 0188 25.55%
Bel Air Elementary 0314 25.41%
Abingdon Elementary 0123 24.30%
North Harford Elementary 0544 23.08%
William S. James Elementary 0113 22.96%
Prospect Mill Elementary 0329 20.28%
Norrisville Elementary 0441 17.59%
Harford Technical High 0304 17.08%
Churchville Elementary 0316 16.27%
North Harford Middle 0583 15.60%
North Bend Elementary 0447 15.38%
Bel Air Middle 0372 15.28%
Ring Factory Elementary 0345 14.21%
North Harford High 0580 13.67%
Hickory Elementary 0333 13.32%
FY 2013 Harford County Public Schools Page 5
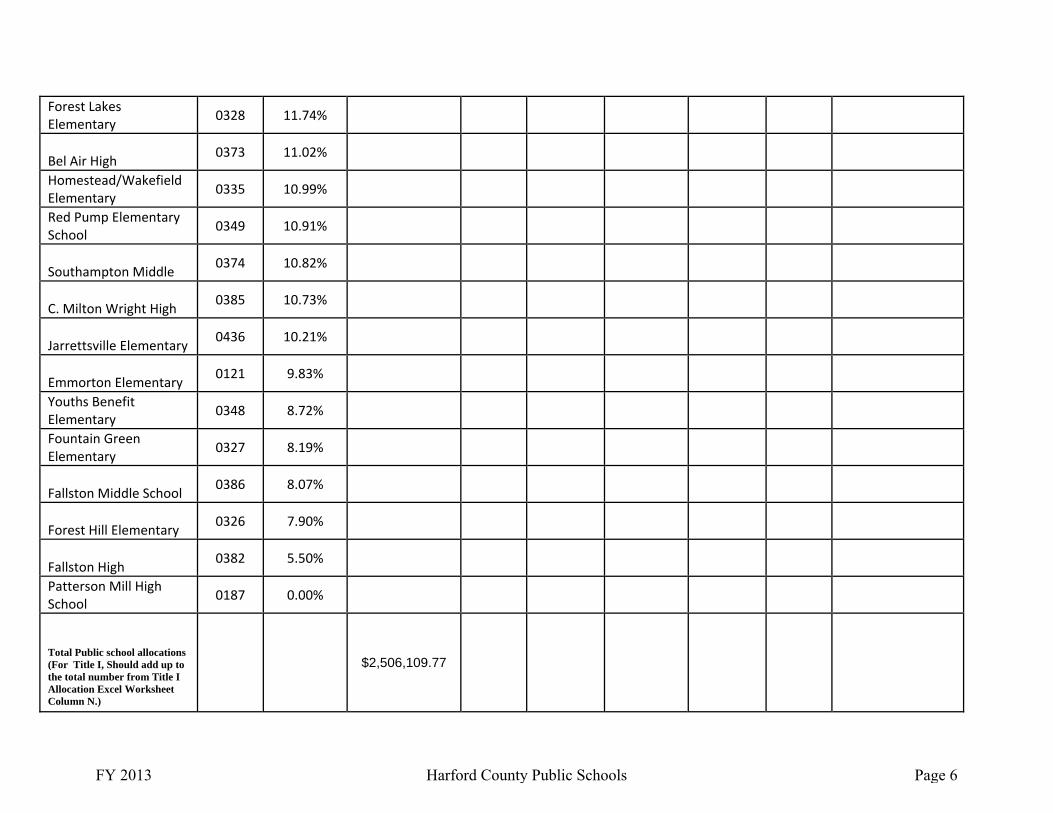
Forest Lakes Elementary 0328 11.74%
Bel Air High 0373 11.02%
Homestead/Wakefield Elementary 0335 10.99%
Red Pump Elementary School 0349 10.91%
Southampton Middle 0374 10.82%
C. Milton Wright High 0385 10.73%
Jarrettsville Elementary 0436 10.21%
Emmorton Elementary 0121 9.83%
Youths Benefit Elementary 0348 8.72%
Fountain Green Elementary 0327 8.19%
Fallston Middle School 0386 8.07%
Forest Hill Elementary 0326 7.90%
Fallston High 0382 5.50%
Patterson Mill High School 0187 0.00%
Total Public school allocations (For Title I, Should add up to the total number from Title I Allocation Excel Worksheet Column N.)
$2,506,109.77
FY 2013 Harford County Public Schools Page 6

School System Administration (For Title I, Use Table 7-8 LINE 5)
$630,727.28
System-wide Programs and School System Support to Schools
(For Title I, Use Table 7-8 LINE 12)
$1,174,440.10
Nonpublic Costs
(For Title I, Use Table 7-10 LINE 7)
$200,994.85
TOTAL LSS Title I Allocation (Should match # presented on
C-1-25)
$4,512,272.00
FY 2013 Harford County Public Schools Page 7
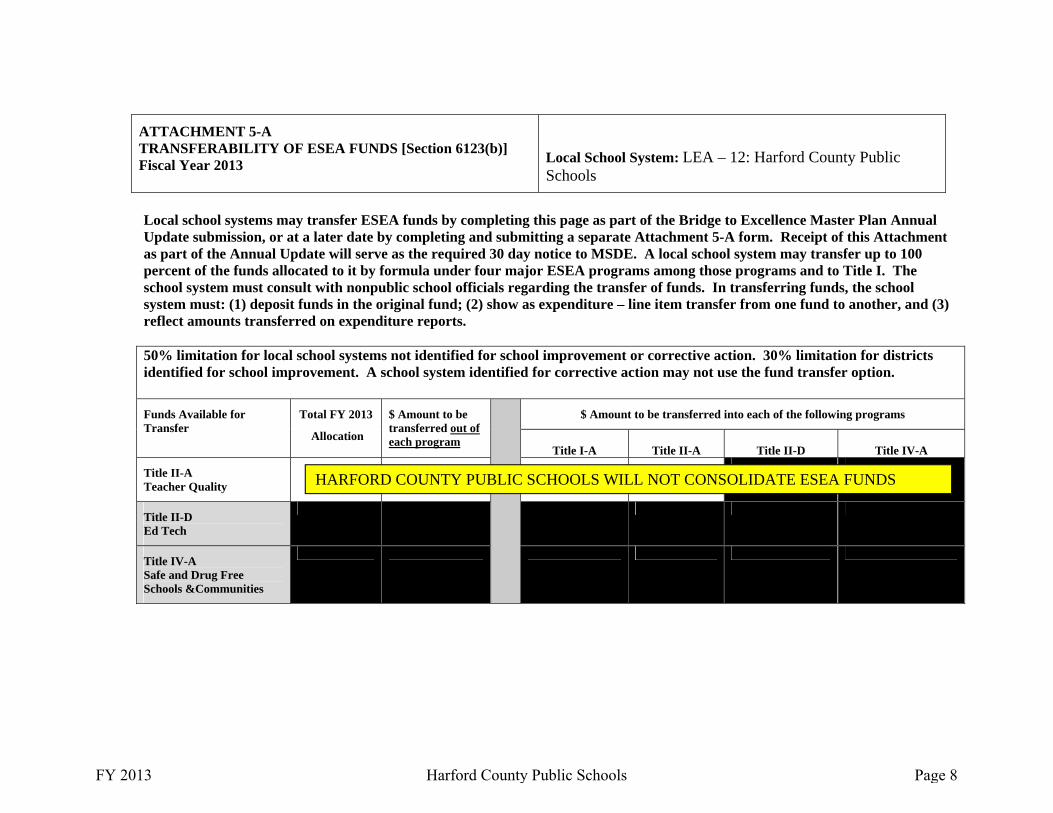
ATTACHMENT 5-A TRANSFERABILITY OF ESEA FUNDS [Section 6123(b)] Fiscal Year 2013
Local School System: LEA – 12: Harford County Public Schools
Local school systems may transfer ESEA funds by completing this page as part of the Bridge to Excellence Master Plan Annual Update submission, or at a later date by completing and submitting a separate Attachment 5-A form. Receipt of this Attachment as part of the Annual Update will serve as the required 30 day notice to MSDE. A local school system may transfer up to 100 percent of the funds allocated to it by formula under four major ESEA programs among those programs and to Title I. The school system must consult with nonpublic school officials regarding the transfer of funds. In transferring funds, the school system must: (1) deposit funds in the original fund; (2) show as expenditure – line item transfer from one fund to another, and (3) reflect amounts transferred on expenditure reports. 50% limitation for local school systems not identified for school improvement or corrective action. 30% limitation for districts identified for school improvement. A school system identified for corrective action may not use the fund transfer option.
Funds Available for Transfer
Total FY 2013
Allocation
$ Amount to be transferred out of each program
$ Amount to be transferred into each of the following programs
Title I-A
Title II-A
Title II-D
Title IV-A
Title II-A Teacher Quality
Title II-D Ed Tech
Title IV-A Safe and Drug Free Schools &Communities
HARFORD COUNTY PUBLIC SCHOOLS WILL NOT CONSOLIDATE ESEA FUNDS
FY 2013 Harford County Public Schools Page 8
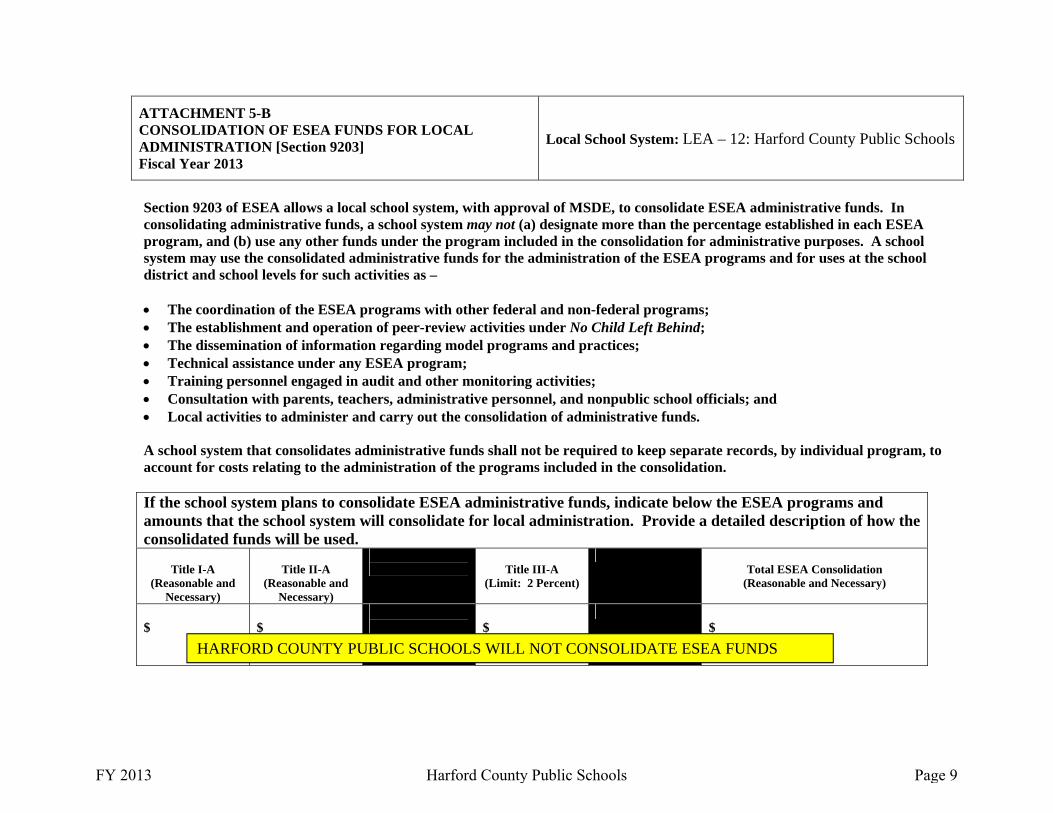
ATTACHMENT 5-B CONSOLIDATION OF ESEA FUNDS FOR LOCAL ADMINISTRATION [Section 9203] Fiscal Year 2013
Local School System: LEA – 12: Harford County Public Schools
Section 9203 of ESEA allows a local school system, with approval of MSDE, to consolidate ESEA administrative funds. In consolidating administrative funds, a school system may not (a) designate more than the percentage established in each ESEA program, and (b) use any other funds under the program included in the consolidation for administrative purposes. A school system may use the consolidated administrative funds for the administration of the ESEA programs and for uses at the school district and school levels for such activities as – The coordination of the ESEA programs with other federal and non-federal programs; The establishment and operation of peer-review activities under No Child Left Behind; The dissemination of information regarding model programs and practices; Technical assistance under any ESEA program; Training personnel engaged in audit and other monitoring activities; Consultation with parents, teachers, administrative personnel, and nonpublic school officials; and Local activities to administer and carry out the consolidation of administrative funds.
A school system that consolidates administrative funds shall not be required to keep separate records, by individual program, to account for costs relating to the administration of the programs included in the consolidation.
If the school system plans to consolidate ESEA administrative funds, indicate below the ESEA programs and amounts that the school system will consolidate for local administration. Provide a detailed description of how the consolidated funds will be used.
Title I-A
(Reasonable and Necessary)
Title II-A
(Reasonable and Necessary)
Title III-A
(Limit: 2 Percent)
Total ESEA Consolidation
(Reasonable and Necessary)
$
$
$
$
HARFORD COUNTY PUBLIC SCHOOLS WILL NOT CONSOLIDATE ESEA FUNDS
FY 2013 Harford County Public Schools Page 9

ATTACHMENT 6-A NONPUBLIC SCHOOL INFORMATION FOR ESEA PROGRAMS
Fiscal Year 2013
Local School System: Harford County Public Schools
Enter the complete information for each participating nonpublic school, including mailing address. Use the optional “Comments” area to provide additional information about ESEA services to nonpublic school students, teachers, and other school personnel. For example, if Title I services are provided through home tutoring services or by a third party contractor, please indicate that information under “Comments.” NOTE: Complete Attachment 6-A for Title I-A, Title II-A, and Title III services. Use separate pages as necessary.
NONPUBLIC SCHOOL NAME AND ADDRESS
Number of Nonpublic School Participants (Students, Teachers, and Other School Personnel) Title I-A Title II-A Title III-A Comments (Optional)
Number nonpublic T-I students to be
served at the following locations:
Students Reading/Lang.
Arts (Can be a duplicated
count)
Students Mathematics
(Can be a duplicated
count)
Staff Students Staff
The John Carroll School 703 E. Churchville Road Bel Air, MD 21014
Private School
69 681 69
Public School
Neutral Site
Mountain Christian School 1824 Mountain Road Joppa, MD 21085
Private School
28 241 28
Public School
Neutral Site
Oak Grove Classical Christian School 2106 E. Churchville Road Bel Air, MD 21015
Private School
14 75 14
Public School
Neutral Site
FY 2013 Harford County Public Schools Page 10
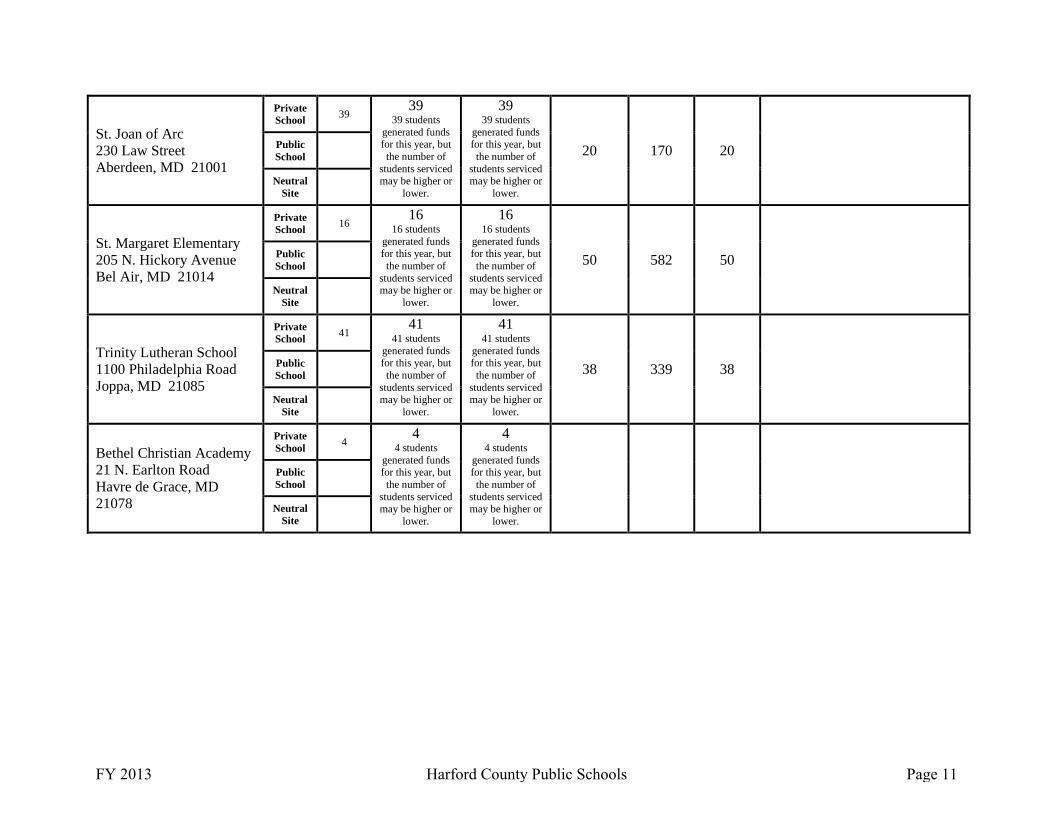
St. Joan of Arc 230 Law Street Aberdeen, MD 21001
Private School
39 39
39 students generated funds for this year, but the number of
students serviced may be higher or
lower.
39 39 students
generated funds for this year, but the number of
students serviced may be higher or
lower.
20 170 20
Public School
Neutral Site
St. Margaret Elementary 205 N. Hickory Avenue Bel Air, MD 21014
Private School
16 16
16 students generated funds for this year, but the number of
students serviced may be higher or
lower.
16 16 students
generated funds for this year, but the number of
students serviced may be higher or
lower.
50 582 50
Public School
Neutral Site
Trinity Lutheran School 1100 Philadelphia Road Joppa, MD 21085
Private School
41 41
41 students generated funds for this year, but the number of
students serviced may be higher or
lower.
41 41 students
generated funds for this year, but the number of
students serviced may be higher or
lower.
38 339 38
Public School
Neutral Site
Bethel Christian Academy 21 N. Earlton Road Havre de Grace, MD 21078
Private School
4 4
4 students generated funds for this year, but the number of
students serviced may be higher or
lower.
4 4 students
generated funds for this year, but the number of
students serviced may be higher or
lower.
Public School
Neutral Site
FY 2013 Harford County Public Schools Page 11

Reviewed and Approved by COP: June 1, 2012
Attachment 7
Title I, Part A
Improving Basic Programs
LEA: 12 – Harford County Submission Date:
SY 2012-2013 Please go to www.marylandpublicschools.org. Click on Programs>Title I for the
application and required forms.

Part II
Additional Attachments
Table of Contents
1. Allocation Worksheet Page 2
2. Signed Assurance Page Page 3
3. Signed C – 125 Page 4
4. Magnolia ES, School‐Based Budget Narrative Page 5
5. Hall’s Cross Roads ES, School‐Based Budget Narrative Page 8
6. William Paca / Old Post Road ES, School‐Based Budget Narrative
Page 11
7. G. Lisby ES, School‐Based Budget Narrative Page 14
8. Havre de Grace ES, School‐Based Budget Narrative Page 18
9. Attachments 4‐A & B Page 21
10. Attachments 5‐A & B Page 26
11. Attachments 6‐A & B Page 28
Additional Attachments Page 1

Title I FY 13 Allocation WorksheetSchool Year 2012-2013
Submission Date Note: 1/2 day Pre-K equals .5 FTE
D E F G H I J K L M N O
N or P or F or S
SW or
TASMSDE
Sch ID #
Public School Name (Must rank order by Percent of Poverty
highest to lowest)
Charter school(s) place * after school name
Specific Numeric Grade Span
(public)
Percent of Poverty (I/H=G)
Public School
Enrollment (as of
9/30/11)
Number of Low
Income- Public School
Children (as of
10/31/11)
FTELow
Income Public School
Children (10/31/11)
Number of Low- Income
Private School
Children Residing in
this School's Attendance
Area.
FTELow Income
Private School
Children Residing in
this School's
Attendance Area.
Per Pupil Allocation (PPA)
Public School Allocation (J x M =N)
Allocation for Private School
Children (L x M =O)
1 SW 120131 MAGNOLIA ELEMENTARY PREK-5 84.94% 385 327 311.0 9 9 $1,981.32 $616,190.52 $17,831.882 SW 120230 HALLS CROSS ROADS ELEMENTARY PREK-5 77.68% 475 369 350.5 14 14 $1,386.92 $486,115.46 $19,416.883 F SW 120140 WM PACA/OLD POST RD ELEM PREK-5 76.02% 663 504 474.5 52 52 $1,367.11 $648,693.70 $71,089.724 SW 120211 GEORGE D LISBY ELEM AT HILLSDALE PREK-5 70.02% 427 299 287.0 5 5 $1,327.48 $380,986.76 $6,637.405 SW 120632 HAVRE DE GRACE ELEMENTARY PREK-5 69.53% 443 308 290.5 20 20 $1,287.86 $374,123.33 $25,757.20
Total 1807 1713.5 100 100.0 $2,506,109.77 $140,733.08Table 7-9 Table 7-9 Table 4 A & B Table 4 A & B
Table 7-10 /6
Notations:
Local School System
5-14-12 SY 12-13Additional Attachments Page 2

Additional Attachments Page 3

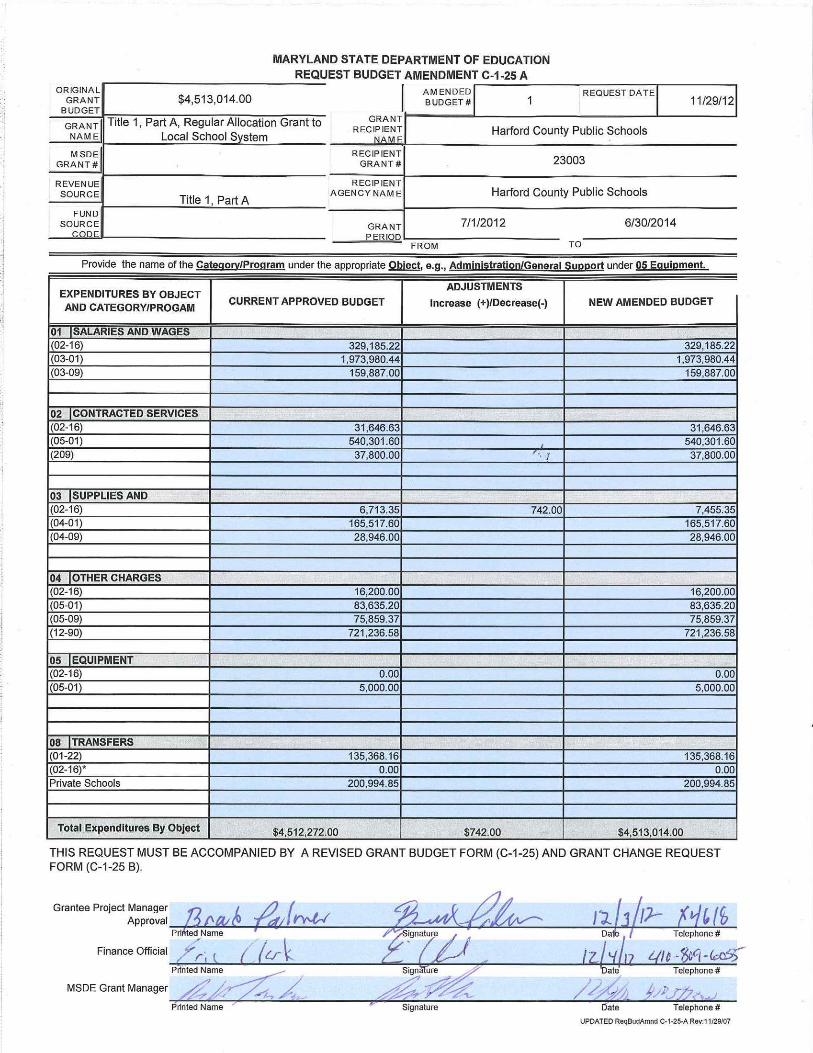
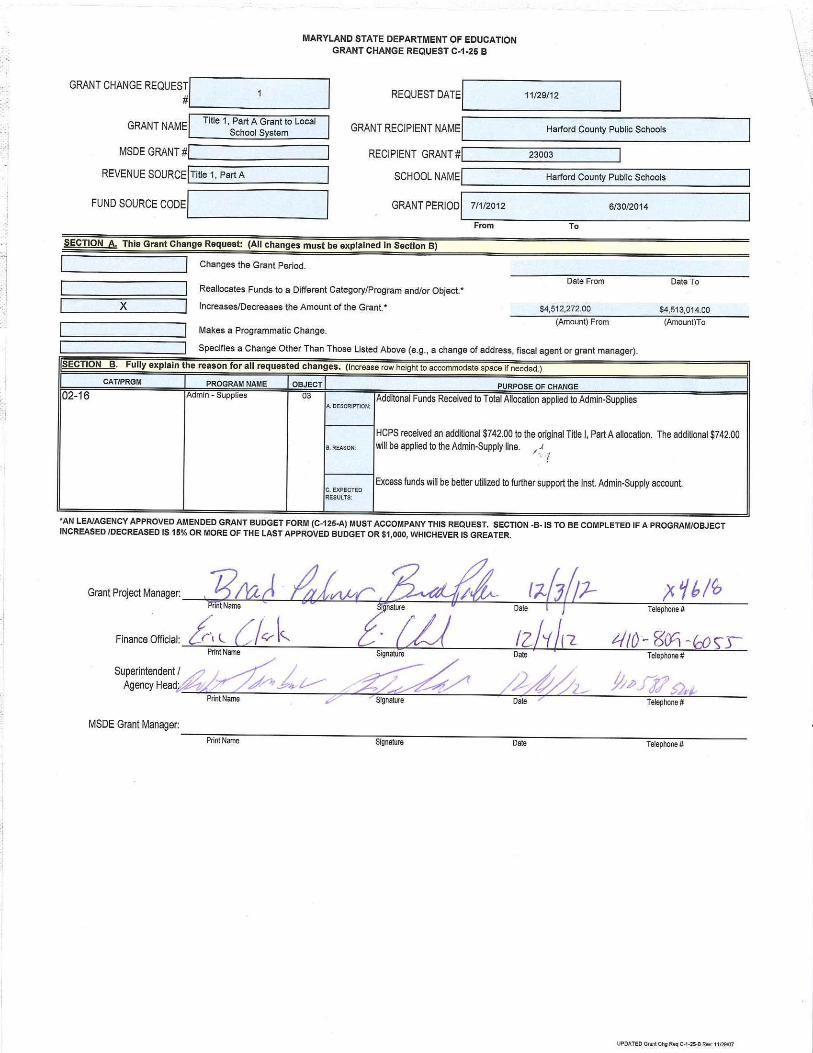
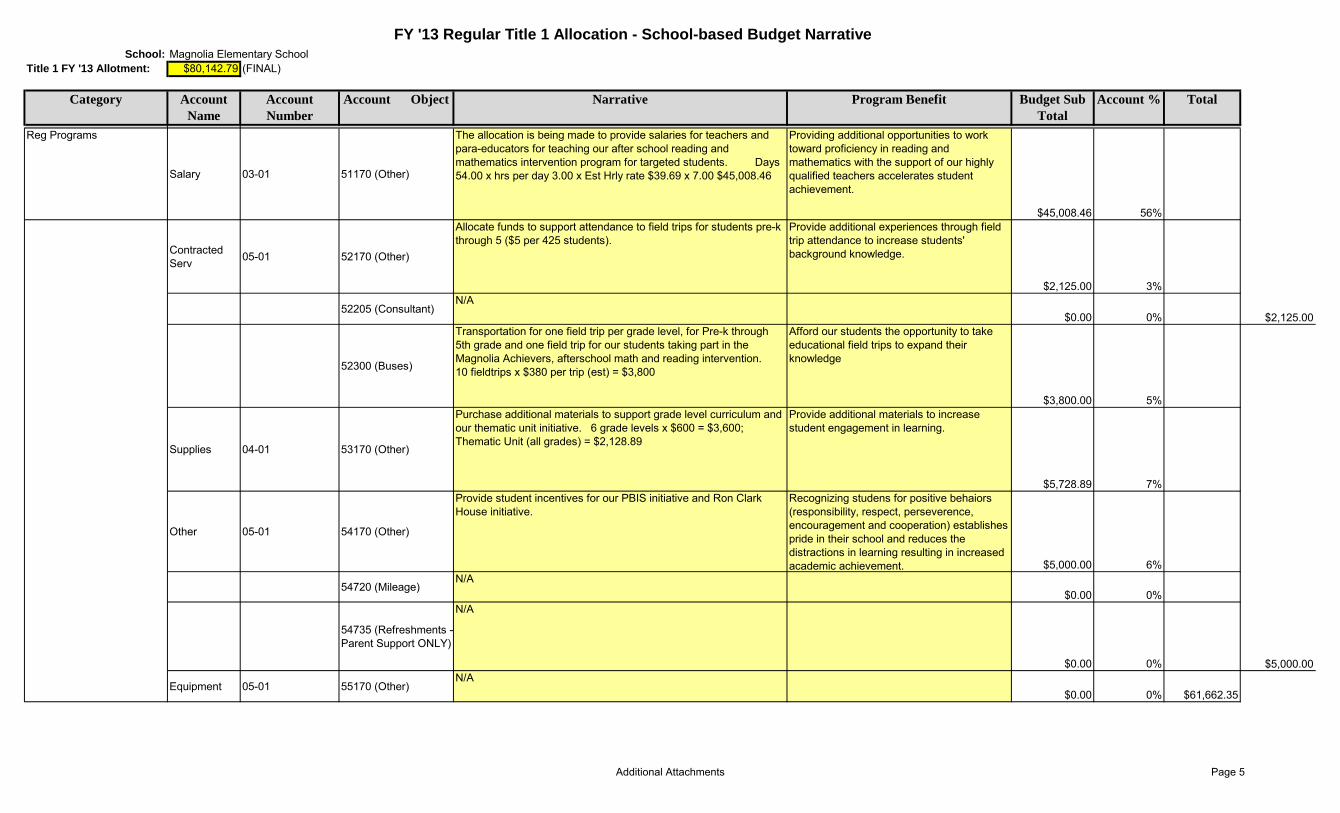
School: Magnolia Elementary SchoolTitle 1 FY '13 Allotment: $80,142.79 (FINAL)
Category Account Name
Account Number
Account Object Narrative Program Benefit Budget Sub Total
Account % Total
Reg Programs
Salary 03-01 51170 (Other)
The allocation is being made to provide salaries for teachers and para-educators for teaching our after school reading and mathematics intervention program for targeted students. Days 54.00 x hrs per day 3.00 x Est Hrly rate $39.69 x 7.00 $45,008.46
Providing additional opportunities to work toward proficiency in reading and mathematics with the support of our highly qualified teachers accelerates student achievement.
$45,008.46 56%
Contracted Serv 05-01 52170 (Other)
Allocate funds to support attendance to field trips for students pre-k through 5 ($5 per 425 students).
Provide additional experiences through field trip attendance to increase students' background knowledge.
$2,125.00 3%
52205 (Consultant)N/A
$0.00 0% $2,125.00
52300 (Buses)
Transportation for one field trip per grade level, for Pre-k through 5th grade and one field trip for our students taking part in the Magnolia Achievers, afterschool math and reading intervention. 10 fieldtrips x $380 per trip (est) = $3,800
Afford our students the opportunity to take educational field trips to expand their knowledge
$3,800.00 5%
Supplies 04-01 53170 (Other)
Purchase additional materials to support grade level curriculum and our thematic unit initiative. 6 grade levels x $600 = $3,600; Thematic Unit (all grades) = $2,128.89
Provide additional materials to increase student engagement in learning.
$5,728.89 7%
Other 05-01 54170 (Other)
Provide student incentives for our PBIS initiative and Ron Clark House initiative.
Recognizing studens for positive behaiors (responsibility, respect, perseverence, encouragement and cooperation) establishes pride in their school and reduces the distractions in learning resulting in increased academic achievement. $5,000.00 6%
54720 (Mileage)N/A
$0.00 0%
54735 (Refreshments -Parent Support ONLY)
N/A
$0.00 0% $5,000.00
Equipment 05-01 55170 (Other)N/A
$0.00 0% $61,662.35
FY '13 Regular Title 1 Allocation - School-based Budget Narrative
Additional Attachments Page 5
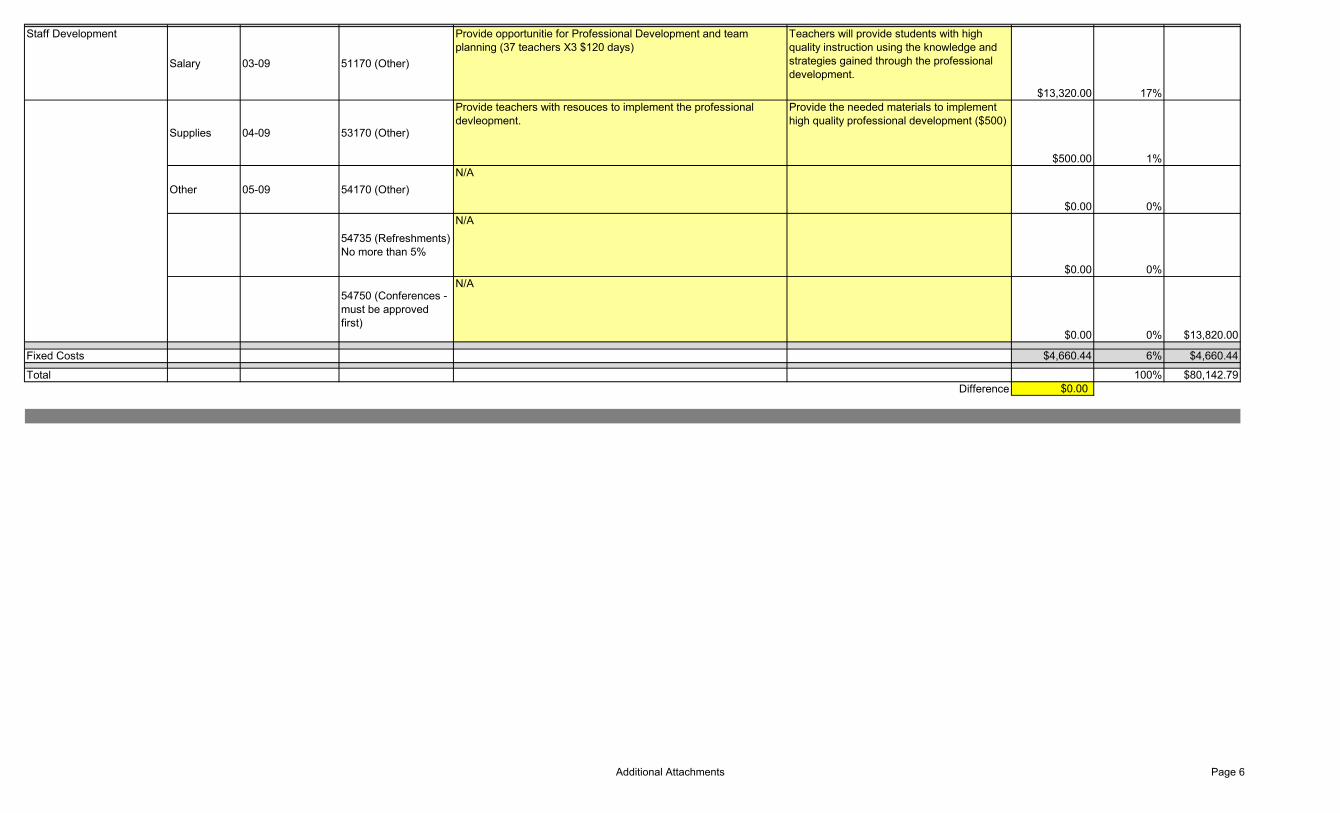
Staff Development
Salary 03-09 51170 (Other)
Provide opportunitie for Professional Development and team planning (37 teachers X3 $120 days)
Teachers will provide students with high quality instruction using the knowledge and strategies gained through the professional development.
$13,320.00 17%
Supplies 04-09 53170 (Other)
Provide teachers with resouces to implement the professional devleopment.
Provide the needed materials to implement high quality professional development ($500)
$500.00 1%
Other 05-09 54170 (Other)N/A
$0.00 0%
54735 (Refreshments) No more than 5%
N/A
$0.00 0%
54750 (Conferences - must be approved first)
N/A
$0.00 0% $13,820.00
Fixed Costs $4,660.44 6% $4,660.44
Total 100% $80,142.79Difference $0.00
Additional Attachments Page 6
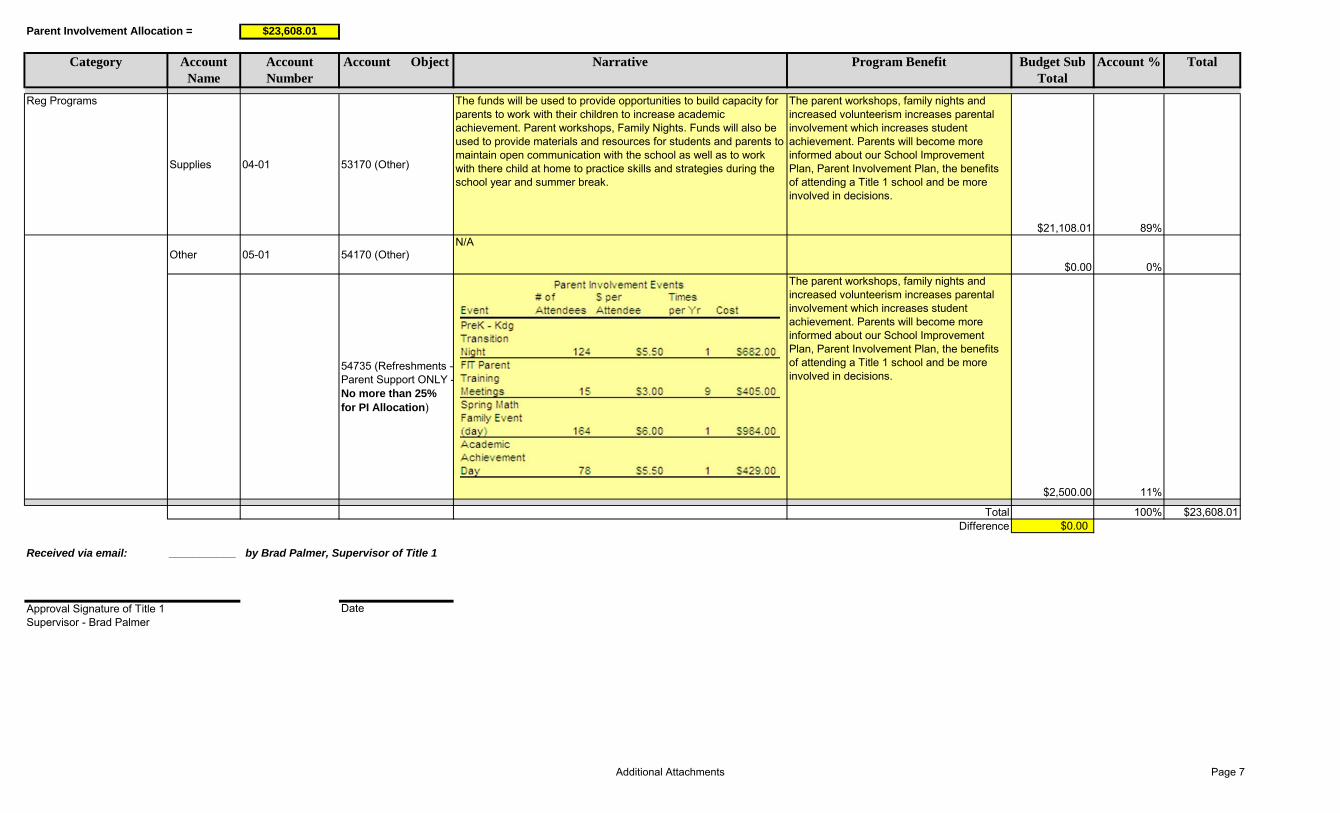
Parent Involvement Allocation = $23,608.01
Category Account Name
Account Number
Account Object Narrative Program Benefit Budget Sub Total
Account % Total
Reg Programs
Supplies 04-01 53170 (Other)
The funds will be used to provide opportunities to build capacity for parents to work with their children to increase academic achievement. Parent workshops, Family Nights. Funds will also be used to provide materials and resources for students and parents to maintain open communication with the school as well as to work with there child at home to practice skills and strategies during the school year and summer break.
The parent workshops, family nights and increased volunteerism increases parental involvement which increases student achievement. Parents will become more informed about our School Improvement Plan, Parent Involvement Plan, the benefits of attending a Title 1 school and be more involved in decisions.
$21,108.01 89%
Other 05-01 54170 (Other)N/A
$0.00 0%
54735 (Refreshments -Parent Support ONLY -No more than 25% for PI Allocation)
The parent workshops, family nights and increased volunteerism increases parental involvement which increases student achievement. Parents will become more informed about our School Improvement Plan, Parent Involvement Plan, the benefits of attending a Title 1 school and be more involved in decisions.
$2,500.00 11%
Total 100% $23,608.01Difference $0.00
Received via email: ___________ by Brad Palmer, Supervisor of Title 1
Approval Signature of Title 1 Supervisor - Brad Palmer
Date
Additional Attachments Page 7
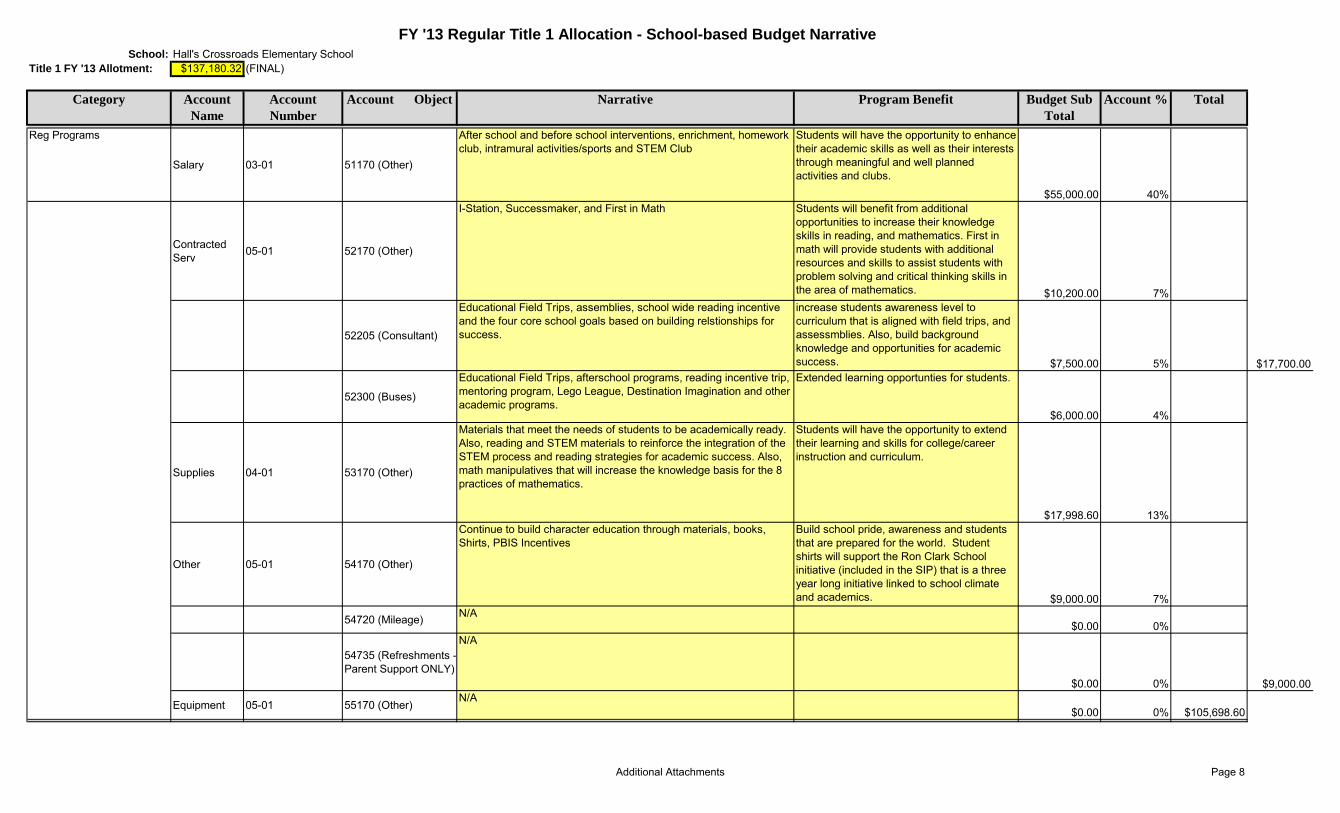
School: Hall's Crossroads Elementary SchoolTitle 1 FY '13 Allotment: $137,180.32 (FINAL)
Category Account Name
Account Number
Account Object Narrative Program Benefit Budget Sub Total
Account % Total
Reg Programs
Salary 03-01 51170 (Other)
After school and before school interventions, enrichment, homework club, intramural activities/sports and STEM Club
Students will have the opportunity to enhance their academic skills as well as their interests through meaningful and well planned activities and clubs.
$55,000.00 40%
Contracted Serv 05-01 52170 (Other)
I-Station, Successmaker, and First in Math Students will benefit from additional opportunities to increase their knowledge skills in reading, and mathematics. First in math will provide students with additional resources and skills to assist students with problem solving and critical thinking skills in the area of mathematics. $10,200.00 7%
52205 (Consultant)
Educational Field Trips, assemblies, school wide reading incentive and the four core school goals based on building relstionships for success.
increase students awareness level to curriculum that is aligned with field trips, and assessmblies. Also, build background knowledge and opportunities for academic success. $7,500.00 5% $17,700.00
52300 (Buses)
Educational Field Trips, afterschool programs, reading incentive trip, mentoring program, Lego League, Destination Imagination and other academic programs.
Extended learning opportunties for students.
$6,000.00 4%
Supplies 04-01 53170 (Other)
Materials that meet the needs of students to be academically ready. Also, reading and STEM materials to reinforce the integration of the STEM process and reading strategies for academic success. Also, math manipulatives that will increase the knowledge basis for the 8 practices of mathematics.
Students will have the opportunity to extend their learning and skills for college/career instruction and curriculum.
$17,998.60 13%
Other 05-01 54170 (Other)
Continue to build character education through materials, books, Shirts, PBIS Incentives
Build school pride, awareness and students that are prepared for the world. Student shirts will support the Ron Clark School initiative (included in the SIP) that is a three year long initiative linked to school climate and academics. $9,000.00 7%
54720 (Mileage) N/A$0.00 0%
54735 (Refreshments -Parent Support ONLY)
N/A
$0.00 0% $9,000.00
Equipment 05-01 55170 (Other)N/A
$0.00 0% $105,698.60
FY '13 Regular Title 1 Allocation - School-based Budget Narrative
Additional Attachments Page 8
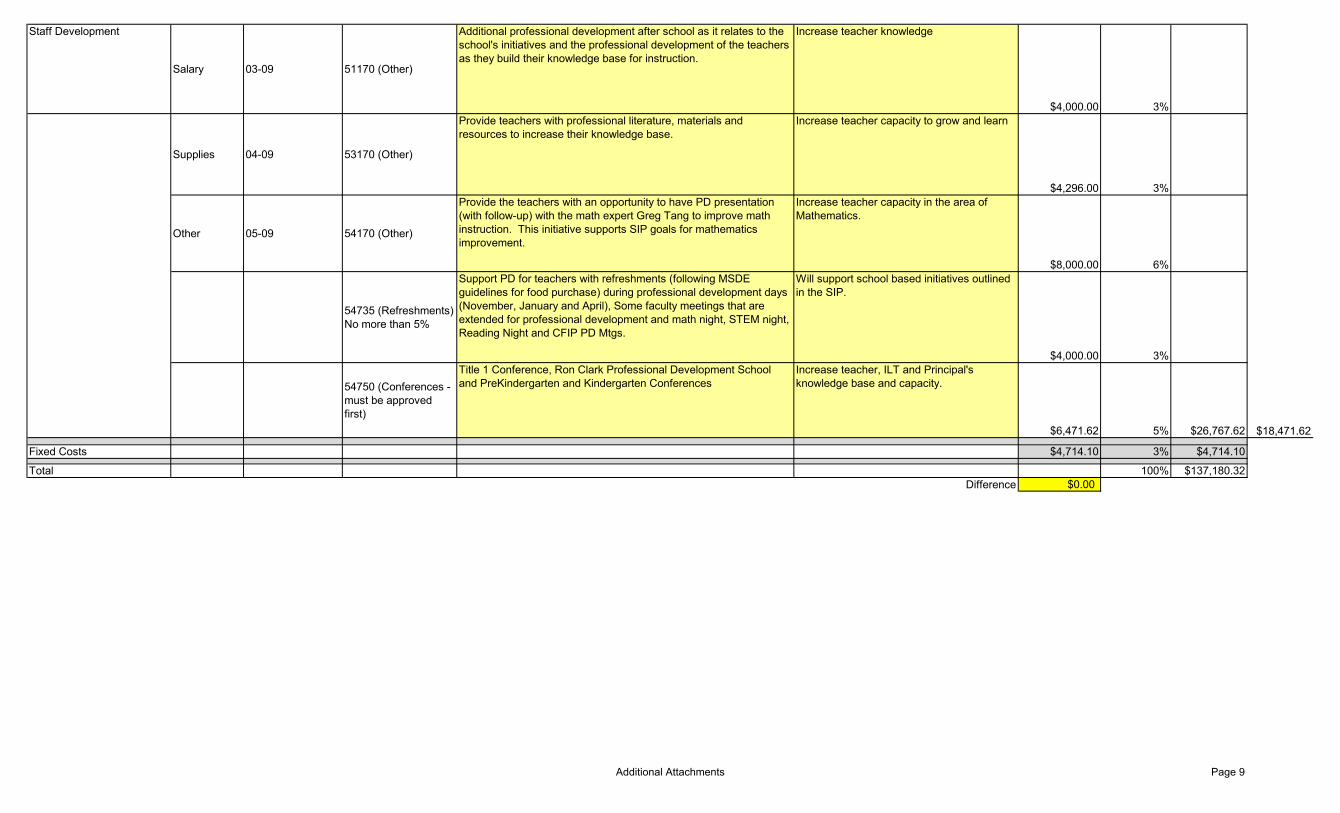
Staff Development
Salary 03-09 51170 (Other)
Additional professional development after school as it relates to the school's initiatives and the professional development of the teachers as they build their knowledge base for instruction.
Increase teacher knowledge
$4,000.00 3%
Supplies 04-09 53170 (Other)
Provide teachers with professional literature, materials and resources to increase their knowledge base.
Increase teacher capacity to grow and learn
$4,296.00 3%
Other 05-09 54170 (Other)
Provide the teachers with an opportunity to have PD presentation (with follow-up) with the math expert Greg Tang to improve math instruction. This initiative supports SIP goals for mathematics improvement.
Increase teacher capacity in the area of Mathematics.
$8,000.00 6%
54735 (Refreshments) No more than 5%
Support PD for teachers with refreshments (following MSDE guidelines for food purchase) during professional development days (November, January and April), Some faculty meetings that are extended for professional development and math night, STEM night, Reading Night and CFIP PD Mtgs.
Will support school based initiatives outlined in the SIP.
$4,000.00 3%
54750 (Conferences - must be approved first)
Title 1 Conference, Ron Clark Professional Development School and PreKindergarten and Kindergarten Conferences
Increase teacher, ILT and Principal's knowledge base and capacity.
$6,471.62 5% $26,767.62 $18,471.62
Fixed Costs $4,714.10 3% $4,714.10
Total 100% $137,180.32Difference $0.00
Additional Attachments Page 9
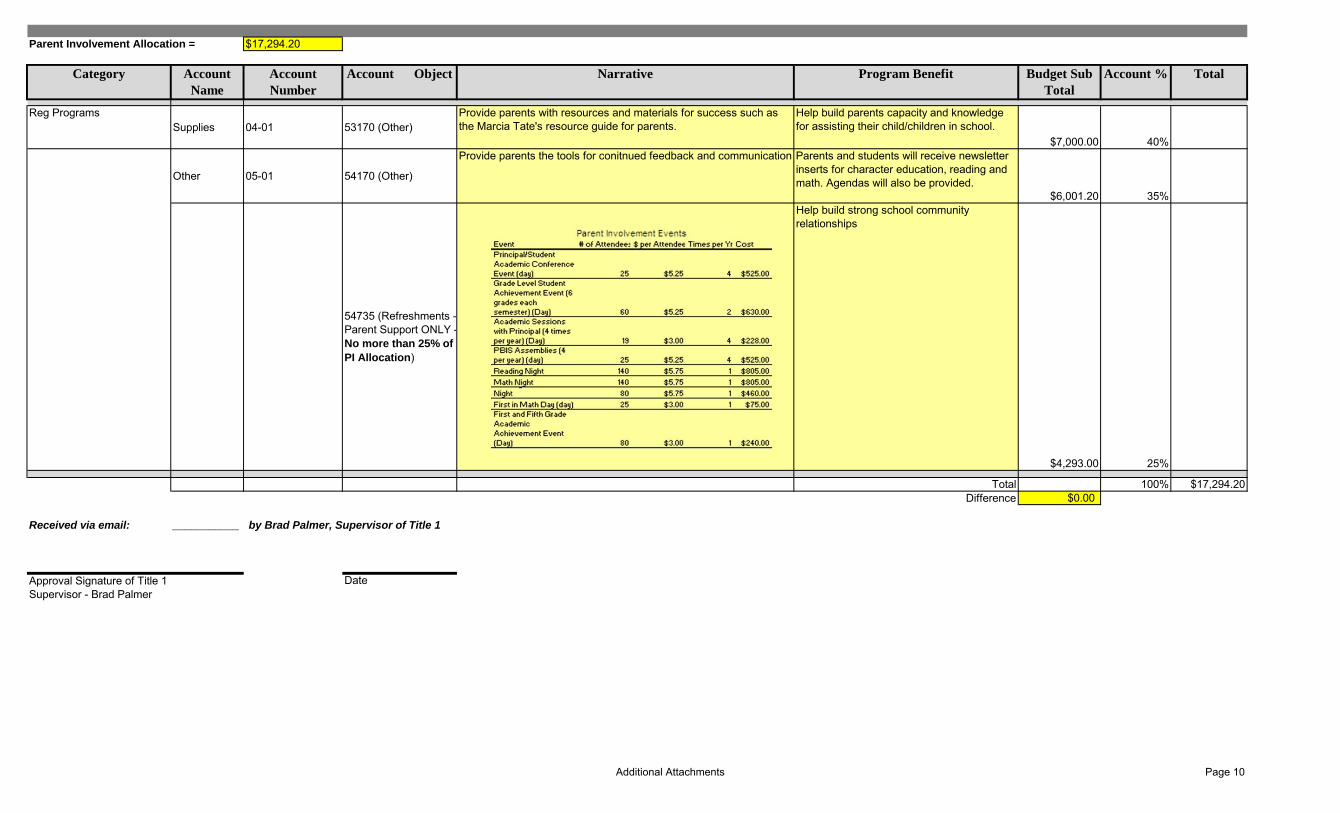
Parent Involvement Allocation = $17,294.20
Category Account Name
Account Number
Account Object Narrative Program Benefit Budget Sub Total
Account % Total
Reg ProgramsSupplies 04-01 53170 (Other)
Provide parents with resources and materials for success such as the Marcia Tate's resource guide for parents.
Help build parents capacity and knowledge for assisting their child/children in school.
$7,000.00 40%
Other 05-01 54170 (Other)
Provide parents the tools for conitnued feedback and communication Parents and students will receive newsletter inserts for character education, reading and math. Agendas will also be provided.
$6,001.20 35%
54735 (Refreshments -Parent Support ONLY -No more than 25% of PI Allocation)
Help build strong school community relationships
$4,293.00 25%
Total 100% $17,294.20Difference $0.00
Received via email: ___________ by Brad Palmer, Supervisor of Title 1
Approval Signature of Title 1 Supervisor - Brad Palmer
Date
Additional Attachments Page 10
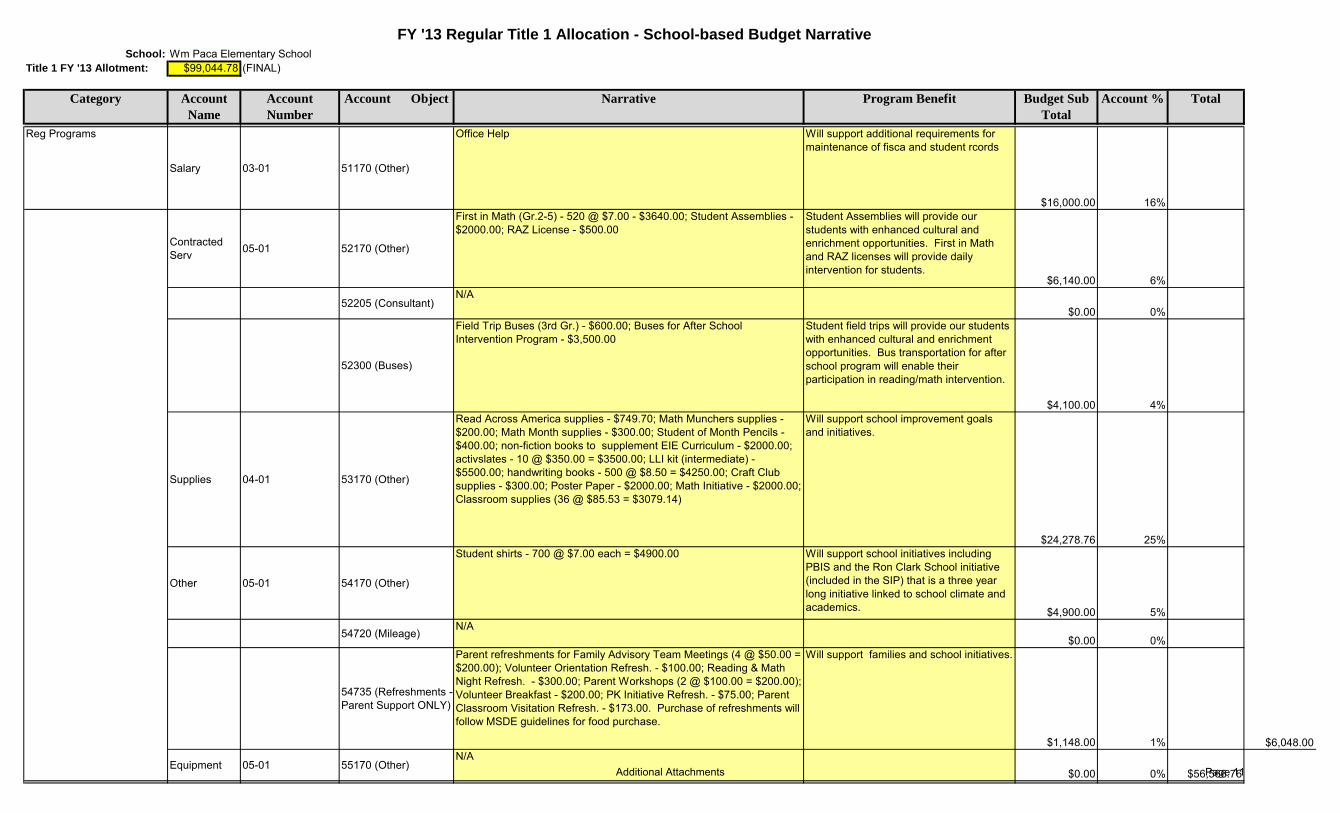
School: Wm Paca Elementary SchoolTitle 1 FY '13 Allotment: $99,044.78 (FINAL)
Category Account Name
Account Number
Account Object Narrative Program Benefit Budget Sub Total
Account % Total
Reg Programs
Salary 03-01 51170 (Other)
Office Help Will support additional requirements for maintenance of fisca and student rcords
$16,000.00 16%
Contracted Serv 05-01 52170 (Other)
First in Math (Gr.2-5) - 520 @ $7.00 - $3640.00; Student Assemblies - $2000.00; RAZ License - $500.00
Student Assemblies will provide our students with enhanced cultural and enrichment opportunities. First in Math and RAZ licenses will provide daily intervention for students.
$6,140.00 6%
52205 (Consultant)N/A
$0.00 0%
52300 (Buses)
Field Trip Buses (3rd Gr.) - $600.00; Buses for After School Intervention Program - $3,500.00
Student field trips will provide our students with enhanced cultural and enrichment opportunities. Bus transportation for after school program will enable their participation in reading/math intervention.
$4,100.00 4%
Supplies 04-01 53170 (Other)
Read Across America supplies - $749.70; Math Munchers supplies - $200.00; Math Month supplies - $300.00; Student of Month Pencils - $400.00; non-fiction books to supplement EIE Curriculum - $2000.00; activslates - 10 @ $350.00 = $3500.00; LLI kit (intermediate) - $5500.00; handwriting books - 500 @ $8.50 = $4250.00; Craft Club supplies - $300.00; Poster Paper - $2000.00; Math Initiative - $2000.00; Classroom supplies (36 @ $85.53 = $3079.14)
Will support school improvement goals and initiatives.
$24,278.76 25%
Other 05-01 54170 (Other)
Student shirts - 700 @ $7.00 each = $4900.00 Will support school initiatives including PBIS and the Ron Clark School initiative (included in the SIP) that is a three year long initiative linked to school climate and academics. $4,900.00 5%
54720 (Mileage)N/A
$0.00 0%
54735 (Refreshments -Parent Support ONLY)
Parent refreshments for Family Advisory Team Meetings (4 @ $50.00 = $200.00); Volunteer Orientation Refresh. - $100.00; Reading & Math Night Refresh. - $300.00; Parent Workshops (2 @ $100.00 = $200.00); Volunteer Breakfast - $200.00; PK Initiative Refresh. - $75.00; Parent Classroom Visitation Refresh. - $173.00. Purchase of refreshments will follow MSDE guidelines for food purchase.
Will support families and school initiatives.
$1,148.00 1% $6,048.00
Equipment 05-01 55170 (Other)N/A
$0.00 0% $56,566.76
FY '13 Regular Title 1 Allocation - School-based Budget Narrative
Additional Attachments Page 11
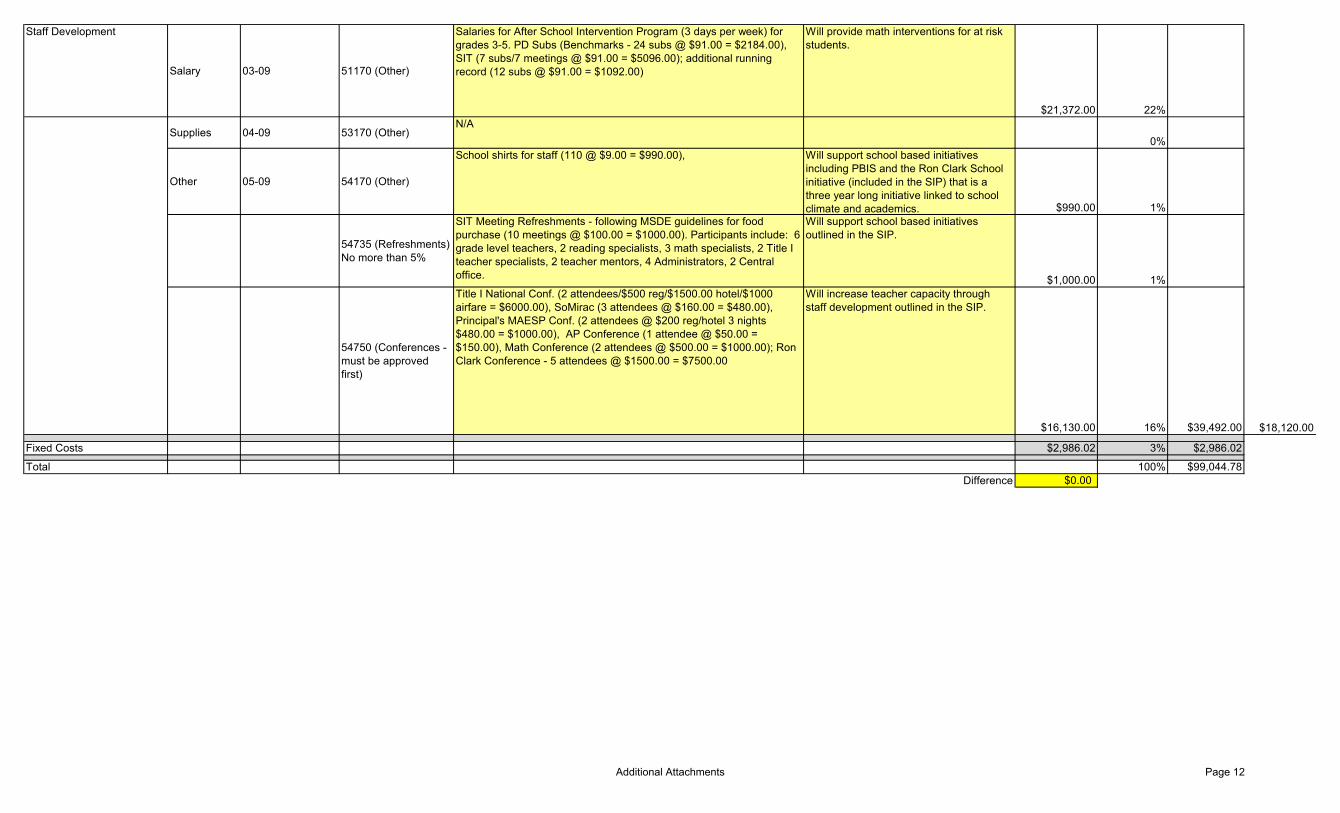
Staff Development
Salary 03-09 51170 (Other)
Salaries for After School Intervention Program (3 days per week) for grades 3-5. PD Subs (Benchmarks - 24 subs @ $91.00 = $2184.00), SIT (7 subs/7 meetings @ $91.00 = $5096.00); additional running record (12 subs @ $91.00 = $1092.00)
Will provide math interventions for at risk students.
$21,372.00 22%
Supplies 04-09 53170 (Other)N/A
0%
Other 05-09 54170 (Other)
School shirts for staff (110 @ $9.00 = $990.00), Will support school based initiatives including PBIS and the Ron Clark School initiative (included in the SIP) that is a three year long initiative linked to school climate and academics. $990.00 1%
54735 (Refreshments) No more than 5%
SIT Meeting Refreshments - following MSDE guidelines for food purchase (10 meetings @ $100.00 = $1000.00). Participants include: 6 grade level teachers, 2 reading specialists, 3 math specialists, 2 Title I teacher specialists, 2 teacher mentors, 4 Administrators, 2 Central office.
Will support school based initiatives outlined in the SIP.
$1,000.00 1%
54750 (Conferences - must be approved first)
Title I National Conf. (2 attendees/$500 reg/$1500.00 hotel/$1000 airfare = $6000.00), SoMirac (3 attendees @ $160.00 = $480.00), Principal's MAESP Conf. (2 attendees @ $200 reg/hotel 3 nights $480.00 = $1000.00), AP Conference (1 attendee @ $50.00 = $150.00), Math Conference (2 attendees @ $500.00 = $1000.00); Ron Clark Conference - 5 attendees @ $1500.00 = $7500.00
Will increase teacher capacity through staff development outlined in the SIP.
$16,130.00 16% $39,492.00 $18,120.00
Fixed Costs $2,986.02 3% $2,986.02
Total 100% $99,044.78Difference $0.00
Additional Attachments Page 12
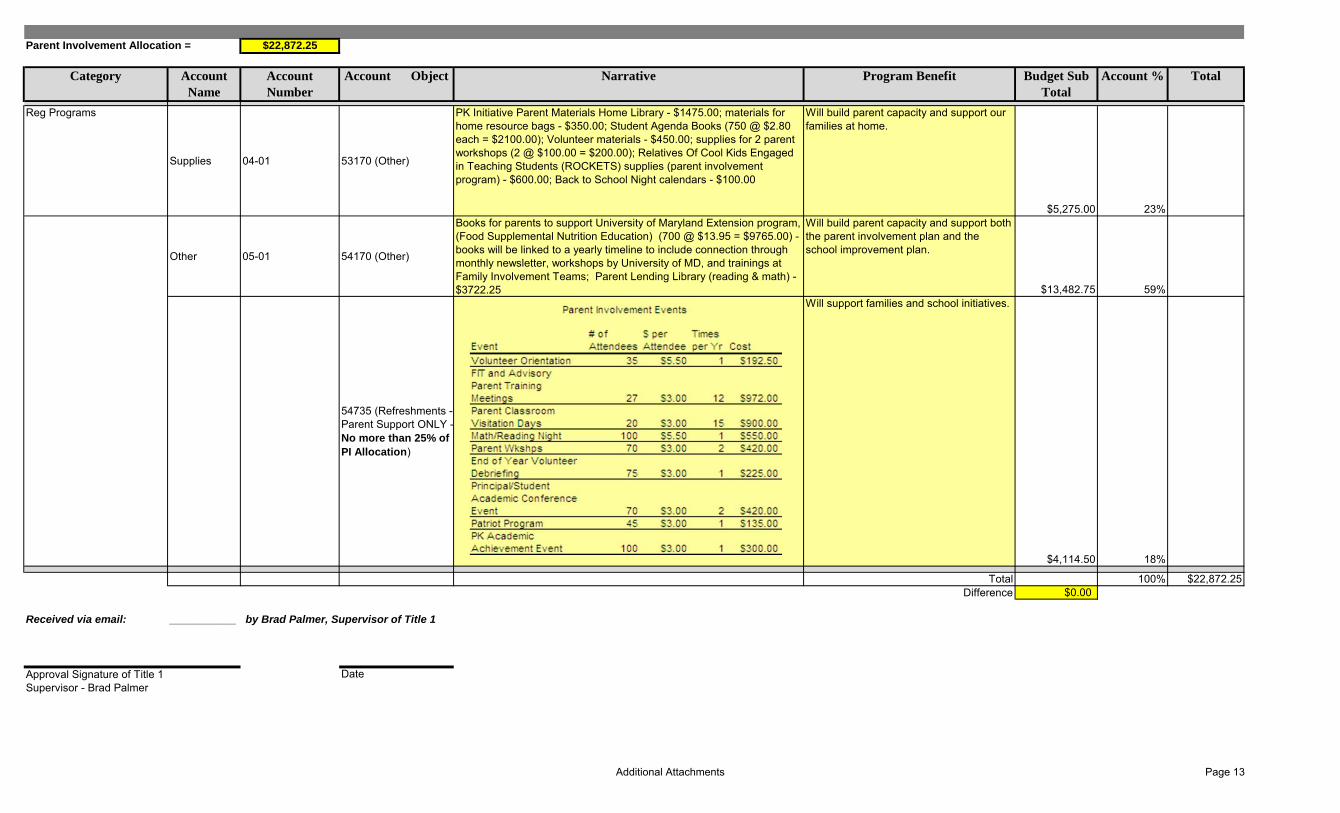
Parent Involvement Allocation = $22,872.25
Category Account Name
Account Number
Account Object Narrative Program Benefit Budget Sub Total
Account % Total
Reg Programs
Supplies 04-01 53170 (Other)
PK Initiative Parent Materials Home Library - $1475.00; materials for home resource bags - $350.00; Student Agenda Books (750 @ $2.80 each = $2100.00); Volunteer materials - $450.00; supplies for 2 parent workshops (2 @ $100.00 = $200.00); Relatives Of Cool Kids Engaged in Teaching Students (ROCKETS) supplies (parent involvement program) - $600.00; Back to School Night calendars - $100.00
Will build parent capacity and support our families at home.
$5,275.00 23%
Other 05-01 54170 (Other)
Books for parents to support University of Maryland Extension program, (Food Supplemental Nutrition Education) (700 @ $13.95 = $9765.00) - books will be linked to a yearly timeline to include connection through monthly newsletter, workshops by University of MD, and trainings at Family Involvement Teams; Parent Lending Library (reading & math) - $3722.25
Will build parent capacity and support both the parent involvement plan and the school improvement plan.
$13,482.75 59%
54735 (Refreshments -Parent Support ONLY -No more than 25% of PI Allocation)
Will support families and school initiatives.
$4,114.50 18%
Total 100% $22,872.25Difference $0.00
Received via email: ___________ by Brad Palmer, Supervisor of Title 1
Approval Signature of Title 1 Supervisor - Brad Palmer
Date
Additional Attachments Page 13
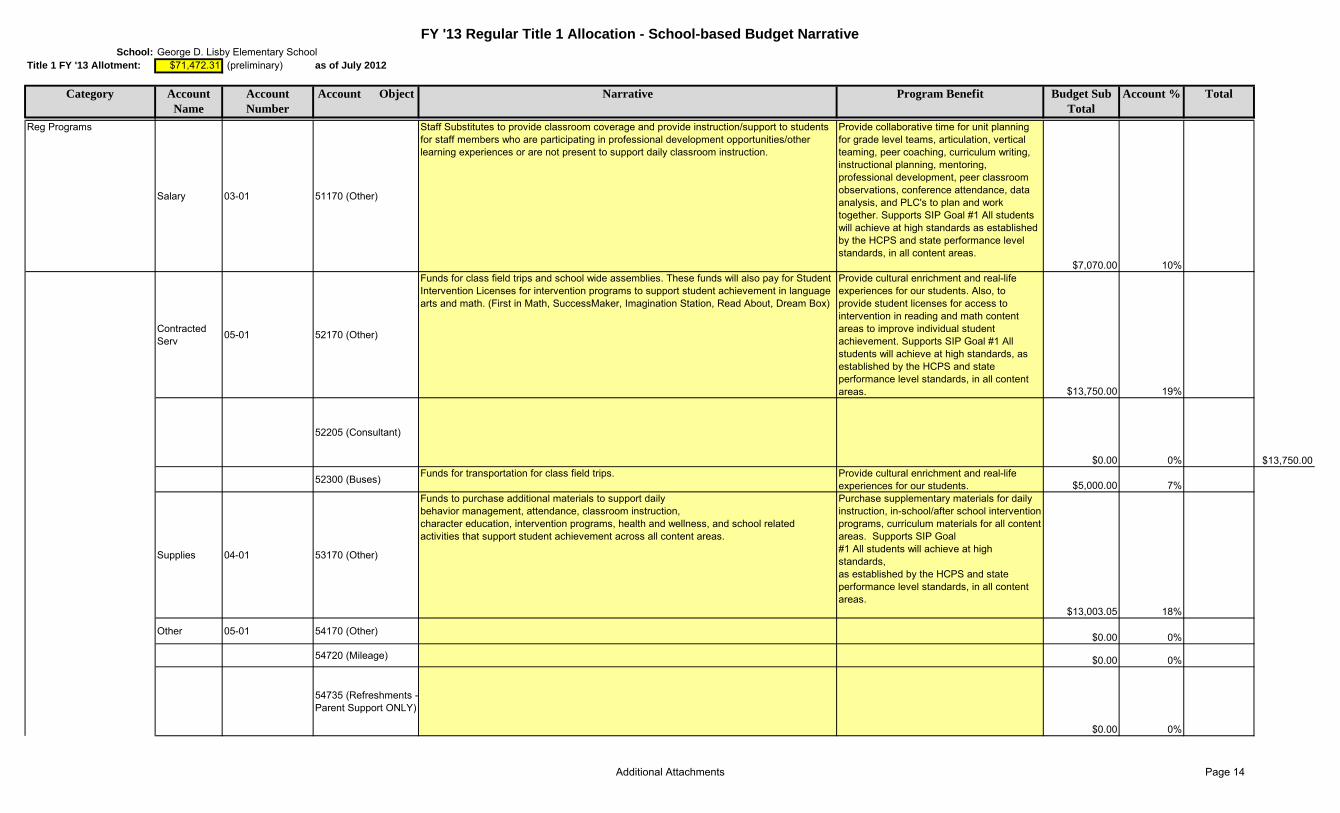
School: George D. Lisby Elementary SchoolTitle 1 FY '13 Allotment: $71,472.31 (preliminary) as of July 2012
Category Account Name
Account Number
Account Object Narrative Program Benefit Budget Sub Total
Account % Total
Reg Programs
Salary 03-01 51170 (Other)
Staff Substitutes to provide classroom coverage and provide instruction/support to students for staff members who are participating in professional development opportunities/other learning experiences or are not present to support daily classroom instruction.
Provide collaborative time for unit planning for grade level teams, articulation, vertical teaming, peer coaching, curriculum writing, instructional planning, mentoring, professional development, peer classroom observations, conference attendance, data analysis, and PLC's to plan and work together. Supports SIP Goal #1 All students will achieve at high standards as established by the HCPS and state performance level standards, in all content areas.
$7,070.00 10%
Contracted Serv 05-01 52170 (Other)
Funds for class field trips and school wide assemblies. These funds will also pay for Student Intervention Licenses for intervention programs to support student achievement in language arts and math. (First in Math, SuccessMaker, Imagination Station, Read About, Dream Box)
Provide cultural enrichment and real-life experiences for our students. Also, to provide student licenses for access to intervention in reading and math content areas to improve individual student achievement. Supports SIP Goal #1 All students will achieve at high standards, as established by the HCPS and state performance level standards, in all content areas. $13,750.00 19%
52205 (Consultant)
$0.00 0% $13,750.00
52300 (Buses) Funds for transportation for class field trips. Provide cultural enrichment and real-life experiences for our students. $5,000.00 7%
Supplies 04-01 53170 (Other)
Funds to purchase additional materials to support dailybehavior management, attendance, classroom instruction,character education, intervention programs, health and wellness, and school related activities that support student achievement across all content areas.
Purchase supplementary materials for daily instruction, in-school/after school intervention programs, curriculum materials for all content areas. Supports SIP Goal#1 All students will achieve at high standards,as established by the HCPS and stateperformance level standards, in all contentareas.
$13,003.05 18%
Other 05-01 54170 (Other) $0.00 0%
54720 (Mileage) $0.00 0%
54735 (Refreshments -Parent Support ONLY)
$0.00 0%
FY '13 Regular Title 1 Allocation - School-based Budget Narrative
Additional Attachments Page 14
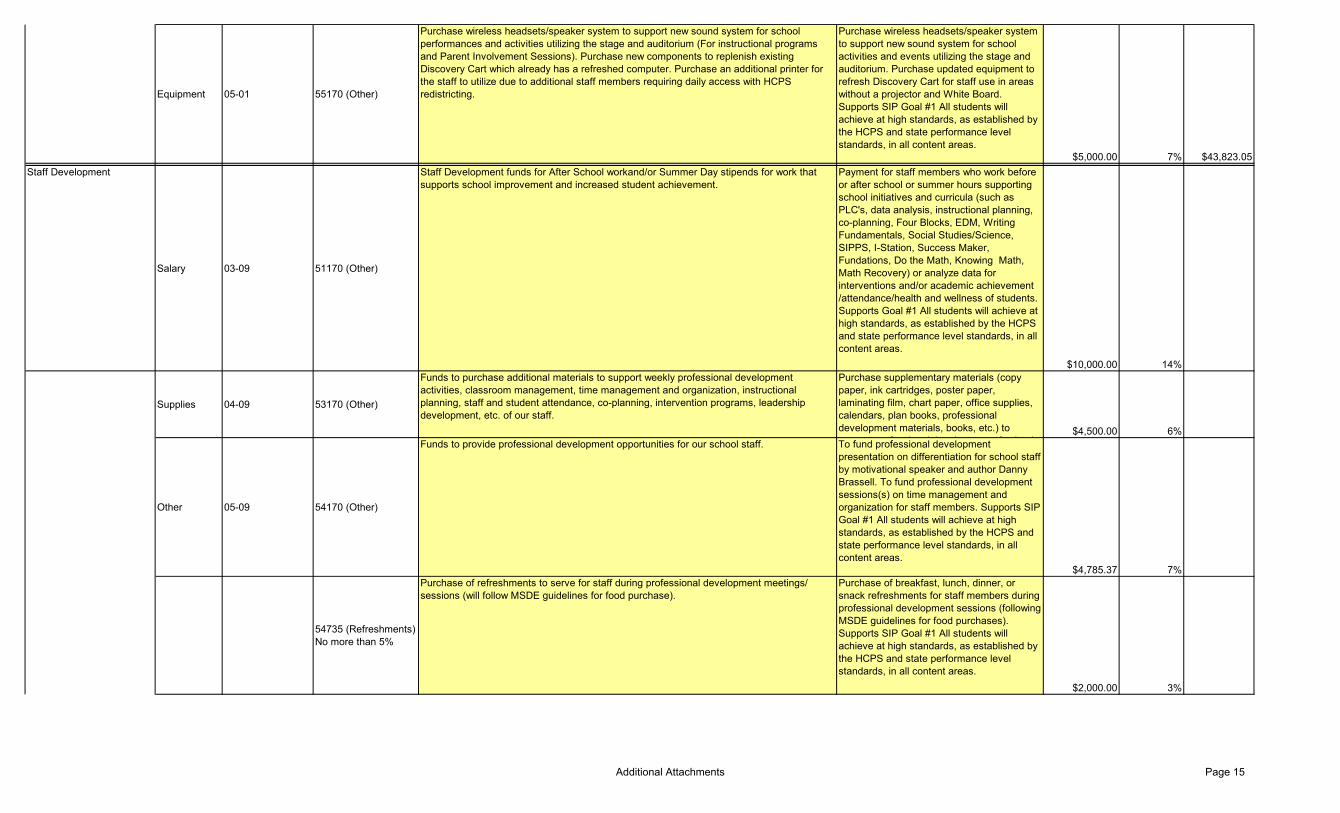
Equipment 05-01 55170 (Other)
Purchase wireless headsets/speaker system to support new sound system for school performances and activities utilizing the stage and auditorium (For instructional programs and Parent Involvement Sessions). Purchase new components to replenish existing Discovery Cart which already has a refreshed computer. Purchase an additional printer for the staff to utilize due to additional staff members requiring daily access with HCPS redistricting.
Purchase wireless headsets/speaker system to support new sound system for school activities and events utilizing the stage and auditorium. Purchase updated equipment to refresh Discovery Cart for staff use in areas without a projector and White Board. Supports SIP Goal #1 All students will achieve at high standards, as established by the HCPS and state performance level standards, in all content areas.
$5,000.00 7% $43,823.05Staff Development
Salary 03-09 51170 (Other)
Staff Development funds for After School workand/or Summer Day stipends for work that supports school improvement and increased student achievement.
Payment for staff members who work before or after school or summer hours supporting school initiatives and curricula (such as PLC's, data analysis, instructional planning, co-planning, Four Blocks, EDM, Writing Fundamentals, Social Studies/Science, SIPPS, I-Station, Success Maker, Fundations, Do the Math, Knowing Math, Math Recovery) or analyze data for interventions and/or academic achievement /attendance/health and wellness of students. Supports Goal #1 All students will achieve at high standards, as established by the HCPS and state performance level standards, in all content areas.
$10,000.00 14%
Supplies 04-09 53170 (Other)
Funds to purchase additional materials to support weekly professional development activities, classroom management, time management and organization, instructional planning, staff and student attendance, co-planning, intervention programs, leadership development, etc. of our staff.
Purchase supplementary materials (copy paper, ink cartridges, poster paper, laminating film, chart paper, office supplies, calendars, plan books, professional development materials, books, etc.) to
t f i l d l t f h l$4,500.00 6%
Other 05-09 54170 (Other)
Funds to provide professional development opportunities for our school staff. To fund professional development presentation on differentiation for school staff by motivational speaker and author Danny Brassell. To fund professional development sessions(s) on time management and organization for staff members. Supports SIP Goal #1 All students will achieve at high standards, as established by the HCPS and state performance level standards, in all content areas.
$4,785.37 7%
54735 (Refreshments) No more than 5%
Purchase of refreshments to serve for staff during professional development meetings/ sessions (will follow MSDE guidelines for food purchase).
Purchase of breakfast, lunch, dinner, or snack refreshments for staff members during professional development sessions (following MSDE guidelines for food purchases). Supports SIP Goal #1 All students will achieve at high standards, as established by the HCPS and state performance level standards, in all content areas.
$2,000.00 3%
Additional Attachments Page 15

54750 (Conferences - must be approved first)
Payment for registration fees, airfare, and other appropriate expenses for staff members to attend approved professional development conferences.
Payment for registration fees, airfare, and other appropriate expenses for staff members to attend approved professional development conferences to improve classroom management, curriculum instruction, organization, instruction, leadership, etc. Participants may attend as individuals or grade level teams upon approval from the Executive Director of Elementary School Performance. (National Title I Conference, NAESP/MAESP Conference, Assistant Principals Conference, SoMIRAC, Ron Clark Conference, etc.) Supports SIP Goal #1 All students will achieve at high standards, as established by the HCPS and state performance level standards, in all content areas. $5,000.00 7% $26,285.37 $11,785.37
Fixed Costs $1,363.89 2% $1,363.89
Total 100% $71,472.31Difference $0.00
Additional Attachments Page 16

Parent Involvement Allocation = $13,725.29
Category Account Name
Account Number
Account Object Narrative Program Benefit Budget Sub Total
Account % Total
Reg Programs
Supplies 04-01 53170 (Other)
Funds to provide support materials for parents to increase strategies for supporting children socially, academically, and emotionally during the school year.
Provide support materials for parents and family members supporting students in our building to improve their academic achievement while meeting the needs of the whole child. (books, brochures, support materials, summer counts workbooks, family reading books, flash cards, behavior information, school readiness materials, health and wellness, etc.) Purchase student planners for every child to increase daily home/school communication. Goal #1 All students will achieve at high standards, as established by the HCPS and state performance level standards, in all content areas.
$6,925.29 50%
Other 05-01 54170 (Other)
Funds, as needed, for families to participate in family involvement events. Will build parent capacity and support both the parent involvement plan and the school improvement plan. Goal #1 All students will achieve at high standards, as established by the HCPS and state performance level standards, in all content areas.
$3,452.50 25%
54735 (Refreshments -Parent Support ONLY- No more than 25% for PI Allocation)
Will support families and school initiatives. Supports SIP Goal #1 All students will achieve at high standards, as established by the HCPS and state performance level standards, in all content areas. ** Parent Conference Day includes distribution of PI Compact, PI Parent Friendly Plan, and SIP At-A-Glance.
$3,347.50 24%
Total 100% $13,725.29Difference $0.00
Received via email: ___________ by Brad Palmer, Supervisor of Title 1
DateApproval Signature of Title 1 Supervisor - Brad Palmer
Additional Attachments Page 17
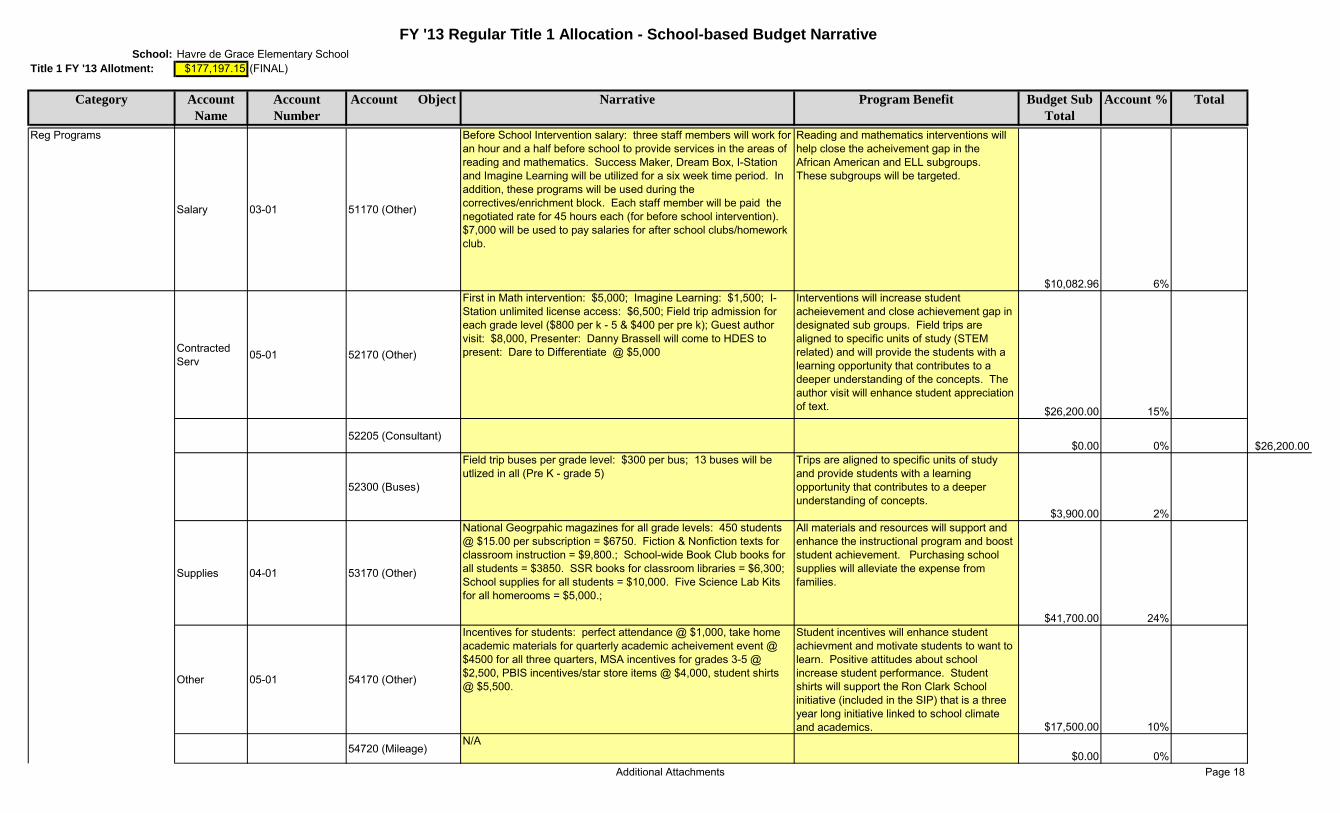
School: Havre de Grace Elementary SchoolTitle 1 FY '13 Allotment: $177,197.15 (FINAL)
Category Account Name
Account Number
Account Object Narrative Program Benefit Budget Sub Total
Account % Total
Reg Programs
Salary 03-01 51170 (Other)
Before School Intervention salary: three staff members will work for an hour and a half before school to provide services in the areas of reading and mathematics. Success Maker, Dream Box, I-Station and Imagine Learning will be utilized for a six week time period. In addition, these programs will be used during the correctives/enrichment block. Each staff member will be paid the negotiated rate for 45 hours each (for before school intervention). $7,000 will be used to pay salaries for after school clubs/homework club.
Reading and mathematics interventions will help close the acheivement gap in the African American and ELL subgroups. These subgroups will be targeted.
$10,082.96 6%
Contracted Serv 05-01 52170 (Other)
First in Math intervention: $5,000; Imagine Learning: $1,500; I-Station unlimited license access: $6,500; Field trip admission for each grade level ($800 per k - 5 & $400 per pre k); Guest author visit: $8,000, Presenter: Danny Brassell will come to HDES to present: Dare to Differentiate @ $5,000
Interventions will increase student acheievement and close achievement gap in designated sub groups. Field trips are aligned to specific units of study (STEM related) and will provide the students with a learning opportunity that contributes to a deeper understanding of the concepts. The author visit will enhance student appreciation of text. $26,200.00 15%
52205 (Consultant)$0.00 0% $26,200.00
52300 (Buses)
Field trip buses per grade level: $300 per bus; 13 buses will be utlized in all (Pre K - grade 5)
Trips are aligned to specific units of study and provide students with a learning opportunity that contributes to a deeper understanding of concepts.
$3,900.00 2%
Supplies 04-01 53170 (Other)
National Geogrpahic magazines for all grade levels: 450 students @ $15.00 per subscription = $6750. Fiction & Nonfiction texts for classroom instruction = $9,800.; School-wide Book Club books for all students = $3850. SSR books for classroom libraries = $6,300; School supplies for all students = $10,000. Five Science Lab Kits for all homerooms = $5,000.;
All materials and resources will support and enhance the instructional program and boost student achievement. Purchasing school supplies will alleviate the expense from families.
$41,700.00 24%
Other 05-01 54170 (Other)
Incentives for students: perfect attendance @ $1,000, take home academic materials for quarterly academic acheivement event @ $4500 for all three quarters, MSA incentives for grades 3-5 @ $2,500, PBIS incentives/star store items @ $4,000, student shirts @ $5,500.
Student incentives will enhance student achievment and motivate students to want to learn. Positive attitudes about school increase student performance. Student shirts will support the Ron Clark School initiative (included in the SIP) that is a three year long initiative linked to school climate and academics. $17,500.00 10%
54720 (Mileage)N/A
$0.00 0%
FY '13 Regular Title 1 Allocation - School-based Budget Narrative
Additional Attachments Page 18
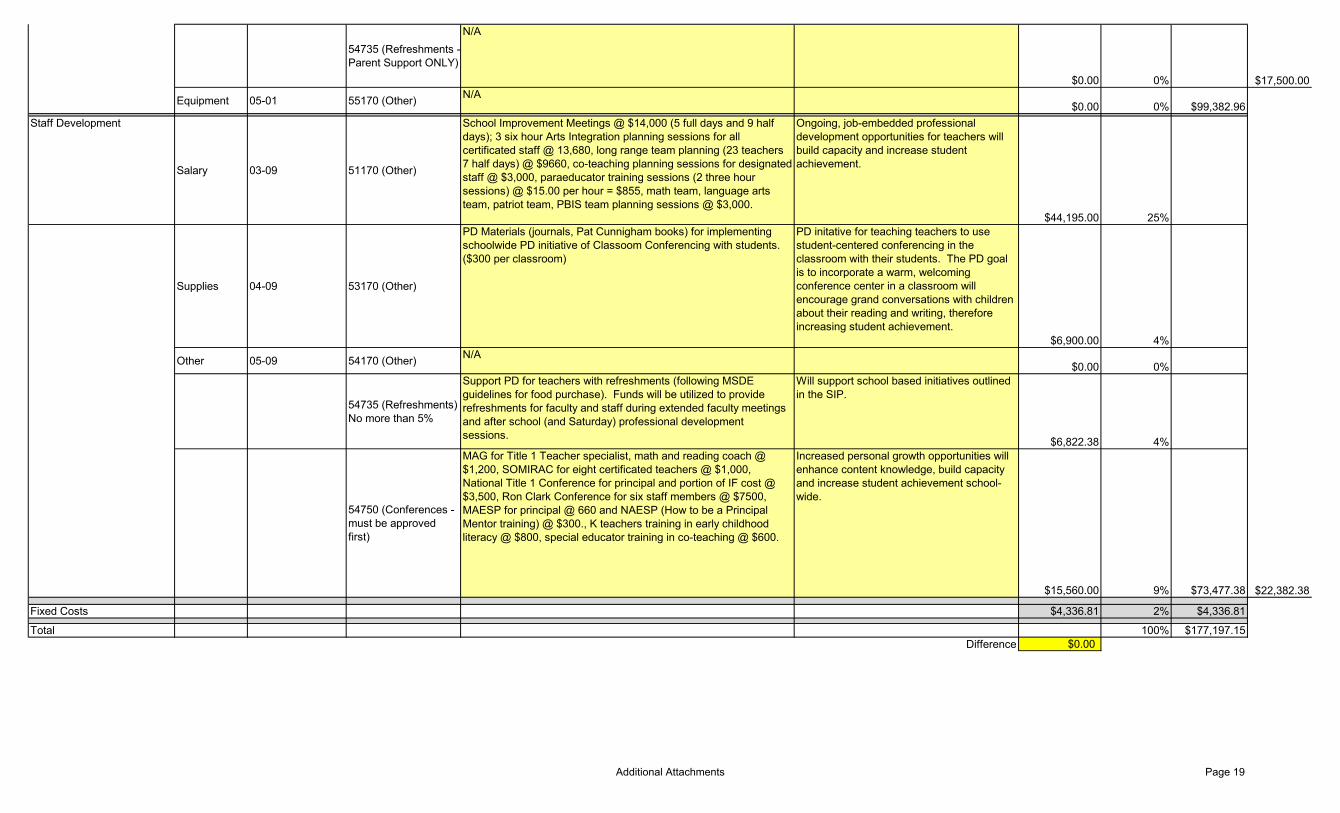
54735 (Refreshments -Parent Support ONLY)
N/A
$0.00 0% $17,500.00
Equipment 05-01 55170 (Other) N/A$0.00 0% $99,382.96
Staff Development
Salary 03-09 51170 (Other)
School Improvement Meetings @ $14,000 (5 full days and 9 half days); 3 six hour Arts Integration planning sessions for all certificated staff @ 13,680, long range team planning (23 teachers 7 half days) @ $9660, co-teaching planning sessions for designated staff @ $3,000, paraeducator training sessions (2 three hour sessions) @ $15.00 per hour = $855, math team, language arts team, patriot team, PBIS team planning sessions @ $3,000.
Ongoing, job-embedded professional development opportunities for teachers will build capacity and increase student achievement.
$44,195.00 25%
Supplies 04-09 53170 (Other)
PD Materials (journals, Pat Cunnigham books) for implementing schoolwide PD initiative of Classoom Conferencing with students. ($300 per classroom)
PD initative for teaching teachers to use student-centered conferencing in the classroom with their students. The PD goal is to incorporate a warm, welcoming conference center in a classroom will encourage grand conversations with children about their reading and writing, therefore increasing student achievement.
$6,900.00 4%
Other 05-09 54170 (Other) N/A$0.00 0%
54735 (Refreshments) No more than 5%
Support PD for teachers with refreshments (following MSDE guidelines for food purchase). Funds will be utilized to provide refreshments for faculty and staff during extended faculty meetings and after school (and Saturday) professional development sessions.
Will support school based initiatives outlined in the SIP.
$6,822.38 4%
54750 (Conferences - must be approved first)
MAG for Title 1 Teacher specialist, math and reading coach @ $1,200, SOMIRAC for eight certificated teachers @ $1,000, National Title 1 Conference for principal and portion of IF cost @ $3,500, Ron Clark Conference for six staff members @ $7500, MAESP for principal @ 660 and NAESP (How to be a Principal Mentor training) @ $300., K teachers training in early childhood literacy @ $800, special educator training in co-teaching @ $600.
Increased personal growth opportunities will enhance content knowledge, build capacity and increase student achievement school-wide.
$15,560.00 9% $73,477.38 $22,382.38
Fixed Costs $4,336.81 2% $4,336.81
Total 100% $177,197.15Difference $0.00
Additional Attachments Page 19

Parent Involvement Allocation = $12,895.75
Category Account Name
Account Number
Account Object Narrative Program Benefit Budget Sub Total
Account % Total
Reg Programs
Supplies 04-01 53170 (Other)
Instructional materials for family events (quarterly grade level events @ $1,000, math carnival, & book club night @ $3,000 , family wellness night @ $1000 and parent financial planning workshop @ $500)
We will build capacity in our school community so that families can better support their children's academic achievement.
$5,500.00 43%
Other 05-01 54170 (Other)
Academic focused incentives for families attending extended hour Parent Involvement events will be purchased.
Building positive relationships with families contributes to higher attendance levels and increased student achievement.
$4,175.75 32%
54735 (Refreshments -Parent Support ONLY -No more than 25% of PI Allocation)
Help build strong school community relationships ** Parent Conference Day includes distribution of PI Compact, PI Parent Friendly Plan, and SIP At-A-Glance.
$3,220.00 25%
Total 100% $12,895.75Difference $0.00
Received via email: ___________ by Brad Palmer, Supervisor of Title 1
Approval Signature of Title 1 Supervisor - Brad Palmer
Date
Additional Attachments Page 20
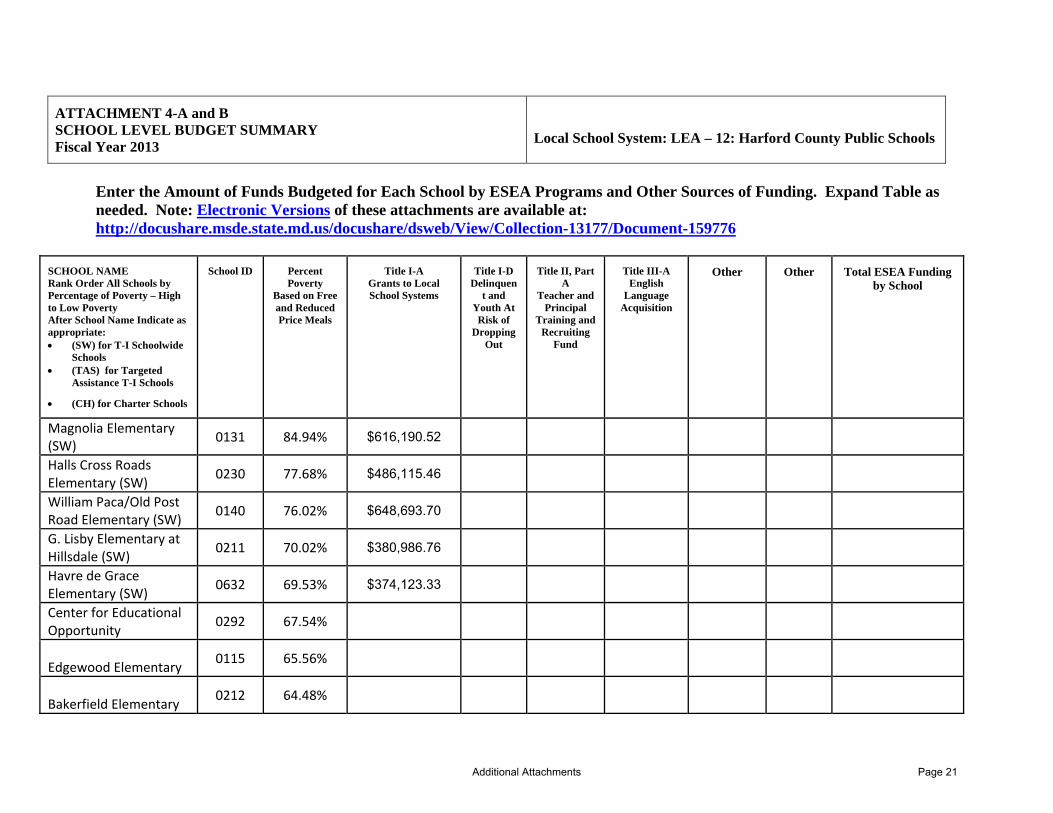
ATTACHMENT 4-A and B SCHOOL LEVEL BUDGET SUMMARY Fiscal Year 2013
Local School System: LEA – 12: Harford County Public Schools
Enter the Amount of Funds Budgeted for Each School by ESEA Programs and Other Sources of Funding. Expand Table as needed. Note: Electronic Versions of these attachments are available at: http://docushare.msde.state.md.us/docushare/dsweb/View/Collection-13177/Document-159776
SCHOOL NAME Rank Order All Schools by Percentage of Poverty – High to Low Poverty After School Name Indicate as appropriate: (SW) for T-I Schoolwide
Schools (TAS) for Targeted
Assistance T-I Schools
(CH) for Charter Schools
School ID Percent Poverty
Based on Free and Reduced Price Meals
Title I-A Grants to Local School Systems
Title I-D Delinquen
t and Youth At Risk of
Dropping Out
Title II, Part A
Teacher and Principal
Training and Recruiting
Fund
Title III-A English
Language Acquisition
Other Other Total ESEA Funding by School
Magnolia Elementary (SW) 0131 84.94% $616,190.52
Halls Cross Roads Elementary (SW) 0230 77.68% $486,115.46
William Paca/Old Post Road Elementary (SW) 0140 76.02% $648,693.70
G. Lisby Elementary at Hillsdale (SW) 0211 70.02% $380,986.76
Havre de Grace Elementary (SW) 0632 69.53% $374,123.33
Center for Educational Opportunity 0292 67.54%
Edgewood Elementary 0115 65.56%
Bakerfield Elementary 0212 64.48%
Additional Attachments Page 21
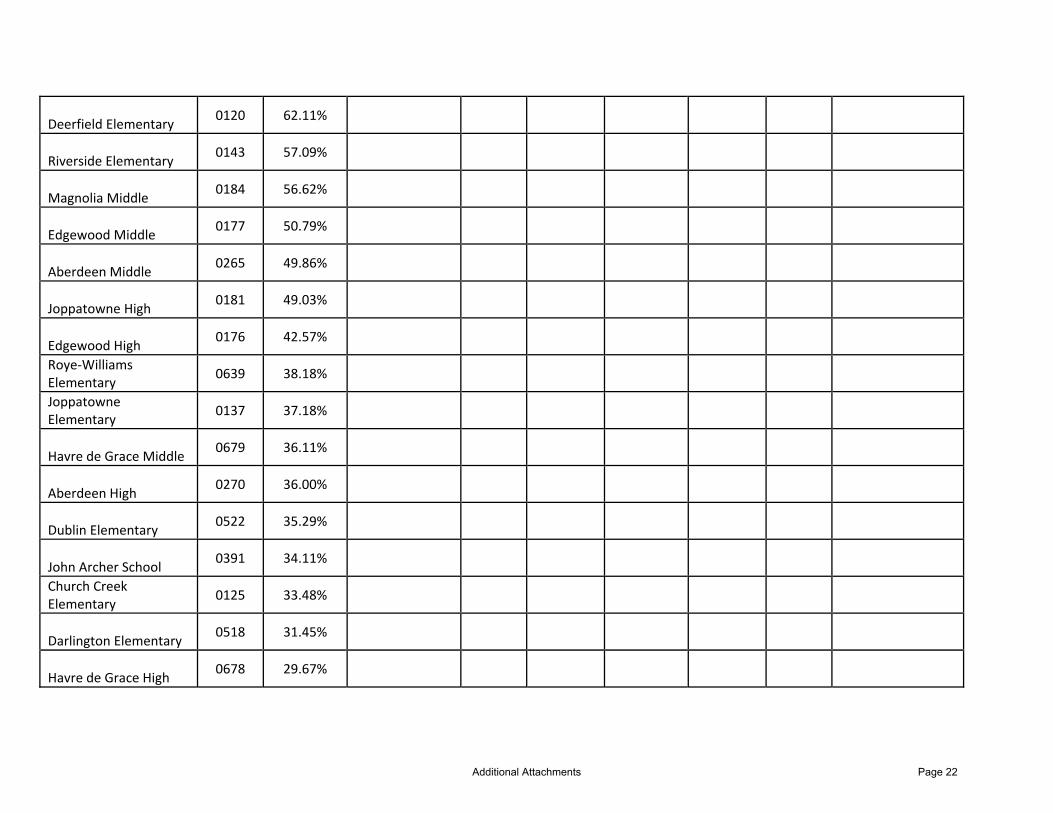
Deerfield Elementary 0120 62.11%
Riverside Elementary 0143 57.09%
Magnolia Middle 0184 56.62%
Edgewood Middle 0177 50.79%
Aberdeen Middle 0265 49.86%
Joppatowne High 0181 49.03%
Edgewood High 0176 42.57%
Roye‐Williams Elementary 0639 38.18%
Joppatowne Elementary 0137 37.18%
Havre de Grace Middle 0679 36.11%
Aberdeen High 0270 36.00%
Dublin Elementary 0522 35.29%
John Archer School 0391 34.11%
Church Creek Elementary 0125 33.48%
Darlington Elementary 0518 31.45%
Havre de Grace High 0678 29.67%
Additional Attachments Page 22

Meadowvale Elementary 0638 25.75%
Patterson Mill Middle School 0188 25.55%
Bel Air Elementary 0314 25.41%
Abingdon Elementary 0123 24.30%
North Harford Elementary 0544 23.08%
William S. James Elementary 0113 22.96%
Prospect Mill Elementary 0329 20.28%
Norrisville Elementary 0441 17.59%
Harford Technical High 0304 17.08%
Churchville Elementary 0316 16.27%
North Harford Middle 0583 15.60%
North Bend Elementary 0447 15.38%
Bel Air Middle 0372 15.28%
Ring Factory Elementary 0345 14.21%
North Harford High 0580 13.67%
Hickory Elementary 0333 13.32%
Additional Attachments Page 23

Forest Lakes Elementary 0328 11.74%
Bel Air High 0373 11.02%
Homestead/Wakefield Elementary 0335 10.99%
Red Pump Elementary School 0349 10.91%
Southampton Middle 0374 10.82%
C. Milton Wright High 0385 10.73%
Jarrettsville Elementary 0436 10.21%
Emmorton Elementary 0121 9.83%
Youths Benefit Elementary 0348 8.72%
Fountain Green Elementary 0327 8.19%
Fallston Middle School 0386 8.07%
Forest Hill Elementary 0326 7.90%
Fallston High 0382 5.50%
Patterson Mill High School 0187 0.00%
Total Public school allocations (For Title I, Should add up to the total number from Title I Allocation Excel Worksheet Column N.)
$2,506,109.77
Additional Attachments Page 24
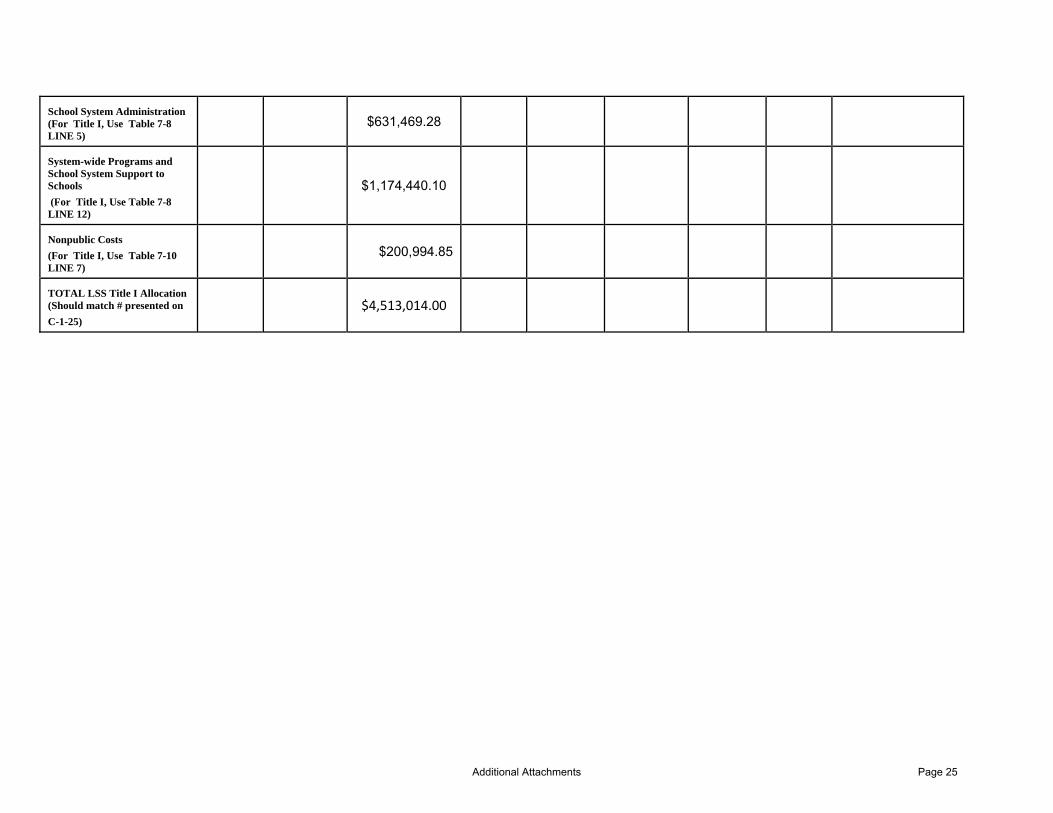
School System Administration (For Title I, Use Table 7-8 LINE 5)
$631,469.28
System-wide Programs and School System Support to Schools
(For Title I, Use Table 7-8 LINE 12)
$1,174,440.10
Nonpublic Costs
(For Title I, Use Table 7-10 LINE 7)
$200,994.85
TOTAL LSS Title I Allocation (Should match # presented on
C-1-25)
$4,513,014.00
Additional Attachments Page 25

ATTACHMENT 5-A TRANSFERABILITY OF ESEA FUNDS [Section 6123(b)] Fiscal Year 2013
Local School System: LEA – 12: Harford County Public Schools
Local school systems may transfer ESEA funds by completing this page as part of the Bridge to Excellence Master Plan Annual Update submission, or at a later date by completing and submitting a separate Attachment 5-A form. Receipt of this Attachment as part of the Annual Update will serve as the required 30 day notice to MSDE. A local school system may transfer up to 100 percent of the funds allocated to it by formula under four major ESEA programs among those programs and to Title I. The school system must consult with nonpublic school officials regarding the transfer of funds. In transferring funds, the school system must: (1) deposit funds in the original fund; (2) show as expenditure – line item transfer from one fund to another, and (3) reflect amounts transferred on expenditure reports. 50% limitation for local school systems not identified for school improvement or corrective action. 30% limitation for districts identified for school improvement. A school system identified for corrective action may not use the fund transfer option.
Funds Available for Transfer
Total FY 2013
Allocation
$ Amount to be transferred out of each program
$ Amount to be transferred into each of the following programs
Title I-A
Title II-A
Title II-D
Title IV-A
Title II-A Teacher Quality
Title II-D Ed Tech
Title IV-A Safe and Drug Free Schools &Communities
HARFORD COUNTY PUBLIC SCHOOLS WILL NOT CONSOLIDATE ESEA FUNDS
Additional Attachments Page 26

ATTACHMENT 5-B CONSOLIDATION OF ESEA FUNDS FOR LOCAL ADMINISTRATION [Section 9203] Fiscal Year 2013
Local School System: LEA – 12: Harford County Public Schools
Section 9203 of ESEA allows a local school system, with approval of MSDE, to consolidate ESEA administrative funds. In consolidating administrative funds, a school system may not (a) designate more than the percentage established in each ESEA program, and (b) use any other funds under the program included in the consolidation for administrative purposes. A school system may use the consolidated administrative funds for the administration of the ESEA programs and for uses at the school district and school levels for such activities as – The coordination of the ESEA programs with other federal and non-federal programs; The establishment and operation of peer-review activities under No Child Left Behind; The dissemination of information regarding model programs and practices; Technical assistance under any ESEA program; Training personnel engaged in audit and other monitoring activities; Consultation with parents, teachers, administrative personnel, and nonpublic school officials; and Local activities to administer and carry out the consolidation of administrative funds.
A school system that consolidates administrative funds shall not be required to keep separate records, by individual program, to account for costs relating to the administration of the programs included in the consolidation.
If the school system plans to consolidate ESEA administrative funds, indicate below the ESEA programs and amounts that the school system will consolidate for local administration. Provide a detailed description of how the consolidated funds will be used.
Title I-A
(Reasonable and Necessary)
Title II-A
(Reasonable and Necessary)
Title III-A
(Limit: 2 Percent)
Total ESEA Consolidation
(Reasonable and Necessary)
$
$
$
$
HARFORD COUNTY PUBLIC SCHOOLS WILL NOT CONSOLIDATE ESEA FUNDS
Additional Attachments Page 27
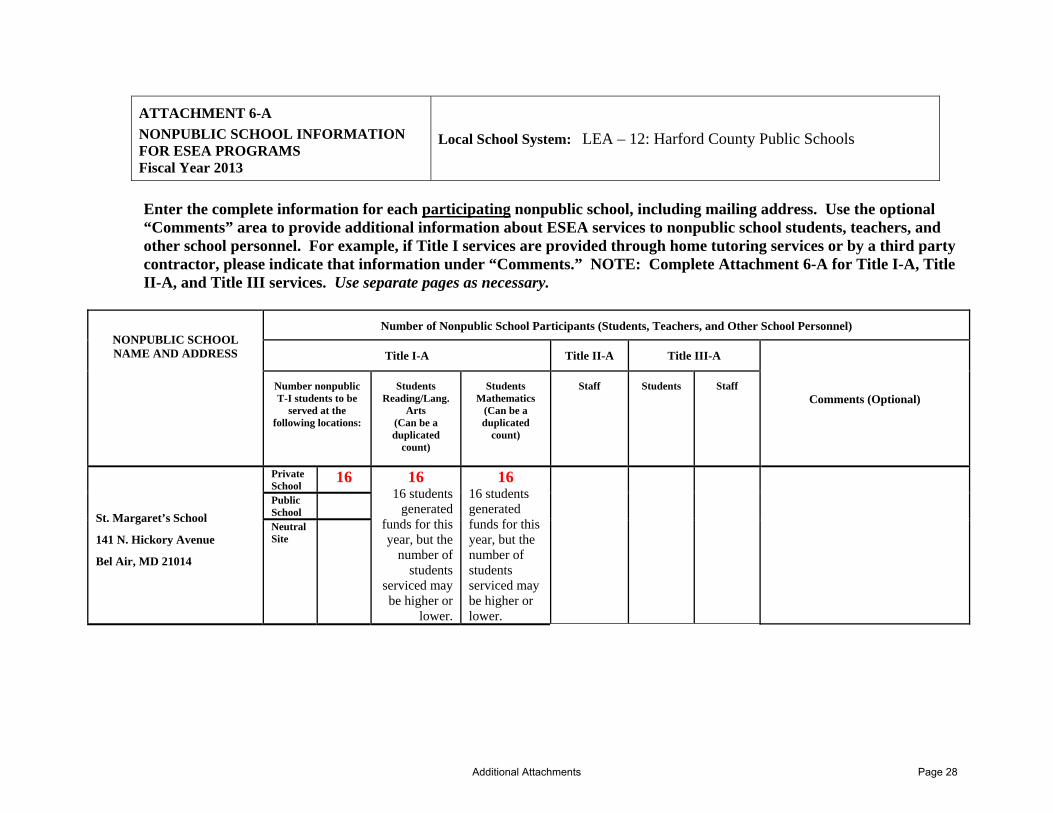
ATTACHMENT 6-A
NONPUBLIC SCHOOL INFORMATION FOR ESEA PROGRAMS Fiscal Year 2013
Local School System: LEA – 12: Harford County Public Schools
Enter the complete information for each participating nonpublic school, including mailing address. Use the optional “Comments” area to provide additional information about ESEA services to nonpublic school students, teachers, and other school personnel. For example, if Title I services are provided through home tutoring services or by a third party contractor, please indicate that information under “Comments.” NOTE: Complete Attachment 6-A for Title I-A, Title II-A, and Title III services. Use separate pages as necessary.
NONPUBLIC SCHOOL NAME AND ADDRESS
Number of Nonpublic School Participants (Students, Teachers, and Other School Personnel)
Title I-A Title II-A Title III-A
Comments (Optional) Number nonpublic T-I students to be
served at the following locations:
Students Reading/Lang.
Arts (Can be a duplicated
count)
Students Mathematics
(Can be a duplicated
count)
Staff Students Staff
St. Margaret’s School
141 N. Hickory Avenue
Bel Air, MD 21014
Private School
16 16 16 students
generated funds for this year, but the
number of students
serviced may be higher or
lower.
16 16 students generated funds for this year, but the number of students serviced may be higher or lower.
Public School
Neutral Site
Additional Attachments Page 28
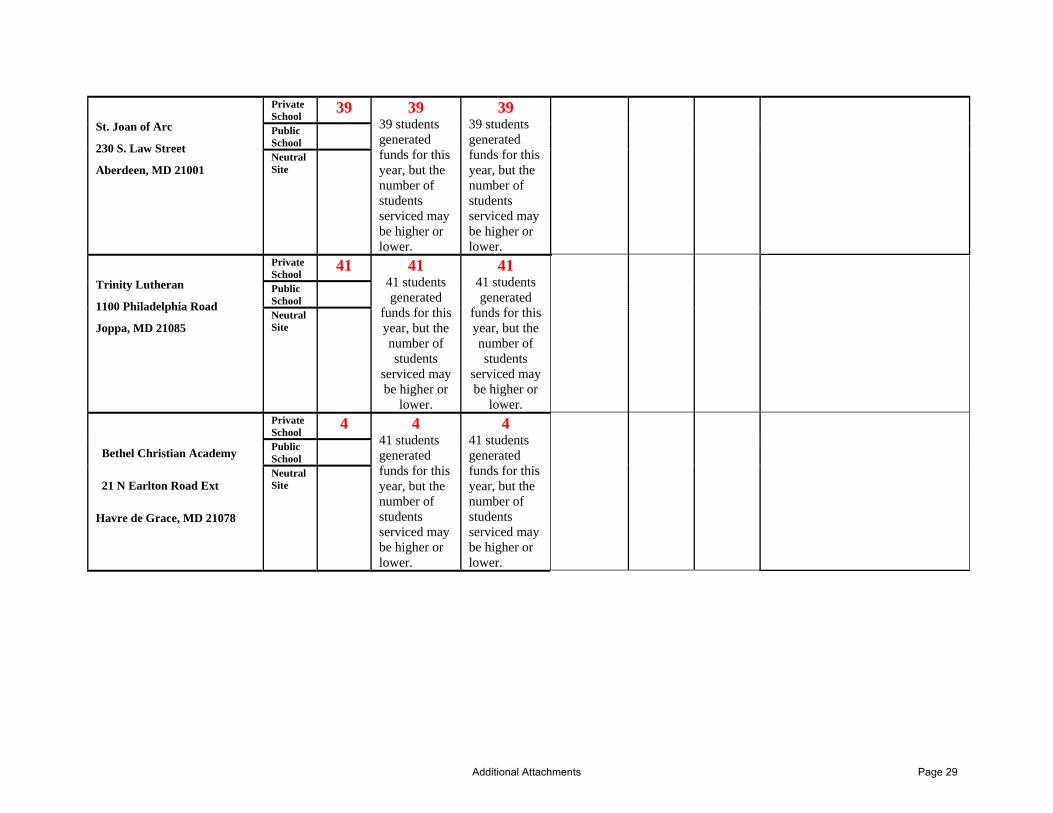
St. Joan of Arc
230 S. Law Street
Aberdeen, MD 21001
Private School
39 39 39 students generated funds for this year, but the number of students serviced may be higher or lower.
39 39 students generated funds for this year, but the number of students serviced may be higher or lower.
Public School
Neutral Site
Trinity Lutheran
1100 Philadelphia Road
Joppa, MD 21085
Private School
41 41 41 students generated
funds for this year, but the number of students
serviced may be higher or
lower.
41 41 students generated
funds for this year, but the number of students
serviced may be higher or
lower.
Public School
Neutral Site
Bethel Christian Academy
21 N Earlton Road Ext
Havre de Grace, MD 21078
Private School
4 4 41 students generated funds for this year, but the number of students serviced may be higher or lower.
4 41 students generated funds for this year, but the number of students serviced may be higher or lower.
Public School
Neutral Site
Additional Attachments Page 29

2012-2013 Attachment 7
Title I, Part A
2 LEA: ________________________________
Last fall, the U.S. Department of Education offered States the opportunity to request flexibility from certain
requirements of the Elementary and Secondary Education Act of 1965 (ESEA), as amended by the No Child Left
Behind Act of 2001 (NCLB), in exchange for rigorous and comprehensive plans designed to improve educational
outcomes for all students, close achievement gaps, increase equity, and improve the quality of instruction. This
flexibility is intended to support the groundbreaking reforms already taking place in many States and districts that
we believe hold promise for improving outcomes for students. The waivers that comprise ESEA flexibility were
granted to Maryland pursuant to Secretary Duncan’s authority in section 9401 of the ESEA. On May 29, 2012, the
U.S. Department of Education approved Maryland’s Flexibility Plan.
Maryland’s Flexibility Plan includes a waiver of section 1116(b) (except (b)(13)), that required LEAs to identify
schools for improvement, corrective action, and restructuring. As a result, all schools in your district that have not
made AYP for two or more consecutive years under NCLB or Maryland’s Differentiated Accountability System will
no longer carry its school improvement label or be required to implement the requirements associated with its
former improvement status which include Public School Choice, SES, 10% reservation for School PD, 10%
reservation for LEA PD, and the 85% funding rule for schools in corrective action or restructuring .
Under Maryland’s ESEA Flexibility Plan, the requirement in ESEA section 1114(a)(1) that a school have a poverty
percentage of 40% or more in order to operate a schoolwide program has been waived if the school has been
designated as a priority school or focus school by the SEA.
Priority Schools
Priority Schools are five percent of all Title I schools that are the lowest achieving on MSA. . These schools have
not reached adequate performance standards in reading and mathematics for the “all students” subgroup, not just for
low-performing subgroup populations. Schools or local education agencies have the option to use one of the USED
approved “turnaround models” or they can develop their own measures to implement to improve the school. If
schools choose to use their own model they must address a number of Turnaround principles including strong
leadership, effective teachers and instruction, additional time for student learning, school instructional programs, a
safe school environment, and family and community engagement.
Focus Schools
Focus Schools are ten percent of all Title I schools having the largest gap between the “all students” subgroup and
the lowest performing subgroup or a Title I eligible high school with graduation rates 60% or lower. These schools
are unique in that they do not require whole school reform measures, rather school interventions will focus on one or
two subgroups that are low achieving and contribute to an increased achievement gap between other subgroups of
students in the school. Maryland’s focus schools will implement intervention plans mainly for students with
disabilities or students who are second language learners with cultural barriers., Many of these students have unique
challenges. Focus schools will be expected to collect and analyze data to identify problematic areas of instruction
and learning. This will allow schools and LEAs to address the particular areas through professional development,
parental involvement, instructional teams, and the development of other specialized strategies that they deem
necessary.
Support for Priority Schools Not Receiving Title I 1003(g) SIG funds
MSDE expects the LEA to use all, or a portion of, the amount of Title I dollars that was previously required as a set
aside for SES and Parent Choice (20% of its total allocation) to provide between $50,000 and $2 million per school
per year for the next three years in order to implement a model or interventions sufficiently addresses the needs of
its priority schools and students. [ESEA Flexibility Plan: Principle 2.D.iii] If LEAs with priority schools do not use
the full 20% reservation for its priority schools, MSDE expects the LEA to use the remaining amount to support its
Title I focus schools.
Support to Low Performing Title I Schools (priority, focus, and Title I schools that have not met all student
progress targets (SPT)).
Local Discretion: An LEA with priority, focus or low performing Title I schools is highly encouraged to set aside
district level Title I, Part A funds to support low performing schools through interventions such as, locally

2012-2013 Attachment 7
Title I, Part A
3 LEA: ________________________________
coordinated supplemental educational services or after school programs, technical assistance, and/or professional
development. [Maryland’s Flexibility Plan: Section 2.D.iii]
Please be advised, MSDE will continue to provide guidance to LEAs as we begin the implementation of our new
Flexibility Plan. If you have any questions, please contact Maria E. Lamb, Director, Program Improvement and
Family Support Branch at [email protected] .
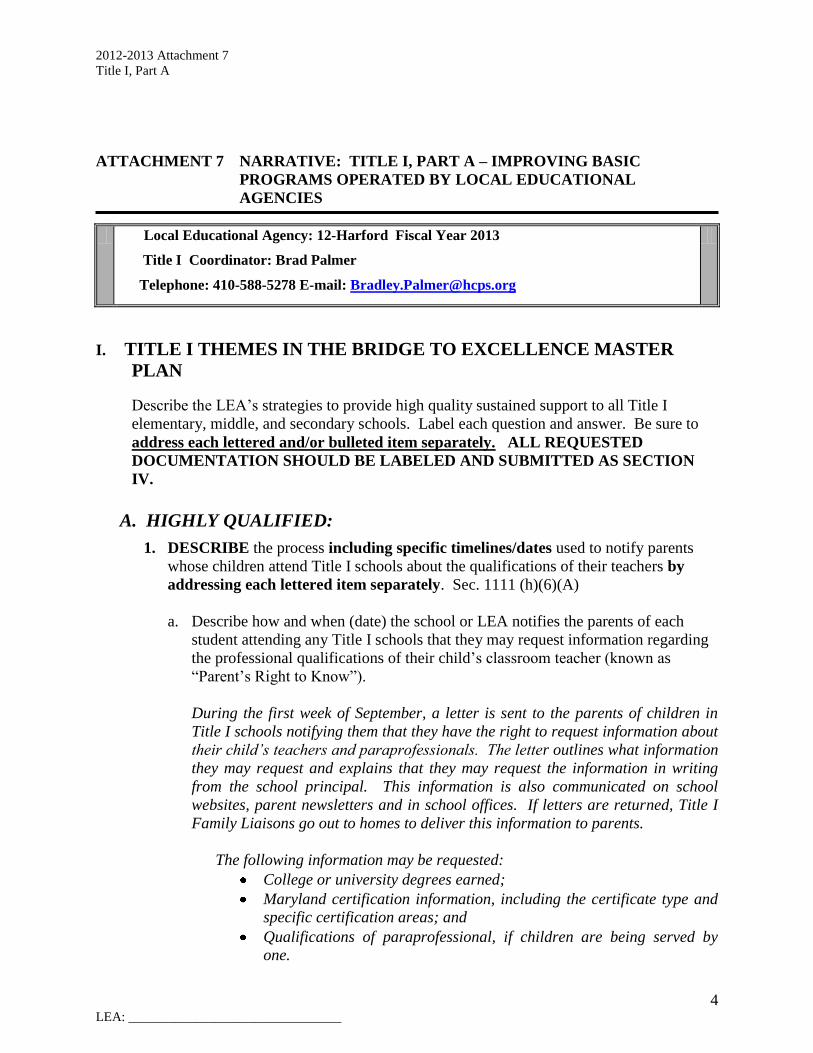
2012-2013 Attachment 7
Title I, Part A
4 LEA: ________________________________
ATTACHMENT 7 NARRATIVE: TITLE I, PART A – IMPROVING BASIC
PROGRAMS OPERATED BY LOCAL EDUCATIONAL
AGENCIES
Local Educational Agency: 12-Harford Fiscal Year 2013
Title I Coordinator: Brad Palmer
Telephone: 410-588-5278 E-mail: [email protected]
I. TITLE I THEMES IN THE BRIDGE TO EXCELLENCE MASTER
PLAN
Describe the LEA’s strategies to provide high quality sustained support to all Title I
elementary, middle, and secondary schools. Label each question and answer. Be sure to
address each lettered and/or bulleted item separately. ALL REQUESTED
DOCUMENTATION SHOULD BE LABELED AND SUBMITTED AS SECTION
IV.
A. HIGHLY QUALIFIED:
1. DESCRIBE the process including specific timelines/dates used to notify parents
whose children attend Title I schools about the qualifications of their teachers by
addressing each lettered item separately. Sec. 1111 (h)(6)(A)
a. Describe how and when (date) the school or LEA notifies the parents of each
student attending any Title I schools that they may request information regarding
the professional qualifications of their child’s classroom teacher (known as
“Parent’s Right to Know”).
During the first week of September, a letter is sent to the parents of children in
Title I schools notifying them that they have the right to request information about
their child’s teachers and paraprofessionals. The letter outlines what information
they may request and explains that they may request the information in writing
from the school principal. This information is also communicated on school
websites, parent newsletters and in school offices. If letters are returned, Title I
Family Liaisons go out to homes to deliver this information to parents.
The following information may be requested:
College or university degrees earned;
Maryland certification information, including the certificate type and
specific certification areas; and
Qualifications of paraprofessional, if children are being served by
one.

2012-2013 Attachment 7
Title I, Part A
5 LEA: ________________________________
If a request is made for any of the above information, the principal will
provide information within 30 calendar days. The principal compiles a binder
of Title I teacher/paraprofessional profiles which contain all highly qualified
information. This binder is kept on file in the principal’s office and is updated
whenever there are staff changes throughout the year. At a parent’s request,
the information from the binder is shared.
(See Appendix A.1 - Parents Right to Know Letter English and Spanish)
b. Describe the process of providing timely notice (letter) to parents when their child
has been assigned or taught for 4 or more consecutive weeks by a teacher or
substitute teacher who is not highly qualified.
In the event the system has a non-highly qualified Title I
teacher/paraprofessional, the Human Resources and Title I Offices will meet with
the employee and principal immediately upon notification. As per the HQ
Process Document, (Appendix A.2 – HQ Process Document), a plan will be put in
place that documents support to teachers/para-professionals in an effort to obtain
highly qualified status.
Parents will be notified in writing if their child is taught by a teacher for 4 or
more weeks (20 days) that does not meet the state’s definition of highly qualified.
Letters will go home on day 18. On day 18, a copy of the letter is sent to the Title
I Supervisor’s office, to be kept on file.
(See Appendix A.2 – HQ Process Document)
Principals will use the Verification of Compliance Attestation to document highly
qualified status of all teachers and paraprofessionals in their schools. The Title I
Office will maintain documentation and provide follow-up.
Retaining highly qualified teachers in Title I schools will be promoted through
additional professional development activities with stipends and MSDE credit, co-
teaching opportunities, and mentoring support (after school/weekends).
Attestation documents will be sent to all Title I Principals on September 1, 2012.
These Attestations will be due to the Title I Office on September 30, 2012.
c. Identify by name, title, and department the person(s) responsible for ensuring
compliance with Section 1111(h)(6)(A).
Brad Palmer, Supervisor of Compensatory Education
Jake Little, Coordinator of Compensatory Education
Thomas Webber, Assistant Supervisor of Compensatory Education
Barbara Matthews, Human Resources Coordinator, ESEA
Deborah Cannon, Human Resources Specialist, Compliance

2012-2013 Attachment 7
Title I, Part A
6 LEA: ________________________________
Patricia Chenworth, Principal, George D. Lisby Elementary School at
Hillsdale
Gwendolyn Benjamin-Jones, Principal, Hall’s Cross Roads Elementary
School
Renee Villareal, Principal, Havre de Grace Elementary School
Patricia Mason, Principal, Magnolia Elementary School
Gail Dunlap, Principal, William Paca/Old Post Road Elementary School
d. Describe how the LEA coordinates Highly Qualified notification between Human
Resources, the Title I Office, and school administration (for a. and b. in this
section).
The Title I Office meets quarterly with the Harford County Public School Human
Resources Office to review Highly Qualified status for teachers and
paraprofessionals in Title I schools. Any issues that need to be addressed are
discussed with the Executive Director of Elementary Programs, the school
principal, and Harford County Public Schools Human Resources Office.
Documentation is maintained as to these discussions. In the event the system has
a non-highly qualified Title I teacher/paraprofessional, the Human Resources and
Title I Offices will meet with the employee and principal immediately upon
notification. As per the HQ Process Document, (Appendix A.2 – HQ Process
Document), a plan will be put in place that documents support to teachers/para-
professionals in an effort to obtain highly qualified status.
e. Describe how the LEA ensure the Highly Qualified status of teachers assigned to
Title I schools is maintained.
On a monthly basis, the Title I Office meets with the Human Resources Office to
review all Title I teachers’ and paraprofessionals’ highly qualified status. All
certification requirements are validated by Harford County Public Schools
certification specialist for accuracy. Sign-in sheets, agendas, and minutes are
kept to document the effort toward maintaining 100% highly qualified status for
all Harford County Public Schools Title I schools. Title I principals notify the
Supervisor of Title I as to highly qualified status of all teachers/paraprofessionals
candidates.
(See Appendix A.2 – HQ Process Document)
2. DOCUMENTATION: Include sample copies of English and translated letters that
will be used to meet the requirements (for a. and b.) in school year 2012-2013.
(See Appendix A.1 - Parents Right to Know Letter English and Spanish)
3. Are all paraprofessionals in Title I schoolwide schools qualified?
___X____Yes _______ No _________ Not Applicable
2012-2013 Attachment 7
Title I, Part A
7 LEA: ________________________________
4. Are all paraprofessionals paid with Title I funds in targeted assistance schools
qualified? ________Yes _______ No ____ X ____ Not Applicable
B. SCHOOLWIDE PROGRAMS:
If the LEA does not have any Title I schoolwide programs, proceed to Section C -
Targeted Assistance.
Under Maryland’s ESEA Flexibility Plan, the requirement in ESEA section 1114(a)(1)
that a school have a poverty percentage of 40% or more in order to operate a schoolwide
program has been waived if the school has been designated as a priority school or focus
school by the SEA. See the end of this application for the list of Maryland’s approved
priority and focus schools.
1. For LEAs with Title I schoolwide programs, DESCRIBE the steps taken to help the
Title I schools make effective use of schoolwide programs by addressing each
lettered item separately. Reg. 200.25-28 and Sec. 1114.
a. Describe how the system will assist schools in consolidating funds for schoolwide
programs. If the system is not consolidating funds, describe how the system
coordinates financial resources to develop schoolwide programs.
Funds are not consolidated. The Title I Office and the Office of Finance work
closely to ensure all funds for Title I schools are effectively appropriated with on-
going frequent contact between both departments. Title I schools utilize these
funds for additional staff, intervention programs and supplies/materials/
equipment which support Title I student achievement.
The LEA and the Title I Office communicate regularly to ensure the coordination
of funds, for purchases of intervention supplies, materials and programs, which
will increase student achievement in Title I Schools. The HCPS Intervention
Coordinator and Title I Office discuss the best use of these funds. Once the funds
are disbursed to the schools, the principals order the instructional tools needed to
support student achievement.
b. Describe the process to ensure that the 10 Components of a Schoolwide Program
are part of the development, peer review, implementation, and monitoring of
Schoolwide/School Improvement Plans.
The HCPS Title I process to ensure the 10 Components of a Schoolwide Program
are part of the development, peer review, implementation, and monitoring of
Schoolwide/School Improvement plans are:
1. Schools receive staff development from the Title I Supervisors, Title I
Teacher Specialists, and MSDE specialists on how to make effective use of
schoolwide programs.
2. Embedded in staff development are the 10 components of a schoolwide
program and how those components help to effect change for all

2012-2013 Attachment 7
Title I, Part A
8 LEA: ________________________________
stakeholders. The Schoolwide Component Checklist is introduced and
used in the writing of each school’s School Improvement Plan.
3. Peer reviews are conducted to review school improvement plans and to
help schools ensure that the plans are a working document at the school
site. (Scheduled for October 2012). The peer review process meeting
includes information pertaining to the uniform evaluation process. A
scoring tool is included during the peer review process meeting. William
Paca/Old Post Road ES will be paired with another school to specifically
address their status as a “FOCUS” school.
4. During the Peer review, the Schoolwide Component Checklist:
(Schoolwide Components NCLB section 1114(b) (1) (A-J)) is used to
document that all 10 components are in each school’s plan. A matrix is
included in each School’s Improvement Plan, detailing each of the 10
Schoolwide Components on which page they are found.
5. After the Title I SIP (School Improvement Plan) Peer Review, the school
reviews and rewrites the plan to incorporate all components. The
Schoolwide Component Checklist is used during the school review and
rewrite. Completion of revisions are due back to the Title I Office by mid-
November.
6. Monthly School Improvement Teams review 10 components to ensure
implementation.
7. Title I principals and teacher specialists maintain binders/bins that are
divided into the 10 components. Evidence of each component is filed and
maintained. The Title I supervisor monitors and reviews all evidence on a
quarterly basis. Title I principals meet monthly to discuss progress and
student needs. Title I Teacher Specialists meet with Title I Supervisor on a
monthly basis to discuss additional support, if needed.
8. New for the 2012-2013 School Year, the Title I Office will conduct Mock
Program Reviews for each of the Title I Schools in the Fall of 2012.
Purpose of the mock reviews is to provide support and guidance to the
schools to ensure that each school is meeting 100% of the Title I program
review requirements.
9. Title I Supervisor, Assistant Supervisor, and Coordinator meet with ILT
(Instructional Leadership Team), SIT (School Improvement Team) to
review ongoing implementation of the 10 components.
10. Title I Supervisor, Assistant Supervisor, and Coordinator monitor
timelines for implementation/review school improvement team minutes on
a monthly basis to ensure the minutes highlight which component(s) are
referenced during the meeting.
SIP Peer Review Documents to be completed in October 2012.
c. If any of the 10 Components of the schoolwide plan are not adequately addressed,
describe steps the LEA will take to ensure that revisions to schoolwide plans
occur in a timely manner.
2012-2013 Attachment 7
Title I, Part A
9 LEA: ________________________________
The Plan, Do, Study, Act cycle of continuous improvement will be used to review
data related to the 10 components of a schoolwide program. During the month of
October, the Title I schools will conduct a peer review of school improvement
plans. The Schoolwide Component Checklist: (Schoolwide Components NCLB
section 1114(b) (1) (A-J) is used to document that all 10 components are in each
school’s plan. A matrix is created for each School’s Improvement Plan, detailing
each of the 10 Schoolwide Components and on which page they are found.
After the Title I SIP (School Improvement Plan) Peer Review, the school reviews
and rewrites the plan to incorporate all components. Completion of revisions are
due back to the Title I Office by mid-November. The SIP (School Improvement
Plan) is reviewed again by Title I Supervisors and Teacher Specialists for
inclusion of all 10 components.
d. Describe specific steps to be taken by the LEA to review and analyze the
effectiveness of schoolwide programs.
Bi-weekly data meetings are conducted by Title I Teacher Specialists with
grade level teams to identify whether or not students are making
appropriate progress. If students are not making appropriate progress,
decisions about changes in interventions will be made on how to increase
student achievement.
Title I Supervisor meets monthly with teacher specialists to review bi-
weekly data meetings and school/student progress. Feedback is given to
the teacher specialists during the monthly meetings. Minutes are
maintained to capture the feedback. The Title I Supervisor monitors the
intervention data provided by the teacher specialists to ensure, the
program’s effectiveness
A monthly review of implementation of School Improvement Plans by SIP
teams is monitored for student benchmark progress. Minutes are provided
to the Title I Office of all School Improvement Team meetings. These
minutes are reviewed monthly by the Title I Office to determine student
progress based upon benchmark information provided. Feedback is
submitted to each school’s SIP team.
The Title I Supervisor, Assistant Supervisor, and Coordinator will attend
each school’s SIT meetings at a minimum on a quarterly basis.
The Title I Coordinator will attend each schools FIT meetings on a
quarterly basis
The Title I Supervisor and Coordinator, with each school’s Principal, will
participate in formal teacher observations each semester in order to
monitor the program effectiveness.
The Title I Coordinator will attend family involvement events in order to
monitor the effectiveness of these events.
e. Describe how the system and/or schools provide extended learning time, such as
an extended school year, before- and after-school, and summer program
opportunities.
2012-2013 Attachment 7
Title I, Part A
10 LEA: ________________________________
All Title I schools in Harford County offer extended learning time through
programs such as:
Half day Summer School, a four-week program designed to maintain
students’ skills in reading and mathematics. Two mega sites house
registered students (grades K-4) from all five Title I schools.
Transportation is provided.
The 2012 Jump Start Summer Program is a 10 day program designed
to introduce students, in grades 3 – 5, to specialized STEM instruction
that is focuses on Science, Technology, Engineering, Math (STEM)
skills, and literacy skills with an interwoven Arts Integration
component. In addition, the program is held two week prior to the
beginning of the school year to assist students in acclimatizing to the
regular school year. The curriculum for this program was custom
designed by a committee of Teachers, Principals, and Support Staff.
Curriculum guides are available upon request.
Homework Club, Math Clubs and Cool School are before and/or after
school programs that support identified students by providing time and
guidance for remediation.
After-school reading and mathematics programs are available to
support special education students to improve their achievement.
Intervention Programs are offered before, during, after school:
SuccessMaker, LAUNCH (Language Arts Understanding to Nurture
Children’s Literacy Achievement), SIPPS (Systematic Instruction in
Phonemic Awareness, Phonics and Sight Words), Imagination Station,
Wilson Reading Program and Knowing Math.
Title I Selection Instruments and Selection Criteria are utilized to
provide extended learning opportunities for students in need
academic.
(See Appendix B.1 – Title I Selection Instruments Criteria)
f. In addition to the Title I Supervisor, identify other central office staff by name,
title, and department responsible for monitoring the 10 components in schoolwide
plans, the effectiveness of schoolwide program implementation, fiduciary issues,
and program effectiveness.
Angela Morton, Executive Director of Elementary Programs, 410-588-5207
Thomas Webber, Assistant Supervisor of Compensatory Education, 410-809-6062
Jacob Little, Coordinator of Compensatory Education, 410-588-5266
Leeann Schubert, Coordinator of School Improvement, 410-809-6073
Nancy Beltz, Title I Teacher Specialist, 410-273-5530
Tina Sell, Title I Teacher Specialist, 410-612-1566
Jody Stover, Title I Teacher Specialist, 410-273-5524,
Alice Jaffe, Title I Teacher Specialist, 410-612-1566
Jennifer Gasdia, Title I Teacher Specialist, 410-939-6616
Tara Sample, Title I Teacher Specialist, 410-612-1553
2012-2013 Attachment 7
Title I, Part A
11 LEA: ________________________________
2. For LEAs with Priority Schools (which includes 1003g SIG funded schools)
and/or Focus Schools: Describe how the LEA will insure that the 10 components
for schoolwide are integrated throughout the schools’ models/plans.
Please refer to the answer in B.1.b that addresses the procedures established to
ensure the 10 components are included in the School Improvement Plan for
William Paca / Old Post Road ES (WPES).
In addition, the Executive Director of Elementary Education and the Supervisor
of Title I will review the School Improvement Plan for WPES and provide
feedback that specifically addresses the special education deficits at WPES.
The Schoolwide Component Checklist: (Schoolwide Components NCLB section
1114(b) (1) (A-J)) is used to document that all 10 components are in each
school’s plan. A matrix is created for each School’s Improvement Plan, detailing
each of the 10 Schoolwide Components and on which page they are found.
After the Title I SIP (School Improvement Plan) Peer Review, the school reviews
and rewrites the plan to incorporate all components. The Schoolwide Component
Checklist are used during the school review and rewrite. Completion of revisions
are due back to the Title I Office by mid-November. Special attention will be
given to ensure the SIP includes specific strategies that address the Special
Education deficit needs. During the October SIP Peer Review process, detailed
documentation of the 10 components will be reviewed.
WPES’ SIP is in the process of revision during the month of August. Finalization
of the School Improvement Plans will be completed throughout the beginning of
the school year. This final copy will be submitted to the MSDE POC for review.
HCPS has created a Task Force during the 2012-2013 School Year to support
WPES as a designated Focus School. The task force is composed of HCPS
Leadership personnel. The Task Force will meet prior to the beginning of the
school year to formulate strategies and programs to assist WPES. In addition,
the Task Force will make a site visit in September 2012 and will hold quarterly
meetings to monitor the progress of WPES.
C. TARGETED ASSISTANCE SCHOOLS:
If the LEA does not have any Title I targeted assistance programs, proceed to Section E -
Parent Involvement.
1. DESCRIBE the step-by-step process including timelines/dates used to identify
eligible children most in need of services. Include in the description how students are
ranked using multiple selection (academic) criteria. (NOTE: Children from
preschool through grade 2 must be selected solely on the basis of such criteria as

2012-2013 Attachment 7
Title I, Part A
12 LEA: ________________________________
teacher judgment, parent interviews, and developmentally appropriate measures.)
Section 1115(b)(1)(B)
N/A
2. DESCRIBE how the LEA helps targeted assistance schools identify, implement, and
monitor effective methods and supplemental instructional strategies for small
groups of identified students. (In Maryland, small group constitutes no more than
8 students to one teacher.) These strategies must be based on best practices and
scientific research to strengthen the core academic program of the school. Describe
how the system/school will address the following: Section 1115(c)(1)(C).
a. Giving primary consideration to providing extended learning time, such as an
extended school year, before-and after-school, and summer program
opportunities.
N/A
b. Helping provide an accelerated, high-quality curriculum, including applied
learning.
N/A
c. Minimizing the removal of children from regular classroom instruction for
additional services.
N/A
3. DESCRIBE how the LEA/school provides additional opportunities for professional
development with Title I resources, and, to the extent practicable, from other sources,
for teachers, principals, and paraprofessionals, including, if appropriate other staff.
N/A
4. DESCRIBE the process for developing (with peer review), implementing, and
monitoring targeted assistance requirements in targeted assistance school
improvement plans.
N/A
5. DESCRIBE the specific steps to be taken to review and analyze the effectiveness of
the targeted assistance programs.
N/A
6. In addition to the LEA Title I coordinator, identify by name, title, and department the
person/s responsible for monitoring the required components in targeted assistance
plans, the effectiveness of the targeted assistance programs, and fiduciary issues.
N/A
7. DOCUMENTATION: Attach weighted criteria used to select and rank children for
targeted assistance services, the timeline for selecting students and implementing the
targeted assistance program.
N/A

2012-2013 Attachment 7
Title I, Part A
13 LEA: ________________________________
8. If an LEA intends to transition a Title I school implementing a targeted assistance
program in 2012-2013 to a schoolwide program in 2013-2014, the LEA must submit
a formal letter to Maria E. Lamb, Program Improvement and Family Support
Director, informing MSDE of its intent.
N/A
List the Title I school(s) by name and assigned MSDE ID number below.
N/A
D. PARENT INVOLVEMENT:
To encourage parent involvement, LEAs and schools need to communicate frequently,
clearly, and meaningfully with families, and ask for parents’ input in decisions that affect
their children. [Section 1118(a)(2)] Parent involvement strategies should be woven
throughout each system’s Master Plan.
1. Local Educational Agency Parent Involvement Policy/Plan Review
a. Date the current LEA Parent Involvement Policy/Plan was reviewed: March 1,
2012
b. Describe how parents from Title I schools were involved in the annual review of
the LEA Parent Involvement Policy/Plan.
Each Title I school has a Parent Involvement Committee that meets quarterly
to review and update the Parent Involvement Plan.
After parents review LEA Parent Involvement Plan using the Title I District
level Parent Involvement Plan Requirement Checklist, they submit their
feedback to the Title I Coordinator.
An annual Title I Parent Involvement Policy and Procedure Survey is
distributed to parents during winter/spring Parent Involvement meetings,
feedback is submitted to the Title I Coordinator.
The Title I Coordinator submits the parent feedback to the Executive Director
of Elementary Programs who in turn provides information to the Harford
County Public Schools Board of Education for further review/approval.
The final form of Parent Involvement Plan is reviewed at Back to School
night, school newsletters, FIT Meetings and posted on school and LEA
websites so that all parents receive information on their input to the plan.
Process will begin again for continual yearly review of the LEA Parent
Involvement Plan for the 2012-2013 School Year.
(See Appendix D.1 – Title I Parent Involvement Documents)
c. Describe how the LEA ensures that parents from Title I schools are informed
about the existence of the district-level Parent Involvement Policy/Plan and how it
is distributed to parents.
2012-2013 Attachment 7
Title I, Part A
14 LEA: ________________________________
HCPS Title I Office ensures that each Title I school is informed about the
existence of the system-level Parent Involvement Plan through various meetings
with Family Involvement Teams, all Title I school improvement teams and
monthly Title I principals and teacher specialists meetings. The plan is on the
HCPS website and the HCPS Title I website. In addition, the plan is distributed
to all parents during the Fall as an attachment to the monthly school newsletters.
(See Appendix D.1 – Title I Parent Involvement Documents)
2. DOCUMENTATION: Attach a copy of the LEA’s most current distributed Parent
Involvement Policy and Procedures. Discuss and explain any changes that have been
made since the last Master Plan submission.
Revisions were made effective May 1, 2011
(See Appendix D.1 – Title I Parent Involvement Documents)
3. School Level Parent Involvement Plan Review
a. Describe how the LEA ensures that all Title I schools have a school level Parent
Involvement Policy/Plan that meets statutory requirements.
The LEA Parent Involvement Statement is embedded in each Title I school’s
Parent Involvement Plan to indicate their acceptance of the HCPS district Parent
Involvement policy.
During the fall of each school year, the Family Involvement Teams at each Title I
school review the Parent Involvement Plan using the School Level Plan Checklist.
The Coordinator of Title I attends Family Involvement Team meetings at each
Title I school. To ensure compliance, the Coordinator of Title I collects all plans
and provides written feedback, using the district level Parent Involvement Plan
checklist.
b. Describe how the LEA will verify that Title I parents are involved in the joint
development, implementation and annual review of the parent involvement plans.
Each Title I school has a Family Involvement Team that meets quarterly to review
and update the Parent Involvement Plan.
Parents discuss/make revisions on the plan. The LEA verifies that Title I
parents are involved in the joint development, implementation, and annual
review of the parent involvement plans through:
2012-2013 Attachment 7
Title I, Part A
15 LEA: ________________________________
Collection and review of sign-in sheets, agendas and minutes (SANE-
Sign in, Agenda, Notes, Evaluation)
Periodic review of Student Agenda Books by Teachers/Family Liaisons
which include the Parent Involvement Plan for the school
Analysis of the results of the Title I School Satisfaction Survey, results
from survey are shared with administrators, school teams and parents.
Concerns are addressed/discussed at parent involvement meetings and
school improvement meetings. Results are used to support revisions to
the parent involvement plan.
Review of Parent Involvement Plans by Title I Coordinator.
Additional opportunities exist, throughout the year, for parents and families not
involved with the Family Involvement Team. The timeline is as follows:
Fall 2012 Plan sent home
Back to School Night – plan/compact reviewed
Fall 2012 Parent Conferences
Parent Involvement plan redistributed
Fall 2012 Newsletters
HCPS Parent Involvement Plan is sent home in each school’s
newsletter
4. School-Parent Compact
a. Describe how the LEA will ensure that each Title I school has a School-Parent
Compact that meets statutory requirements.
Title I Office utilizes a school/parent compact checklist to guide/ensure that Title I
schools incorporate and meet all statutory requirements. The Title I Coordinator
reviews all checklists and inform principals of any needed feedback. Based upon
monitoring by the Title I Coordinator, if any changes need to be made to the
school/parent compact, these changes will take place within the next two family
involvement team meetings. School teams comprised of teachers/parents
rewrite/revise compact on a yearly basis. Compacts are placed in every student’s
agenda book in English and Spanish. Parent friendly versions of the
Parent/School compact were created during the 2011-2012 School Year with
support from MSDE. Final versions of the parent friendly parent/school compact
are now in place at each of the 5 Title I Schools.
b. Describe how the LEA will verify that Title I parents are involved in the joint
development, implementation, and annual review of the School-Parent Compact.
The LEA attends family involvement meetings at each Title I school periodically
throughout the school year. All SANE documents are sent and kept on file in the
Title I Office. Expectations are that school teams will incorporate parent input to
compose all school compacts. Parent/school teams continuously work on
rewriting compacts throughout the year. Revisions are completed by December,

2012-2013 Attachment 7
Title I, Part A
16 LEA: ________________________________
2012. All Title I rewritten School-Parent Compacts are available at the school,
on school websites, within family involvement team meetings, and available at all
Parent Involvement nights.
5. Monitoring Parent Involvement
a. Describe the LEA’s process for monitoring parent involvement requirements in
Title I schools.
(See Appendix D.2 – Title I Parent Involvement Process Document)
b. In addition to the LEA Title I coordinator, identify by name, title, and department
the person(s) responsible for monitoring parent involvement.
Title I principals monitor parent involvement along with Title I
Family Liaisons.
Patricia Chenworth, Principal, George D. Lisby Elementary School at Hillsdale
Gwendolyn Benjamin-Jones, Principal, Hall’s Cross Roads Elementary School
Renee Villareal, Principal, Havre de Grace Elementary School
Patricia Mason, Principal, Magnolia Elementary School
Gail Dunlap, Principal, William Paca/Old Post Road Elementary School
Shanda Coley White, Family Liaison, Hall’s Cross Roads Elementary School
Kelly Wettig, Family Liaison, Havre de Grace Elementary School
Michael Phillips and Carinda Raftery, Family Liaisons, William Paca/Old Post
Road
Barbara Haller, Family Liaison, Magnolia Elementary School
Nancy Beltz, Title I Teacher Specialist, George D. Lisby Elementary School
6. Distribution of Parent Involvement Funds
a. Describe how the LEA distributes 95% of the 1% reservation to its Title I schools
for parent involvement activities.
Distribution of the parent involvement funds is based upon the number of
students in poverty within the Title I school. This allocation is funded for the
Title I schools with the greatest PPA (Per Pupil Allocation) to the least, based
upon the School’s FARMS rate, ranked order.
School Poverty
MAES 84.94%
HXES 77.68%
WPES 76.02%
GLES 70.02%
HDES 69.53%
Title I schools then apply the funds to identified parent involvement needs. Uses
of funds are identified in school improvement plan. Feedback is given to schools

2012-2013 Attachment 7
Title I, Part A
17 LEA: ________________________________
if funds are not used in a timely way. The Title I Supervisor monitors the parent
involvement expenses monthly.
b. Describe how the LEA ensures that Title I parents have input in the use of these
funds at the district and school level.
Through the School Improvement Team, Parent Involvement Committees,
Parent Meetings (SANE) information about use of Title I funds is provided
and feedback welcomed. Parents are included in all parts of the decision
making process regarding use of these funds.
Principals will report the use of parent involvement funds through the use of
various media sources such as newsletters, emails and the school alert system.
Title I School Satisfaction Parent Survey provides the opportunity to supply
input in the use of how Title I funds are used for their school.
Parent feedback of the use of Title I funds for the event and parent ideas for
other use of the funds are requested on the evaluation form.
(See Appendix D.3 – Title I School Satisfaction Parent Survey Information)
c. Does the LEA reserve more than 1% of its total allocation for parent
involvement? __X__ Yes _____ No
d. If yes, describe how these additional funds are used.
For the 2012-2013 School Year, HCPS will reserve 2% of its total Title I
allocation for parent involvement. The additional funds will be distributed
equitably to schools based upon poverty ranking just as the first 1% of parent
involvement funds are distributed. The reason for the increase in total allocation
for parent involvement is due to the request by Title I Principals and their parent
teams to provide a larger designated fund to increase parent involvement
participation at the school. The previous year’s 1% allocation was typically
expended within the first half year of the grant. The increase to 2% will allow
schools more opportunities to provide parent involvement programs and activities
throughout the entire school year. The attached Title I School Satisfaction Parent
Survey Information (Appendix E.3 - Title I School Satisfaction Parent Survey
Information), reflects only the feedback on the initial 1%. Principals and parent
teams decided to increase the amount beyond the 1% after the survey had been
completed. All schools are in complete support of the increase of parent
involvement funds beyond the 1% as of July 15, 2012. A detailed explanation of
the expenditures by school is included in the budget narrative portion of Budget
Information section, following the guidelines from MSDE for limiting food
purchases to prescribed “per person” allocation. In addition HCPS has also
instituted a 25% cap on Parent Involvement Food purchases for each school.
2012-2013 Attachment 7
Title I, Part A
18 LEA: ________________________________
E. EQUITABLE SERVICES TO STUDENTS IN PRIVATE SCHOOLS
[SECTION 1120]:
1. Participating private schools and services: COMPLETE INFORMATION IN
ATTACHMENT 6 A regarding the names of participating private schools and the
number of private school students that will benefit from the Title I-A services. Refer
to the Title I Services to Eligible Private School Children Non-Regulatory Guidance,
October 17, 2003.
(See Attachment 6-A)
2. DESCRIBE the LEA’s process for inviting private schools to participate in the Title
I, Part A program.
Certified letters are sent to all non-public schools in Harford County to invite
them to a meeting early in the calendar year. This meeting is held with all HCPS
grant managers. Each grant manager shares with the group all information
involving their specific grant. Telephone numbers and e-mail addresses are given
to the group in case there are other questions to be answered. At this meeting,
non-public school officials also check whether they are interested in having the
Title I program in their schools. Through written form distributed at the meeting,
with the timeline of two weeks after the meeting to accept or decline Title I
services. The Title I Supervisor plans a follow-up meeting with the non-public
school officials. Together dates are set for meetings to discuss all aspects of the
Title I program. Private and public school officials conduct meaningful
consultation during these meetings. All SANE documentation is on file at the
HCPS Title I Office.
(See Appendix E.1 – Invitation to Private Schools to Join Title I)
3. DESCRIBE the LEA's process of ongoing consultation with private school officials
to provide equitable participation to students in private schools.
The HCPS Title I Office is committed to providing equitable services to eligible
private school students, teachers, and parents. These services and other benefits will
be comparable to the services and other benefits provided to the public school
children and teachers participating in Title I programs. HCPS Title I Office will
assess, address, and evaluate the needs of private school students and teachers.
HCPS Title I Office meets with private school officials quarterly throughout the year.
At each meeting SANE documentation is kept and student progress is monitored. The
agendas include: Implementation of Afterschool program, Parent Involvement, Staff
Development, Student Assessment Calendar, Monitor Title I students, update of how
program is working and determination if any changes need to be made.

2012-2013 Attachment 7
Title I, Part A
19 LEA: ________________________________
4. DOCUMENTATION: Attach a timeline for consultation and affirmation meetings
with private school officials.
(See Appendix E.2 – Private School Timeline for consultation and affirmation
meeting)
5. DELIVERY OF SERVICES
a. Will LEA staff provide the services directly to the eligible private school
students? _____ Yes __X__ No
If yes, when will services begin? _______________
b. Will the LEA enter into a formal agreement with other LEA(s) to provide
services to private school students? _____ Yes __ X __ No
If yes, identify the LEA(s) involved and the date the services will begin.
_____________________________
c. Will the LEA enter into a third party contract to provide services to eligible
private school students? _ X ___ Yes _____ No
If yes, when will services begin? August 27, 2012
6. DOCUMENTATION: Attach copies of written affirmation(s) and if applicable,
copies of the MOUs between school districts. [Section 1120(b) and Reg. 200.63]
(See Appendix E.2 – Private School Timeline for consultation and affirmation
meeting)
7. DESCRIBE the LEA’s process to supervise and evaluate the Title I program serving
private school students.
Special Note: If an LEA is skipping schools, equitable services must still be
calculated with Title I funds and reported on the Title I allocation worksheet.
HCPS Title I Office meets with private school officials quarterly throughout the year.
At each meeting SANE documentation is kept and student progress is monitored. The
agendas include: Implementation of Afterschool program, Parent Involvement, Staff
Development, Student Assessment Calendar, Monitor Title I students, update of how
program is working and determination if any changes need to be made. During these
meetings with private school officials, the Title I Office is evaluating how the
program is working. Changes will be made to the program if it is determined that the
program is not working in its current form.
(See Appendix E.3 – Private School Signed Contract)

2012-2013 Attachment 7
Title I, Part A
20 LEA: ________________________________
II. TABLES AND WORKSHEETS
A. DETERMINATION OF ELIGIBLE SCHOOL ATTENDANCE AREAS [Section 1113]
Table 7-1 SOURCE(S) OF DOCUMENTED LOW-INCOME DATA FOR DETERMINING
THE NUMBER OF CHILDREN FROM LOW-INCOME FAMILIES
A Local Educational Agency must use the same measure of poverty for:
1. Identifying eligible Title I schools.
2. Determining the ranking of each school.
3. Determining the Title I allocation for each school.
PUBLIC SCHOOLS:
CHECK the data source(s) listed below that the school system is using to determine eligible Title I schools. The
data source(s) must be applied uniformly to all schools across the school system. A child who might be included in
more than one data source may be counted only once in arriving at a total count. The data source(s) must be
maintained in the applicant's Title I records for a period of three years after the end of the grant period
and/or 3 years after the resolution of an audit – if there was one. Public School System must only check one.
A. Free Lunch
X B. Free and Reduced Lunch
C. Temporary Assistance for Needy Families (TANF)
D. Census Poor (Children ages 5-17 based on 2000 Census Data)
E. Children eligible to receive medical assistance under the Medicaid program
F. A composite of any of the above measures (explain):
_____ A weighted process has been used as follows:
_____ An unduplicated count has been verified.
PRIVATE SCHOOLS:
A local educational agency shall have the final authority to calculate the number of children who are from low-

2012-2013 Attachment 7
Title I, Part A
21 LEA: ________________________________
income families and attend private schools. According to Title I Guidance B-4, if available, an LEA should use
the same measure of poverty used to count public school children, e.g., free and reduced price lunch data. CHECK (all that apply) the data source(s) listed below that the school system is using to identify private school
participants: (Reg. Sec. 200.78)
X A. Use FARMS to identify low-income students;
B. Use the same poverty data the LEA uses to count public school children;
C. Use comparable poverty data from a survey of families of private school students that, to the extent
possible, protects the families’ identify;
D. Extrapolate data from the survey based on a representative sample if complete actual data are
unavailable
E. Use comparable poverty data from a different source, such as scholarship applications;
F. Apply the low-income percentage of each participating public school attendance area to the number
of private school children who reside in that school attendance area; (proportionality) or
G. Use an equated measure of low-income correlated with the measure of low-income used to count
public school children.
A. DETERMINATION OF ELIGIBLE SCHOOL ATTENDANCE AREAS [Section 1113]
Table 7-2 METHOD OF QUALIFYING ELIGIBLE ATTENDANCE AREAS (TITLE I SCHOOLS)
Section 1113 of Title I contains the requirements for identifying and selecting eligible schools that will participate in
the Title I-A. The following points summarize these requirements:
1. The school system must first rank all of its schools by poverty based on the percentage of low-income
children.
2. After schools have been ranked by poverty, the school system must serve in rank order of poverty, schools
above 75% poverty, including middle and high schools.
3. Only after the school system has served all schools above 75% poverty, may lower-ranked schools be
served. The school system has the option to (a) continue on with the district-wide ranking or (b) rank
remaining schools by grade span groupings.
4. If the school system has no schools above 75% poverty, the system may rank district-wide or by grade
span groupings. For ranking by grade span groupings, the school system may use (a) the district-wide
grade span poverty average noted in Table 7-4, or (b) the district-wide grade span poverty averages for the
respective grade span groupings.
CHECK the appropriate box below to indicate which method the school system is using to qualify attendance areas.
The school system must qualify Title I schools by using percentages or other listed eligible methods.
Percentages -- schools at or above the district-wide average noted in Table 7-2 above. Schools must be
served in rank order of poverty. Title I funds may run out before serving all schools above the district-wide
average. Schools below the district-wide average cannot be served. Complete Table 7-3.
X Grade span grouping/district-wide percentage -- schools with similar grade spans grouped together, and any
school at or above the district-wide percentage in each group is eligible for services. Schools must be served
in rank order of poverty within each grade-span grouping. Complete Tables 7-3 and 4.
35% rule -- all schools at or above 35% are eligible for services. Schools must be served in rank order of
poverty. Title I funds may run out before serving all schools above 35%. Complete Tables 7-3.

2012-2013 Attachment 7
Title I, Part A
22 LEA: ________________________________
Grade-span grouping/35% rule -- schools with similar grade spans grouped together and any school at or
above 35% in each group is eligible for services. Schools must be served in rank order of poverty within each
grade-span grouping. Complete Tables 7-3 and 7-4.
Special Rule: Feeder pattern for middle and high schools. Using this method, a school system may project
the number of low-income children in a middle school or high school based on the average poverty rate of the
elementary school attendance areas that feed into the school. Complete Tables 7-3 and 4.
NOTE REGARDING GRADE-SPAN GROUPING: The same rule must be used for all groups if grade-span grouping
is selected. If there are three grade-span groups, the school system must use the 35% rule for all three or the district-
wide average for all three. The district may not have three groups with one group using the 35% rule and one group
using the district-wide average. Schools above 75% poverty must be served before lower ranked schools.
NOTE: The requirements in ESEA section 1113(a)(3)-(4) and (c)(1) that require an LEA to serve eligible schools
under Title I in rank order of poverty and to allocate Title I, Part A funds based on that rank ordering. The
SEA requested this waiver in order to permit its LEAs to serve a Title I eligible high school with a graduation
rate below 60 percent that the SEA has identified as a priority school even if that school does not rank
sufficiently high to be served. (Complete Table 7-6.2 if applying this rule.)
A. DETERMINATION OF ELIGIBLE SCHOOL ATTENDANCE AREAS [Section 1113]
Table 7-3 DISTRICT-WIDE PERCENTAGE OF LOW-INCOME CHILDREN
The LEA may rank schools using the district-wide poverty average or the district-wide grade span poverty averages
for the respective grade span groupings. Based on the data source(s) noted in Table 7-1, CALCULATE the district-
wide average of low-income children below. Use the official number of students approved for FARM as of
October 31, 2011 to complete this table along with the September 30, 2011 enrollment data. Beginning in SY 2007-2008 Pre-K should be included in these numbers.
____10,523___ Total Number of
Low-Income Children
Attending ALL Public Schools
(October 31, 2011)
_____38,224_____ Total LEA
Student Enrollment
(September 30, 2011)
=
______27.5%______
District-Wide Average
(percentage)
of Low-Income Children
Table 7-4 DISTRICT-WIDE GRADE SPAN POVERTY AVERAGES OF LOW-INCOME
CHILDREN BY GRADE SPAN GROUPINGS (Complete only if using grade span averaging.)
A school system’s organization of its schools defines its grade span groupings. For example, if the district has
elementary schools serving grades Pre-K-5, middle schools serving grades 6-8, and high schools serving grades 9-
12, the grade span groupings would be the same. To the extent a school system has schools that overlap grade spans
(e.g. Pre-K-6, K-8, 6-9) the school system may include a school in the grade span in which it is most appropriate.
Based on the data source(s) noted in Table 7-1 and the district-wide average in Table 7-3, INDICATE below the
district-wide grade span poverty averages for each grade span groupings.
DISTRICT-WIDE GRADE SPAN POVERTY AVERAGE CALCULATIONS
Grade Span
Write Grade Spans in
Spaces Below.
Total Grade Span
Enrollment of Low
Income Students.
÷ Total Grade Span
Enrollment
District-wide grade span
poverty average
Elementary (_________) 5,559 ÷ 17,517 31.7%
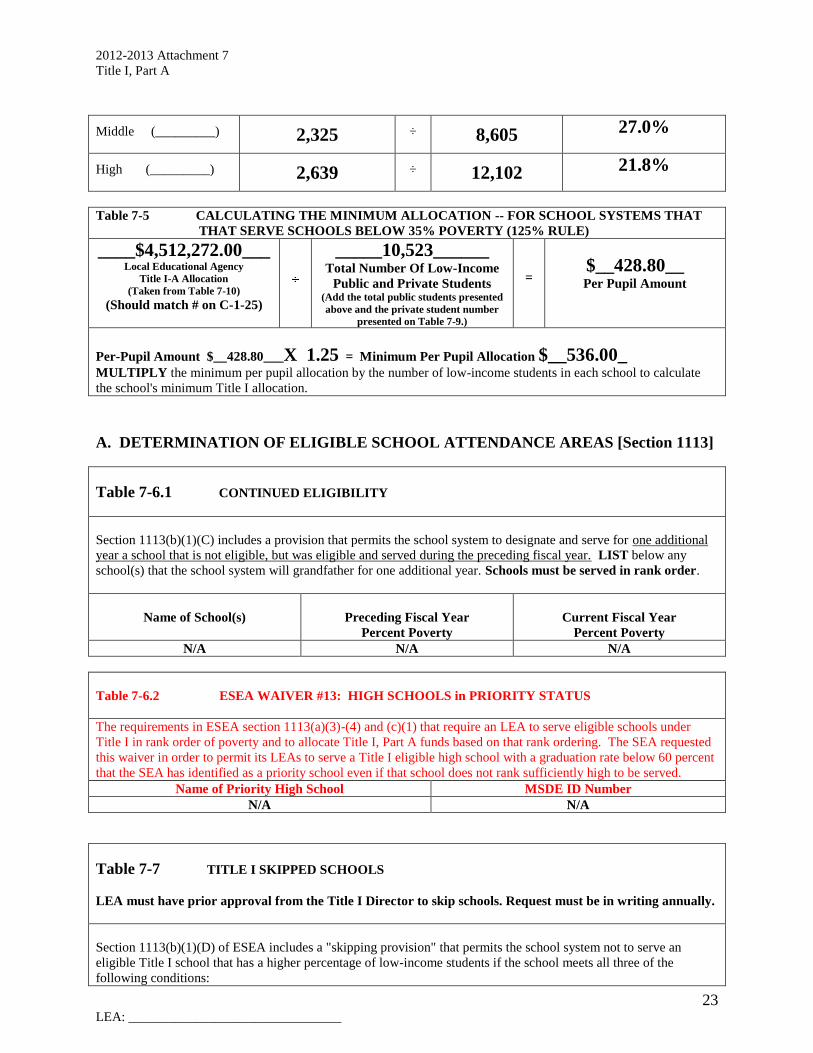
2012-2013 Attachment 7
Title I, Part A
23 LEA: ________________________________
Middle (_________) 2,325 ÷ 8,605 27.0%
High (_________) 2,639 ÷ 12,102 21.8%
Table 7-5 CALCULATING THE MINIMUM ALLOCATION -- FOR SCHOOL SYSTEMS THAT
THAT SERVE SCHOOLS BELOW 35% POVERTY (125% RULE)
____$4,512,272.00___ Local Educational Agency
Title I-A Allocation
(Taken from Table 7-10)
(Should match # on C-1-25)
_____10,523______ Total Number Of Low-Income
Public and Private Students (Add the total public students presented
above and the private student number
presented on Table 7-9.)
=
$__428.80__ Per Pupil Amount
Per-Pupil Amount $__428.80___X 1.25 = Minimum Per Pupil Allocation $__536.00_
MULTIPLY the minimum per pupil allocation by the number of low-income students in each school to calculate
the school's minimum Title I allocation.
A. DETERMINATION OF ELIGIBLE SCHOOL ATTENDANCE AREAS [Section 1113]
Table 7-6.1 CONTINUED ELIGIBILITY
Section 1113(b)(1)(C) includes a provision that permits the school system to designate and serve for one additional
year a school that is not eligible, but was eligible and served during the preceding fiscal year. LIST below any
school(s) that the school system will grandfather for one additional year. Schools must be served in rank order.
Name of School(s)
Preceding Fiscal Year
Percent Poverty
Current Fiscal Year
Percent Poverty
N/A N/A N/A
Table 7-6.2 ESEA WAIVER #13: HIGH SCHOOLS in PRIORITY STATUS
The requirements in ESEA section 1113(a)(3)-(4) and (c)(1) that require an LEA to serve eligible schools under
Title I in rank order of poverty and to allocate Title I, Part A funds based on that rank ordering. The SEA requested
this waiver in order to permit its LEAs to serve a Title I eligible high school with a graduation rate below 60 percent
that the SEA has identified as a priority school even if that school does not rank sufficiently high to be served.
Name of Priority High School MSDE ID Number
N/A N/A
Table 7-7 TITLE I SKIPPED SCHOOLS
LEA must have prior approval from the Title I Director to skip schools. Request must be in writing annually.
Section 1113(b)(1)(D) of ESEA includes a "skipping provision" that permits the school system not to serve an
eligible Title I school that has a higher percentage of low-income students if the school meets all three of the
following conditions:
2012-2013 Attachment 7
Title I, Part A
24 LEA: ________________________________
1. The school meets the comparability requirements of section 1120(A)(c).
2. The school is receiving supplemental funds from other state and local sources that are spent according the
requirements of section 1114 and 1115.
3. The funds expended from these other sources equal or exceed the amount that would be provided by Title I.
Number of Skipped Schools :
0 Note: The completed 2012-2013 Skipped School(s)
Addendum and Skipped School(s) Allocation Worksheet
must be submitted with the Attachment 7 submission.
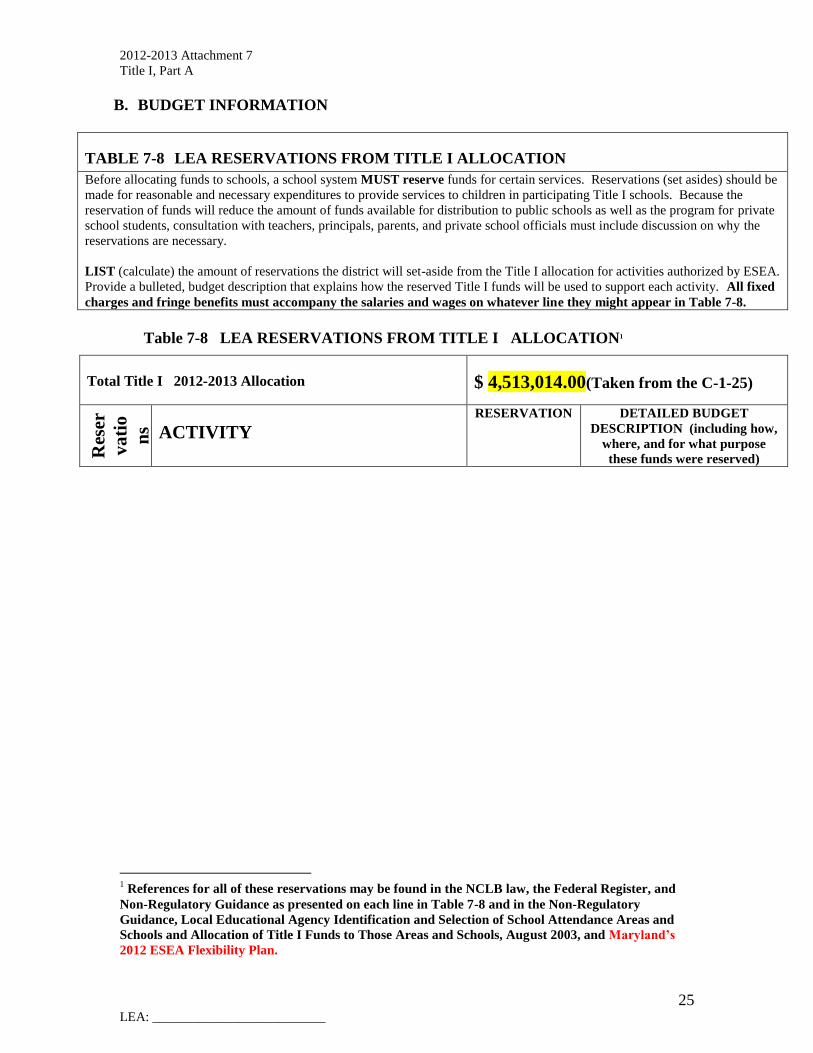
2012-2013 Attachment 7
Title I, Part A
25 LEA: __________________________
B. BUDGET INFORMATION
TABLE 7-8 LEA RESERVATIONS FROM TITLE I ALLOCATION
Before allocating funds to schools, a school system MUST reserve funds for certain services. Reservations (set asides) should be
made for reasonable and necessary expenditures to provide services to children in participating Title I schools. Because the
reservation of funds will reduce the amount of funds available for distribution to public schools as well as the program for private
school students, consultation with teachers, principals, parents, and private school officials must include discussion on why the
reservations are necessary.
LIST (calculate) the amount of reservations the district will set-aside from the Title I allocation for activities authorized by ESEA.
Provide a bulleted, budget description that explains how the reserved Title I funds will be used to support each activity. All fixed
charges and fringe benefits must accompany the salaries and wages on whatever line they might appear in Table 7-8.
Table 7-8 LEA RESERVATIONS FROM TITLE I ALLOCATION1
Total Title I 2012-2013 Allocation
$ 4,513,014.00(Taken from the C-1-25)
Res
er
va
tio
ns
Req
u
irin
g
Eq
uit
ab
le
Ser
vi
ces
for
Non
-
Pu
bli
c
Sch
o
ols
Use
thes
e
nu
mb
er
s in
Ta
ble
7-9
.
ACTIVITY
RESERVATION DETAILED BUDGET
DESCRIPTION (including how,
where, and for what purpose
these funds were reserved)
1 References for all of these reservations may be found in the NCLB law, the Federal Register, and
Non-Regulatory Guidance as presented on each line in Table 7-8 and in the Non-Regulatory
Guidance, Local Educational Agency Identification and Selection of School Attendance Areas and
Schools and Allocation of Title I Funds to Those Areas and Schools, August 2003, and Maryland’s
2012 ESEA Flexibility Plan.
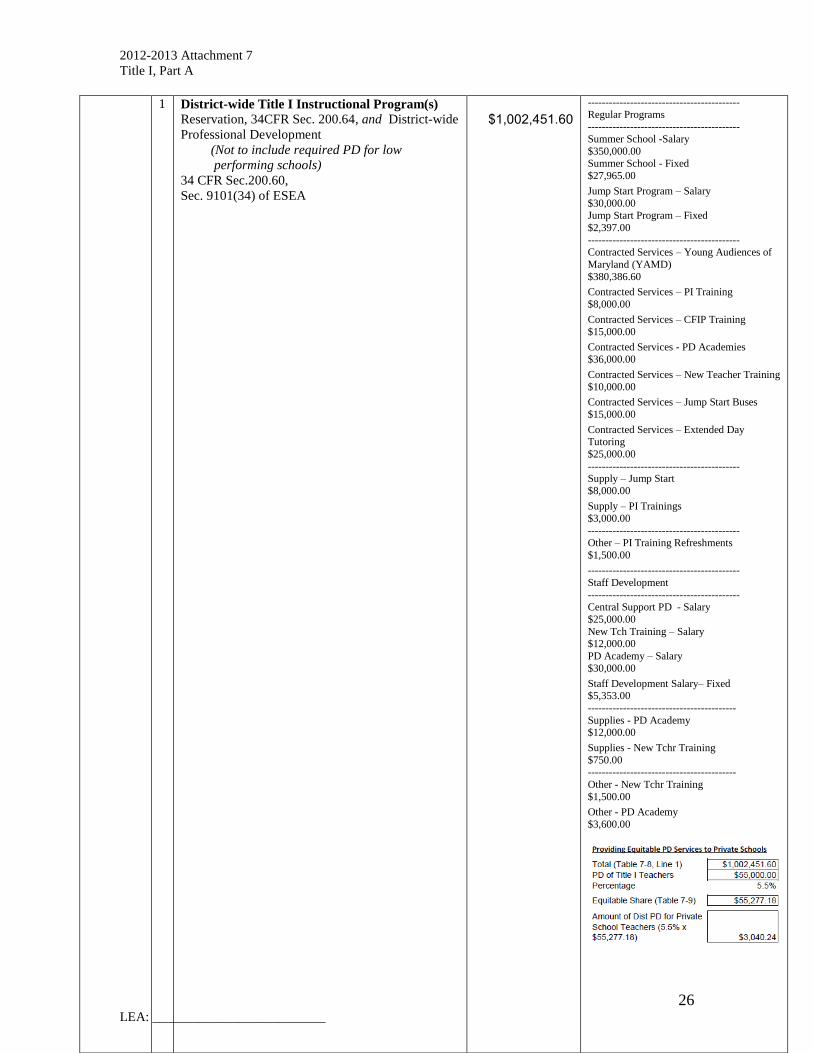
2012-2013 Attachment 7
Title I, Part A
26 LEA: __________________________
1 District-wide Title I Instructional Program(s)
Reservation, 34CFR Sec. 200.64, and District-wide
Professional Development
(Not to include required PD for low
performing schools)
34 CFR Sec.200.60,
Sec. 9101(34) of ESEA
$1,002,451.60
-------------------------------------------
Regular Programs -------------------------------------------
Summer School -Salary
$350,000.00 Summer School - Fixed
$27,965.00
Jump Start Program – Salary
$30,000.00 Jump Start Program – Fixed
$2,397.00
------------------------------------------- Contracted Services – Young Audiences of
Maryland (YAMD)
$380,386.60
Contracted Services – PI Training
$8,000.00
Contracted Services – CFIP Training
$15,000.00
Contracted Services - PD Academies
$36,000.00
Contracted Services – New Teacher Training
$10,000.00
Contracted Services – Jump Start Buses
$15,000.00
Contracted Services – Extended Day Tutoring
$25,000.00
------------------------------------------- Supply – Jump Start
$8,000.00
Supply – PI Trainings
$3,000.00 -------------------------------------------
Other – PI Training Refreshments
$1,500.00
-------------------------------------------
Staff Development
------------------------------------------- Central Support PD - Salary
$25,000.00
New Tch Training – Salary $12,000.00
PD Academy – Salary
$30,000.00
Staff Development Salary– Fixed $5,353.00
------------------------------------------
Supplies - PD Academy $12,000.00
Supplies - New Tchr Training
$750.00 ------------------------------------------
Other - New Tchr Training
$1,500.00
Other - PD Academy
$3,600.00

2012-2013 Attachment 7
Title I, Part A
27 LEA: __________________________
2 Parent Involvement (not less than 1%) Sec. 1118
(a)(3)(A) of ESEA (95% must be distributed to
schools and parent input is required for expenditure)
$90,395.50
- Materials/supplies to support
parent involvement activities in all
Title I schools. Per Pupil
Allocation (PPA): School Poverty
PPA Amount
__________________________
MAES (84.94%) $23,608.01
HXES (77.68%) $17,294.20
WPES (76.02%) $22,872.25
GLES (70.02%) $13,725.29
HDES (69.53%) $12,895.75
3 Professional Development to train teachers to
become highly qualified (not less than 5%) Sec.
1119 (1) If a lesser amount or no monies are
needed, a description as to why should be
provided. Reg. Sec. 200.60 (a) 2 and Non-Regulatory Guidance on Improving Teacher
Quality State Grants, C-6 and Appendix A.
No Longer Applicable, due to NCLB Highly
Qualified Deadline.
4 TOTAL reservations requiring equitable services.
Lines1 & 2 (Present this number in Table 7-10
LINE 2.)
$1,092,847.10
Res
erv
ati
on
s N
ot
Req
uir
ing
Eq
uit
ab
le S
erv
ices
va
tio
ns
No
t R
eq
uir
ing
Eq
uit
ab
le S
erv
ices
5 Administration (including mid-level) for
services to public and private school students and
non-instructional capital expenses for private
school participants
34CFR Sec. 200.77 (f) (Present this number in
Attachment 4-A School System Administration.)
$631,469.28
Title I Supervisor (1.0) $102,914.24
Title I Asst Sup. (1.0) $90,506.00 Title I Coordinator (1.0) $91,411.22
Title I Clerical (1.0) $44,353.76
Contracted Services (private school -admin. fee,
use of copier, survey monkey)
$31,646.63
Supplies
$7,455.35
Other (conferences, journals, mileage,
refreshments) $16,200.00 Equipment
$0.00
Fixed Costs $111,613.92
Indirect Costs $135,368.16

2012-2013 Attachment 7
Title I, Part A
28 LEA: __________________________
6 Support for Priority Schools Not Receiving
Title I 1003(g) SIG funds
MSDE expects the LEA to use all, or a portion
of, the amount of Title I dollars that was
previously required as a set aside for SES and
Parent Choice (20% of its total allocation) to
provide between $50,000 and $2 million per
school per year for the next three years in order
to implement a model or interventions
sufficiently addresses the needs of its priority
schools and students.
[ESEA Flexibility Plan: Principle 2.D.iii]
If an LEA does not use the full 20% reservation
for its priority schools, MSDE expects the LEA
to use the remaining amount to support its Title I
focus schools. Complete line item #7 of
Table 7-8.
[ESEA Flexibility Plan: Principle 2.E.iii]
$0.00
20% of LEA allocation = ______
List the Amount Per Priority School
7 Support for Focus Schools in LEAs Serving
Priority Schools
Note: This line item will only be completed by
LEAs that meet the requirement of line item #6.
$0.00
List the Amount Per Focus School
8 Support to Low Performing Title I Schools
(priority, focus, and Title I schools that have not
met all AMOs)
a. Optional: An LEA with priority, focus
or low performing Title I schools is
highly encouraged to set aside district
level Title I, Part A funds to support low
performing schools through
interventions such as, locally
coordinated supplemental educational
services or after school programs,
technical assistance, and/or professional
development. [Maryland’s Flexibility
Plan: Section 2.D.iii]
b. Optional: Continued Public School
Choice transportation for students who
are attending their choice receiving
schools until the end of the grade span
offered.
$75,593.00
List the Amount per school and describe
the interventions that will be
implemented.
William Paca / Old Post Road ES -
$75,593.00
9 Services to Neglected Children
Sec. 1113(c)(3) (B)(C) of ESEA
Must reserve funds if N & D programs exist.
$0.00

2012-2013 Attachment 7
Title I, Part A
29 LEA: __________________________
10 Services for Homeless Children (must) Sec. 1113(c)(3)(A) of ESEA and Non-Regulatory
Guidance, Education for Homeless Children and
Youth Program, July 2004, M-3.
Note: Please include a description of how the
funds and service plan is coordinated with the
McKinney Vento Homeless Education Act funds.
$6,000.00
In consultation with HCPS Pupil Services Office
and HCPS Title I Office services are coordinated for homeless children through communication of:
1) Identifying student needs; 2) Discussion of
allowable expenses; and 3) Defining appropriate expenditures (McKinney
Vento/Title I). HCPS Pupil Services Office
allocates McKinney Vento funds for use of transportation expenses and supplies/materials for
homeless children.
HCPS Title I Office allocates Title I funds for: Educationally Relates Services $ 1,500
Supplies and Materials $3.000
School Uniforms $ 1,500
11
Total Reservations Not requiring Equitable
Services, lines 5-11
(Use this number in Table 7-10 LINE 4.)
$713,062.28
12 Total of Equitable and Non-Equitable
Reservations minus Administration.
(Present this number in Attachment 4-A
System-wide Program and School System
Support to Schools.) $1,174,440.10
Total Non-Equitable LINE 11 $713,062.28
Plus
Equitable Reservations LINE 4 $1,092,847.10
Equals $1,805,167.38
Minus
Administration – LINE 5 $631,469.28
Equal: $1,174,440.10

2012-2013 Attachment 7
Title I, Part A
30 LEA: __________________________
BUDGET INFORMATION
Table 7-9
COMPLETE the following formulas to identify monies allocated for equitable services to private school participants, their
families, and their teachers (see Section 1120(a) of NCLB and Sec 200.64 & 200.65 in 34CFR.) Monies calculated for
equitable services to private school participants, their families, and their teachers.
District-wide Instructional Program(s) Reservation and District Professional Development
______100______
Total # of private school children from
low-income families including those
going to schools in other LEAs
(Residing in Title I School attendance
area)
(Use the total number reported in
the Title I Allocation Worksheet.)
÷
____1,813.50___
Total # of public school
children from low-income
families (in Title I public
schools) plus private school
children from low-income
families
(Use the total numbers
reported in the Title I
Allocation Worksheet.)
=
__0.0551419906__ Proportion of reservation
____0.0551419906___ Proportion of reservation
x
__$1,002,451.60__ reservation
(Use # from Table 7-8, Line 1)
=
__$55,277.18___ Proportional monies available for
equitable services to private school
participants
i.
Parental Involvement Reservation
_____100____
Total # of private school children from
low-income families including those
going to schools in other LEAs
(Residing in Title I School attendance
area)
(Use the total number reported in
the Title I Allocation Worksheet.)
÷
__1,813.50__
Total # of public school children
from low-income families (in
Title I public schools) plus
private school children from low-
income families
(Use the total numbers
reported in the Title I
Allocation Worksheet.)
=
__0.0551419906__
Proportion of reservation
____0.0551419906___ Proportion of reservation
x
__$90,395.50__ reservation
(Use # from Table 7-8, Line 2)
=
_$4,984.59__
Proportional monies available for
equitable services to parents of
private school participants
TOTAL: proportional funds from reservations for equitable instructional service, professional development and
parent involvement
(Total from Table 7-9 ADD to Table 7-10 LINE 3) Total $ _$60,261.77_
B. Budget Information
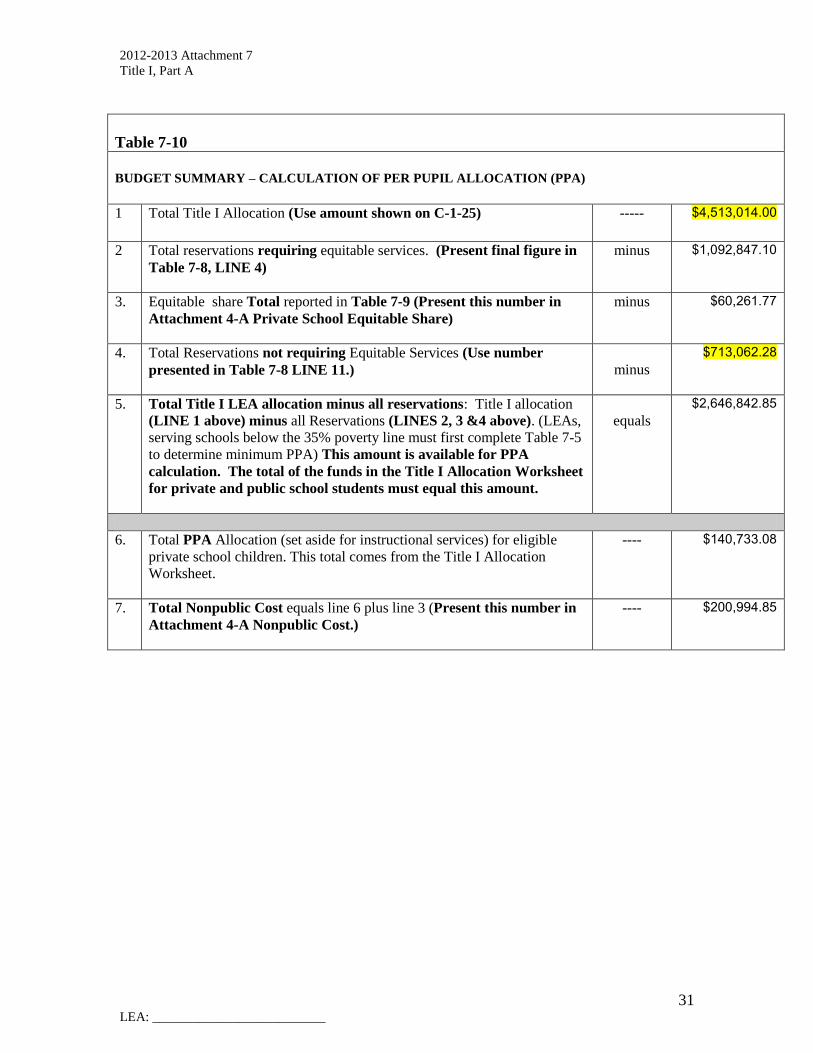
2012-2013 Attachment 7
Title I, Part A
31 LEA: __________________________
Table 7-10
BUDGET SUMMARY – CALCULATION OF PER PUPIL ALLOCATION (PPA)
1 Total Title I Allocation (Use amount shown on C-1-25)
----- $4,513,014.00
2 Total reservations requiring equitable services. (Present final figure in
Table 7-8, LINE 4)
minus $1,092,847.10
3. Equitable share Total reported in Table 7-9 (Present this number in
Attachment 4-A Private School Equitable Share)
minus $60,261.77
4. Total Reservations not requiring Equitable Services (Use number
presented in Table 7-8 LINE 11.)
minus
$713,062.28
5. Total Title I LEA allocation minus all reservations: Title I allocation
(LINE 1 above) minus all Reservations (LINES 2, 3 &4 above). (LEAs,
serving schools below the 35% poverty line must first complete Table 7-5
to determine minimum PPA) This amount is available for PPA
calculation. The total of the funds in the Title I Allocation Worksheet
for private and public school students must equal this amount.
equals
$2,646,842.85
6. Total PPA Allocation (set aside for instructional services) for eligible
private school children. This total comes from the Title I Allocation
Worksheet.
---- $140,733.08
7. Total Nonpublic Cost equals line 6 plus line 3 (Present this number in
Attachment 4-A Nonpublic Cost.)
---- $200,994.85

2012-2013 Attachment 7
Title I, Part A
32 LEA: __________________________
C. PROJECTED CARRYOVER INFORMATION
Table 7-11 ESTIMATE OF TITLE I CARRYOVER (Annually as of September 30)
Section 1127(a) of ESEA permits a school system to carryover not more than 15% of Title I funds from one fiscal
year to the next. The amount of carryover is calculated based on the initial 15-month expenditure period (e.g., July
1, 2011 - September 30, 2012). LEAs have two options for the use of carryover funds: 1) add carryover funds
to the LEA’s subsequent year’s allocation and distribute them to participating areas and schools in
accordance with allocation procedures that ensure equitable participation of non-public school children; 2)
designate carryover funds for particular activities that could best benefit from additional funding. (Non-
Regulatory Guidance, LEA Identification and Selection of School Attendance Areas and Schools and
Allocation of Title I Funds to those Areas and Schools, August 2003, Question 3, page 8.)
1. Total amount of Title I 2011-2012 allocation: $ _3,967,786.00_
2. The estimated amount of Title I funds the school system will carryover: $_522,483.80_
3. Explain why this Carryover may occur.
Title I programs during the first 15 months of grant period came in at a lesser cost than originally estimated.
4. The estimated percentage of carryover Title I funds as of September 30, 2012 _13.2% (THIS IS A
PROJECTION.)
5. Within the past 3 years, has the system been granted a waiver? __X__Yes _____No __2009__Year
LEAs with more than 15% projected carryover must contact their
MSDE point of contact for further instructions.

2012-2013 Attachment 7
Title I, Part A
33 LEA: __________________________
III. BUDGET INFORMATION- SUBMIT THIS INFORMATION AFTER
SECTION II
PROPOSED BUDGET FORM AND NARRATIVE FOR SY 2012-2013
1. COMPLETE a detailed BUDGET on the MSDE Title I, PART A proposed
budget form (C-1-25). The proposed budget must reflect how the funds will
be spent and organized according to the budget objectives. MSDE budget
forms are available through the local finance officer or at the MSDE BRIDGE
TO EXCELLENCE MASTER PLAN web site at:
WWW.MARYLANDPUBLICSCHOOLS.ORG.
2. Provide a detailed budget narrative. The budget narrative should:
a. Detail how the LEA will use Title I, Part A funds to pay only
reasonable and necessary direct administrative costs associated with
the operation of the Title I, Part A program.
i. Include a separate and complete justification for each line item.
ii. Identify each activity.
iii. Include a clear, complete calculation of expenses for each category
and object (identifying the categories and objects with appropriate
codes) including amount paid to each employee (salary or hourly
rate), number and types of positions, fixed charges for each
position.
iv. Show alignment between the project activities and the description
of the program in the Title I Program Description and Reservations
with the C-1-25.
b. Demonstrate the extent to which the budget is reasonable, necessary,
supplemental, allowable, allocable and cost-effective.
c. Sample budget template for the detailed narrative is available on the
Title I web page on www.marylandpublicschools.org
3. Attach the signed required assurance page with the final submission.
4. Attach the allocation worksheets
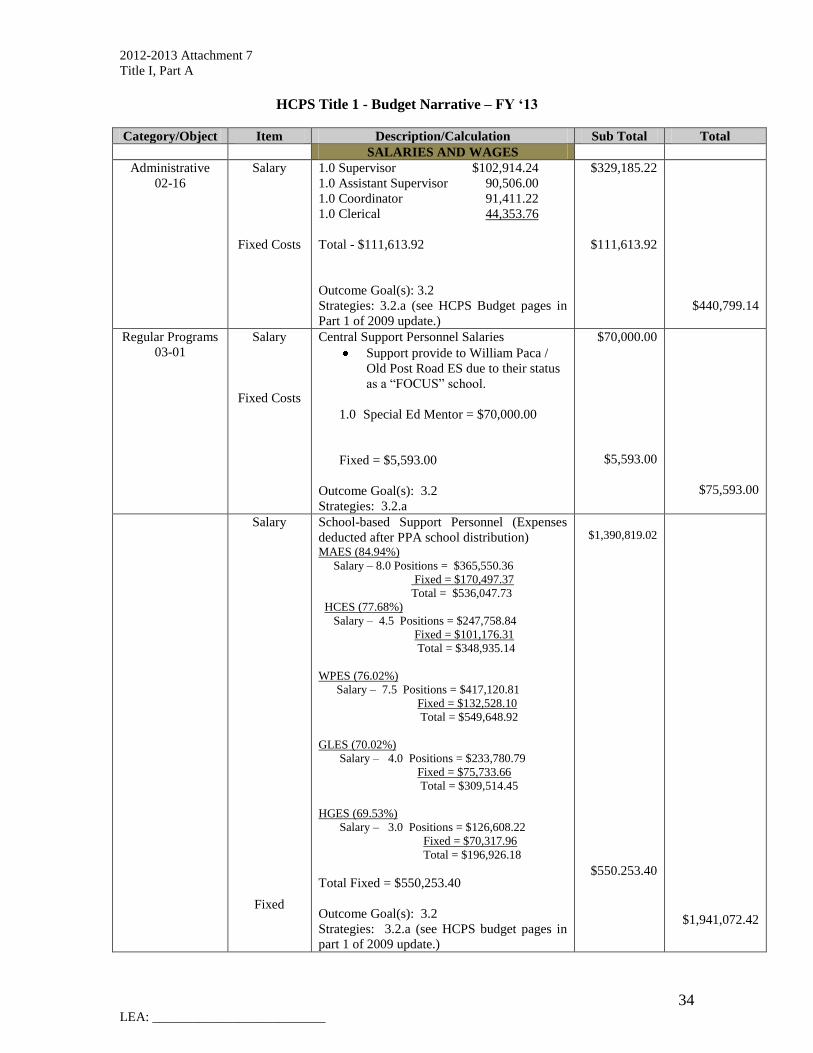
2012-2013 Attachment 7
Title I, Part A
34 LEA: __________________________
HCPS Title 1 - Budget Narrative – FY ‘13
Category/Object Item Description/Calculation Sub Total Total
SALARIES AND WAGES
Administrative
02-16
Salary
Fixed Costs
1.0 Supervisor $102,914.24
1.0 Assistant Supervisor 90,506.00
1.0 Coordinator 91,411.22
1.0 Clerical 44,353.76
Total - $111,613.92
Outcome Goal(s): 3.2
Strategies: 3.2.a (see HCPS Budget pages in
Part 1 of 2009 update.)
$329,185.22
$111,613.92
$440,799.14
Regular Programs
03-01
Salary
Fixed Costs
Central Support Personnel Salaries
Support provide to William Paca /
Old Post Road ES due to their status
as a “FOCUS” school.
1.0 Special Ed Mentor = $70,000.00
Fixed = $5,593.00
Outcome Goal(s): 3.2
Strategies: 3.2.a
$70,000.00
$5,593.00
$75,593.00
Salary
Fixed
School-based Support Personnel (Expenses
deducted after PPA school distribution) MAES (84.94%)
Salary – 8.0 Positions = $365,550.36
Fixed = $170,497.37
Total = $536,047.73
HCES (77.68%)
Salary – 4.5 Positions = $247,758.84
Fixed = $101,176.31
Total = $348,935.14
WPES (76.02%)
Salary – 7.5 Positions = $417,120.81
Fixed = $132,528.10
Total = $549,648.92
GLES (70.02%)
Salary – 4.0 Positions = $233,780.79
Fixed = $75,733.66
Total = $309,514.45
HGES (69.53%)
Salary – 3.0 Positions = $126,608.22
Fixed = $70,317.96
Total = $196,926.18
Total Fixed = $550,253.40
Outcome Goal(s): 3.2
Strategies: 3.2.a (see HCPS budget pages in
part 1 of 2009 update.)
$1,390,819.02
$550.253.40
$1,941,072.42
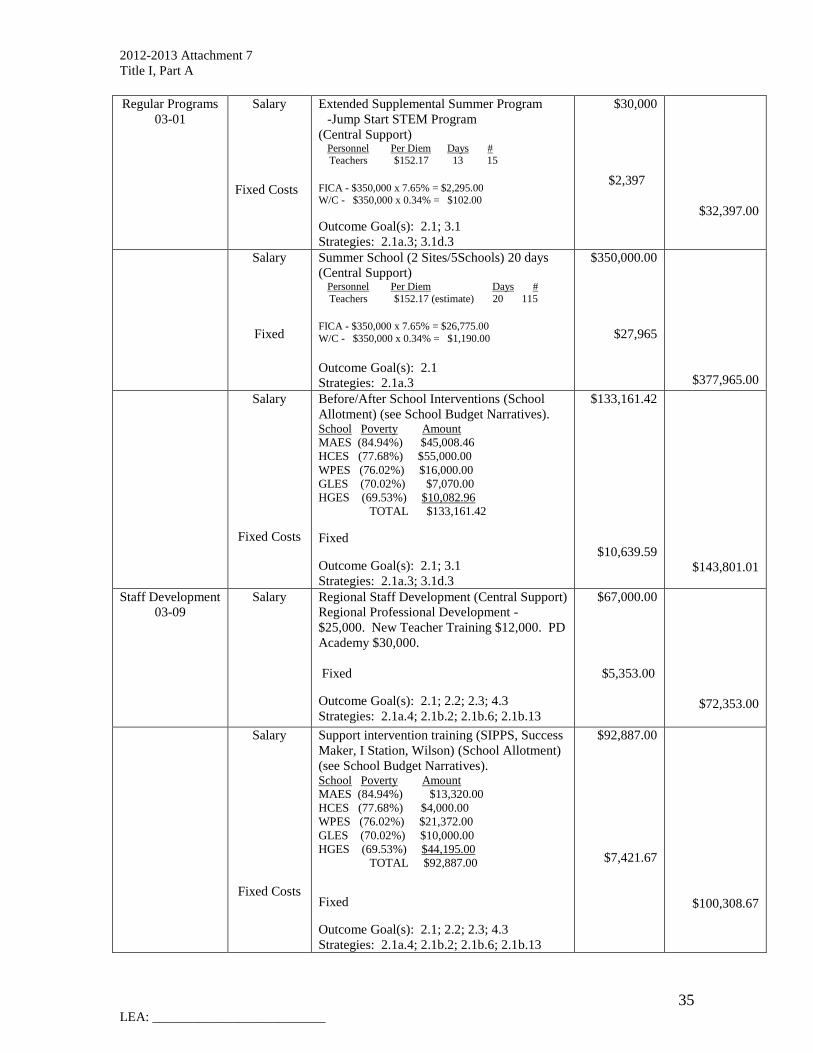
2012-2013 Attachment 7
Title I, Part A
35 LEA: __________________________
Regular Programs
03-01
Salary
Fixed Costs
Extended Supplemental Summer Program
-Jump Start STEM Program
(Central Support) Personnel Per Diem Days # Teachers $152.17 13 15
FICA - $350,000 x 7.65% = $2,295.00 W/C - $350,000 x 0.34% = $102.00
Outcome Goal(s): 2.1; 3.1
Strategies: 2.1a.3; 3.1d.3
$30,000
$2,397
$32,397.00
Salary
Fixed
Summer School (2 Sites/5Schools) 20 days
(Central Support) Personnel Per Diem Days #
Teachers $152.17 (estimate) 20 115
FICA - $350,000 x 7.65% = $26,775.00
W/C - $350,000 x 0.34% = $1,190.00
Outcome Goal(s): 2.1
Strategies: 2.1a.3
$350,000.00
$27,965
$377,965.00
Salary
Fixed Costs
Before/After School Interventions (School
Allotment) (see School Budget Narratives). School Poverty Amount
MAES (84.94%) $45,008.46
HCES (77.68%) $55,000.00
WPES (76.02%) $16,000.00
GLES (70.02%) $7,070.00
HGES (69.53%) $10,082.96
TOTAL $133,161.42
Fixed
Outcome Goal(s): 2.1; 3.1
Strategies: 2.1a.3; 3.1d.3
$133,161.42
$10,639.59
$143,801.01
Staff Development
03-09
Salary
Regional Staff Development (Central Support)
Regional Professional Development -
$25,000. New Teacher Training $12,000. PD
Academy $30,000.
Fixed
Outcome Goal(s): 2.1; 2.2; 2.3; 4.3
Strategies: 2.1a.4; 2.1b.2; 2.1b.6; 2.1b.13
$67,000.00
$5,353.00
$72,353.00
Salary
Fixed Costs
Support intervention training (SIPPS, Success
Maker, I Station, Wilson) (School Allotment)
(see School Budget Narratives). School Poverty Amount
MAES (84.94%) $13,320.00
HCES (77.68%) $4,000.00
WPES (76.02%) $21,372.00
GLES (70.02%) $10,000.00
HGES (69.53%) $44,195.00
TOTAL $92,887.00
Fixed
Outcome Goal(s): 2.1; 2.2; 2.3; 4.3
Strategies: 2.1a.4; 2.1b.2; 2.1b.6; 2.1b.13
$92,887.00
$7,421.67
$100,308.67
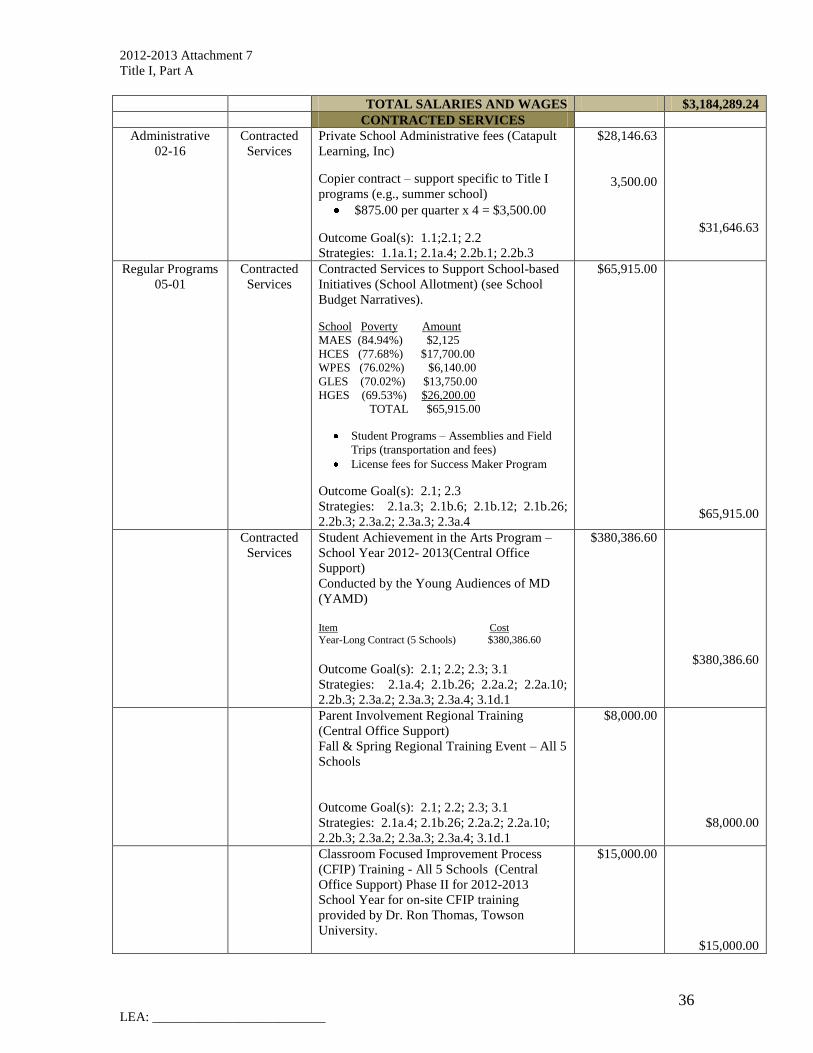
2012-2013 Attachment 7
Title I, Part A
36 LEA: __________________________
TOTAL SALARIES AND WAGES $3,184,289.24
CONTRACTED SERVICES
Administrative
02-16
Contracted
Services
Private School Administrative fees (Catapult
Learning, Inc)
Copier contract – support specific to Title I
programs (e.g., summer school)
$875.00 per quarter x 4 = $3,500.00
Outcome Goal(s): 1.1;2.1; 2.2
Strategies: 1.1a.1; 2.1a.4; 2.2b.1; 2.2b.3
$28,146.63
3,500.00
$31,646.63
Regular Programs
05-01
Contracted
Services
Contracted Services to Support School-based
Initiatives (School Allotment) (see School
Budget Narratives).
School Poverty Amount
MAES (84.94%) $2,125
HCES (77.68%) $17,700.00
WPES (76.02%) $6,140.00
GLES (70.02%) $13,750.00
HGES (69.53%) $26,200.00
TOTAL $65,915.00
Student Programs – Assemblies and Field
Trips (transportation and fees)
License fees for Success Maker Program
Outcome Goal(s): 2.1; 2.3
Strategies: 2.1a.3; 2.1b.6; 2.1b.12; 2.1b.26;
2.2b.3; 2.3a.2; 2.3a.3; 2.3a.4
$65,915.00
$65,915.00
Contracted
Services
Student Achievement in the Arts Program –
School Year 2012- 2013(Central Office
Support)
Conducted by the Young Audiences of MD
(YAMD)
Item Cost Year-Long Contract (5 Schools) $380,386.60
Outcome Goal(s): 2.1; 2.2; 2.3; 3.1
Strategies: 2.1a.4; 2.1b.26; 2.2a.2; 2.2a.10;
2.2b.3; 2.3a.2; 2.3a.3; 2.3a.4; 3.1d.1
$380,386.60
$380,386.60
Parent Involvement Regional Training
(Central Office Support)
Fall & Spring Regional Training Event – All 5
Schools
Outcome Goal(s): 2.1; 2.2; 2.3; 3.1
Strategies: 2.1a.4; 2.1b.26; 2.2a.2; 2.2a.10;
2.2b.3; 2.3a.2; 2.3a.3; 2.3a.4; 3.1d.1
$8,000.00
$8,000.00
Classroom Focused Improvement Process
(CFIP) Training - All 5 Schools (Central
Office Support) Phase II for 2012-2013
School Year for on-site CFIP training
provided by Dr. Ron Thomas, Towson
University.
$15,000.00
$15,000.00
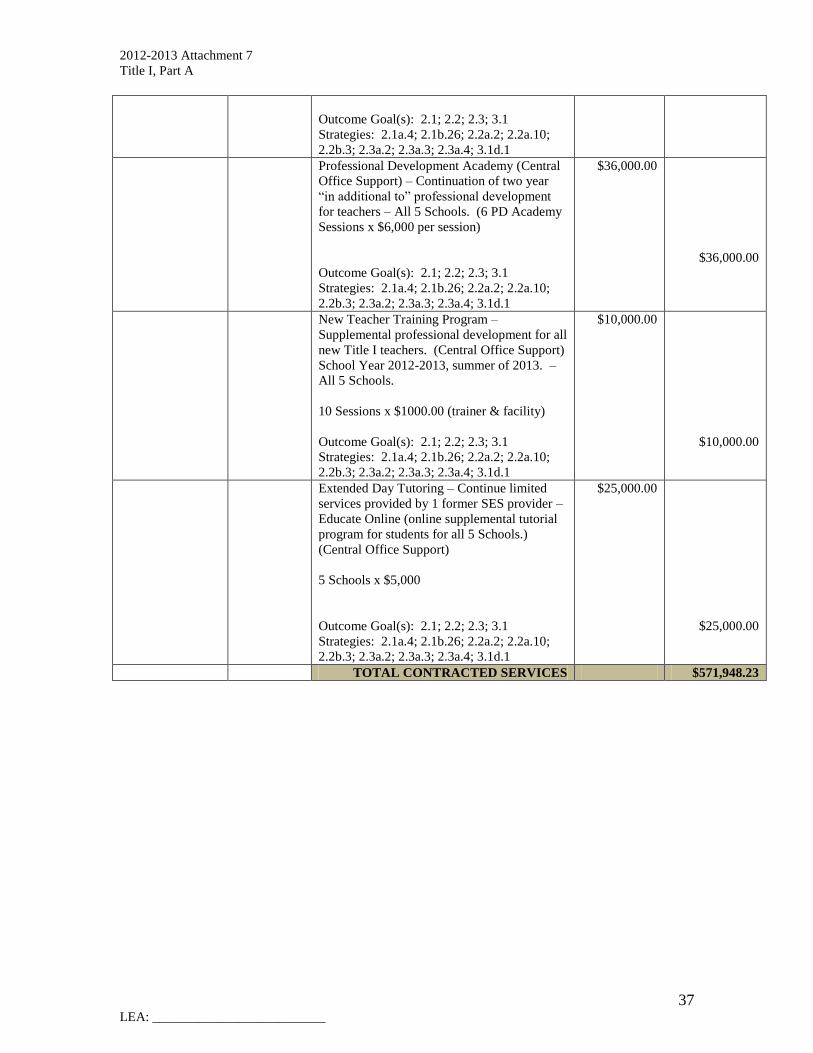
2012-2013 Attachment 7
Title I, Part A
37 LEA: __________________________
Outcome Goal(s): 2.1; 2.2; 2.3; 3.1
Strategies: 2.1a.4; 2.1b.26; 2.2a.2; 2.2a.10;
2.2b.3; 2.3a.2; 2.3a.3; 2.3a.4; 3.1d.1
Professional Development Academy (Central
Office Support) – Continuation of two year
“in additional to” professional development
for teachers – All 5 Schools. (6 PD Academy
Sessions x $6,000 per session)
Outcome Goal(s): 2.1; 2.2; 2.3; 3.1
Strategies: 2.1a.4; 2.1b.26; 2.2a.2; 2.2a.10;
2.2b.3; 2.3a.2; 2.3a.3; 2.3a.4; 3.1d.1
$36,000.00
$36,000.00
New Teacher Training Program –
Supplemental professional development for all
new Title I teachers. (Central Office Support)
School Year 2012-2013, summer of 2013. –
All 5 Schools.
10 Sessions x $1000.00 (trainer & facility)
Outcome Goal(s): 2.1; 2.2; 2.3; 3.1
Strategies: 2.1a.4; 2.1b.26; 2.2a.2; 2.2a.10;
2.2b.3; 2.3a.2; 2.3a.3; 2.3a.4; 3.1d.1
$10,000.00
$10,000.00
Extended Day Tutoring – Continue limited
services provided by 1 former SES provider –
Educate Online (online supplemental tutorial
program for students for all 5 Schools.)
(Central Office Support)
5 Schools x $5,000
Outcome Goal(s): 2.1; 2.2; 2.3; 3.1
Strategies: 2.1a.4; 2.1b.26; 2.2a.2; 2.2a.10;
2.2b.3; 2.3a.2; 2.3a.3; 2.3a.4; 3.1d.1
$25,000.00
$25,000.00
TOTAL CONTRACTED SERVICES $571,948.23

2012-2013 Attachment 7
Title I, Part A
38 LEA: __________________________
SUPPLIES
Administrative
02-16
Supplies Central Office Supplies/Materials to support
data collection/evaluation of student academic
program in Reading/Math in 5 Title I schools .
Outcome Goal(s): 2.1; 2.2; 2.3; 3.1
Strategies: 2.1a.4; 2.1b.26; 2.2a.2; 2.2a.10;
2.2b.3; 2.3a.2; 2.3a.3; 2.3a.4; 3.1d.1
$7,455.35
$7,455.35
Regular Programs
04-01
Supplies
Parent Involvement Funds (Required
Reservation 1% (plus an additional 1%) -
Based on PPA). Other items to support Parent
Involvement activities in 5 schools (School
Allotment) (see School Budget Narratives). School Poverty Amount
MAES (84.94%) $21,108.01
HCES (77.68%) $7,000.00
WPES (76.02%) $5,275.00
GLES (70.02%) $6,925.29
HGES (69.53%) $5,500.00
TOTAL $45,808.30
Parent resource rooms
Materials for correspondence to parents
Pamphlets/Posters to communicate
educational events to parents
Postage for parent communication
Outcome Goal(s): 2.1; 4.3; 2.2; 2.3
Strategies: 2.1a.3; 2.1a.4; 2.1b.2; 2.1b.6;
2.1b.15; 2.1b.16; 2.1b.26; 2.2a.2; 2.2a.10;
2.2b.1; 2.2b.3; 2.3a.2; 2.3a.3; 2.3a.4; 4.3c.5;
4.3c.6; 4.3c.8
$45,808.30
$45,808.30
Support of Title I initiatives at school level
(School Allotment) (see School Budget
Narratives). School Poverty Amount
MAES (84.94%) $5,728.89
HCES (77.68%) $17,998.60
WPES (76.02%) $24,278.76
GLES (70.02%) $13,003.05
HGES (69.53%) $41,700.00
TOTAL $102,709.30
Supplemental materials for 4 Block
Reading, SIPPS, Math Initiatives,
Classroom Learning Systems and other
classroom support.
Supplemental materials for Before/After
School Interventions
Outcome Goal(s): 2.1; 4.3; 2.2; 2.3
Strategies: 2.1a.3; 2.1a.4; 2.1b.2; 2.1b.6;
2.1b.15; 2.1b.16; 2.1b.26; 2.2a.2; 2.2a.10;
2.2b.1; 2.2b.3; 2.3a.2; 2.3a.3; 2.3a.4; 4.3c.5;
4.3c.6; 4.3c.8
$102,709.30
$102,709.30

2012-2013 Attachment 7
Title I, Part A
39 LEA: __________________________
Jump Start STEM program
Support for Instructional Supplies and
Materials (Central Office Support) – All 5
Schools
Outcome Goal(s): 2.1; 4.3; 2.2; 2.3
Strategies: 2.1a.3; 2.1a.4; 2.1b.2; 2.1b.6;
2.1b.15; 2.1b.16; 2.1b.26; 2.2a.2; 2.2a.10;
2.2b.1; 2.2b.3; 2.3a.2; 2.3a.3; 2.3a.4; 4.3c.5;
4.3c.6; 4.3c.8
$8,000.00
$8,000.00
Parent Involvement Regional Training -
(Books & Materials for 2 sessions) (Central
Office Support)
Outcome Goal(s): 2.1; 4.3; 2.2; 2.3
Strategies: 2.1a.3; 2.1a.4; 2.1b.2; 2.1b.6;
2.1b.15; 2.1b.16; 2.1b.26; 2.2a.2; 2.2a.10;
2.2b.1; 2.2b.3; 2.3a.2; 2.3a.3; 2.3a.4; 4.3c.5;
4.3c.6; 4.3c.8
$3,000.00
$3,000.00
Homeless
Students -
Regular Programs
04-01
Required
Reservation
(Supplies)
In consultation with HCPS Pupil Services
Office and HCPS Title I Office services are
coordinated for homeless children through
communication of:
1) Identifying student needs; 2) Discussion of
allowable expenses; and
3) Defining appropriate expenditures
(McKinney Vento/Title I). HCPS Pupil
Services Office allocates McKinney Vento
funds for use of transportation expenses and
supplies/materials for homeless children.
HCPS Title I Office allocates Title I funds for:
Educationally Relates Services $ 1,500
Supplies and Materials $3.000
School Uniforms $ 1,500
Outcome Goal(s): 1.1
Strategies: 1.1e.4
$6,000.00
$6,000.00
Staff Development
04-09
Supplies Professional Development Academy –
Continuation of two year “in additional to”
professional development for teachers – All 5
Schools. (6 PD Academy Sessions x $2,000
per session – books & materials)
(Central Office Support)
Outcome Goal(s): 2.1; 4.3
Strategies: 2.1a4; 2.1b.2; 2.1b.6; 2.1b.13
$12,000.00
$12,000.00
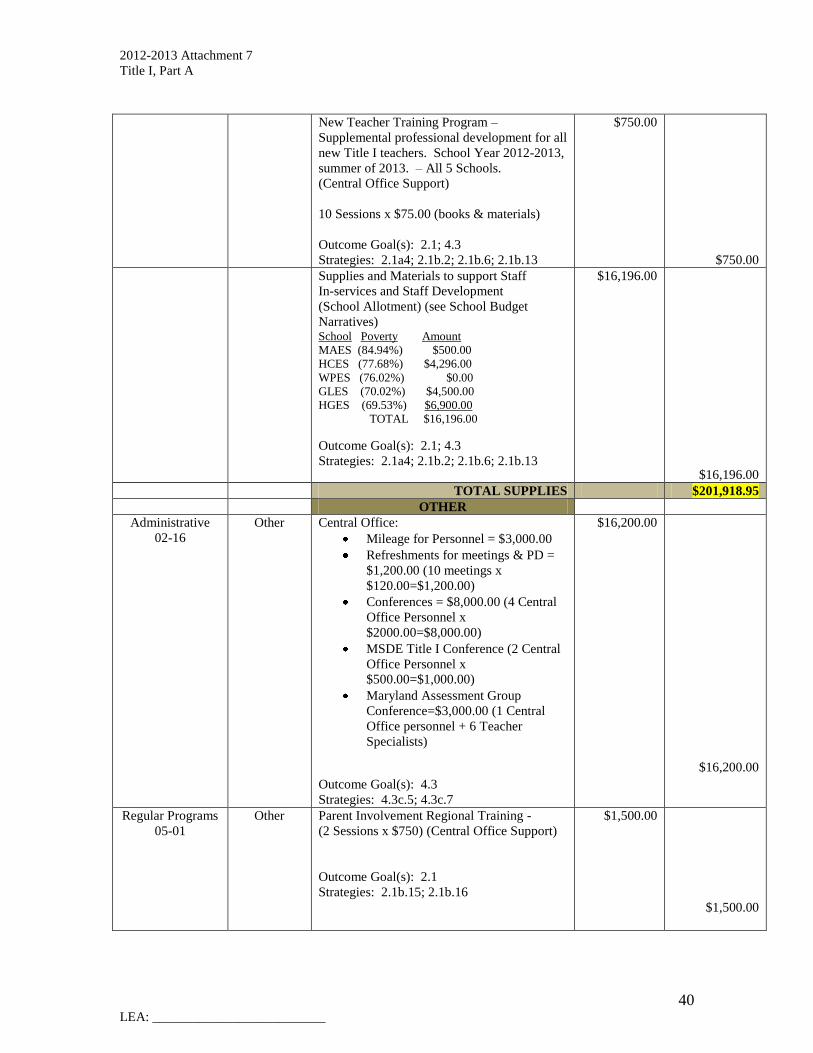
2012-2013 Attachment 7
Title I, Part A
40 LEA: __________________________
New Teacher Training Program –
Supplemental professional development for all
new Title I teachers. School Year 2012-2013,
summer of 2013. – All 5 Schools.
(Central Office Support)
10 Sessions x $75.00 (books & materials)
Outcome Goal(s): 2.1; 4.3
Strategies: 2.1a4; 2.1b.2; 2.1b.6; 2.1b.13
$750.00
$750.00
Supplies and Materials to support Staff
In-services and Staff Development
(School Allotment) (see School Budget
Narratives) School Poverty Amount
MAES (84.94%) $500.00
HCES (77.68%) $4,296.00
WPES (76.02%) $0.00
GLES (70.02%) $4,500.00
HGES (69.53%) $6,900.00
TOTAL $16,196.00
Outcome Goal(s): 2.1; 4.3
Strategies: 2.1a4; 2.1b.2; 2.1b.6; 2.1b.13
$16,196.00
$16,196.00
TOTAL SUPPLIES $201,918.95
OTHER
Administrative
02-16
Other Central Office:
Mileage for Personnel = $3,000.00
Refreshments for meetings & PD =
$1,200.00 (10 meetings x
$120.00=$1,200.00)
Conferences = $8,000.00 (4 Central
Office Personnel x
$2000.00=$8,000.00)
MSDE Title I Conference (2 Central
Office Personnel x
$500.00=$1,000.00)
Maryland Assessment Group
Conference=$3,000.00 (1 Central
Office personnel + 6 Teacher
Specialists)
Outcome Goal(s): 4.3
Strategies: 4.3c.5; 4.3c.7
$16,200.00
$16,200.00
Regular Programs
05-01
Other Parent Involvement Regional Training -
(2 Sessions x $750) (Central Office Support)
Outcome Goal(s): 2.1
Strategies: 2.1b.15; 2.1b.16
$1,500.00
$1,500.00

2012-2013 Attachment 7
Title I, Part A
41 LEA: __________________________
Parent Involvement Funds (Required
Reservation 1% (plus an additional 1%) -
Based on PPA). Other items to support Parent
Involvement activities in 5 schools (School
Allotment) (see School Budget Narratives). School Poverty Amount
MAES (84.94%) $2,500.00
HCES (77.68%) $10,294.20
WPES (76.02%) $17,597.25
GLES (70.02%) $6,800.00
HGES (69.53%) $7,395.75
TOTAL $44,587.20
Refreshments
Parent transportation to school
activities (need based)
Parent admission to field trip events
(need based)
Supplies for parent activities
Outcome Goal(s): 2.1
Strategies: 2.1b.15; 2.1b.16
$44,587.20
$44,587.20
School-based Support of Instructional
Programs/Activities (student, parent and
community focus) (School Allotment) (see
School Budget Narratives) School Poverty Amount
MAES (84.94%) $5,000.00
HCES (77.68%) $9,000.00
WPES (76.02%) $6,048.00
GLES (70.02%) $0.00
HGES (69.53%) $17,500.00
TOTAL $37,548.00
Refreshments for instructional activities
Professional Travel
Institutes and conferences
Student incentives
Outcome Goal(s): 2.1
Strategies: 2.1b.15; 2.1b.16
$37,548.00
$37,548.00
Staff Development
05-09
Other Support Professional Development (All 5
Schools - Central Office Support)
New Teacher Summer Training food
and refreshments = $1,500.00 (3 day
event; in addition to Harford County
Public Schools New Teacher training;
approximately 20 participants.)
PD Academy food and refreshments =
$3,600.00 ($600.00 per session x 6
sessions = $3,600.00)
Outcome Goal(s): 2.1; 4.3; 2.2
Strategies: 2.1a.4; 2.1b.2; 2.1b.6; 2.1b.15;
2.1b.16; 2.1b.26; 4.3c.5; 4.3c.6; 4.3c.7;
2.2b.1
$5,100.00
$5,100.00
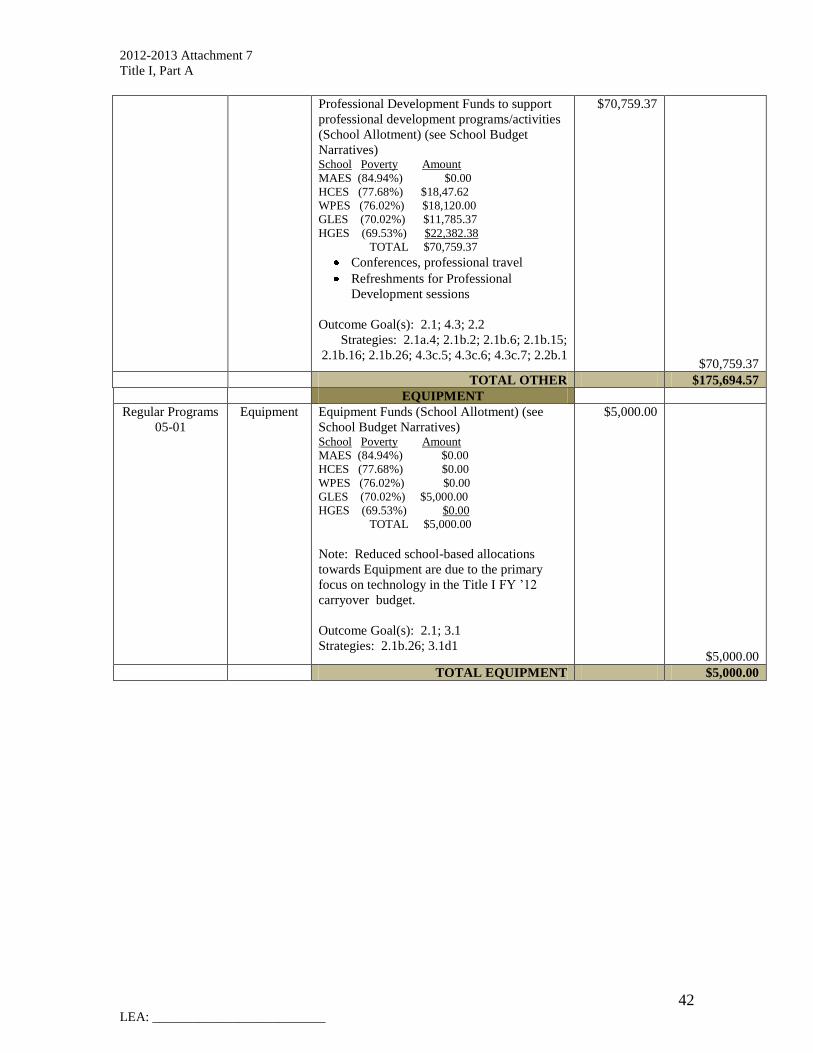
2012-2013 Attachment 7
Title I, Part A
42 LEA: __________________________
Professional Development Funds to support
professional development programs/activities
(School Allotment) (see School Budget
Narratives) School Poverty Amount
MAES (84.94%) $0.00
HCES (77.68%) $18,47.62
WPES (76.02%) $18,120.00
GLES (70.02%) $11,785.37
HGES (69.53%) $22,382.38
TOTAL $70,759.37
Conferences, professional travel
Refreshments for Professional
Development sessions
Outcome Goal(s): 2.1; 4.3; 2.2
Strategies: 2.1a.4; 2.1b.2; 2.1b.6; 2.1b.15;
2.1b.16; 2.1b.26; 4.3c.5; 4.3c.6; 4.3c.7; 2.2b.1
$70,759.37
$70,759.37
TOTAL OTHER $175,694.57
EQUIPMENT
Regular Programs
05-01
Equipment Equipment Funds (School Allotment) (see
School Budget Narratives) School Poverty Amount
MAES (84.94%) $0.00
HCES (77.68%) $0.00
WPES (76.02%) $0.00
GLES (70.02%) $5,000.00
HGES (69.53%) $0.00
TOTAL $5,000.00
Note: Reduced school-based allocations
towards Equipment are due to the primary
focus on technology in the Title I FY ’12
carryover budget.
Outcome Goal(s): 2.1; 3.1
Strategies: 2.1b.26; 3.1d1
$5,000.00
$5,000.00
TOTAL EQUIPMENT $5,000.00
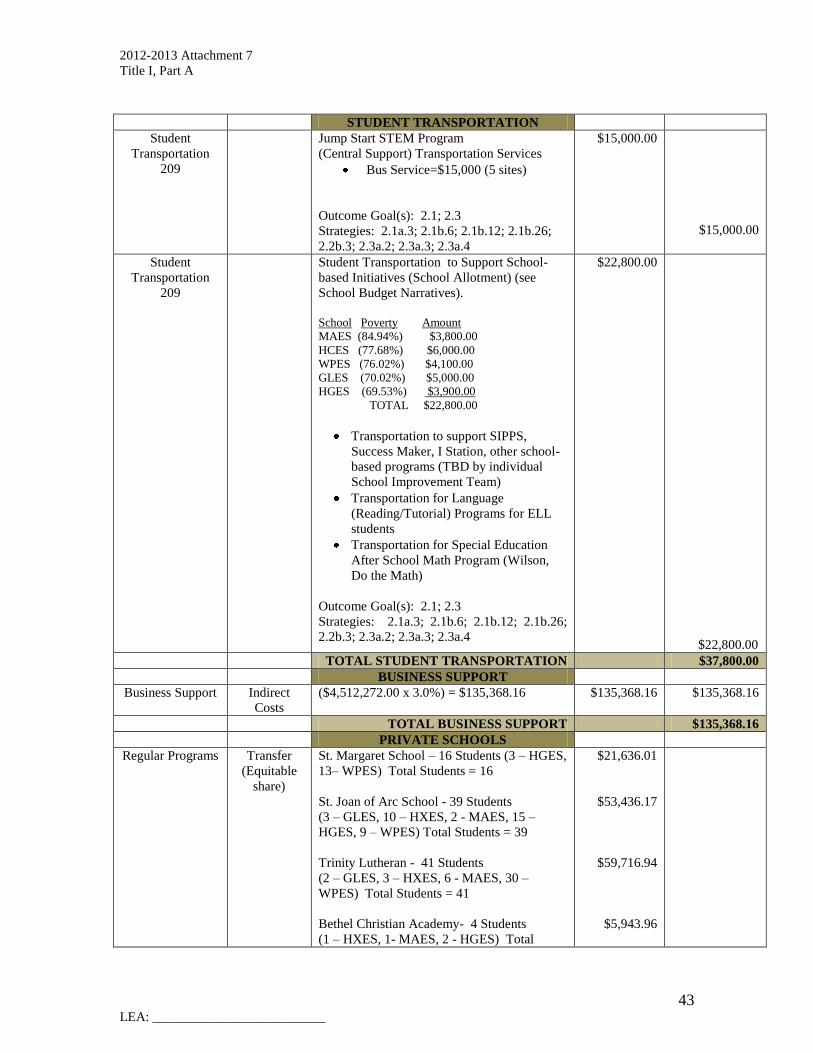
2012-2013 Attachment 7
Title I, Part A
43 LEA: __________________________
STUDENT TRANSPORTATION
Student
Transportation
209
Jump Start STEM Program
(Central Support) Transportation Services
Bus Service=$15,000 (5 sites)
Outcome Goal(s): 2.1; 2.3
Strategies: 2.1a.3; 2.1b.6; 2.1b.12; 2.1b.26;
2.2b.3; 2.3a.2; 2.3a.3; 2.3a.4
$15,000.00
$15,000.00
Student
Transportation
209
Student Transportation to Support School-
based Initiatives (School Allotment) (see
School Budget Narratives).
School Poverty Amount
MAES (84.94%) $3,800.00
HCES (77.68%) $6,000.00
WPES (76.02%) $4,100.00
GLES (70.02%) $5,000.00
HGES (69.53%) $3,900.00
TOTAL $22,800.00
Transportation to support SIPPS,
Success Maker, I Station, other school-
based programs (TBD by individual
School Improvement Team)
Transportation for Language
(Reading/Tutorial) Programs for ELL
students
Transportation for Special Education
After School Math Program (Wilson,
Do the Math)
Outcome Goal(s): 2.1; 2.3
Strategies: 2.1a.3; 2.1b.6; 2.1b.12; 2.1b.26;
2.2b.3; 2.3a.2; 2.3a.3; 2.3a.4
$22,800.00
$22,800.00
TOTAL STUDENT TRANSPORTATION $37,800.00
BUSINESS SUPPORT
Business Support Indirect
Costs
($4,512,272.00 x 3.0%) = $135,368.16
$135,368.16 $135,368.16
TOTAL BUSINESS SUPPORT $135,368.16
PRIVATE SCHOOLS
Regular Programs Transfer
(Equitable
share)
St. Margaret School – 16 Students (3 – HGES,
13– WPES) Total Students = 16
St. Joan of Arc School - 39 Students
(3 – GLES, 10 – HXES, 2 - MAES, 15 –
HGES, 9 – WPES) Total Students = 39
Trinity Lutheran - 41 Students
(2 – GLES, 3 – HXES, 6 - MAES, 30 –
WPES) Total Students = 41
Bethel Christian Academy- 4 Students
(1 – HXES, 1- MAES, 2 - HGES) Total
$21,636.01
$53,436.17
$59,716.94
$5,943.96

2012-2013 Attachment 7
Title I, Part A
44 LEA: __________________________
Students = 4
District-wide Instructional Program(s)
Reservation (Equitable Share)
Parent Involvement (Equitable Share)
Outcome Goal(s): 2.1; 4.3; 2.2
Strategies: 2.1b.15; 1.1b.16; 2.2a.2; 4.3c.5
$55,277.18
$4,984.59
$200,994.85
TOTAL PRIVATE SCHOOLS $200,994.85
GRAND TOTAL
$4,513,014.00
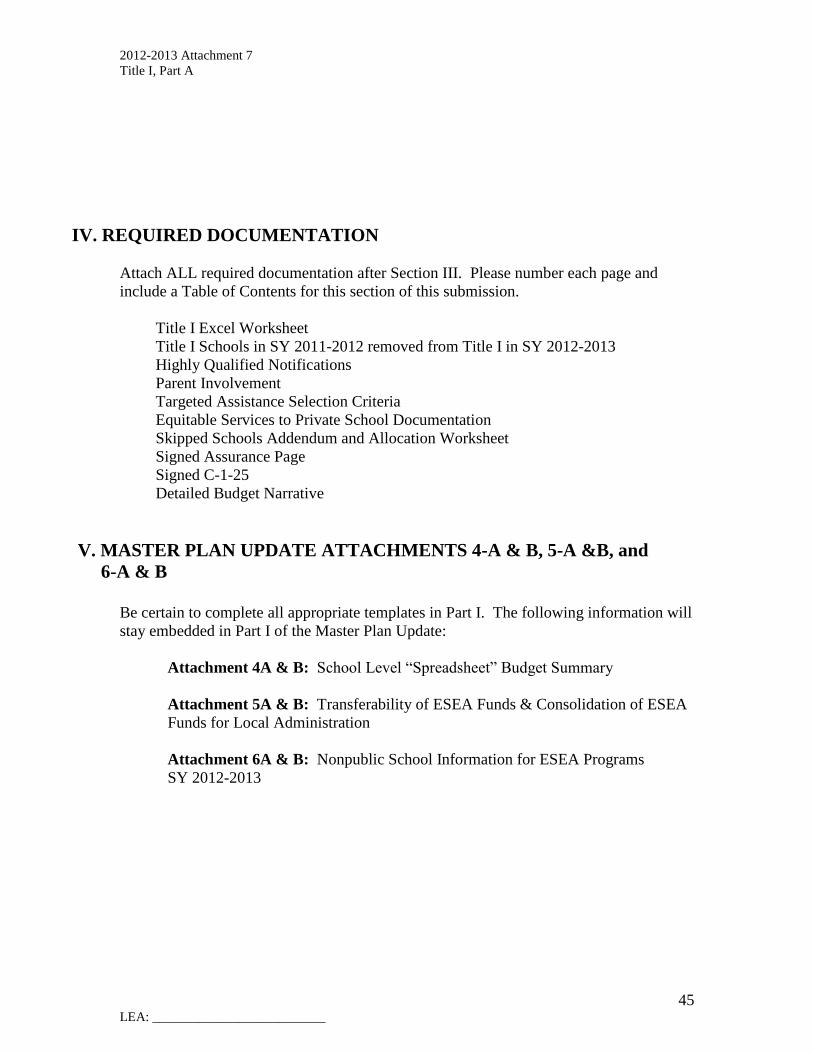
2012-2013 Attachment 7
Title I, Part A
45 LEA: __________________________
IV. REQUIRED DOCUMENTATION
Attach ALL required documentation after Section III. Please number each page and
include a Table of Contents for this section of this submission.
Title I Excel Worksheet
Title I Schools in SY 2011-2012 removed from Title I in SY 2012-2013
Highly Qualified Notifications
Parent Involvement
Targeted Assistance Selection Criteria
Equitable Services to Private School Documentation
Skipped Schools Addendum and Allocation Worksheet
Signed Assurance Page
Signed C-1-25
Detailed Budget Narrative
V. MASTER PLAN UPDATE ATTACHMENTS 4-A & B, 5-A &B, and
6-A & B
Be certain to complete all appropriate templates in Part I. The following information will
stay embedded in Part I of the Master Plan Update:
Attachment 4A & B: School Level “Spreadsheet” Budget Summary
Attachment 5A & B: Transferability of ESEA Funds & Consolidation of ESEA
Funds for Local Administration
Attachment 6A & B: Nonpublic School Information for ESEA Programs
SY 2012-2013
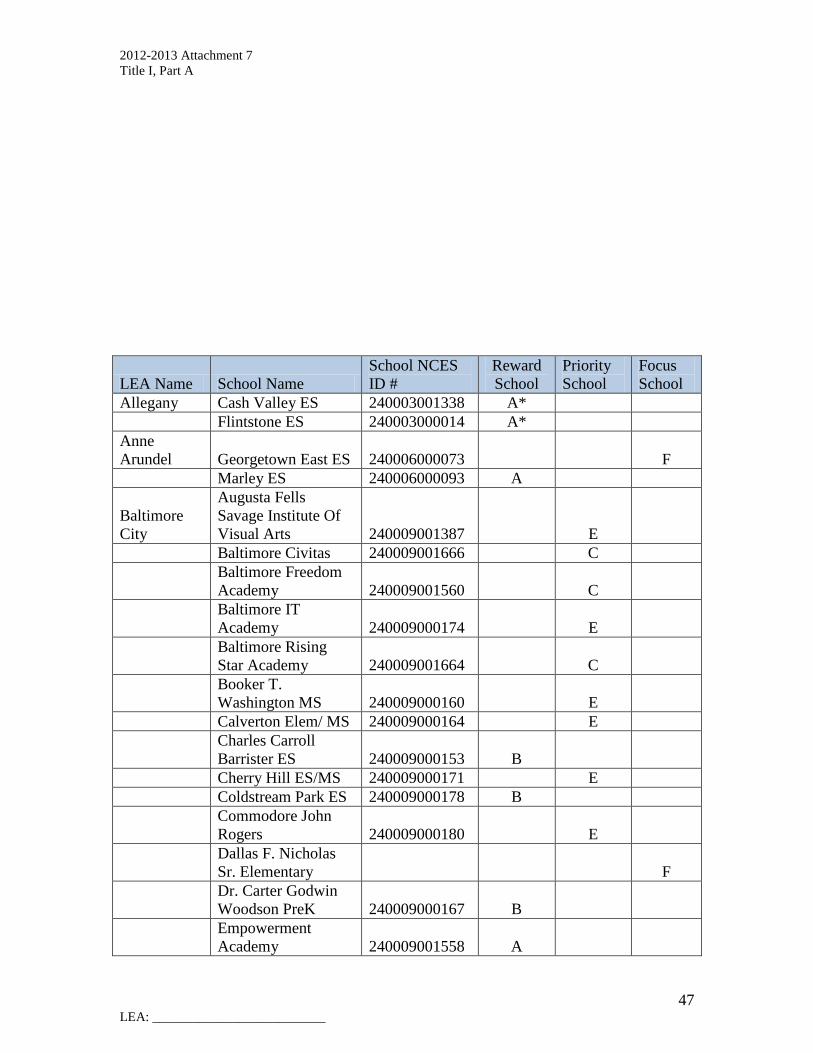
2012-2013 Attachment 7
Title I, Part A
47 LEA: __________________________
LEA Name School Name
School NCES
ID #
Reward
School
Priority
School
Focus
School
Allegany Cash Valley ES 240003001338 A*
Flintstone ES 240003000014 A*
Anne
Arundel Georgetown East ES 240006000073 F
Marley ES 240006000093 A
Baltimore
City
Augusta Fells
Savage Institute Of
Visual Arts 240009001387 E
Baltimore Civitas 240009001666 C
Baltimore Freedom
Academy 240009001560 C
Baltimore IT
Academy 240009000174 E
Baltimore Rising
Star Academy 240009001664 C
Booker T.
Washington MS 240009000160 E
Calverton Elem/ MS 240009000164 E
Charles Carroll
Barrister ES 240009000153 B
Cherry Hill ES/MS 240009000171 E
Coldstream Park ES 240009000178 B
Commodore John
Rogers 240009000180 E
Dallas F. Nicholas
Sr. Elementary F
Dr. Carter Godwin
Woodson PreK 240009000167 B
Empowerment
Academy 240009001558 A
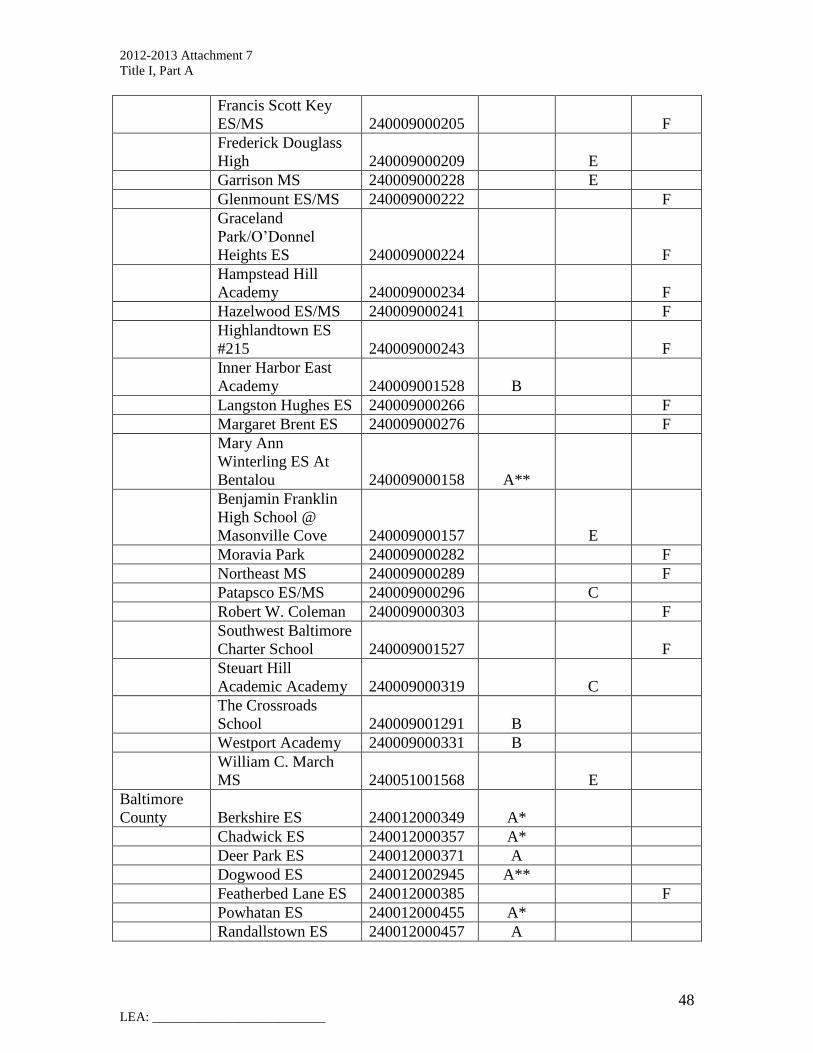
2012-2013 Attachment 7
Title I, Part A
48 LEA: __________________________
Francis Scott Key
ES/MS 240009000205 F
Frederick Douglass
High 240009000209 E
Garrison MS 240009000228 E
Glenmount ES/MS 240009000222 F
Graceland
Park/O’Donnel
Heights ES 240009000224 F
Hampstead Hill
Academy 240009000234 F
Hazelwood ES/MS 240009000241 F
Highlandtown ES
#215 240009000243 F
Inner Harbor East
Academy 240009001528 B
Langston Hughes ES 240009000266 F
Margaret Brent ES 240009000276 F
Mary Ann
Winterling ES At
Bentalou 240009000158 A**
Benjamin Franklin
High School @
Masonville Cove 240009000157 E
Moravia Park 240009000282 F
Northeast MS 240009000289 F
Patapsco ES/MS 240009000296 C
Robert W. Coleman 240009000303 F
Southwest Baltimore
Charter School 240009001527 F
Steuart Hill
Academic Academy 240009000319 C
The Crossroads
School 240009001291 B
Westport Academy 240009000331 B
William C. March
MS 240051001568 E
Baltimore
County Berkshire ES 240012000349 A*
Chadwick ES 240012000357 A*
Deer Park ES 240012000371 A
Dogwood ES 240012002945 A**
Featherbed Lane ES 240012000385 F
Powhatan ES 240012000455 A*
Randallstown ES 240012000457 A

2012-2013 Attachment 7
Title I, Part A
49 LEA: __________________________
Riverview
Elementary 240012000464 F
Sandy Plains ES 240012000470 F
Sussex Elementary 240012000482 B
Winfield ES 240012000498 F
Carroll Robert Moton ES 240021000544 F
Charles C. Paul Barnhart ES 240027000380 F
Dr. Samuel A. Mudd
ES 240027000585 F
Mt Hope/Nanjemoy
ES 240027001492 F
Dorchester Choptank ES 240030000841 F
Garrett Crellin ES 240036000665 A*
Harford
William Paca/Old
Post Road ES 240039000716 F
Howard Bryant Woods ES 240042000720 F
Guilford ES 240042000733 F
Laurel Woods ES 240042000761 F
Swansfield ES 240042000755 F
Kent Kent County MS 240045000766 F
Montgomery Brookhaven ES 240048000789 F
Kemp Mill ES 240048000858 F
Prince
George's Adelphi ES 240051000965 A**
Andrew Jackson
Academy 240051001683 F
Benjamin Stoddert
MS 240051001464 E
Carrollton ES 240051001000 F
Charles Carroll MS 240051001004 F
Concord ES 240051001013 A**
Drew Freeman MS 240051001034 E
G. James Gholson
MS 240051001211 E
Gaywood ES 240051001041 F
Lewisdale ES 240051001093 A**
Oxon Hill MS 240051001471 E
Robert Frost ES 240051001142 A**
Robert R. Gray ES 240051001183 B
Seat Pleasant ES 240051001155 A**
Thomas Johnson MS 240051001175 E
Thurgood Marshall
MS 240051001465 E
William Wirt MS 240051001186 F
Somerset Greenwood ES 240057001373 A*
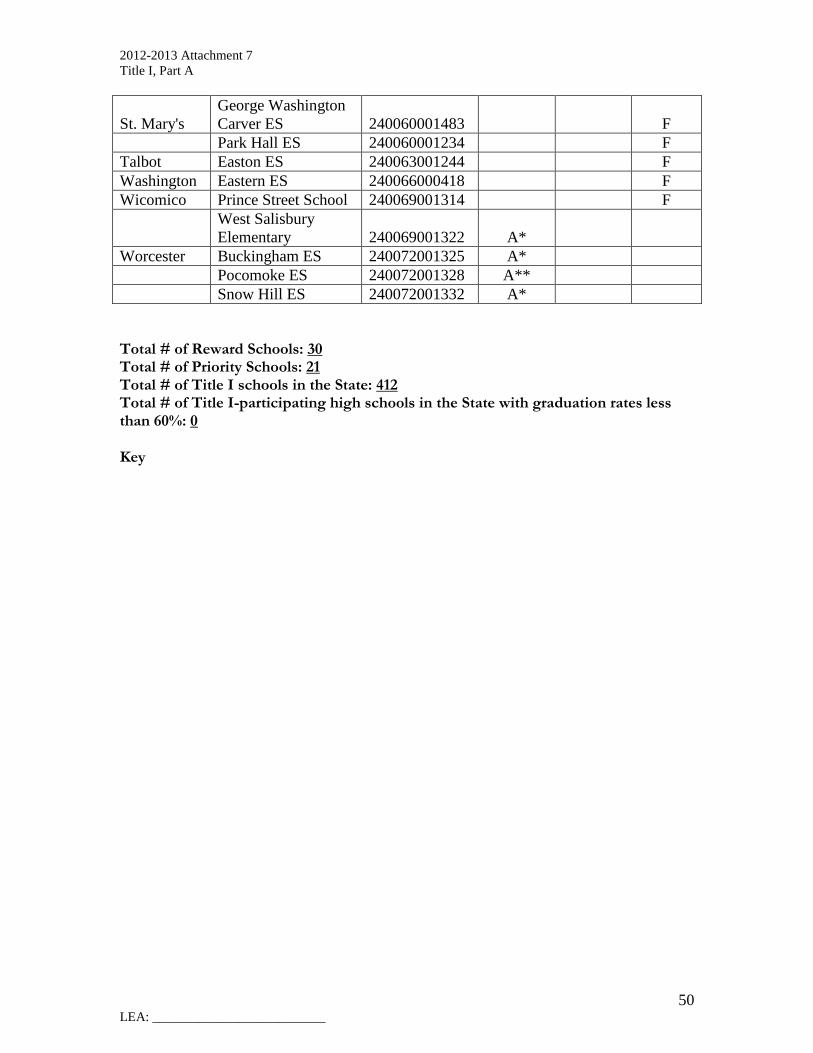
2012-2013 Attachment 7
Title I, Part A
50 LEA: __________________________
St. Mary's
George Washington
Carver ES 240060001483 F
Park Hall ES 240060001234 F
Talbot Easton ES 240063001244 F
Washington Eastern ES 240066000418 F
Wicomico Prince Street School 240069001314 F
West Salisbury
Elementary 240069001322 A*
Worcester Buckingham ES 240072001325 A*
Pocomoke ES 240072001328 A**
Snow Hill ES 240072001332 A*
Total # of Reward Schools: 30 Total # of Priority Schools: 21 Total # of Title I schools in the State: 412 Total # of Title I-participating high schools in the State with graduation rates less than 60%: 0
Key
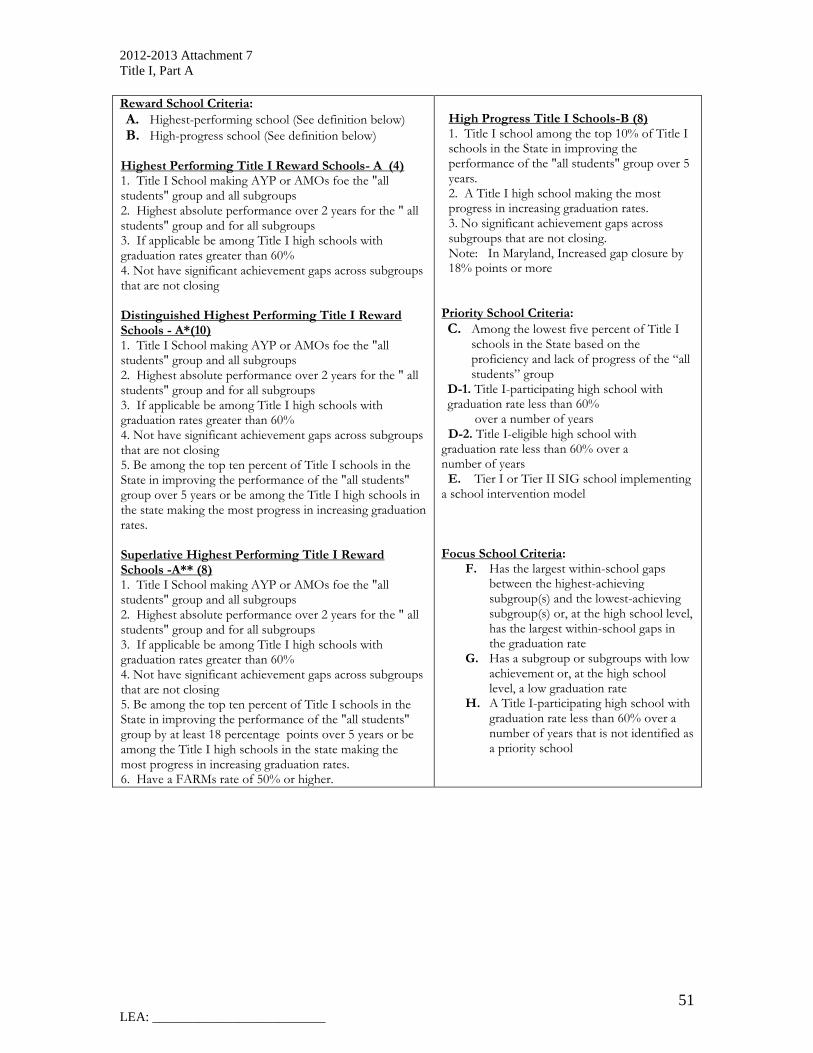
2012-2013 Attachment 7
Title I, Part A
51 LEA: __________________________
Reward School Criteria:
A. Highest-performing school (See definition below)
B. High-progress school (See definition below) Highest Performing Title I Reward Schools- A (4) 1. Title I School making AYP or AMOs foe the "all students" group and all subgroups 2. Highest absolute performance over 2 years for the " all students" group and for all subgroups 3. If applicable be among Title I high schools with graduation rates greater than 60% 4. Not have significant achievement gaps across subgroups that are not closing Distinguished Highest Performing Title I Reward Schools - A*(10) 1. Title I School making AYP or AMOs foe the "all students" group and all subgroups 2. Highest absolute performance over 2 years for the " all students" group and for all subgroups 3. If applicable be among Title I high schools with graduation rates greater than 60% 4. Not have significant achievement gaps across subgroups that are not closing 5. Be among the top ten percent of Title I schools in the State in improving the performance of the "all students" group over 5 years or be among the Title I high schools in the state making the most progress in increasing graduation rates. Superlative Highest Performing Title I Reward Schools -A** (8) 1. Title I School making AYP or AMOs foe the "all students" group and all subgroups 2. Highest absolute performance over 2 years for the " all students" group and for all subgroups 3. If applicable be among Title I high schools with graduation rates greater than 60% 4. Not have significant achievement gaps across subgroups that are not closing 5. Be among the top ten percent of Title I schools in the State in improving the performance of the "all students" group by at least 18 percentage points over 5 years or be among the Title I high schools in the state making the most progress in increasing graduation rates. 6. Have a FARMs rate of 50% or higher.
High Progress Title I Schools-B (8) 1. Title I school among the top 10% of Title I schools in the State in improving the performance of the "all students" group over 5 years. 2. A Title I high school making the most progress in increasing graduation rates. 3. No significant achievement gaps across subgroups that are not closing. Note: In Maryland, Increased gap closure by 18% points or more
Priority School Criteria:
C. Among the lowest five percent of Title I schools in the State based on the proficiency and lack of progress of the “all students” group
D-1. Title I-participating high school with graduation rate less than 60%
over a number of years D-2. Title I-eligible high school with graduation rate less than 60% over a number of years E. Tier I or Tier II SIG school implementing a school intervention model
Focus School Criteria:
F. Has the largest within-school gaps between the highest-achieving subgroup(s) and the lowest-achieving subgroup(s) or, at the high school level, has the largest within-school gaps in the graduation rate
G. Has a subgroup or subgroups with low achievement or, at the high school level, a low graduation rate
H. A Title I-participating high school with graduation rate less than 60% over a number of years that is not identified as a priority school
Appendix
Table of Contents
A – Highly Qualified A.1 ‐ Parents Right to Know Letter English and Spanish Page 2
A_1_Parents Right to Know Letter English and Spanish.pdf
A.2 – HQ Process Document Page 4
A_2_Highly Qualified Process Document.pdf
B – SCHOOLWIDE PROGRAMS B.1 – Title I Selection Instruments Criteria Page 10
B_1_Title I Selection Criteria 2012‐2013.pdf
C – TARGETED ASSISTANCE SCHOOLS N/A
D ‐ PARENT INVOLVEMENT
D.1 – Title I Parent Involvement Documents
D_1_a_LEA_PI_Policy.pdf Page 16
D_1_ab_Title1_PI_Procedure.pdf Page 19
D_1_b_LEI_PI_Policy Spanish.pdf Page 27
D_1_bb_Title1_PI_Procedure Spanish.pdf Page 30
D_1_c_SAMPLE_LEA_PI Procedures Feedback Form 2012.pdf Page 39
D_1_d_LEA PI Policy and Procedures Survey Writeup.pdf Page 40
D_1_e_LEA_PI_Policy_Procedures Revised Parent_Friendly_Trifold.pdf Page 44
D.2 – Title I Parent Involvement Process Document Page 46
D_2_Title_I_Parent_Involvement_Process_Document.pdf
D.3 – Title I School Satisfaction Parent Survey Information Page 54
D_3_Title_I_School_Satisfaction_Parent_Survey_Information.pdf
E ‐ EQUITABLE SERVICES TO STUDENTS IN PRIVATE SCHOOLS E.1 – Invitation to Private Schools to Join Title I Page 55
E_1_Invitation_to_Private_schools_to_join_TitleI.pdf E.2 – Private School Timeline for consultation and affirmation meetings Page 61
E_2_Private_Schools_Timeline and Affirmations.pdf E.3 – Private School Signed Contract Page 67
E_3_Private_School_Signed_Contract.pdf
Appendix Page 1
Appendix Page 2

Appendix Page 3

Revised 12/09
1
Harford County Public Schools Component 1 – Highly Qualified (HQ) 2011-2012
Section Activity Names/Office/Positions Responsible
Action Taken Time Frame Actual Date
1 New Hires
Initial Interview of potential New Title 1 Educator (teacher or paraprofessional)
Title 1 Principals Principals will interview candidates supplied by the Office of Human Resources (HR) for any openings. If the principal chooses to hire the candidate, then Debbie Cannon and Brad Palmer will verify HQ status. If the principal does not want to hire the candidate, no further action is taken.
June – August and/or through-out the school year
New Title 1 Educator is Selected for Hire
Debbie Cannon, HR Brad Palmer, Title 1
Once a new candidate is selected by the principal, Debbie Cannon and Brad Palmer will verify HQ status. If the candidate meets HQ status, a hiring offer will be communicated by HR. If the candidate is not HQ, the candidate and the principal will be notified, and the selection process will continue until an HQ candidate is hired.
June – August and/or through-out the school year
2 HQ
Monitoring Teachers/Para
Verification of HQ by Principals
Title 1 Principals Brad Palmer, Title 1
The Verification Attestation Form will be completed by Title 1 Principals confirming that all teachers within their building are HQ.
Beginning of the school year and on-going, if needed
On-going Review of HQ status of new and existing educators
Title 1 Principals Debbie Cannon, HR Brad Palmer, Title 1
An HR/Title 1 mtg will be held at the beginning of the year and at the end of each qrtr during the year. The purpose of each mtg is to review the teacher and paraprofessionals Master List of Title 1 HQ to verify and confirm the HQ status of all Title 1 educators. Sample records will be reviewed for HQ document support, including school-based staff/faculty rosters. Educators found to be Non-HQ will begin the process established for addressing Non-HQ educators. Educators found to be HQ will be monitored next quarter. Grade/position assignments will also be reviewed quarterly to ensure that teachers are not moved to a non-HQ position.
Beginning of the year and quarterly throughout the year.
Appendix Page 4
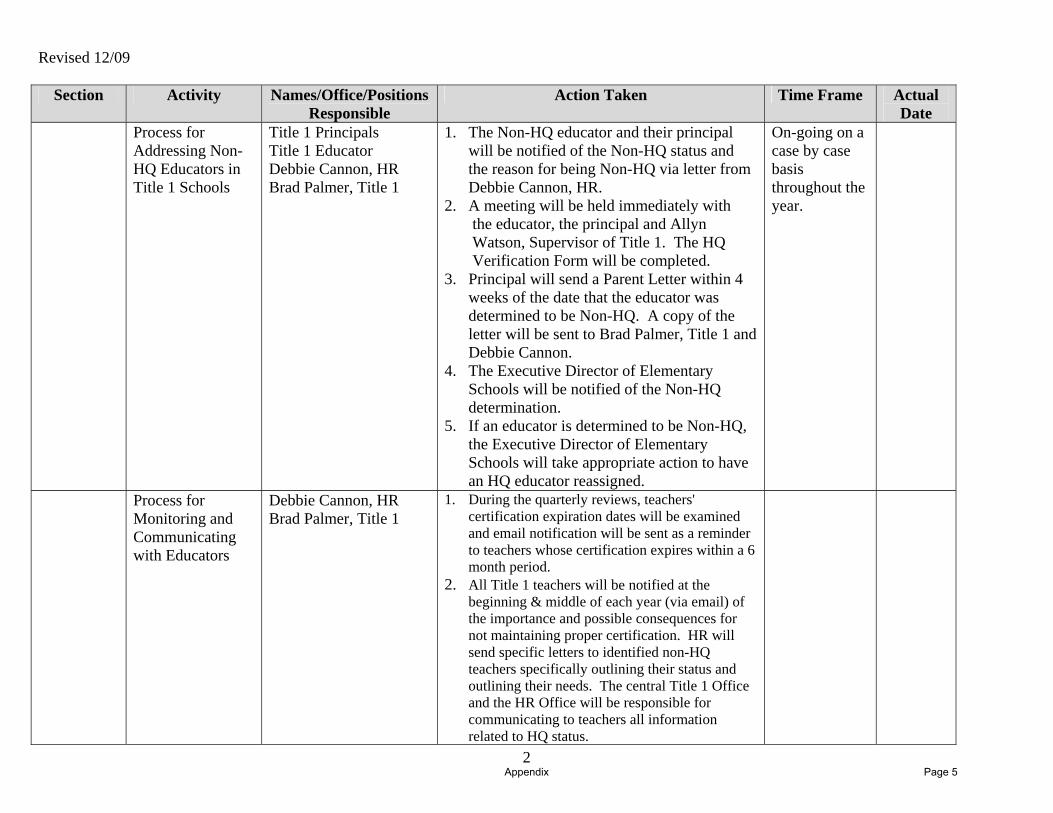
Revised 12/09
2
Section Activity Names/Office/Positions Responsible
Action Taken Time Frame Actual Date
Process for Addressing Non-HQ Educators in Title 1 Schools
Title 1 Principals Title 1 Educator Debbie Cannon, HR Brad Palmer, Title 1
1. The Non-HQ educator and their principal will be notified of the Non-HQ status and the reason for being Non-HQ via letter from Debbie Cannon, HR.
2. A meeting will be held immediately with the educator, the principal and Allyn Watson, Supervisor of Title 1. The HQ Verification Form will be completed. 3. Principal will send a Parent Letter within 4
weeks of the date that the educator was determined to be Non-HQ. A copy of the letter will be sent to Brad Palmer, Title 1 and Debbie Cannon.
4. The Executive Director of Elementary Schools will be notified of the Non-HQ determination.
5. If an educator is determined to be Non-HQ, the Executive Director of Elementary Schools will take appropriate action to have an HQ educator reassigned.
On-going on a case by case basis throughout the year.
Process for Monitoring and Communicating with Educators
Debbie Cannon, HR Brad Palmer, Title 1
1. During the quarterly reviews, teachers' certification expiration dates will be examined and email notification will be sent as a reminder to teachers whose certification expires within a 6 month period.
2. All Title 1 teachers will be notified at the beginning & middle of each year (via email) of the importance and possible consequences for not maintaining proper certification. HR will send specific letters to identified non-HQ teachers specifically outlining their status and outlining their needs. The central Title 1 Office and the HR Office will be responsible for communicating to teachers all information related to HQ status.
Appendix Page 5

Revised 12/09
3
Section Activity Names/Office/Positions Responsible
Action Taken Time Frame Actual Date
3
HQ Monitoring- Long term Substitutes
Process for Maintaining HQ Title 1 Long Term Substitutes for Teachers and Paraprofessionals
Title 1 Principals Debbie Cannon, HR Brad Palmer, Title 1
1. Principals will notify Brad Palmer-Title 1 when a long term substitute is needed, preferably with as much advanced notice as possible.
2. Principal will send a Parent Letter (Parents’ Right to Know) within 4 weeks of the date that the full-time educator was replaced by the long term substitute. A copy of the letter will be sent to Brad Palmer, Title 1 and Debbie Cannon, HR
3. Brad Palmer –Title 1 will work with HR to find HQ substitutes for the vacancy.
4. Brad Palmer-Title 1 will research and communicate a list of viable HQ substitutes to the principals for interviewing.
5. The principal will interview and make an offer for hiring, or will reject the candidate.
6. The process will continue until an HQ substitute is hired or there are no more HQ substitutes available.
7. If there are no HQ substitutes available, then a Non-HQ substitute will fill the vacancy.
8. The principal and Brad Palmer-Title 1 will continue to search for HQ substitutes to replace the Non-HQ substitute.
9. As a double check, the staffing list for Title 1 schools will be reviewed at the quarterly meetings to review any long term substitutes.
On-going on a case by case basis throughout the year.
Appendix Page 6

Revised 12/09
4
Section Activity Names/Office/Positions Responsible
Action Taken Time Frame Actual Date
10. A Home & Hospital teacher falls under the substitute heading, as long as the student remains enrolled at the school and the H&H teacher is working under the direction of the HQ classroom teacher (plans, work, grading, etc).
4
HQ Monitoring- Private School & Charter School
Process for Maintaining HQ Status of Private School and Charter School Teachers Servicing Title 1 Students
Debbie Cannon, HR Brad Palmer, Title 1
1. Private School or Charter School tutors will be selected based on their HQ status.
2. Brad Palmer-Title 1 will work with the Private Schools and the Charter Schools to find HQ tutors to hire, including HQ educators working for HCPS.
3. Brad Palmer-Title 1, along with Debbie Cannon-HR, will review each tutors HQ qualifications and make the final HQ determination.
4. The HQ tutor will sign a contract with HCPS and will confirm that they remain HQ as a condition of their employment.
Or 1. A Private Vendor will be contracted to
provide Title 1 services to qualifying Title 1 or Charter School students, and will verify and maintain HQ status of their employees who work with Title 1 students.
Beginning of the School Year
Appendix Page 7

Revised 12/09
5
Section Activity Names/Office/Positions Responsible
Action Taken Time Frame Actual Date
5 Internal
Transfers
Process for ensuring that internal transfers at the end of the school year remain compliant with HQ requirements
Title 1 Principals Debbie Cannon, HR Brad Palmer, Title 1
1. Principals will complete the “Grade Level Change-Internal Transfer” form in early May and return to Brad Palmer.
2. Brad Palmer and Debbie Cannon will review the list from each school and consult with Barb Matthews if there are any questions.
3. Principals will receive the completed “Grade Level Change-Internal Transfer” in early June with the approval or denial of the internal transfers.
May of each year June of each year
6 Role of the Parapro-fessional
Process for ensuring that instructional Paraprofessionals work under the direct supervision of and within close proximity with an HQ teacher
Title 1 Principals Title 1 Teachers Title 1 Paraprofessionals Title 1 Teacher Specialists Debbie Cannon, HR Brad Palmer, Title 1
1. Training to ensure that all Title 1 school- based staff understand the role of the instructional paraprofessional, training will occur as follows:
a. Principals will be trained annually by Brad Palmer
b. Teachers will be trained annually by Title 1 Teacher Specialists
c. Paraprofessionals will be trained annually by Title 1 teacher specialists
2. Title 1 Principals will ensure that instructional paraprofessionals are working under the direct supervision of and within proximity with an HQ teacher by:
a. Informal observations b. Formal observation and evaluation
process c. In-school professional development
3. The Title 1 Office will ensure that instructional paraprofessionals are working under the direct supervision of and within proximity with an HQ teacher by:
a. Monthly Title 1 Principal meetings b. Analysis of the formal teacher
observations and evaluations
Annually – Beginning of the school year On-going On-going
Appendix Page 8

New Educator
Title I Principal Interviews Educator
Educator not selected by Title I
Principal
Educator selected by Principal
Quarterly review of HQ status
• HR/Title I review certifi- cation records of all Title I Educators • Master list of Title I HQ status
Existing Educator
Meets HQ status
Does NOT Meet HQ status
TEACHER
1. Bachelor’s or > 2. Certification 3. Praxis (new
teachers) 4. HOUSSE (current
teachers)
PARAPROFESSIONAL
48 credits, or AA Degree, or Pass Parapro test
Principal/Educator Notified by HR via letter
(cc to Title I Office)
Title I Process: • Meeting w/ Principal + Educator + Title I Sup. • Complete HQ Compliance Form
Parent Letter sent by Principal (4 wks) from notice
of non-HQ status
Educator does not work toward HQ
status
Educator works to become HQ
Educator/Principal/Title I develop Prof. Dev. Plan
Personnel Actions
• Removal from Title I school
Principal/HR/Title I monitor
monthly
Educator receives HQ status
Educator does not receive HQ status
Return to quarterly
monitoring
Harford County Public Schools – SY 2011-2012
Flowchart for Maintaining Highly Qualified (HQ) Status of Title I Educators (Teachers and Paraprofessionals)
B. Palmer revised 2/11
HR/Title 1 Office verify HQ status
Educator hired at Title I school
ONLY HR offers employment
Certified does not equal HQ
Appendix Page 9

Revised 9/27/11
TITLE I SELECTION INSTRUMENTS AND SELECTION CRITERIA*
*Students meeting at least two criteria will be targeted for interventions. *Some students may be monitored due to lack of formal assessment data.
Kindergarten
Mathematics
Instrument
Criteria
1. SNAP Student fails to meet minimum proficiency in three or more of the following subtests: forward number word sequence (1-10),finger patterns and spatial patterns, number identification (1-10), addition and subtraction (counting items)
2. Teacher Observation Class Profile for mathematics or grouping card teacher ranking.
Teacher indicates student is below grade level in math.
3. Pre-K Skills Checklist (Spring) Student identifies less than 10 numbers up to 30.
4. Pre-K Skills Checklist (Spring) Student identifies less than 3 of the 4 sets on the “Identification of Sets” subtest.
5. Pre-K Skills Checklist (Spring) Student makes less than 2 of the 3 sets on the “Makes Set” subtest.
Reading
Instrument
Criteria
1. TPRI-(Phonemic Awareness ) Student scores less than 4 on Task 3 (Rhyming)
2. TPRI- (Graphophonemic Knowledge)
Student scores less than 8 on Task 7 (Letters to Sound Linking).
3. Pre-K Skills Checklist(Spring)
Student identifies less than 9 of 12 sight words
4. Teacher Observation Class Profile for reading or grouping card teacher ranking.
Teacher indicates student is below grade level.
Appendix Page 10
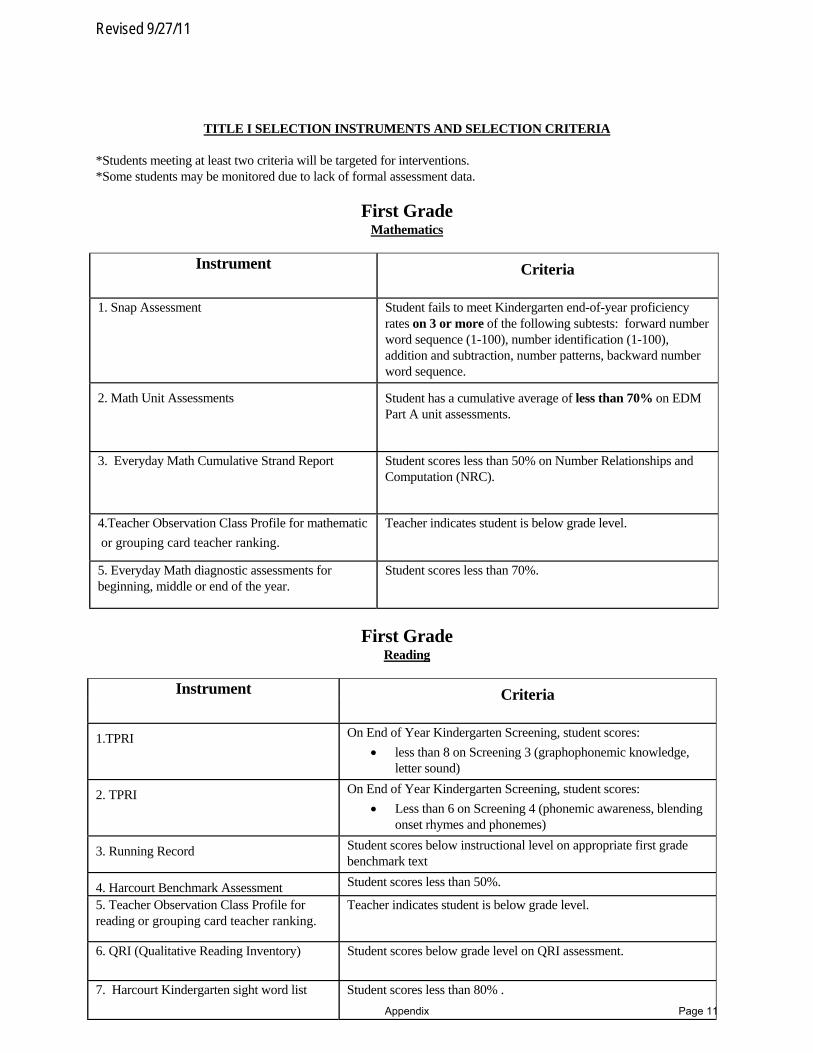
Revised 9/27/11
TITLE I SELECTION INSTRUMENTS AND SELECTION CRITERIA
*Students meeting at least two criteria will be targeted for interventions. *Some students may be monitored due to lack of formal assessment data.
First Grade Mathematics
Instrument Criteria
1. Snap Assessment Student fails to meet Kindergarten end-of-year proficiency rates on 3 or more of the following subtests: forward number word sequence (1-100), number identification (1-100), addition and subtraction, number patterns, backward number word sequence.
2. Math Unit Assessments
Student has a cumulative average of less than 70% on EDM Part A unit assessments.
3. Everyday Math Cumulative Strand Report Student scores less than 50% on Number Relationships and Computation (NRC).
4.Teacher Observation Class Profile for mathematic
or grouping card teacher ranking.
Teacher indicates student is below grade level.
5. Everyday Math diagnostic assessments for beginning, middle or end of the year.
Student scores less than 70%.
First Grade Reading
Instrument Criteria
1.TPRI On End of Year Kindergarten Screening, student scores:
less than 8 on Screening 3 (graphophonemic knowledge, letter sound)
2. TPRI On End of Year Kindergarten Screening, student scores:
Less than 6 on Screening 4 (phonemic awareness, blending onset rhymes and phonemes)
3. Running Record Student scores below instructional level on appropriate first grade benchmark text
4. Harcourt Benchmark Assessment Student scores less than 50%.
5. Teacher Observation Class Profile for reading or grouping card teacher ranking.
Teacher indicates student is below grade level.
6. QRI (Qualitative Reading Inventory) Student scores below grade level on QRI assessment.
7. Harcourt Kindergarten sight word list Student scores less than 80% .
Appendix Page 11

Revised 9/27/11
TITLE I SELECTION INSTRUMENTS AND SELECTION CRITERIA
*Students meeting at least two criteria will be targeted for interventions. *Some students may be monitored due to lack of formal assessment data.
Second Grade Mathematics
Instrument Criteria 1. Everyday Math Cumulative Mathematics Strand Report
Student scores less than 50% on number relationships and computation (NRC).
2. Math Unit Assessments
Student has a cumulative average less than 70% on math part A unit assessments.
3. Teacher Observation Class Profile for Mathematics or grouping card teacher ranking.
Teacher indicates student is below grade level.
4. Everyday Math diagnostic assessments for beginning, middle, or end-of year
Student scores less than 70%.
6. Grade 2 Scholastic Math Inventory
(SMI) Winter and Fall
Student scores “well below” on Winter or Spring Grade2 SMI assessment.
Second Grade Reading
Instrument Criteria 1. Running Record
Student scores below instructional level on appropriate second grade benchmark text.
2. QRI (Qualitative Reading Inventory) Student scores below grade level on QRI assessment.
3. Harcourt Benchmark Assessments
Student scores less than 50%.
4. Teacher Observation Class Profile or grouping card teacher ranking.
Teacher indicates student is below grade level.
5. Harcourt first grade sight word list Student scores less than 80%.
Appendix Page 12
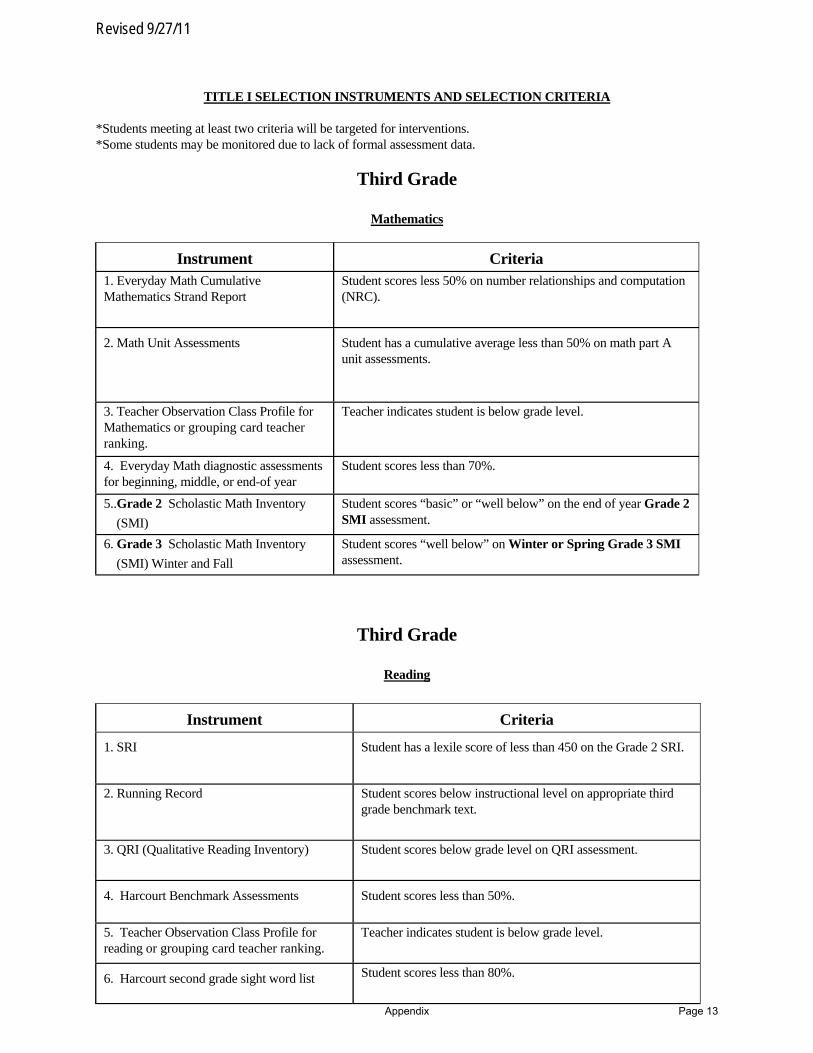
Revised 9/27/11
TITLE I SELECTION INSTRUMENTS AND SELECTION CRITERIA
*Students meeting at least two criteria will be targeted for interventions. *Some students may be monitored due to lack of formal assessment data.
Third Grade
Mathematics
Instrument Criteria 1. Everyday Math Cumulative Mathematics Strand Report
Student scores less 50% on number relationships and computation (NRC).
2. Math Unit Assessments
Student has a cumulative average less than 50% on math part A unit assessments.
3. Teacher Observation Class Profile for Mathematics or grouping card teacher ranking.
Teacher indicates student is below grade level.
4. Everyday Math diagnostic assessments for beginning, middle, or end-of year
Student scores less than 70%.
5..Grade 2 Scholastic Math Inventory
(SMI)
Student scores “basic” or “well below” on the end of year Grade 2 SMI assessment.
6. Grade 3 Scholastic Math Inventory
(SMI) Winter and Fall
Student scores “well below” on Winter or Spring Grade 3 SMI assessment.
Third Grade
Reading
Instrument Criteria
1. SRI Student has a lexile score of less than 450 on the Grade 2 SRI.
2. Running Record
Student scores below instructional level on appropriate third grade benchmark text.
3. QRI (Qualitative Reading Inventory) Student scores below grade level on QRI assessment.
4. Harcourt Benchmark Assessments
Student scores less than 50%.
5. Teacher Observation Class Profile for reading or grouping card teacher ranking.
Teacher indicates student is below grade level.
6. Harcourt second grade sight word list Student scores less than 80%.
Appendix Page 13

Revised 9/27/11
TITLE I SELECTION INSTRUMENTS AND SELECTION CRITERIA
*Students meeting at least two criteria will be targeted for interventions. *Some students may be monitored due to lack of formal assessment data.
Fourth Grade Mathematics
Instrument Criteria 1.Maryland School Assessment Student scores “Basic.”
2.Maryland School Assessment
(subtest scores)
Student with overall proficient score in MSA math scores basic on 3 of 5 math subtests.
3. Everyday Math Cumulative Mathematics Strand Report
Student scores less than 50% on number relationships and computation ( NRC).
4. Math Unit Assessments
Student has a cumulative average less than 50% on math part A unit assessments
5. Teacher Observation Class Profile for Mathematics or grouping card teacher ranking.
Teacher indicates student is below grade level.
6 .Everyday Math diagnostic assessments for beginning, middle, or end-of year
Student scores less than 70%
5.Grade 3 Scholastic Math Inventory
(SMI)
Student scores “basic” or “well below” on the end of year Grade 3 SMI assessment.
6. Grade 4 Scholastic Math Inventory
(SMI) Winter and Fall
Student scores “well below” on Winter or Spring Grade 4 SMI assessment.
Fourth Grade Reading
Instrument Criteria
1.Maryland School Assessment Student scores “Basic.”
2.Maryland School Assessment
(subtest scores)
Student with overall proficient score in MSA reading scores basic on 2 of 3 reading subtests.
3.Running Record
Student scores below instructional level on end-of-third-grade running record.
4. Harcourt Benchmark Assessment
Student scores less than 50%.
5. QRI (Qualitative Reading Inventory) Student scores below grade level on QRI assessment.
6. Teacher Observation Class Profile for reading or grouping card teacher ranking.
Teacher indicates student is below grade level.
7 .SRI Student has a lexile score of less than 600 on the grade 3SRI.
6. Harcourt second grade sight word list Student scores less than 80%.
Appendix Page 14

Revised 9/27/11
TITLE I SELECTION INSTRUMENTS AND SELECTION CRITERIA *Students meeting at least two criteria will be targeted for interventions. *Some students may be monitored due to lack of formal assessment data.
Fifth Grade Mathematics
Instrument Criteria 1.Maryland School Assessment Student scores “Basic.”
2.Maryland School Assessment
(subtest scores)
Student with overall proficient score in MSA math scores basic on 3 of 5 math subtests.
3. Everyday Math Cumulative Mathematics Strand Report
Student scores less than 50% on number relationships and computation (NRC).
4. Math Unit Assessments
Student has a cumulative average less than 50% on math part A unit assessments.
5. Teacher Observation Class Profile for
Mathematics or grouping card teacher ranking.
Teacher indicates student is below grade level.
6. Everyday Math diagnostic assessments for beginning, middle, or end-of year
Student scores less than 70%.
5.Grade 4 Scholastic Math Inventory
(SMI)
Student scores “basic” or “well below” on the end of year Grade 4 SMI assessment.
6. Grade 5 Scholastic Math Inventory
(SMI) Winter and Fall
Student scores “well below” on Winter or Spring Grade 5 SMI assessment.
Fifth Grade Reading
Instrument Criteria
1.Maryland School Assessment Student scores “Basic.”
2.Maryland School Assessment (subtest scores)
Student with overall proficient score in MSA reading scores basic on 2 of 3 reading subtests.
3. QRI (Qualitative Reading Inventory) Student scores below grade level on QRI assessment.
4. Harcourt Benchmark Assessment
Student scores less than 50%.
5. SRI Student has a lexile score of less than 750 on the grade 4 SRI.
6. Teacher Observation Class Profile for reading or grouping card teacher ranking.
Teacher indicates student is below grade level.
7. Harcourt second grade sight word list Student scores less than 80%.
Note: If the above criteria for grades K-5 do not identify enough students to sustain the program, a decision will be made by the Title I office to adjust criteria or to use an alternative instrument. Appendix Page 15

Appendix Page 16

Appendix Page 17

Appendix Page 18
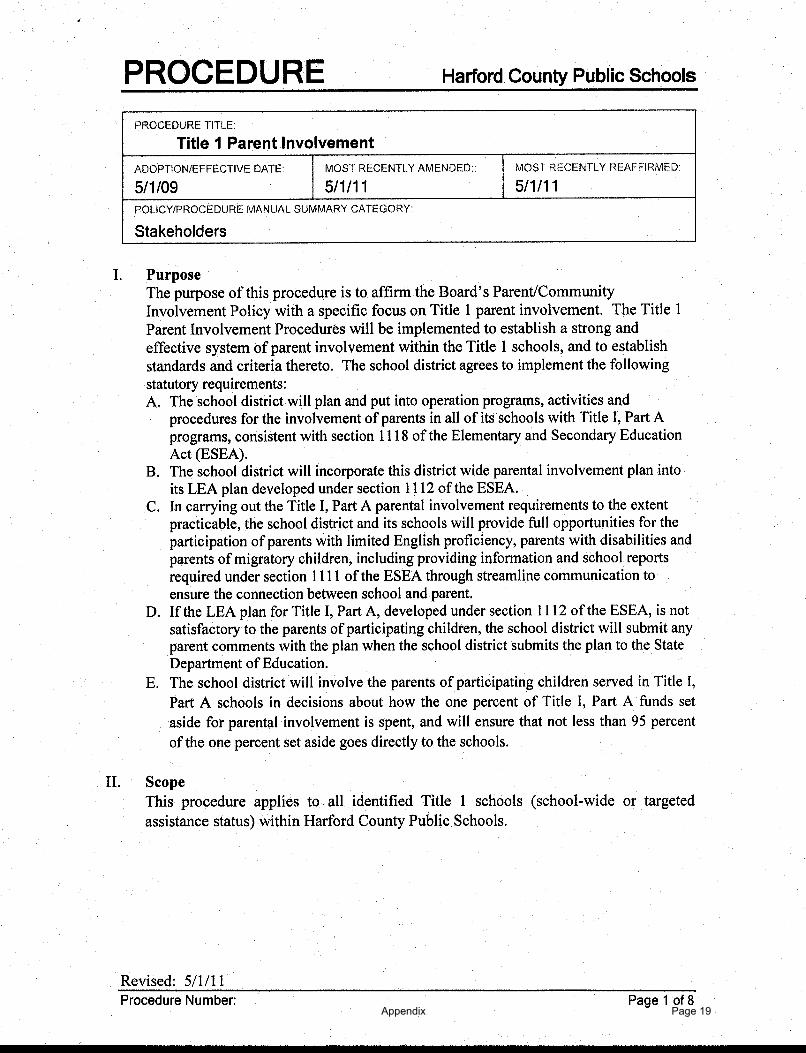
Appendix Page 19
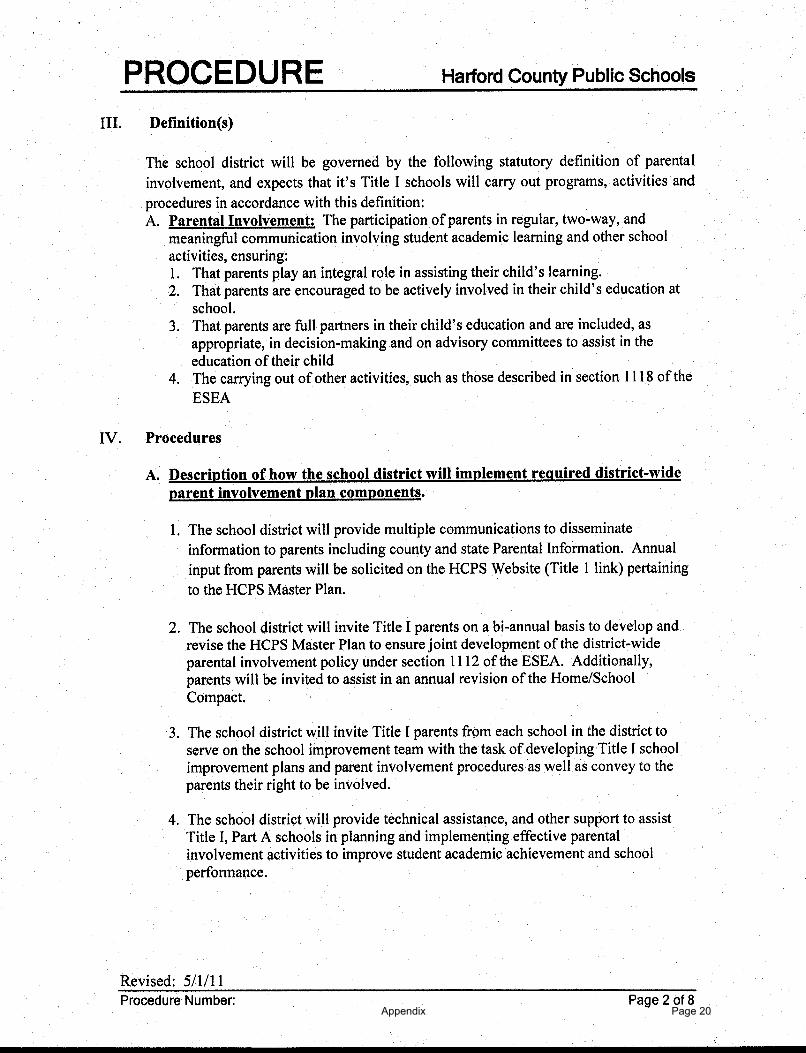
Appendix Page 20
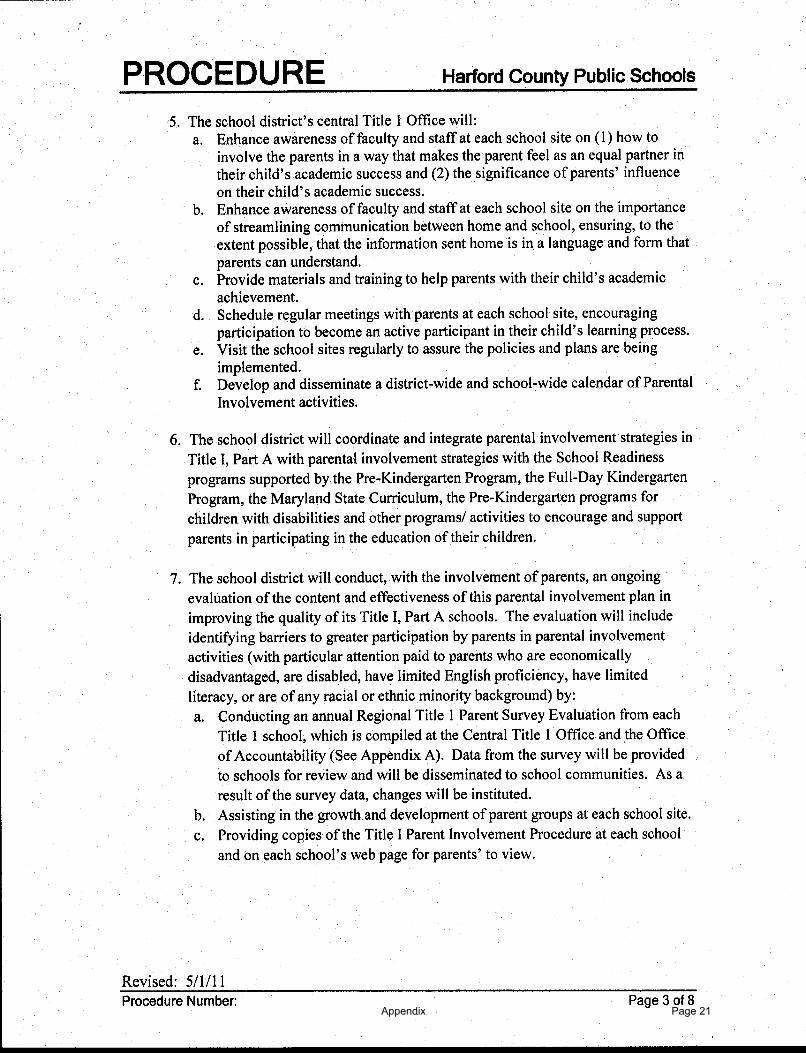
Appendix Page 21

Appendix Page 22

Appendix Page 23
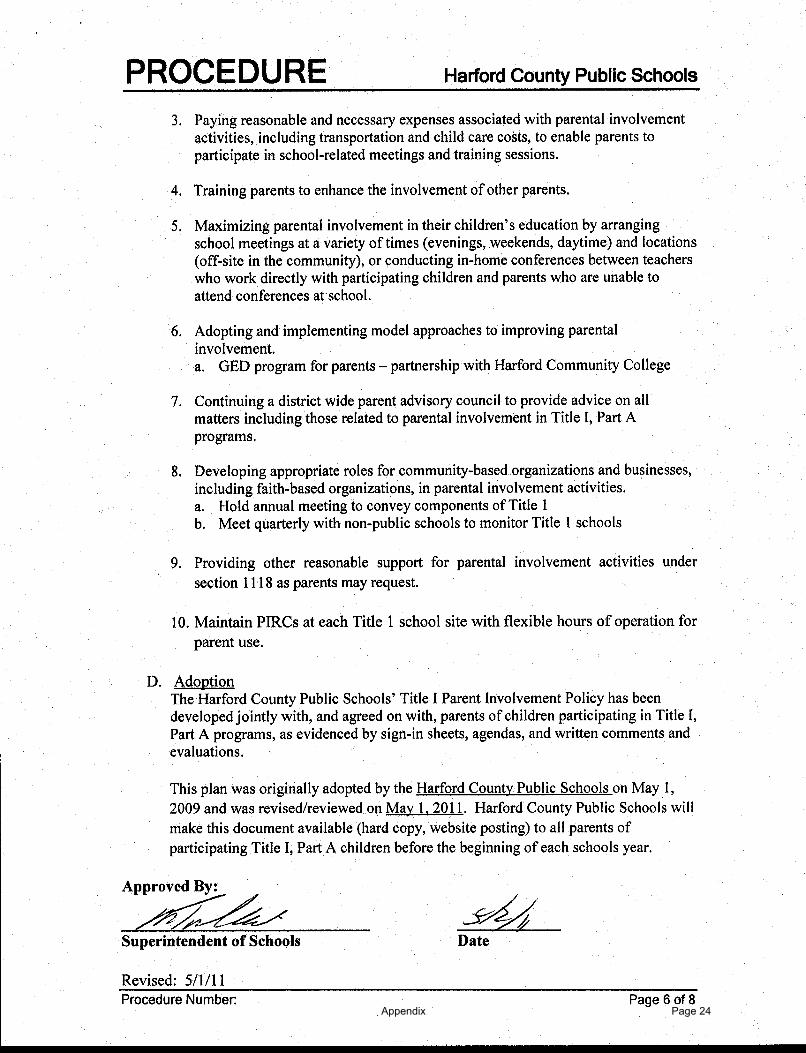
Appendix Page 24
Appendix Page 25
Appendix Page 26
POLICY Harford County Public Schools
Policy Number: 10-0004-000 Page 1 of 3
POLICY TITLE:
Parent/Community Involvement ADOPTION/EFFECTIVE DATE: MOST RECENTLY AMENDED: MOST RECENTLY REAFFIRMED:
9/14/1992 6/8/2009
POLICY/PROCEDURE MANUAL SUMMARY CATEGORY:
Stakeholders I. Purpose El propósito de esta póliza es para afirmar el compromiso que la Junta establece
para un sistema sólido y eficaz de los padres y la comunidad en el ámbito educativo y con las Escuelas Públicas del Condado de Harford (HCPS) y establecer normas y criterios relacionados con ellas.
II. Policy Statement A. HCPS apoya un sistema integral y eficaz para los padres y la comunidad en
sus escuelas, el ambiente educativo y la educación, en general.
B. HCPS involucrará a los padres y familiares de los niños y otros miembros apropiados de la comunidad en el ámbito educativo y el proceso relativo a todos los estudiantes.
C. Profesionales médicos y las escuelas individuales informar e involucrar a los padres, la familia de los estudiantes y la comunidad en el aprendizaje del estudiante y las actividades educativas y todas las decisiones relacionadas.
D. HCPS promoverá y fomentará las asociaciones significativas y eficaces
entre las escuelas, padres, familias y comunidades a fin de aumentar la implicación y participación de todos en la promoción del crecimiento social, emocional y educativo de los estudiantes HCPS.
E. HCPS, en la búsqueda y aplicación de los objetivos de la póliza anterior,
deberá: 1. Promover una comunicación abierta y constante entre el hogar,
escuela y comunidad. 2. Adoptar y apoyar destrezas para los padres.
Appendix Page 27
POLICY Harford County Public Schools
Policy Number: 10-0004-000 Page 2 of 3
3. Apoyar, promover y fomentar los padres, la familia y la participación de la comunidad ayudando en el aprendizaje de los estudiantes.
4. Ayudar, promover y facilitar el voluntariado de los padres, las
familias y miembros de la comunidad en las escuelas. 5. Facilitar, apoyar y alentar a los padres, las familias y miembros de
la comunidad en participar como socios activos en el proceso educativo y en la toma de decisiones en la escuela como en el nivel del sistema.
6. Recabar y utilizar recursos de la comunidad a fin de fortalecer las escuelas, las familias y el aprendizaje de los estudiantes.
F. HCPS afirma su compromiso y el cumplimiento de los requisitos del Título I, Título III de Acto de que Ningun NiNo se queda atrás. (No Child Left Behind Act) de 2001, codificada en 20 Estados Unidos Código Sección 6301, et seq. que ellos designen como el fortalecimiento y mejoramiento de escuelas primarias y secundarias.
Appendix Page 28
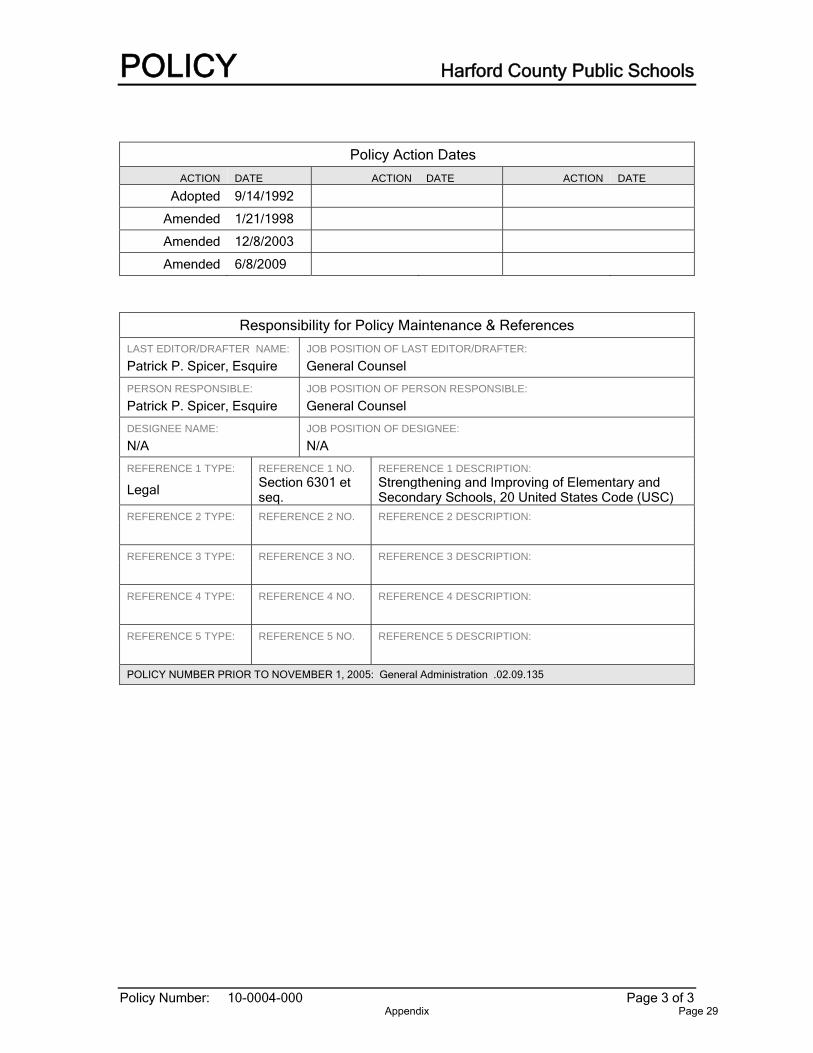
POLICY Harford County Public Schools
Policy Number: 10-0004-000 Page 3 of 3
Policy Action Dates
ACTION DATE ACTION DATE ACTION DATE
Adopted 9/14/1992
Amended 1/21/1998
Amended 12/8/2003
Amended 6/8/2009
Responsibility for Policy Maintenance & References
LAST EDITOR/DRAFTER NAME: JOB POSITION OF LAST EDITOR/DRAFTER:
Patrick P. Spicer, Esquire General Counsel
PERSON RESPONSIBLE: JOB POSITION OF PERSON RESPONSIBLE:
Patrick P. Spicer, Esquire General Counsel
DESIGNEE NAME: JOB POSITION OF DESIGNEE:
N/A N/A
REFERENCE 1 TYPE: REFERENCE 1 NO. REFERENCE 1 DESCRIPTION:
Legal Section 6301 et seq.
Strengthening and Improving of Elementary and Secondary Schools, 20 United States Code (USC)
REFERENCE 2 TYPE: REFERENCE 2 NO. REFERENCE 2 DESCRIPTION:
REFERENCE 3 TYPE: REFERENCE 3 NO. REFERENCE 3 DESCRIPTION:
REFERENCE 4 TYPE: REFERENCE 4 NO. REFERENCE 4 DESCRIPTION:
REFERENCE 5 TYPE: REFERENCE 5 NO. REFERENCE 5 DESCRIPTION:
POLICY NUMBER PRIOR TO NOVEMBER 1, 2005: General Administration .02.09.135
Appendix Page 29

NORMAS Harford County Public Schools
Revisado: 1/5/11 Norma Número: Página 1 de 9
TÍTULO DE LA NORMA:
Participación de los Padres de Título I FECHA DE VIGENCIA/APROBACIÓN: ENMIENDA MÁS RECIENTE: REAFIRMACIÓN MÁS RECIENTE:
1/5/09 1/5/11 1/5/11 CATEGORÍA RESUMEN MANUAL DE LA NORMA/POLÍTICA:
Accionistas
I. Objetivo El objetivo de esta norma es afirmar la Política de Participación de la Comunidad/los Padres de la Junta con un enfoque específico en la participación de los padres de Título I. Las Normas de Participación de los Padres de Título I se implementarán para establecer un sistema fuerte y eficaz de participación de los padres dentro de las escuelas de Título I, y para determinar normas y criterios al respecto. El distrito escolar se compromete a implementar los siguientes requisitos legales: A. El distrito escolar se ocupará de planificar y poner en marcha programas, actividades
y normas para la participación de los padres en todas sus escuelas con programas de Título I, Parte A, en consonancia con el artículo 1118 de la Ley de Enseñanza Primaria y Secundaria (ESEA, por sus siglas en inglés).
B. El distrito escolar incorporará el plan de amplia participación de los padres del distrito dentro de su plan de Organismos de Educación Local (LEA, por sus siglas en inglés), desarrollado en virtud del artículo 1112 de la ESEA.
C. Para cumplir los requisitos de participación de los padres de Título I, Parte A, el distrito escolar y sus escuelas proporcionarán, en la medida de lo posible, todas las oportunidades para la participación de los padres con conocimientos limitados de inglés, padres con discapacidad y padres de niños migrantes, incluidos el suministro de información e informes escolares requeridos en virtud del artículo 1111 de la ESEA, mediante comunicación simple a fin de garantizar la conexión entre la escuela y los padres.
D. Si el plan de LEA para el Título I, Parte A, desarrollado de acuerdo con el artículo 1112 de la ESEA, no es del todo satisfactorio para los padres de los niños y niñas participantes, el distrito escolar adjuntará al plan los comentarios de los padres antes de presentarlo ante el Departamento de Educación del Estado.
E. El distrito escolar participará a los padres de los niños y niñas que asisten a las escuelas de Título I, Parte A en las decisiones sobre cómo se gastará el 1% de los fondos del Título I, Parte A destinado a la participación de los padres, y se asegurará de que no menos del 95% del 1% apartado se destine directamente a las escuelas.
II. Alcance
Esta norma se aplica a todas las escuelas identificadas en el Título I (condición de asistencia escolar en general o específica) dentro de las Escuelas Públicas del Condado de Harford (HCPS, por sus siglas en inglés).
Appendix Page 30

NORMAS Harford County Public Schools
Revisado: 1/5/11 Norma Número: Página 2 de 9
III. Definición(es)
El distrito escolar se regirá por la siguiente definición legal de participación de los padres, y espera que sus escuelas de Título I lleven a cabo programas, actividades y normas de conformidad con esta definición: A. Participación de los Padres: La participación de los padres consiste en la
comunicación periódica, mutua y provechosa, involucrándose en el aprendizaje académico del estudiante y en otras actividades escolares, para asegurar que: 1. Los padres desempeñen un papel esencial en el aprendizaje de sus hijos. 2. Se incentive a los padres a participar activamente en la educación de sus hijos
dentro de la escuela. 3. Los padres sean socios plenos en la educación de sus hijos y se participen, según
corresponda, en la toma de decisiones y en las comisiones consultivas para ayudar en la educación de sus hijos.
4. La realización de otras actividades, tales como las descritas en el artículo 1118 de la ESEA.
IV. Normas
A. Descripción de cómo el distrito escolar implementará los componentes
requeridos en el plan distrital de participación de los padres.
1. El distrito escolar emitirá múltiples comunicados para difundir información a los padres, incluida la Información para Padres del condado y del estado. Se solicitará a los padres un aporte anual en el sitio Web de las HCPS (enlace Título I) relativo al Plan Maestro de las HCPS.
2. El distrito escolar invitará dos veces al año a los padres de Título I a desarrollar
y revisar el Plan Maestro de las HCPS para asegurar el desarrollo conjunto de la política distrital de participación de los padres en virtud del artículo 1112 de la ESEA. Además, se invitará a los padres a colaborar en una revisión anual del Compacto Hogar/Escuela.
3. El distrito escolar invitará a los padres de Título I de cada escuela del distrito a
formar parte del equipo de mejora escolar con el objetivo de desarrollar los planes de mejora escolar y las normas de participación de los padres, y también transmitirá a los padres el derecho a participar.
4. El distrito escolar proporcionará asistencia técnica y otro tipo de apoyo para
ayudar a las escuelas de Título I, Parte A en la planificación y ejecución de actividades de participación efectivas de los padres para mejorar el rendimiento académico y escolar de los estudiantes.
5. La Oficina central de Título I del distrito escolar: a. Mejorará la conciencia del plantel docente y del personal en cada escuela
acerca de: 1) el modo de incentivar la participación de los padres de manera
Appendix Page 31

NORMAS Harford County Public Schools
Revisado: 1/5/11 Norma Número: Página 3 de 9
que ellos se sientan socios en pie de igualdad con el éxito académico de sus hijos y 2) la importancia de la influencia de los padres en el éxito académico de sus hijos.
b. Mejorará la sensibilidad del plantel docente y del personal en cada escuela acerca de la importancia de agilizar la comunicación entre el hogar y la escuela, asegurando, en la medida de lo posible, que la información enviada al hogar esté en un lenguaje y en una forma que los padres puedan entender.
c. Proporcionará los materiales y la capacitación necesarios para ayudar a los padres con los logros académicos de sus hijos.
d. Programará reuniones regulares con los padres en cada escuela a fin de fomentar la participación y convertirse en un participante activo en el proceso de aprendizaje de sus hijos.
e. Visitará con regularidad las escuelas para corroborar que las políticas y los planes se estén llevando a cabo.
f. Elaborará y difundirá un calendario a nivel distrital y escolar de actividades de Participación de los Padres.
6. El distrito escolar se encargará de coordinar e integrar las estrategias de
participación de los padres de Título I, Parte A con los programas de Preparación Escolar apoyados por el Programa Pre-Jardín de Infantes, el Programa de Jardín de Infantes Jornada Completa, el Plan de Estudios del Estado de Maryland, los programas Pre-Jardín de Infantes para niños y niñas con discapacidades, y otros programas/actividades para incentivar y apoyar a los padres a participar en la educación de sus hijos.
7. El distrito escolar llevará a cabo, junto con la participación de los padres, un
sistema de evaluación permanente del contenido y la eficacia de este plan de participación de los padres para mejorar la calidad de sus escuelas de Título I, Parte A. La evaluación incluirá la identificación de obstáculos para la mayor participación de los padres en las actividades de participación de padres (prestando especial atención a los padres que están económicamente en desventaja, que poseen alguna discapacidad o conocimientos limitados de inglés, o que cuentan con alfabetización limitada o con antecedentes de una minoría racial o étnica) y se realizará de la siguiente manera: a. Realizando anualmente una Encuesta Evaluadora Regional de Padres de
Título I en cada escuela de Título I, la cual se compilará en la Oficina Central de Título I y en la Oficina de Contabilidad (Ver Apéndice A). Los datos de la encuesta se suministrarán a las escuelas para que los examinen y se darán a conocer en las comunidades escolares. A partir de los datos de la encuesta, se instituirán cambios.
b. Ayudando al crecimiento y desarrollo de los grupos de padres en cada escuela.
c. Suministrando a cada escuela copias de las Normas de Participación de los Padres de Título I y colocándolas en la página Web de cada escuela para que los padres las puedan ver.
Appendix Page 32
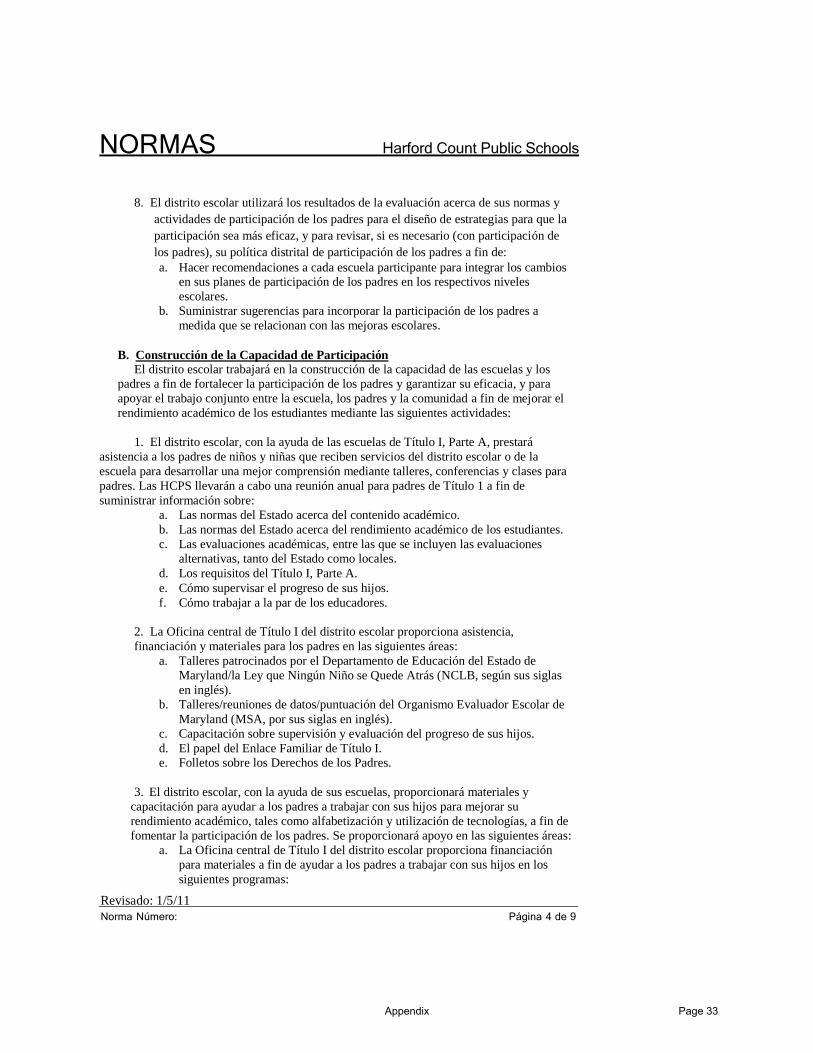
NORMAS Harford Count Public Schools
8. El distrito escolar utilizará los resultados de la evaluación acerca de sus normas y actividades de participación de los padres para el diseño de estrategias para que la participación sea más eficaz, y para revisar, si es necesario (con participación de los padres), su política distrital de participación de los padres a fin de: a. Hacer recomendaciones a cada escuela participante para integrar los cambios
en sus planes de participación de los padres en los respectivos niveles escolares.
b. Suministrar sugerencias para incorporar la participación de los padres a medida que se relacionan con las mejoras escolares.
B. Construcción de la Capacidad de Participación
El distrito escolar trabajará en la construcción de la capacidad de las escuelas y los padres a fin de fortalecer la participación de los padres y garantizar su eficacia, y para apoyar el trabajo conjunto entre la escuela, los padres y la comunidad a fin de mejorar el rendimiento académico de los estudiantes mediante las siguientes actividades:
1. El distrito escolar, con la ayuda de las escuelas de Título I, Parte A, prestará
asistencia a los padres de niños y niñas que reciben servicios del distrito escolar o de la escuela para desarrollar una mejor comprensión mediante talleres, conferencias y clases para padres. Las HCPS llevarán a cabo una reunión anual para padres de Título 1 a fin de suministrar información sobre:
a. Las normas del Estado acerca del contenido académico. b. Las normas del Estado acerca del rendimiento académico de los estudiantes. c. Las evaluaciones académicas, entre las que se incluyen las evaluaciones
alternativas, tanto del Estado como locales. d. Los requisitos del Título I, Parte A. e. Cómo supervisar el progreso de sus hijos. f. Cómo trabajar a la par de los educadores.
2. La Oficina central de Título I del distrito escolar proporciona asistencia, financiación y materiales para los padres en las siguientes áreas:
a. Talleres patrocinados por el Departamento de Educación del Estado de Maryland/la Ley que Ningún Niño se Quede Atrás (NCLB, según sus siglas en inglés).
b. Talleres/reuniones de datos/puntuación del Organismo Evaluador Escolar de Maryland (MSA, por sus siglas en inglés).
c. Capacitación sobre supervisión y evaluación del progreso de sus hijos. d. El papel del Enlace Familiar de Título I. e. Folletos sobre los Derechos de los Padres.
3. El distrito escolar, con la ayuda de sus escuelas, proporcionará materiales y
capacitación para ayudar a los padres a trabajar con sus hijos para mejorar su rendimiento académico, tales como alfabetización y utilización de tecnologías, a fin de fomentar la participación de los padres. Se proporcionará apoyo en las siguientes áreas:
a. La Oficina central de Título I del distrito escolar proporciona financiación para materiales a fin de ayudar a los padres a trabajar con sus hijos en los siguientes programas:
Revisado: 1/5/11 Norma Número: Página 4 de 9
Appendix Page 33
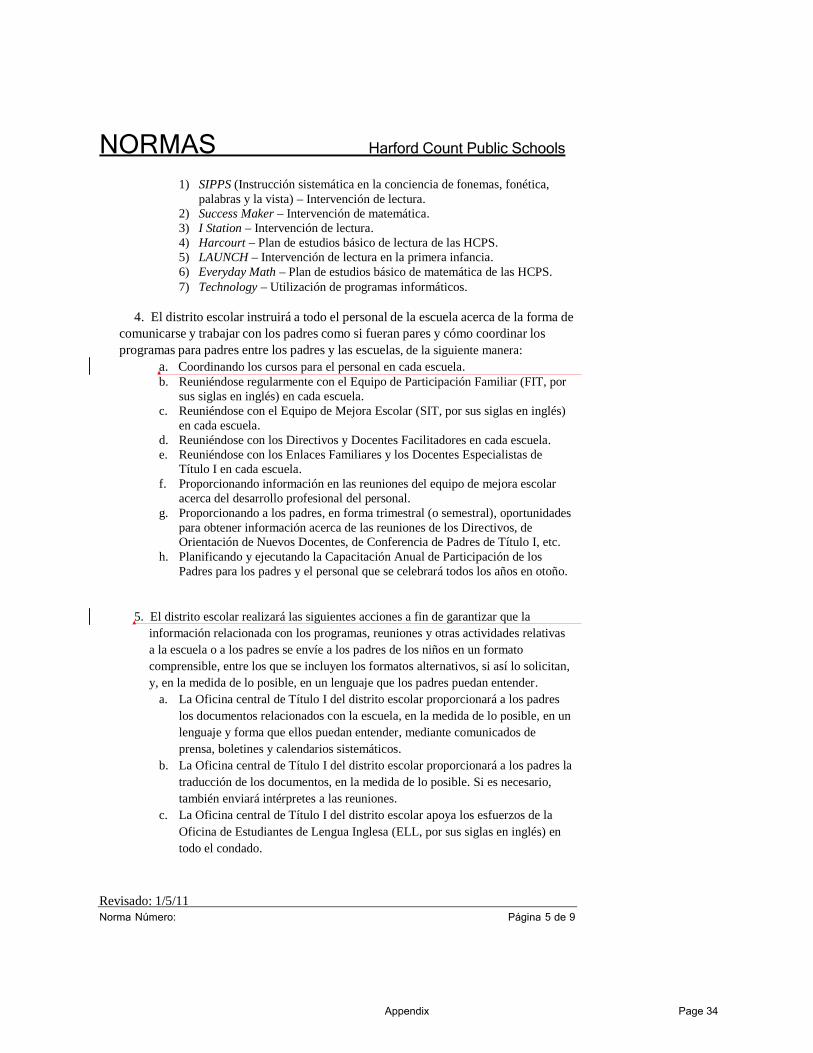
NORMAS Harford Count Public Schools
1) SIPPS (Instrucción sistemática en la conciencia de fonemas, fonética, palabras y la vista) – Intervención de lectura.
2) Success Maker – Intervención de matemática. 3) I Station – Intervención de lectura. 4) Harcourt – Plan de estudios básico de lectura de las HCPS. 5) LAUNCH – Intervención de lectura en la primera infancia. 6) Everyday Math – Plan de estudios básico de matemática de las HCPS. 7) Technology – Utilización de programas informáticos.
4. El distrito escolar instruirá a todo el personal de la escuela acerca de la forma de
comunicarse y trabajar con los padres como si fueran pares y cómo coordinar los programas para padres entre los padres y las escuelas, de la siguiente manera:
a. Coordinando los cursos para el personal en cada escuela. b. Reuniéndose regularmente con el Equipo de Participación Familiar (FIT, por
sus siglas en inglés) en cada escuela. c. Reuniéndose con el Equipo de Mejora Escolar (SIT, por sus siglas en inglés)
en cada escuela. d. Reuniéndose con los Directivos y Docentes Facilitadores en cada escuela. e. Reuniéndose con los Enlaces Familiares y los Docentes Especialistas de
Título I en cada escuela. f. Proporcionando información en las reuniones del equipo de mejora escolar
acerca del desarrollo profesional del personal. g. Proporcionando a los padres, en forma trimestral (o semestral), oportunidades
para obtener información acerca de las reuniones de los Directivos, de Orientación de Nuevos Docentes, de Conferencia de Padres de Título I, etc.
h. Planificando y ejecutando la Capacitación Anual de Participación de los Padres para los padres y el personal que se celebrará todos los años en otoño.
5. El distrito escolar realizará las siguientes acciones a fin de garantizar que la información relacionada con los programas, reuniones y otras actividades relativas a la escuela o a los padres se envíe a los padres de los niños en un formato comprensible, entre los que se incluyen los formatos alternativos, si así lo solicitan, y, en la medida de lo posible, en un lenguaje que los padres puedan entender.
a. La Oficina central de Título I del distrito escolar proporcionará a los padres los documentos relacionados con la escuela, en la medida de lo posible, en un lenguaje y forma que ellos puedan entender, mediante comunicados de prensa, boletines y calendarios sistemáticos.
b. La Oficina central de Título I del distrito escolar proporcionará a los padres la traducción de los documentos, en la medida de lo posible. Si es necesario, también enviará intérpretes a las reuniones.
c. La Oficina central de Título I del distrito escolar apoya los esfuerzos de la Oficina de Estudiantes de Lengua Inglesa (ELL, por sus siglas en inglés) en todo el condado.
Revisado: 1/5/11 Norma Número: Página 5 de 9
Appendix Page 34

NORMAS Harford Count Public Schools
C. Componentes Discrecionales del Plan de Participación de los Padres de Título I de LEA El distrito escolar, en consulta con los padres, puede optar por emprender la construcción de la capacidad de participación de los padres para que participen en la escuela y en el sistema escolar, y para que apoyen el rendimiento académico de sus hijos, mediante las siguientes actividades discrecionales, enumeradas en el artículo 1118 e) de la ESEA:
1. Dar participación a los padres en el desarrollo de la capacitación de los docentes,
directivos y otros educadores para mejorar la eficacia de dicha capacitación.
2. Proporcionar a los padres la alfabetización necesaria a partir de los fondos del Título I, Parte A, si el distrito escolar ya ha agotado las otras fuentes razonablemente disponibles de fondos.
3. Pagar los gastos razonables y necesarios relacionados con las actividades de
participación de los padres, entre los que se incluyen los costos de transporte y cuidado infantil, para que los padres puedan participar en las reuniones relacionadas con la escuela y en las sesiones de capacitación.
4. Brindar capacitación a los padres para fomentar la participación de otros padres.
5. Maximizar la participación de los padres en la educación de sus hijos
organizando reuniones escolares en distintos horarios (por las noches, los fines de semana, durante el día) y lugares (en otro sitio dentro de la comunidad); o realizando reuniones en los hogares entre los docentes que trabajan directamente con los niños y niñas, y los padres que no pueden asistir a las reuniones en la escuela.
6. Adoptar y aplicar enfoques modelo para mejorar la participación de los padres.
a. Programa de Desarrollo Educativo General (GED, por sus siglas en inglés) para padres – en asociación con el Harford Community College.
7. Continuar un consejo asesor de padres a nivel distrital a fin de proporcionar
asesoramiento sobre todas las cuestiones, entre las que se incluyen aquellas relacionadas con la participación de los padres en los programas de Título I, Parte A.
8. Desarrollar funciones apropiadas para organizaciones y empresas con base en la
comunidad, entre las que se incluyen las organizaciones confesionales, en las actividades de participación de los padres. a. Celebrar una reunión anual para transmitir los componentes del Título I. b. Reunirse trimestralmente con escuelas no estatales para supervisar a las
escuelas de Título I.
9. Proporcionar otro tipo de apoyo razonable para las actividades de participación de
los padres en virtud del artículo 1118, si los padres lo solicitan.
Revisado: 1/5/11 Norma Número: Página 6 de 9
Appendix Page 35

NORMAS Harford Count Public Schools
10. Mantener Centros de Recursos de Información para Padres (PIRCs, por sus siglas en inglés) en cada escuela de Título I con horarios de atención flexibles para que los padres puedan recurrir a ellos.
D. Aprobación
La Política de Participación de los Padres de Título I de las Harford County Public Schools ha sido desarrollada conjuntamente y de acuerdo con los padres de los niños y niñas que participan en los programas del Título I, Parte A, como se pone de manifiesto en las hojas de firmas, agendas, y evaluaciones y comentarios escritos.
Este plan fue aprobado inicialmente por las Harford County Public Schools el 1 de mayo de 2009 y revisado el 1 de mayo de 2011. Las Harford County Public Schools deben tener este documento disponible (en versión impresa o digital) para todos los padres de niños y niñas que participan en el Título I, Parte A antes del comienzo de cada año escolar.
Aprobado por:
Superintendente de Escuelas Fecha
Revisado: 1/5/11 Norma Número: Página 7 de 9
Appendix Page 36

NORMAS Harford Count Public Schools
Revisado: 1/5/11 Norma Número: Página 8 de 9
APÉNDICE A
Appendix Page 37
NORMAS Harford Count Public Schools
Revisado: 1/5/11 Norma Número: Página 9 de 9
Fechas de Acción de las Normas
FECHA DE ACCIÓN FECHA DE ACCIÓN FECHA DE ACCIÓN
Revisado 1/5/11
Responsabilidad por el Mantenimiento y las Referencias de las Normas NOMBRE DELÚLTIMO EDITOR/ REDACTOR:
Palmer, Brad
CARGO DEL ÚLTIMO EDITOR/REDACTOR:
Supervisor a cargo – Oficina de Título I de las HCPS
PERSONA RESPONSABLE: CARGO DE LA PERSONA RESPONSABLE:
NOMBRE DE LA PERSONA DESIGNADA:
CARGO DE LA PERSONA DESIGNADA:
TIPO DE REFERENCIA 1:
NÚMERO DE REFERENCIA 1
DESCRIPCIÓN DE REFERENCIA 1:
TIPO DE REFERENCIA 2:
NÚMERO DE REFERENCIA 2
DESCRIPCIÓN DE REFERENCIA 2:
TIPO DE REFERENCIA 3:
NÚMERO DE REFERENCIA 3
DESCRIPCIÓN DE REFERENCIA 3:
TIPO DE REFERENCIA 4:
NÚMERO DE REFERENCIA 4
DESCRIPCIÓN DE REFERENCIA 4:
TIPO DE REFERENCIA 5:
NÚMERO DE REFERENCIA 5
DESCRIPCIÓN DE REFERENCIA 5:
NÚMERO DE NORMA ANTERIOR AL 1 DE NOVIEMBRE DE 2005:
Appendix Page 38
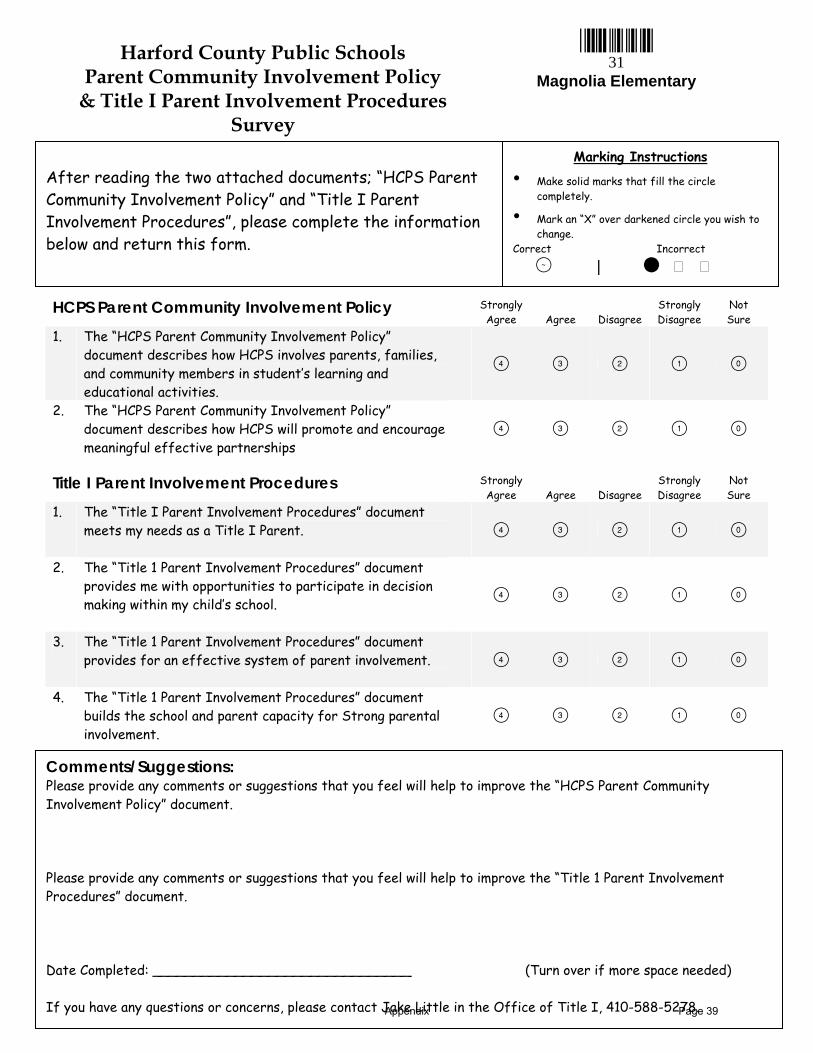
Harford County Public Schools Parent Community Involvement Policy
& Title I Parent Involvement Procedures Survey
*31* 31
Magnolia Elementary
After reading the two attached documents; “HCPS Parent Community Involvement Policy” and “Title I Parent Involvement Procedures”, please complete the information below and return this form.
Marking Instructions
• Make solid marks that fill the circle completely.
• Mark an “X” over darkened circle you wish to change.
Correct Incorrect
|
HCPS Parent Community Involvement Policy Strongly Agree Agree Disagree
Strongly Disagree
Not Sure
1. The “HCPS Parent Community Involvement Policy” document describes how HCPS involves parents, families, and community members in student’s learning and educational activities.
2. The “HCPS Parent Community Involvement Policy” document describes how HCPS will promote and encourage meaningful effective partnerships
Title I Parent Involvement Procedures Strongly Agree Agree Disagree
Strongly Disagree
Not Sure
1. The “Title I Parent Involvement Procedures” document meets my needs as a Title I Parent.
2. The “Title 1 Parent Involvement Procedures” document provides me with opportunities to participate in decision making within my child’s school.
3. The “Title 1 Parent Involvement Procedures” document provides for an effective system of parent involvement.
4. The “Title 1 Parent Involvement Procedures” document builds the school and parent capacity for Strong parental involvement.
Comments/Suggestions: Please provide any comments or suggestions that you feel will help to improve the “HCPS Parent Community Involvement Policy” document. Please provide any comments or suggestions that you feel will help to improve the “Title 1 Parent Involvement Procedures” document. Date Completed: _______________________________ (Turn over if more space needed) If you have any questions or concerns, please contact Jake Little in the Office of Title I, 410-588-5278. Appendix Page 39
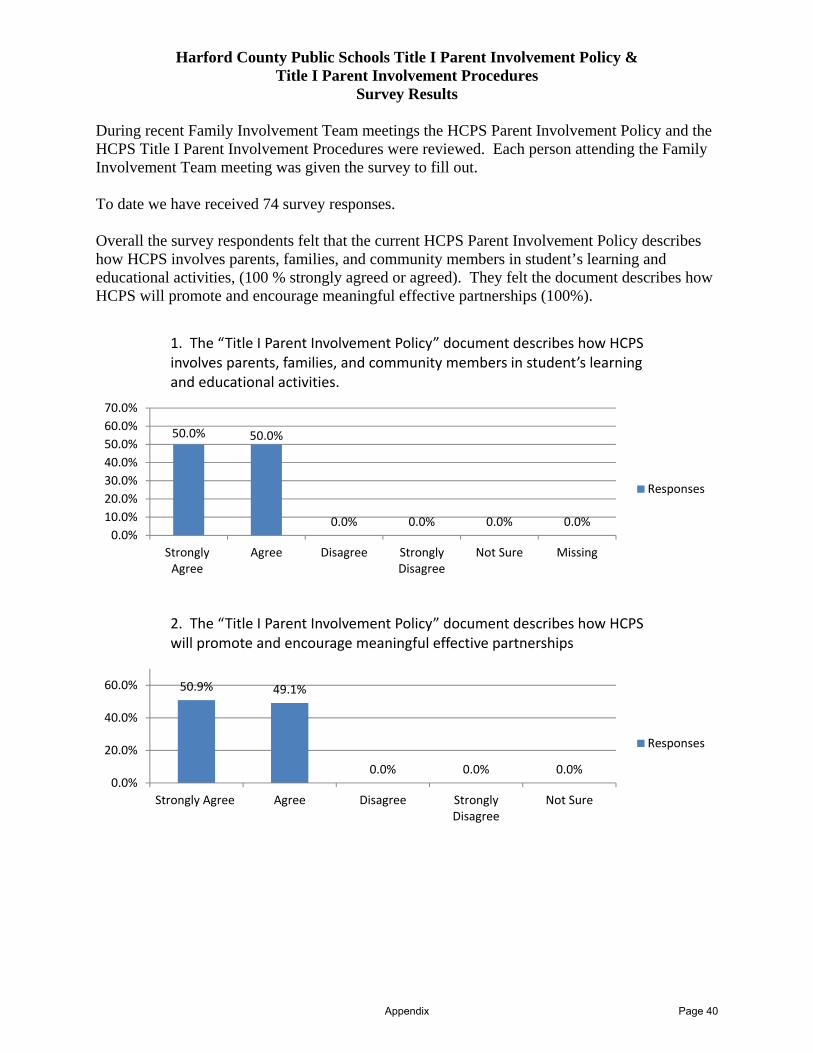
Harford County Public Schools Title I Parent Involvement Policy & Title I Parent Involvement Procedures
Survey Results During recent Family Involvement Team meetings the HCPS Parent Involvement Policy and the HCPS Title I Parent Involvement Procedures were reviewed. Each person attending the Family Involvement Team meeting was given the survey to fill out. To date we have received 74 survey responses. Overall the survey respondents felt that the current HCPS Parent Involvement Policy describes how HCPS involves parents, families, and community members in student’s learning and educational activities, (100 % strongly agreed or agreed). They felt the document describes how HCPS will promote and encourage meaningful effective partnerships (100%).
50.0% 50.0%
0.0% 0.0% 0.0% 0.0%0.0%
10.0%20.0%30.0%40.0%50.0%60.0%70.0%
StronglyAgree
Agree Disagree StronglyDisagree
Not Sure Missing
1. The “Title I Parent Involvement Policy” document describes how HCPS involves parents, families, and community members in student’s learning and educational activities.
Responses
50.9% 49.1%
0.0% 0.0% 0.0%0.0%
20.0%
40.0%
60.0%
Strongly Agree Agree Disagree StronglyDisagree
Not Sure
2. The “Title I Parent Involvement Policy” document describes how HCPS will promote and encourage meaningful effective partnerships
Responses
Appendix Page 40
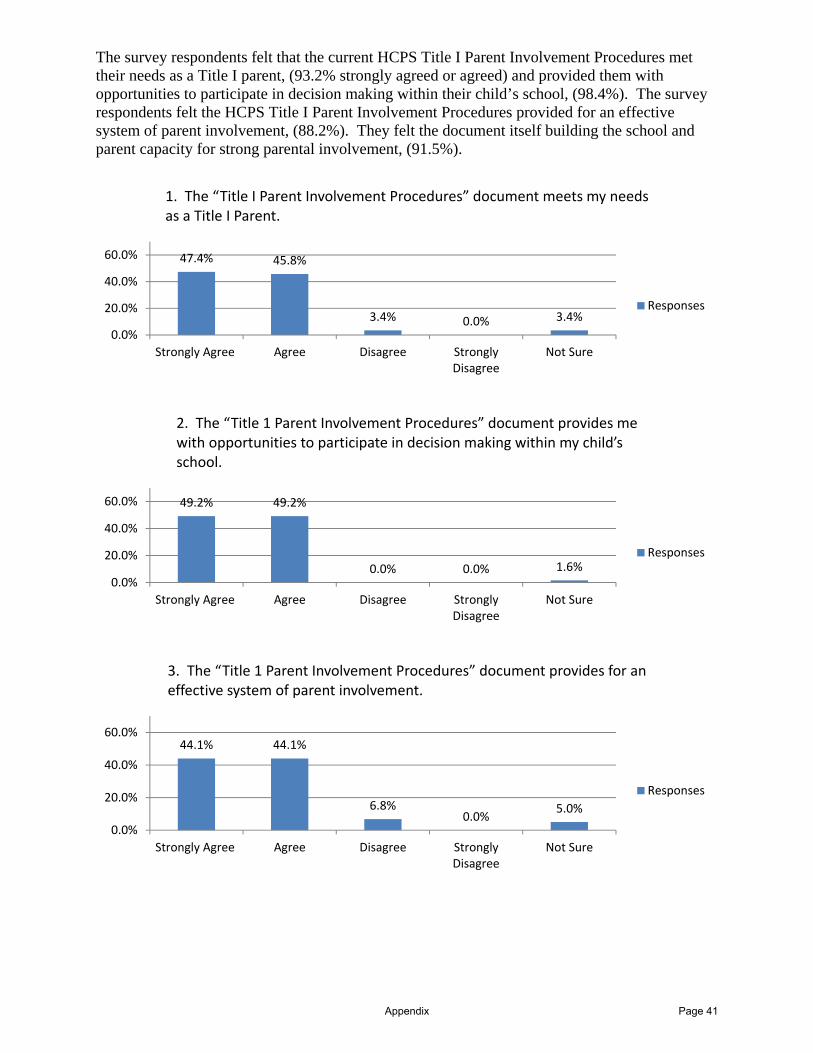
The survey respondents felt that the current HCPS Title I Parent Involvement Procedures met their needs as a Title I parent, (93.2% strongly agreed or agreed) and provided them with opportunities to participate in decision making within their child’s school, (98.4%). The survey respondents felt the HCPS Title I Parent Involvement Procedures provided for an effective system of parent involvement, (88.2%). They felt the document itself building the school and parent capacity for strong parental involvement, (91.5%).
47.4% 45.8%
3.4% 0.0% 3.4%0.0%
20.0%
40.0%
60.0%
Strongly Agree Agree Disagree StronglyDisagree
Not Sure
1. The “Title I Parent Involvement Procedures” document meets my needs as a Title I Parent.
Responses
49.2% 49.2%
0.0% 0.0% 1.6%0.0%
20.0%
40.0%
60.0%
Strongly Agree Agree Disagree StronglyDisagree
Not Sure
2. The “Title 1 Parent Involvement Procedures” document provides me with opportunities to participate in decision making within my child’s school.
Responses
44.1% 44.1%
6.8%0.0% 5.0%
0.0%
20.0%
40.0%
60.0%
Strongly Agree Agree Disagree StronglyDisagree
Not Sure
3. The “Title 1 Parent Involvement Procedures” document provides for an effective system of parent involvement.
Responses
Appendix Page 41

The respondents were given the opportunity to provide input into making any changes to the HCPS Parent Involvement Policy, the main request was to make the policy itself easier to understand and more readable. (A full list of all comments can be found at the bottom of this page.) The respondents were given the opportunity to provide input into making any changes to the HCPS Title I Parent Involvement Procedures, (A full list of all comments can be found at the bottom of this page.) HCPS Parent Involvement Policy comment / suggestions:
Remember to keep the language "parent friendly" I feel that more parents won't even take the time to read or understand what it even is or
that they don't care about the education of these children. This document is not easy to read and understand. If is truly your goal to explain these
policies and procedures to the typical Title 1 parent it must be rewritten! Please take out words such as Thereto, statutory requirements, statutory definition and streamline communication among others. What is the LEA plan? What is ESEA? The typical Title 1 parent will not admit that this reads like a college textbook.
Almost did not provide an "agree" with statements 2 and 3 above. This document does not provide the "how" - that is contained more in the Procedure document.
If I was able to have some of the things she works on in school other then homework We need more parents involved!
Title 1 Parent Involvement Procedures comments / suggestions:
The intention is good, but how many parents are included on the team of each school? Consider that although some parents want to be a big part of their child's education we do
work long hours to support our families and can't go to all these meetings and assemblies etc. and it's pushed on the parents making us feel like if we can’t do all these things it's being implied were not involved with our children enough and that is completely untrue, also some of us don’t have computer access and have to go to the Library if possible. Please be considerate that we are not all stay at home mom's, I work two jobs and have a toddler and I always check the school folder and ask my child about her day so that I always know what's going on at school with my first grader and I do her homework and
47.4% 44.1%
6.8%0.0% 1.7%
0.0%
20.0%
40.0%
60.0%
Strongly Agree Agree Disagree StronglyDisagree
Not Sure
4. The “Title 1 Parent Involvement Procedures” document builds the school and parent capacity for Strong parental involvement.
Responses
Appendix Page 42

read with her every day I don't need school to tell me how to be a part of my child's learning process or a meeting to tell me how she's doing, that's my child I know.
I think that the Parent Involvement Procedure has a lot of information and is very helpful to parents and the Children. It’s wonderful that you offer this type of help its very important for parents to be a part of their child’s education and to communicate with teachers, staff, etc
Parent of Homeless Students
Make all families aware that there is a bully form on line for the use of bullying purposes and explain what the form is used for and the protocol, which should come before using the form.
This document tells what you want to do, not how you plan to do it. There should be paperwork mailed home for any after school activities with a price list, schedule, so parents can see what activity not only fits their budget but also their schedules. (This comment was written 3 times)
Instead of surveys maybe a meeting with parents to discuss the HCPS get real views. Please help my son and I will continue to help.
18.2%
27.3%
0.0%
9.1%
0.0%
10.0%
20.0%
30.0%
40.0%
Strongly Agree Agree Disagree StronglyDisagree
Not Sure
1. The “HCPS Parent Involvement Policy” document describes how HCPS involves parents, families, and community members in student’s learning and educational activities.
Responses
18.2% 18.2%
0.0%
9.1%
0.0%
10.0%
20.0%
30.0%
40.0%
Strongly Agree Agree Disagree StronglyDisagree
Not Sure
2. The “HCPSParent Involvement Policy” document describes how HCPS will promote and encourage meaningful effective partnerships
Responses
Appendix Page 43

Mission Statement:
The mission of Title I in Harford County Public Schools is to ensure academic achievement for at‐risk students attending schools in high poverty areas.
We Believe In:
Implementing research‐based instructional practice Utilizing additional resources in instruction Involving parents and community
Harford County Public Schools
To see the original documents
Go to hcps.org, click on Title I Schools under the Parents Tab
Scroll down to General Info
Parent Involvement Procedure (continued)…
We will provide multiple communications of information to parents.
We will invite Title I parents twice per year to help revise the HCPS master plan (Goals of HCPS school system).
We will invite Title I parents to work with the school improvement team (A team that develops school Improvement plan)
We will provide help with effective parent involvement activities.
We will support parent involvement in Pre-K, Kindergarten and the Maryland State Curriculum (What students work on at each grade level).
We will conduct ongoing evaluation of the parent involvement policy and procedures.
We will use the findings to plan a more effective parent involvement policy and procedures.
Parent Involvement Procedure
(continued)…
Schools and parents will work to build knowledge to better help our students
achieve.
HCPS will work cooperatively with parents and staff through workshops,
conferences, and classes to discuss many topics.
Title I office will provide assistance,
funding and materials for parents and staff related to understanding topics that effect
our children in school.
The school district will work with parents and staff to provide materials and
training in regards to specific programs designed to help students succeed in
school.
The school district will work with parents and staff to communicate effectively and
work as equal partners.
The school district will make sure that information sent to parents is in an
understandable format.
Harford County Public Schools A.A. Roberty Building
102 S. Hickory Avenue Bel Air, MD 21014
Phone: 410-588-5278 Fax: 410-588-5349
www.HCPS.org
Appendix Page 44
Parent Involvement Procedure (continued)…
The Title I Office will work with staff at each school on how to involve parents as equal partners and the importance of communication between home and school. The Title I Office will provide materials to parents, if needed, on how to help support their child in school. The Title I Office will schedule meetings with parents, encouraging them to stay involved in their child’s education. The Title I Office will visit the schools often to make sure plans are being implemented. The Title I Office will ensure that parental involvement activities are located on district-wide and school-wide calendars.
Purpose: To establish a strong commitment between communities, parents, and Harford County Public Schools (HCPS) in supporting the school environment. HCPS will support an effective system of parent and community involvement in schools by involving parents, family members and communities. HCPS will promote and help schools with meaningful effective partnerships among schools and parents. HCPS will inform and involve parents in school activities. HCPS will promote open and ongoing communication. HCPS will support parent involvement in student learning. HCPS will promote and assist volunteering in schools. HCPS will encourage parents to participate in the decision making at the school and system level.
Purpose: The Title I Parent Involvement procedure is completed to build a strong and effective system of parent involvement in HCPS. The school district will plan activities for parent involvement with Title I schools. The school district will provide opportunities for all parents to participate, such as parents with limited English and parents with disabilities. The school district will submit any comments that are not satisfactory to the Maryland State Department of Education. The school district will involve parents in the decision of how the one percent of funds set aside for parent involvement is spent.
Harford County Public Schools Parent Involvement Policy
Harford County Public Schools A.A. Roberty Building
102 S. Hickory Avenue Bel Air, MD 21014
Phone: 410-588-5278 Fax: 410-588-5349
www.HCPS.org
Harford County Public Schools Parent Involvement Procedure
Appendix Page 45
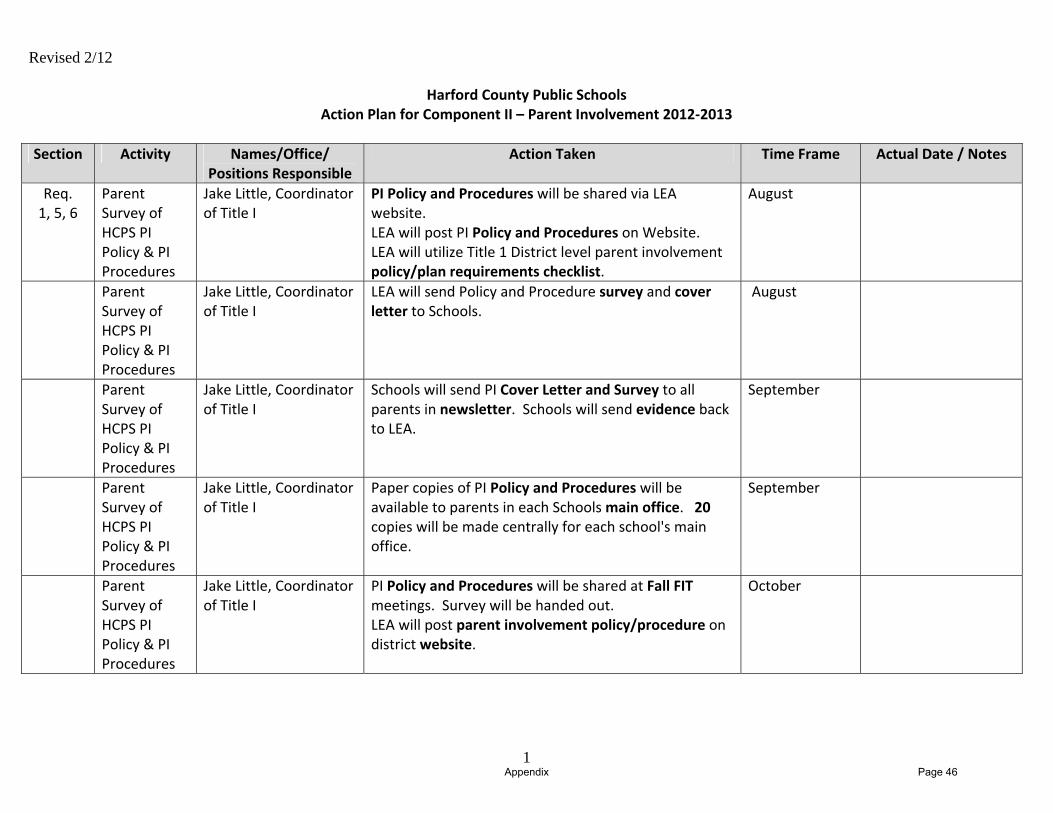
Revised 2/12
1
Harford County Public Schools Action Plan for Component II – Parent Involvement 2012‐2013
Section Activity Names/Office/ Positions Responsible
Action Taken Time Frame Actual Date / Notes
Req. 1, 5, 6
Parent Survey of HCPS PI Policy & PI Procedures
Jake Little, Coordinator of Title I
PI Policy and Procedures will be shared via LEA website. LEA will post PI Policy and Procedures on Website. LEA will utilize Title 1 District level parent involvement policy/plan requirements checklist.
August
Parent Survey of HCPS PI Policy & PI Procedures
Jake Little, Coordinator of Title I
LEA will send Policy and Procedure survey and cover letter to Schools.
August
Parent Survey of HCPS PI Policy & PI Procedures
Jake Little, Coordinator of Title I
Schools will send PI Cover Letter and Survey to all parents in newsletter. Schools will send evidence back to LEA.
September
Parent Survey of HCPS PI Policy & PI Procedures
Jake Little, Coordinator of Title I
Paper copies of PI Policy and Procedures will be available to parents in each Schools main office. 20 copies will be made centrally for each school's main office.
September
Parent Survey of HCPS PI Policy & PI Procedures
Jake Little, Coordinator of Title I
PI Policy and Procedures will be shared at Fall FIT meetings. Survey will be handed out. LEA will post parent involvement policy/procedure on district website.
October
Appendix Page 46
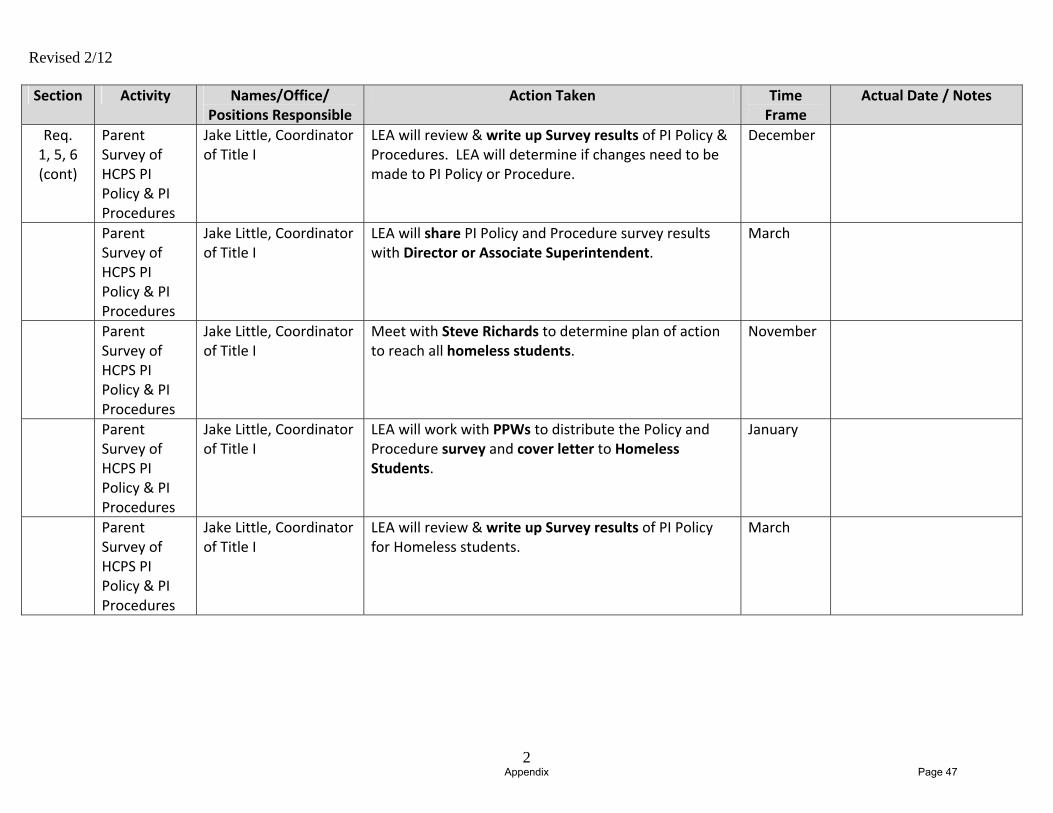
Revised 2/12
2
Section Activity Names/Office/ Positions Responsible
Action Taken Time Frame
Actual Date / Notes
Req. 1, 5, 6 (cont)
Parent Survey of HCPS PI Policy & PI Procedures
Jake Little, Coordinator of Title I
LEA will review & write up Survey results of PI Policy & Procedures. LEA will determine if changes need to be made to PI Policy or Procedure.
December
Parent Survey of HCPS PI Policy & PI Procedures
Jake Little, Coordinator of Title I
LEA will share PI Policy and Procedure survey results with Director or Associate Superintendent.
March
Parent Survey of HCPS PI Policy & PI Procedures
Jake Little, Coordinator of Title I
Meet with Steve Richards to determine plan of action to reach all homeless students.
November
Parent Survey of HCPS PI Policy & PI Procedures
Jake Little, Coordinator of Title I
LEA will work with PPWs to distribute the Policy and Procedure survey and cover letter to Homeless Students.
January
Parent Survey of HCPS PI Policy & PI Procedures
Jake Little, Coordinator of Title I
LEA will review & write up Survey results of PI Policy for Homeless students.
March
Appendix Page 47
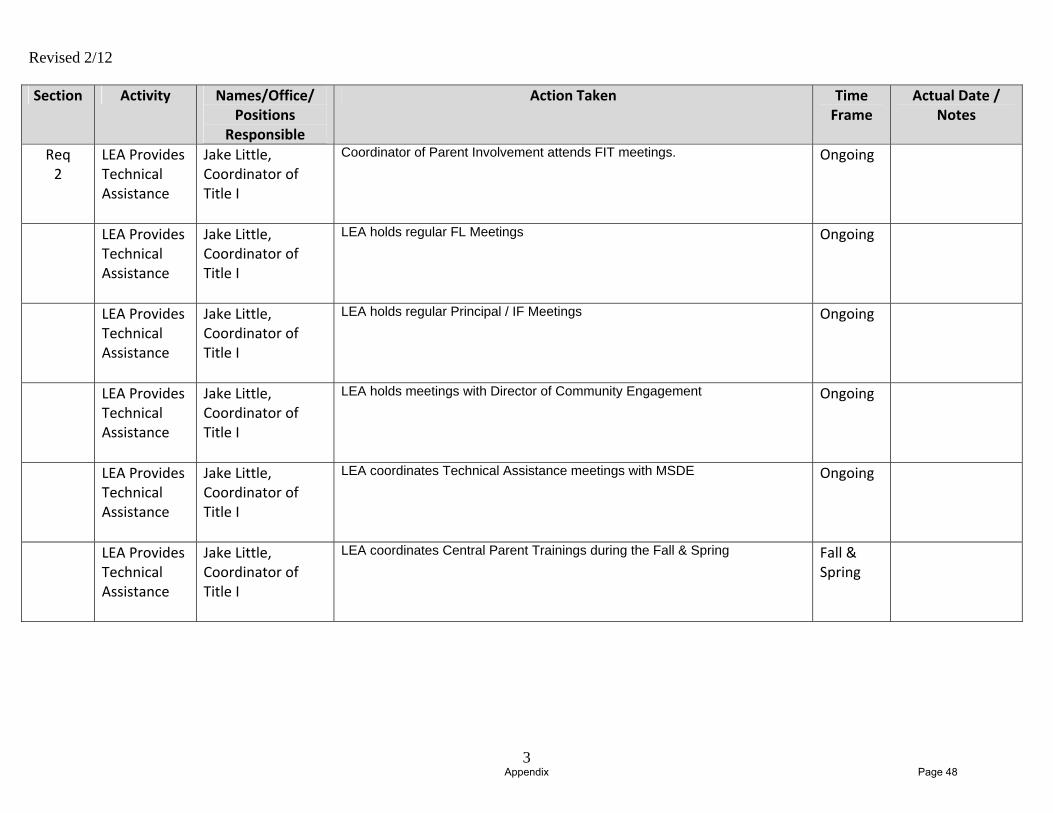
Revised 2/12
3
Section Activity Names/Office/ Positions
Responsible
Action Taken Time Frame
Actual Date / Notes
Req 2
LEA Provides Technical Assistance
Jake Little, Coordinator of Title I
Coordinator of Parent Involvement attends FIT meetings.
Ongoing
LEA Provides Technical Assistance
Jake Little, Coordinator of Title I
LEA holds regular FL Meetings
Ongoing
LEA Provides Technical Assistance
Jake Little, Coordinator of Title I
LEA holds regular Principal / IF Meetings
Ongoing
LEA Provides Technical Assistance
Jake Little, Coordinator of Title I
LEA holds meetings with Director of Community Engagement
Ongoing
LEA Provides Technical Assistance
Jake Little, Coordinator of Title I
LEA coordinates Technical Assistance meetings with MSDE
Ongoing
LEA Provides Technical Assistance
Jake Little, Coordinator of Title I
LEA coordinates Central Parent Trainings during the Fall & Spring
Fall & Spring
Appendix Page 48
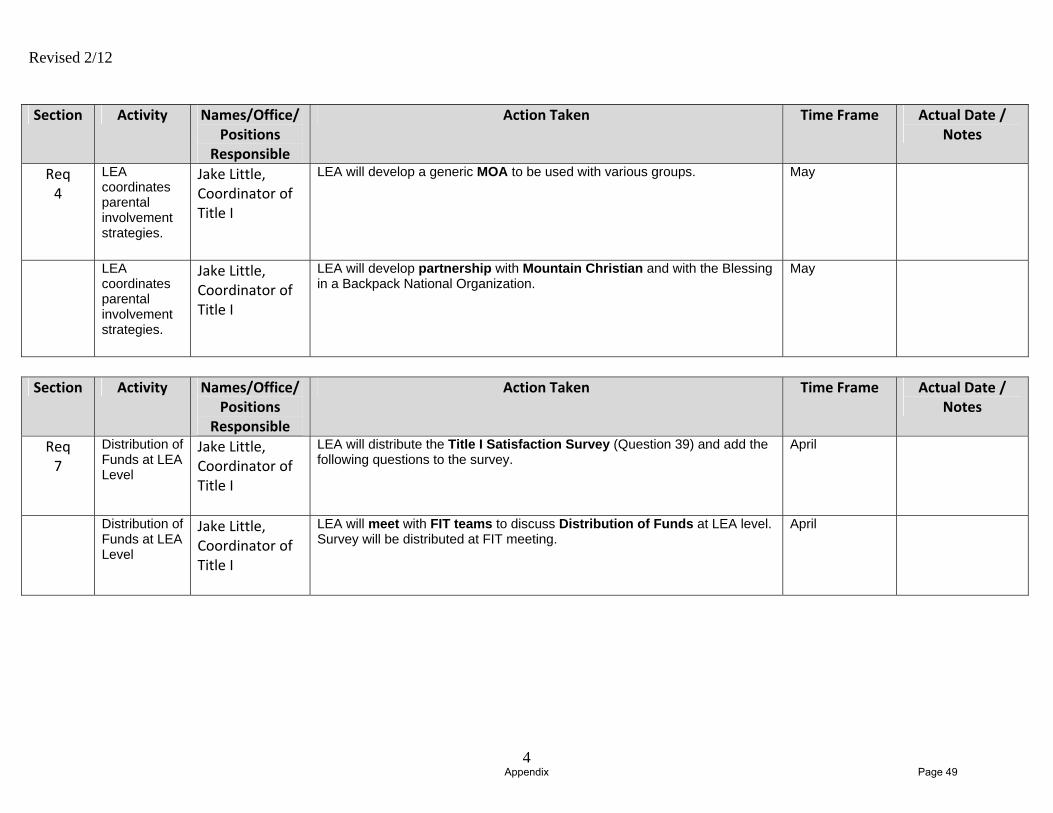
Revised 2/12
4
Section Activity Names/Office/
Positions Responsible
Action Taken Time Frame Actual Date / Notes
Req 4
LEA coordinates parental involvement strategies.
Jake Little, Coordinator of Title I
LEA will develop a generic MOA to be used with various groups.
May
LEA coordinates parental involvement strategies.
Jake Little, Coordinator of Title I
LEA will develop partnership with Mountain Christian and with the Blessing in a Backpack National Organization.
May
Section Activity Names/Office/
Positions Responsible
Action Taken Time Frame Actual Date / Notes
Req 7
Distribution of Funds at LEA Level
Jake Little, Coordinator of Title I
LEA will distribute the Title I Satisfaction Survey (Question 39) and add the following questions to the survey.
April
Distribution of Funds at LEA Level
Jake Little, Coordinator of Title I
LEA will meet with FIT teams to discuss Distribution of Funds at LEA level. Survey will be distributed at FIT meeting.
April
Appendix Page 49

Revised 2/12
5
Section Activity Names/Office/ Positions
Responsible
Action Taken Time Frame Actual Date / Notes
Req 8
Jake Little, Coordinator of Title I
School Level Parent Involvement Plan is jointly developed with parents. Parent Feedback forms that parents are filling out at FIT Meetings concerning their review of the School Level Parent Involvement Plan are required.
March
Req 9
Jake Little, Coordinator of Title I
The School Level Parent Involvement Plan is distributed to parents of Title I students. School must provide information to LEA concerning how the School Level PI Plan is distributed.
Fall
Req 11
Jake Little, Coordinator of Title I
Parents of Title I Students are involved in the decisions regarding the spending of the parent involvement funds at the school level. SANE documentation or surveys from FIT meetings pertaining to parent input into spending of school‐based parent involvement funds.
May
Req 12
Jake Little, Coordinator of Title I
Records that all 2011‐2012 Title I schools conducted an annual parent meeting. SANE documentation from back‐to‐school nights that parents conducted an annual parent meeting.
September Back To School Nights
Req 13a
Jake Little, Coordinator of Title I
Provide assistance to parents in understanding the state's academic content standards and student achievement standards, State and local academic assessments, the requirements of Title I, and how to monitor a child's progress and work with educators to improve student achievement ‐State Curriculum Tri‐Fold per grade level will be distributed at the first conference day at the end of 1st Marking period. ‐Schools need to provide the "Topic List" of things discussed with the accompanying sign‐in sheet.
Fall
Appendix Page 50
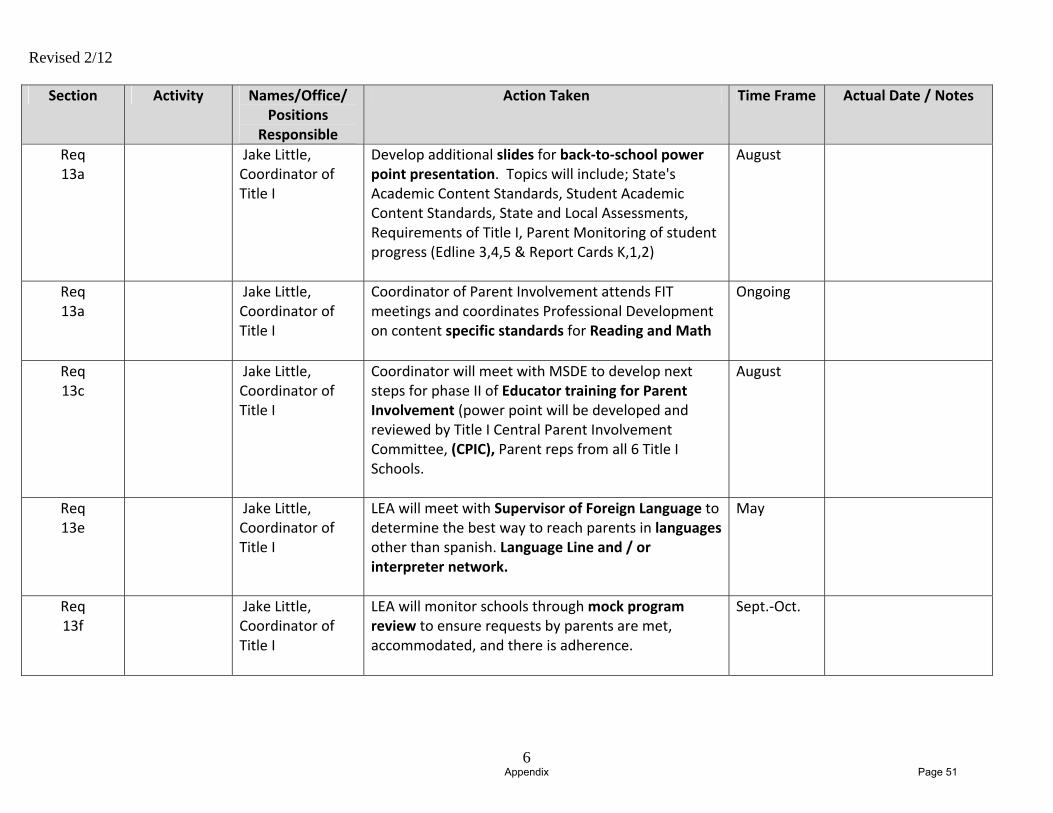
Revised 2/12
6
Section Activity Names/Office/ Positions
Responsible
Action Taken Time Frame Actual Date / Notes
Req 13a
Jake Little, Coordinator of Title I
Develop additional slides for back‐to‐school power point presentation. Topics will include; State's Academic Content Standards, Student Academic Content Standards, State and Local Assessments, Requirements of Title I, Parent Monitoring of student progress (Edline 3,4,5 & Report Cards K,1,2)
August
Req 13a
Jake Little, Coordinator of Title I
Coordinator of Parent Involvement attends FIT meetings and coordinates Professional Development on content specific standards for Reading and Math
Ongoing
Req 13c
Jake Little, Coordinator of Title I
Coordinator will meet with MSDE to develop next steps for phase II of Educator training for Parent Involvement (power point will be developed and reviewed by Title I Central Parent Involvement Committee, (CPIC), Parent reps from all 6 Title I Schools.
August
Req 13e
Jake Little, Coordinator of Title I
LEA will meet with Supervisor of Foreign Language to determine the best way to reach parents in languages other than spanish. Language Line and / or interpreter network.
May
Req 13f
Jake Little, Coordinator of Title I
LEA will monitor schools through mock program review to ensure requests by parents are met, accommodated, and there is adherence.
Sept.‐Oct.
Appendix Page 51
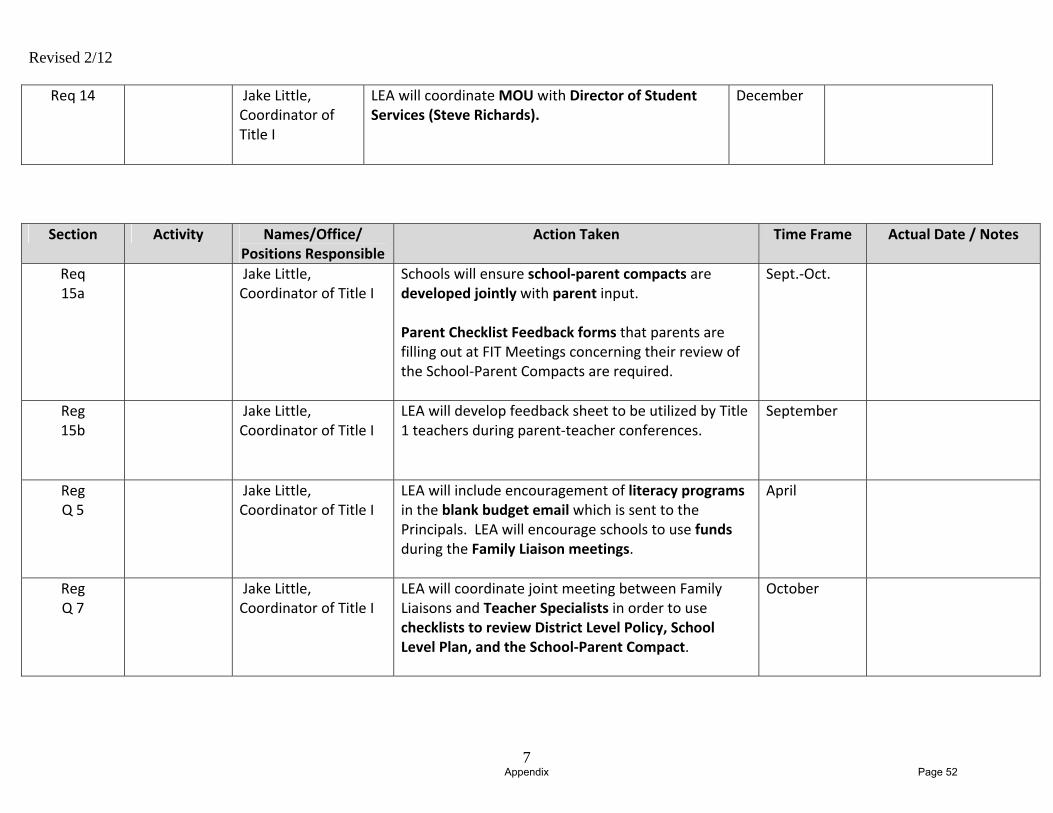
Revised 2/12
7
Req 14 Jake Little, Coordinator of Title I
LEA will coordinate MOU with Director of Student Services (Steve Richards).
December
Section Activity Names/Office/ Positions Responsible
Action Taken Time Frame Actual Date / Notes
Req 15a
Jake Little, Coordinator of Title I
Schools will ensure school‐parent compacts are developed jointly with parent input. Parent Checklist Feedback forms that parents are filling out at FIT Meetings concerning their review of the School‐Parent Compacts are required.
Sept.‐Oct.
Reg 15b
Jake Little, Coordinator of Title I
LEA will develop feedback sheet to be utilized by Title 1 teachers during parent‐teacher conferences.
September
Reg Q 5
Jake Little, Coordinator of Title I
LEA will include encouragement of literacy programs in the blank budget email which is sent to the Principals. LEA will encourage schools to use funds during the Family Liaison meetings.
April
Reg Q 7
Jake Little, Coordinator of Title I
LEA will coordinate joint meeting between Family Liaisons and Teacher Specialists in order to use checklists to review District Level Policy, School Level Plan, and the School‐Parent Compact.
October
Appendix Page 52
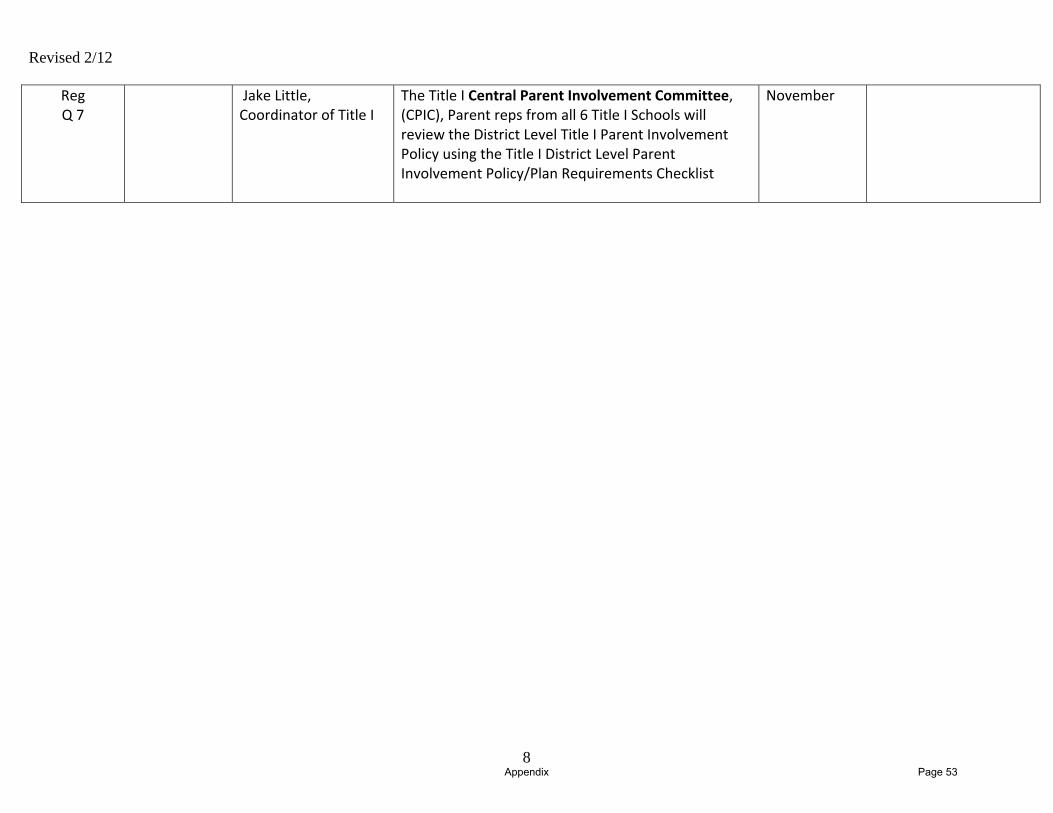
Revised 2/12
8
Reg Q 7
Jake Little, Coordinator of Title I
The Title I Central Parent Involvement Committee, (CPIC), Parent reps from all 6 Title I Schools will review the District Level Title I Parent Involvement Policy using the Title I District Level Parent Involvement Policy/Plan Requirements Checklist
November
Appendix Page 53

100% of the Title 1 Parent Involvement funds (1% of Total Allocation) should be allocated directly to the Title 1 schools.
Parent / Guardian
79.35% 77.89%
73.64%
78.90%
88.37%
84.26%
79.32%
1.09%2.88% 3.88%
1.83% 2.33% 0.93% 2.22%
14.13% 14.42%17.83%
14.68%
6.98%
13.89% 14.53%
5.43% 4.81% 4.65% 4.59%2.33% 0.93%
3.93%
0.00%
10.00%
20.00%
30.00%
40.00%
50.00%
60.00%
70.00%
80.00%
90.00%
100.00%
Edgewood G. Lisby Hall's Cross Roads Havre de Grace Magnolia William Paca All Title I Schools
Strongly Agree / Agree Disagree / Strongly Disagree Not Sure Missing
Appendix Page 54
Appendix Page 55

Appendix Page 56

Appendix Page 57

Appendix Page 58

Appendix Page 59

Appendix Page 60

Revised: July 27, 2012
1
Harford County Public Schools Component VIII: Private Schools
Action Plan
The HCPS Title I Office is committed to providing equitable services to eligible private school students, teachers, and parents. These services and other benefits will be comparable to the services and other benefits provided to the public school children and teachers participating in Title I programs. The HCPS Title I Office will assess, address, and evaluate the needs of private school students and teachers. The system will spend an equal amount of funds per students to provide services.
Activity Names/Office/Positions
Responsible Action Taken Time
Frame Actual Date
Notes
Discuss Third Party Contract
Thomas Webber, Assistant Title I Assistant Supervisor Ms. Lisa Kriss, Catapult Learning
Discuss upcoming year’s contract. Review any changes. August 2011
Set up Consultation Calendar
Mrs. Virginia Behr, Principal, St. Joan of Arc School Mrs. Jane Dean, Principal, St. Margaret’s School John Austin, Administrator, Trinity Lutheran School Millie Flosser, Administrator, Bethel Christian Academy Thomas Webber, Assistant Title I Assistant Supervisor
Contact private school officials to set up consultation calendar for upcoming school year
Summer 2012
1st Week of July
Emailed 4 Private Schools to set up Affirmation Meetings.
Affirmation of Consultation Meeting / Summer Meeting
Mrs. Virginia Behr, Principal, St. Joan of Arc School Mrs. Jane Dean, Principal, St. Margaret’s School John Austin, Administrator, Trinity Lutheran School Millie Flosser, Administrator, Bethel Christian Academy Thomas Webber, Assistant Title I Assistant Supervisor Ms. Lisa Kriss, Catapult Learning
Initial consultation meeting.1. Determine data source for counting eligible students.
(Identifying pool of eligible students is private school responsibility.)
2. Identify multiple, educationally related criteria for choosing students. (LEA responsibility.)
3. Discuss academic goals of eligible students, appropriate assessments.
4. Solicit views on service delivery options, including “pooling” option.
5. Discuss district‐wide instructional set‐asides and administrative
Summer 2012
various 7/16 – St. Joan7/18 – Trinity Lutheran 8/3 ‐ Bethel 8/23 – St. Margaret’s
Appendix Page 61

Revised: July 27, 2012
2
costs.6. Determine services for parents and teachers of participating
students. 7. Inform private school officials of the HCPS Title I, Part A,
complaint procedure. 8. Collect signed affirmation form private school officials. 9. Determine equitable services amount based on number of
eligible students and per‐pupil allocations. 10. Identify students to participate (serviced).
Review / Revise HCPS Title I generated annual progress rubric
Thomas Webber Revise HCPS Title I generated annual progress rubric, used by third party vendor to create Initial Management Plan
Late August
Meet with Third Party vendor to develop the management plan.
Thomas Webber, Assistant Title I Assistant Supervisor Ms. Lisa Kriss, Catapult Learning
The Third Party Vendor In consultation with HCPS, will implement the management plan that was developed for their program. The required elements of the initial plan include: A. Holding an Affirmation of Consultation meeting and follow‐up
monitoring throughout the school year. Minutes of the meetings will be kept to document attendees, such as non‐public officials, classroom teachers, Catapult personnel and HCPS Title I personnel and will be distributed the same day as the meeting.
B. Consulting with the HCPS Title I Office before proceeding with any changes to the program.
C. A discussion of methods of quality control for products and general operational performance.
D. A discussion of proposed lines of authority, coordination and communication among sub CONTRACTOR, (if applicable), field based staff (if any), and the management staff.
E. An indication of time commitments of key personnel, by task or activity, and for the project as a whole, expressed in person days. A chart shall be included, which summarizes this information.
F. A chart showing task and subtasks, deadlines, decision points, and deliverables over the duration of the contract. The expected ending date for each task and subtask, in calendar weeks from the implementation of the contract, shall be indicated. The
Late September, 2012
Appendix Page 62
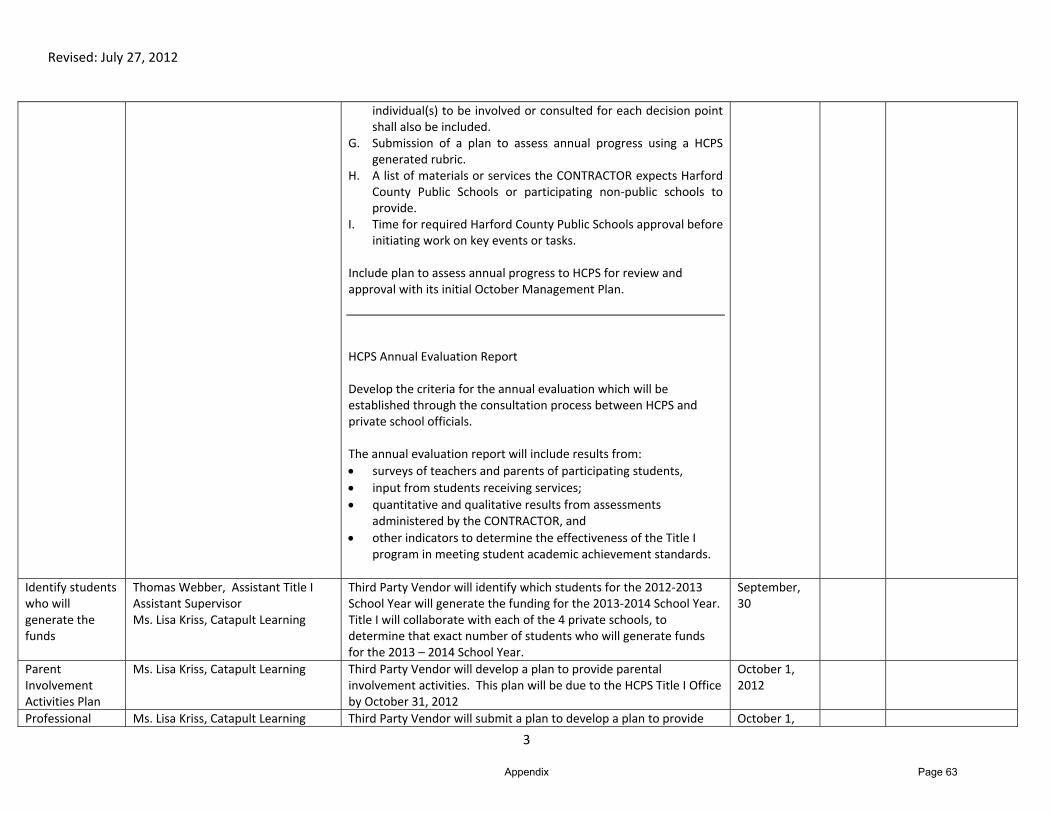
Revised: July 27, 2012
3
individual(s) to be involved or consulted for each decision point shall also be included.
G. Submission of a plan to assess annual progress using a HCPS generated rubric.
H. A list of materials or services the CONTRACTOR expects Harford County Public Schools or participating non‐public schools to provide.
I. Time for required Harford County Public Schools approval before initiating work on key events or tasks.
Include plan to assess annual progress to HCPS for review and approval with its initial October Management Plan. HCPS Annual Evaluation Report Develop the criteria for the annual evaluation which will be established through the consultation process between HCPS and private school officials. The annual evaluation report will include results from: surveys of teachers and parents of participating students, input from students receiving services; quantitative and qualitative results from assessments
administered by the CONTRACTOR, and other indicators to determine the effectiveness of the Title I
program in meeting student academic achievement standards.
Identify students who will generate the funds
Thomas Webber, Assistant Title I Assistant Supervisor Ms. Lisa Kriss, Catapult Learning
Third Party Vendor will identify which students for the 2012‐2013School Year will generate the funding for the 2013‐2014 School Year. Title I will collaborate with each of the 4 private schools, to determine that exact number of students who will generate funds for the 2013 – 2014 School Year.
September, 30
Parent Involvement Activities Plan
Ms. Lisa Kriss, Catapult Learning Third Party Vendor will develop a plan to provide parental involvement activities. This plan will be due to the HCPS Title I Office by October 31, 2012
October 1, 2012
Professional Ms. Lisa Kriss, Catapult Learning Third Party Vendor will submit a plan to develop a plan to provide October 1,
Appendix Page 63

Revised: July 27, 2012
4
Development Activities Plan
Professional Development activities. This plan will be due to the HCPS Title I Office by October 1, 2012
2012
Initial Management Plan
Ms. Lisa Kriss, Catapult Learning Third Party Vendor will prepare and submit an Initial Management Report for the accomplishments of the tasks, subtasks, key events, deadlines, and deliverables. This plan will be due to the HCPS Title I Office by October 1, 2012
October 1, 2012
Exchange Funds for out of county students
Thomas Webber, Title I Assistant Supervisor
Identify students attending private schools in Harford County and other LEAs
October / November
Fall Meeting with Private Schools
Participating Private Schools, Thomas Webber, Title I Assistant Supervisor Ms. Lisa Kriss, Catapult Learning
Attending Quarterly meeting at Private SchoolsMonitor Student Progress, Receive updates on Parent Involvement, Professional Development, Management Plan, Review sample Correspondence between Private Schools and Families. Assess student progress and evaluate program compliance
Mid/Late October 2012
RFP Thomas Webber, Title I Assistant Supervisor
Start RFP process for third party contractor when applicable October/ November
Winter Meeting with Private Schools
Participating Private Schools, Thomas Webber, Title I Assistant Supervisor Ms. Lisa Kriss, Catapult Learning
Attending Quarterly meeting at Private SchoolsMonitor Student Progress, Receive updates on Parent Involvement, Professional Development, Management Plan, Review sample Correspondence between Private Schools and Families. Assess student progress and evaluate program compliance Discuss poverty data results with private school officials and estimated instructional funds generated
Dec 2012 / Jan 2013
Federal HCPS Programs Consultation meetings
Mary Beth Stapleton, HCPS Supervisor for Curriculum and Instructional Grants, Thomas Webber, Title I Assistant Supervisor
Invite eligible private schools to the federal programs informational meeting for upcoming school year
January 2013/ February 2013
Appendix Page 64
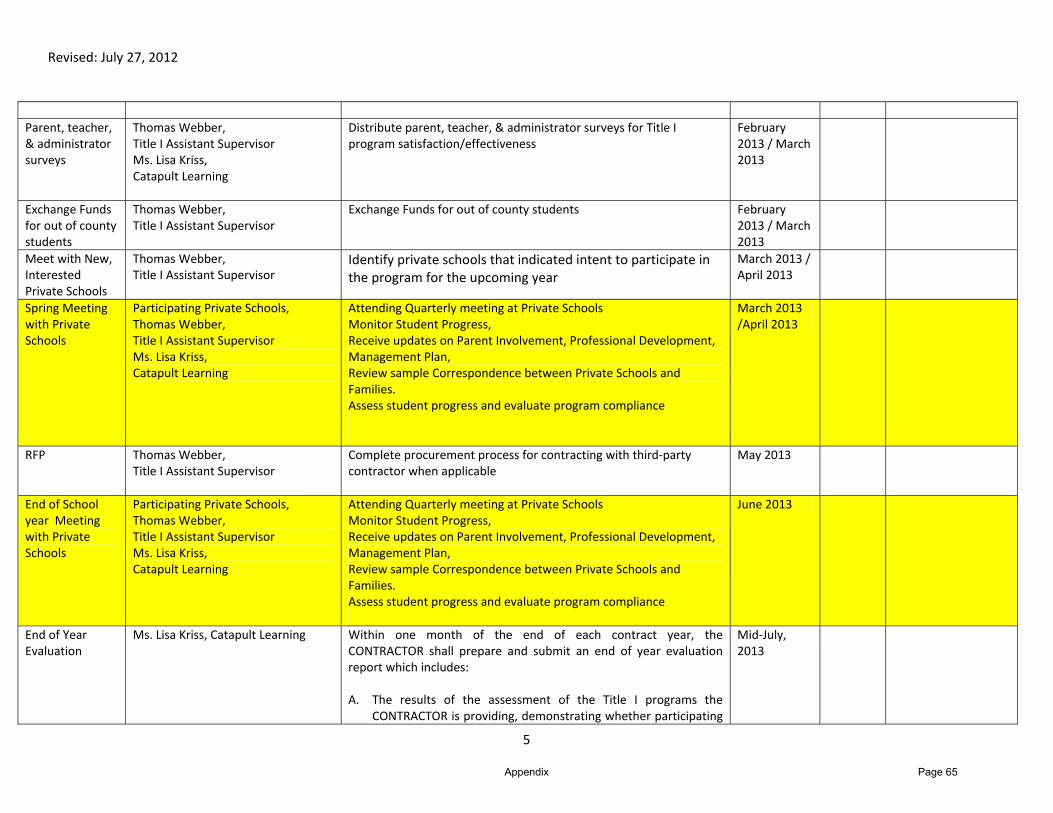
Revised: July 27, 2012
5
Parent, teacher, & administrator surveys
Thomas Webber, Title I Assistant Supervisor Ms. Lisa Kriss, Catapult Learning
Distribute parent, teacher, & administrator surveys for Title I program satisfaction/effectiveness
February 2013 / March 2013
Exchange Funds for out of county students
Thomas Webber, Title I Assistant Supervisor
Exchange Funds for out of county students February 2013 / March 2013
Meet with New, Interested Private Schools
Thomas Webber, Title I Assistant Supervisor
Identify private schools that indicated intent to participate in the program for the upcoming year
March 2013 / April 2013
Spring Meeting with Private Schools
Participating Private Schools, Thomas Webber, Title I Assistant Supervisor Ms. Lisa Kriss, Catapult Learning
Attending Quarterly meeting at Private SchoolsMonitor Student Progress, Receive updates on Parent Involvement, Professional Development, Management Plan, Review sample Correspondence between Private Schools and Families. Assess student progress and evaluate program compliance
March 2013 /April 2013
RFP Thomas Webber, Title I Assistant Supervisor
Complete procurement process for contracting with third‐party contractor when applicable
May 2013
End of School year Meeting with Private Schools
Participating Private Schools, Thomas Webber, Title I Assistant Supervisor Ms. Lisa Kriss, Catapult Learning
Attending Quarterly meeting at Private SchoolsMonitor Student Progress, Receive updates on Parent Involvement, Professional Development, Management Plan, Review sample Correspondence between Private Schools and Families. Assess student progress and evaluate program compliance
June 2013
End of Year Evaluation
Ms. Lisa Kriss, Catapult Learning Within one month of the end of each contract year, the CONTRACTOR shall prepare and submit an end of year evaluation report which includes: A. The results of the assessment of the Title I programs the
CONTRACTOR is providing, demonstrating whether participating
Mid‐July, 2013
Appendix Page 65

Revised: July 27, 2012
6
children are meeting, or making annual yearly progress toward meeting the student academic achievement standards or the alternative standards.
B. A description of program services and activities, especially new services, activities, methods, etc. and the results of their use.
C. An evaluation of the parental involvement activities to determine the effectiveness of the activities in increasing the participation of parents, to identify barriers to greater participation of parents in activities, and to use the findings to improve the strategies for program improvement and parental involvement.
D. An evaluation of professional development activities conducted for eligible non‐public school staff members.
E. Special problems encountered and solutions applied or anticipated.
HCPS Annual Evaluation Report
Thomas Webber Title I Office will complete an annual evaluation of the Title I nonpublic program. Criteria for the annual evaluation will be established through the consultation process between HCPS and private school officials. The annual evaluation report will include results from: surveys of teachers and parents of participating students, input from students receiving services; quantitative and qualitative results from assessments
administered by the CONTRACTOR, and other indicators to determine the effectiveness of the Title I
program in meeting student academic achievement standards.
Late July, 2013
Appendix Page 66
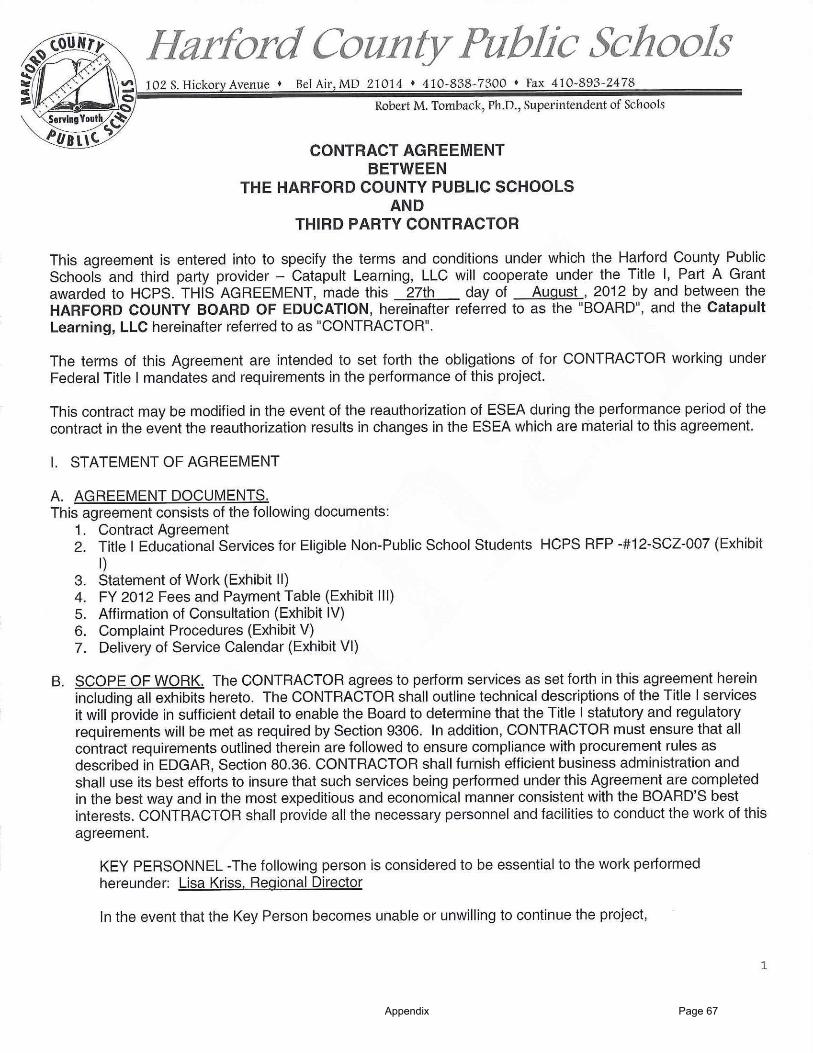
Appendix Page 67
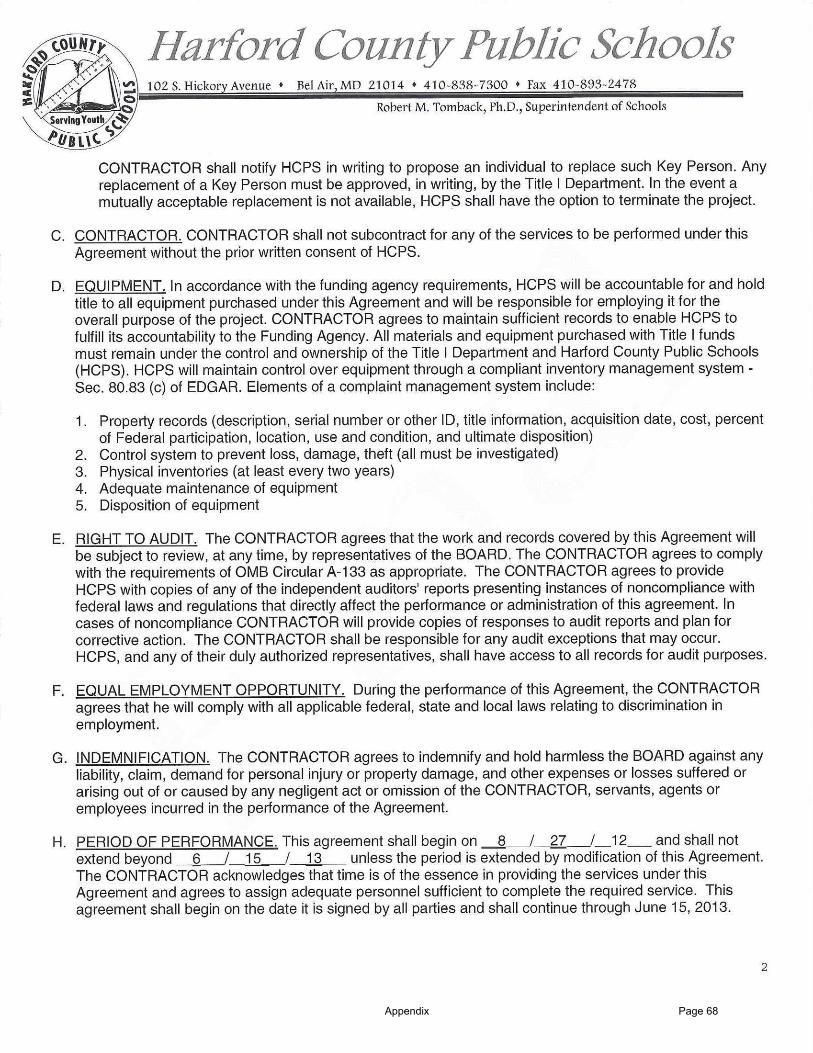
Appendix Page 68

Appendix Page 69
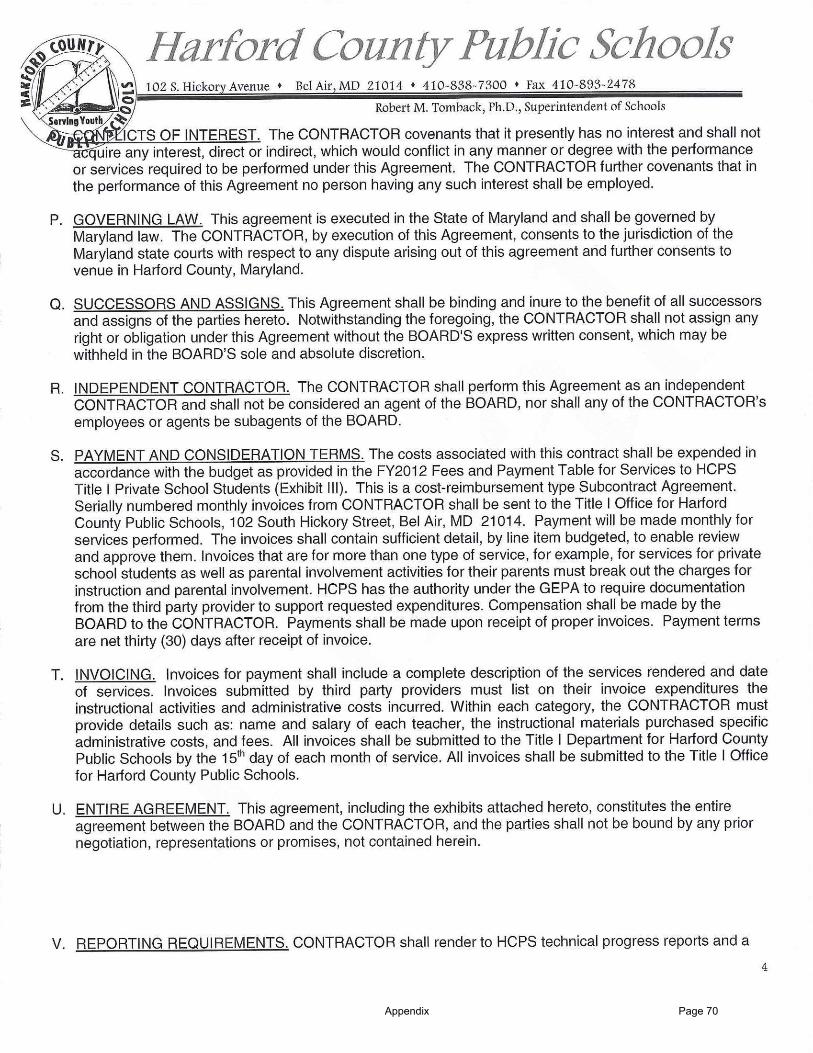
Appendix Page 70

Appendix Page 71

Attachment 8
Title II, Part A Preparing, Training and Recruiting
High-Quality Teachers and Principals
FY 2013 Harford County Public Schools A8.1

A. PERFORMANCE GOALS, INDICATORS, AND TARGETS. In the October 1, 2003 submission of the five-year comprehensive master plan, school systems provided an analysis of the teacher quality performance indicators detailed in Table 8-1. MSDE has established performance targets as part of the September 2003 Consolidated State Application submission to the United States Department of Education (USDE). Although local school systems do not need to respond to this section as part of the Master Plan Annual Update, local planning teams should review the teacher quality information to determine progress in meeting State and local performance targets. School systems should use the annual review of the teacher quality data to determine allowable Title II, Part A activities as well as to revise goals, objectives, and/or strategies in the Master Plan that relate to improving teacher quality.
Race to the Top: In the fall of 2010, HCPS embraced Maryland’s Race to the Top (RTTT) reform agenda. Also in 2010, the HCPS Board of Education (BOE) approved a Strategic Plan that aligns with Maryland’s RTTT goals. Included in the HCPS BOE’s plan is the goal “to hire and support skilled staff who are committed to increasing student achievement.” The implementation of RTTT and the BOE plans will ensure that all HCPS students can meet high standards. To that end, HCPS commits to the following elements of the State’s reform plan as described in the American Recovery and Reinvestment Act (ARRA):
• Supporting the transition to enhanced standards and high-quality assessments; • Using data to improve instruction; • Supporting great teachers and great leaders; and • Turning around HCPS lowest-achieving schools.
Educator Effectiveness Academies: In the summer of 2011, HCPS identified school based teams to participate in the Educator Effectiveness Academies. HCPS identified professional development days throughout the 2011-2012 school year to ensure classroom teachers receive intensive professional development on the implementation of the plans developed at the summer 2011 academies. In the summer of 2012, the teams participated in a second educator effectiveness academy. The teams worked on reviewing final versions of Reading/English Language Arts and Mathematics Frameworks; developing knowledge of the Maryland STEM Standards of Practice and Frameworks; developing knowledge of the format, lessons and media resources in the Reading/English Language Arts and Mathematics; and developing knowledge of STEM unit components and resources. Staff members attending the academies with their principal agreed to plan and organize, in collaboration with the principal, professional development activities during the 2012-2013 school year that will assist all staff members in developing a working knowledge of the Maryland Common Core State Curriculum Framework. Members of the school team also agree to participate in on-line follow-up sessions.
New Teacher Induction: The Coordinator of Teacher Induction who has been charged with participating in the State’s Induction Program Academies and sending HCPS mentors as allowable by the state; overseeing a comprehensive teacher induction program based on the model shared at the Teacher Induction Academies; supervising the continuation of the mentor teacher program; evaluating mentor teachers in collaboration with school administrators; collaborating with the Office of Education Services to assess school needs and to assign mentor teachers as appropriate; and serving as a liaison with MSDE. This position provides focused professional development for new teachers including, professional development orientation conference; three hour after school workshops throughout the year; opportunities to observe a model classroom and teacher; and job embedded professional development. The creation
FY 2013 Harford County Public Schools A8.2

of the new position, Coordinator of Teacher Induction, will enhance the work of the mentor teachers and will allow for additional supports provided for new teachers. Clerical support will also be provided for the Coordinator of Teacher Induction.
The Model Chairperson Initiative: HCPS implemented a Model Department Chair initiative. During the 2010-2011 and 2011-2012 school years, model department chairs in the core content areas were assigned to work with three principals and core content supervisors to provide supplementary content specific evaluative services. In addition to the high school assignment, the model department chairpersons collaborated with the Office of Professional Development in the development of programs to facilitate the preparation and transition of department chairpersons to their new role in the 2012 -2013 school year. Department Chairs in all high schools will experience increased roles and responsibilities working to ensure there are highly qualified teachers in core content areas in our secondary schools. In 2012-2013, the Model Department Chair initiative was expanded to include middle schools. Model department chairpersons were hired to provide content specific evaluative services and assistance to principals and will work with Office of Professional Development to facilitate the preparation and transition of middle school department chairs to their new role. HCPS Teacher Evaluation Pilot: HCPS utilized the Maryland Teacher and Principal Evaluation Guidebook published by the Maryland State Department of Education (MSDE), as well as Charlotte Danielson’s Framework for Teaching to determine the 2012-13 Teacher Evaluation Pilot. The Pilot will occur over the course of School Year 2012-13. At the beginning of the year, a teacher participating in the Pilot will develop a Professional Development Plan (PDP). One component of the PDP is a teacher self-assessment of levels of performance using the Framework for Teaching. The teacher will reflect upon his/her Framework for Teaching self-assessment and identify one professional practice goal. In addition, the teacher will identify one student learning objective, to be accomplished over the school year. The student learning objective (SLO) measures student growth by establishing learning goals.
FY 2013 Harford County Public Schools A8.3
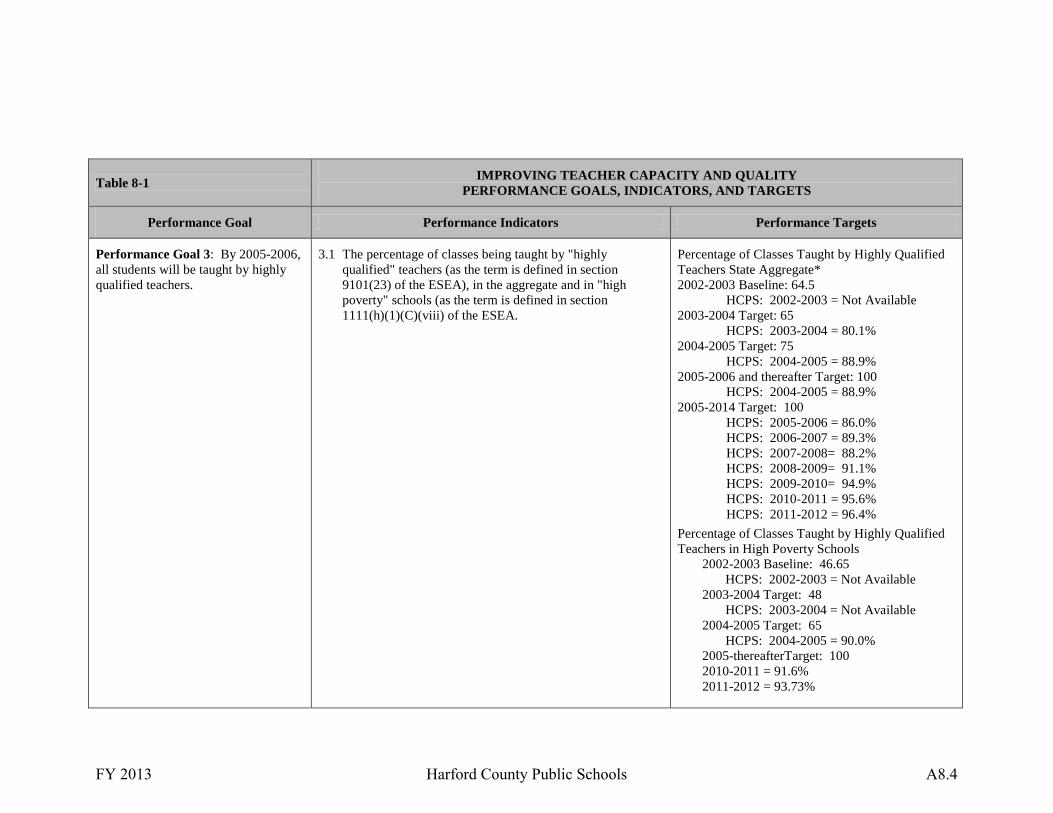
Table 8-1 IMPROVING TEACHER CAPACITY AND QUALITY
PERFORMANCE GOALS, INDICATORS, AND TARGETS
Performance Goal Performance Indicators Performance Targets
Performance Goal 3: By 2005-2006, all students will be taught by highly qualified teachers.
3.1 The percentage of classes being taught by "highly qualified" teachers (as the term is defined in section 9101(23) of the ESEA), in the aggregate and in "high poverty" schools (as the term is defined in section 1111(h)(1)(C)(viii) of the ESEA.
Percentage of Classes Taught by Highly Qualified Teachers State Aggregate* 2002-2003 Baseline: 64.5
HCPS: 2002-2003 = Not Available 2003-2004 Target: 65
HCPS: 2003-2004 = 80.1% 2004-2005 Target: 75
HCPS: 2004-2005 = 88.9% 2005-2006 and thereafter Target: 100
HCPS: 2004-2005 = 88.9% 2005-2014 Target: 100
HCPS: 2005-2006 = 86.0% HCPS: 2006-2007 = 89.3% HCPS: 2007-2008= 88.2% HCPS: 2008-2009= 91.1% HCPS: 2009-2010= 94.9% HCPS: 2010-2011 = 95.6% HCPS: 2011-2012 = 96.4%
Percentage of Classes Taught by Highly Qualified Teachers in High Poverty Schools
2002-2003 Baseline: 46.65 HCPS: 2002-2003 = Not Available
2003-2004 Target: 48 HCPS: 2003-2004 = Not Available
2004-2005 Target: 65 HCPS: 2004-2005 = 90.0%
2005-thereafterTarget: 100 2010-2011 = 91.6% 2011-2012 = 93.73%
FY 2013 Harford County Public Schools A8.4
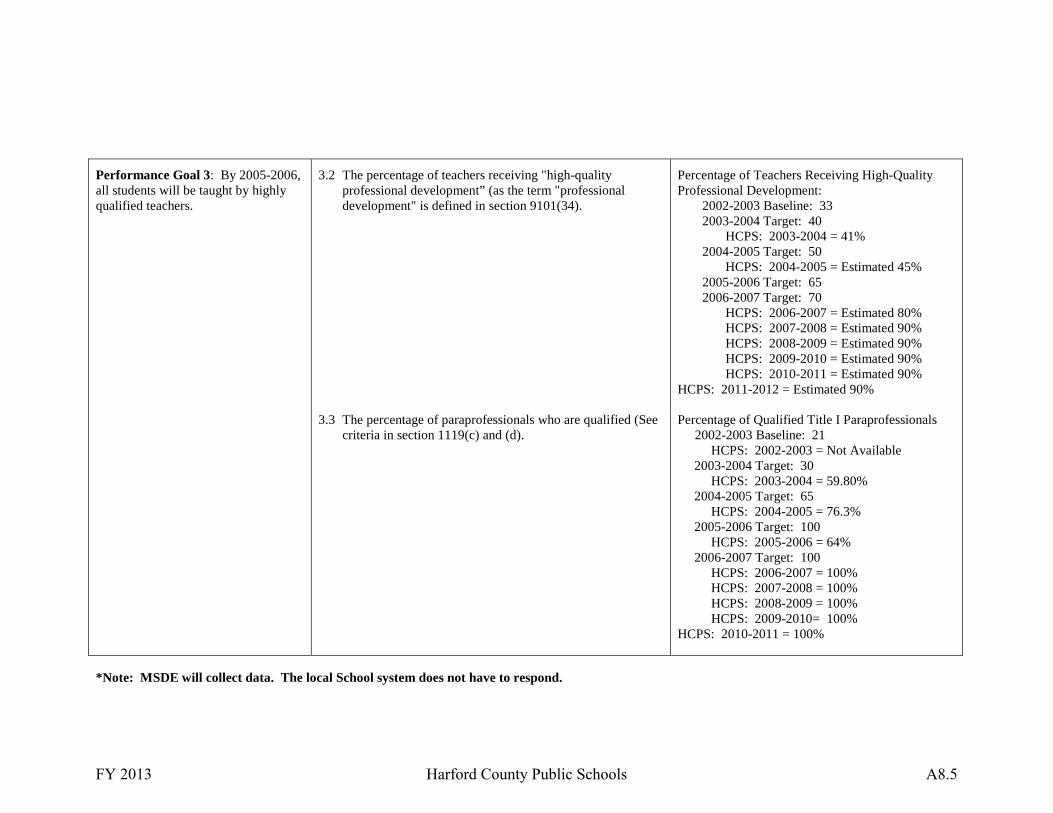
Performance Goal 3: By 2005-2006, all students will be taught by highly qualified teachers.
3.2 The percentage of teachers receiving "high-quality professional development” (as the term "professional development" is defined in section 9101(34).
Percentage of Teachers Receiving High-Quality Professional Development:
2002-2003 Baseline: 33 2003-2004 Target: 40
HCPS: 2003-2004 = 41% 2004-2005 Target: 50
HCPS: 2004-2005 = Estimated 45% 2005-2006 Target: 65 2006-2007 Target: 70
HCPS: 2006-2007 = Estimated 80% HCPS: 2007-2008 = Estimated 90% HCPS: 2008-2009 = Estimated 90% HCPS: 2009-2010 = Estimated 90% HCPS: 2010-2011 = Estimated 90%
HCPS: 2011-2012 = Estimated 90%
3.3 The percentage of paraprofessionals who are qualified (See criteria in section 1119(c) and (d).
Percentage of Qualified Title I Paraprofessionals 2002-2003 Baseline: 21
HCPS: 2002-2003 = Not Available 2003-2004 Target: 30
HCPS: 2003-2004 = 59.80% 2004-2005 Target: 65
HCPS: 2004-2005 = 76.3% 2005-2006 Target: 100
HCPS: 2005-2006 = 64% 2006-2007 Target: 100
HCPS: 2006-2007 = 100% HCPS: 2007-2008 = 100% HCPS: 2008-2009 = 100% HCPS: 2009-2010= 100%
HCPS: 2010-2011 = 100%
*Note: MSDE will collect data. The local School system does not have to respond.
FY 2013 Harford County Public Schools A8.5

B. ALLOWABLE ACTIVITIES [Section 2123]. For all allowable activities that will be implemented, (a) provide a brief description of services, (b) timelines or target dates, (c) the specific goals, objectives, and/or strategies detailed in the 5-year comprehensive Bridge to Excellence Master Plan, and (d) the amount of funding for services to public and nonpublic students and teachers. Use separate pages as necessary for descriptions.
1. Strategies and Activities to Recruit and Hire Highly Qualified Teachers and Principals
Allowable Activities Brief Description of Specific Services, Timelines or Target Dates, and Specific Goals, Objectives, and Strategies Detailed in the 5-Year Comprehensive Bridge to Excellence Master Plan, and any Revisions to the Plan as Part of this Annual Update, including Page Numbers. All activities funded by Title II, Part A for high quality professional development must meet the six components of the Maryland Teacher Professional Development Planning Guide.
Public School Costs
1.1 Developing and implementing mechanisms to assist schools to effectively recruit and retain highly qualified teachers, principals, and specialists in core academic areas (and other pupil services personnel in special circumstances) [section 2123(a)(1)].
1.2 Developing and implementing strategies and activities to recruit, hire, and retain highly qualified teachers and principals. These strategies may include (a) providing monetary incentives such as scholarships, signing bonuses, or differential pay for teachers in academic subjects or schools in which the LEA has shortages*; (b) reducing class size; (c) recruiting teachers to teach special needs children, and (d) recruiting qualified paraprofessionals and teachers from populations underrepresented in the teaching profession, and providing those paraprofessionals with alternative routes to obtaining teacher certification [section 2123(a)(2)].
*Note: Because the purpose of Title II-A is to increase
REDUCING CLASS SIZE Classroom teachers will continue to be employed under Title II, Part A funding to reduce class size. According to the National Education Association, “Teachers with small classes can spend time and energy helping each child to succeed. Smaller classes also enhance safety, discipline and order in the classroom. Its common sense and the research prove that it works to increase student achievement.” The HCPS system teachers are placed in schools with class sizes that exceed the county averages to provide more individualized instruction. Smaller class sizes should afford
FUNDING FOR SERVICES: • 15 teachers @ an average of
$45,867 per teacher = $688,000 • Fixed Costs – As required by law,
fixed costs @ 41.787% per average teacher = $287,500
Reducing Class Size: $975,500
ACTIVITY 1.2 TOTAL BUDGET: $975,500
FY 2013 Harford County Public Schools A8.6

student achievement, programs that provide teachers and principals with merit pay, pay differential, and/or monetary bonuses should be linked to measurable increases in student academic achievement produced by the efforts of the teacher or principal [section 2101(1)].
every student the opportunity to receive the individual attention necessary to assist him or her in being successful. Class size reduction efforts will support the goals and activities identified in Section D: Great Teachers and Great Leaders. The recruitment of teachers to fill various vacancies for positions used to reduce class size will focus on teacher candidates that have successfully completed all certification requirements. Highly-qualified candidates will be pursued. TIMELINE AND TARGET DATES: • Schools identified, teachers hired and
professional development, training provided for teachers employed to reduce class size 9/1/12-6/30/14.
• Recruitment of highly-qualified teachers – ongoing.
1.3 Hiring highly qualified teachers, including teachers who become highly qualified through State and local alternative routes to certification, and special education teachers, in order to reduce class size, particularly in the early grades [section 2123(a)(7)].
FY 2013 Harford County Public Schools A8.7
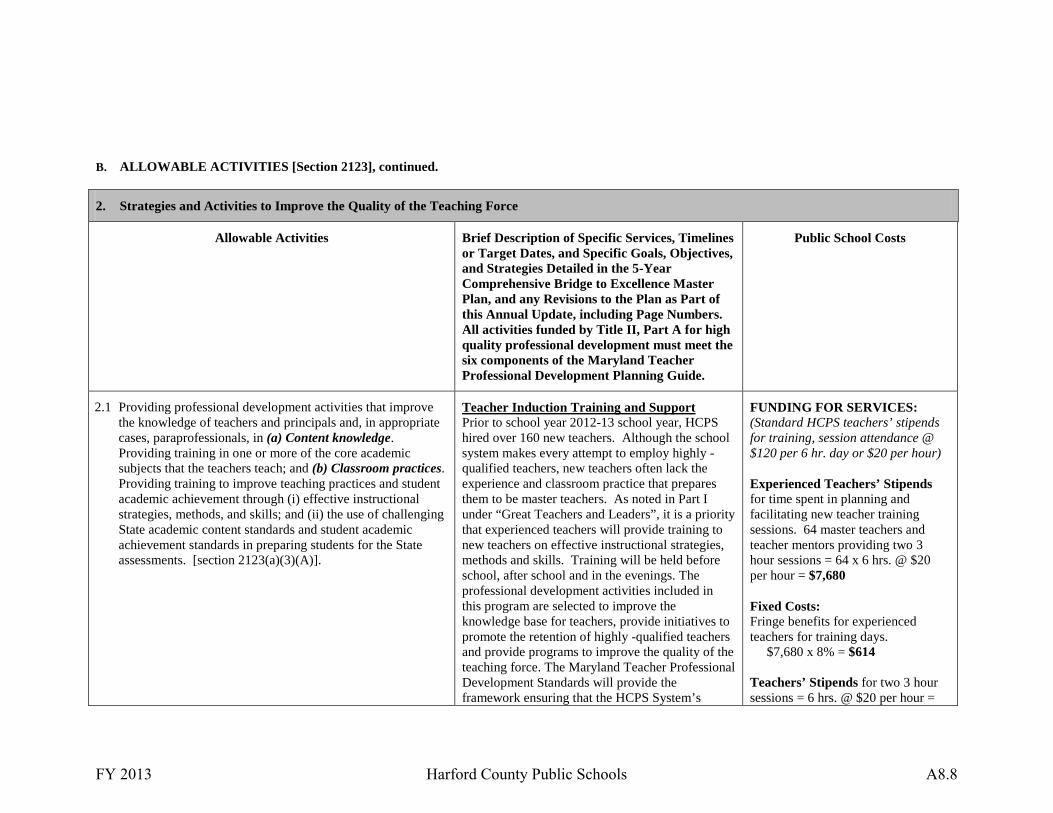
B. ALLOWABLE ACTIVITIES [Section 2123], continued.
2. Strategies and Activities to Improve the Quality of the Teaching Force
Allowable Activities Brief Description of Specific Services, Timelines or Target Dates, and Specific Goals, Objectives, and Strategies Detailed in the 5-Year Comprehensive Bridge to Excellence Master Plan, and any Revisions to the Plan as Part of this Annual Update, including Page Numbers. All activities funded by Title II, Part A for high quality professional development must meet the six components of the Maryland Teacher Professional Development Planning Guide.
Public School Costs
2.1 Providing professional development activities that improve the knowledge of teachers and principals and, in appropriate cases, paraprofessionals, in (a) Content knowledge. Providing training in one or more of the core academic subjects that the teachers teach; and (b) Classroom practices. Providing training to improve teaching practices and student academic achievement through (i) effective instructional strategies, methods, and skills; and (ii) the use of challenging State academic content standards and student academic achievement standards in preparing students for the State assessments. [section 2123(a)(3)(A)].
Teacher Induction Training and Support Prior to school year 2012-13 school year, HCPS hired over 160 new teachers. Although the school system makes every attempt to employ highly -qualified teachers, new teachers often lack the experience and classroom practice that prepares them to be master teachers. As noted in Part I under “Great Teachers and Leaders”, it is a priority that experienced teachers will provide training to new teachers on effective instructional strategies, methods and skills. Training will be held before school, after school and in the evenings. The professional development activities included in this program are selected to improve the knowledge base for teachers, provide initiatives to promote the retention of highly -qualified teachers and provide programs to improve the quality of the teaching force. The Maryland Teacher Professional Development Standards will provide the framework ensuring that the HCPS System’s
FUNDING FOR SERVICES: (Standard HCPS teachers’ stipends for training, session attendance @ $120 per 6 hr. day or $20 per hour) Experienced Teachers’ Stipends for time spent in planning and facilitating new teacher training sessions. 64 master teachers and teacher mentors providing two 3 hour sessions = 64 x 6 hrs. @ $20 per hour = $7,680 Fixed Costs: Fringe benefits for experienced teachers for training days.
$7,680 x 8% = $614 Teachers’ Stipends for two 3 hour sessions = 6 hrs. @ $20 per hour =
FY 2013 Harford County Public Schools A8.8

professional development program and activities appropriately address priorities and goals for improving student learning. TIMELINE AND TARGET DATES: • New Teacher After School Training and
support -9/2013– 6/2014
$120 per teacher x 200 teachers = $24,000 Fixed Costs: $24,000 x 8% = $1,920
Teacher Induction Training and
Support: $34,214
2.1 Continued
Advancement Via Individualized Determination (AVID): Since 2010, HCPS has been providing the Advancement Via Individual Determination (AVID) program at Aberdeen Middle and Havre de Grace Middle, two schools on the School Improvement list during the 2011-2012 school year. AVID provides students with support for their college preparatory classes through tutors and training that focuses on study skills, writing, inquiry, collaborative work groups, and success for advanced classes, such as Algebra. AVID is a research based program that has been proven to work with “B, C, and D” basic and proficient students. In the fall of 2013, Aberdeen High and Havre de Grace High will begin the AVID program. High school teachers will attend AVID summer institute in the summer of 2012-2013 hosted by AVID national. Teachers will participate in follow-up workshops throughout the following school year to learn instructional skills that are focused on improving “the student in the middle” performance. Implementation of AVID is done with the assistance of AVID National. AVID National will work with HCPS on ensuring fidelity of implementation to the middle school model and will include AVID Certification oversight and monitoring.
Stipends AVID Summer Institute: • 16 teachers x $120/day = $1,920 x
4 days = $7,680
• Fixed Costs: Fringe Benefits for summer training 2013. $7,680 x 8% = $614
Other AVID Summer Institute 2013: • Registration fees for 16 teachers
@ $669/teacher = $10,704
• Summer Institute Hotel = 8 rooms x $225 = $1,800
Supplies and Materials • Two libraries (one for each high
school) to support AVID teachers = 1 x $5,669 = $5,669
AVID: $26,467
ACTIVITY 2.1 TOTAL BUDGET: $60,681
FY 2013 Harford County Public Schools A8.9
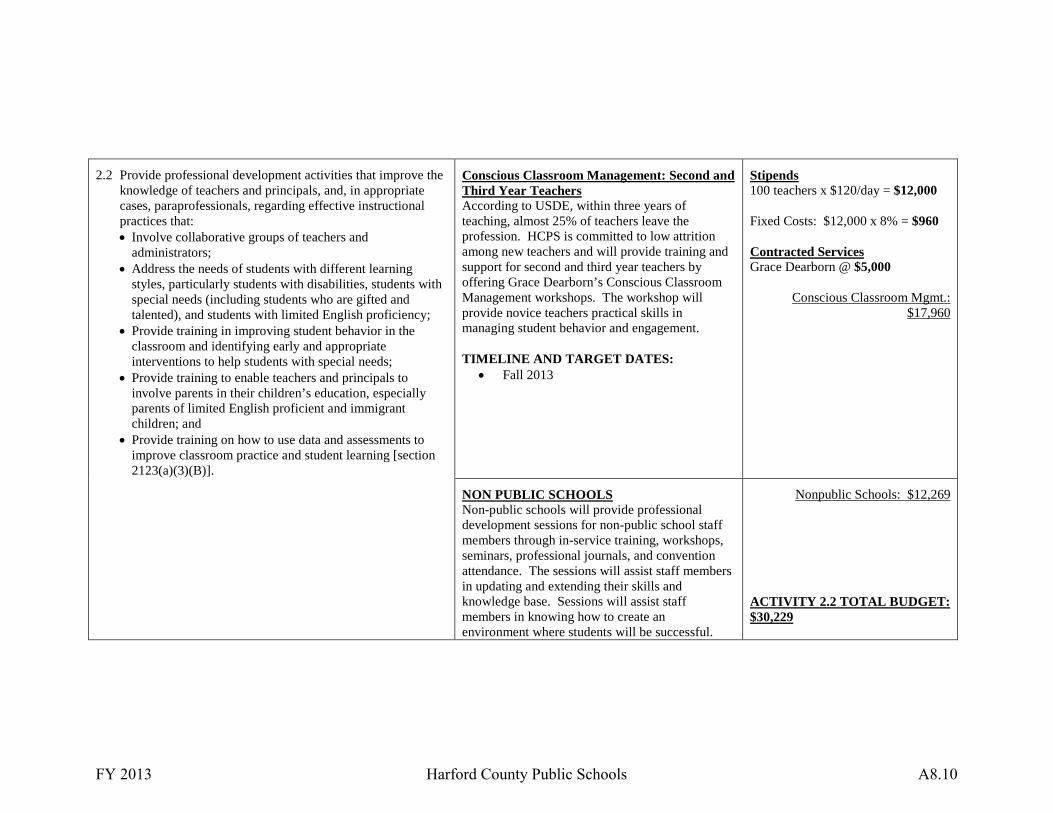
2.2 Provide professional development activities that improve the knowledge of teachers and principals, and, in appropriate cases, paraprofessionals, regarding effective instructional practices that: • Involve collaborative groups of teachers and
administrators; • Address the needs of students with different learning
styles, particularly students with disabilities, students with special needs (including students who are gifted and talented), and students with limited English proficiency;
• Provide training in improving student behavior in the classroom and identifying early and appropriate interventions to help students with special needs;
• Provide training to enable teachers and principals to involve parents in their children’s education, especially parents of limited English proficient and immigrant children; and
• Provide training on how to use data and assessments to improve classroom practice and student learning [section 2123(a)(3)(B)].
Conscious Classroom Management: Second and Third Year Teachers According to USDE, within three years of teaching, almost 25% of teachers leave the profession. HCPS is committed to low attrition among new teachers and will provide training and support for second and third year teachers by offering Grace Dearborn’s Conscious Classroom Management workshops. The workshop will provide novice teachers practical skills in managing student behavior and engagement. TIMELINE AND TARGET DATES:
• Fall 2013
Stipends 100 teachers x $120/day = $12,000 Fixed Costs: $12,000 x 8% = $960 Contracted Services Grace Dearborn @ $5,000
Conscious Classroom Mgmt.: $17,960
NON PUBLIC SCHOOLS Non-public schools will provide professional development sessions for non-public school staff members through in-service training, workshops, seminars, professional journals, and convention attendance. The sessions will assist staff members in updating and extending their skills and knowledge base. Sessions will assist staff members in knowing how to create an environment where students will be successful.
Nonpublic Schools: $12,269 ACTIVITY 2.2 TOTAL BUDGET: $30,229
FY 2013 Harford County Public Schools A8.10

Public School Costs
Nonpublic School Costs
Subtotal
Indirect Costs @ 2.21%
TOTAL TITLE II-A FUNDING AMOUNT
1,054,141
12,269
1,066,410
23,568
$1,089,978
FY 2013 Harford County Public Schools A8.11

C. HIGHLY QUALIFIED TEACHERS
1. Given your school system’s analysis of data on highly qualified teachers in core academic subjects, describe how these strategies and activities will directly contribute to attracting and retaining highly qualified teachers in core academic subjects at the elementary and secondary level.
Data Analysis: Harford County Public School (HCPS) system, home to more than 38,000 students, is privileged to employ and maintain qualified, motivated and successful teachers, focusing each day on connecting with every one of their students. Assessment of the current status of teacher capacity and quality for the HCPS system and for each elementary, middle and high school relative to the hiring, recruiting, and retaining of highly-qualified teachers occurs on a continuous basis. In 2011-2012, 96.4% of over 3,500 HCPS teachers were highly qualified, a 16% increase over the 2003-2004 school year. Of those classes not taught by Highly-Qualified Teachers, the two major reasons cited are that the Testing Requirements have not been met or the teacher holds a Conditional Certificate. System-wide strategies are in place to ensure highly qualified teachers in core academic subject areas are attracted and retained. Additionally, as principals determine a need for specific professional development for their instructional staff, the HCPS teacher calendar designates 5 teacher days for the implementation of targeted professional development at the school level.
Class size reduction: Use of Title II A funds to support class size reduction continues to ensure student achievement. Compelling evidence demonstrates that reducing class size, particularly for younger children, has a positive effect on student learning. Title II A funds allow for the creation of smaller class sizes and Highly Qualified teachers provide individualized instruction for young children in HCPS elementary schools with higher numbers of enrollment. Recruitment: HCPS continues to see a steady increase in the number of applications for employment. In 2012, over 160 new teachers were hired. HCPS recently converted fully to an electronic web-based application process for all positions. Including current teachers and content specialists in “hard to staff” disciplines (math, chemistry, physics) has provided an immediate connection for prospective staff members. Utilizing the evaluation from job fairs, HR determines who the effective recruiters are and what job fairs produce a result sufficient to warrant the cost of returning in the future. HR works with principals to place new hires and transfers in positions for which they are highly qualified. Credentials for individuals who are not HQ are evaluated and, if applicable, individuals are notified. Each year, principals and teachers are notified to determine the best way for the teacher to become HQ. Principals are requested to submit their staffing rosters to HR to verify accurate placement. In order to ensure that all teachers funded through Title II, Part A retain their highly qualified status, principals are requested to submit their staffing rosters to HR to verify accurate placement. Attendance at college fairs is targeted to include colleges/universities with teacher education programs in critical shortage areas as well as in geographical areas of the country with high teacher production and low teacher employment ratios (e.g. Michigan, Illinois). Reshaping our recruitment and recruiter training efforts has allowed us to focus on recruiter selection and training. These changes have proven successful in determining the candidates to focus on during our recruitment efforts. As presented in the annual Recruitment and Retention Report to the HCPS BOE, the plan included the creation of a recruiter training program which focuses on identifying and targeting candidates (quality vs. quantity), assessment and evaluation of candidates, legal implications, promoting HCPS as an employer of choice and the logistics of a job fair (marketing and booth display).
FY 2013 Harford County Public Schools A8.12

Recruiters are now nominated by the appropriate Executive Director with returning recruiters and new recruiters attending separate training sessions which are focused on their specific needs. Retention: The importance of recruiting and retaining a highly qualified and diverse workforce is illustrated in the HCPS BOE’s Strategic Plan: Goal 3: “To hire and support skilled staff who are committed to increasing student achievement.” With the introduction of RTTT New Teacher Induction Coordinator, this position is building quality HCPS professional development for new teachers including, professional development orientation conference; after school workshops throughout the year; opportunities to observe a model classroom and teacher; and job embedded professional development. The creation of the new position, Coordinator of Teacher Induction, is continuing to enhance the work of the mentor teachers and allowing for additional supports provided for new teachers. The New Teacher Induction Coordinator is working to implement best practices provided by the MSDE sponsored New Teacher Center. The following is a list of activities available system-wide designed to support new teachers:
• Teacher Mentors – work directly in schools to teach demonstration lessons, assist in daily and unit planning and organization, provide guidance
in addressing classroom behavior management, guide the use of curricula and provide assistance on the many topics facing new teachers such as grading assessment and special education issues.
• Instructional Facilitators – engage in the informal and formal observation and evaluation process and guide the use of curricula and materials of instruction including supporting the small percentage of teachers who are Not Highly-Qualified in Core Content to pursue required certification.
• Content Supervisors – provide curriculum guides, contact specific professional development, and work with secondary Department Chairpersons to support teachers.
• Professional Development – offered at the beginning of the school year via HCPS Orientation Conference, technology workshops, specific curriculum content and the end of year June professional conference; evening professional development sessions including content specific teaching techniques and attendance at state-of-the-art conferences and trainings outside of Harford County.
• Professional learning communities and College Board training for new hires responsible for teaching AP courses. • Throughout the school year, a Title I Saturday Professional Lab is offered to first and second year teachers.
In addition to the HCPS system-wide structure designed to support the retention of teachers, Harford County provides all professional development based on Maryland Teacher Professional Development Standards. Using the context for High-Quality Teacher Professional Development, HCPS leadership supports:
• The use of Professional Learning Communities. • Leaders who are committed to high quality Professional Development and encourage teacher participation. • Infusion of clear expectations of what teachers need to know in order to help students learn through performance appraisal and design/content
of teacher professional development. HCPS has institutionalized Professional Learning Communities (PLCs) in all schools and the district’s central office. The Instructional Leadership Team comprised of school administrators, instructional facilitators, and teacher mentors, engage in training sessions annually to focus on professional
FY 2013 Harford County Public Schools A8.13

learning communities, group effectiveness, change, research-based best practices, and job-embedded professional development. This training supports the cultivation of PLC’s within the school community. Teachers have opportunities to engage in PLC’s during faculty meetings, team planning periods, duty periods, and/or during the designated countywide professional development days. Professional learning communities consistently operate along five dimensions: (1) supportive and shared leadership, (2) shared values and vision, (3) collective learning and application of learning (formerly identified as collective creativity), (4) supportive conditions, and (5) shared personal practice. Second year teachers who are surveyed consistently cite the support of the Teacher Mentors and assistance of Instructional Facilitators as reasons for choosing to return to HCPS. HCPS is committed to providing teachers with access to high-quality professional development opportunities designed to enhance teaching skills and to accelerate student learning.
FY 2013 Harford County Public Schools A8.14

2. If applicable, describe how these strategies and activities will contribute to reducing the gap between high poverty schools and low poverty schools with respect to the percentage of core academic classes taught by highly qualified teachers.
By the end of the school year 2011-2012, Title I HCPS were staffed 100% with Highly-Qualified Teachers. Intensive professional development activities have been designed for these schools including the implementation of Classroom Learning Systems and other high-quality teacher trainings. Retaining highly-qualified teachers in Title I schools will be promoted through additional professional development activities with stipends and MSDE credit, co-teaching opportunities, and mentoring support (after school/weekends). There are three schools in the HCPS System that are listed as high poverty, Magnolia Elementary School (MES) and Hall’s Cross Roads Elementary School (HXES), and the secondary school, Alternative Education Center (CEO). In FY 2012, both MES and HXES achieved 100% Highly-Qualified Teaching (HQT) staff. In addition to hiring only teachers with HQT status, staff has participated in intensive professional development with resources provided through Title I and the HCPS Central Office. Grade-level and special area teachers meet in Professional Learning Communities (PLC) to identify common goals and develop professional development plans to meet those goals. Professional Development Academy sessions were conducted throughout the year that provided teachers and paraprofessionals the opportunity to learn strategies that would impact student achievement. In addition, Title I staff provided professional development to School Improvement Team (SIT) members on creating quality School Improvement Plans and data assessment. The ALT/CEO is also listed as a high poverty school and serves students who may have experienced a crisis or have not been successful in a traditional school environment. The ALT/CEO has been identified for restructuring because of graduation rates. At outlined in the Alternative Governance Board Plan, the ALT/CEO will continue to work toward achieving 100% highly qualified teacher status. As with all schools, the ALT/CEO strives to achieve 100% in highly qualified teacher. One challenge faced by the ALT/CEO is the transiency of the students. With such a large number of students moving in and out of the school, it is difficult to staff in September not knowing what needs will be later in the year. To address the gap between high poverty schools and lower poverty schools with respect to the percentage of core academic classes taught by highly qualified teacher, the HCPS system is continuing its effort to employ only highly qualified teachers. Additionally, the supports offered new teachers, specifically in the form of new teacher induction sessions and consistent effective mentoring for all teachers, especially those non-tenured, prepares the non-highly qualified teacher to have a similar positive impact on student achievement as highly qualified teacher. As noted above, extra support is provided for teachers in high poverty schools so that all HCPS students have potential for improving achievement and reaching a high level of success. HCPS Title I schools have been improving in school performance and this is a reflection upon the direct intention to provide assistance through ensuring in-depth content knowledge and improved teaching skills of new and non-highly qualified teacher.
FY 2013 Harford County Public Schools A8.15
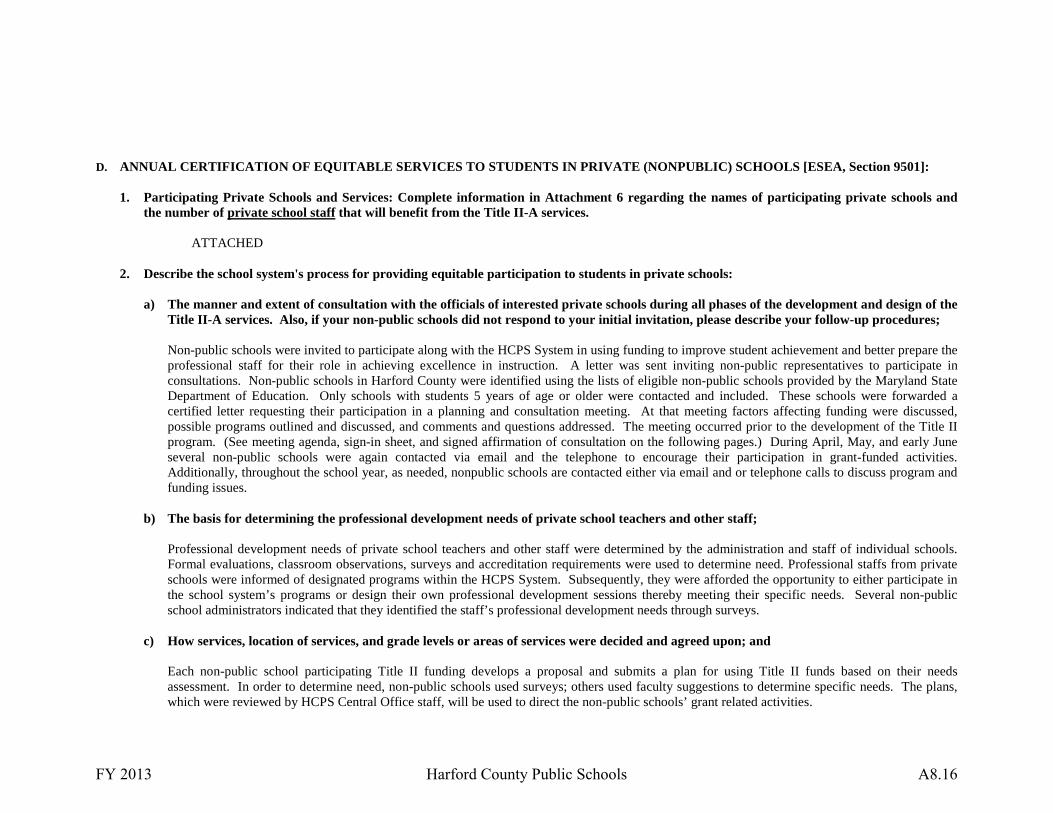
D. ANNUAL CERTIFICATION OF EQUITABLE SERVICES TO STUDENTS IN PRIVATE (NONPUBLIC) SCHOOLS [ESEA, Section 9501]:
1. Participating Private Schools and Services: Complete information in Attachment 6 regarding the names of participating private schools and the number of private school staff that will benefit from the Title II-A services.
ATTACHED
2. Describe the school system's process for providing equitable participation to students in private schools:
a) The manner and extent of consultation with the officials of interested private schools during all phases of the development and design of the Title II-A services. Also, if your non-public schools did not respond to your initial invitation, please describe your follow-up procedures;
Non-public schools were invited to participate along with the HCPS System in using funding to improve student achievement and better prepare the professional staff for their role in achieving excellence in instruction. A letter was sent inviting non-public representatives to participate in consultations. Non-public schools in Harford County were identified using the lists of eligible non-public schools provided by the Maryland State Department of Education. Only schools with students 5 years of age or older were contacted and included. These schools were forwarded a certified letter requesting their participation in a planning and consultation meeting. At that meeting factors affecting funding were discussed, possible programs outlined and discussed, and comments and questions addressed. The meeting occurred prior to the development of the Title II program. (See meeting agenda, sign-in sheet, and signed affirmation of consultation on the following pages.) During April, May, and early June several non-public schools were again contacted via email and the telephone to encourage their participation in grant-funded activities. Additionally, throughout the school year, as needed, nonpublic schools are contacted either via email and or telephone calls to discuss program and funding issues.
b) The basis for determining the professional development needs of private school teachers and other staff;
Professional development needs of private school teachers and other staff were determined by the administration and staff of individual schools. Formal evaluations, classroom observations, surveys and accreditation requirements were used to determine need. Professional staffs from private schools were informed of designated programs within the HCPS System. Subsequently, they were afforded the opportunity to either participate in the school system’s programs or design their own professional development sessions thereby meeting their specific needs. Several non-public school administrators indicated that they identified the staff’s professional development needs through surveys.
c) How services, location of services, and grade levels or areas of services were decided and agreed upon; and
Each non-public school participating Title II funding develops a proposal and submits a plan for using Title II funds based on their needs assessment. In order to determine need, non-public schools used surveys; others used faculty suggestions to determine specific needs. The plans, which were reviewed by HCPS Central Office staff, will be used to direct the non-public schools’ grant related activities.
FY 2013 Harford County Public Schools A8.16

d) The differences, if any, between the Title II-A services that will be provided to public and private school students and teachers, and the reasons for any differences. (Note: The school system provides services on an equitable basis to private school children whether or not the services are the same Title II-A services the district provides to the public school children. The expenditures for such services, however, must be equal -- consistent with the number of children served -- to Title II-A services provided to public school children.)
Professional development funds were made available to non-public school teachers based on the Title II, A formula determining professional development funds per public school student:
1. Total amount of Fiscal Year funds used for professional development in this proposal divided by the number of public K-12 students = $ per public school student.
2. $ Per public school student x the number of nonpublic K-12 students = $nonpublic funds. Compare $nonpublic funds to FY02 Eisenhower Funds that were available for nonpublic schools ($12,269).
3. The greater of the two is the amount that will be made available for use by nonpublic teachers. E. BUDGET INFORMATION AND NARRATIVE
1. Provide a detailed budget on the MSDE Proposed Budget Form. The Proposed Budget must reflect how the funds will be spent, organized according to the budget objectives, and correlated to the activities and costs detailed in the Allowable Activities. MSDE budget forms are available in Excel format through the local finance officer or the MSDE Bridge to Excellence Master Plan Web Site at www.marylandpublicschools.org.
ATTACHED MSDE C-125 FORM
2. Provide a detailed budget narrative using the “Guidance for Completion of the Budget Narrative for Individual Grants.” (pp. 10-12 of this guidance document). The accompanying budget narrative should: (a) detail how the school system will use program funds to pay only reasonable and necessary direct administrative costs associated with the operation of the program; and (b) demonstrate the extent to which the budget is both reasonable and cost-effective.
ATTACHED BUDGET NARRATIVE
F. ATTACHMENTS 4-A and B, 5-A and B, and 6-A
Be certain to complete all appropriate templates in Part II: Attachment 4-A and 4-B: School Level Budget Summary Attachment 5-A: Transferability of ESEA Funds Attachment 5-B: Consolidation of ESEA Funds for Local Administration Attachment 6-A: Nonpublic School Information for ESEA Programs
FY 2013 Harford County Public Schools A8.17
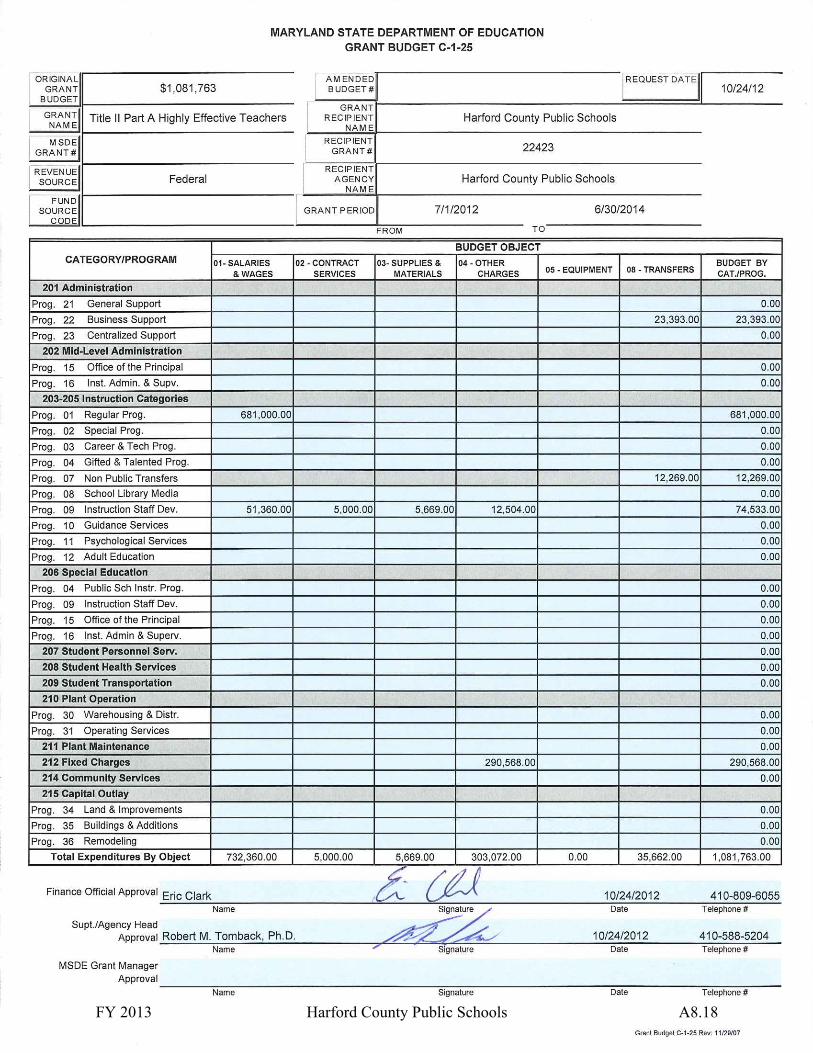
FY 2013 Harford County Public Schools A8.18

FY 2013 Harford County Public Schools A8.19
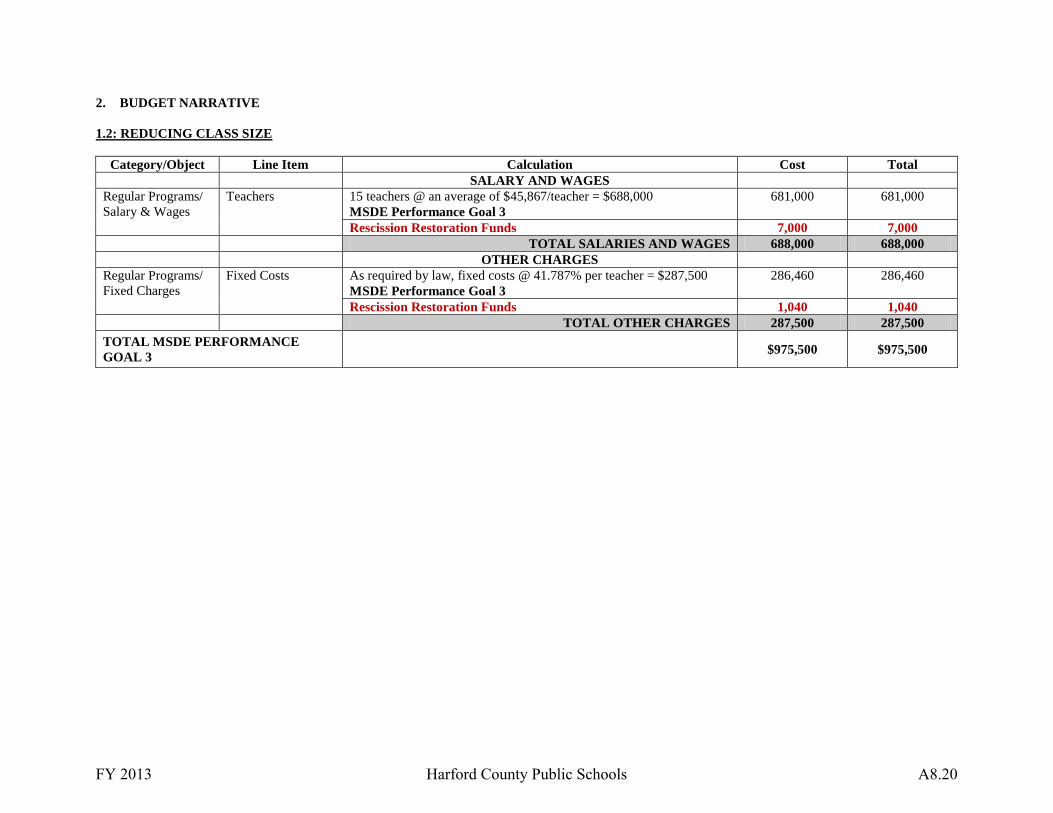
2. BUDGET NARRATIVE 1.2: REDUCING CLASS SIZE
Category/Object Line Item Calculation Cost Total SALARY AND WAGES Regular Programs/ Salary & Wages
Teachers 15 teachers @ an average of $45,867/teacher = $688,000 MSDE Performance Goal 3
681,000
681,000
Rescission Restoration Funds 7,000 7,000 TOTAL SALARIES AND WAGES 688,000 688,000 OTHER CHARGES Regular Programs/ Fixed Charges
Fixed Costs As required by law, fixed costs @ 41.787% per teacher = $287,500 MSDE Performance Goal 3
286,460 286,460
Rescission Restoration Funds 1,040 1,040 TOTAL OTHER CHARGES 287,500 287,500
TOTAL MSDE PERFORMANCE GOAL 3
$975,500 $975,500
FY 2013 Harford County Public Schools A8.20
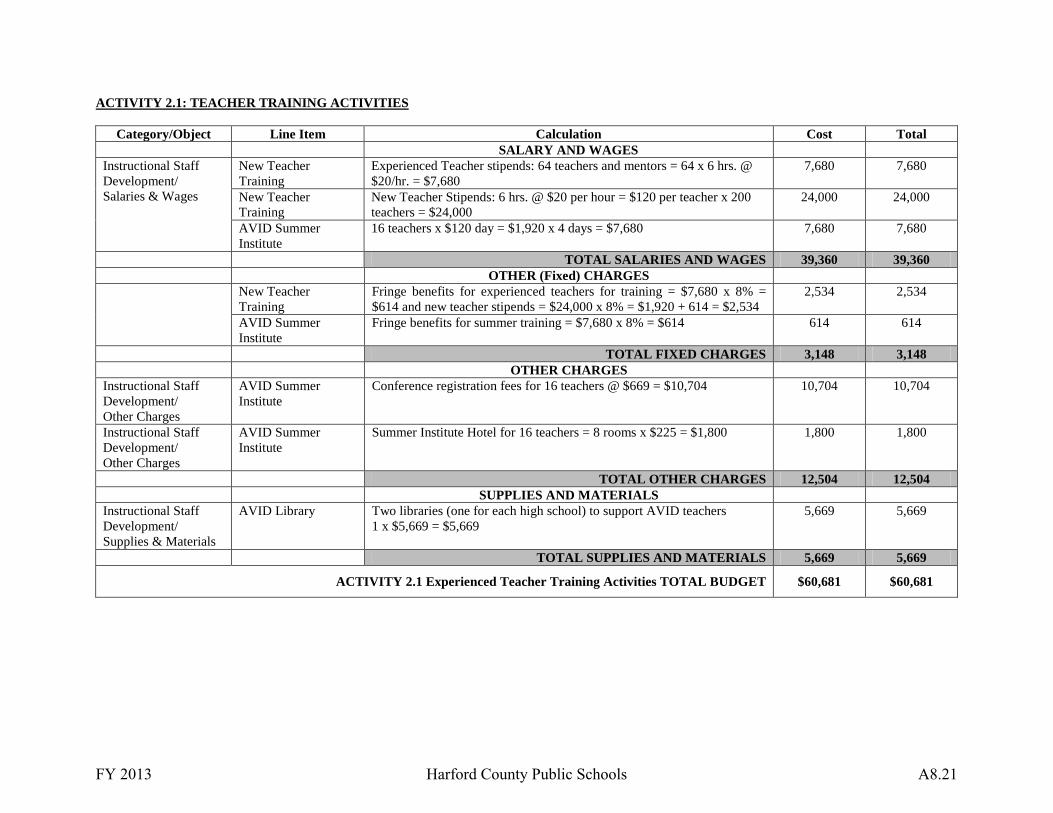
ACTIVITY 2.1: TEACHER TRAINING ACTIVITIES
Category/Object Line Item Calculation Cost Total SALARY AND WAGES Instructional Staff Development/ Salaries & Wages
New Teacher Training
Experienced Teacher stipends: 64 teachers and mentors = 64 x 6 hrs. @ $20/hr. = $7,680
7,680 7,680
New Teacher Training
New Teacher Stipends: 6 hrs. @ $20 per hour = $120 per teacher x 200 teachers = $24,000
24,000 24,000
AVID Summer Institute
16 teachers x $120 day = $1,920 x 4 days = $7,680 7,680 7,680
TOTAL SALARIES AND WAGES 39,360 39,360 OTHER (Fixed) CHARGES New Teacher
Training Fringe benefits for experienced teachers for training = $7,680 x 8% = $614 and new teacher stipends = $24,000 x 8% = $1,920 + 614 = $2,534
2,534 2,534
AVID Summer Institute
Fringe benefits for summer training = $7,680 x 8% = $614 614 614
TOTAL FIXED CHARGES 3,148 3,148 OTHER CHARGES Instructional Staff Development/ Other Charges
AVID Summer Institute
Conference registration fees for 16 teachers @ $669 = $10,704 10,704 10,704
Instructional Staff Development/ Other Charges
AVID Summer Institute
Summer Institute Hotel for 16 teachers = 8 rooms x $225 = $1,800 1,800 1,800
TOTAL OTHER CHARGES 12,504 12,504 SUPPLIES AND MATERIALS Instructional Staff Development/ Supplies & Materials
AVID Library Two libraries (one for each high school) to support AVID teachers 1 x $5,669 = $5,669
5,669 5,669
TOTAL SUPPLIES AND MATERIALS 5,669 5,669
ACTIVITY 2.1 Experienced Teacher Training Activities TOTAL BUDGET $60,681 $60,681
FY 2013 Harford County Public Schools A8.21

ACTIVITY 2.2: CLASSROOM MANAGEMENT TRAINING
Category/Object Line Item Calculation Cost Total SALARY AND WAGES Instructional Staff Development/ Salaries & Wages
Classroom Management Training
100 teachers x $120 day = $12,000 12,000 12,000
TOTAL SALARIES AND WAGES 12,000 12,000 OTHER (Fixed) CHARGES Classroom
Management Training Fringe benefits for classroom management training = $12,000 x 8% = 960
960 960
TOTAL FIXED CHARGES 960 960 CONTRACTED SERVICES Classroom
Management Training Grace Dearborn’s Conscious Classroom Management Workshops @ $5,000
5,000 5,000
TOTAL CONTRACTED SERVICES 5,000 5,000
ACTIVITY 2.2 Classroom Management Training TOTAL BUDGET $17,960 $17,960
NON-PUBLIC SCHOOL BUDGET
Category/Object Line Item Calculation Cost Total NON-PUBLIC SCHOOL PARTICIPATION
Nonpublic Transfers
Nonpublic School Participation*
John Carroll: • Training/professional development activities • Convention attendance and workshop attendance • Professional development supplies and materials
4,001 4,001
Mountain Christian: • Training/professional development activities • Convention attendance and workshop attendance • Professional development supplies and materials
1,416 1,416
Oak Grove: • Training/professional development activities • Convention attendance and workshop attendance • Professional development supplies and materials
441 441
FY 2013 Harford County Public Schools A8.22
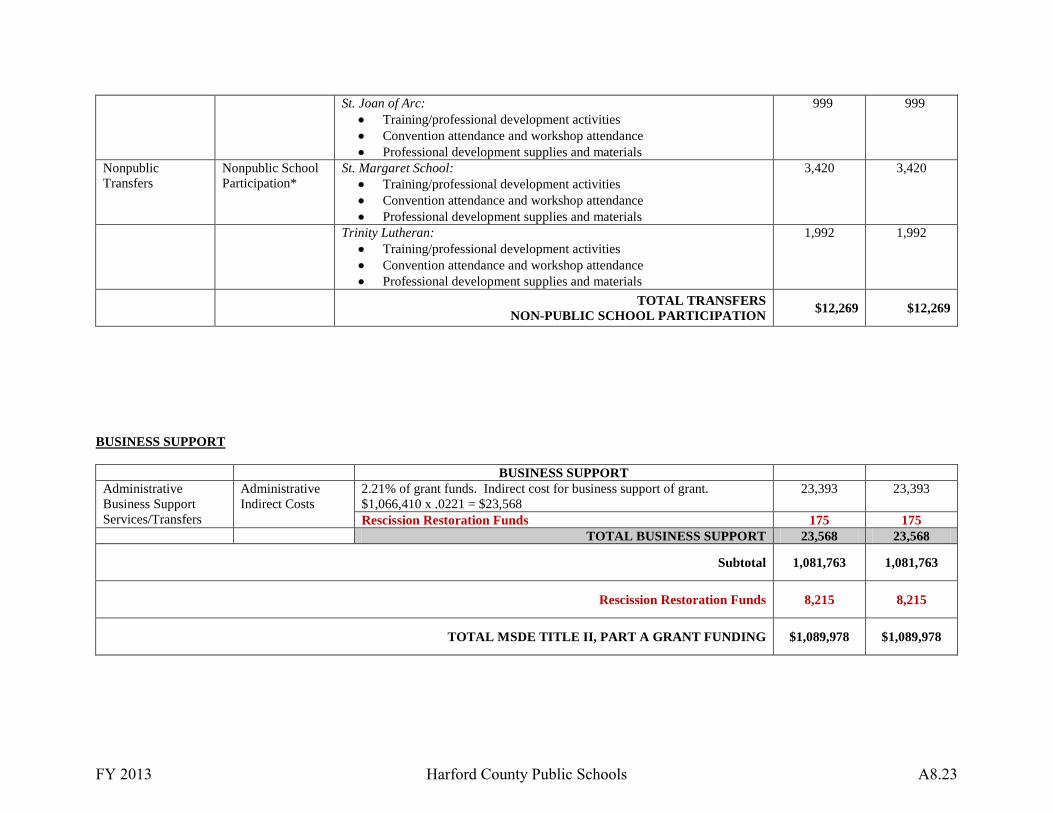
St. Joan of Arc: • Training/professional development activities • Convention attendance and workshop attendance • Professional development supplies and materials
999 999
Nonpublic Transfers
Nonpublic School Participation*
St. Margaret School: • Training/professional development activities • Convention attendance and workshop attendance • Professional development supplies and materials
3,420 3,420
Trinity Lutheran: • Training/professional development activities • Convention attendance and workshop attendance • Professional development supplies and materials
1,992 1,992
TOTAL TRANSFERS NON-PUBLIC SCHOOL PARTICIPATION
$12,269 $12,269
BUSINESS SUPPORT
BUSINESS SUPPORT Administrative Business Support Services/Transfers
Administrative Indirect Costs
2.21% of grant funds. Indirect cost for business support of grant. $1,066,410 x .0221 = $23,568
23,393 23,393
Rescission Restoration Funds 175 175 TOTAL BUSINESS SUPPORT 23,568 23,568
Subtotal 1,081,763 1,081,763
Rescission Restoration Funds 8,215 8,215
TOTAL MSDE TITLE II, PART A GRANT FUNDING $1,089,978 $1,089,978
FY 2013 Harford County Public Schools A8.23

ATTACHMENT 6-A NONPUBLIC SCHOOL INFORMATION FOR ESEA PROGRAMS
Fiscal Year 2013
Local School System: Harford County Public Schools
Enter the complete information for each participating nonpublic school, including mailing address. Use the optional “Comments” area to provide additional information about ESEA services to nonpublic school students, teachers, and other school personnel. For example, if Title I services are provided through home tutoring services or by a third party contractor, please indicate that information under “Comments.” NOTE: Complete Attachment 6-A for Title I-A, Title II-A, and Title III services. Use separate pages as necessary.
NONPUBLIC SCHOOL NAME AND ADDRESS
Number of Nonpublic School Participants (Students, Teachers, and Other School Personnel) Title I-A Title II-A Title III-A Comments (Optional)
Number nonpublic T-I students to be
served at the following locations:
Students Reading/Lang.
Arts (Can be a duplicated
count)
Students Mathematics
(Can be a duplicated
count)
Staff Students Staff
The John Carroll School 703 E. Churchville Road Bel Air, MD 21014
Private School
69
Public School
Neutral Site
Mountain Christian School 1824 Mountain Road Joppa, MD 21085
Private School
28
Public School
Neutral Site
Oak Grove Classical Christian School 2106 E. Churchville Road Bel Air, MD 21015
Private School
14
Public School
Neutral Site
FY 2013 Harford County Public Schools A8.24

St. Joan of Arc 230 Law Street Aberdeen, MD 21001
Private School
20
Public School
Neutral Site
St. Margaret Elementary 205 N. Hickory Avenue Bel Air, MD 21014
Private School
50
Public School
Neutral Site
Trinity Lutheran School 1100 Philadelphia Road Joppa, MD 21085
Private School
38
Public School
Neutral Site
FY 2013 Harford County Public Schools A8.25

FY 2013 Harford County Public Schools A8.26

FY 2013 Harford County Public Schools A8.27

FY 2013 Harford County Public Schools A8.28

FY 2013 Harford County Public Schools A8.29

FY 2013 Harford County Public Schools A8.30

FY 2013 Harford County Public Schools A8.31

FY 2013 Harford County Public Schools A8.32
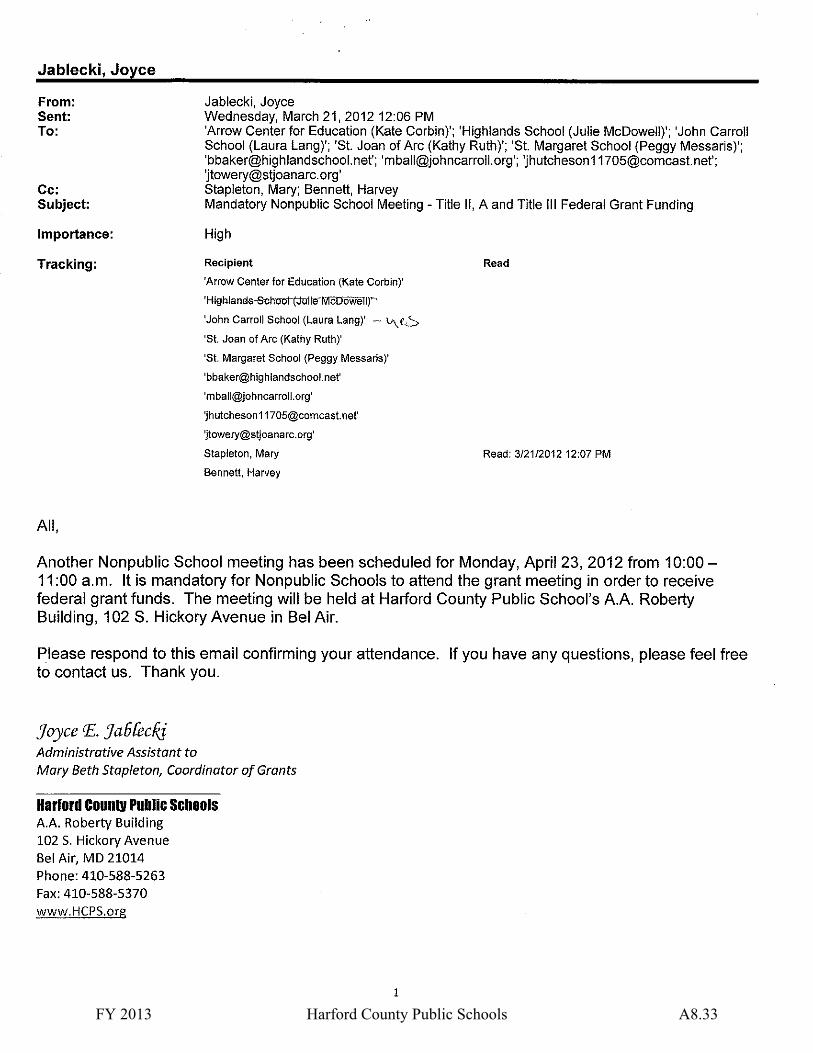
FY 2013 Harford County Public Schools A8.33

FY 2013 Harford County Public Schools A8.34
FY 2013 Harford County Public Schools A8.35
FY 2013 Harford County Public Schools A8.36
FY 2013 Harford County Public Schools A8.37

FY 2013 Harford County Public Schools A8.38

FY 2013 Harford County Public Schools A8.39

FY 2013 Harford County Public Schools A8.40
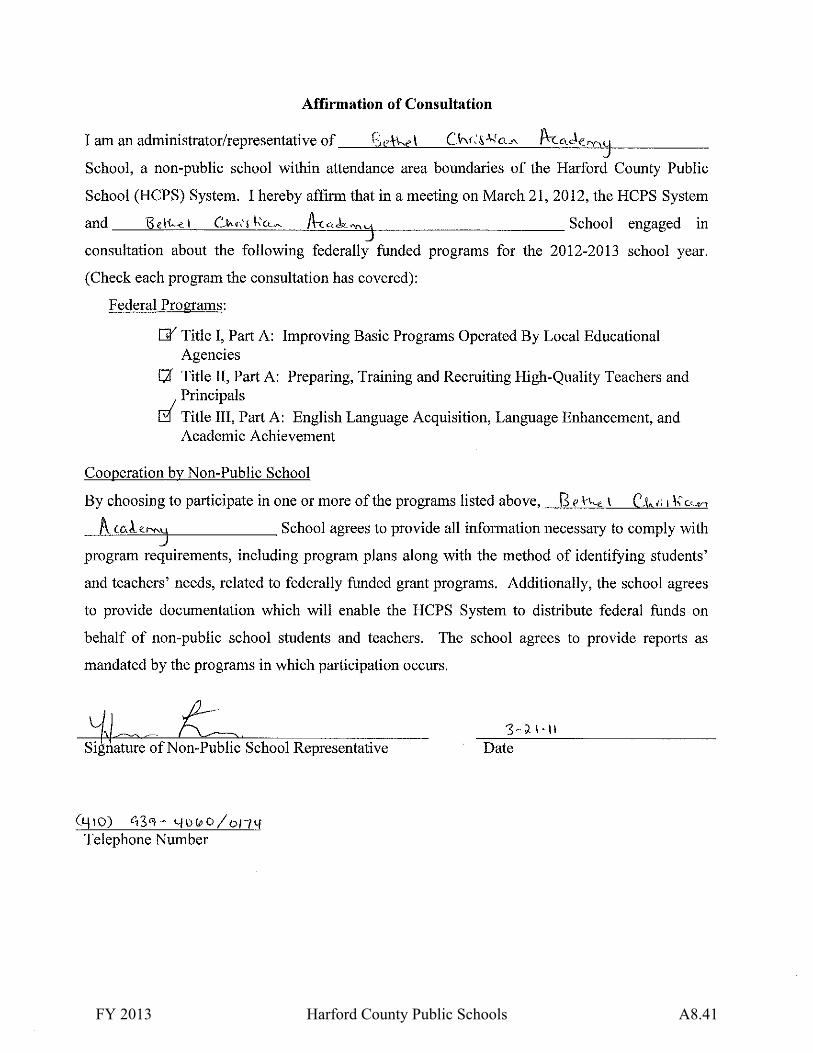
FY 2013 Harford County Public Schools A8.41
FY 2013 Harford County Public Schools A8.42

FY 2013 Harford County Public Schools A8.43

FY 2013 Harford County Public Schools A8.44

FY 2013 Harford County Public Schools A8.45
FY 2013 Harford County Public Schools A8.46
FY 2013 Harford County Public Schools A8.47

FY 2013 Harford County Public Schools A8.48

FY 2013 Harford County Public Schools A8.49

FY 2013 Harford County Public Schools A8.50

FY 2013 Harford County Public Schools A8.51

FY 2013 Harford County Public Schools A8.52

FY 2013 Harford County Public Schools A8.53

FY 2013 Harford County Public Schools A8.54

FY 2013 Harford County Public Schools A8.55

FY 2013 Harford County Public Schools A8.56

FY 2013 Harford County Public Schools A8.57
FY 2013 Harford County Public Schools A8.58

FY 2013 Harford County Public Schools A8.59

FY 2013 Harford County Public Schools A8.60

FY 2013 Harford County Public Schools A8.61
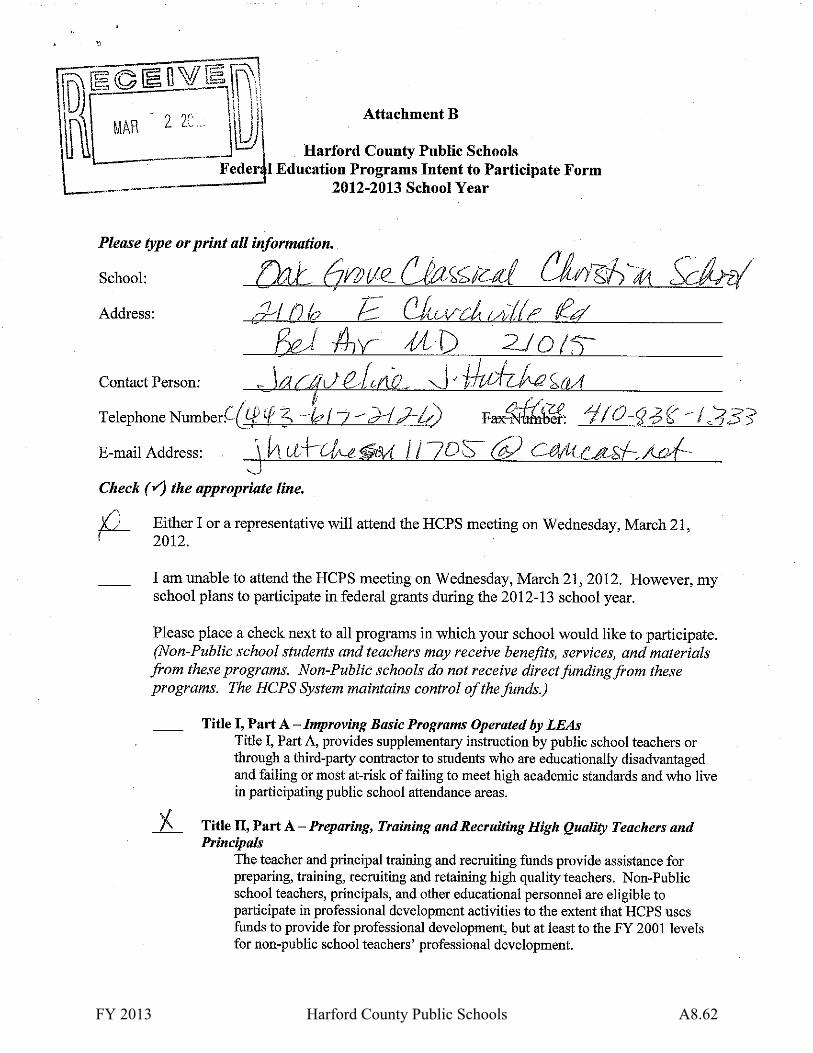
FY 2013 Harford County Public Schools A8.62

FY 2013 Harford County Public Schools A8.63

FY 2013 Harford County Public Schools A8.64

FY 2013 Harford County Public Schools A8.65
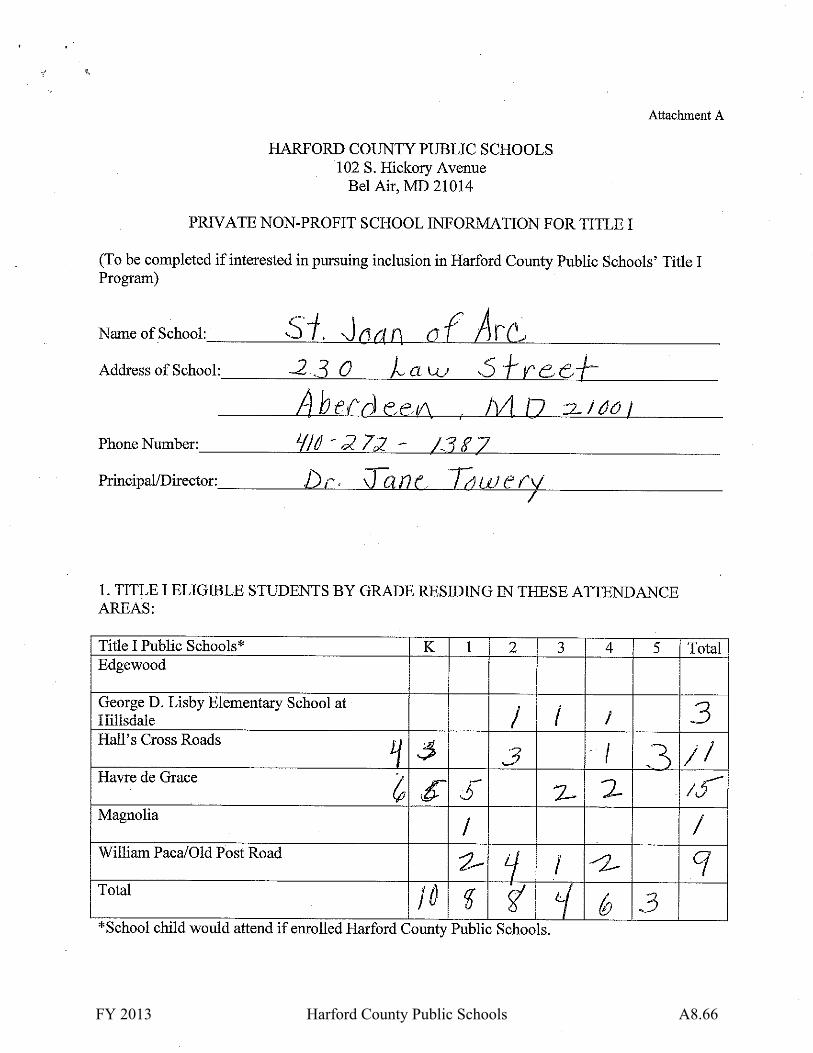
FY 2013 Harford County Public Schools A8.66

FY 2013 Harford County Public Schools A8.67

FY 2013 Harford County Public Schools A8.68

FY 2013 Harford County Public Schools A8.69

FY 2013 Harford County Public Schools A8.70

FY 2013 Harford County Public Schools A8.71

FY 2013 Harford County Public Schools A8.72

FY 2013 Harford County Public Schools A8.73

Attachment 10
Title III, Part A English Language Acquisition, Language
Enhancement, and Academic Achievement
FY 2013 Harford County Public Schools A10.1
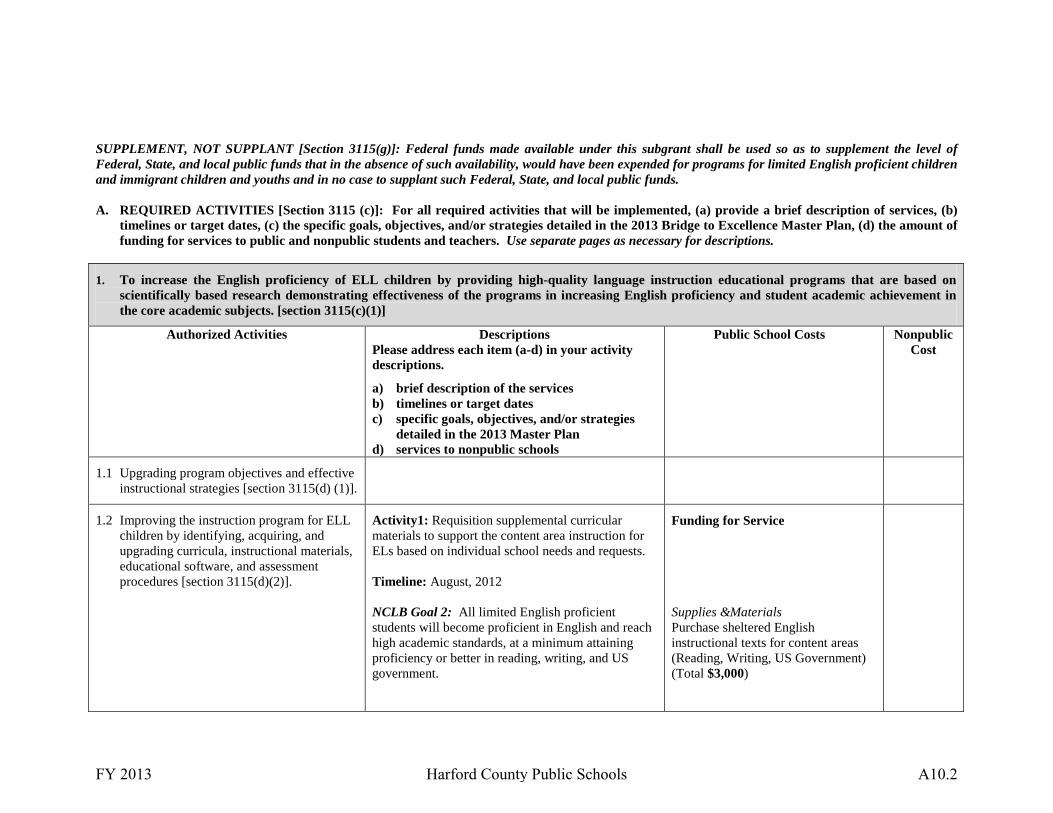
SUPPLEMENT, NOT SUPPLANT [Section 3115(g)]: Federal funds made available under this subgrant shall be used so as to supplement the level of Federal, State, and local public funds that in the absence of such availability, would have been expended for programs for limited English proficient children and immigrant children and youths and in no case to supplant such Federal, State, and local public funds. A. REQUIRED ACTIVITIES [Section 3115 (c)]: For all required activities that will be implemented, (a) provide a brief description of services, (b)
timelines or target dates, (c) the specific goals, objectives, and/or strategies detailed in the 2013 Bridge to Excellence Master Plan, (d) the amount of funding for services to public and nonpublic students and teachers. Use separate pages as necessary for descriptions.
1. To increase the English proficiency of ELL children by providing high-quality language instruction educational programs that are based on scientifically based research demonstrating effectiveness of the programs in increasing English proficiency and student academic achievement in the core academic subjects. [section 3115(c)(1)]
Authorized Activities Descriptions Please address each item (a-d) in your activity descriptions.
a) brief description of the services b) timelines or target dates c) specific goals, objectives, and/or strategies
detailed in the 2013 Master Plan d) services to nonpublic schools
Public School Costs Nonpublic Cost
1.1 Upgrading program objectives and effective instructional strategies [section 3115(d) (1)].
1.2 Improving the instruction program for ELL children by identifying, acquiring, and upgrading curricula, instructional materials, educational software, and assessment procedures [section 3115(d)(2)].
Activity1: Requisition supplemental curricular materials to support the content area instruction for ELs based on individual school needs and requests. Timeline: August, 2012 NCLB Goal 2: All limited English proficient students will become proficient in English and reach high academic standards, at a minimum attaining proficiency or better in reading, writing, and US government.
Funding for Service Supplies &Materials Purchase sheltered English instructional texts for content areas (Reading, Writing, US Government) (Total $3,000)
FY 2013 Harford County Public Schools A10.2
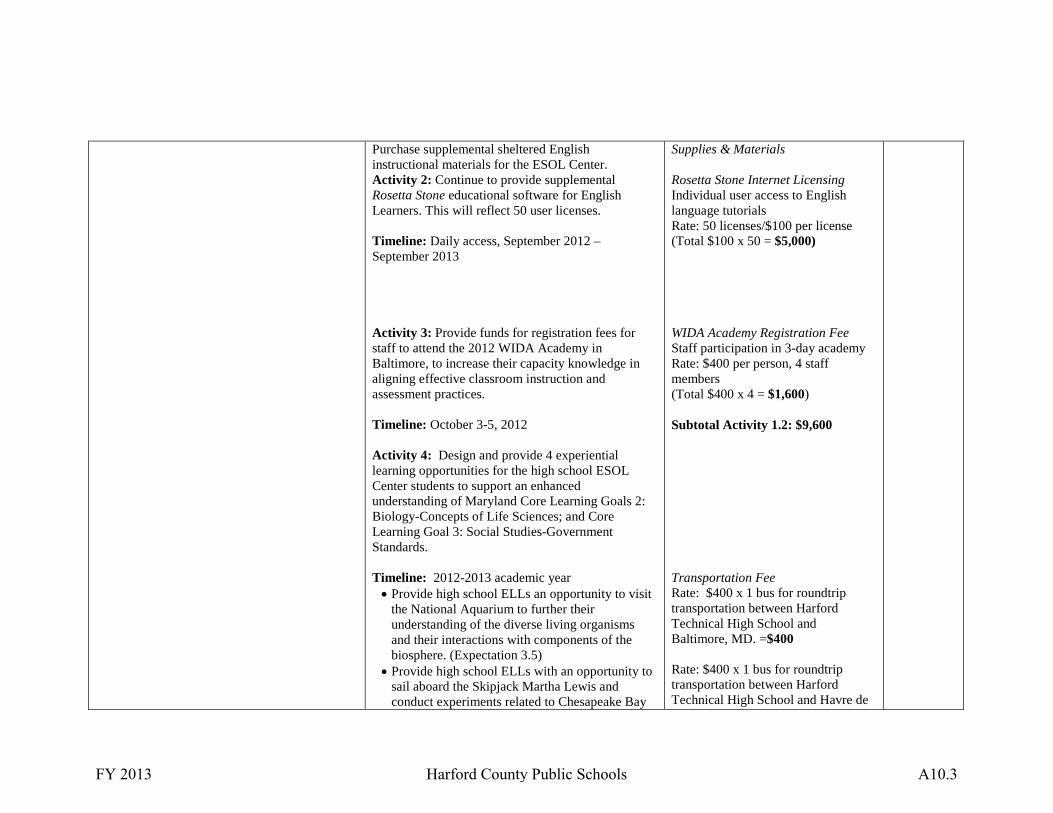
Purchase supplemental sheltered English instructional materials for the ESOL Center. Activity 2: Continue to provide supplemental Rosetta Stone educational software for English Learners. This will reflect 50 user licenses. Timeline: Daily access, September 2012 – September 2013 Activity 3: Provide funds for registration fees for staff to attend the 2012 WIDA Academy in Baltimore, to increase their capacity knowledge in aligning effective classroom instruction and assessment practices. Timeline: October 3-5, 2012 Activity 4: Design and provide 4 experiential learning opportunities for the high school ESOL Center students to support an enhanced understanding of Maryland Core Learning Goals 2: Biology-Concepts of Life Sciences; and Core Learning Goal 3: Social Studies-Government Standards. Timeline: 2012-2013 academic year • Provide high school ELLs an opportunity to visit
the National Aquarium to further their understanding of the diverse living organisms and their interactions with components of the biosphere. (Expectation 3.5)
• Provide high school ELLs with an opportunity to sail aboard the Skipjack Martha Lewis and conduct experiments related to Chesapeake Bay
Supplies & Materials Rosetta Stone Internet Licensing Individual user access to English language tutorials Rate: 50 licenses/$100 per license (Total $100 x 50 = $5,000) WIDA Academy Registration Fee Staff participation in 3-day academy Rate: $400 per person, 4 staff members (Total $400 x 4 = $1,600) Subtotal Activity 1.2: $9,600 Transportation Fee Rate: $400 x 1 bus for roundtrip transportation between Harford Technical High School and Baltimore, MD. =$400 Rate: $400 x 1 bus for roundtrip transportation between Harford Technical High School and Havre de
FY 2013 Harford County Public Schools A10.3

conservation efforts. (Expectations 3.5) • Provide high school ELLs an opportunity to visit
Washington, D.C. to promote an improved understanding of this Federal government location and related sites of cultural significance.
• Provide high school ELs an opportunity to visit Ellis Island to enhance their understanding of the history of immigration.
Grace = $400 Rate: $2,100 x 1 bus for roundtrip transportation between Harford Technical High School and Washington, D.C. =$2,100 Rate: $2,100 x 1 bus for roundtrip transportation between Harford Technical High School and New York City, NY = $2,100 Subtotal Activity 1.2: $5,000 Materials and Entrance Fees Skipjack, “Martha Lewis” estimated at $750 for 25 students; a 4 hour “Discovery Bay” studies of the upper Chesapeake Bay= $750 National Aquarium Total Experience Package at $25 per student for 25 students=$625 New York Ferry and Ellis Island complex Rate: $15 per student, 25 students (Total $15 x 25 = $375) Subtotal Activity 1.2: $1,750
TOTAL Activity 1.2
$16,350
FY 2013 Harford County Public Schools A10.4

A. REQUIRED ACTIVITIES [Section 3115(c)] continued
2. To provide high-quality professional development to classroom teachers (including teachers in classroom settings that are not the setting of language instruction educational programs), principals, administrators, and other school or community-based organizational personnel. [section 3115(c)(2)]
Authorized Activities
Note: High quality professional development shall not include activities such as one-day or short-term workshops and conferences. High quality professional development shall apply to an activity that is one component of a long-term, comprehensive professional development plan established by a teacher or the teacher's supervisor based on an assessment of needs of the teacher, supervisor, the students of the teacher, and any school system employing the teacher [section 3115(c)(2)(D)].
Descriptions Please address each item (a-d) in your activity descriptions.
a) brief description of the services b) timelines or target dates c) specific goals, objectives, and/or strategies
detailed in the 2013 Master Plan d) services to nonpublic schools
Public School Costs Nonpublic Cost
2.1 Providing for professional development designed to improve the instruction and assessment of ELL children [section 3115(c)(2)(A)].
Activity 1: Provide comprehensive training for staff on the WIDA 2012 Amplification of the English Language Development Standards. Timeline: November 29, 2012
WIDA Consultant Provide comprehensive training for staff on the WIDA 2012 Amplification of the English Language Development Standards. Rate: $2,000 All Inclusive-6 hour Session (Total $2,000 x 1 = $2,000) Materials and Supplies • Purchase copies of the 2012
Amplification of the English Language Development Standards. Rate: $14/ea x 12 copies = $168 + $15/S/H = $183
• Purchase WIDA ELD Standards Posters. Rate: $3/ea x 11 copies = $33 + $6.50 S/H = $39.50
FY 2013 Harford County Public Schools A10.5
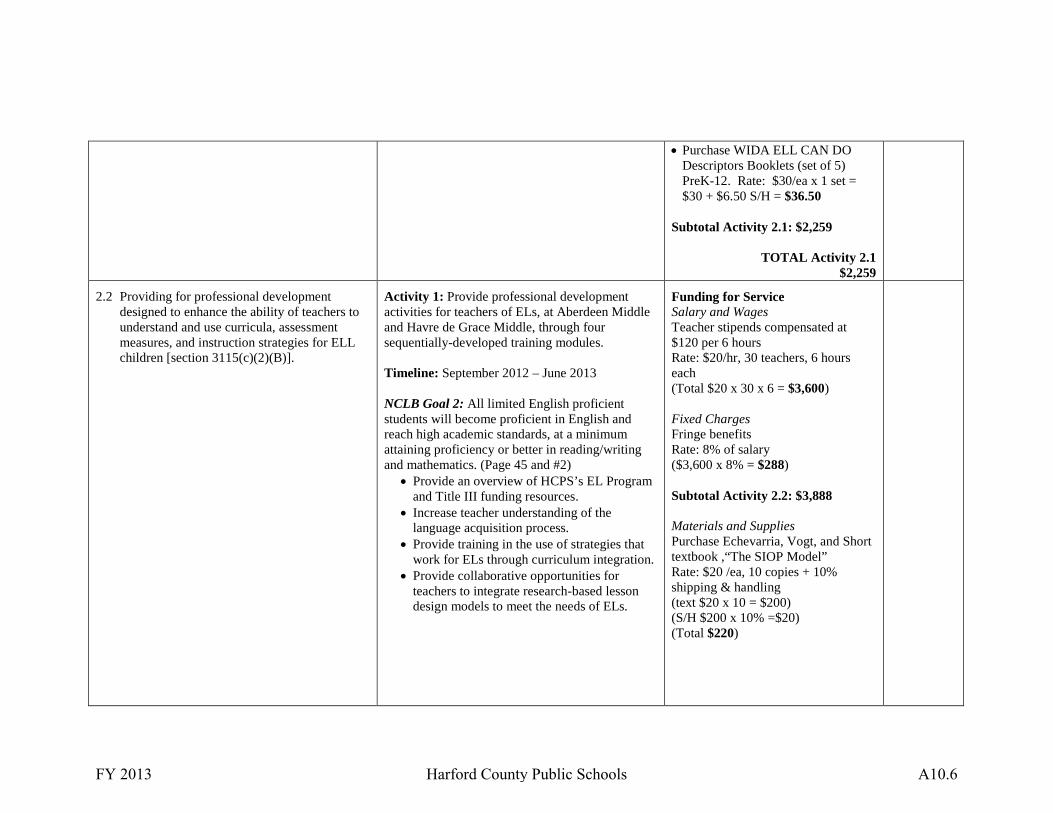
• Purchase WIDA ELL CAN DO Descriptors Booklets (set of 5) PreK-12. Rate: $30/ea x 1 set = $30 + $6.50 S/H = $36.50
Subtotal Activity 2.1: $2,259
TOTAL Activity 2.1 $2,259
2.2 Providing for professional development designed to enhance the ability of teachers to understand and use curricula, assessment measures, and instruction strategies for ELL children [section 3115(c)(2)(B)].
Activity 1: Provide professional development activities for teachers of ELs, at Aberdeen Middle and Havre de Grace Middle, through four sequentially-developed training modules. Timeline: September 2012 – June 2013 NCLB Goal 2: All limited English proficient students will become proficient in English and reach high academic standards, at a minimum attaining proficiency or better in reading/writing and mathematics. (Page 45 and #2)
• Provide an overview of HCPS’s EL Program and Title III funding resources.
• Increase teacher understanding of the language acquisition process.
• Provide training in the use of strategies that work for ELs through curriculum integration.
• Provide collaborative opportunities for teachers to integrate research-based lesson design models to meet the needs of ELs.
Funding for Service Salary and Wages Teacher stipends compensated at $120 per 6 hours Rate: $20/hr, 30 teachers, 6 hours each (Total $20 x 30 x 6 = $3,600) Fixed Charges Fringe benefits Rate: 8% of salary ($3,600 x 8% = $288) Subtotal Activity 2.2: $3,888 Materials and Supplies Purchase Echevarria, Vogt, and Short textbook ,“The SIOP Model” Rate: $20 /ea, 10 copies + 10% shipping & handling (text $20 x 10 = $200) (S/H $200 x 10% =$20) (Total $220)
FY 2013 Harford County Public Schools A10.6
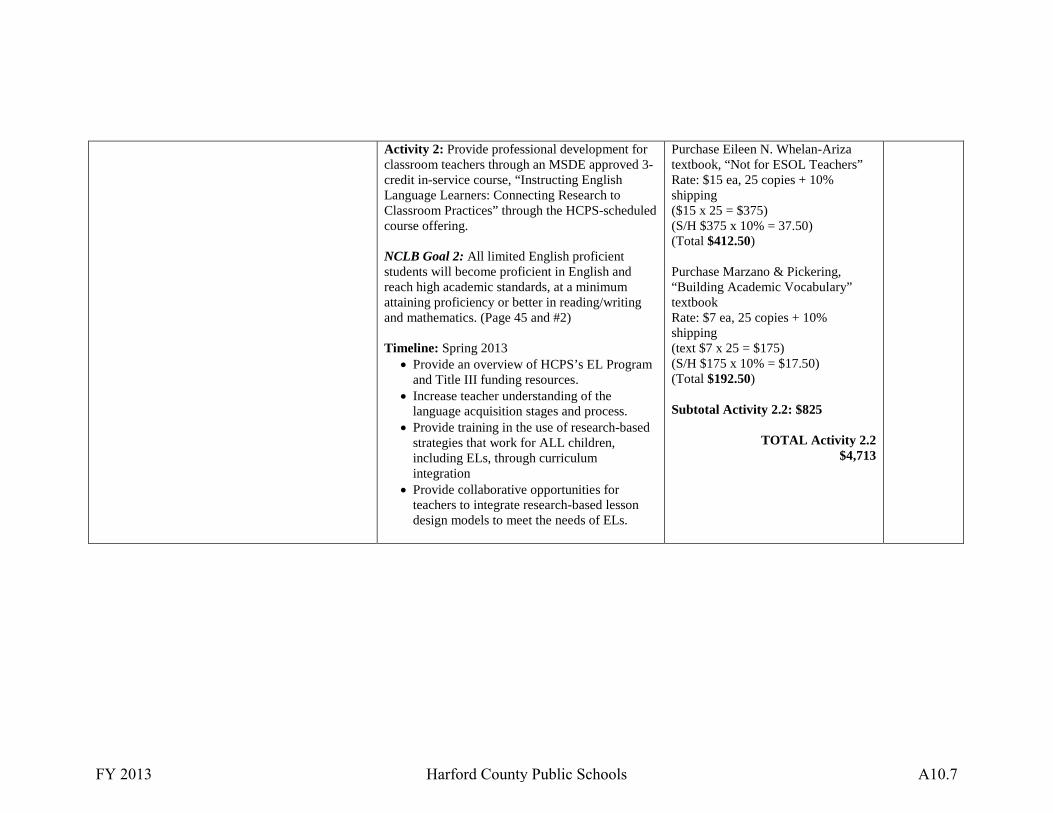
Activity 2: Provide professional development for classroom teachers through an MSDE approved 3-credit in-service course, “Instructing English Language Learners: Connecting Research to Classroom Practices” through the HCPS-scheduled course offering. NCLB Goal 2: All limited English proficient students will become proficient in English and reach high academic standards, at a minimum attaining proficiency or better in reading/writing and mathematics. (Page 45 and #2) Timeline: Spring 2013
• Provide an overview of HCPS’s EL Program and Title III funding resources.
• Increase teacher understanding of the language acquisition stages and process.
• Provide training in the use of research-based strategies that work for ALL children, including ELs, through curriculum integration
• Provide collaborative opportunities for teachers to integrate research-based lesson design models to meet the needs of ELs.
Purchase Eileen N. Whelan-Ariza textbook, “Not for ESOL Teachers” Rate: $15 ea, 25 copies + 10% shipping ($15 x 25 = $375) (S/H $375 x 10% = 37.50) (Total $412.50) Purchase Marzano & Pickering, “Building Academic Vocabulary” textbook Rate: $7 ea, 25 copies + 10% shipping (text $7 x 25 = $175) (S/H $175 x 10% = $17.50) (Total $192.50) Subtotal Activity 2.2: $825
TOTAL Activity 2.2
$4,713
FY 2013 Harford County Public Schools A10.7

SUPPLEMENT, NOT SUPPLANT [Section 3115(g)]: Federal funds made available under this subgrant shall be used so as to supplement the level of Federal, State, and local public funds that in the absence of such availability, would have been expended for programs for limited English proficient children and immigrant children and youths and in no case to supplant such Federal, State, and local public funds. B. ALLOWABLE ACTIVITIES [Section 3115(d)]: An eligible entity receiving funds under section 3114(a) may use the funds to achieve one or more
of the following activities:
3. To provide community participation programs, family literacy services, and parent outreach and training activities to ELL children and their families. [section 3115(d)(6)]
Authorized Activities Descriptions Please address each item (a-d) in your activity descriptions.
a) brief description of the services b) timelines or target dates c) specific goals, objectives, and/or strategies
detailed in the 2013 Master Plan d) services to nonpublic schools
Public School Costs Nonpublic Cost
3.1 Providing programs to improve the English language skills of ELL children [section 3115(d)(6)(A)].
Activity: Continue to provide the H.E.L.L.O summer camp (Helping English Language Learners Outreach), an authentic language experience summer camp offering for ELs to improve and enhance their understanding of the environment and to realize that they are becoming responsible stewards of their community. Timeline: June 17-21, 2013
Funding for Service Salaries and Wages Instructor stipend compensated at 75% of daily rate Rate: $40/hr, 9 teachers, 5 days/8 hours daily (Total $40 x 9 x 40 = $14,400) Fixed Charges Fringe Benefits Rate: 8% of salary ($14,400 x 8% = $1,152) Consultant Reimbursement Costs -Harford County Parks & Recreation “Above & Beyond Low Ropes Course” Rate: $400 All Inclusive Session
FY 2013 Harford County Public Schools A10.8
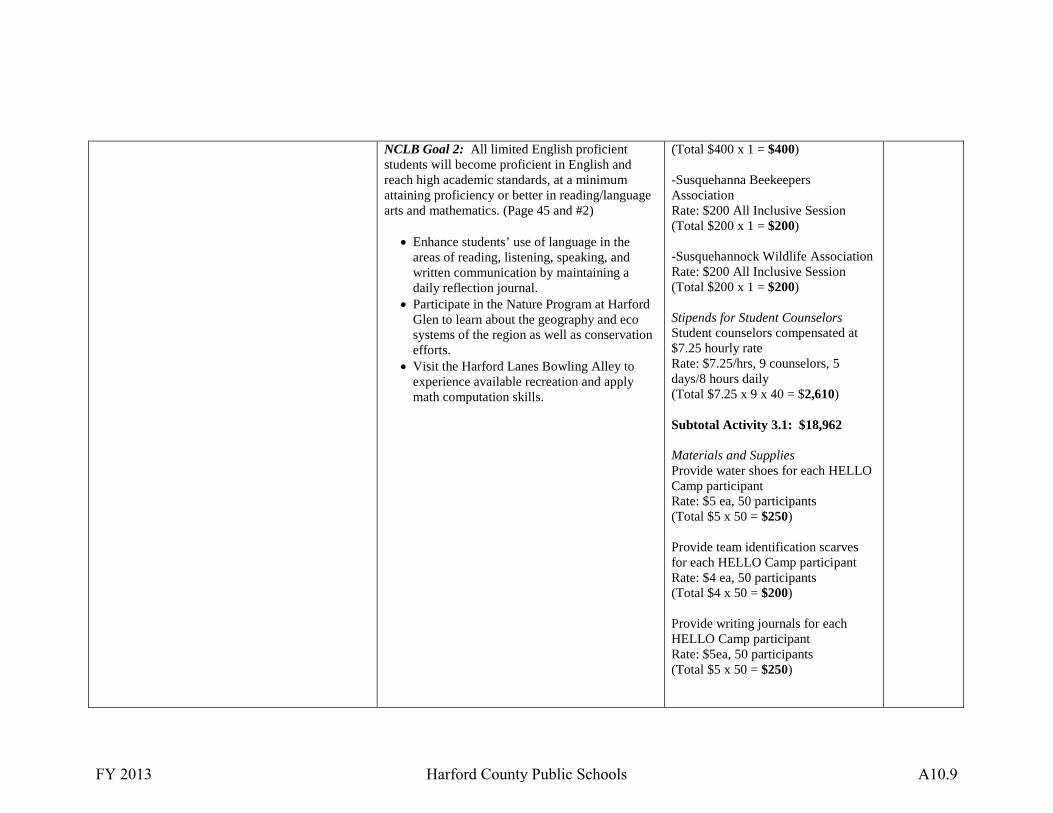
NCLB Goal 2: All limited English proficient students will become proficient in English and reach high academic standards, at a minimum attaining proficiency or better in reading/language arts and mathematics. (Page 45 and #2)
• Enhance students’ use of language in the areas of reading, listening, speaking, and written communication by maintaining a daily reflection journal.
• Participate in the Nature Program at Harford Glen to learn about the geography and eco systems of the region as well as conservation efforts.
• Visit the Harford Lanes Bowling Alley to experience available recreation and apply math computation skills.
(Total $400 x 1 = $400) -Susquehanna Beekeepers Association Rate: $200 All Inclusive Session (Total $200 x 1 = $200) -Susquehannock Wildlife Association Rate: $200 All Inclusive Session (Total $200 x 1 = $200) Stipends for Student Counselors Student counselors compensated at $7.25 hourly rate Rate: $7.25/hrs, 9 counselors, 5 days/8 hours daily (Total $7.25 x 9 x 40 = $2,610) Subtotal Activity 3.1: $18,962 Materials and Supplies Provide water shoes for each HELLO Camp participant Rate: $5 ea, 50 participants (Total $5 x 50 = $250) Provide team identification scarves for each HELLO Camp participant Rate: $4 ea, 50 participants (Total $4 x 50 = $200) Provide writing journals for each HELLO Camp participant Rate: $5ea, 50 participants (Total $5 x 50 = $250)
FY 2013 Harford County Public Schools A10.9

Refreshments Daily snacks estimated @$5/student, 50 students, 5 days (Total $5 x 50 x 5 = $1,250) Transportation Fee Provide roundtrip bus pickup to/from Harford Glen and six school sites Rate: $1,200/weekly/per bus, 2 buses (Total $1,200 x 2 = $2,400) Subtotal Activity 3.1: $4,350
TOTAL Activity 3.1 $23,312
3.2 Providing programs to assist parents in helping their children to improve their academic achievement and becoming active participants in the education of their children [section 3115(d)(6)(B)].
Activity 1: Provide translation/interpretation support to the parents of ELs as they choose to attend Back to School presentations at the beginning of the school year and Teacher Parent Conferences as requested. Timeline: September 2012-June 2013 Objective: To promote and encourage parent attendance/ participation at school events.
• Offer the parents of ELs the opportunity to collaborate with their school community.
Funding for Service Salary and Wages Translation/interpretation stipends compensated @$21/hr, 2 translators/interpreters, 1hr sessions, 20 sessions (Total $21 x 2 x 1 x 20 = $840) Fixed Charges Fringe benefits calculated at 8% of salary. ($840 x 8% = $67) Subtotal Activity 3.2: $907
TOTAL Activity 3.2 $907
FY 2013 Harford County Public Schools A10.10
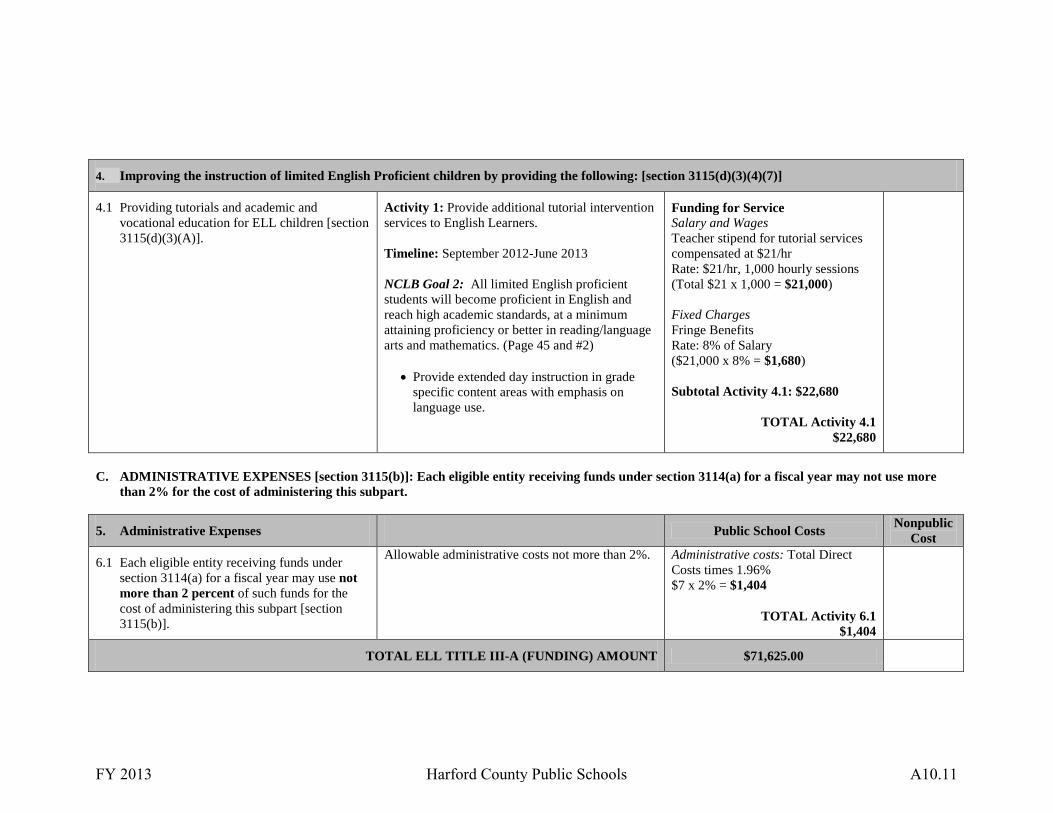
4. Improving the instruction of limited English Proficient children by providing the following: [section 3115(d)(3)(4)(7)]
4.1 Providing tutorials and academic and vocational education for ELL children [section 3115(d)(3)(A)].
Activity 1: Provide additional tutorial intervention services to English Learners. Timeline: September 2012-June 2013 NCLB Goal 2: All limited English proficient students will become proficient in English and reach high academic standards, at a minimum attaining proficiency or better in reading/language arts and mathematics. (Page 45 and #2)
• Provide extended day instruction in grade specific content areas with emphasis on language use.
Funding for Service Salary and Wages Teacher stipend for tutorial services compensated at $21/hr Rate: $21/hr, 1,000 hourly sessions (Total $21 x 1,000 = $21,000) Fixed Charges Fringe Benefits Rate: 8% of Salary ($21,000 x 8% = $1,680) Subtotal Activity 4.1: $22,680
TOTAL Activity 4.1 $22,680
C. ADMINISTRATIVE EXPENSES [section 3115(b)]: Each eligible entity receiving funds under section 3114(a) for a fiscal year may not use more
than 2% for the cost of administering this subpart.
5. Administrative Expenses Public School Costs Nonpublic
Cost
6.1 Each eligible entity receiving funds under section 3114(a) for a fiscal year may use not more than 2 percent of such funds for the cost of administering this subpart [section 3115(b)].
Allowable administrative costs not more than 2%. Administrative costs: Total Direct Costs times 1.96% $7 x 2% = $1,404
TOTAL Activity 6.1 $1,404
TOTAL ELL TITLE III-A (FUNDING) AMOUNT $71,625.00
FY 2013 Harford County Public Schools A10.11

SUPPLEMENT, NOT SUPPLANT [Section 3115(g)]: Federal funds made available under this subgrant shall be used so as to supplement the level of Federal, State, and local public funds that in the absence of such availability, would have been expended for programs for limited English proficient children and immigrant children and youths and in no case to supplant such Federal, State, and local public funds. D. IMMIGRANT ACTIVITIES [section 3115(e)]: Activities by agencies experiencing substantial increases in immigrant children and youth.
1. An eligible entity receiving funds under section 3114(d)(1) shall use the funds to pay for activities that provide enhanced instructional opportunities for immigrant children and youth. [section 3115(e)(1)]
Authorized Activities Descriptions Please address each item (a-d) in your activity descriptions. a) brief description of the services b) timelines or target dates c) specific goals, objectives, and/or strategies
detailed in the 2013 Master Plan d) services to nonpublic schools
Public School Costs Nonpublic Cost
1.1 Providing for family literacy, parent outreach, and training activities designed to assist parents to become active participants in the education of their children [section 3115(e)(1)(A)].
Activity 1: Provide a selection of literary texts to EL families in attendance at the Family Welcome Center Quarterly Outreach Meetings Timeline: September 2012-June 2013 NCLB Goal 2: All limited English proficient students will become proficient in English and reach high academic standards, at a minimum attaining proficiency or better in reading/language arts and mathematics. (Page 45 and #2)
Funding for Source Materials and Supplies Purchase literary texts to assist parents in becoming collaborative learning partners with their children. Estimated Rate: $527 total Subtotal Activity 1.1: $527
TOTAL Activity 1.1
$527
1.5 Providing basic instructional services that are directly attributable to the presence in the school district of immigrant children and youth, including the payment of costs of providing additional classroom supplies, cost of transportation or such other costs [section 3115(e)(1)(E)].
Activity 1: Provide transportation (to increase parent involvement) for family outreach to the Family Welcome Center from various school locations. Timeline: Twice/Semester, September 2012-June 2013
Funding for Service Transportation Fee Provide roundtrip bus transportation to/from various school sites to the Family Welcome Center Rate: $400/ bus/4 trips/3 buses (Total $400 x 4 x 3 = $4,800)
FY 2013 Harford County Public Schools A10.12
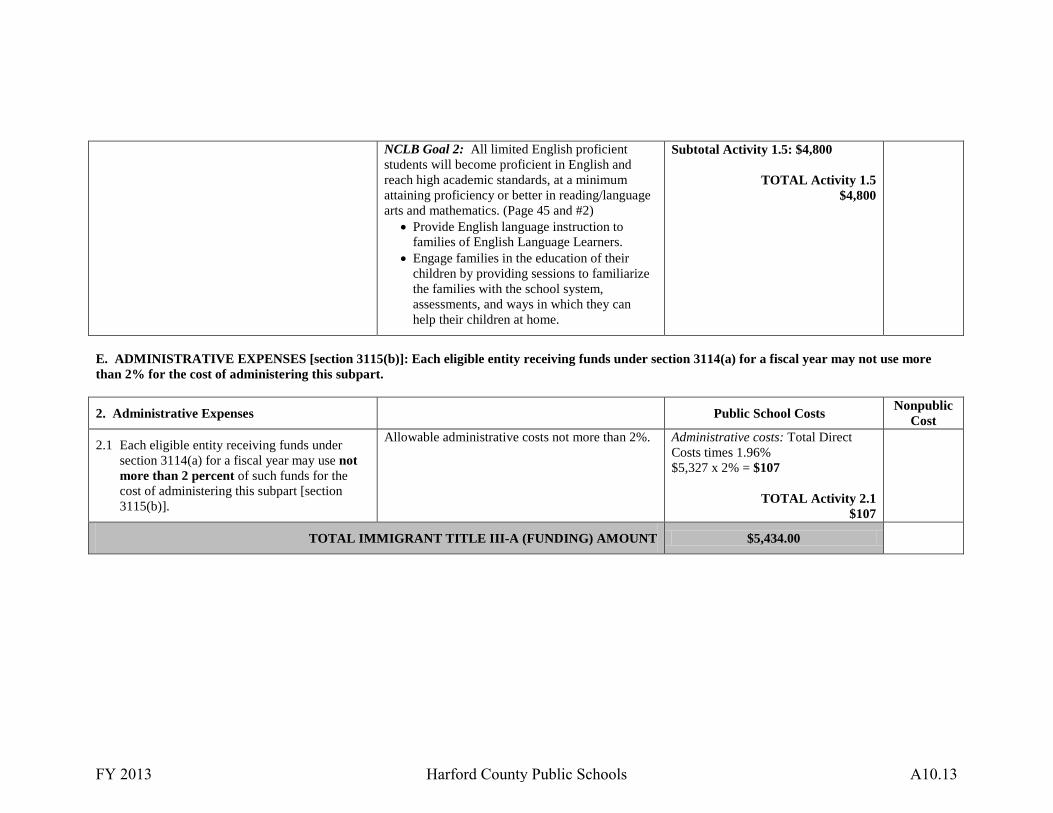
NCLB Goal 2: All limited English proficient students will become proficient in English and reach high academic standards, at a minimum attaining proficiency or better in reading/language arts and mathematics. (Page 45 and #2)
• Provide English language instruction to families of English Language Learners.
• Engage families in the education of their children by providing sessions to familiarize the families with the school system, assessments, and ways in which they can help their children at home.
Subtotal Activity 1.5: $4,800
TOTAL Activity 1.5 $4,800
E. ADMINISTRATIVE EXPENSES [section 3115(b)]: Each eligible entity receiving funds under section 3114(a) for a fiscal year may not use more than 2% for the cost of administering this subpart.
2. Administrative Expenses
Public School Costs Nonpublic
Cost
2.1 Each eligible entity receiving funds under section 3114(a) for a fiscal year may use not more than 2 percent of such funds for the cost of administering this subpart [section 3115(b)].
Allowable administrative costs not more than 2%. Administrative costs: Total Direct Costs times 1.96% $5,327 x 2% = $107
TOTAL Activity 2.1 $107
TOTAL IMMIGRANT TITLE III-A (FUNDING) AMOUNT $5,434.00
FY 2013 Harford County Public Schools A10.13
B. ANNUAL CERTIFICATION OF EQUITABLE SERVICES TO STUDENTS IN PRIVATE (NONPUBLIC) SCHOOLS [ESEA, Section 9501]: 1. Participating Private Schools and Services: Complete information in Attachment 6-A on page 9 regarding the names of participating private schools and
the number of private school students and/or staff that will benefit from the Title III-A services.
Attached
2. Describe the school system's process for providing equitable participation to students in private schools: a) The manner and extent of consultation with the officials of interested private schools during all phases of the development and design of the Title
III-A services;
Nonpublic and private school officials were contacted in August 2012 to ascertain the current enrollment of English language learners. These schools have been made aware of the current Title III funding, and the categories of funding services provided. Representatives of the various nonpublic and private schools in Harford County met with HCPS administrative personnel, and are provided an overview of the current grants, including the Title III grant.
b) The basis for determining the needs of private school children and teachers;
As nonpublic representatives contact HCPS, a sharing of information relevant to the instruction and assessment of English language learners is provided. Should a request be made for a sharing of diagnostic language assessment, professional development, textual support, etc., those requests are honored.
c) How services, location of services, and grade levels or areas of services were decided and agreed upon; and
Should a nonpublic school request servicing through the use of Title III funding, such a request would be honored based on the location of the school, the identification of an HCPS ESOL staff member, and the amount of time the ELL would be provided additional instructional support.
d) The differences, if any, between the Title III-A services that will be provided to public and private school students and teachers, and the reasons for
any differences. (Note: The school system provides services on an equitable basis to private school children whether or not the services are the same Title III-A services the district provides to the public school children.)
The Office of World Languages, upon request, will offer suggestions to nonpublic school officials and teachers as it relates to the instruction of English language learners. Additionally, as professional development sessions are offered throughout the 2012-2013 school year to HCPS personnel, nonpublic school staffs will be invited to participate. As comprehensive instructional and assessment materials become available within the school system, the materials will, likewise, be made available to the nonpublic schools in this geographical area for preview and/or use.
FY 2013 Harford County Public Schools A10.14

3. ATTACH WRITTEN AFFIRMATION (e.g., meeting dates, agenda, sign-in sheets, letters/forms, etc.) for the school year 2012 – 2013 signed by officials at each participating nonpublic school and/or their designee that consultation regarding Title III services has occurred. DOCUMENTATION SHOULD BE LABELED AND PROVIDED AS AN ATTACHMENT AFTER THE BUDGET PAGES IN ATTACHMENT 10.
ATTACHED following the budget pages.
C. BUDGET INFORMATION AND NARRATIVE
1. Provide a detailed budget on the MSDE Proposed Title III-A Budget Form. The Proposed Budget must reflect how the funds will be spent, organized according to the budget objectives, and correlated to the activities and costs detailed in Attachment 10. MSDE budget forms are available in Excel format through the local finance officer or at the MSDE Bridge to Excellence Master Plan Web Site at www.marylandpublicschools.org.
ATTACHED – see following pages.
2. Provide a detailed budget narrative using the attached “Guidance for Completion of the Budget Narrative for Individual Grants” (pp. 11-13 of this
guidance document). The accompanying budget narrative should (a) detail how the school system will use Title III-A funds to pay only reasonable and necessary direct administrative costs associated with the operation of the Title III-A program and (b) demonstrate the extent to which the budget is both reasonable and cost-effective.
ATTACHED – see following pages.
D. ATTACHMENTS 4-A & B, 5-A &B, and 6-A & B
Be certain to complete all appropriate templates in Part II: Attachment 4: School Level Budget Summary
Attachment 5: Transfer of ESEA Funds
Attachment 6: Consolidation of ESEA Funds for Local Administration
Attachment 7: Affirmation of Consultation (with nonpublic schools) documentation – SEE ATTACHED AFTER BUDGET PAGES
FY 2013 Harford County Public Schools A10.15
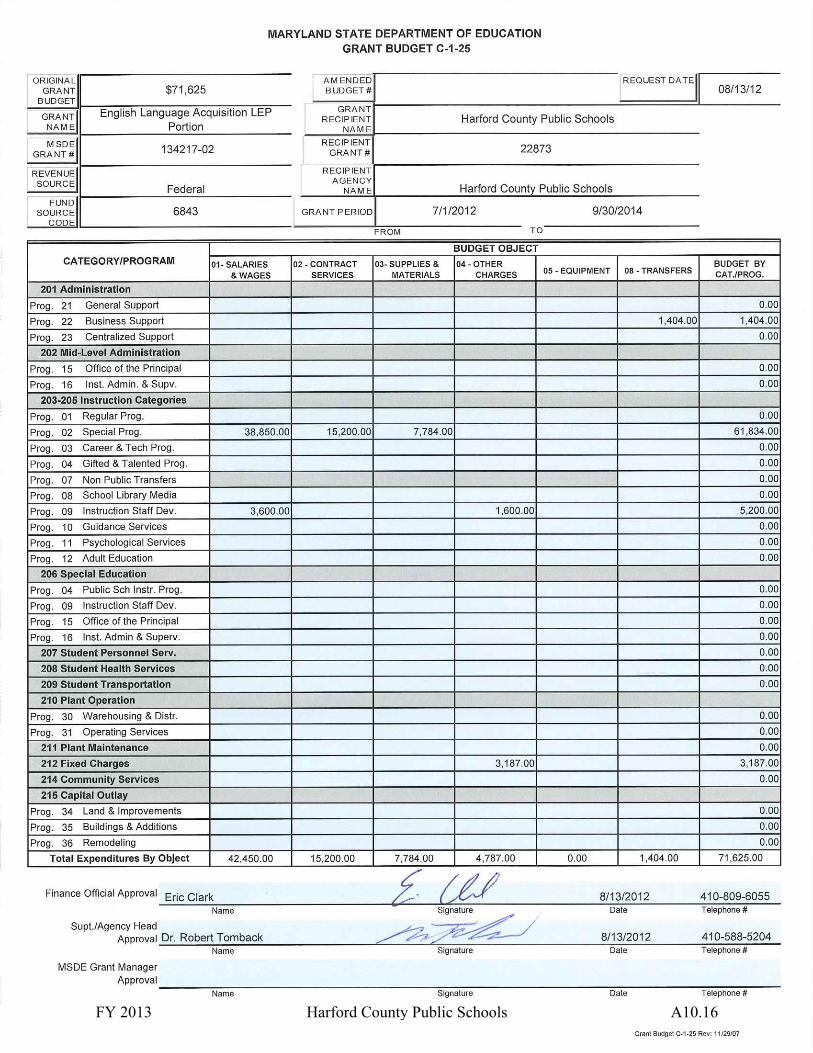
FY 2013 Harford County Public Schools A10.16
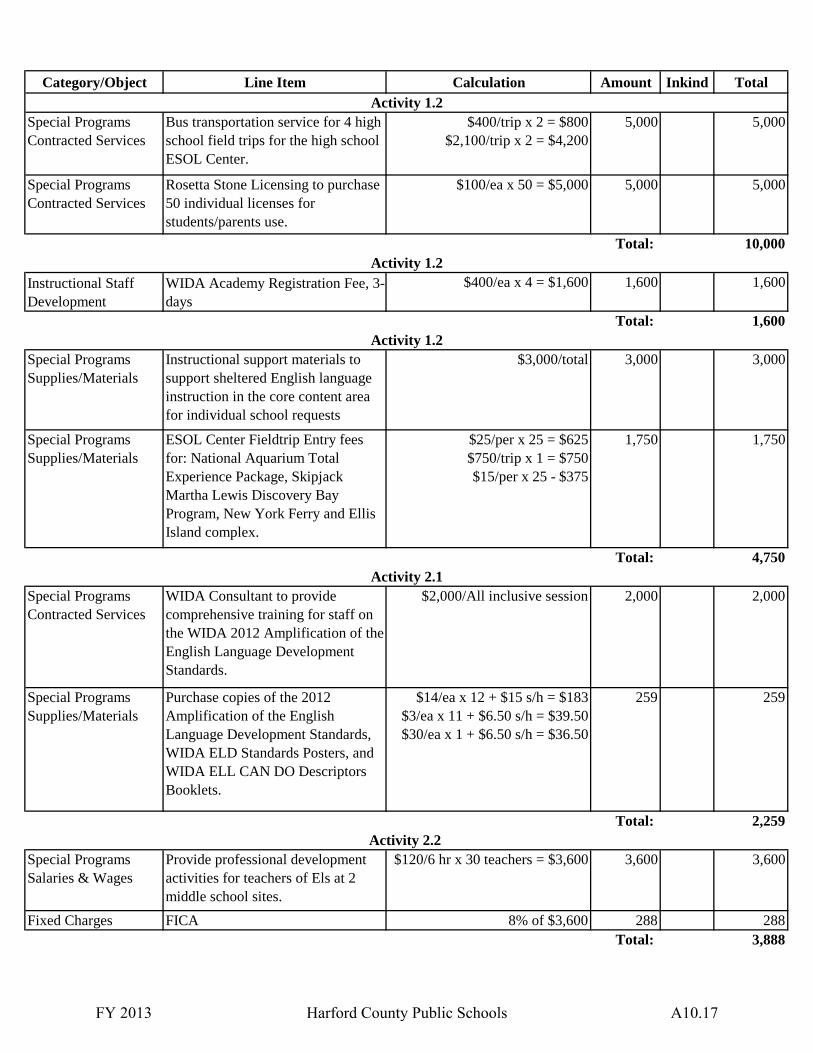
Category/Object Line Item Calculation Amount Inkind Total
Special Programs Contracted Services
Rosetta Stone Licensing to purchase 50 individual licenses for students/parents use.
$100/ea x 50 = $5,000 5,000 5,000
Total: 10,000
Total: 1,600
Special Programs Supplies/Materials
ESOL Center Fieldtrip Entry fees for: National Aquarium Total Experience Package, Skipjack Martha Lewis Discovery Bay Program, New York Ferry and Ellis Island complex.
$25/per x 25 = $625$750/trip x 1 = $750$15/per x 25 - $375
1,750 1,750
Total: 4,750
Special ProgramsContracted Services
WIDA Consultant to provide comprehensive training for staff on the WIDA 2012 Amplification of the English Language Development Standards.
$2,000/All inclusive session 2,000 2,000
Special Programs Supplies/Materials
Purchase copies of the 2012 Amplification of the English Language Development Standards, WIDA ELD Standards Posters, and WIDA ELL CAN DO Descriptors Booklets.
$14/ea x 12 + $15 s/h = $183$3/ea x 11 + $6.50 s/h = $39.50$30/ea x 1 + $6.50 s/h = $36.50
259 259
Total: 2,259
Fixed Charges FICA 8% of $3,600 288 288Total: 3,888
$400/trip x 2 = $800$2,100/trip x 2 = $4,200
Bus transportation service for 4 high school field trips for the high school ESOL Center.
Special Programs Contracted Services
Special Programs Supplies/Materials
Special Programs Salaries & Wages
Activity 2.1
Activity 2.2 3,600Provide professional development
activities for teachers of Els at 2 middle school sites.
$120/6 hr x 30 teachers = $3,600 3,600
3,000
Activity 1.2
Activity 1.2Instructional support materials to support sheltered English language instruction in the core content area for individual school requests
$3,000/total 3,000
Activity 1.2
Instructional Staff Development
WIDA Academy Registration Fee, 3-days
$400/ea x 4 = $1,600
5,000 5,000
1,600 1,600
FY 2013 Harford County Public Schools A10.17

Category/Object Line Item Calculation Amount Total
Special Programs Supplies/Materials
Purchase textbooks: Echevarria, Vogt, and Short, "The SIOP Model", Eileen N. Whelan-Ariza "Not for ESOL Teachers", Marzano & Pickering, "Building Academic Vocabulary"
$20/ea x 10 + 10% s/h=$220.00$15/ea x 25 + 10% s/h=$412.50$7/ea x 25 + 10% s/h=$192.50
825 825
Total: 825
Special Programs Salaries & Wages
Student counselor stipend for the H.E.L.L.O summer camp
$7.25/hr x 9 x 40 hrs = $2,610 2,610 2,610
Fixed Charges FICA 8% of $14,400 1,152 1,152Total: 18,162
Special Programs Contracted Services
Bus transportation to/from the H.E.L.L.O summer camp
$1,200/wk/per x 2 = $2,400 2,400 2,400
Special Programs Contracted Services
Harford County Parks & Recreations "Low Ropes Course" Facilitators, Susquehanna Beekeepers Association Consultant, Suquehannock Wildlife Association Consultant
$400/session x 1 = $400 $200/session x 2 = $400
800 800
Total: 3,200
Special Programs Supplies/Materials
Provide items H.E.L.L.O camp: water shoes, team scarves, writing journals, daily snacks
$5/ea x 50 = $250$4/ea x 50 = $200$5/ea x 50 = $250
$5/ea x 50 x 5 = $1,250
1,950 1,950
Total: 1,950
Fixed Charges FICA 8% of $840 67 67Total: 907
Special Programs Salaries & Wages
Provide tutorial services to Els $21/hr x 1,000 sessions=$21,000 21,000 21,000
Fixed Charges FICA 8% of $21,000 1,680 1,680Total: 22,680
Administration Transfers 2% x $70,221 1,404 1,404Total: 1,404
71,625$
840
Activity 4.1
Activity 6.1
Activity 2.2
Title III ELL Total:
Special Programs Salaries & Wages
Instructor stipend for the H.E.L.L.O summer camp
$40/hr x 9 x 40 hrs = $14,400 14,400
Activity 3.1
Activity 3.1
Activity 3.2Special Programs Salaries & Wages
Provide translation/interpretation services to parents of Els
$21/hr x 2 x 20 hrs = $840 840
14,400
Activity 3.1
FY 2013 Harford County Public Schools A10.18
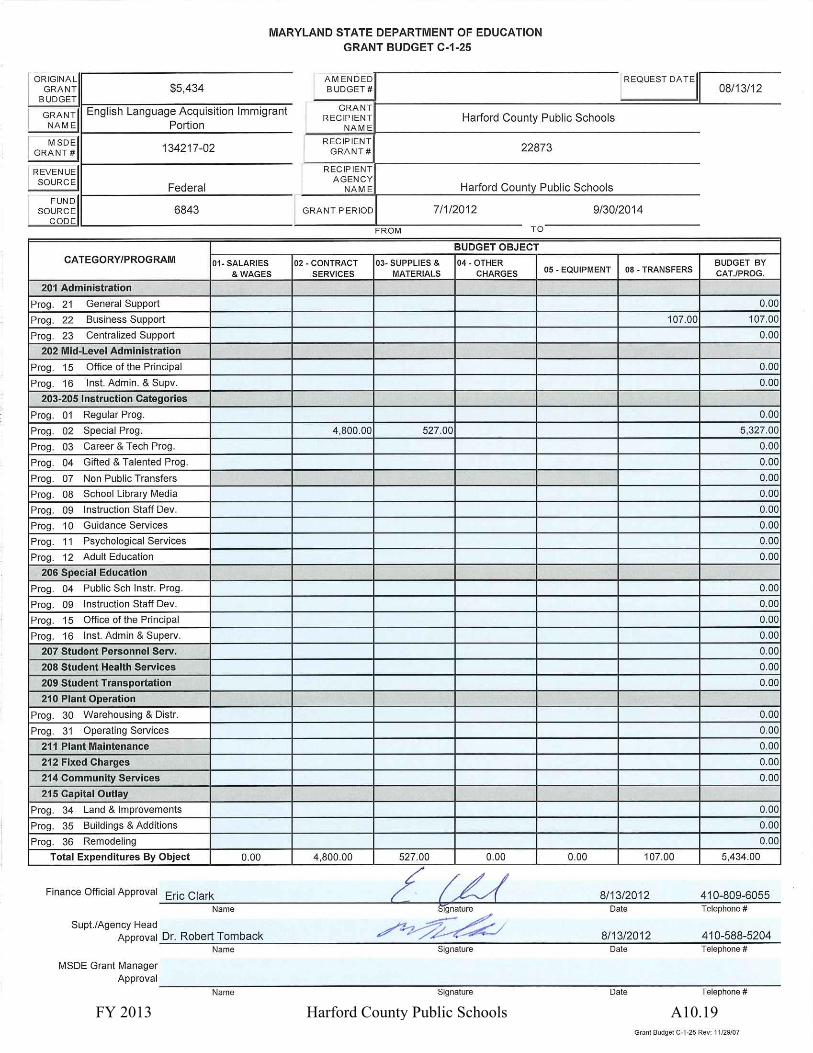
FY 2013 Harford County Public Schools A10.19
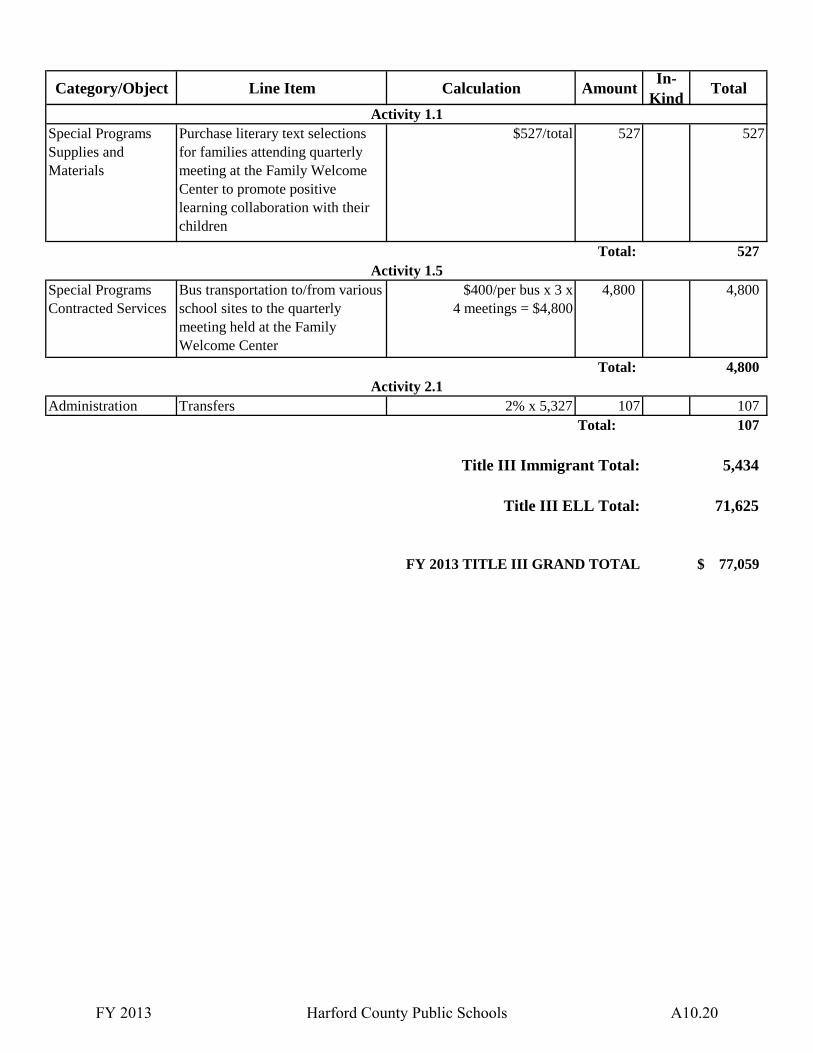
Category/Object Line Item Calculation AmountIn-
KindTotal
Special Programs Supplies and Materials
Purchase literary text selections for families attending quarterly meeting at the Family Welcome Center to promote positive learning collaboration with their children
$527/total 527 527
Total: 527
Special Programs Contracted Services
Bus transportation to/from various school sites to the quarterly meeting held at the Family Welcome Center
$400/per bus x 3 x 4 meetings = $4,800
4,800 4,800
Total: 4,800
Administration Transfers 2% x 5,327 107 107 Total: 107
5,434
71,625
77,059$ FY 2013 TITLE III GRAND TOTAL
Activity 2.1
Title III Immigrant Total:
Activity 1.5
Activity 1.1
Title III ELL Total:
FY 2013 Harford County Public Schools A10.20
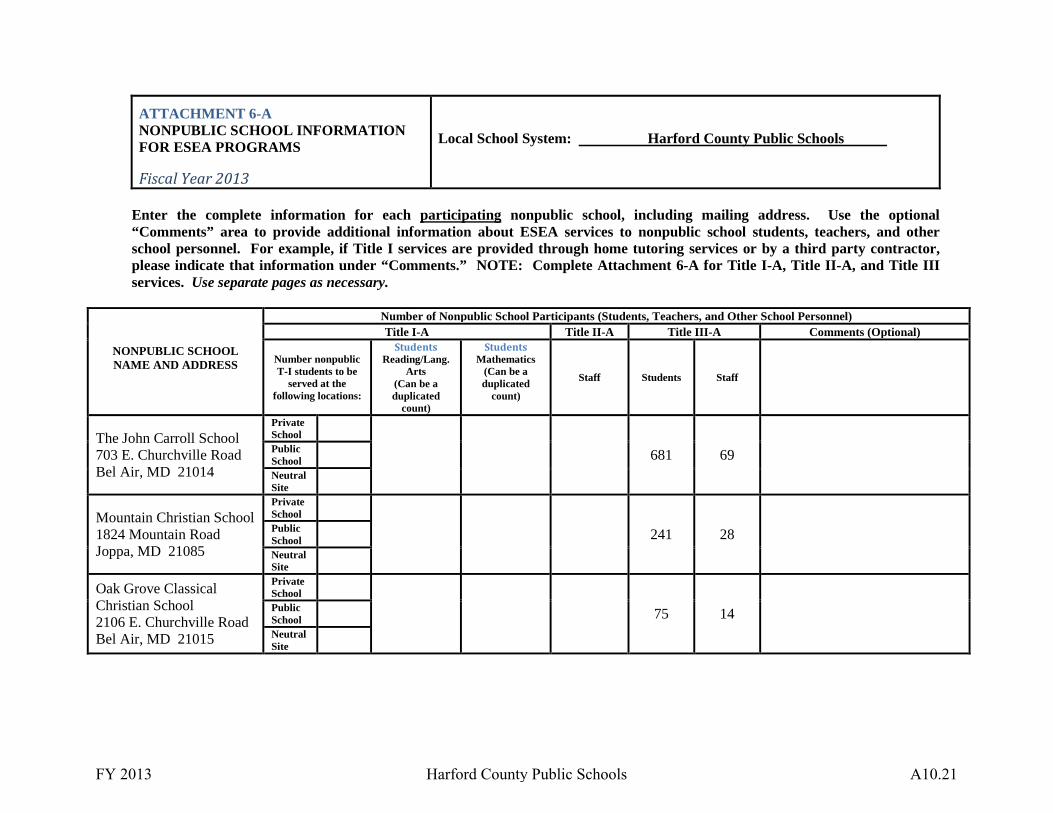
ATTACHMENT 6-A NONPUBLIC SCHOOL INFORMATION FOR ESEA PROGRAMS
Fiscal Year 2013
Local School System: Harford County Public Schools
Enter the complete information for each participating nonpublic school, including mailing address. Use the optional “Comments” area to provide additional information about ESEA services to nonpublic school students, teachers, and other school personnel. For example, if Title I services are provided through home tutoring services or by a third party contractor, please indicate that information under “Comments.” NOTE: Complete Attachment 6-A for Title I-A, Title II-A, and Title III services. Use separate pages as necessary.
NONPUBLIC SCHOOL NAME AND ADDRESS
Number of Nonpublic School Participants (Students, Teachers, and Other School Personnel) Title I-A Title II-A Title III-A Comments (Optional)
Number nonpublic T-I students to be
served at the following locations:
Students Reading/Lang.
Arts (Can be a duplicated
count)
Students Mathematics
(Can be a duplicated
count)
Staff Students Staff
The John Carroll School 703 E. Churchville Road Bel Air, MD 21014
Private School
681 69
Public School
Neutral Site
Mountain Christian School 1824 Mountain Road Joppa, MD 21085
Private School
241 28
Public School
Neutral Site
Oak Grove Classical Christian School 2106 E. Churchville Road Bel Air, MD 21015
Private School
75 14
Public School
Neutral Site
FY 2013 Harford County Public Schools A10.21
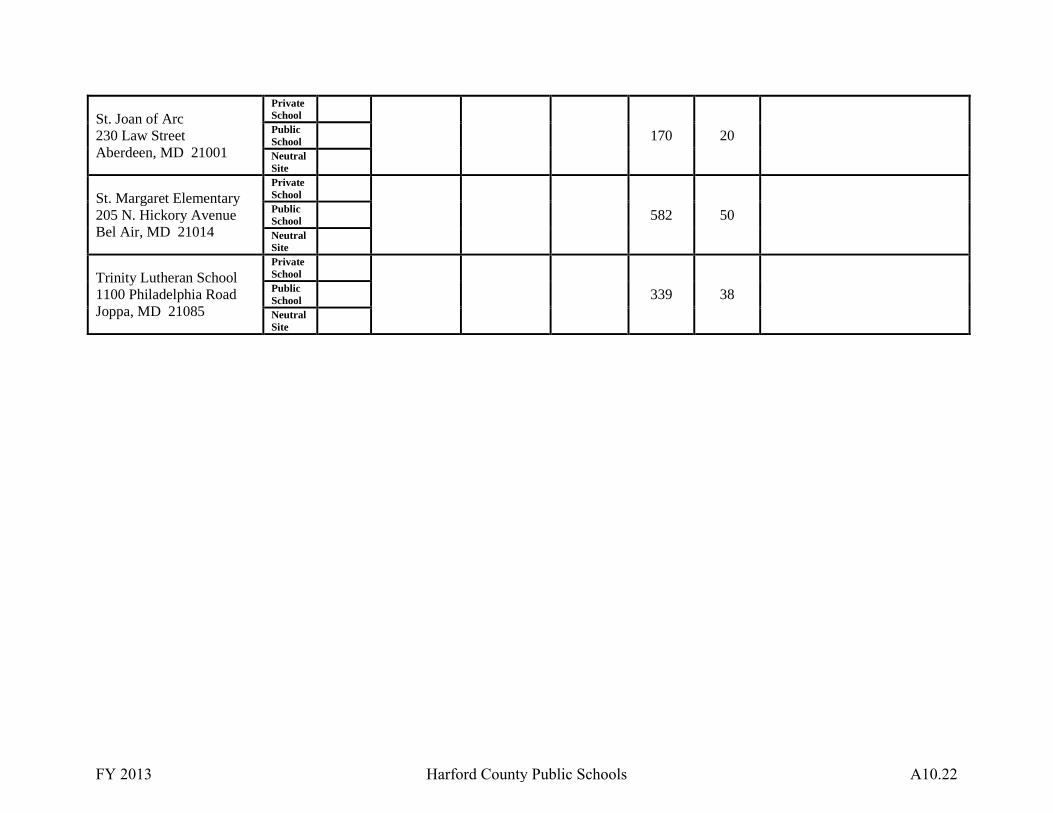
St. Joan of Arc 230 Law Street Aberdeen, MD 21001
Private School
170 20
Public School
Neutral Site
St. Margaret Elementary 205 N. Hickory Avenue Bel Air, MD 21014
Private School
582 50
Public School
Neutral Site
Trinity Lutheran School 1100 Philadelphia Road Joppa, MD 21085
Private School
339 38
Public School
Neutral Site
FY 2013 Harford County Public Schools A10.22

FY 2013 Harford County Public Schools A10.23

FY 2013 Harford County Public Schools A10.24

FY 2013 Harford County Public Schools A10.25

FY 2013 Harford County Public Schools A10.26

FY 2013 Harford County Public Schools A10.27

FY 2013 Harford County Public Schools A10.28
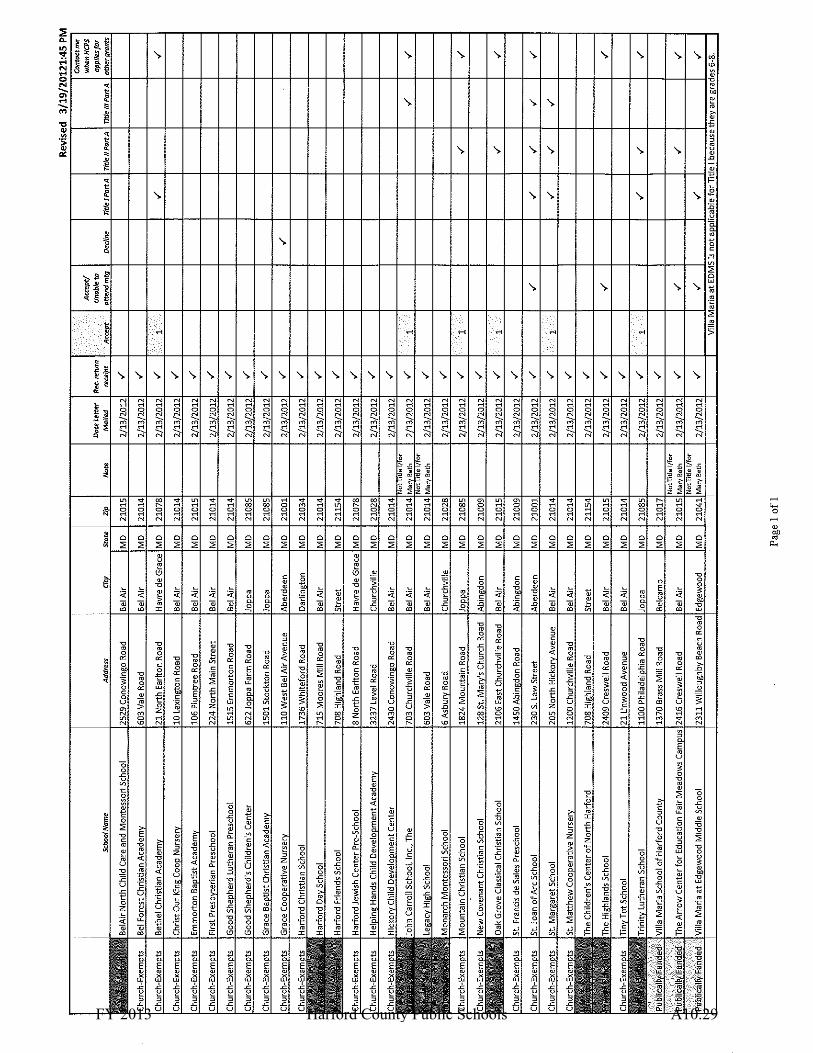
FY 2013 Harford County Public Schools A10.29
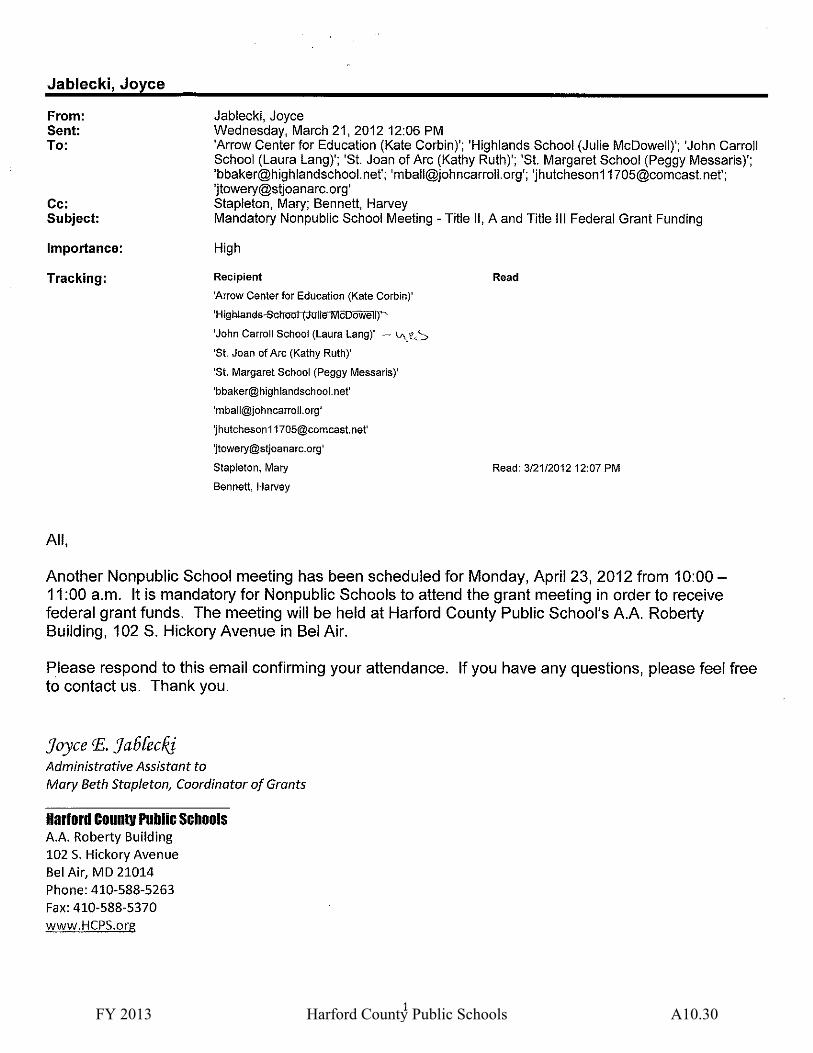
FY 2013 Harford County Public Schools A10.30
FY 2013 Harford County Public Schools A10.31

FY 2013 Harford County Public Schools A10.32
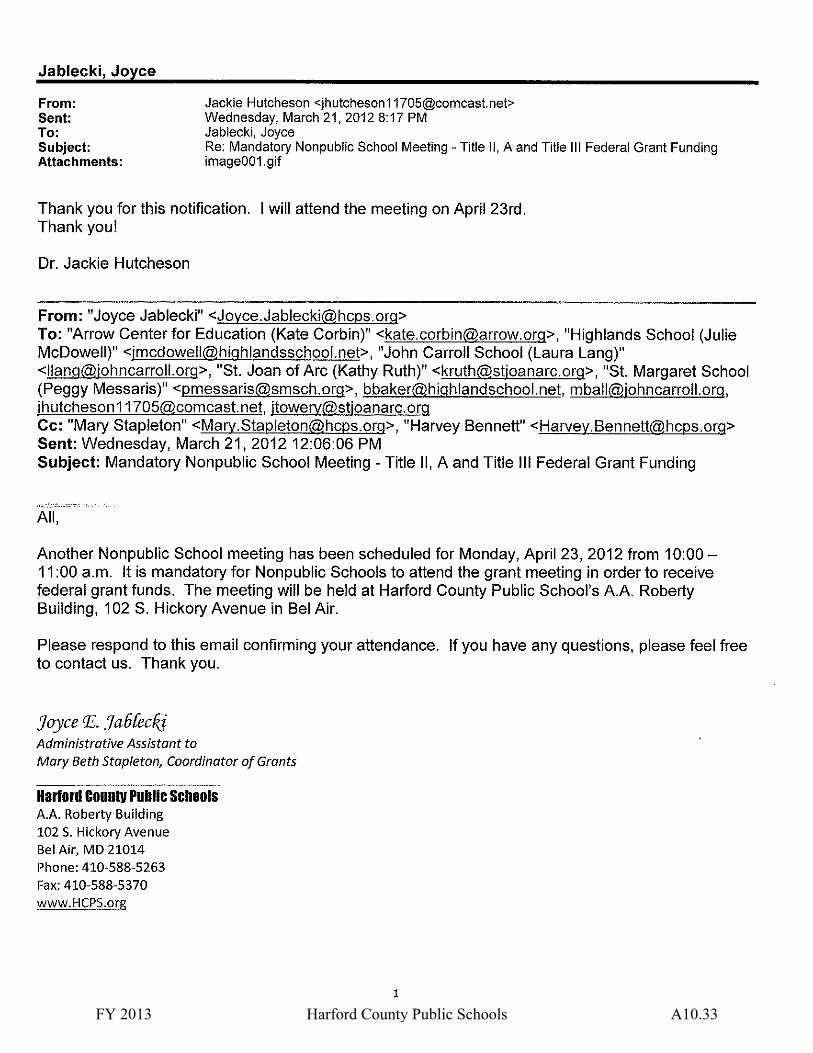
FY 2013 Harford County Public Schools A10.33

FY 2013 Harford County Public Schools A10.34

FY 2013 Harford County Public Schools A10.35

FY 2013 Harford County Public Schools A10.36

FY 2013 Harford County Public Schools A10.37
FY 2013 Harford County Public Schools A10.38

FY 2013 Harford County Public Schools A10.39

FY 2013 Harford County Public Schools A10.40
FY 2013 Harford County Public Schools A10.41
FY 2013 Harford County Public Schools A10.42

FY 2013 Harford County Public Schools A10.43
FY 2013 Harford County Public Schools A10.44
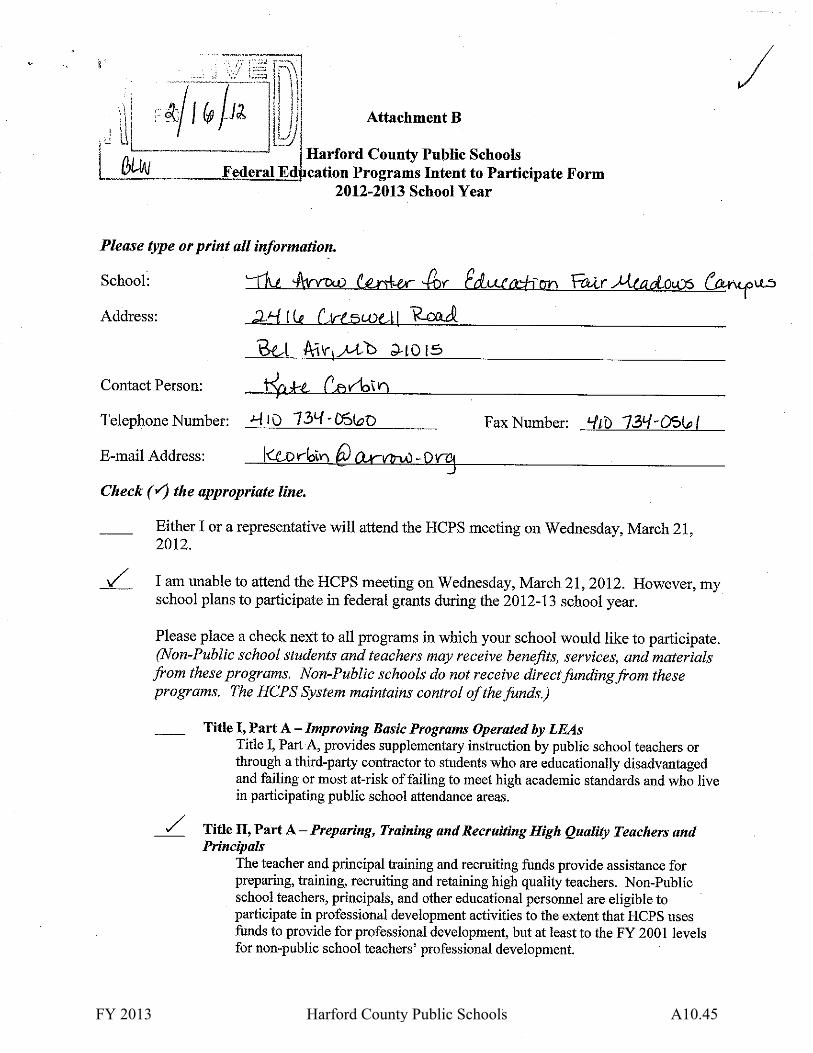
FY 2013 Harford County Public Schools A10.45
FY 2013 Harford County Public Schools A10.46

FY 2013 Harford County Public Schools A10.47

FY 2013 Harford County Public Schools A10.48

FY 2013 Harford County Public Schools A10.49

FY 2013 Harford County Public Schools A10.50
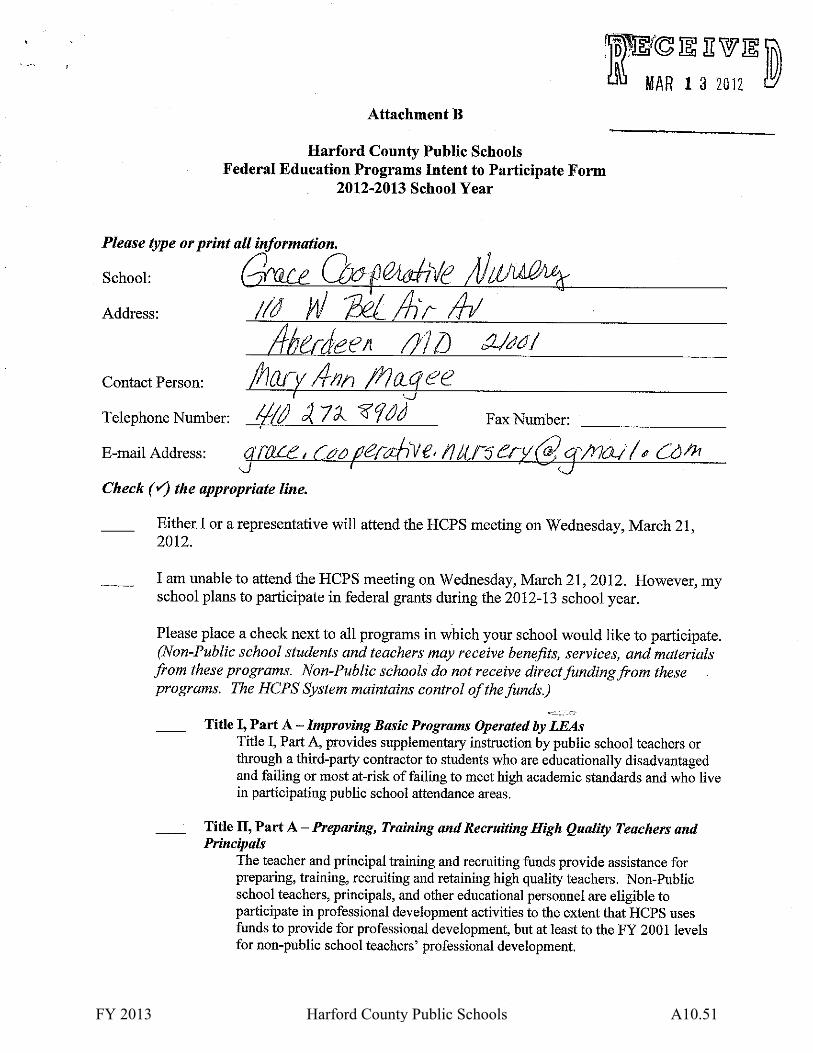
FY 2013 Harford County Public Schools A10.51
FY 2013 Harford County Public Schools A10.52
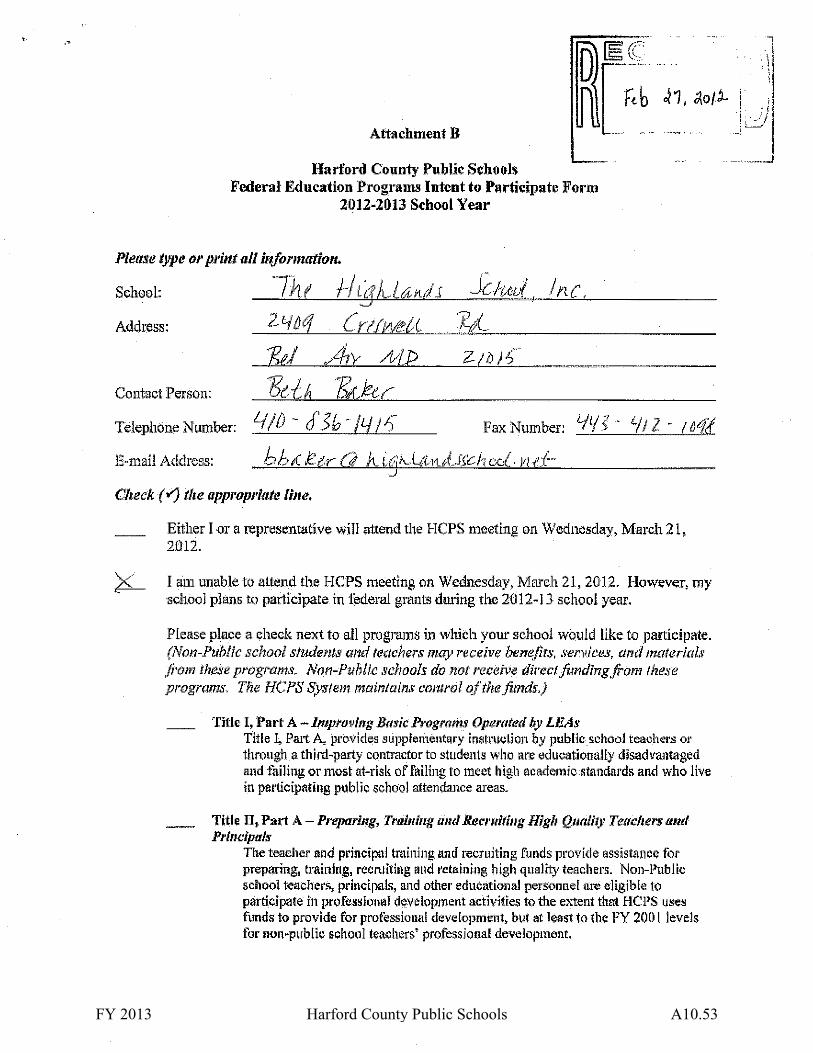
FY 2013 Harford County Public Schools A10.53
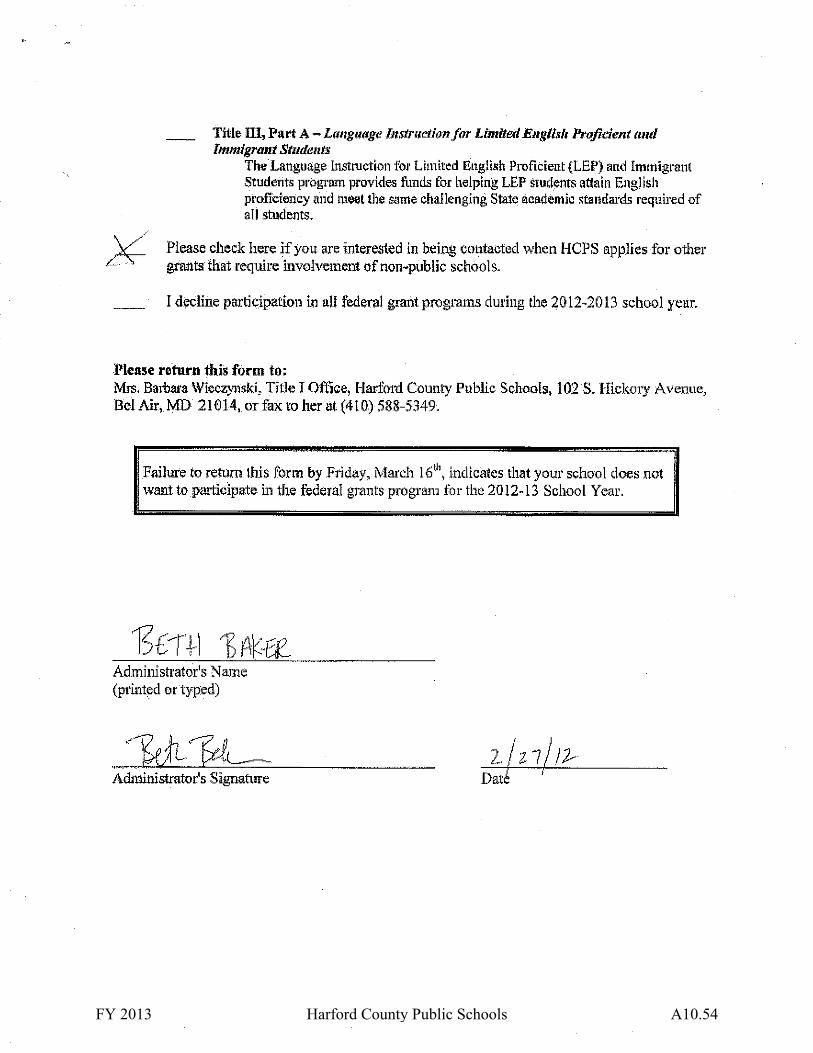
FY 2013 Harford County Public Schools A10.54

FY 2013 Harford County Public Schools A10.55
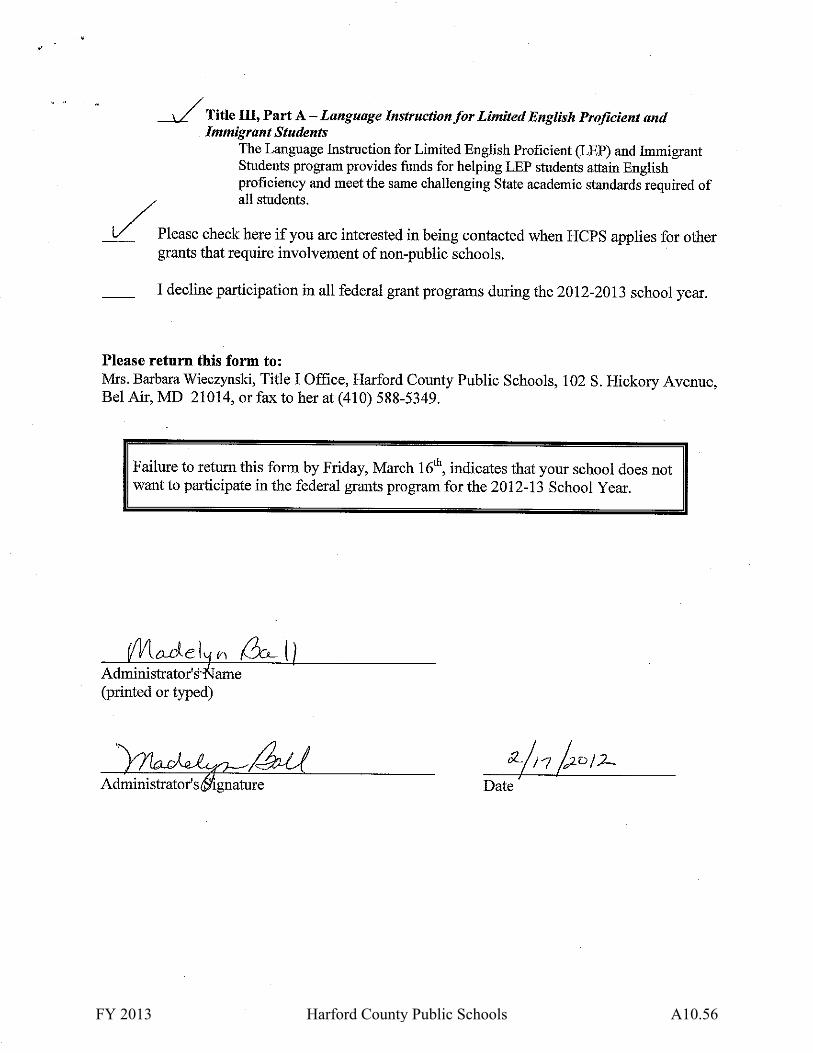
FY 2013 Harford County Public Schools A10.56
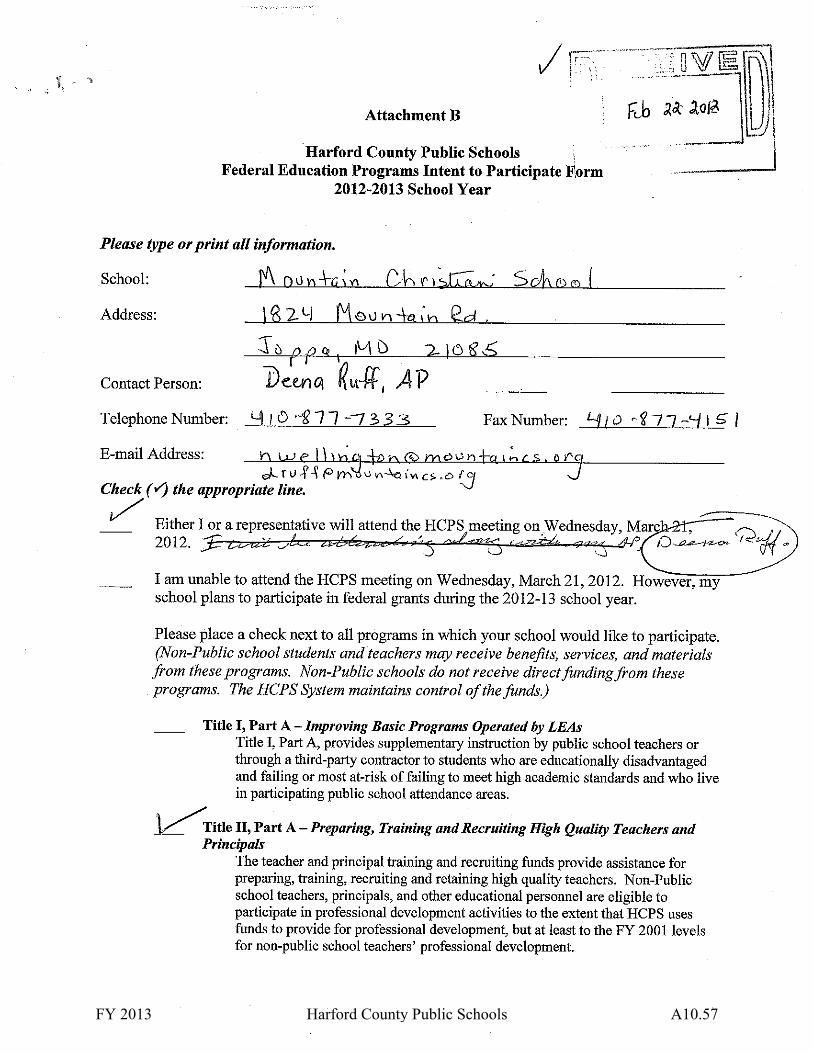
FY 2013 Harford County Public Schools A10.57

FY 2013 Harford County Public Schools A10.58

FY 2013 Harford County Public Schools A10.59

FY 2013 Harford County Public Schools A10.60

FY 2013 Harford County Public Schools A10.61

FY 2013 Harford County Public Schools A10.62

FY 2013 Harford County Public Schools A10.63

FY 2013 Harford County Public Schools A10.64

FY 2013 Harford County Public Schools A10.65

FY 2013 Harford County Public Schools A10.66
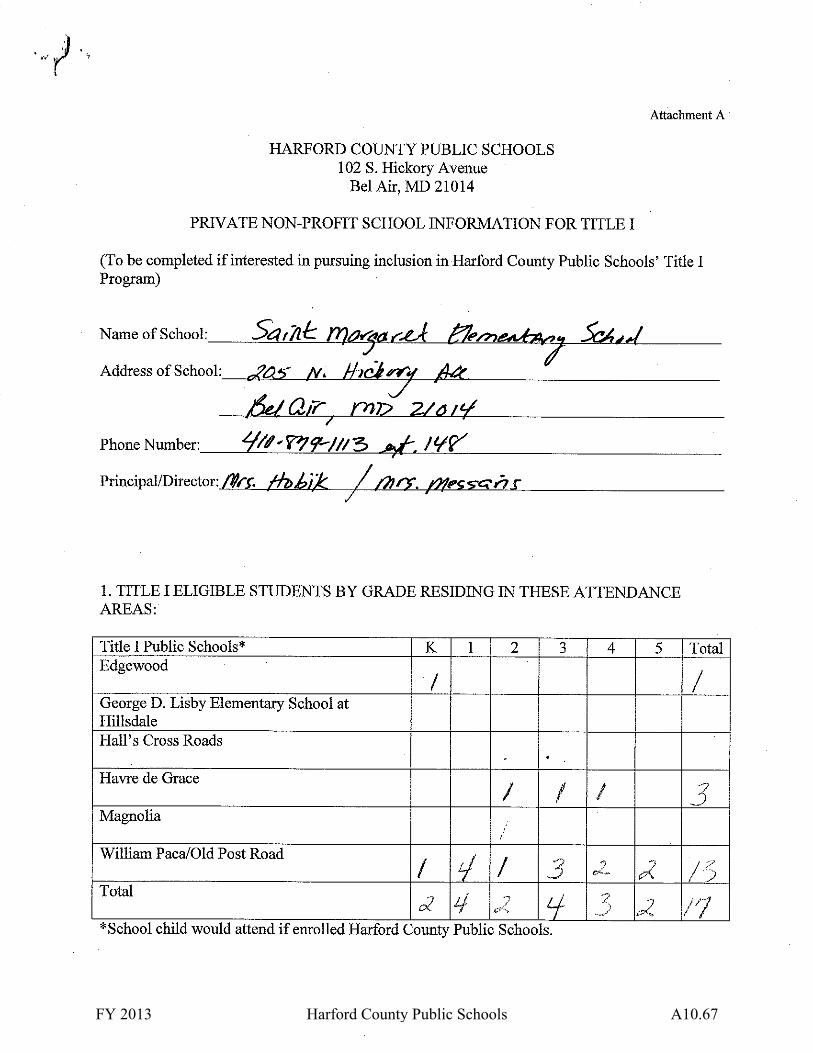
FY 2013 Harford County Public Schools A10.67

FY 2013 Harford County Public Schools A10.68

FY 2013 Harford County Public Schools A10.69

FY 2013 Harford County Public Schools A10.70
Attachment 12
Title I, Part D Prevention and Intervention Programs for
Children And Youth Who Are Neglected, Delinquent, or At-Risk
FY 2013 Harford County Public Schools A12.1

Attachment 13
Fine Arts
FY 2013 Harford County Public Schools A13.1

The Bridge to Excellence in Public Schools Act requires that the updated Master Plan “shall include goals, objectives, and strategies” for Programs in Fine Arts. Local school systems are expected to provide a cohesive, stand-alone response to the prompts and questions outlined below. Harford County Public Schools (HCPS) offers all students fine arts instruction in a variety of venues. Students in full day kindergarten through grade 8 receive art and music instruction each year of their schooling. Instrumental music and choral programs are available for students in grades 4 through 12. The high school students of HCPS have the opportunity to select from a wide variety of fine arts courses to meet graduation requirements. Throughout their school years, students have multiple opportunities to display art productions and to perform musical, drama and dance selections for a wide range of audiences. The Fine Arts State Curriculum and Essential Learner Outcomes documents serve as the guidelines and blueprints for all curriculum development in music, art, drama, and dance. As stated in the document, “…the primary purpose of the fine arts curriculum is to establish a foundation for a life-long relationship with the arts for every student,” and HCPS has supported this concept in the past and will continue to do so in the future. High quality fine arts instruction is an essential part of students’ educational experience in HCPS. 1. Describe the progress that was made in 2011-2012 toward meeting Programs in Fine Arts goals, strategies, and objectives articulated
in the System’s Bridge to Excellence (BTE) Master Plan. During the 2011-2012 school year, HCPS addressed the majority of the goals pertaining to fine arts outlined in the Bridge to Excellence Master Plan. Progress for each of FY 11’s objectives is listed below:
a. Art – The HCPS Art program continues to move forward, placing an emphasis on training for AP Art History and Art Studio as well as providing appropriate equipment and materials in the classroom. The 2011-2012 Fine Arts Grant helped to fund 12 sets of Scholastic Art to be placed in each of the 10 high schools as well as the alternative school housed at the Center for Educational Opportunity.
b. Music – The HCPS Music program continues to provide students with an exceptional package of opportunities which include All
County Band, Orchestra, Chorus and Solo and Ensemble at both middle and high school levels. All County Jazz Band and Choir are becoming ever more popular and give students a different type of musical experience for our high school students. Teachers were able to have more personalized professional development due to the FAI Grant. New Music Technology Labs were added to the system at Fallston, Havre de Grace and Aberdeen High Schools with professional development taking place for all teachers presently involved and those who will become involved in the near future. Trumpet Day also continued this school year drawing more vendors and participants than previous years. Reference materials were purchased to continue the HCPS initiative on content literacy.
c. Dance – Two high schools continue to offer a dance program, Aberdeen High School and Edgewood High School with North Harford
adding a new program. Costumes were purchased to enhance all three programs.
FY 2013 Harford County Public Schools A13.2

d. Drama – The drama program continued to hold its annual drama clinic by contracting a professional acting troop. Schools also
received money to purchased needed supplies and materials to enhance instruction. 2. Identify the programs, practices, or strategies and related resource allocations that are related to the progress reported in prompt #1.
a. Art – The HCPS Master Plan has provided guidance for the art program and is a blueprint for measuring the successes that were achieved in 2011-2012. It is an ongoing organized process which outlines specific program related materials to be purchased for identified schools so that all students are provided with a quality program of art studies. Local funding for this this year remained the same as last year. Even with local budget cuts, funding has been maintained for the art program. Grant funding has made a dramatic impact on the county-wide art program. Additionally, over the past several years HCPS has been working on providing AP course offerings in Art History and Art Studio available in every high school
b. Music – The HCPS Master Plan has provided guidance for the music program and is a blueprint for measuring the successes that were
achieved in 2011-2012. The county-wide activities associated with the music program have been supported in the Master Plan through the strategies of maintaining funding and resources to support the HCPS Fine Arts Program and implementing music all-county events and festivals. The direction and focus afforded the music program through inclusion in the Master Plan has provided support for the program within the school system. The Superintendent’s Senior Staff and Board of Education (BOE) members are kept aware of music department activities through invitations to events and awards received by students, staff and the department as a whole. Even with recent budget cuts county support has remained steady. Also, the purchase of reference materials has been well received by teachers. Combined with the Content Literacy initiative, teachers are beginning to utilize materials to develop units that go beyond performance and contribute to total musicianship.
c. Dance – The HCPS Master Plan has provided guidance for the dance program and a blueprint for measuring successes that were
achieved in 2011-2012. The strategy of maintaining funding and resources to support the HCPS Fine Arts Program has helped the dance program focus on areas that can improve the level of students’ experience. Funding from the Fine Arts Initiative (FAI) grant has been allocated for two schools in the program and progress is being made in establishing a program that is well received by students, teachers and administration in the schools where it is located.
d. Drama - The HCPS Master Plan has provided guidance for the drama program and a blueprint for measuring successes that were
achieved in 2011-2012. The strategy of maintaining funding and resources to support the HCPS Fine Arts Program has helped the drama program focus on areas that can improve the level of students’ experience. The Drama Program held its annual Drama Festival and was able to give supply and material money to schools to assist with program needs through the FAI Grant.
FY 2013 Harford County Public Schools A13.3

3. Describe which goals, objectives, and strategies included in the BTE Master Plan were not attained and where challenges in making progress toward meeting Programs in Fine Arts goals and objectives are evident.
a. Art – The Art Program of the HCPS was very productive during 2011-20112, meeting all of the identified goals and objectives. The
continued challenge relative to the art program is the fact that the supervisor in charge of the Art Program is also responsible for several curricular areas. It is necessary for her to split her time attending to numerous and extensive duties. Regardless of this obstacle, the Art Program has continued to move forward making remarkable progress with a heightened awareness of goals and standards not present in the past. The continued cuts in the FAI grant are causing a slowdown of progress. No new sources of funds are available.
b. Music – The Music Program was very productive during 2011-2012. All of the goals were met as outlined in the Master Plan. One
area that will continue to be a focus is work on the high school curriculum guide and the completion of a Music Technology II course that will complete a career pathway for students interested in music technology. The have been delayed once again do to a refocusing on Common Core Curricula. The continued cuts in the FAI grant are causing a slowdown of progress. No new sources of funds are available.
c. Dance – Dance Program goals for the 2011-2012 school year have been completed. The priority of HCPS to maintain funding and
resources to support the HCPS Fine Arts Program, as outlined in the Master Plan, has given the program visibility. The main challenge continues to be that Dance is under the direction of the Supervisor for FACS/Art and Career Programs. With the demands placed on the supervisor, little time exists to focus on the needs of the Dance Program. The continued cuts in the FAI grant are causing a slowdown of progress. No new sources of funds are available and those we rely on are becoming almost non-existent.
d. Drama – Drama Program goals for the 2011-2012 school year have been completed. The priority of HCPS to maintain funding and
resources to support the HCPS Fine Arts Program has made it possible for the Drama Program to enhance its offerings to students through a county-wide Drama Festival. The main challenge continues to be that Drama is under the direction of the Supervisor for English/Language Arts. With the demands placed on the supervisor, little time exists to focus on the needs of the Drama Program. The continued cuts in the FAI grant are causing a slowdown of progress. No new sources of funds are available.
4. Describe the goals, objectives, and strategies that will be implemented during 2012-2013 and plans for addressing the challenges
identified in prompt #3. Include a description of the adjustments that will be made along with related resources to ensure progress toward meeting identified goals, objectives, and strategies. Where appropriate, include timelines.
The Fine Arts goals, objectives and strategies outlined in the 2012 Master Plan are aligned with transition to High-Quality Standards and Assessments (Section B), and Great Teachers and Great Leaders (Section D).
FY 2013 Harford County Public Schools A13.4

In the fall of 2011, HCPS BOE developed a new strategic plan. The following BOE goal and supporting objective support implementation of HCPS Fine Arts strategies.
Board of Education: Goal 1: To prepare every student for success in postsecondary education and a career. Goal 3: To hire and support skilled staff who are committed to increasing student achievement. Supporting Objective: Review and analyze available data to ascertain graduates’ career and postsecondary educational success Provide all staff with professional development, resources, and services.
Strategy 1: Music: During 2012-2013 school year, the music program funding will focus on maintaining the music program we have established. Cuts to the budget are requiring the 2013 grant to be spent on basic necessities such as substitute time to support programs instead of advancing the program as in past years. Strategy 2: Music: The Music Program will continue the highly successful All County and Assessment Programs that have been part of the HCPS educational system since 1960, but because of a lack of funding to pay middle school teachers, the Middle School All County program will be discontinued. Strategy 3: Art: During 2012-2013 school year, funding for the Art Program will continue to be used to support teachers in the classroom through the purchasing of Scholastic Art sets for 12 HCPS schools as well as equipment to support art classroom activities. Strategy 4: Drama: Drama productions in Harford County Public Schools have grown considerably over the past several years. During the 2011-2012 school year, HCPS will contract professional actors to assist teachers with program delivery and staff development. Funds will also be allocated to supplement in-kind funding for the purchase of scripts.
BUDGET INFORMATION AND NARRATIVE
1. Provide a detailed budget on the MSDE Proposed Fine Arts Budget Form. The Proposed Budget must reflect how the funds will be spent, organized according to the budget objectives. MSDE budget forms are available in Excel format through the local finance officer or at the MSDE Bridge to Excellence Master Plan Web Site at www.marylandpublicschools.org.
2. Provide a detailed budget narrative using the “Guidance for Completion of the Budget Narrative for Individual Grants.” (pp. 10-12 of this guidance
document). The accompanying budget narrative should detail how the school system will use Fine Arts funds to pay only reasonable and necessary direct administrative costs associated with the operation of the Fine Arts program. All expenditures must be directly linked to the goals, objectives, and strategies identified in Attachment 13 of the BTE Master Plan.
FY 2013 Harford County Public Schools A13.5
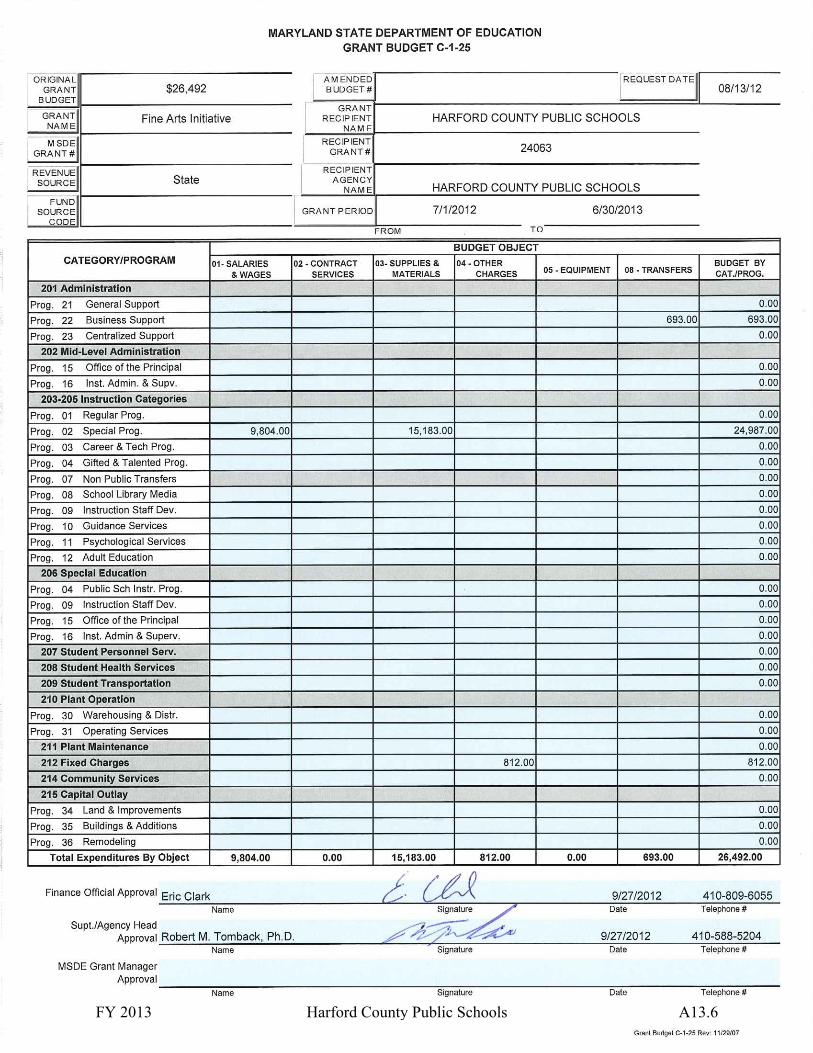
FY 2013 Harford County Public Schools A13.6
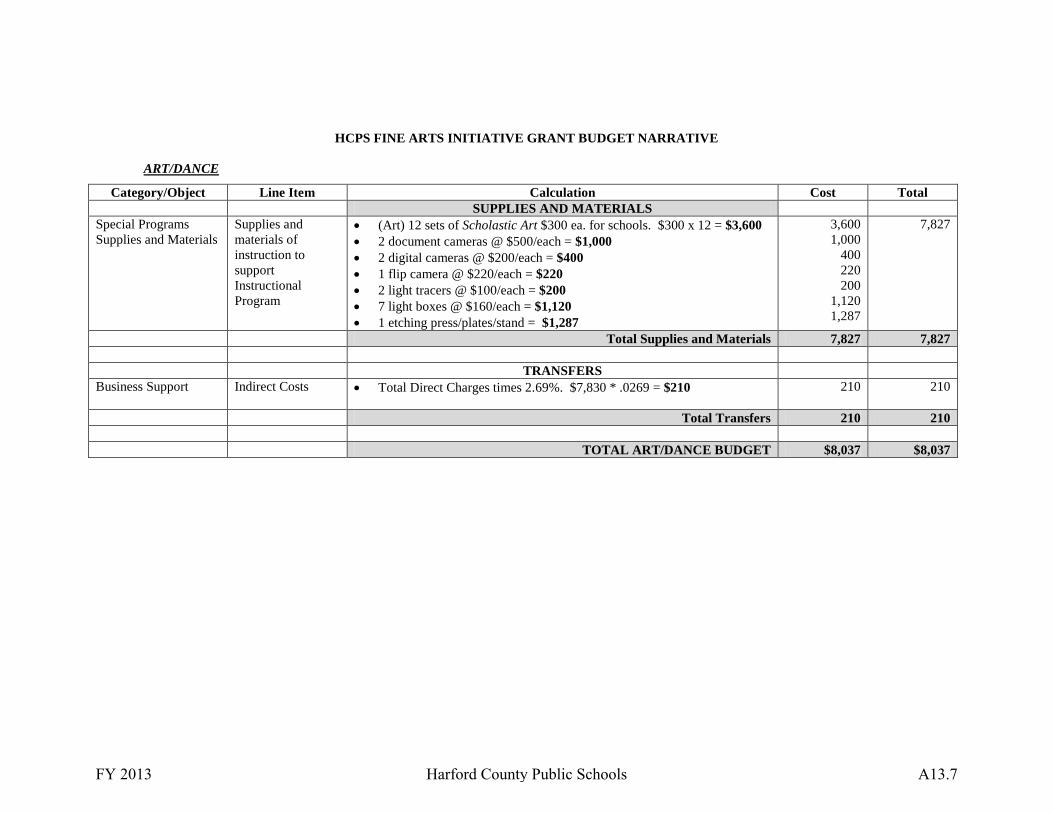
HCPS FINE ARTS INITIATIVE GRANT BUDGET NARRATIVE
ART/DANCE
Category/Object Line Item Calculation Cost Total SUPPLIES AND MATERIALS Special Programs Supplies and Materials
Supplies and materials of instruction to support Instructional Program
• (Art) 12 sets of Scholastic Art $300 ea. for schools. $300 x 12 = $3,600 • 2 document cameras @ $500/each = $1,000 • 2 digital cameras @ $200/each = $400 • 1 flip camera @ $220/each = $220 • 2 light tracers @ $100/each = $200 • 7 light boxes @ $160/each = $1,120 • 1 etching press/plates/stand = $1,287
3,600 1,000
400 220 200
1,120 1,287
7,827
Total Supplies and Materials 7,827 7,827 TRANSFERS Business Support
Indirect Costs • Total Direct Charges times 2.69%. $7,830 * .0269 = $210 210 210
Total Transfers 210 210 TOTAL ART/DANCE BUDGET $8,037 $8,037
FY 2013 Harford County Public Schools A13.7
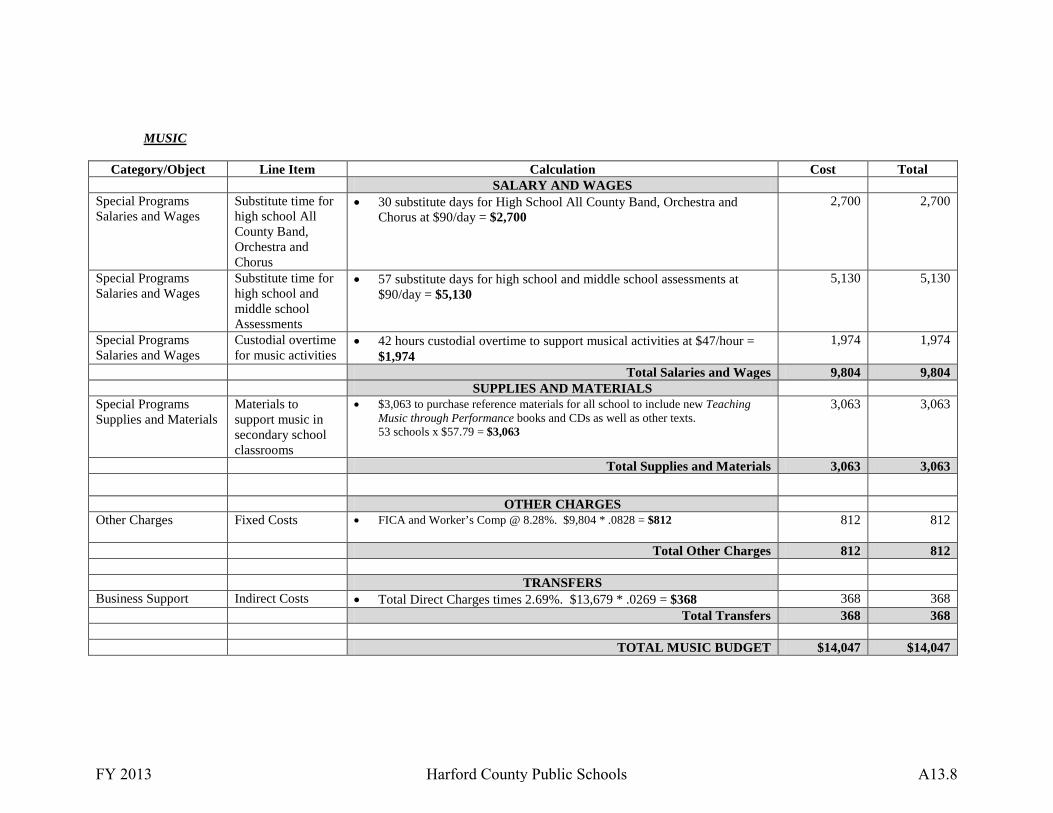
MUSIC
Category/Object Line Item Calculation Cost Total SALARY AND WAGES
Special Programs Salaries and Wages
Substitute time for high school All County Band, Orchestra and Chorus
• 30 substitute days for High School All County Band, Orchestra and Chorus at $90/day = $2,700
2,700 2,700
Special Programs Salaries and Wages
Substitute time for high school and middle school Assessments
• 57 substitute days for high school and middle school assessments at $90/day = $5,130
5,130 5,130
Special Programs Salaries and Wages
Custodial overtime for music activities
• 42 hours custodial overtime to support musical activities at $47/hour = $1,974
1,974 1,974
Total Salaries and Wages 9,804 9,804 SUPPLIES AND MATERIALS Special Programs Supplies and Materials
Materials to support music in secondary school classrooms
• $3,063 to purchase reference materials for all school to include new Teaching Music through Performance books and CDs as well as other texts. 53 schools x $57.79 = $3,063
3,063 3,063
Total Supplies and Materials 3,063 3,063
OTHER CHARGES Other Charges Fixed Costs • FICA and Worker’s Comp @ 8.28%. $9,804 * .0828 = $812
812 812
Total Other Charges 812 812 TRANSFERS Business Support Indirect Costs • Total Direct Charges times 2.69%. $13,679 * .0269 = $368 368 368 Total Transfers 368 368 TOTAL MUSIC BUDGET $14,047 $14,047
FY 2013 Harford County Public Schools A13.8
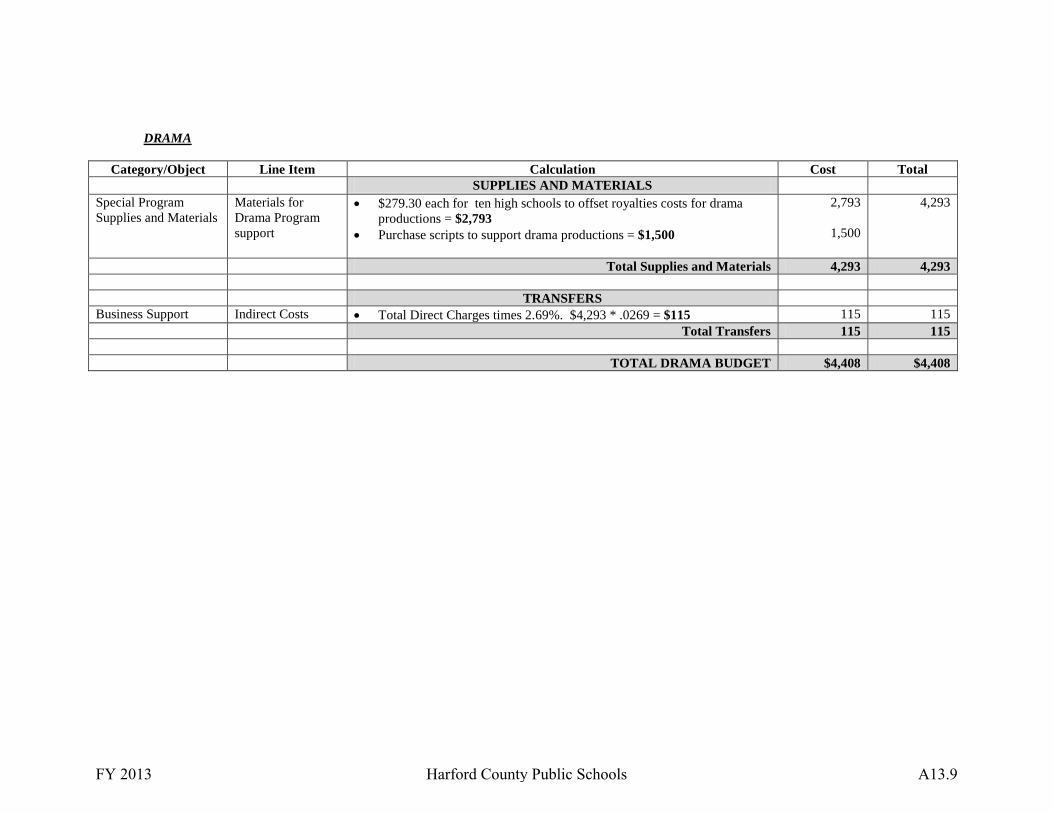
DRAMA
Category/Object Line Item Calculation Cost Total SUPPLIES AND MATERIALS Special Program Supplies and Materials
Materials for Drama Program support
• $279.30 each for ten high schools to offset royalties costs for drama productions = $2,793
• Purchase scripts to support drama productions = $1,500
2,793
1,500
4,293
Total Supplies and Materials 4,293 4,293 TRANSFERS Business Support Indirect Costs • Total Direct Charges times 2.69%. $4,293 * .0269 = $115 115 115 Total Transfers 115 115 TOTAL DRAMA BUDGET $4,408 $4,408
FY 2013 Harford County Public Schools A13.9
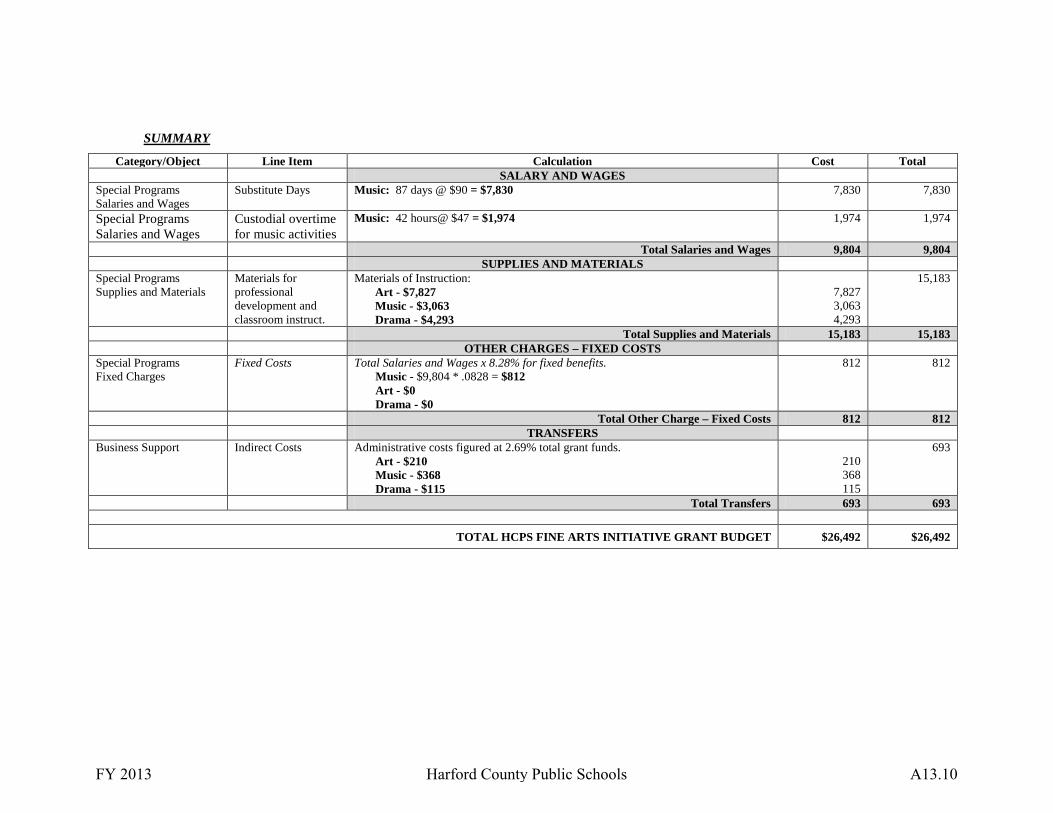
SUMMARY
Category/Object Line Item Calculation Cost Total SALARY AND WAGES
Special Programs Salaries and Wages
Substitute Days Music: 87 days @ $90 = $7,830 7,830 7,830
Special Programs Salaries and Wages
Custodial overtime for music activities
Music: 42 hours@ $47 = $1,974 1,974 1,974
Total Salaries and Wages 9,804 9,804 SUPPLIES AND MATERIALS Special Programs Supplies and Materials
Materials for professional development and classroom instruct.
Materials of Instruction: Art - $7,827 Music - $3,063 Drama - $4,293
7,827 3,063 4,293
15,183
Total Supplies and Materials 15,183 15,183 OTHER CHARGES – FIXED COSTS Special Programs Fixed Charges
Fixed Costs Total Salaries and Wages x 8.28% for fixed benefits. Music - $9,804 * .0828 = $812 Art - $0 Drama - $0
812 812
Total Other Charge – Fixed Costs 812 812 TRANSFERS Business Support Indirect Costs Administrative costs figured at 2.69% total grant funds.
Art - $210 Music - $368 Drama - $115
210 368 115
693
Total Transfers 693 693
TOTAL HCPS FINE ARTS INITIATIVE GRANT BUDGET $26,492 $26,492
FY 2013 Harford County Public Schools A13.10

Additional Federal and State
Reporting Requirements
FY 2013 Harford County Public Schools RR-
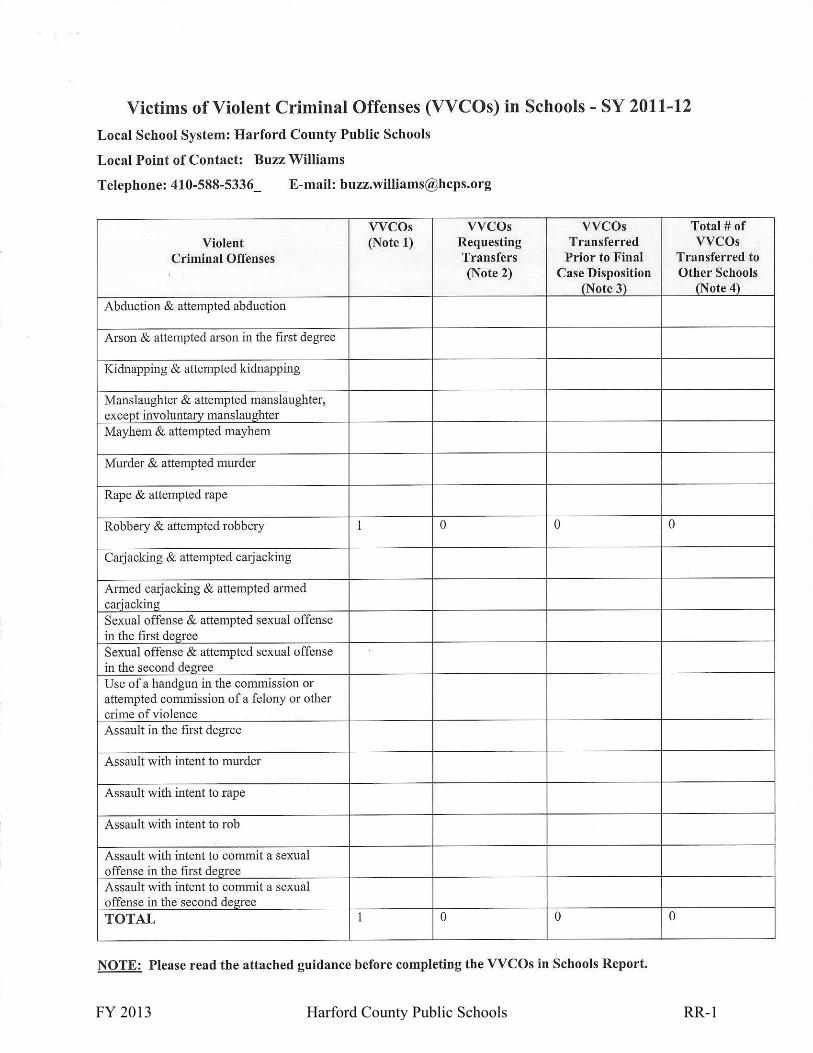
FY 2013 Harford County Public Schools RR-1

FY 2013 Harford County Public Schools RR-2
State Fiscal Stabilization Fund Program Requirements – Phase II Achieving Equity in Teacher Distribution
Summary To enable State officials, parents, the Department of Education, local educators and other key stakeholders to measure States’ progress towards improving teacher effectiveness and achieving equity in the distribution of teachers and principals, States will need to collect, publish, and analyze basic information about how districts evaluate teacher and principal effectiveness and distribute their highly qualified and effective teachers among schools. The objective is to highlight inequities that result in low-income and minority students being taught by inexperienced, unqualified, out-of-field or ineffective teachers at higher rates than other students. Similarly, because principals play a critical role in teaching and learning, it is important to highlight inequities that result in low-income and minority students being taught in schools overseen by ineffective principals at higher rates than other students. General Instructions:
- Please update your school system web site to report required information.
- For this reporting year, use 2011-2012 data to update system web site.
PART I: Teacher and Principal Evaluation Systems Directions: Include, and update, the following information for descriptors (a)(1), (a)(2), and indicators (a)(4), (a)(5), (a)(7) on the local school system's designated website.
Please provide your school system link on the line below:
URL: http://www.hcps.org/BOE/Default.aspx?tab=4
Citation Description Rationale Descriptor (a)(1)
Describe, for each local education agency (LEA) in the State, the systems used to evaluate the performance of teachers and the use of results from those systems in decisions regarding teacher development, compensation, promotion, retention, and removal.
Teacher evaluation systems should reflect a comprehensive review of the established criteria and are an important information source for assessing the distribution of effective teachers.
HCPS Response: Evaluation of teachers is based on established performance standards which include observation of instruction and criteria identified in Characteristics of a Competent Teacher. The evaluation process includes development of the individual's professional development goals. Key components of the observation instrument include instructional planning, lesson implementation, pupil involvement, management and organization, and professional characteristics. Indicators within these components are tied to state curriculum outcomes and student achievement. Teachers exhibiting weaknesses in any of the observation components are placed on assistance plans accordingly. This professional development allows administrators and supervisors to meet the identified needs of individual teachers directly connected to their instructional practices. Additionally, as principals determine a need for specific professional development for their instructional staffs, the HCPS teacher calendar designates 5 teacher days for the implementation of targeted professional development at the school level. Currently there is no performance pay or performance compensation for teachers other than the established salary scale. Promotional opportunities for teachers are advertised as needed and require 3 to 5 years of successful teaching experience in addition to job-specific qualifications. The teacher observation and evaluation process is used to determine retention and dismissal. During the 2012-2013 school year, in
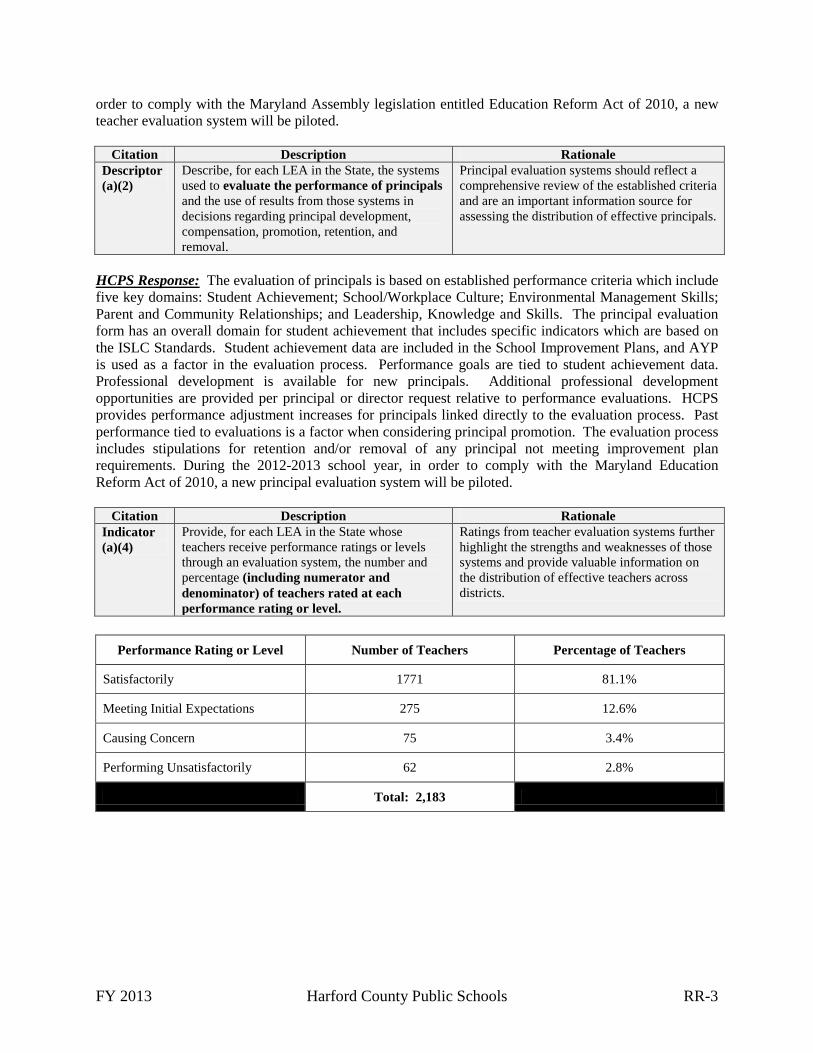
FY 2013 Harford County Public Schools RR-3
order to comply with the Maryland Assembly legislation entitled Education Reform Act of 2010, a new teacher evaluation system will be piloted.
Citation Description Rationale Descriptor (a)(2)
Describe, for each LEA in the State, the systems used to evaluate the performance of principals and the use of results from those systems in decisions regarding principal development, compensation, promotion, retention, and removal.
Principal evaluation systems should reflect a comprehensive review of the established criteria and are an important information source for assessing the distribution of effective principals.
HCPS Response: The evaluation of principals is based on established performance criteria which include five key domains: Student Achievement; School/Workplace Culture; Environmental Management Skills; Parent and Community Relationships; and Leadership, Knowledge and Skills. The principal evaluation form has an overall domain for student achievement that includes specific indicators which are based on the ISLC Standards. Student achievement data are included in the School Improvement Plans, and AYP is used as a factor in the evaluation process. Performance goals are tied to student achievement data. Professional development is available for new principals. Additional professional development opportunities are provided per principal or director request relative to performance evaluations. HCPS provides performance adjustment increases for principals linked directly to the evaluation process. Past performance tied to evaluations is a factor when considering principal promotion. The evaluation process includes stipulations for retention and/or removal of any principal not meeting improvement plan requirements. During the 2012-2013 school year, in order to comply with the Maryland Education Reform Act of 2010, a new principal evaluation system will be piloted.
Citation Description Rationale Indicator (a)(4)
Provide, for each LEA in the State whose teachers receive performance ratings or levels through an evaluation system, the number and percentage (including numerator and denominator) of teachers rated at each performance rating or level.
Ratings from teacher evaluation systems further highlight the strengths and weaknesses of those systems and provide valuable information on the distribution of effective teachers across districts.
Performance Rating or Level Number of Teachers Percentage of Teachers
Satisfactorily 1771 81.1%
Meeting Initial Expectations 275 12.6%
Causing Concern 75 3.4%
Performing Unsatisfactorily 62 2.8%
Total: 2,183
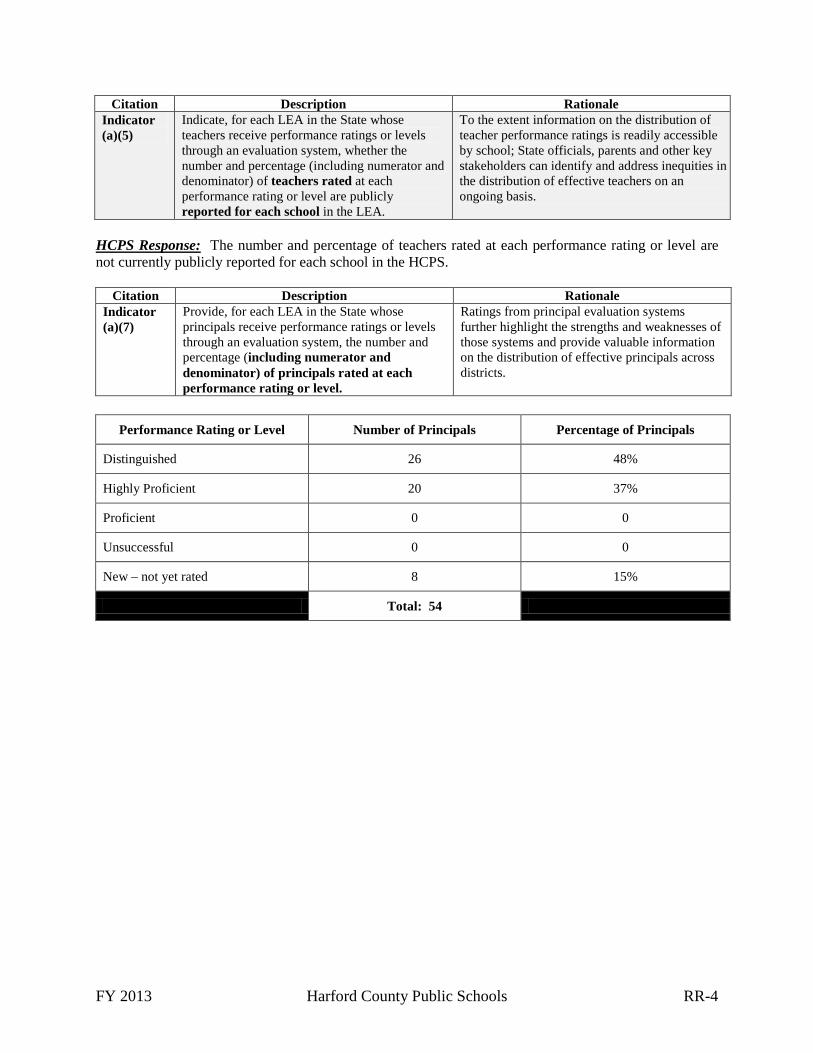
FY 2013 Harford County Public Schools RR-4
Citation Description Rationale Indicator (a)(5)
Indicate, for each LEA in the State whose teachers receive performance ratings or levels through an evaluation system, whether the number and percentage (including numerator and denominator) of teachers rated at each performance rating or level are publicly reported for each school in the LEA.
To the extent information on the distribution of teacher performance ratings is readily accessible by school; State officials, parents and other key stakeholders can identify and address inequities in the distribution of effective teachers on an ongoing basis.
HCPS Response: The number and percentage of teachers rated at each performance rating or level are not currently publicly reported for each school in the HCPS.
Citation Description Rationale Indicator (a)(7)
Provide, for each LEA in the State whose principals receive performance ratings or levels through an evaluation system, the number and percentage (including numerator and denominator) of principals rated at each performance rating or level.
Ratings from principal evaluation systems further highlight the strengths and weaknesses of those systems and provide valuable information on the distribution of effective principals across districts.
Performance Rating or Level Number of Principals Percentage of Principals
Distinguished 26 48%
Highly Proficient 20 37%
Proficient 0 0
Unsuccessful 0 0
New – not yet rated 8 15%
Total: 54

FY 2013 Harford County Public Schools RR-5
PART II: Achievement Outcomes and Evaluation Systems Directions: Check the appropriate response for questions 1 and 2 to report information for
indicators (a)(3) and (a)(6).
Citation Description Rationale Indicator (a)(3)
Indicate, for each LEA in the State, whether the systems used to evaluate the performance of teachers include student achievement outcomes or student growth as an evaluation criterion.
Evaluation systems that include student achievement outcomes yield reliable assessments of teacher performance. Knowing if an evaluation system includes these outcomes informs the value of teacher performance ratings.
1. Do your evaluation systems include student achievement outcomes or student growth?
(Mark "Yes" or "No")
a. ______Yes, the systems used to evaluate the performance of teachers include student achievement outcomes or student growth as an evaluation criterion.
b. If Yes, please respond (check one):
_____ Student achievement outcomes are included as an evaluation criterion. _____ Student growth is included as an evaluation criterion.
c. X No, the systems used to evaluate the performance of teachers do not include student achievement outcomes or student growth as an evaluation criterion.
Citation Description Rationale
Indicator (a)(6)
Indicate, for each LEA in the State, whether the systems used to evaluate the performance of principals include student achievement outcomes or student growth data as an evaluation criterion.
Evaluation systems that include student achievement outcomes yield reliable assessments of teacher performance. Knowing if an evaluation system includes these outcomes informs the value of teacher performance ratings.
2. Do the systems used to evaluate the performance of principals include student achievement outcomes
or student growth as an evaluation criterion? (Mark "Yes" or "No")
a. X Yes, the systems used to evaluate the performance of principals include student achievement outcomes or student growth as an evaluation criterion.
b. If Yes, please respond (check one):
Student achievement outcomes are included as an evaluation criterion.
X Student growth is included as an evaluation criterion.
c. No, the systems used to evaluate the performance of principals do not
include student achievement outcomes or student growth as an evaluation criterion.

FY 2013 Harford County Public Schools RR-6

FY 2013 Harford County Public Schools RR-7