hcs traffic simulation models ! how do they compare - application and... · traffic simulation...
TRANSCRIPT
Traffic Simulation Models ! How Do They Compare
Presented By: Anita S Johari, PE, PTOE ASJ Engineering Consultants, LLC
HCM-HCS
VISTRO
2016 ITE/IMSA Spring Conference
Presentation Outline
▪ What are the Traffic Engineering Software Available
▪ When Do you use What ?
▪ How do the results of different simulation software compare !
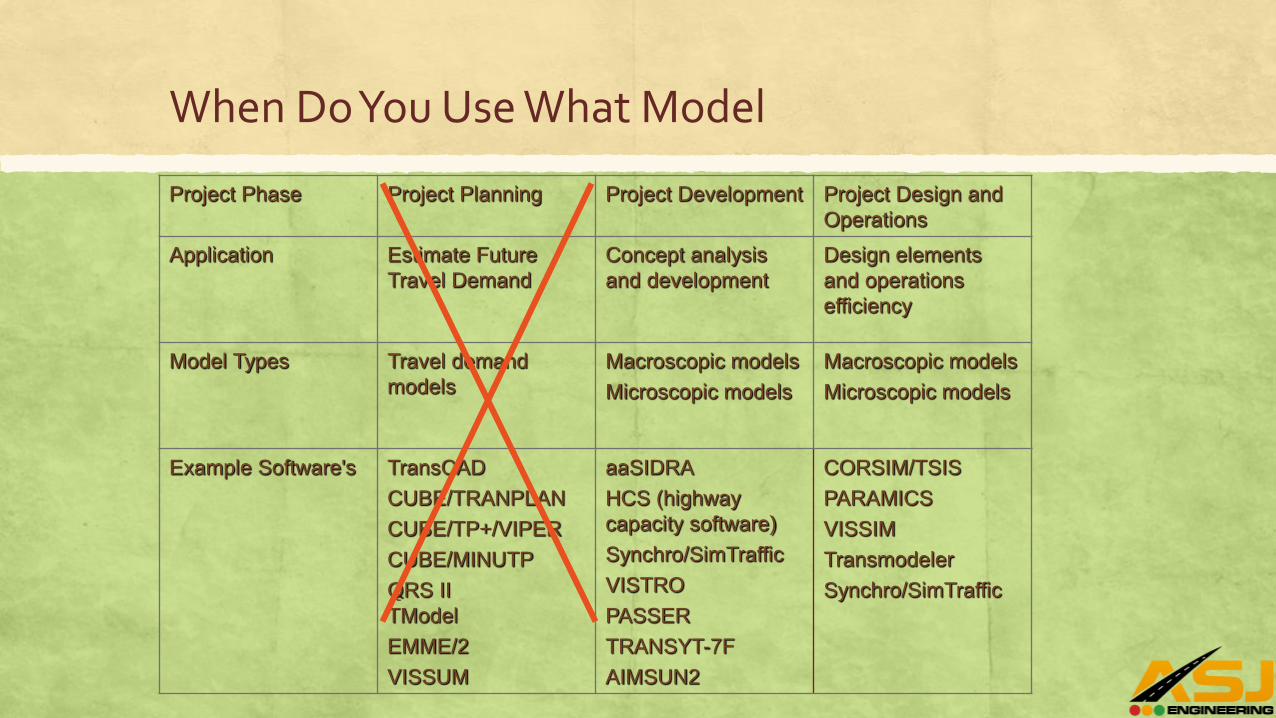
When Do You Use What Model
Project Phase Project Planning Project Development Project Design and
Operations
Application Estimate Future
Travel Demand
Concept analysis
and development
Design elements
and operations
efficiency
Model Types Travel demand
models
Macroscopic models
Microscopic models
Macroscopic models
Microscopic models
Example Software's TransCAD
CUBE/TRANPLAN
CUBE/TP+/VIPER
CUBE/MINUTP
QRS II
TModel
EMME/2
VISSUM
aaSIDRA
HCS (highway
capacity software)
Synchro/SimTraffic
VISTRO
PASSER
TRANSYT-7F
AIMSUN2
CORSIM/TSIS
PARAMICS
VISSIM
Transmodeler
Synchro/SimTraffic
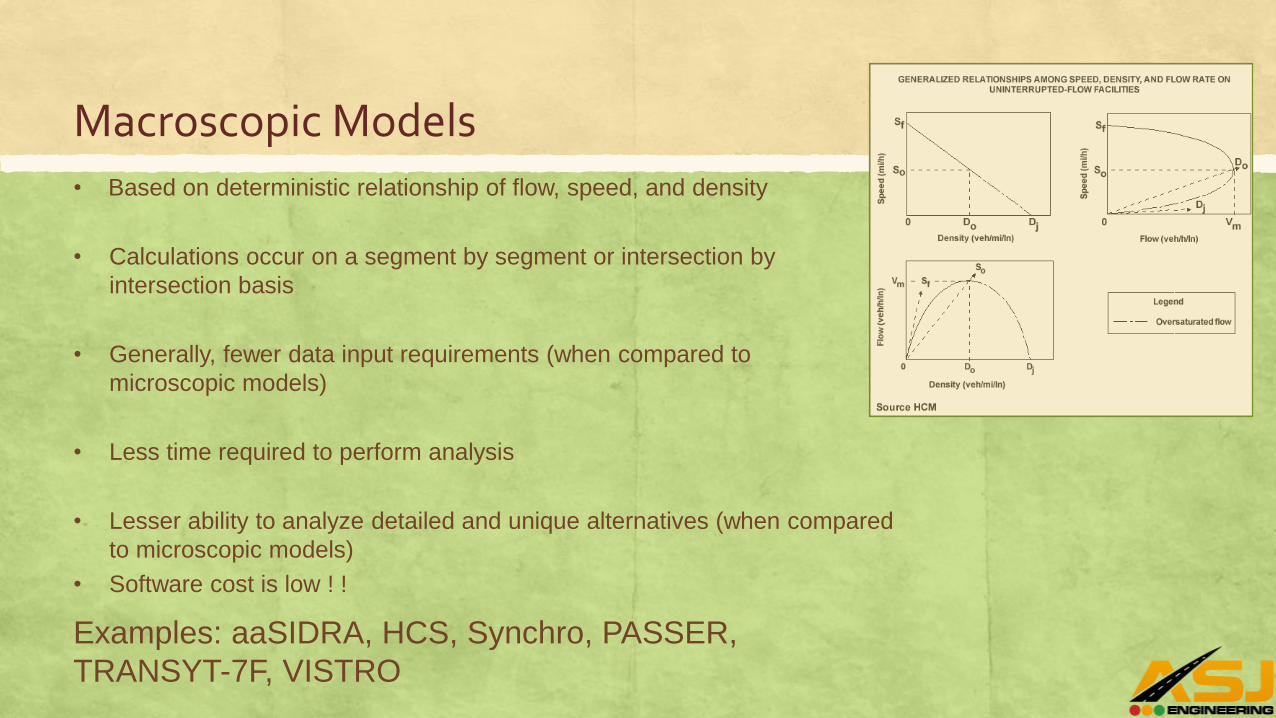
Macroscopic Models• Based on deterministic relationship of flow, speed, and density
• Calculations occur on a segment by segment or intersection by
intersection basis
• Generally, fewer data input requirements (when compared to
microscopic models)
• Less time required to perform analysis
• Lesser ability to analyze detailed and unique alternatives (when compared
to microscopic models)
• Software cost is low ! !
Examples: aaSIDRA, HCS, Synchro, PASSER,
TRANSYT-7F, VISTRO
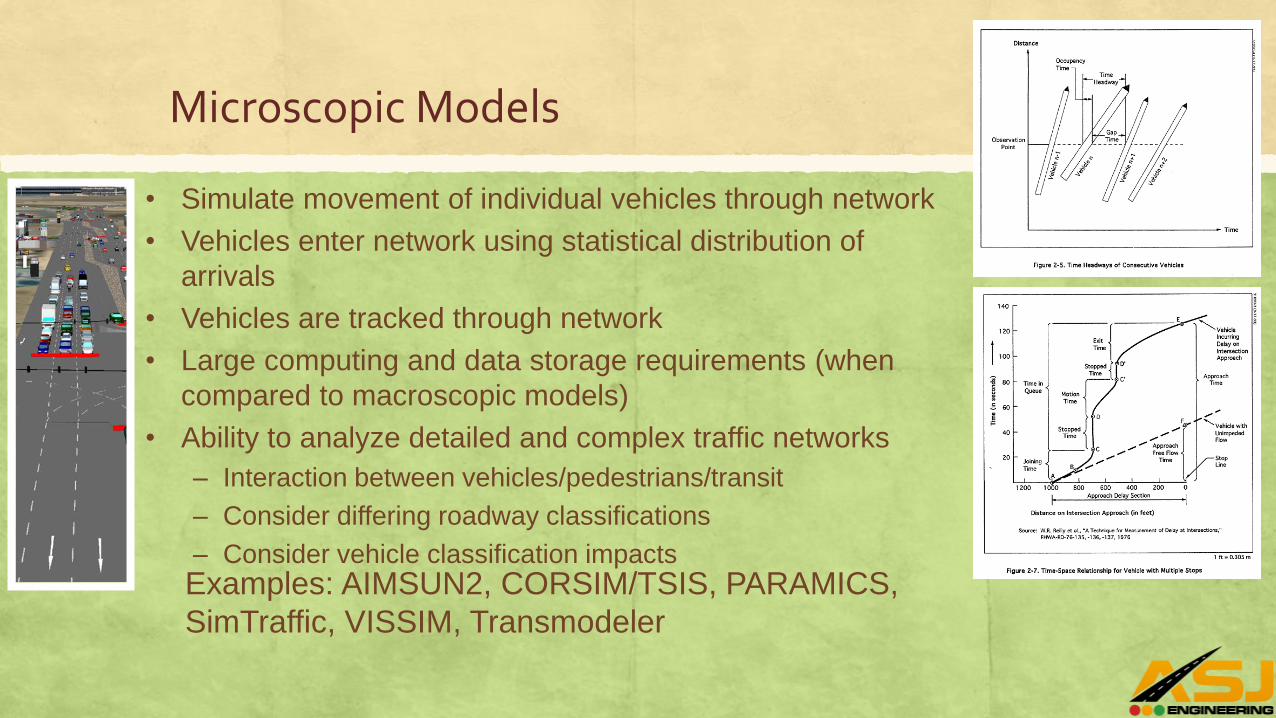
Microscopic Models
• Simulate movement of individual vehicles through network
• Vehicles enter network using statistical distribution of
arrivals
• Vehicles are tracked through network
• Large computing and data storage requirements (when
compared to macroscopic models)
• Ability to analyze detailed and complex traffic networks
– Interaction between vehicles/pedestrians/transit
– Consider differing roadway classifications
– Consider vehicle classification impactsExamples: AIMSUN2, CORSIM/TSIS, PARAMICS,
SimTraffic, VISSIM, Transmodeler
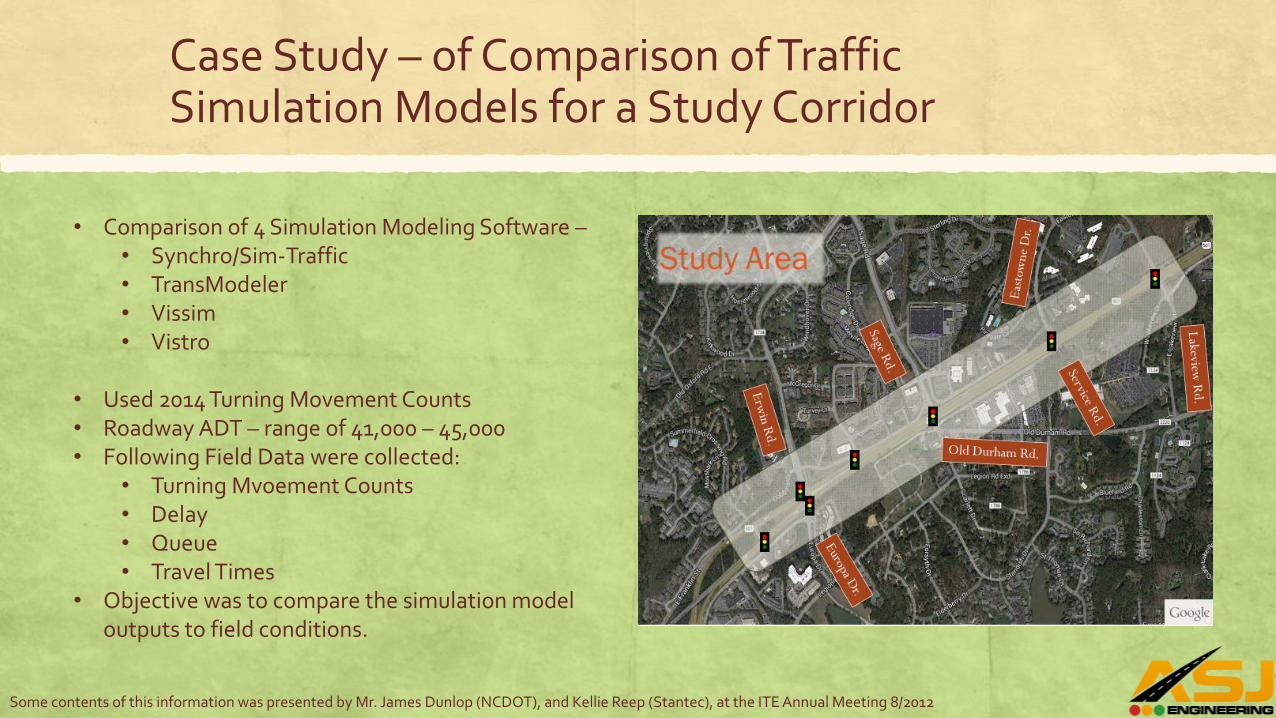
Case Study – of Comparison of Traffic Simulation Models for a Study Corridor
Some contents of this information was presented by Mr. James Dunlop (NCDOT), and Kellie Reep (Stantec), at the ITE Annual Meeting 8/2012
• Comparison of 4 Simulation Modeling Software –• Synchro/Sim-Traffic• TransModeler• Vissim• Vistro
• Used 2014 Turning Movement Counts• Roadway ADT – range of 41,000 – 45,000 • Following Field Data were collected:
• Turning Mvoement Counts• Delay• Queue• Travel Times
• Objective was to compare the simulation model outputs to field conditions.

Base Model Setup & Assumptions
• Base models for each software were set up from scratch
• Same speed and heavy vehicle percentages were used in Synchro and Vistro
• Same speed distributions were used in Vissim and TransModeler
• Effort was made to keep same assumptions in both Vissim and TransModeler
• Same 10 random seeds were used: 5, 10, 15, 20, …. 50
Some contents of this information was presented by Mr. James Dunlop (NCDOT), and Kellie Reep (Stantec), at the ITE Annual Meeting 8/2012
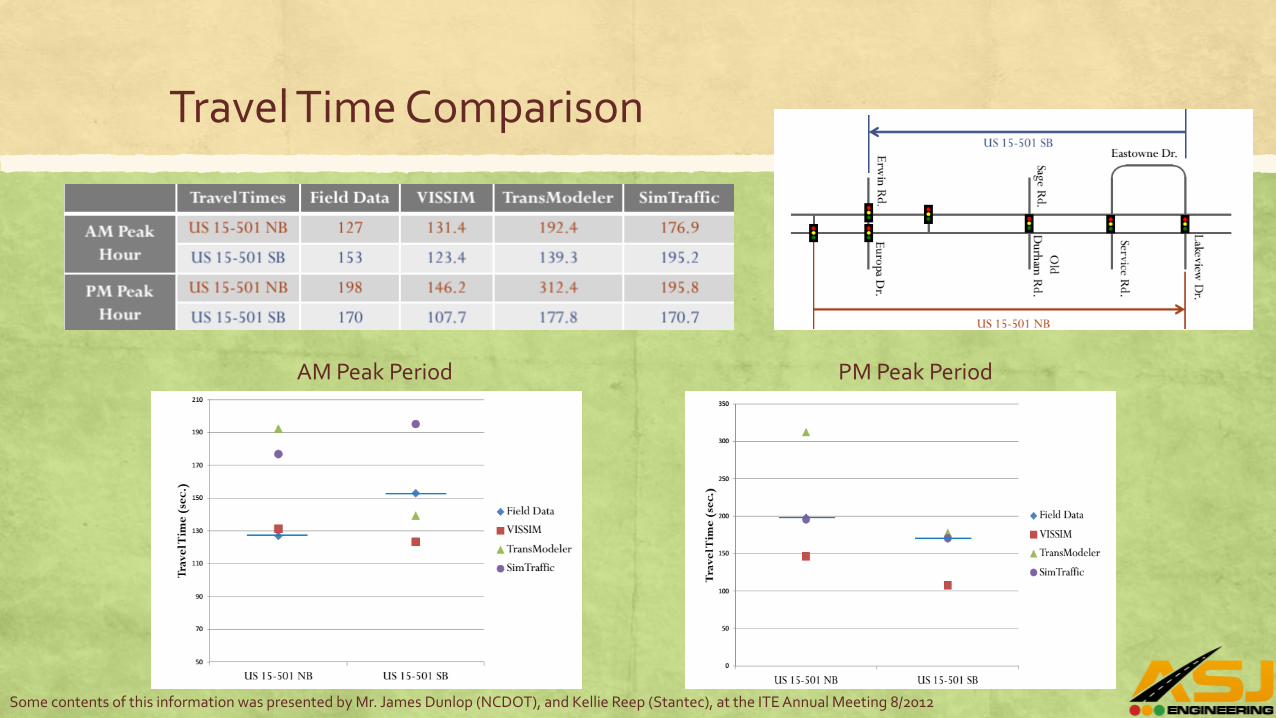
Travel Time Comparison
AM Peak Period PM Peak Period
Some contents of this information was presented by Mr. James Dunlop (NCDOT), and Kellie Reep (Stantec), at the ITE Annual Meeting 8/2012
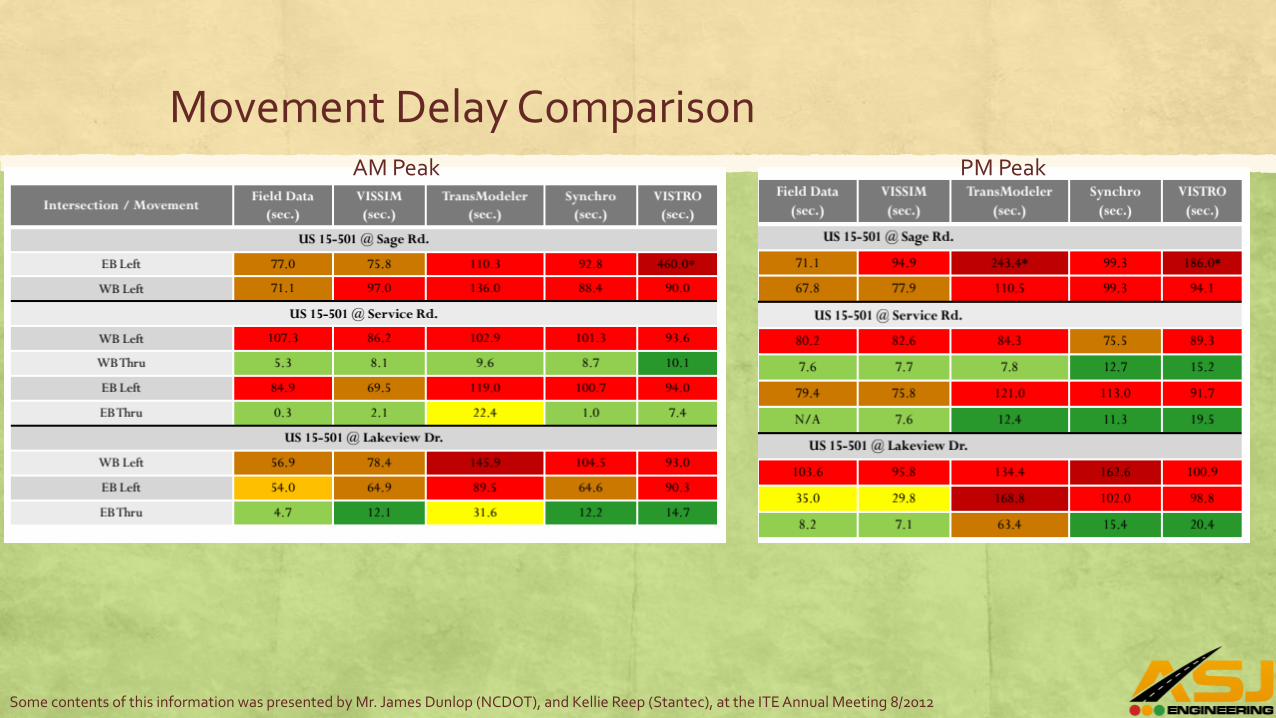
Movement Delay Comparison AM Peak PM Peak
Some contents of this information was presented by Mr. James Dunlop (NCDOT), and Kellie Reep (Stantec), at the ITE Annual Meeting 8/2012
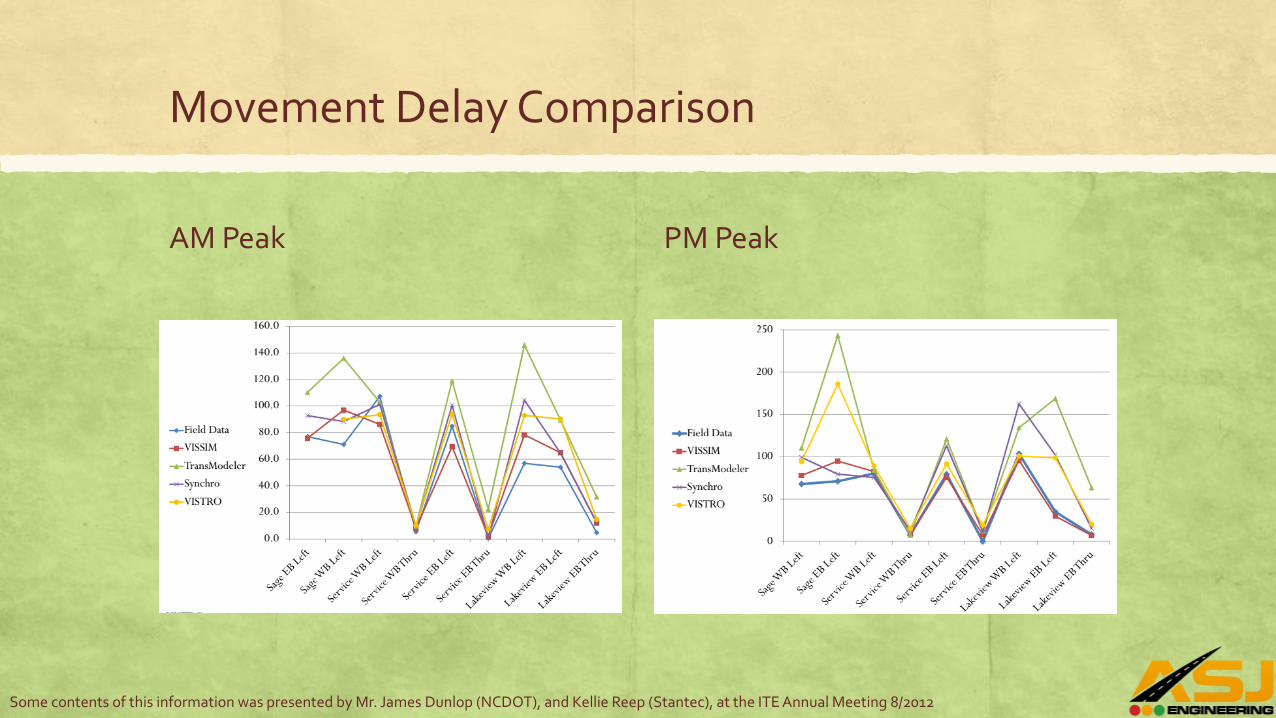
Movement Delay Comparison
AM Peak PM Peak
Some contents of this information was presented by Mr. James Dunlop (NCDOT), and Kellie Reep (Stantec), at the ITE Annual Meeting 8/2012
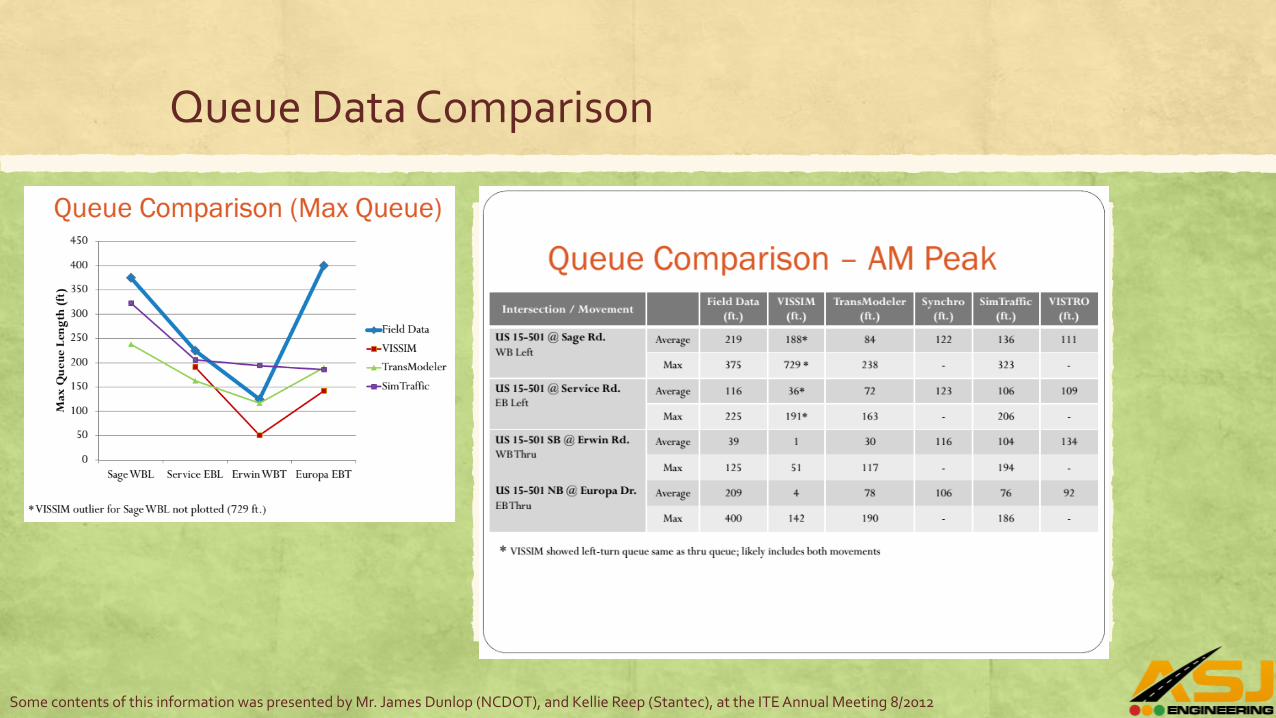
Queue Data Comparison
Some contents of this information was presented by Mr. James Dunlop (NCDOT), and Kellie Reep (Stantec), at the ITE Annual Meeting 8/2012
Observations
▪ No clear pattern for travel times; varied among all software applications
▪ Magnitude of delay times were elevated for all software when compared to field data, but the trend was consistent
▪ Maximum queues were consistent in some locations, but very different in others
▪ Conventional intersections –TransModeler & Vistro high, VISSIM, low
▪ Parkway intersections – Synchro high, TransModeler & VISSIM low
Some contents of this information was presented by Mr. James Dunlop (NCDOT), and Kellie Reep (Stantec), at the ITE Annual Meeting 8/2012

Conclusion from the Study Results !
▪ TransModeler tends to produce higher movement delays than the other software, especially at congested locations
▪ TransModeler generates lower delays for parkways (e.g. 2-phase signals), but higher delays for conventional intersections (e.g. 6- or 8-phase)
▪ Vistro and Synchro generate higher delays for parkway locations, while VISSIM shows generally some of the lowest delays
▪ Software results generally higher than field data, indicating that analyses are conservative
▪ No clear “winner” in travel time comparison
▪ Calibration is Key ! !
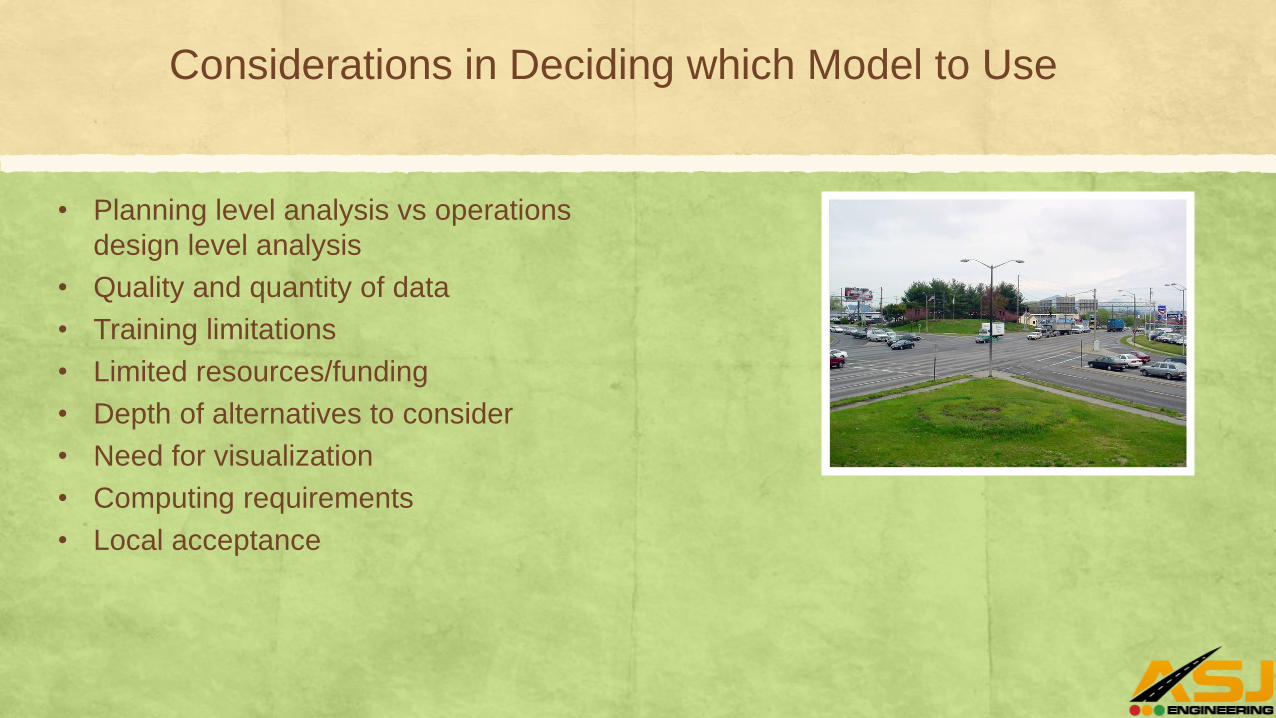
Considerations in Deciding which Model to Use
• Planning level analysis vs operations
design level analysis
• Quality and quantity of data
• Training limitations
• Limited resources/funding
• Depth of alternatives to consider
• Need for visualization
• Computing requirements
• Local acceptance
General Comparison
• TransModeler and VISSIM allow for the most flexibility in creating a Innovative Design – Parkways, Continuous Flow Intersections, Complete Streets, Transit facilities
• Vistro still has some bugs – Software needs fixes
• Vistro signal timing optimization more flexible than Synchro and TransModeler –seems to provide results with improved delay & LOS
• Time required to code / ease of coding Innovative intersections/Corridors: TransModeler<VISSIM
• Time required to code / ease of coding conventional intersections Synchro≤Vistro<TransModeler<VISSIM
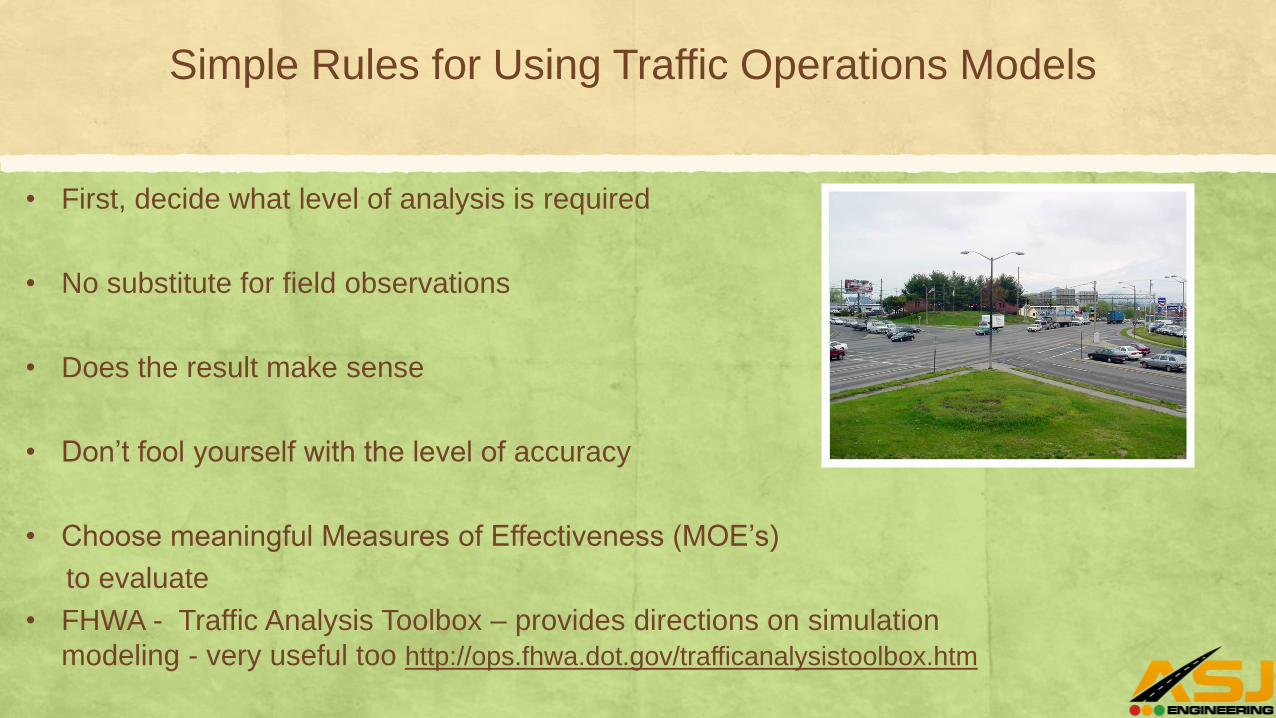
Simple Rules for Using Traffic Operations Models
• First, decide what level of analysis is required
• No substitute for field observations
• Does the result make sense
• Don’t fool yourself with the level of accuracy
• Choose meaningful Measures of Effectiveness (MOE’s)
to evaluate
• FHWA - Traffic Analysis Toolbox – provides directions on simulation
modeling - very useful too http://ops.fhwa.dot.gov/trafficanalysistoolbox.htm

Questions ??
Thank You !
Anita S Johari, PE, PTOE
ASJ Engineering Consultants, LLC