hdpe pipe: recommended material specifications and design
TRANSCRIPT

F-1
APPENDIX F
REPORTS ON EIGHTEEN INVESTIGATED FIELD SITES

F-2
SITE A
INTRODUCTION
Site A is located in Region 5 of the States. Related information supplied by the local engineer is
included in the Appendix B under Questionnaire No. 72-11.
The pipe was a high-density polyethylene (HDPE) corrugated pipe with a nominal diameter of
600 mm and was a type C-helical pipe. The nominal pipe section length was 6.7 m and the entire system
length was 13.3 m. The pipe was installed in 1981 and used as a cross drain. The pipeline was located
under a maximum height of 0.3 m of fill. The fill material was generally a gravelly soil. The pipe was
entered from the inlet end and the entire installation was inspected.
PIPE CONDITION
The storm drain was inspected in June 1997, and showed that the pipe has experienced deflection
and cracking at the invert near the inlet of the pipe, as shown in Figure 1, and summarized in Table 1.
Table 1 - Information on the deflection and cracks
Distance frompoint of inlet
Deflection measurements Cracks
(m) Vert. Horiz.5.2 - 12.5% + 8.3% circumferential and longitudinal cracks,
at the invert of the pipe4.5 - 6.3%) + 7.3%) -1.2 - - circumferential crack at invert of the pipe
LABORATORY INVESTIGATION ON THE FIELD RETRIEVED SAMPLES
Three large samples and three small samples were removed from various locations of the pipe
(Figure 2). Samples are coded A1 to A6. Samples A1 and A2 were taken at the location where the
greatest deflection took place. Both samples contained a failure surface. Sample A3 was taken two
corrugations away from the Samples A1 and A2 and also contained a failure surface. Three large
samples, A4 to A6, were taken at the inlet of the pipe. Sample A4 also contained a fracture surface. The
fracture surface of the cracks was examined using a scanning electron microscope (SEM) to verify the
failure mechanism.

F-3
Fracture Morphology
Three small SEM specimens were taken from web of Samples A1 and A4. Figure 3 shows the
fracture surface of the crack in Sample A1. There is no sign of ductility associated with this crack, as
indicated by the constant thickness along the fraction surface. The crack was initiated from the inner
pipe wall at region marked “A”. The crack started from the initiation region and grew outward. A close
view of area near region “A” reveals many short fibrils (Figure 4). The fracture surface of the specimen
taken from Sample A4 is shown in Figure 5. Fibrous morphology again covers the fracture surface, as
can be seen in Figure 6. The fibrous morphology signifies that both cracks were caused by the slow
crack growth mechanism.
SUMMARY
A Type C-helical HDPE pipe was being used as a storm drain under 0.3 m of fill beneath a
roadway. During the inspection in June 1997, 16 years after the its installation, circumferential and
longitudinal cracks were observed in the inspected area near the inlet of the pipe. A 12% vertical
deflection and 8% horizontal deflection were measured at one crack location.
The microstructure examination of the fracture surface of the crack verifies that the slow crack
growth was failure mechanism. The tensile stress that initiated the crack is likely due to deflection of the
pipe.

F-4
Figure 1 – An interior view of the pipe in Site A
Figure 2 – Retrieved field samples from pipe in Site

F-5
Figure 3 – Fracture surface of the crack in Sample A1
Figure 4 – A close view on the fracture surface of the crack inSample A1, revealing fibrous morphology
pipe wallthickness
outer pipe surface
inner pipe surface
crack growthdirection
A

F-6
Figure 5 – Fracture surface of the crack in Sample A4
Figure 6 – A Clost view on the fracture surface of the crackIn Sample A-4, revealing fibrous morphology
pipe wallthickness
outer pipe surface
inner pipe surface
crack growthdirection

F-7
SITE B
INTRODUCTION
Site B is located in Region 5 of the States. Related information supplied by the local engineer is
included in the Appendix B under Questionnaire No. 72-3.
The pipe was a high-density polyethylene (HDPE) corrugated pipe with a nominal diameter of
600 mm and was a Type C-helical pipe. The nominal pipe section length was 6.7 m and the entire system
length was 16 m. The pipe was installed in 1984 and is used as a cross drain, under a maximum height of
1.8 m of fill. The fill material was generally a mixture of sand, silt and gravel. The pipe was entered from
the outlet end and a total of 10 m of pipe was inspected.
PIPE CONDITION
The storm drain was inspected in June of 1997. Figure 1 shows the condition of the pipe. There
was no deflection; however, there was significant longitudinal bending in the pipe due to erosion at the
outlet end. The bends leaded to circumferential cracking.
LABORATORY INVESTIGATION ON THE FIELD RETRIEVED SAMPLES
A section of the pipe was removed from the pipe, as shown in Figure 2. The sample is coded as
Sample B1, which contains a long circumferential crack. The crack took place at the joint location
between web and valley of the pipe. The fracture surface of the cracks was examined using a scanning
electron microscope (SEM) in order to verify the failure mechanism.
Fracture Morphology
Two specimens were taken at different positions of the circumferential crack for evaluation. Their
fracture morphology are very similar. Figures 3 show the overall appearing of the fracture surface of the
crack. There is no sign of ductility associated with this crack, since the pipe wall thickness remained
constant along the fracture surface. The crack was initiated from the inner surface of the pipe, and grew
towards the outer surface. The fracture surface is covered with the morphology defined as the “flake”
structure, as can be seen in Figure 4. The flake morphology is not the result of slow crack growth failure,

F-8
but is associated with a rapid crack propagation failure mechanism. Such cracking typically occurs very
fast under a dynamic force.
SUMMARY
A type C - helical HDPE pipe was being used as a storm drain under 1.8 m of fill. During the
inspection in June 1997, 13 years after the installation, circumferential cracks were observed in the
inspected area near the outlet of the pipe. A significant amount of longitudinal bending was observed,
which was caused by soil erosion under the pipe.
The microstructure examination of the fracture surface of the crack indicates that a rapid crack
propagation was the cause of cracking. Cracks were initiated from the inner surface of the pipe. The
longitudinal bending was the major cause of the cracking.

F-9
Figure 1 – General view of the pipe in Site B
Figure 2 – A retrieved field sample containing a circumferential crack

F-10
Figure 3 – Fracture surface of the crack in Sample B-1
Figure 4 – A close view on the fracture surface of the crackin Sample B1, revealing a flake morphology
pipe wallthickness
inner pipe surface
outer pipe surface
crack growthdirection

F-11
SITE D
INTRODUCTION
Site D is located in Region 5 of the States. Related information supplied by the local engineer is
included in the Appendix B under Questionnaire No. 72-1.
The pipe was a high-density polyethylene (HDPE) corrugated pipe with a nominal diameter of
600 mm and was a Type C-annular pipe. . The pipe was labeled AASHTO M 294. The pipe was installed
in 1995 and used as concrete column formwork under a highway bridge, as shown in Figure 1. The same
type of pipe was used in eight concrete columns, and all eight pipes were cracked. Pipes, which were
manufactured by different company, used at other bridge piers did not crack.
PIPE CONDITION
The pipe was inspected in June 1997, and showed that a single longitudinal crack occurred along
the air channel of the pipe, as can be seen in Figure 2. This suggests that the pipe was subjected to a
circumferential stress, which might be induced by the hydrostatic pressure of the wet concrete and the
high thermal expansion coefficient of the polyethylene.
LABORATORY INVESTIGATION ON THE FIELD RETRIEVED SAMPLES
A section of the pipe was removed from the pipe. The section consisted of a pair of samples on
opposite sides of the crack. The two samples are coded as Samples D1 and D2. The fracture surface of
the cracks was examined using a scanning electron microscope (SEM) in order to verify the failure
mechanism.
Fracture Morphology
A SEM specimen was taken from the crack for evaluation. Figure 3 shows the overall appearing
of the fracture surface of the crack. There is no sign of ductility associated with this crack, as indicated by
the constant thickness along the fracture surface. The initiation of the crack was not identified. The crack
probably started at the center of the pipe wall and grew toward the edges, since small amount of ductile
pullout can be observed on both edges of the pipe. The fracture surface, however, is heavy covered with

F-12
soil particles, causing difficulty in examining the morphology. Figure 4 shows the fibrous morphology on
the surface of the crack. The size of the fibrils is fairly small; suggesting the applied stress is relatively
small.
SUMMARY
A Type C-annular HDPE pipe was being used as concrete column formwork under a highway
bridge. During the inspection in June 1997, 2 years after the installation, a single longitudinal crack along
the entire length of the pipe was observed. The microstructure examination of the fracture surface of the
crack indicates that a slow crack growth was the cracking mechanism. Cracks might be initiated from the
center of the pipe wall and grew toward the edges. The cracking was induced by a circumferential tensile
stress likely the result of thermal expansion caused by the hydration of wet concrete.

F-13
Figure 1 – A view of the eight concrete columns with pipe as the formwork
Figure 2 – A close view of the longitudinal crack alongthe air channel of the pipe

F-14
Figure 3 – Fracture surface of the crack in Sample D1
Figure 4 – A close view on the fracture surface of the crackin Sample D1, revealing a fibrous morphology
pipe wallthickness
outer pipe surface
inner pipe surface

F-15
SITE E
INTRODUCTION
Site E is located in Region 5 of the States. Related information supplied by the local engineer is
included in Appendix B under the Questionnaire No. 72-2.
The pipe has a nominal diameter of 1070 mm with a Type S-honeycomb cross section. The
nominal pipe section length was 6.7 m and the entire system length was 162 m. The pipe was installed in
1994, and used as a cross drain beneath a highway embankment. The pipeline was located under a
maximum depth of fill of 15 m. The fill material was identified as #57 limestone. The pipe was entered
from the inlet end and a total of 62 m of pipe was inspected.
PIPE CONDITION
The culvert was inspected in June 1997, and showed that the pipe has experienced deflection,
buckling, and cracking (Figure 1).
Deflection measurements were taken at several locations along the culvert’s length. In addition to
deflection, the culvert pipe also exhibited localized buckling through much of its length. The buckling
can be described as having a short wavelength, sinusoidal pattern and commonly occurred within the
liner, around the pipe circumference. The buckling first appeared in the second length of pipe from the
inlet and increased with increasing depth of fill. Two types of cracking was observed in this pipe. The
first resembles a splitting of the liner at the corrugation/liner intersection (Figure 2). The other is related
to the inner wall buckling and forms an elliptical crack around a buckle (Figure 1) and sometimes in the
longitudinal direction. Table 1 summarizes the information regarding deflection, buckling and cracking
under the deeper fill sections.
F-16
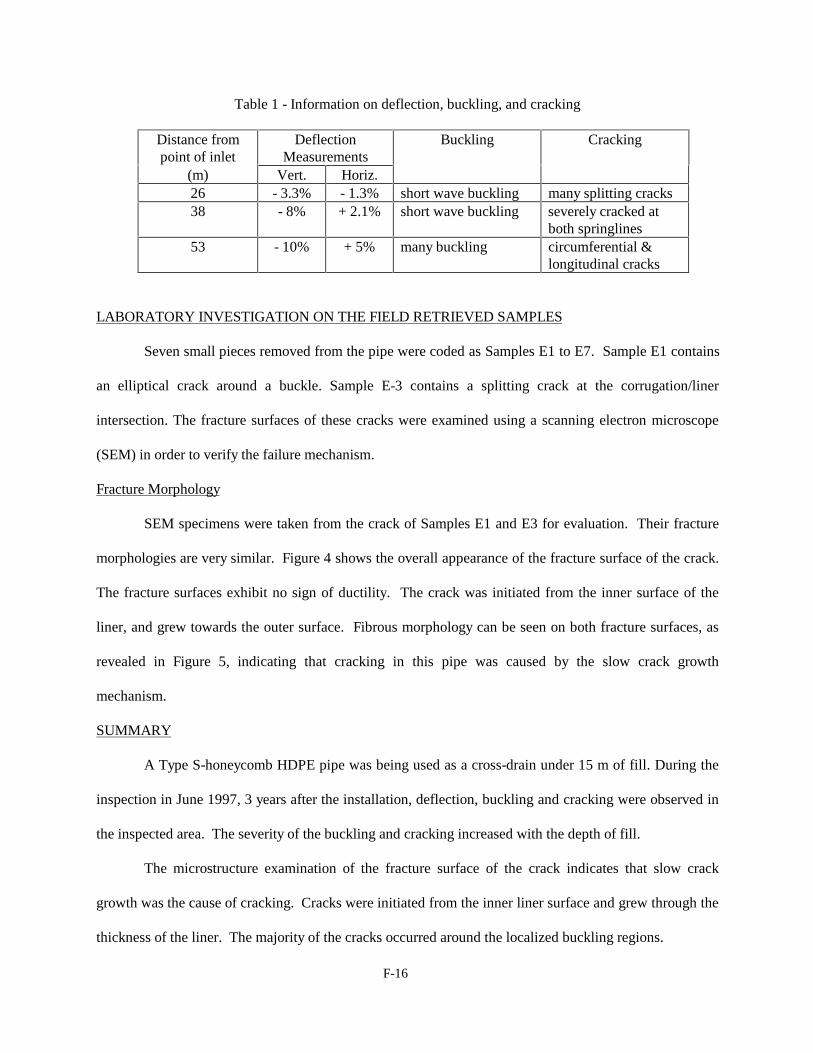
Table 1 - Information on deflection, buckling, and cracking
Distance frompoint of inlet
DeflectionMeasurements
Buckling Cracking
(m) Vert. Horiz.26 - 3.3% - 1.3% short wave buckling many splitting cracks38 - 8% + 2.1% short wave buckling severely cracked at
both springlines53 - 10% + 5% many buckling circumferential &
longitudinal cracks
LABORATORY INVESTIGATION ON THE FIELD RETRIEVED SAMPLES
Seven small pieces removed from the pipe were coded as Samples E1 to E7. Sample E1 contains
an elliptical crack around a buckle. Sample E-3 contains a splitting crack at the corrugation/liner
intersection. The fracture surfaces of these cracks were examined using a scanning electron microscope
(SEM) in order to verify the failure mechanism.
Fracture Morphology
SEM specimens were taken from the crack of Samples E1 and E3 for evaluation. Their fracture
morphologies are very similar. Figure 4 shows the overall appearance of the fracture surface of the crack.
The fracture surfaces exhibit no sign of ductility. The crack was initiated from the inner surface of the
liner, and grew towards the outer surface. Fibrous morphology can be seen on both fracture surfaces, as
revealed in Figure 5, indicating that cracking in this pipe was caused by the slow crack growth
mechanism.
SUMMARY
A Type S-honeycomb HDPE pipe was being used as a cross-drain under 15 m of fill. During the
inspection in June 1997, 3 years after the installation, deflection, buckling and cracking were observed in
the inspected area. The severity of the buckling and cracking increased with the depth of fill.
The microstructure examination of the fracture surface of the crack indicates that slow crack
growth was the cause of cracking. Cracks were initiated from the inner liner surface and grew through the
thickness of the liner. The majority of the cracks occurred around the localized buckling regions.

F-17
Figure 1 – Buckling and cracking along the springline of the pipe
Figure 2 – Splitting cracking along the liner and corrugation

F-18
Figure 3 – Fracture surface of the crack in Sample E1
Figure 4 – A close view on the fracture surface of the crackIn Sample E1, revealing a fibrous morphology
linerthickness
inner liner surface
outer liner surface
crack growthdirection

F-19
SITE F
INTRODUCTION
Site F is located in Region 5 of the States. Related information supplied by the local engineer is
included in the Appendix B under Questionnaire No. 72-12.
The pipe was a high-density polyethylene (HDPE) corrugated pipe with a nominal diameter of
1060 mm with a Type S-helical corrugation. The nominal pipe section length was 6.7 m and the entire
system length was 27 to 33 m. The pipe was installed in 1996 and used as a cross-drain. The pipeline was
located under a maximum height of 2.7 m of fill. The specified fill material was generally a angular
gravel with sand and silt. The pipe was entered from the outlet end and a total of 13 m of pipe was
inspected.
PIPE CONDITION
The storm drain was inspected in June 1997. The inspection discovered that the pipe has
experienced deflection, buckling, and cracking, as shown in Figure 1. The groundwater table was above
the pipe springline and some cracks were leaking. Table 1 summarizes the pipe information regarding
these three behaviors along the inspected section of the pipe.
Table 1 - Information on deflection, buckling, and cracking
Distance frompoint of inlet
DeflectionMeasurements
Buckling Cracking
(m) Vert. Horiz.3 - 5% + 1.8% - circumferential crack , 180
mm long9 - 11% + 10% • liner buckling at each
springline.• whole corrugationbuckled and collapsed
• circumferential cracks atcrown, 450 to 600 mm long.• longitudinal crack
10 - 19% - - -

F-20
LABORATORY INVESTIGATION ON THE FIELD RETRIEVED SAMPLES
Five samples taken from the inner liner of the pipe were coded as Samples F1 to F5. F1 contains a
circumferential crack. Cracking took place at the junction between liner and corrugation. The fracture
surface of the cracks was examined using a scanning electron microscope (SEM) in order to verify the
failure mechanism.
Fracture Morphology
A specimen was taken from Sample F1 of the circumferential crack for evaluation. Figure 2
shows the overall appearance of the fracture surface of the crack. There is no sign of ductility associated
with this crack. The crack was initiated from the outer surface of the pipe, and grew through the thickness
of the liner. A fibrous morphology is revealed on the fracture surface, as can be seen in Figure 3. This
reflects that the crack was caused by a slow crack growth failure mechanism.
SUMMARY
A Type S-helical HDPE pipe was being used as a storm-drain under 2.7 m of fill. During the
inspection in June 1997, 1 year after the installation, deflection, buckling, and cracking were observed
near the outlet of the pipe. Severe buckling was found 9 m from the outlet, leading to both circumferential
and longitudinal cracking.
The microstructure examination of the fracture surface of the crack indicates that slow crack growth
was the cause of cracking. Cracks were initiated from the outer surface of the liner and grew towards the
inner surface.

F-21
Figure 1 – Buckling and cracking in the liner of the pipe

F-22
Figure 2 – Fracture surface of the crack in Sample F1
Figure 3 – A close view on the fracture surface of the crackin Sample F1, revealing a fibrous morphology
linerthickness
outer liner surface
inner liner surface
crack growthdirection

F-23
SITE G
INTRODUCTION
Site G is located in Region 5 of the States. The related information supplied by the local engineer
is included in the Appendix B under Questionnaire No. 101-2.
The pipe used in this site was a high-density polyethylene (HDPE) corrugated pipe with a nominal
diameter of 1220 mm and was a Type S-annular pipe. The nominal pipe section length was 6.7 m and the
entire system length was over 67 m. The pipe was installed in 1996 as a storm water drain for a housing
subdivision. The pipeline was located under a maximum height of 1 m of fill. The fill material was
generally clayey sand. The pipe was entered from the outlet end and a total of 67 m of pipe was inspected.
PIPE CONDITION
The storm drain was inspected in June 1997. Figure 1 shows the condition of the pipe. The
inspection discovered that the pipe exhibited a small deflection and contained one short crack. Table 1
summarizes the pipe information regarding deflection and cracking along the inspected section of the
pipe.
Table 1 - Information on deflection and cracking
Distancefrom point
of inlet
Deflection Measurements Cracking
(m) Vert. Horiz.1.2 - 3.5% + 3.3% circumferential crack 150 mm long3 - 5.7% + 5.3% -
6.7 - 5.4% + 3.4% -
LABORATORY INVESTIGATION ON THE FIELD RETRIEVED SAMPLES
Five samples taken from the pipe were coded as Samples G1 to G5. Sample G5 contains a
circumferential crack. Cracking took place at the junction between liner and corrugation. The fracture
surface of the cracks was examined using a scanning electron microscope (SEM) in order to verify the
failure mechanism.

F-24
Fracture Morphology
Two specimens were taken from Sample G5 of the circumferential crack for evaluation. The
fracture surfaces of both specimens are very similar. Figure 2 shows the overall appearance of the
fracture surface of the crack. There is no sign of ductility associated with this crack. However, the crack
initiation was not identified. The fracture morphology of the crack is found to be a flake structure (Figure
3), indicating that cracking was caused by a rapid crack propagation failure mechanism. The close view
on the flake morphology is depicted in Figure 4.
SUMMARY
A Type S - annular HDPE pipe was being used as a storm drain under 1 m of fill. During the
inspection in June 1997, 1 year after the installation, small amount of deflection was measured, and only
one 150 mm long circumferential crack was observed.
The microstructure examination of the fracture surface of the crack indicates that a rapid crack
propagation was the cause of cracking.

F-25
Figure 1 – A general view in the interior of the pipe at Site G

F-26
Figure 2 – Fracture surface of the crack in Sample G5
Figure 3 – A close view on the fracture surface of the crackin Sample G5, revealing a flake morphology
linerthickness
inner pipe surface
outer pipe surface

F-27
Figure 4 – A close view on the flake morphology on Figure 3

F-28
SITE H
INTRODUCTION
Site H is located in Region 5 of the States. The related information supplied by the local
engineer is included in the Appendix B under Questionnaire No. 101-3.
The pipe was a high-density polyethylene (HDPE) corrugated pipe with a nominal diameter of
760 mm and was a Type S-helical pipe. The nominal pipe section length was 6.7 m and the entire system
length was 21.7 m. The pipe was installed in 1993 and used as a cross drain. The pipeline was located
under a maximum height of 2.3 m of fill. The fill material was generally a mixture of sand and gravel.
The pipe was entered from the outlet end.
PIPE CONDITION
The storm drain was inspected in June 1997. Only the section in proximity to the outlet of pipe
was investigated. The inspection discovered that the pipe has experienced some deflection and cracking
within the last several feet of the drain near its outlet. Also, the pipe is on a skewed alignment with a
varying slope downgrade. The slope of the pipe was found to be 4% from the outlet to 1.3 m into the
pipe, but then changed to 2% thereafter. The change in slope induced a longitudinal bending in this
section of the pipe. The measurement and description of the cracks and deflections of the pipe are
presented below and summarized in Table 1:
Table 1 - Information on the deflection and cracks
Distance frompoint of outlet
Deflection measurements Cracks
(m) vertical horizontal1.3 -2% + 6.7% circumferential,
from 3 o’clock to 11 o’clock1 - - circumferential, 3.75 in. long
start at 5 o’clock1.1 - - partial crack at 5 o’clock on inside of the liner. (crack
does not fully penetrate the liner thickness)

F-28
LABORATORY INVESTIGATION ON THE FIELD RETRIEVED SAMPLES
Three samples removed from this pipe were coded as Samples H1, H2 and H3. Samples H1 and
H2 were taken at locations adjacent to two circumferential cracks, can be seen in Figures 1 and 2,
respectively. The fracture surface of the cracks was examined using a scanning electron microscope
(SEM) in order to verify the failure mechanism.
Fracture Morphology
A SEM specimen was taken from the crack of Samples H1 and H2. Their fracture behavior were
found to be very similar. Figure 3 shows the overall appearance of the fracture surface of the crack.
There is no sign of ductility associated with this crack, as indicated by the constant thickness along the
fracture surface. There are many rows of thin film structure across the thickness of the liner. This thin
film structure suggests that the crack resulted by the joining of many small failure planes together,
instead of a single failure plane. Each of the failure planes was generated by a micro-crack that
propagated through the thickness of the liner; simultaneously, the micro-crack grew sideways. When the
two adjacent failure planes met, a thin film structure formed.
The subsurface structure on the fracture surface is depicted in Figure 4, revealing a fibrous
morphology. This structure signifies a slow crack growth failure.
SUMMARY
A Type S-helical HDPE pipe was being used as a storm-drain under 2.3 m of fill beneath a
roadway. During the inspection in June 1997, 4 years after the its installation, three circumferential
cracks were observed in the inspected area near the outlet of the pipe. A 3.6% vertical deflection and
4.9% horizontal deflection were measured at the location where the longest circumferential crack was
situated. Additionally, longitudinal bending of the pipe has occurred in the same region as the cracking
due to a change in the slope from - 2% to - 4%.
The microstructure examination of the fracture surface of the crack verifies that a slow crack
growth was the cause of cracking. The tensile stress that initiated the crack might be due to deflection
and bending of the pipe.

F-30
Figure 1 – Small circumferential crack in Sample H1
Figure 2 – Long circumferential crack in Sample H2

F-31
Figure 3 – Fracture surface of the crack in Sample H1
Figure 4 – A close view on the fracture surface of the crackin Sample H1, revealing a fibrous morphology
linerthickness
inner liner surface
outer liner surface
crack growthdirection

F-32
SITE I
INTRODUCTION
Site I is located in Region 5 of the States. Related information supplied by the local engineer is
included in the Appendix B under Questionnaire No. 101-4.
The pipe was a high-density polyethylene (HDPE) corrugated pipe with a nominal diameter of
600 mm and was a Type S-annular pipe. The nominal pipe section length was 6.7 m and the entire system
length was 12 m. The pipe was installed in 1996 as a cross drain. The pipeline was located under a fill
height of 1.3 to 3 m. The fill material was generally a mixture of flyash, sand, and water. The pipe was
entered from the inlet end and a total of 12 m of pipe was inspected.
PIPE CONDITION
The storm drain was inspected in June of 1997. Figure 1 shows the condition of the pipe. The
inspection discovered that the pipe exhibited some amount of deflection, longitudinal bending, ductile
tearing, and circumferential cracking. Table 1 summarizes the pipe information regarding the behavior of
the pipe along the inspected section.
Table 1 - Information on the pipe
Distance frompoint of inlet
DeflectionMeasurements
LongitudinalBending
Cracking
(m) Vert. Horiz.1.6 - - - circumferential crack at crown,
500 mm long1.9 - 4.2% + 4.2% - circumferential cracks at
crown, 600 mm long.8.7 - - yes • ductile tearing at crown, 1200
mm long• separation of corrugations at twolocations.
LABORATORY INVESTIGATION ON THE FIELD RETRIEVED SAMPLES
Two long strip samples removed from the crown of the pipe together with a large piece removed
from the inlet were coded as Sample I1 to I3. Samples I1 and I2 contain the fracture surface of the

F-33
circumferenital cracks. The crack formed at the junction between liner and corrugation of the pipe. The
fracture surface of the cracks was examined using a scanning electron microscope (SEM) in order to
verify the failure mechanism. The results of the evaluation are presented in this section.
Fracture Morphology
A SEM specimen was taken from each of the cracks in Samples I1 and I2. Figure 2 shows the
fracture surface of Sample I1. The microstructure indicates a more ductile type of failure. However, the
stress was not high enough to induce a yielding on the liner, since the liner thickness exhibited no
reduction. Contrary, the fracture surface of the crack in Sample I2 is very different, as can be seen in
Figure 3. The morphology consists of both flake and fibrous structures. Near the outer surface of the
liner, where the crack was initiated, a small region of flake structure was observed. After that the crack
growth rate slowed down and changed to slow crack growth as indicated by the fibrous structure (Figure
4). At the end of the crack (near the inner surface of the liner), the stress became much higher and a more
ductile failure morphology can be seen.
SUMMARY
A Type S - annular HDPE pipe was being used as a cross drain under 1 to 3 m of fill. During the
inspection in June 1997, 1 year after the installation, some deflection, longitudinal bending and
circumferential cracking were observed in the inspected area near the inlet of the pipe. Significant
longitudinal bending leads to tearing in some of the corrugations.
The microstructure examination of the fracture surface of the crack indicates a mixture failure
modes, including ductile failure, slow crack growth and rapid crack propagation. Cracks were initiated
from the outer surface of the liner at the junction between liner and corrugation.

F-34
Figure 1 – A general view on the interior of the pipe at Site I
Figure 2 – Fracture surface of the crack in Sample I1
outer liner surface
inner liner surface
liner thickness

F-35
Figure 3 – Fracture surface of the crack in Sample I2
Figure 4 – A close view on the fracture surface of the crackin Sample I2, revealing a fibrous morphology
linerthickness
inner liner surface
outer liner surface
crack growthdirection

F-36
SITE J
INTRODUCTION
Site J is located in Region 1 of the States. Related information supplied by the local engineer is
included in Appendix B under Questionnaire No. 93.
The pipe was a high-density polyethylene (HDPE) corrugated pipe. Type S-annular and helical
pipes with four different diameters 300 mm, 600 mm, 700 mm and 900 mm were installed at the site. The
nominal pipe section length was 6.7 m and the entire system consisted of over 85 m of pipes. The pipe
was installed in 1990 and was used as a culvert. The pipeline was located under fill height from 0.15 to
0.9 m. The backfill material was a clayey soil.
PIPE CONDITION
When the visit was made, pipes were already removed from the ground, as shown in Figure 1.
Thus, the pipe condition during the service was not directly observed by the research team; however,
reports from prior inspections provided information on the performance of this pipe system. Table 1
shows the related pipe information.
Table 1 - Information on the behavior of the pipe
Pipe Diameterand Profile
DeflectionMeasurements
Buckling Cracking
(mm) Vert. Horiz.600
(helical)- 25% - - many circumferential crack.
300(annular)
- 3.3 % - - circumferential andlongitudinal cracks
900(helical)
- 11% - yes many circumferential crack.
LABORATORY INVESTIGATION ON THE FIELD RETRIEVED SAMPLES
Three samples taken from three pipes with different diameters, 600 mm, 300 mm, and 900 mm
were coded as Samples J1, J2, and J3, respectively. Samples J1 and J3 contain only circumferential
cracks, whereas Sample J2 contains both circumferential and longitudinal cracks. All circumferential

F-37
cracks took place at the junction between liner and corrugation. The longitudinal crack propagated
through the liner and corrugation of the pipe (Figure 2). The fracture surface of the cracks was examined
using a scanning electron microscope (SEM) in order to verify the failure mechanism.
Fracture Morphology
A specimen was taken from each crack in Samples J1, J2, and J3. The fracture morphology of
circumferential cracks in all three samples are very similar; thus, only those taken from Sample J2 are
presented. Figure 3 shows the general view of the fracture surface. Multiple micro-cracks are clearly
revealed with rows of thin film between them. The crack was initiated from the outer surface of the liner
and grew through the thickness toward the inner surface. A fibrous morphology covers the entire surface
(Figure 4), indicating a slow crack growth failure. Regarding the longitudinal crack in Sample J2, Figure
5 shows its fracture surface. The crack seems to start from the center towards edges of the liner. The
fracture surface, however, does not reveal a well defined fibrous morphology, as depicted in Figure 6. The
size of the few fibrils is very small.
SUMMARY
Four different diameter HDPE pipes with both Type S-annular and helical profile were being used
as a culvert under 0.15 to 1.9 m of fill. Deflection, buckling, and cracking were observed in these pipes
prior to their removal. The inspection, in June 1997, was made after removal.
The microstructure examination of the fracture surface of the crack indicates that slow crack growth
was the cause of circumferential cracking. Cracks were initiated from outer surface of the liner and grew
towards the inner surface. The failure mechanism of the longitudinal crack in Sample J2 is not well
defined, but has more of the morphology of the slow crack growth mechanism than rapid crack
propagation.

F-38
Figure 1 – The already removed pipes at Site J
Figure 2 – A longitudinal crack along mold line in Sample J2
F-39
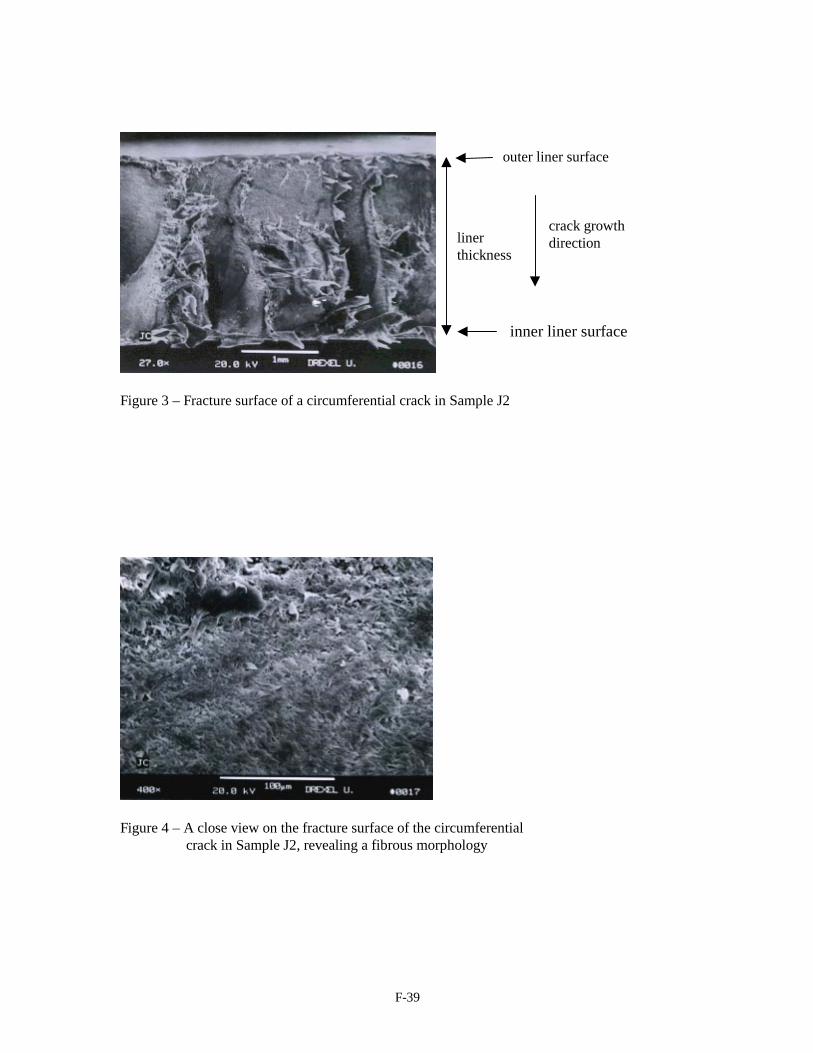
Figure 3 – Fracture surface of a circumferential crack in Sample J2
Figure 4 – A close view on the fracture surface of the circumferentialcrack in Sample J2, revealing a fibrous morphology
linerthickness
outer liner surface
inner liner surface
crack growthdirection

F-40
Figure 5 – Fracture surface of a longitudinal crack in Sample J2
Figure 6 – A close view on the fracture surface of the longitudinalcrack in Sample J2, revealing a fibrous morphology
linerthickness
outer liner surface
inner liner surface

F-41
SITE K
INTRODUCTION
Site K is located in Region 1 of the States. Related information supplied by the local engineer is
included in Appendix B under Questionnaire No. 27.
The pipe was a high-density polyethylene (HDPE) corrugated pipe with a nominal diameter of
900 mm and was a Type S-helical pipe. The nominal pipe section length was 6.7 m and the entire system
length was 21 m. The pipe was installed in about 1991 as a culvert. The pipeline was located under a
maximum height of 3 m of fill. The specified fill material was generally a sandy soil. The pipe was
entered from the outlet end and the entire length was inspected.
PIPE CONDITION
The culvert was inspected in June 1997. The inspection discovered that the pipe has experienced
deflection, buckling, and cracking, as shown in Figures 1 and 2. Table 1 summarizes the pipe information
regarding these three behaviors along the inspected section of the pipe.
Table 1 - Information on deflection, buckling, and cracking
Distance frompoint of inlet
DeflectionMeasurements
Buckling Cracking
(m) Vert. Horiz.2.7 to 5.3 - - - • many circumferential cracks.
• slight buckling4.3 - 11.1% + 2.5 % slightly -5.3 - 14% + 8.3 % slightly -6.7 - 16.7% + 13.9 % slightly -
16 to 18 - - slightly three circumferential cracks19 - - buckling/bulging
in liner-
LABORATORY INVESTIGATION ON THE FIELD RETRIEVED SAMPLES
Nine samples taken from two parts of the pipe were coded as Samples K1A to K1G, and K2A to
K2B. The K1 series was taken near the outlet of the pipe and K2 samples were taken near the inlet. Four
K1 samples, Samples K1B to K1E, contain a crack surface. Both K2 samples contain a circumferential

F-42
crack. Cracking took place at the junction between liner and corrugation. The fracture surface of the
cracks was examined using a scanning electron microscope (SEM) to verify the failure mechanism.
Fracture Morphology
A SEM specimen was taken from Samples K1E series and K2A samples for evaluation. Figure 3
shows the overall appearance of the fracture surface of the crack in Sample K1E. There is no sign of
ductility associated with this crack. The crack was initiated from the outer surface of the liner, and grew
through the thickness of the liner. A small fibrous morphology is revealed on the fracture surface of this
crack, as can be seen in Figure 4. Similar fracture surface and morphology are also observed on the crack
in Sample K2A (Figures 5 and 6). Figure 5 reveals the multiple rows of thin films, indicating that many
micro-cracks were initiated simultaneously.
SUMMARY
A Type S-helical HDPE pipe was being used as a storm drain under 3 m of fill. During the
inspection in June 1997, 6 year after the installation, deflection, buckling, and cracking were observed in
the pipe.
The microstructure examination of the fracture surface of the crack indicates that a slow crack
growth was the cause of cracking. Cracks were initiated from the outer surface of the liner and grew
towards the inner surface at the junction between liner and corrugation.

F-43
Figure 1 – a general view in the interior of the pipe at Site K
Figure 2 – Buckling on the liner of the pipe

F-44
Figure 3 – Fracture surface of the crack in Sample K1
Figure 4 – A close view on the fracture surface of the crackin Sample K1, revealing a fibrous morphology
linerthickness
inner liner surface
outer liner surface
crack growthdirection
F-45
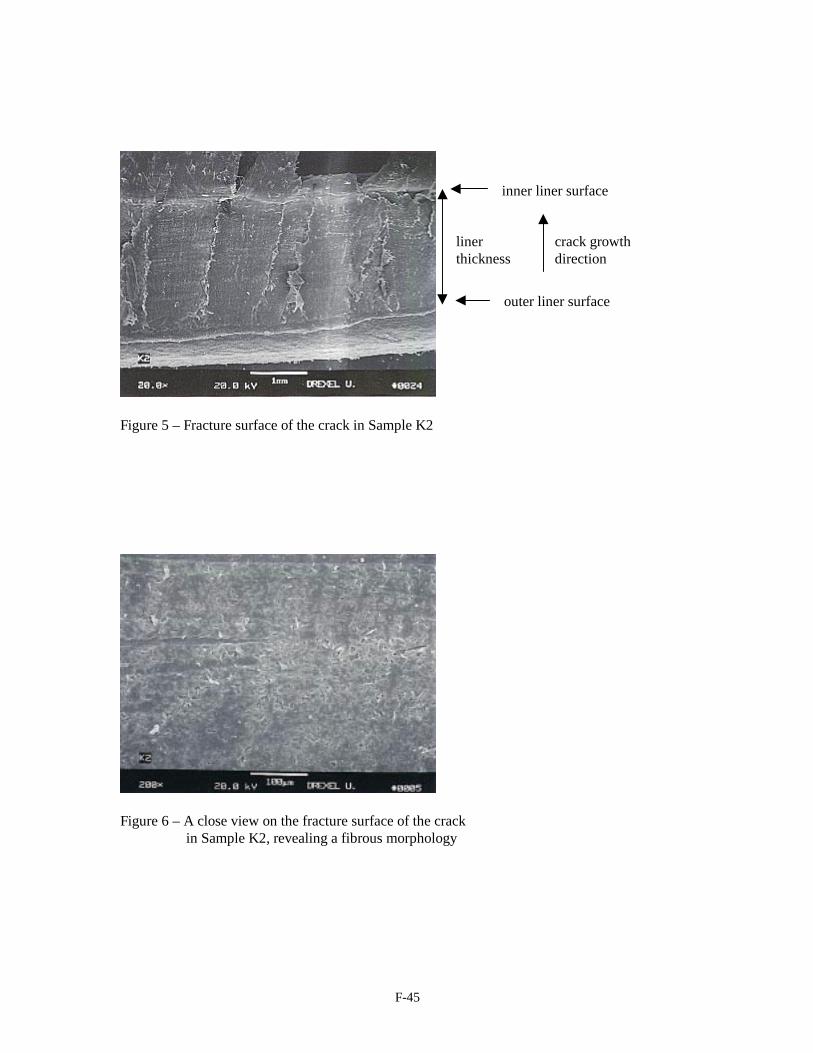
Figure 5 – Fracture surface of the crack in Sample K2
Figure 6 – A close view on the fracture surface of the crackin Sample K2, revealing a fibrous morphology
linerthickness
inner liner surface
outer liner surface
crack growthdirection

F-46
SITE L
INTRODUCTION
Site L is located in Canada. Related information supplied by the local engineer is included in the
Appendix B under Questionnaire No. 102-1.
The pipe was a high-density polyethylene (HDPE) corrugated pipe with a nominal diameter of
900 mm and was a type C-helical pipe. The nominal pipe section length was 6.7 m and the entire system
length was 60 m. The pipe was installed in 1989 and used as a cross drain, as shown in Figure 1. The
pipeline was located under a maximum height of 9 m of fill.
PIPE CONDITION
The storm drain was inspected in October 1997. Due to high water level, the field engineer was
unable to perform close-up investigation of the interior. However, visual observation was carried out from
both inlet and outlet of the pipe. Figure 2 shows the interior appearance of the pipe from the outlet.
Deflection was observed in two regions near both ends of the pipe. The vertical deflection was estimated
to be approximately 17%.
Additional information regarding the pipe was provided by the local pipe manufacturer. They
indicated that cracking was not found in this pipe.
SUMMARY
A Type C-helical HDPE pipe was being used as a cross drain. During the inspection in October
1997, 8 years after the installation, some deflection of the pipe was observed.

F-47
Figure 1 – A general view on the pipe at Site L
Figure 2 – An interior view of the pipe from outlet end
F-48
SITE N
INTRODUCTION
Site N is located in Canada. Related information supplied by the local engineer is included in the
Appendix B under Questionnaire No. 102-3.
The pipe was a high-density polyethylene (HDPE) corrugated pipe with a nominal diameter of
450 mm and is a type C-helical pipe. The nominal pipe section length was 6.7 m and the entire system
length was 12 m. The pipe was installed in 1985 as a cross drain, as shown in Figure 1. The pipeline was
located under a maximum height of 0.15 m of fill.
PIPE CONDITION
The cross drain was inspected in October 1997. Due to the small diameter of the pipe, the
engineer was unable to enter for close-up investigation. However, visual observation was carried out from
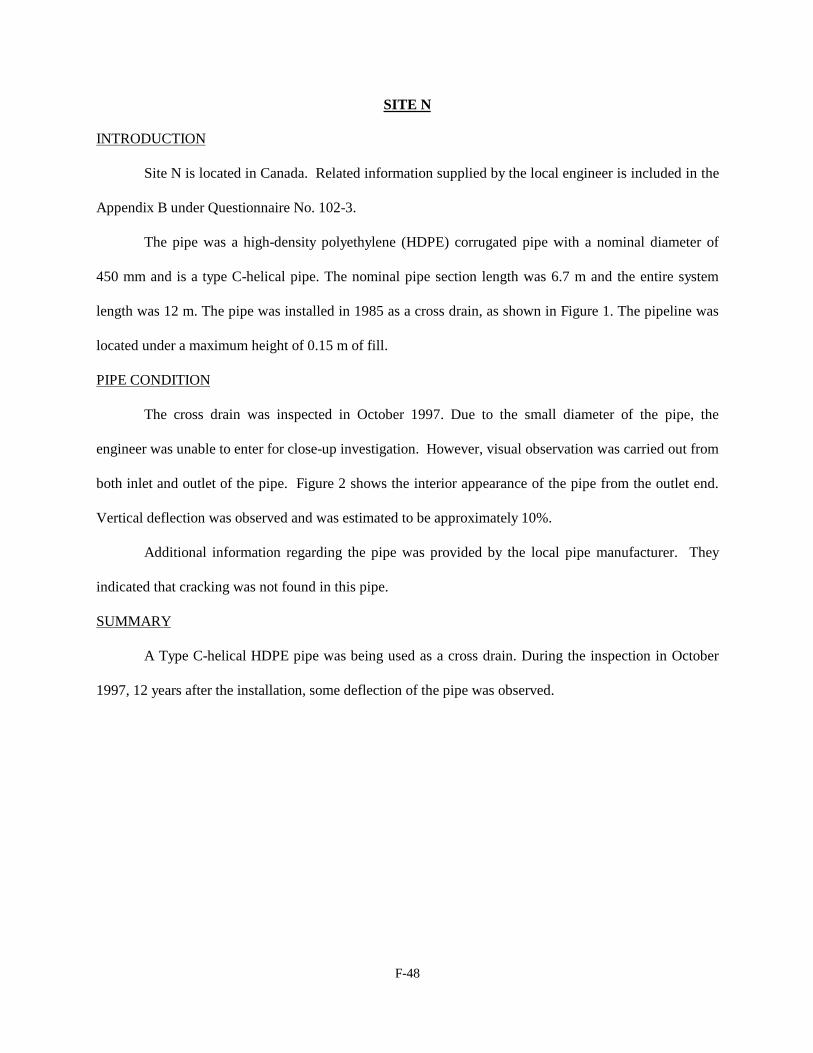
both inlet and outlet of the pipe. Figure 2 shows the interior appearance of the pipe from the outlet end.
Vertical deflection was observed and was estimated to be approximately 10%.
Additional information regarding the pipe was provided by the local pipe manufacturer. They
indicated that cracking was not found in this pipe.
SUMMARY
A Type C-helical HDPE pipe was being used as a cross drain. During the inspection in October
1997, 12 years after the installation, some deflection of the pipe was observed.

F-49
Figure 1 – A general view on the pipe at Site N
Figure 2 – An interior view of the pipe from the outlet end

F-50
SITE O
INTRODUCTION
Site O is located in Region 3 of the States. Related information supplied by the local engineer is
included in the Appendix B under Questionnaire No. 15.
The pipe used in this site was a high-density polyethylene (HDPE) corrugated pipe with a
diameter of 600 mm. Both Type C-helical and Type S-helical pipes were used. The nominal pipe section
length was 6.7 m and the entire system consisted of over 200 m of pipes. The pipe was installed in 1987
as a cross drain of a research project. The pipeline was located under fill height from 30 m. The backfill
material was a crushed limestone.
PIPE CONDITION
The cross drain was inspected in September 1997. The inspection showed that the pipe has
experienced deflection, buckling, and cracking. Vertical deflections are on the order of 4% and no
measurable horizontal deflections. Circumferential shortening was measured at about 2%. Figures 1
shows the local buckling in the Type S-helical pipe, which increases in severity with depth of fill. Figure
2 shows one of a large number of circumferential cracks that were commonly observed near joints of pipes
under depths of fill greater than 21 m. These cracks occurred only in the Type C-helical pipes. The
length of the cracks ranges from 13 mm to 600 mm. A sample of the Type C pipe was removed from the
outlet and curled severely overnight, indicating a significant residual stress present in the pipe.
LABORATORY INVESTIGATION ON THE FIELD RETRIEVED SAMPLES
Five small samples were taken from various circumferentially cracked regions of the pipe for
microstructure evaluation. In addition, a large piece of Type C-helical pipe was removed for material
evaluation. The fracture surface of the cracks was examined using a scanning electron microscope (SEM)
in order to verify the failure mechanism.
Fracture Morphology

F-51
A SEM specimen was taken from three circumferential cracks. Specimens #1 and #2 were cut
from the Type C-helical pipe. Specimen #3 was cut from the different region of the Type C-helical pipe.
Figure 3 shows the general view of the fracture surface of Specimen #1. The crack propagated from the
center towards the edges of the pipe. A fibrous morphology covers the entire surface (Figure 4), indicating
a slow crack growth failure. Similar fracture morphology is observed in Specimens #2 and #3, as can be
seen in Figures 5 and 6, respectively. The crack in Specimen #2 was initiated from one point at the inside
surface of the pipe (Figure 5).
SUMMARY
A 600 mm diameter of Type C - helical and Type S-helical HDPE pipes were being used as a
cross drain under 30 m of fill. During the inspection in September 1997, 10 years after installation,
deflection, buckling, and cracking were observed along the pipe.
The microstructure examination of fracture surfaces of circumferential cracks indicates that slow crack
growth was the failure mechanism.

F-52
Figure 1 – Buckling on the liner of the pipe at Site O
Figure 2 – Circumferential cracking in the TypeC-helical section of the pipe system

F-53
Figure 3 – Fracture surface of the crack in Specimens #1
Figure 4 – A close view on the fracture surface of the crackin Specimen #1, revealing a fibrous morphology
pipe wallthickness
outer pipe surface
inner pipe surface


F-55
SITE P
INTRODUCTION
Site P is located in Region 4 of the States. Related information supplied by the local engineer is
included in the Appendix B under Questionnaire No. 30.
The pipe was a high-density polyethylene (HDPE) corrugated pipe with a nominal diameter of
760 mm and was a Type S-annular pipe. The nominal pipe section length was 6.7 m and the entire system
length was 39 m. The pipe was installed in 1994 as a cross drain. The pipeline was located under a
maximum height of 1.3 m of fill. The specified fill material was generally a sandy soil. The pipe was
entered from the outlet end and a total of 13 m of pipe was inspected.
PIPE CONDITION
The storm drain was inspected in December 1997. The inspection showed that the pipe has
experienced some deflections and cracking. The interior of the pipe can be seen in Figure 1. Table 1
summarizes the pipe information regarding deflection and cracking along the inspected section of the
pipe.
Table 1 - Information on deflection and cracking
Distance frompoint of inlet
DeflectionMeasurements
Cracking
(m) Vert. Horiz.6.2 - 1.5% + 1.7% -26.7 - 5% + 5% -33.3 - 1.7% + 1.7% 5 circumferential cracks with
length from 127 mm to 500mm at invert
LABORATORY INVESTIGATION ON THE FIELD RETRIEVED SAMPLES
Five samples taken from the inner liner at invert of the pipe were coded as Samples P1 to P5. All
five samples contain a crack surface. Cracking took place at the junction between liner and corrugation.
The fracture surface of the cracks was examined using a scanning electron microscope (SEM) in order to
verify the failure mechanism.

F-56
Fracture Morphology
A SEM specimen was taken from Samples P1 and P2 for evaluation. Their fracture
microstructure are very similar. Figure 2 shows the overall appearance of the fracture surface of the crack
taken from Sample P1. The crack was initiated from the outer surface of the liner and grew through the
thickness of the liner. A fibrous morphology is revealed on the fracture surface of this crack, as can be
seen in Figure 3. This signifies that the crack was caused by a slow crack growth failure mechanism.
SUMMARY
A Type S-annular HDPE pipe was being used as a storm-drain under 1.3 m of fill. During the
inspection in December 1997, 3 year after the installation, small deflection and cracking were observed in
the pipe.
The microstructure examination of the fracture surface of the crack indicates that a slow crack
growth was the cause of cracking. Cracks were initiated from the outer surface of the liner and grew
towards the inner surface.

F-57
Figure 1 – An interior view on the pipe at Site P

F-58
Figure 2 – Fracture surface of the crack in Sample P1
Figure 3 – A Close view on the fracture surface of the crackin Sample P1, revealing a fibrous morphology
linerthickness
outer liner surface
inner liner surface
crack growthdirection

F-59
SITE R
INTRODUCTION
Site R is located in Region 4 of the States. Related information supplied by the local engineer is
included in the Appendix B under Questionnaire No. 43-5.
The pipe was a high-density polyethylene (HDPE) corrugated pipe with a nominal diameter of
900 mm and was a type S-helical pipe. The nominal pipe section length was 6.7 m and the entire system
length was 20 m. The pipe was installed in 1995 as a cross drain, although the water level in the adjacent
ponds was 1.3 to 1.7 m below the invert of the pipe. The pipeline was located under a maximum height of
0.5 m of fill. The specified fill material was a gravely soil. The pipe was entered from the north end and a
total of 4 m of pipe was inspected.
PIPE CONDITION
The storm drain was inspected in December 1997. The inspection showed that the pipe has
experienced large deflection and cracking. The interior of the pipe can be seen in Figure 1. Table 1
summarizes the pipe information regarding deflection and cracking along the inspected section of the
pipe.
Table 1 - Information on deflection and cracking
Distance frompoint of inlet
DeflectionMeasurements
Cracking
(m) Vert. Horiz.1.3 - 8.3% + 8.3% -2 - 11% + 9.7% circumferential crack , 280
mm long at invert.2.6 - 10.4% + 9% circumferential crack, 940
mm long at invert3.6 - 16.7% + 13.9% circumferential crack, 890
mm long at invert

F-60
LABORATORY INVESTIGATION ON THE FIELD RETRIEVED SAMPLES
Four samples taken from the inner liner at invert of the pipe were coded as Samples R1 to R4. All
four samples contain crack surface. Cracking took place at the junction between liner and corrugation.
The fracture surface of the cracks was examined using a scanning electron microscope (SEM) in order to
verify the failure mechanism.
Fracture Morphology
A SEM specimen was taken from Samples P1 and P2 for evaluation. Their fracture
microstructure are very similar. Figure 2 shows the overall appearance of the fracture surface of the crack
taken from Sample R1. The crack was initiated from the outer surface of the liner and grew through the
thickness of the liner. A fibrous morphology is revealed on the fracture surface of this crack, as can be
seen in Figure 3. This signifies that the crack was caused by a slow crack growth failure mechanism.
SUMMARY
A Type S-helical HDPE pipe was being used as a storm drain under 0.5 m of fill. During the
inspection in December 1997, 2 year after the installation, deflection and cracking were observed in the
pipe.
The microstructure examination of the fracture surface of the crack indicates that a slow crack
growth was the cause of cracking. Cracks were initiated from the outer surface of the liner and grew
towards the inner surface.

F-61
Figure 1 – An interior view of the pipe at Site R

F-62
Figure 2 – Fracture surface of the crack in Sample R1
Figure 3 – A close view on the fracture surface of the crackin Sample R1, revealing a fibrous morphology
linerthickness
inner liner surface
outer liner surface
crack growthdirection

F-63
SITE U
INTRODUCTION
Site U is located in Region 4 of the States. Related information supplied by the local engineer is
included in the Appendix B under Questionnaire No. 43-6.
The pipe was a high-density polyethylene (HDPE) corrugated pipe with a nominal diameter of
1070 mm and was a Type S-honeycomb pipe. The nominal pipe section length was 6.7 m and the entire
system length was in excess of 67 m. The pipe was installed in 1996 as storm water runoff drainage. The
pipeline was located under a maximum height of 1.3 m of fill. The specified fill material was a mixture
of clay, sand and gravel. The pipe was entered from a catch basin and about 38 m of the pipe was
inspected.
PIPE CONDITION
The storm drain was inspected in December 1997. The inspection discovered that the pipe has
experienced large deflection, buckling, and cracking. The interior of the pipe can be seen in Figure 1.
Cracking was observed at the springline where the buckling took place. In addition, longitudinal
cracking was found at both invert and crown of the pipe. Table 1 summarizes the pipe information
regarding deflection, buckling, and cracking along the inspected section of the pipe.
Table 1 - Information on deflection, buckling, and cracking
Distance frompoint of inlet
DeflectionMeasurements
Buckling Cracking
(m) Vert. Horiz.6.3 - 14.2% + 7.1% liner buckling at
springlineboth circumferential andlongitudinal cracks at invert
12.8 - 15.5% + 8.3% liner buckling atspringline.
longitudinal cracks at invert andcrown
25.5 - 14.3% + 8.3% - longitudinal cracks at crown31.9 - 20.2% + 9.5% - -38.3 - 17.8% + 7.1% - • longitudinal cracks at crown.
• joints has longitudinal cracks atcrown and invert.

F-64
LABORATORY INVESTIGATION ON THE FIELD RETRIEVED SAMPLES
Six samples taken from the various locations of the pipe were coded as Samples U1 to U6. All
six samples contain crack surfaces. Circumferential cracking took place at the junction between liner and
corrugation. Longitudinal cracking propagated through the liner and corrugation, as shown in Figure 2.
The fracture surface of the cracks was examined using a scanning electron microscope (SEM) in order to
verify the failure mechanism.
Fracture Morphology
A SEM specimen was taken from Samples U2 and U4 which consisted of longitudinal cracks.
Their fracture microstructure are very similar. Figure 3 shows the overall appearance of the fracture
surface of the crack taken from Sample U2. The crack propagated along the center towards edges of the
liner. The initiation of the crack was unable to be identified. A fibrous morphology is revealed on the
fracture surface of this crack, as can be seen in Figure 4. This signifies that the crack was caused by a
slow crack growth failure mechanism.
SUMMARY
A Type S-honeycomb HDPE pipe was being used as a storm drain under 1.3 m of fill. During the
inspection in December 1997, 2 year after the installation, large deflection, buckling, and circumferential
and longitudinal cracking were observed in the pipe.
The microstructure examination of the fracture surface of the crack indicates that a slow crack growth
was the cause of cracking. The initiation of these cracks was not able to identify, however, the crack
propagated along the center towards edges of the liner.

F-65
Figure 1 – An interior view of the pipe at Site U, showing cracking on the liner
Figure 2 – A longitudinal crack in the pipe

F-66
Figure 3 – Fracture surface of the crack in Sample U2
Figure 4 – A close view on the fracture surface of the crackin Sample U2, revealing a fibrous morphology
linerthickness
outer liner surface
inner liner surface

F-67
SITE V
INTRODUCTION
Site V is located in Region 10 of the States. Related information supplied by the local engineer is
included in the Appendix B under Questionnaire No. 103-1.
The pipe was a high-density polyethylene (HDPE) corrugated pipe with a nominal diameter of
760 mm and was a Type S-helical pipe. The nominal pipe section length was 6.7 m and the entire system
length was over 20 m. The pipe was installed in 1994 as a cross drain. The pipeline is located under a
maximum height of 1 m of fill. The fill material was generally a sand-gravel mixture. The pipe was
entered from the outlet end and a total of 6.7 m of pipe was inspected.
PIPE CONDITION
The cross drain was inspected in February 1998. Figure 1 shows the outlet section of the pipe.
The inspection showed that the pipe exhibited circumferential cracks without deflection. Table 1
summarizes the pipe information regarding the cracking along the inspected section of the pipe.
Table 1 - Information on cracking
Distancefrom point
of inlet
Deflection Measurements Cracking
(m) Vert. Horiz.1.4 - 0% + 0% circumferential cracks range from 25
mm to 180 mm long
LABORATORY INVESTIGATION ON THE FIELD RETRIEVED SAMPLES
One small sample was taken from the circumferential cracking region of the pipe. Another large
sample was taken from the end of the pipe for material evaluation. The samples were coded as Samples
V1 and V2. Sample V1 contains a circumferential crack. Cracking took place at the junction between
liner and corrugation. The fracture surface of the cracks was examined using a scanning electron
microscope (SEM) in order to verify the failure mechanism.

F-68
Fracture Morphology
Two SEM specimens were taken from Sample V1 of the circumferential crack for evaluation.
The fracture surfaces of both specimens are very similar. Figure 2 shows the overall appearance of the
fracture surface of the crack. The crack initiation was initiated from the outer liner surface, since a small
amount of ductile pullout can be seen on the inner liner surface. The fracture morphology of the crack
was found to be a flake structure (Figure 3), indicating that cracking was caused by a rapid crack
propagation failure mechanism.
SUMMARY
A Type S-helical HDPE pipe was being used as a storm-drain under 1 m of fill. During the
inspection in February 1998, 3 year after the installation, only circumferential cracks were observed.
There was no measurable deflection in the pipe.
The microstructure examination of the fracture surface of the crack indicates that a rapid crack
propagation was the cause of cracking.

F-69
Figure 1 – A view on the outlet section of the pipe at Site V

F-70
Figure 2 – Fracture surface of the crack in Sample V1
Figure 3 – A close view on the fracture surface of the crackin Sample V2, revealing a flake morphology
linerthickness
inner liner surface
outer liner surface
crack growthdirection

F-71
SITE W
INTRODUCTION
Site W is located in Region 10 of the States. Related information supplied by the local engineer is
included in the Appendix B under Questionnaire No. 103-2.
The pipe was a high-density polyethylene (HDPE) corrugated pipe with a nominal diameter of
1220 mm and was a type S-honeycomb pipe. The nominal pipe sectional length were 3 m and 6.7 m. The
entire system length was 20 m. The pipe was installed in 1995 and was used to channel a mountain runoff
stream under a logging road. The pipeline was located under a maximum height of 1.3 m of fill. The fill
material was coarse angular gravel. The pipe was entered from the inlet end and the entire pipe was
inspected.
PIPE CONDITION
The drainage pipe was inspected in February 1998. Figure 1 shows the condition of the pipe. The
inspection discovered that the pipe exhibited some deflection, buckling and cracking. Table 1
summarizes the pipe information regarding these three behaviors along the inspected section of the pipe.
Table 1 - Information on deflection, buckling, and cracking
Distance frompoint of inlet
DeflectionMeasurements
Buckling Cracking
(m) Vert. Horiz.3.25 - 6.25% + 1% - 990 mm longitudinal crack.
the crack changed tocircumferential cracking at 450mm.
9.8 - 8.9% + 3.1% - -12.8 - 10.4% + 2% severe wall buckling
(high frequency)-
LABORATORY INVESTIGATION ON THE FIELD RETRIEVED SAMPLES
Two small samples were taken from the crack. Two other samples were taken from the uncracked
section of the pipe for material evaluation. The two small samples were coded as Samples W1 and W2.
Sample W1 contains a circumferential crack, whereas Sample W2 contains a longitudinal crack. The

F-72
fracture surface of the cracks was examined using a scanning electron microscope (SEM) in order to
verify the failure mechanism.
Fracture Morphology
SEM specimens were taken from each of the two samples, Samples W1 and W2. The fracture
surfaces of both specimens are very similar. Figure 2 shows the overall appearing of the fracture surface
of the crack. The crack initiation was initiated from the outer liner surface, since a small amount of ductile
pull-out was observed in the inner liner surface. The fracture morphology of the crack was found to be a
combination of flake and fibrous structure (Figure 3), but more dominated by the flake microstructure.
This indicating that cracking was caused by a rapid crack propagation failure mechanism.
SUMMARY
A Type S-honeycomb HDPE pipe was being used as a storm drain under 1.3 m of fill. During the
inspection in February 1998, 1 year after the installation, small deflection, severe buckling, and cracking
were observed.
The microstructure examination of the fracture surface of the crack indicates that a rapid crack
propagation was the cause of cracking.

F-73
Figure 1 – An interior view of the pipe at Site W

F-74
Figure 2 – Fracture surface of the crack in Sample W1
Figure 3 – A close view on the fracture surface of the crackin Sample W1, revealing a flake/fibrous morphology
linerthickness
outer liner surface
inner liner surface
crack growthdirection

G-1
APPENDIX G
P-NCTL TEST RESULTS OF NINETEEN
RETRIEVED FIELD PIPE SAMPLES

Table G-1 - Test Data Obtained from Pipe at Site A
Yield Stress Failure Time Average Std. Div. ofof the Specimen Failure Time Failure Time
of the Plaque of the PlaqueMPa (psi) (hr.) (hr.) (hr.)
Pipe Pieces; yield stress = 44.1 MPa (6400psi)20% 0.3
0.28.8 (1280) 0.2 0.2 0.0
0.20.2
15% 0.60.7
6.6 (960) 0.7 0.7 0.10.60.7
10% 1.91.6
4.4 (640) 1.9 1.8 0.11.81.7
6% 10.27.2
2.6 (380) 9.3 8.6 1.27.88.3
G-2

Table G-2 - Test Data Obtained from Pipe at Site B
Yield Stress Failure Time Average Std. Div. ofof the Specimen Failure Time Failure Time
of the Plaque of the PlaqueMPa (psi) (hr.) (hr.) (hr.)
Pipe Pieces; yield stress = 26.5 MPa (3840 psi)25% 0.9
1.16.6 (960) 1.0 1.0 0.1
0.91.2
20% 2.12.1
5.3 (768) 1.9 2.0 0.12.11.9
15% 5.14.8
4.0 (576) 3.3 4.7 0.84.95.3
10% 63.130.6
2.6 (380) 47.8 50.0 14.942.166.5
G-3

Table G-3 - Test Data Obtained from Pipe at Site D
Yield Stress Failure Time Average Std. Div. ofof the Specimen Failure Time Failure Time
of the Plaque of the PlaqueMPa (psi) (hr.) (hr.) (hr.)
Pipe Pieces; yield stress = 23.4 MPa (3400 psi)25% 2.2
2.55.9 (850) 2.4 2.3 0.2
2.12.1
20% 44.8
4.7 (680) 3.6 4.1 0.53.94.4
15% 10.511.2
3.5 (510) 9.6 10.1 1.110.68.4
10% 79.764.5
2.3 (340) 65.4 64.3 10.550.461.5
G-4

Table G-4 - Test Data Obtained from Pipe at Site E
Yield Stress Failure Time Average Std. Div. ofof the Specimen Failure Time Failure Time
of the Plaque of the PlaqueMPa (psi) (hr.) (hr.) (hr.)
Pipe Pieces; yield stress = 30.5 MPa (4420 psi)20% 2.9
2.36.1 (884) 2 2.4 0.5
15% 4.43.9
4.6 (663) 3.9 4.1 0.310% 23.1
19.43.0 (442) 20.8 21.1 1.9
Note: material was only sufficient material to perform three replicate at each applied stress.
G-5

Table G-5 - Test Data Obtained from Pipe at Site F
Yield Stress Failure Time Average Std. Div. ofof the Specimen Failure Time Failure Time
of the Plaque of the PlaqueMPa (psi) (hr.) (hr.) (hr.)
Pipe Pieces; yield stress = 28.2 MPa (4090 psi)25% 3.0
2.17.1 (1023) 2.6 2.4 0.4
2.02.2
20% 3.63.6
5.6 (818) 3.7 3.4 0.33.13.1
15% 6.57.3
4.2 (614) 8.1 7.3 0.66.87.7
10% 37.443.4
2.8 (409) 39.2 38.3 3.437.434.2
G-6

Table G-6 - Test Data Obtained from Pipe at Site G
Yield Stress Failure Time Average Std. Div. ofof the Specimen Failure Time Failure Time
of the Plaque of the PlaqueMPa (psi) (hr.) (hr.) (hr.)
Pipe Pieces; yield stress = 38.6 MPa (5600 psi)20% 1.1
1.17.7 (1120) 1.2 1.2 0.2
1.51.3
15% 2.12.4
5.8 (840) 2.6 2.3 0.22.42.2
10% 7.26.8
3.9 (560) 7 7.1 0.56.68
6.8% 43.256.1
2.6 (380) 44.4 43.6 9.244.230.1
G-7

Table G-7 - Test Data Obtained from Pipe at Site H
Yield Stress Failure Time Average Std. Div. ofof the Specimen Failure Time Failure Time
of the Plaque of the PlaqueMPa (psi) (hr.) (hr.) (hr.)
Pipe Pieces; yield stress = 26.2 MPa (3800 psi)25% 12.7
14.26.6 (950) 6.0 11.0 3.2
12.010.1
20% 21.23.8
5.2 (760) 12.7 13.6 6.711.818.3
15% 53.811.1
3.9 (570) 65.2 38.8 26.39.854.1
10% 29497.2
2.6 (380) 72.6 139.2 94.469.2163.1
G-8

Table G-8 - Test Data Obtained from Pipe at Site I
Yield Stress Failure Time Average Std. Div. ofof the Specimen Failure Time Failure Time
of the Plaque of the PlaqueMPa (psi) (hr.) (hr.) (hr.)
Pipe Pieces; yield stress = 26.9 MPa (3900 psi)25% 2.2
1.86.7 (975) 2.0 1.9 0.2
1.61.9
20% 3.43.2
5.4 (780) 2.9 3.0 0.32.82.7
15% 8.37.4
4.0 (585) 6.9 7.5 0.57.77.3
10% 42.338.3
2.7 (390) 39.8 38.4 2.934.636.8
G-9

Table G-9.1 - Test Data Obtained from Pipe at Site J-1
Yield Stress Failure Time Average Std. Div. ofof the Specimen Failure Time Failure Time
of the Plaque of the PlaqueMPa (psi) (hr.) (hr.) (hr.)
Pipe Pieces; yield stress = 25.8 MPa (3740psi)25% 64.6
55.16.4 (935) 63.0 62.8 5.3
61.469.8
20% 90.6105.1
5.2 (748) 117.8 102.4 11.2106.192.3
15% 353.6256.2
3.9 (561) 249 313.7 55.8353.7355.8
G-10

Table G-9.2 - Test Data Obtained from Pipe at Site J-2
Yield Stress Failure Time Average Std. Div. ofof the Specimen Failure Time Failure Time
of the Plaque of the PlaqueMPa (psi) (hr.) (hr.) (hr.)
Pipe Pieces; yield stress = 30.3 MPa (4400 psi)25% 0.7
0.67.6 (1100) 0.7 0.7 0.1
0.70.6
20% 1.41.4
6.1 (880) 1.3 1.3 0.11.31.3
15% 3.03.1
4.6 (660) 2.9 2.9 0.22.63.0
10% 13.215.9
3.0 (440) 13.9 14.0 1.314.312.6
G-11

Table G-10 - Test Data Obtained from Pipe at Site K
Yield Stress Failure Time Average Std. Div. ofof the Specimen Failure Time Failure Time
of the Plaque of the PlaqueMPa (psi) (hr.) (hr.) (hr.)
Pipe Pieces; yield stress = 25.2 MPa (3650 psi)25% 9.8
8.96.3 (913) 8.0 8.7 0.7
8.28.8
20% 16.217.4
5.0 (730) 16.5 16.3 1.014.716.5
15% 46.235.6
3.8 (548) 30.1 37.6 5.837.838.5
10% 521.4444.9
2.5 (365) 403.6 456.2 42.4460.5450.6
G-12

Table G-11 - Test Data Obtained from Pipe at Site L
Yield Stress Failure Time Average Std. Div. ofof the Specimen Failure Time Failure Time
of the Plaque of the PlaqueMPa (psi) (hr.) (hr.) (hr.)
Pipe Pieces; yield stress = 26.5 MPa (3850 psi)25% 178.5
184.66.6 (963) 157.4 175.8 16.3
161.5196.8
20% 443.2467.5
5.3 (770) 440.9 444.9 16.3450.6422.5
G-13

Table G-12 - Test Data Obtained from Pipe at Site N
Yield Stress Failure Time Average Std. Div. ofof the Specimen Failure Time Failure Time
of the Plaque of the PlaqueMPa (psi) (hr.) (hr.) (hr.)
Pipe Pieces; yield stress = 28.2 MPa (4100 psi)25% 47.9
39.27.1 (1025) 46.4 42.6 4.3
38.540.9
20% 85.684.1
5.7 (820) 82.1 78.9 7.173.469.4
15% 217.4194.4
4.2 (615) 219.5 211.8 10.7219.3208.4
G-14

Table G-13 - Test Data Obtained from Pipe at Site O
Yield Stress Failure Time Average Std. Div. ofof the Specimen Failure Time Failure Time
of the Plaque of the PlaqueMPa (psi) (hr.) (hr.) (hr.)
Pipe Pieces; yield stress = 27.6 MPa (4000 psi)25% 0.9
0.96.9 (1000) 0.9 0.9 0.1
1.01.0
20% 1.91.8
5.5 (800) 1.7 1.8 0.11.71.7
15% 4.13.8
4.1 (600) 4.5 4.1 0.34.14
10% 18.716.8
2.8 (400) 22.8 18.8 2.519.216.5
G-15

Table G-14 - Test Data Obtained from Pipe at Site P
Yield Stress Failure Time Average Std. Div. ofof the Specimen Failure Time Failure Time
of the Plaque of the PlaqueMPa (psi) (hr.) (hr.) (hr.)
Pipe Pieces; yield stress = 28.5 MPa (4140 psi)25% 4.6
4.87.1 (1035) 4.8 4.9 0.2
5.05.2
20% 6.87.1
5.7 (828) 7.2 7.0 0.26.97.2
15% 13.413.3
4.3 (621) 13.4 13.7 0.913.115.4
10% 90.2108.9
2.8 (414) 93.7 105.2 14.4126.5106.8
G-16

Table G-15 - Test Data Obtained from Pipe at Site R
Yield Stress Failure Time Average Std. Div. ofof the Specimen Failure Time Failure Time
of the Plaque of the PlaqueMPa (psi) (hr.) (hr.) (hr.)
Pipe Pieces; yield stress = 25.9 MPa (3750 psi)25% 57.1
52.66.5 (938) 43.0 52.6 5.7
56.453.9
20% 139142.0
5.2 (750) 103.5 122.9 18.0124.3105.6
15% 305.3266.0
4.0 (578) 213.8 273.4 36.3295.8285.9
G-17

Table G-16 - Test Data Obtained from Pipe at Site U
Yield Stress Failure Time Average Std. Div. ofof the Specimen Failure Time Failure Time
of the Plaque of the PlaqueMPa (psi) (hr.) (hr.) (hr.)
Pipe Pieces; yield stress = 28.6 MPa (4150 psi)25% 1.5
1.57.2 (1038) 1.4 1.5 0.1
1.41.6
20% 2.82.5
5.7(830) 2.5 2.6 0.12.72.6
15% 6.36.6
4.3 (623) 6.3 6.3 0.36.45.9
10% 31.930.9
2.9 (415) 30.6 31.5 0.731.832.4
G-18

Table G-17 - Test Data Obtained from Pipe at Site V
Yield Stress Failure Time Average Std. Div. ofof the Specimen Failure Time Failure Time
of the Plaque of the PlaqueMPa (psi) (hr.) (hr.) (hr.)
Pipe Pieces; yield stress = 27.1 MPa (3930 psi)25% 20.8
25.86.8 (983) 27.6 24.7 3.5
20% 45.343.7
5.4(786) 44.3 44.4 0.815% 92.3
122.64.1 (590) 91.7 102.2 17.7
Note: Material was only sufficient to perform three replicate tests for each applied stress
G-19

Table G-18 - Test Data Obtained from Pipe at Site W
Yield Stress Failure Time Average Std. Div. ofof the Specimen Failure Time Failure Time
of the Plaque of the PlaqueMPa (psi) (hr.) (hr.) (hr.)
Pipe Pieces; yield stress = 30 MPa (4350 psi)25% 1.9
1.77.5 (1088) 2.0 1.9 0.2
20% 3.93.2
6.0 (870) 3.1 3.4 0.415% 6.3
6.34.5 (653) 6.3 6.3 0.0
10% 54.751.7
3.0 (435) 65.7 57.4 7.4
Note: Material was only sufficient to perform three replicate tests for each applied stress
G-20

H- 1
APPENDIX H
DETERMINATION OF THE STRESS INTENSITY FACTOR “K”
BASED ON NOTCHED DEPTH

H- 2
Unlike the compression mold plaque, the thickness of the specimen varies from liner to crest and
also from location to location along the circumferential of the pipe. For example, in one of the 600 mm
diameter pipes, the average crest thickness is 2.54 mm whereas the thickness of the liner is 1.9 mm.
Thus, the notch depth can vary greatly between the crest and liner specimens if the ASTM D5397
protocol is followed by using a 20% notch depth. (Note that the test is designed for polyethylene
geomembranes which have a fairly uniform thickness, ± 0.002 in.). Comparing failure times resulted
from specimens with significant different notch depth may not be appropriate. Kuhlman, et. al. (1996)
pointed out that the failure time is governed by the stress intensity factor “K” based on the linear fracture
mechanics theory, as indicated in Equation 1.
K = F * σ* √a (1)
where:
K = stress intensity factor (MPa-mm1/2)
F = specimen geometry factor
for the NCTL test specimen the geometry is referred to as single-edge crack
F = [1.99 - 0.41(a/t)+18.70 (a/t)2-38.48(a/t)3+53.85(a/t)4]
σ = applied stress based on original cross-sectional area (MPa)
a = notch depth (mm)
t = thickness of the specimen (mm)
Once the notch depth “a” changes, the K value will also be changed accordingly assuming that other
parameters are kept constant. Hence, the resulting failure time will not be the same, as the driving force
of the crack altered. In order to compare different specimens with significant thickness variation, a
constant K value should be maintained among them. This can be achieved by varying either the notch
depth or applied stress of the NCTL test. Since the goal of the project is to compare the failure time at

H- 3
the same stress level as the compression plaque material, the notch depth of the specimen will be the
variable parameter to obtain the a constant K value.
Following is an example to determine the K value to be used in the SP-NCTL test to evaluate
pipe wall materials.
Step 1: Select applied stress
An applied stress at either 15% of the yield stress (approximately is 4.1 MPa) or 10%
(approximately 2.6 MPa) can be used in order to obtained the failure time at least twenty hours.
Step 2: Determine the K value
The K value is calculated based on the selected applied stress of 2.62 MPa, and the geometry of
the SP-NCTL test specimen used in the compression plaque material, i.e., 1.778 mm thickness
and 0.356 mm notch depth.
K = F * σ* √a (1)where:
t (thickness of the specimen) = 1.778 mm
w (width of the specimen) = 3.175 mm
a (notch depth) = 0.356 mm
σ’ (applied stress) = 2.62 MPa
(based on ligament cross-sectional area)
σ (applied stress) = 11.83/(3.175 * 1.778) = 2.096 MPa
(recalculated from load using the original cross-sectional area) MPa
F (geometry factor)
= [1.99 - 0.41(a/t) + 18.70 (a/t)2 - 38.48(a/t)3 + 53.85(a/t)4]
= [1.99 - 0.41(0.356/1.778) + 18.70 (0.356/1.778)2 -
38.48(0.356/1.778)3 + 53.85(0.356/1.778)4]
= 2.43
K = 2.43 * 2.096 * √356 = 3.04 MPa-mm1/2

H- 4
Furthermore, considering the standard deviation of the notch depth can be 0.025 mm The K value can
range from 2.91 to 3.17 MPa-mm1/2 . For applied stress at 4.13 MPa, the K value ranges from 4.59 to
5.00 MPa-mm1/2 .
In order to achieve the above K value, the notch depth of the specimens with different
thicknesses is calculated using Equation 1 based on different notch depth and thickness. Tables H-1
shows the calculated data for the different tested pipe samples.

Table H-1 - Calculating the notch depth based on the known K value for pipe Sample#1
Stress, MPa w (mm) t (mm) a (mm) Stress (MPa) Q K (MPa/mm1/2)(ligament) (width) (thickness) (notch depth) (original) (geometry) (stress Intensity)
Crest (circumferential) based on K= 4.59 - 5.00 MPa/mm1/2
4.13 3.175 2.184 0.356 3.46 2.29 4.734.13 3.175 2.159 0.356 3.45 2.30 4.734.13 3.175 2.057 0.356 3.42 2.33 4.744.13 3.175 2.007 0.356 3.40 2.34 4.754.13 3.175 1.829 0.356 3.33 2.41 4.784.13 3.175 2.134 0.356 3.44 2.30 4.734.13 3.175 2.134 0.356 3.44 2.30 4.734.13 3.175 2.134 0.356 3.44 2.30 4.734.13 3.175 2.057 0.356 3.42 2.33 4.744.13 3.175 1.905 0.356 3.36 2.38 4.77
Liner (circumferential)4.13 3.175 1.905 0.356 3.36 2.38 4.774.13 3.175 1.905 0.356 3.36 2.38 4.774.13 3.175 1.829 0.356 3.33 2.41 4.784.13 3.175 1.803 0.356 3.32 2.42 4.794.13 3.175 1.778 0.356 3.30 2.43 4.804.13 3.175 1.930 0.356 3.37 2.37 4.764.13 3.175 1.905 0.356 3.36 2.38 4.774.13 3.175 1.905 0.356 3.36 2.38 4.774.13 3.175 1.854 0.356 3.34 2.40 4.784.13 3.175 1.829 0.356 3.33 2.41 4.78
Liner (longitudinal)4.13 3.175 1.905 0.356 3.36 2.38 4.774.13 3.175 1.880 0.356 3.35 2.39 4.774.13 3.175 1.854 0.356 3.34 2.40 4.784.13 3.175 1.854 0.356 3.34 2.40 4.784.13 3.175 1.803 0.356 3.32 2.42 4.794.13 3.175 1.930 0.356 3.37 2.37 4.764.13 3.175 1.880 0.356 3.35 2.39 4.774.13 3.175 1.880 0.356 3.35 2.39 4.774.13 3.175 1.880 0.356 3.35 2.39 4.774.13 3.175 1.854 0.356 3.34 2.40 4.78
H-5

Table H-2 - Calculating the notch depth based on the known K value for pipe Sample#12
Stress, MPa w (mm) t (mm) a (mm) Stress (MPa) Q K (MPa/mm1/2)(ligament) (width) (thickness) (notch depth) (original) (geometry) (stress Intensity)
Liner(circumferential) based on K= 4.59 - 5.00 MPa/mm1/2
4.13 3.175 3.023 0.381 3.61 2.17 4.844.13 3.175 2.997 0.381 3.60 2.18 4.844.13 3.175 2.946 0.381 3.60 2.18 4.844.13 3.175 2.946 0.381 3.60 2.18 4.844.13 3.175 2.946 0.381 3.60 2.18 4.844.13 3.175 3.048 0.381 3.61 2.17 4.844.13 3.175 3.023 0.381 3.61 2.17 4.844.13 3.175 2.972 0.381 3.60 2.18 4.844.13 3.175 2.921 0.381 3.59 2.18 4.844.13 3.175 2.896 0.381 3.59 2.19 4.84
Liner (longitudinal)4.13 3.175 3.200 0.381 3.64 2.15 4.834.13 3.175 2.972 0.381 3.60 2.18 4.844.13 3.175 2.946 0.381 3.60 2.18 4.844.13 3.175 2.896 0.381 3.59 2.19 4.844.13 3.175 2.870 0.381 3.58 2.19 4.854.13 3.175 3.200 0.381 3.64 2.15 4.834.13 3.175 3.099 0.381 3.62 2.16 4.844.13 3.175 3.099 0.381 3.62 2.16 4.844.13 3.175 3.023 0.381 3.61 2.17 4.844.13 3.175 2.972 0.381 3.60 2.18 4.84
H-6

Table H-3 - Calculating the notch depth based on the known K value for pipe Sample#5
Stress, MPa w (mm) t (mm) a (mm) Stress (MPa) Q K (MPa/mm1/2)(ligament) (width) (thickness) (notch depth) (original) (geometry) (stress Intensity)
Liner(circumferential) based on K= 4.59 - 5.00 MPa/mm1/2
4.13 3.175 2.234 0.356 3.47 2.28 4.724.13 3.175 2.135 0.356 3.44 2.30 4.734.13 3.175 2.235 0.356 3.47 2.28 4.724.13 3.175 2.134 0.356 3.44 2.31 4.734.13 3.175 2.134 0.356 3.44 2.31 4.734.13 3.175 2.235 0.356 3.47 2.28 4.724.13 3.175 2.210 0.356 3.46 2.28 4.724.13 3.175 2.108 0.356 3.43 2.31 4.744.13 3.175 2.108 0.356 3.43 2.31 4.744.13 3.175 2.083 0.356 3.42 2.32 4.74
Liner (longitudinal)4.13 3.175 2.210 0.356 3.46 2.28 4.724.13 3.175 2.210 0.356 3.46 2.28 4.724.13 3.175 2.032 0.356 3.41 2.34 4.754.13 3.175 2.007 0.356 3.40 2.34 4.754.13 3.175 1.727 0.356 3.28 2.46 4.814.13 3.175 2.362 0.356 3.51 2.25 4.714.13 3.175 2.261 0.356 3.48 2.27 4.724.13 3.175 2.261 0.356 3.48 2.27 4.724.13 3.175 2.235 0.356 3.47 2.28 4.724.13 3.175 2.108 0.356 3.43 2.31 4.74
H-7

Table H-4 - Calculating the notch depth based on the known K value for pipe Sample#4
Stress, MPa w (mm) t (mm) a (mm) Stress (MPa) Q K (MPa/mm1/2)(ligament) (width) (width) (notch depth) (original) (geometry) (stress Intensity)
Crest(circumferential) based on K= 2.91 - 3.17 MPa/mm1/2
2.62 3.175 2.946 0.381 2.28 2.18 3.072.62 3.175 3.023 0.381 2.29 2.17 3.072.62 3.175 2.794 0.381 2.26 2.20 3.082.62 3.175 3.124 0.381 2.30 2.16 3.072.62 3.175 3.150 0.381 2.30 2.16 3.072.62 3.175 3.454 0.381 2.33 2.13 3.062.62 3.175 3.505 0.381 2.34 2.12 3.062.62 3.175 3.454 0.381 2.33 2.13 3.062.62 3.175 3.429 0.381 2.33 2.13 3.062.62 3.175 3.556 0.381 2.34 2.12 3.06
Liner (longitudinal)2.62 3.175 2.565 0.381 2.23 2.24 3.092.62 3.175 2.515 0.381 2.22 2.25 3.092.62 3.175 2.311 0.381 2.19 2.30 3.102.62 3.175 2.337 0.381 2.19 2.29 3.102.62 3.175 2.413 0.381 2.21 2.27 3.102.62 3.175 2.311 0.381 2.19 2.30 3.102.62 3.175 2.489 0.381 2.22 2.26 3.092.62 3.175 2.388 0.381 2.20 2.28 3.102.62 3.175 2.438 0.381 2.21 2.27 3.092.62 3.175 2.413 0.381 2.21 2.27 3.10
Liner (circumferential)2.62 3.175 2.413 0.381 2.21 2.27 3.102.62 3.175 2.413 0.381 2.21 2.27 3.102.62 3.175 2.413 0.381 2.21 2.27 3.102.62 3.175 2.438 0.381 2.21 2.27 3.092.62 3.175 2.413 0.381 2.21 2.27 3.102.62 3.175 2.413 0.381 2.21 2.27 3.102.62 3.175 2.413 0.381 2.21 2.27 3.102.62 3.175 2.388 0.381 2.20 2.28 3.102.62 3.175 2.413 0.381 2.21 2.27 3.102.62 3.175 2.438 0.381 2.21 2.27 3.09
H-8

Table H-5 - Calculating the notch depth based on the known K value for pipe Sample#11
Stress, MPa w (mm) t (mm) a (mm) Stress (MPa) Q K (MPa/mm1/2)(ligament) (width) (width) (notch depth) (original) (geometry) (stress Intensity)
Crest(circumferential) based on K= 2.91 - 3.17 MPa/mm1/2
2.62 3.175 4.064 0.381 2.37 2.09 3.062.62 3.175 3.708 0.381 2.35 2.11 3.062.62 3.175 4.190 0.381 2.38 2.08 3.062.62 3.175 4.190 0.381 2.38 2.08 3.062.62 3.175 3.734 0.381 2.35 2.11 3.062.62 3.175 4.132 0.381 2.38 2.08 3.062.62 3.175 3.802 0.381 2.36 2.10 3.062.62 3.175 4.052 0.381 2.37 2.09 3.062.62 3.175 3.950 0.381 2.37 2.09 3.062.62 3.175 4.125 0.381 2.38 2.09 3.06
Liner (longitudinal)2.62 3.175 2.616 0.381 2.24 2.23 3.082.62 3.175 2.616 0.381 2.24 2.23 3.082.62 3.175 2.641 0.381 2.24 2.23 3.082.62 3.175 2.591 0.381 2.23 2.24 3.092.62 3.175 2.616 0.381 2.24 2.23 3.082.62 3.175 2.565 0.381 2.23 2.24 3.092.62 3.175 2.591 0.381 2.23 2.24 3.092.62 3.175 2.540 0.381 2.23 2.25 3.092.62 3.175 2.565 0.381 2.23 2.24 3.092.62 3.175 2.591 0.381 2.23 2.24 3.09
Liner (circumferential)2.62 3.175 2.464 0.381 2.21 2.26 3.092.62 3.175 2.540 0.381 2.23 2.25 3.092.62 3.175 2.514 0.381 2.22 2.25 3.092.62 3.175 2.591 0.381 2.23 2.24 3.092.62 3.175 2.565 0.381 2.23 2.24 3.092.62 3.175 2.489 0.381 2.22 2.26 3.092.62 3.175 2.489 0.381 2.22 2.26 3.092.62 3.175 2.565 0.381 2.23 2.24 3.092.62 3.175 2.565 0.381 2.23 2.24 3.092.62 3.175 2.541 0.381 2.23 2.25 3.09
H-9