hdx case study
TRANSCRIPT
1 OCHA CENTRE FOR HUMANITARIAN DATA | SEPTEMBER 2020
CASE EXCERPT
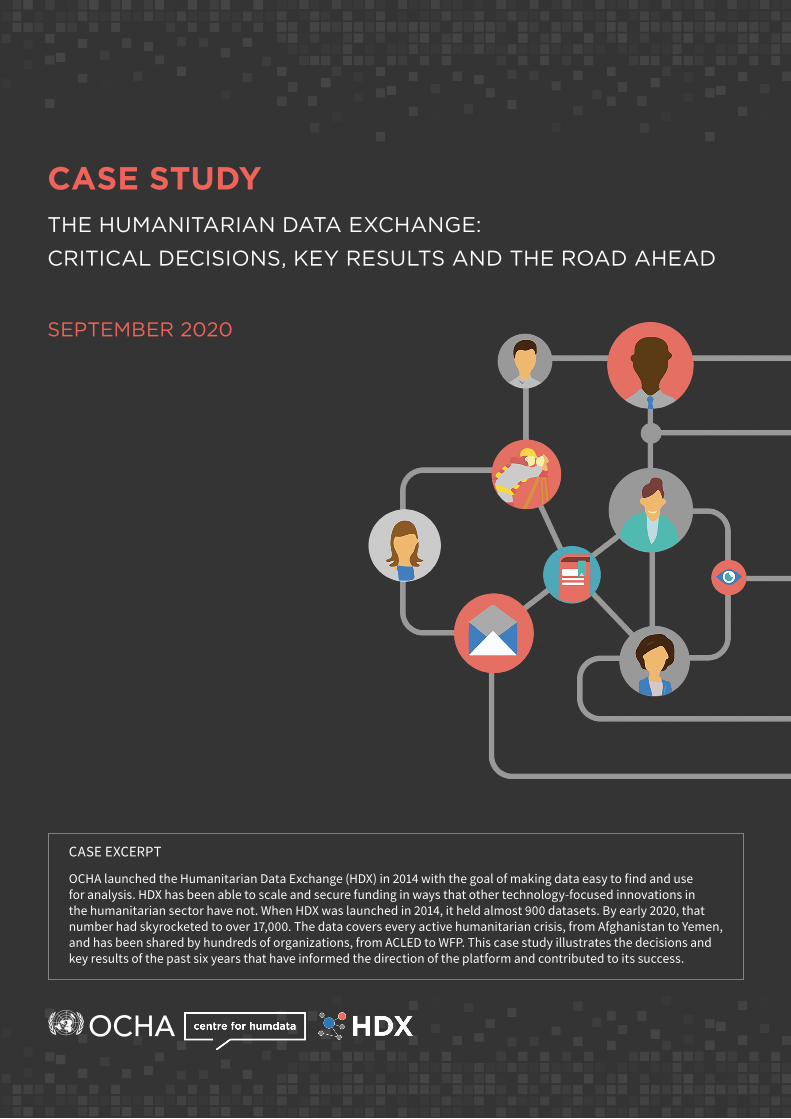
OCHA launched the Humanitarian Data Exchange (HDX) in 2014 with the goal of making data easy to find and use for analysis. HDX has been able to scale and secure funding in ways that other technology-focused innovations in the humanitarian sector have not. When HDX was launched in 2014, it held almost 900 datasets. By early 2020, that number had skyrocketed to over 17,000. The data covers every active humanitarian crisis, from Afghanistan to Yemen, and has been shared by hundreds of organizations, from ACLED to WFP. This case study illustrates the decisions and key results of the past six years that have informed the direction of the platform and contributed to its success.
CASE STUDYTHE HUMANITARIAN DATA EXCHANGE:
CRITICAL DECISIONS, KEY RESULTS AND THE ROAD AHEAD
SEPTEMBER 2020
2 OCHA CENTRE FOR HUMANITARIAN DATA | SEPTEMBER 2020
TABLE OF CONTENTS
1. INTRODUCTION ........................................................................ 3
2. KEY LEARNINGS ........................................................................ 4
3. MAKING THE CASE ..................................................................... 5
4. THE HUMANITARIAN INNOVATION CONTEXT ................................ 6 4.1. Innovation Process Timeline ............................................................................ 7
5. BUILDING HDX: EARLY DECISIONS ................................................ 9 5.1. Build, Buy or Open Source? ............................................................................. 9 5.2. Investing in User Research ............................................................................. 10 5.3. Offering Data Services .................................................................................... 11 5.3. Ebola Crisis Page ............................................................................................ 11 5.3. WFP Organization Page .................................................................................. 12 5.4. Staying Focused ............................................................................................. 13
6. HDX TODAY: KEY RESULTS ........................................................ 14 6.1. Growth in HDX Organizations, Datasets, and Users ....................................... 15 6.1. The number of organizations ......................................................................... 156.1. The number of datasets ................................................................................. 16 6.1. The number of unique visitors ....................................................................... 16 6.2. North Star Metric: Users from field operations .............................................. 17 6.3. Cost per User .................................................................................................. 18 6.4. Connections in the Network .......................................................................... 18
7. THE ROAD AHEAD ................................................................. 19 7.1. Closing Data Gaps .......................................................................................... 20 7.2. Data Responsibility ........................................................................................ 20 7.3. “Long Life to HDX!” ........................................................................................ 21
ACKNOWLEDGEMENTS
This case study was produced by the United Nations Office for the Coordination of Humanitarian Affairs (OCHA) Centre for Humanitarian Data in The Hague, which manages the HDX platform. The study was written by Sarah Telford with contributions from Stuart Campo, CJ Hendrix, Simon Johnson, David Megginson and and Niall Saville. Graphic design is by Yumi Endo and Lena Kim. This work was made possible with funding from the Institute of Development Studies in partnership with the UK’s Department for International Development (now the Foreign, Commonwealth & Development Office). For additional information, contact the Centre for Humanitarian Data at [email protected].
3 OCHA CENTRE FOR HUMANITARIAN DATA | SEPTEMBER 2020
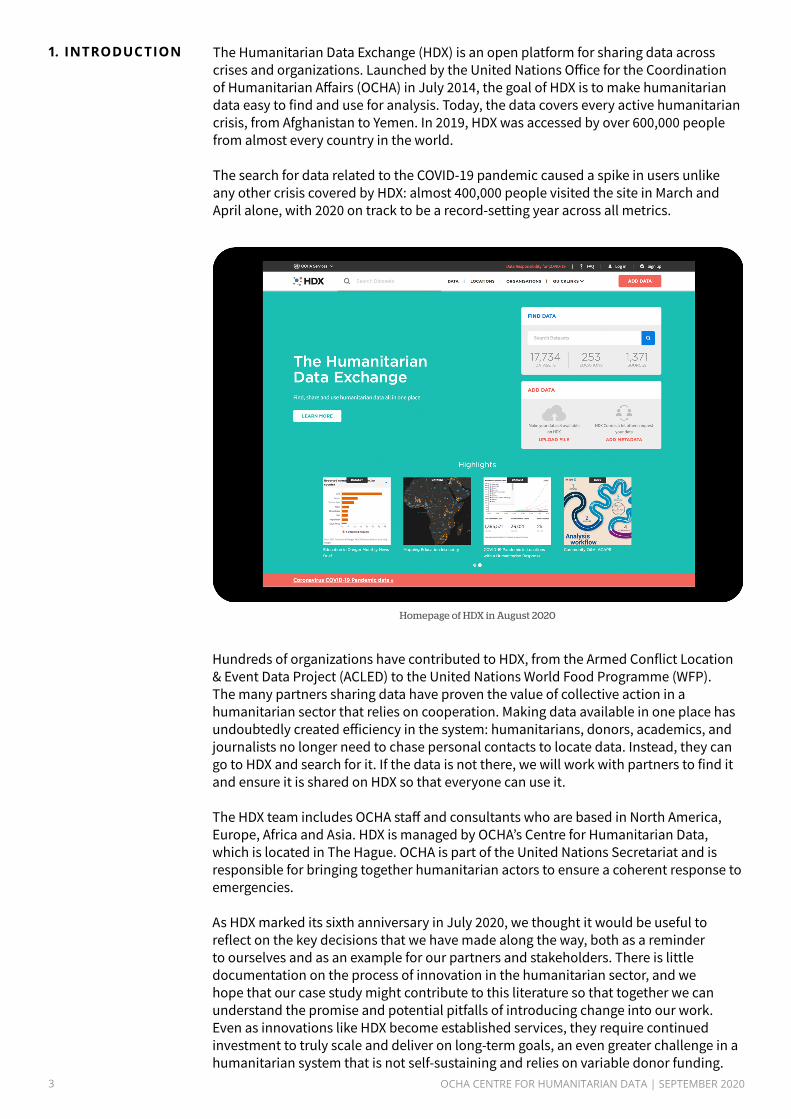
The Humanitarian Data Exchange (HDX) is an open platform for sharing data across crises and organizations. Launched by the United Nations Office for the Coordination of Humanitarian Affairs (OCHA) in July 2014, the goal of HDX is to make humanitarian data easy to find and use for analysis. Today, the data covers every active humanitarian crisis, from Afghanistan to Yemen. In 2019, HDX was accessed by over 600,000 people from almost every country in the world.
The search for data related to the COVID-19 pandemic caused a spike in users unlike any other crisis covered by HDX: almost 400,000 people visited the site in March and April alone, with 2020 on track to be a record-setting year across all metrics.
1. INTRODUCTION
Hundreds of organizations have contributed to HDX, from the Armed Conflict Location & Event Data Project (ACLED) to the United Nations World Food Programme (WFP). The many partners sharing data have proven the value of collective action in a humanitarian sector that relies on cooperation. Making data available in one place has undoubtedly created efficiency in the system: humanitarians, donors, academics, and journalists no longer need to chase personal contacts to locate data. Instead, they can go to HDX and search for it. If the data is not there, we will work with partners to find it and ensure it is shared on HDX so that everyone can use it.
The HDX team includes OCHA staff and consultants who are based in North America, Europe, Africa and Asia. HDX is managed by OCHA’s Centre for Humanitarian Data, which is located in The Hague. OCHA is part of the United Nations Secretariat and is responsible for bringing together humanitarian actors to ensure a coherent response to emergencies.
As HDX marked its sixth anniversary in July 2020, we thought it would be useful to reflect on the key decisions that we have made along the way, both as a reminder to ourselves and as an example for our partners and stakeholders. There is little documentation on the process of innovation in the humanitarian sector, and we hope that our case study might contribute to this literature so that together we can understand the promise and potential pitfalls of introducing change into our work. Even as innovations like HDX become established services, they require continued investment to truly scale and deliver on long-term goals, an even greater challenge in a humanitarian system that is not self-sustaining and relies on variable donor funding.
Homepage of HDX in August 2020
4 OCHA CENTRE FOR HUMANITARIAN DATA | SEPTEMBER 2020
We have organized the case study into the following sections: Key Learnings; Making the Case; the Humanitarian Innovation Context; Building HDX; HDX Today; and the Road Ahead.
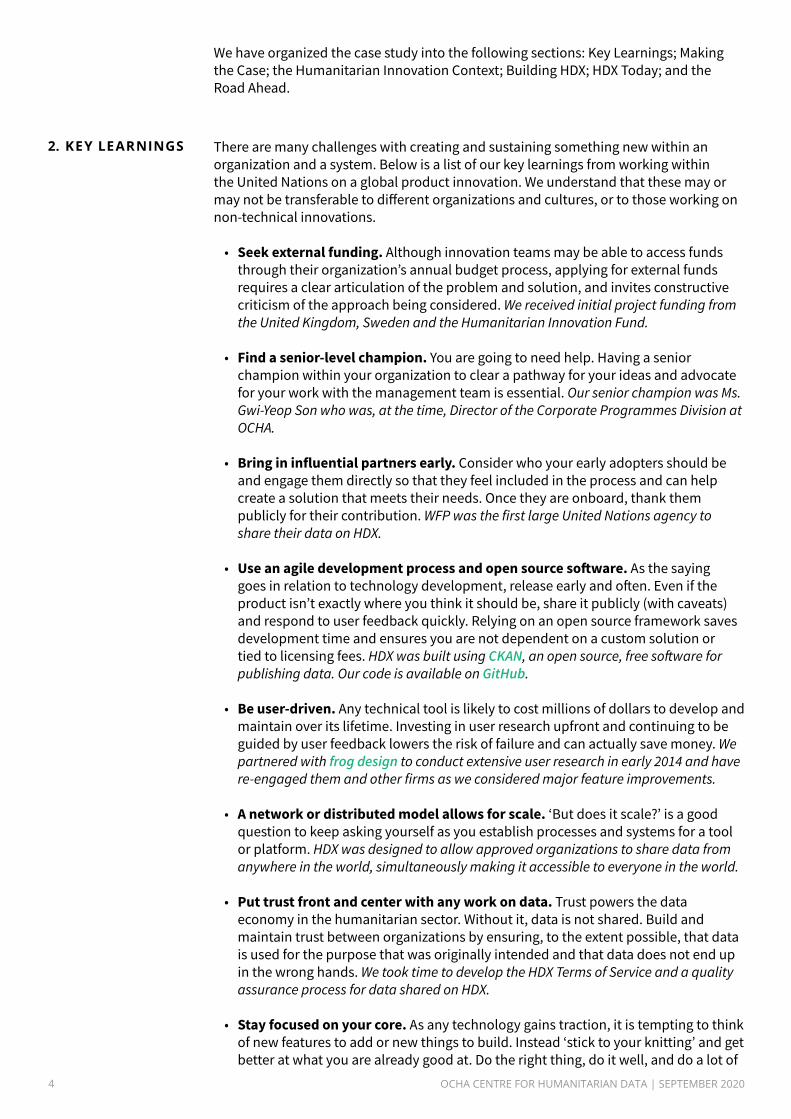
There are many challenges with creating and sustaining something new within an organization and a system. Below is a list of our key learnings from working within the United Nations on a global product innovation. We understand that these may or may not be transferable to different organizations and cultures, or to those working on non-technical innovations.
• Seek external funding. Although innovation teams may be able to access funds through their organization’s annual budget process, applying for external funds requires a clear articulation of the problem and solution, and invites constructive criticism of the approach being considered. We received initial project funding from the United Kingdom, Sweden and the Humanitarian Innovation Fund.
• Find a senior-level champion. You are going to need help. Having a senior champion within your organization to clear a pathway for your ideas and advocate for your work with the management team is essential. Our senior champion was Ms. Gwi-Yeop Son who was, at the time, Director of the Corporate Programmes Division at OCHA.
• Bring in influential partners early. Consider who your early adopters should be and engage them directly so that they feel included in the process and can help create a solution that meets their needs. Once they are onboard, thank them publicly for their contribution. WFP was the first large United Nations agency to share their data on HDX.
• Use an agile development process and open source software. As the saying goes in relation to technology development, release early and often. Even if the product isn’t exactly where you think it should be, share it publicly (with caveats) and respond to user feedback quickly. Relying on an open source framework saves development time and ensures you are not dependent on a custom solution or tied to licensing fees. HDX was built using CKAN, an open source, free software for publishing data. Our code is available on GitHub.
• Be user-driven. Any technical tool is likely to cost millions of dollars to develop and maintain over its lifetime. Investing in user research upfront and continuing to be guided by user feedback lowers the risk of failure and can actually save money. We partnered with frog design to conduct extensive user research in early 2014 and have re-engaged them and other firms as we considered major feature improvements.
• A network or distributed model allows for scale. ‘But does it scale?’ is a good question to keep asking yourself as you establish processes and systems for a tool or platform. HDX was designed to allow approved organizations to share data from anywhere in the world, simultaneously making it accessible to everyone in the world.
• Put trust front and center with any work on data. Trust powers the data economy in the humanitarian sector. Without it, data is not shared. Build and maintain trust between organizations by ensuring, to the extent possible, that data is used for the purpose that was originally intended and that data does not end up in the wrong hands. We took time to develop the HDX Terms of Service and a quality assurance process for data shared on HDX.
• Stay focused on your core. As any technology gains traction, it is tempting to think of new features to add or new things to build. Instead ‘stick to your knitting’ and get better at what you are already good at. Do the right thing, do it well, and do a lot of
2. KEY LEARNINGS
5 OCHA CENTRE FOR HUMANITARIAN DATA | SEPTEMBER 2020
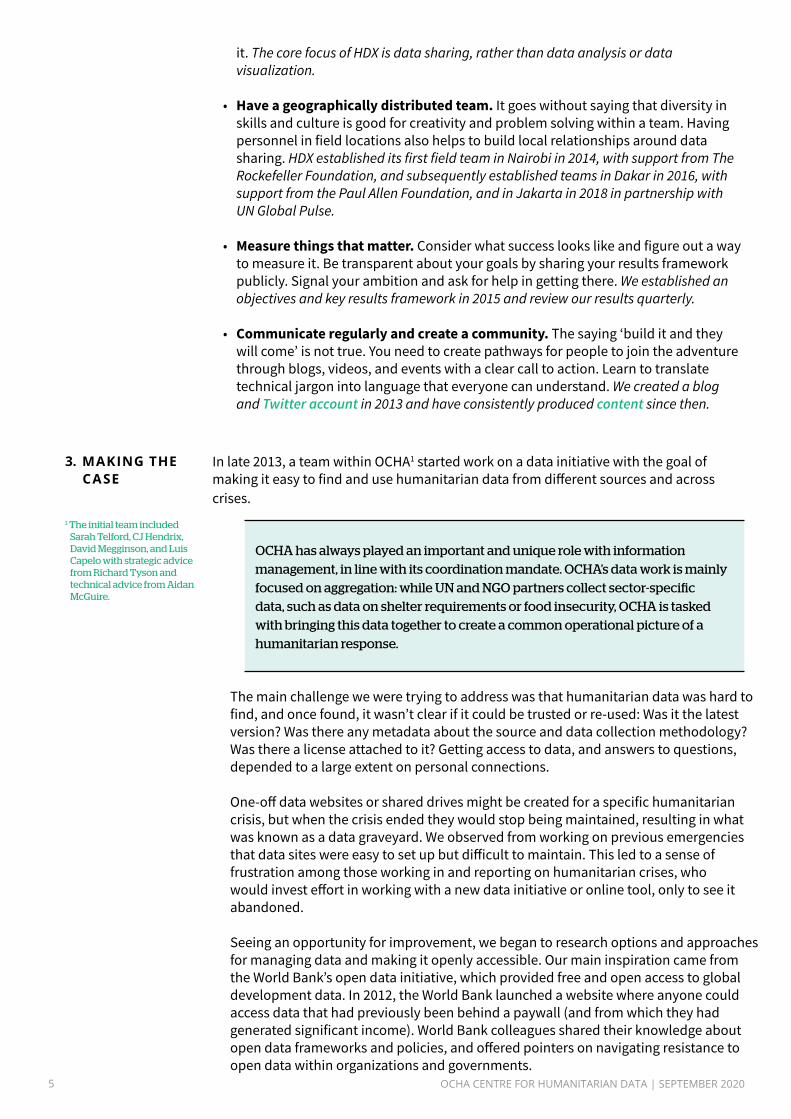
it. The core focus of HDX is data sharing, rather than data analysis or data visualization.
• Have a geographically distributed team. It goes without saying that diversity in skills and culture is good for creativity and problem solving within a team. Having personnel in field locations also helps to build local relationships around data sharing. HDX established its first field team in Nairobi in 2014, with support from The Rockefeller Foundation, and subsequently established teams in Dakar in 2016, with support from the Paul Allen Foundation, and in Jakarta in 2018 in partnership with UN Global Pulse.
• Measure things that matter. Consider what success looks like and figure out a way to measure it. Be transparent about your goals by sharing your results framework publicly. Signal your ambition and ask for help in getting there. We established an objectives and key results framework in 2015 and review our results quarterly.
• Communicate regularly and create a community. The saying ‘build it and they will come’ is not true. You need to create pathways for people to join the adventure through blogs, videos, and events with a clear call to action. Learn to translate technical jargon into language that everyone can understand. We created a blog and Twitter account in 2013 and have consistently produced content since then.
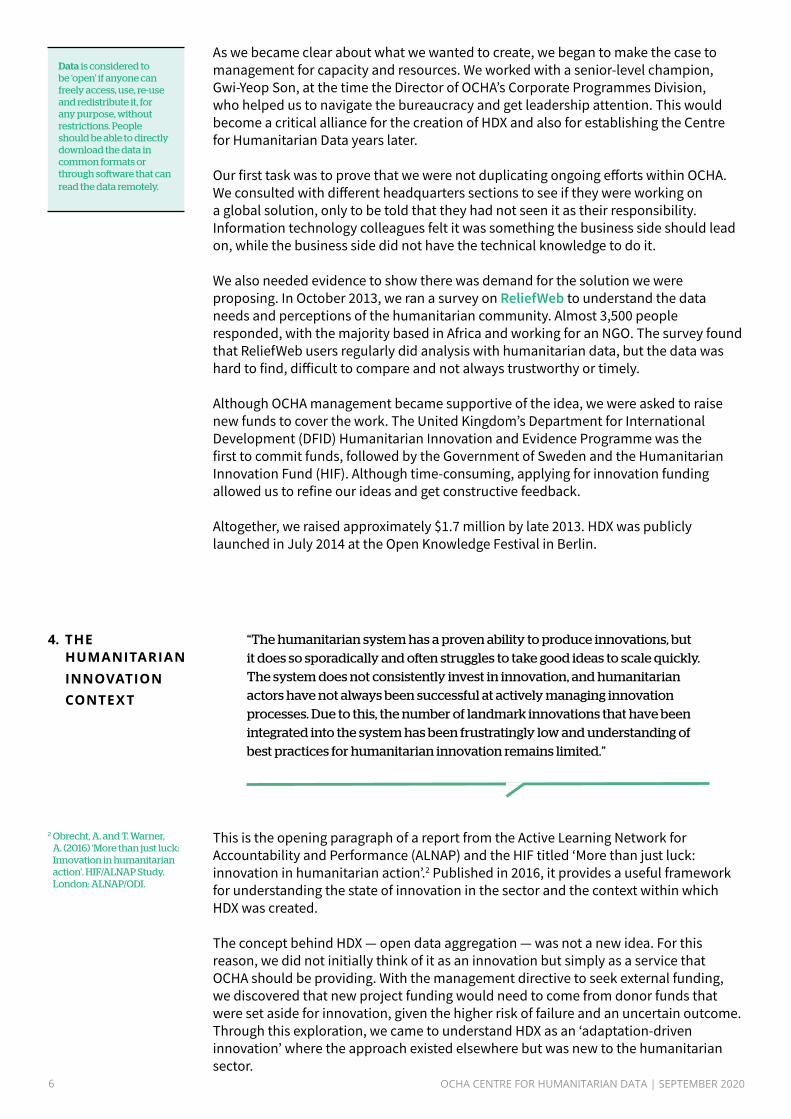
In late 2013, a team within OCHA1 started work on a data initiative with the goal of making it easy to find and use humanitarian data from different sources and across crises.
3. MAKING THECASE
The main challenge we were trying to address was that humanitarian data was hard to find, and once found, it wasn’t clear if it could be trusted or re-used: Was it the latest version? Was there any metadata about the source and data collection methodology? Was there a license attached to it? Getting access to data, and answers to questions, depended to a large extent on personal connections.
One-off data websites or shared drives might be created for a specific humanitarian crisis, but when the crisis ended they would stop being maintained, resulting in what was known as a data graveyard. We observed from working on previous emergencies that data sites were easy to set up but difficult to maintain. This led to a sense of frustration among those working in and reporting on humanitarian crises, who would invest effort in working with a new data initiative or online tool, only to see it abandoned.
Seeing an opportunity for improvement, we began to research options and approaches for managing data and making it openly accessible. Our main inspiration came from the World Bank’s open data initiative, which provided free and open access to global development data. In 2012, the World Bank launched a website where anyone could access data that had previously been behind a paywall (and from which they had generated significant income). World Bank colleagues shared their knowledge about open data frameworks and policies, and offered pointers on navigating resistance to open data within organizations and governments.
1 The initial team included Sarah Telford, CJ Hendrix, David Megginson, and Luis Capelo with strategic advice from Richard Tyson and technical advice from Aidan McGuire.
OCHA has always played an important and unique role with information management, in line with its coordination mandate. OCHA’s data work is mainly focused on aggregation: while UN and NGO partners collect sector-specific data, such as data on shelter requirements or food insecurity, OCHA is tasked with bringing this data together to create a common operational picture of a humanitarian response.
6 OCHA CENTRE FOR HUMANITARIAN DATA | SEPTEMBER 2020
As we became clear about what we wanted to create, we began to make the case to management for capacity and resources. We worked with a senior-level champion, Gwi-Yeop Son, at the time the Director of OCHA’s Corporate Programmes Division, who helped us to navigate the bureaucracy and get leadership attention. This would become a critical alliance for the creation of HDX and also for establishing the Centre for Humanitarian Data years later.
Our first task was to prove that we were not duplicating ongoing efforts within OCHA. We consulted with different headquarters sections to see if they were working on a global solution, only to be told that they had not seen it as their responsibility. Information technology colleagues felt it was something the business side should lead on, while the business side did not have the technical knowledge to do it.
We also needed evidence to show there was demand for the solution we were proposing. In October 2013, we ran a survey on ReliefWeb to understand the data needs and perceptions of the humanitarian community. Almost 3,500 people responded, with the majority based in Africa and working for an NGO. The survey found that ReliefWeb users regularly did analysis with humanitarian data, but the data was hard to find, difficult to compare and not always trustworthy or timely.
Although OCHA management became supportive of the idea, we were asked to raise new funds to cover the work. The United Kingdom’s Department for International Development (DFID) Humanitarian Innovation and Evidence Programme was the first to commit funds, followed by the Government of Sweden and the Humanitarian Innovation Fund (HIF). Although time-consuming, applying for innovation funding allowed us to refine our ideas and get constructive feedback.
Altogether, we raised approximately $1.7 million by late 2013. HDX was publicly launched in July 2014 at the Open Knowledge Festival in Berlin.
4. THE HUMANITARIANINNOVATIONCONTEXT
This is the opening paragraph of a report from the Active Learning Network for Accountability and Performance (ALNAP) and the HIF titled ‘More than just luck: innovation in humanitarian action’.2 Published in 2016, it provides a useful framework for understanding the state of innovation in the sector and the context within which HDX was created.
The concept behind HDX — open data aggregation — was not a new idea. For this reason, we did not initially think of it as an innovation but simply as a service that OCHA should be providing. With the management directive to seek external funding, we discovered that new project funding would need to come from donor funds that were set aside for innovation, given the higher risk of failure and an uncertain outcome. Through this exploration, we came to understand HDX as an ‘adaptation-driven innovation’ where the approach existed elsewhere but was new to the humanitarian sector.
2 Obrecht, A. and T. Warner, A. (2016) ‘More than just luck: Innovation in humanitarian action’. HIF/ALNAP Study. London: ALNAP/ODI.
“The humanitarian system has a proven ability to produce innovations, but it does so sporadically and often struggles to take good ideas to scale quickly. The system does not consistently invest in innovation, and humanitarian actors have not always been successful at actively managing innovation processes. Due to this, the number of landmark innovations that have been integrated into the system has been frustratingly low and understanding of best practices for humanitarian innovation remains limited.”
Data is considered to be ‘open’ if anyone can freely access, use, re-use and redistribute it, for any purpose, without restrictions. People should be able to directly download the data in common formats or through software that can read the data remotely.

7 OCHA CENTRE FOR HUMANITARIAN DATA | SEPTEMBER 2020
As part of a strategy that prioritized innovation as a key area of investment, DFID established the Humanitarian Innovation and Evidence Programme in 2012 with a multi-year £48 million budget aimed at improving research and development activities in the humanitarian system. The UK was also one of the main donors, along with the Netherlands and Sweden, for ELHRA’s Humanitarian Innovation Fund, which was created in 2010.
Our engagement with the innovation experts at these two initiatives shaped our approach and their seed funding created permission for other donors and partners to support us. On the strong advice of DFID, we established an independent advisory board for the first year of the project. The board met regularly and included representatives from Flowminder, Google, Tufts University, WFP and the World Bank. This outside expertise proved invaluable as we navigated challenging issues such as data licensing, drafting the HDX Terms of Service, and gaining early adopters.
HDX is a product innovation, one of the 4 Ps in the classic innovation model. But for HDX to be successful, it would involve a process innovation, one that would shift data sharing from a centralized, hub-and-spoke model to a decentralized, network model.
4.1 Innovation Process Timeline
Although HDX had gained traction by 2015, we had spent the initial innovation funds and needed to find a regular funding source. OCHA agreed to move the cost of HDX into its annual programme budget, which we took as a sign of success, but the relief was short-lived. Soon thereafter, OCHA went through a severe downward cycle of its budget with consequences for staff roles and existing services. We knew that putting the brakes on our development work at this early stage might cause HDX to fail.
3 The dominant model for understanding the ‘what’ of innovation is based on the classic ‘4 Ps’ model outlined by Dave Francis and John Bessant (2005). The wording used here is taken from ALNAP.
The continuum from programming to innovation (ALNAP/HIF).
The 4 Ps of Innovation3
changes in the things (products/services) an organization offers.
changes in the ways products and services are created or delivered.
changes in the context in which the products/services are framed and communicated.
changes in the underlying mental models that shape the organization does.
P
P
P
P
roduct Innovation
rocess Innovation
osition Innovation
aradigm Innovation
8 OCHA CENTRE FOR HUMANITARIAN DATA | SEPTEMBER 2020
It was this pressure that led us to begin conversations with the Netherlands Ministry of Foreign Affairs about creating something more ambitious, along the lines of a position or paradigm innovation, that would encompass HDX but also take on the wider challenges of data policy and data literacy. These ideas coincided with the holding of the World Humanitarian Summit in May 2016, which had a strong focus on achieving transformational change.
OCHA launched the Centre for Humanitarian Data in The Hague in 2017 with the aim of increasing the use and impact of data in the humanitarian sector. The work is an extension of HDX’s goal of making it easy to find and use data for analysis. HDX was able to scale because it became part of the Centre with a multi-year investment from the Netherlands.
4 The HIF has developed a five- stage model for the innovation process which we can use to understand HDX’s progress.
5 Wilson, Mark, “How the Candy Crush of Data is Saving Lives in Nepal” (30 April 2015), Fast Company.
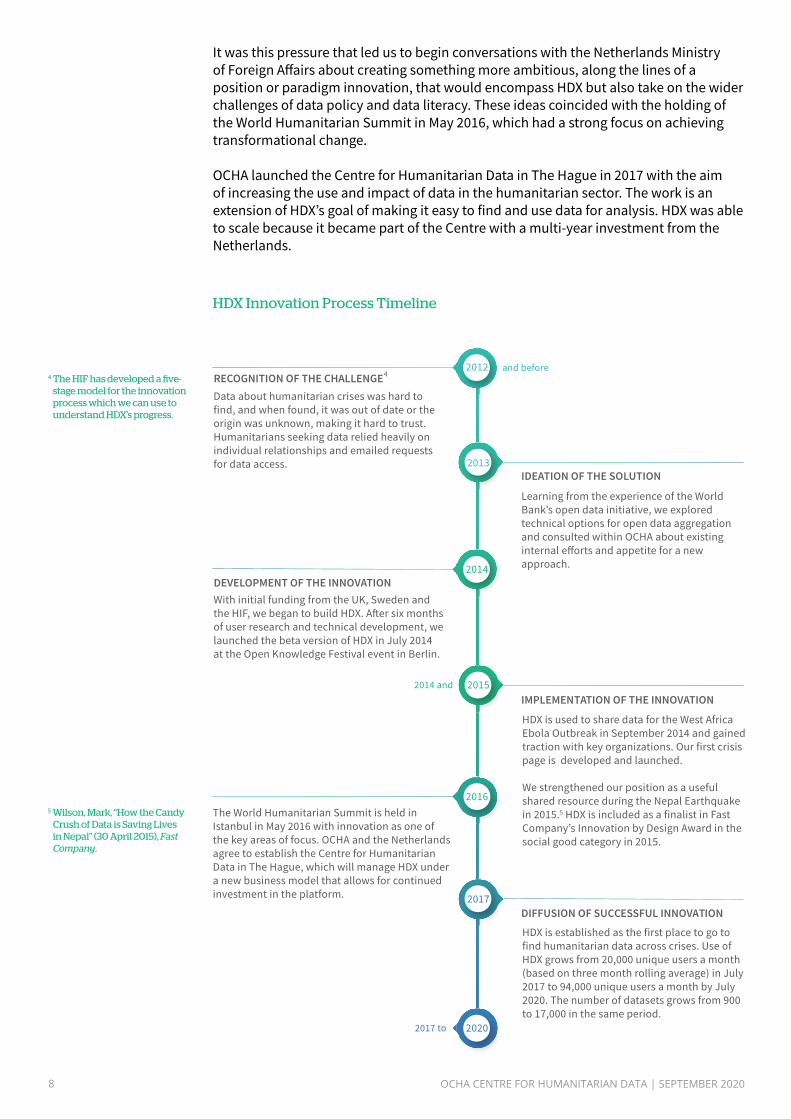
HDX Innovation Process Timeline
RECOGNITION OF THE CHALLENGE
IDEATION OF THE SOLUTION
DEVELOPMENT OF THE INNOVATION
IMPLEMENTATION OF THE INNOVATION
DIFFUSION OF SUCCESSFUL INNOVATION
and before
2017 to
2014 and
Data about humanitarian crises was hard to find, and when found, it was out of date or the origin was unknown, making it hard to trust. Humanitarians seeking data relied heavily on individual relationships and emailed requests for data access.
Learning from the experience of the World Bank’s open data initiative, we explored technical options for open data aggregation and consulted within OCHA about existing internal efforts and appetite for a new approach.
4
With initial funding from the UK, Sweden and the HIF, we began to build HDX. After six months of user research and technical development, we launched the beta version of HDX in July 2014 at the Open Knowledge Festival event in Berlin.
HDX is used to share data for the West Africa Ebola Outbreak in September 2014 and gained traction with key organizations. Our first crisis page is developed and launched.
We strengthened our position as a useful shared resource during the Nepal Earthquake in 2015.5 HDX is included as a finalist in Fast Company’s Innovation by Design Award in the social good category in 2015.
The World Humanitarian Summit is held in Istanbul in May 2016 with innovation as one of the key areas of focus. OCHA and the Netherlands agree to establish the Centre for Humanitarian Data in The Hague, which will manage HDX under a new business model that allows for continued investment in the platform.
HDX is established as the first place to go to find humanitarian data across crises. Use of HDX grows from 20,000 unique users a month (based on three month rolling average) in July 2017 to 94,000 unique users a month by July 2020. The number of datasets grows from 900 to 17,000 in the same period.
2012
2013
2014
2015
2016
2017
2020
9 OCHA CENTRE FOR HUMANITARIAN DATA | SEPTEMBER 2020
5. BUILDING HDX:EARLY DECISIONS
As we built HDX, we faced a number of critical decisions that shaped what it would become. We knew we were not assured of success and were often reminded of the adage that over half of all technology projects fail.
One of our first decisions was around the technology we would use to manage the platform. We had two use cases: we wanted partners to be able to share their data about a crisis (e.g., a single dataset with the results of a needs assessment in Sudan) and we wanted to create a database to compare data across sources and crises. We referred to the latter as the Common Humanitarian Dataset, which would include indicators by country, such as the number of people in need of assistance or the number of displaced people.
Curation Process Software
In late 2013, the Government of Luxembourg funded a programmer at their technology partner Hitec to help us build a prototype system for managing the Common Humanitarian Dataset. We referred to this as the Curation Process Software (CPS). The system would pull data from selected sources, standardize it, and make it available via an application programming interface (API) for other systems to access.
Getting data from existing sources mostly consisted of ‘scraping’ data out of web pages (such as WHO’s Global Health Observatory). We used the ScraperWiki platform for data extraction, and CPS for standardizing, storing, and serving the resulting data. APIs, which are more robust ways of automated data sharing, were then much less common among humanitarian data providers.
CKAN
Simultaneously, we were exploring options for a platform to expose the data from partners and from CPS, allowing users to search for the data they needed in a single place. For this, we decided on CKAN, open source software for data publishing from the Open Knowledge Foundation. Choosing an existing platform came with some limitations, but it freed our technical team from developing and maintaining a custom solution. Instead, the team focused on extending CKAN and building other tools to help expand and maintain HDX’s data ecosystem.
The choice to use CKAN also allowed us to move rapidly from the start of development in March 2014 to a public launch in July, which gave the project momentum at a critical time. CKAN still serves as the core platform for HDX.
The CPS system provided close to 900 datasets to help ‘bootstrap’ HDX for the July 2014 launch. However the experience of maintaining that approach made the HDX team question the feasibility of scaling CPS to include significant amounts of subnational data. Additionally, monitoring the use of HDX made it clear that users were not very interested in national level statistics, which could be several years out of date.
In 2015, the HDX team decided to retire CPS in favour of focusing on direct data sharing by organizations. We also focused on the Humanitarian Exchange Language (HXL) as a longer-term, more sustainable approach to standardizing humanitarian data (see box on page 13).
5.1 Build, Buy or Open Source?
10 OCHA CENTRE FOR HUMANITARIAN DATA | SEPTEMBER 2020
The most consequential decision we made was to invest a significant portion of our first year budget on user research. For this, we found inspiration from UNICEF’s Office of Innovation, which was ahead of its time in using design and technology to improve the lives of children around the world. It was through our conversations with colleagues at UNICEF that we came to understand the value of user research and the work they had done with frog, a global design firm.
We started working with frog in April 2014 in order to bring user needs to the center of the HDX design process. Given that there had been a number of platforms, websites, and tools introduced to humanitarians over the years—many of which were later abandoned—we knew that there would be some scepticism and fatigue in adopting yet another solution. We wanted to hear directly from OCHA staff and partners on some of their pain points and what would help make their data-related work easier. We believed that we would only be able to encourage a new set of behaviours around data sharing and gain adoption by offering a compelling user experience.
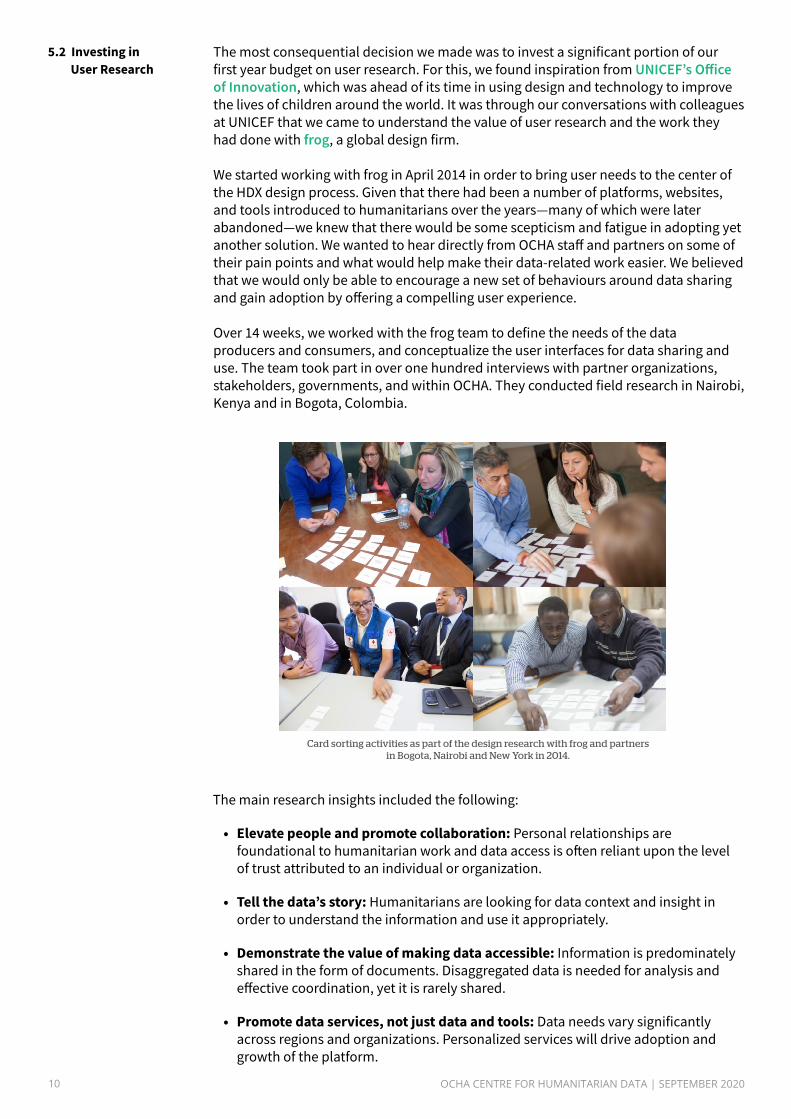
Over 14 weeks, we worked with the frog team to define the needs of the data producers and consumers, and conceptualize the user interfaces for data sharing and use. The team took part in over one hundred interviews with partner organizations, stakeholders, governments, and within OCHA. They conducted field research in Nairobi, Kenya and in Bogota, Colombia.
5.2 Investing in User Research
Card sorting activities as part of the design research with frog and partners in Bogota, Nairobi and New York in 2014.
The main research insights included the following:
• Elevate people and promote collaboration: Personal relationships are foundational to humanitarian work and data access is often reliant upon the level of trust attributed to an individual or organization.
• Tell the data’s story: Humanitarians are looking for data context and insight in order to understand the information and use it appropriately.
• Demonstrate the value of making data accessible: Information is predominately shared in the form of documents. Disaggregated data is needed for analysis and effective coordination, yet it is rarely shared.
• Promote data services, not just data and tools: Data needs vary significantly across regions and organizations. Personalized services will drive adoption and growth of the platform.
11 OCHA CENTRE FOR HUMANITARIAN DATA | SEPTEMBER 2020
The research team also established the design language for HDX that we are still using today. To inform this, they asked interviewees what words they would like to associate with the new platform. We were told that it should be practical, friendly, social, trusted and strategic. The design team went to work to develop the homepage, dataset pages and other key pages along the user journey. The aim was to not just create a ‘minimum viable product’ but what frog referred to as a ‘minimum loveable product’. In parallel, the technical team at frog helped us to define the sites’ information architecture, key pages, users flows, and common layouts.
As we launched HDX in Berlin in July 2014, the Ebola outbreak in West Africa was intensifying. By late August, the United Nations Mission for the Ebola Emergency Response contacted us to see if they could use HDX as the platform of record for their Ebola-related data. We understood that there was a significant responsibility in taking on this role and that the site was still untested. Nevertheless, we agreed to support the mission and the Ebola response became our top priority.
At the time, WHO was publishing daily situation reports in PDF format, which included a table for the Ebola cases and deaths in affected countries. Unfortunately, the PDF format meant that researchers and organizations could not easily incorporate the data into their own spreadsheets or databases. The HDX data team started to manually extract the data from these reports and add the figures to a machine-readable file that was shared on HDX with WHO as the source.
The Ebola cases and deaths data became the most popular dataset on the platform and quickly proved the value of open data as well as the need for a service to transform raw data into something more accessible. The New York Times used the data to create a visual that ran on their homepage and reached millions of readers.
Ebola Crisis Page
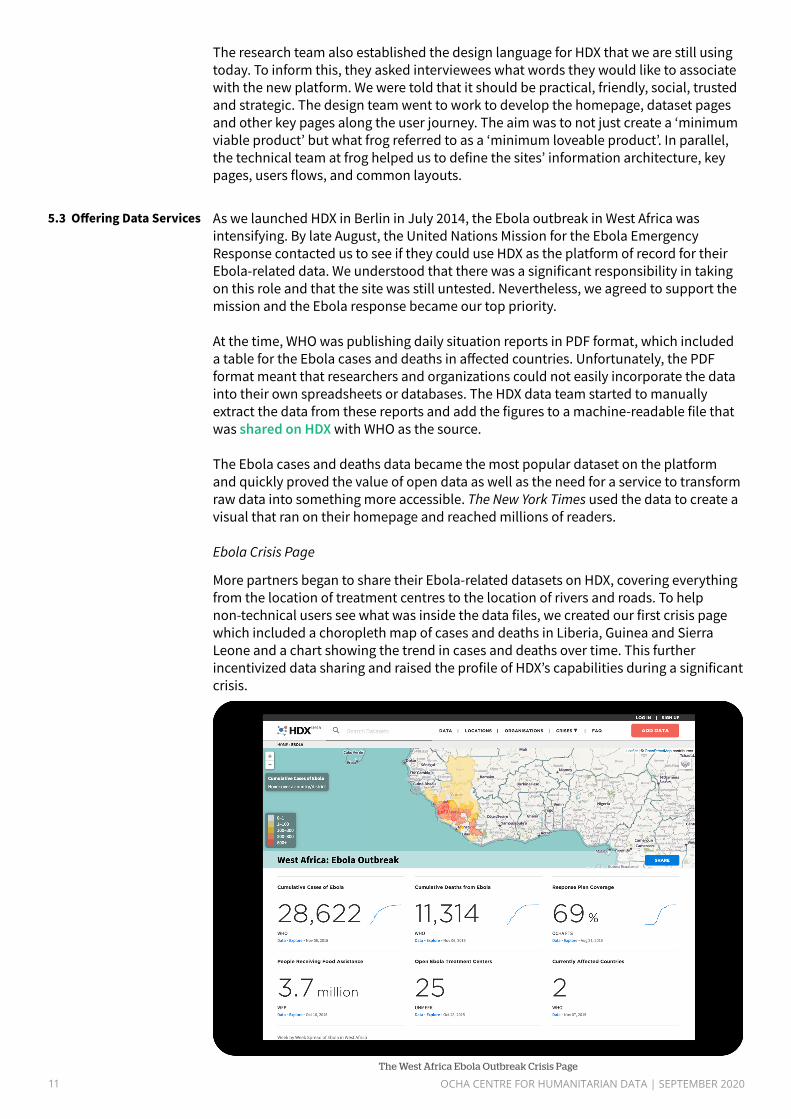
More partners began to share their Ebola-related datasets on HDX, covering everything from the location of treatment centres to the location of rivers and roads. To help non-technical users see what was inside the data files, we created our first crisis page which included a choropleth map of cases and deaths in Liberia, Guinea and Sierra Leone and a chart showing the trend in cases and deaths over time. This further incentivized data sharing and raised the profile of HDX’s capabilities during a significant crisis.
5.3 Offering Data Services
The West Africa Ebola Outbreak Crisis Page
12 OCHA CENTRE FOR HUMANITARIAN DATA | SEPTEMBER 2020
WFP Organization Page
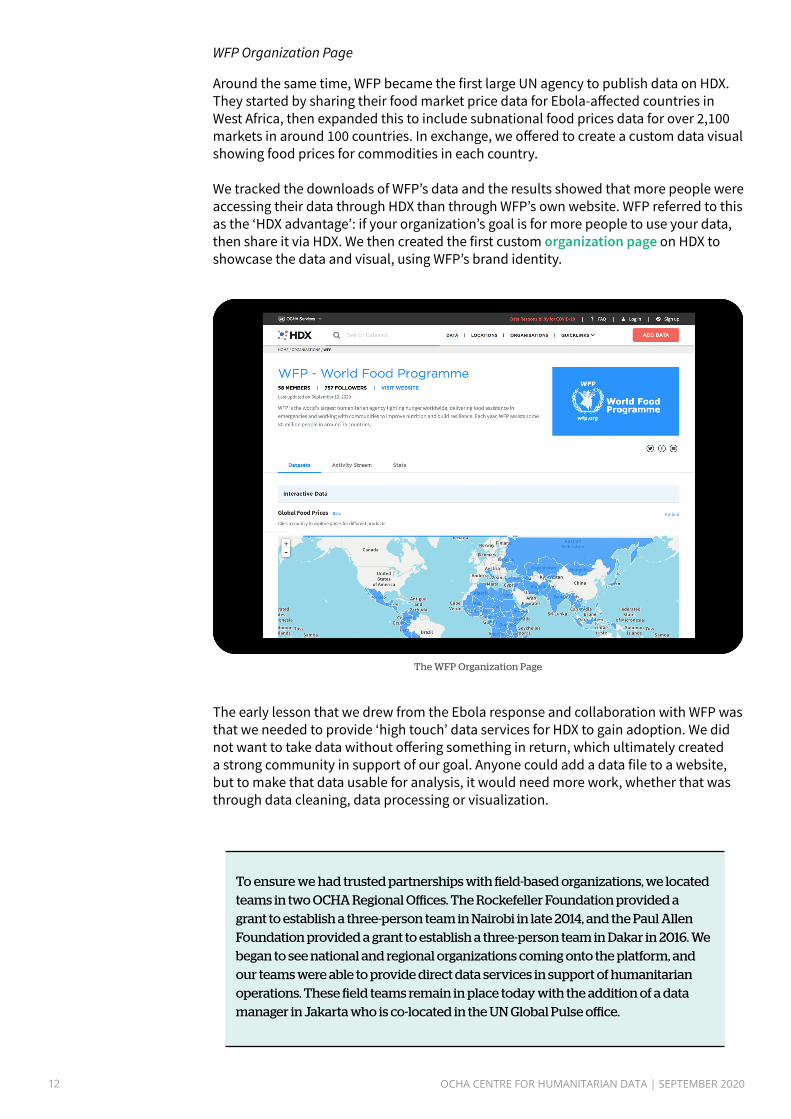
Around the same time, WFP became the first large UN agency to publish data on HDX. They started by sharing their food market price data for Ebola-affected countries in West Africa, then expanded this to include subnational food prices data for over 2,100 markets in around 100 countries. In exchange, we offered to create a custom data visual showing food prices for commodities in each country.
We tracked the downloads of WFP’s data and the results showed that more people were accessing their data through HDX than through WFP’s own website. WFP referred to this as the ‘HDX advantage’: if your organization’s goal is for more people to use your data, then share it via HDX. We then created the first custom organization page on HDX to showcase the data and visual, using WFP’s brand identity.
The WFP Organization Page
The early lesson that we drew from the Ebola response and collaboration with WFP was that we needed to provide ‘high touch’ data services for HDX to gain adoption. We did not want to take data without offering something in return, which ultimately created a strong community in support of our goal. Anyone could add a data file to a website, but to make that data usable for analysis, it would need more work, whether that was through data cleaning, data processing or visualization.
To ensure we had trusted partnerships with field-based organizations, we located teams in two OCHA Regional Offices. The Rockefeller Foundation provided a grant to establish a three-person team in Nairobi in late 2014, and the Paul Allen Foundation provided a grant to establish a three-person team in Dakar in 2016. We began to see national and regional organizations coming onto the platform, and our teams were able to provide direct data services in support of humanitarian operations. These field teams remain in place today with the addition of a data manager in Jakarta who is co-located in the UN Global Pulse office.
13 OCHA CENTRE FOR HUMANITARIAN DATA | SEPTEMBER 2020
As HDX gained more users and data, we began to think of ways to improve and extend the platform. This is a risky period for any project, where it can be easy to lose focus and squander resources. Fortunately, around that time, a World Bank colleague wisely advised us to ‘stick to your knitting’— to get better at what we were already good at, instead of expanding the scope of HDX.
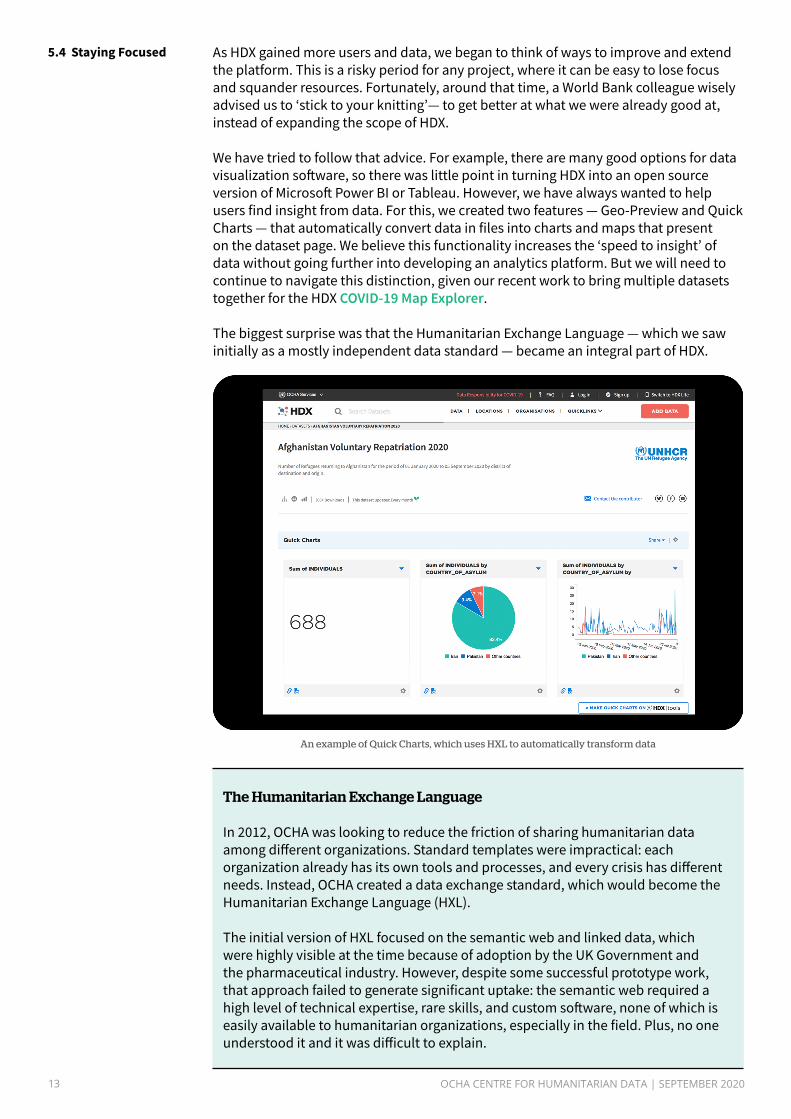
We have tried to follow that advice. For example, there are many good options for data visualization software, so there was little point in turning HDX into an open source version of Microsoft Power BI or Tableau. However, we have always wanted to help users find insight from data. For this, we created two features — Geo-Preview and Quick Charts — that automatically convert data in files into charts and maps that present on the dataset page. We believe this functionality increases the ‘speed to insight’ of data without going further into developing an analytics platform. But we will need to continue to navigate this distinction, given our recent work to bring multiple datasets together for the HDX COVID-19 Map Explorer.
The biggest surprise was that the Humanitarian Exchange Language — which we saw initially as a mostly independent data standard — became an integral part of HDX.
An example of Quick Charts, which uses HXL to automatically transform data
5.4 Staying Focused
The Humanitarian Exchange Language
In 2012, OCHA was looking to reduce the friction of sharing humanitarian data among different organizations. Standard templates were impractical: each organization already has its own tools and processes, and every crisis has different needs. Instead, OCHA created a data exchange standard, which would become the Humanitarian Exchange Language (HXL).
The initial version of HXL focused on the semantic web and linked data, which were highly visible at the time because of adoption by the UK Government and the pharmaceutical industry. However, despite some successful prototype work, that approach failed to generate significant uptake: the semantic web required a high level of technical expertise, rare skills, and custom software, none of which is easily available to humanitarian organizations, especially in the field. Plus, no one understood it and it was difficult to explain.
14 OCHA CENTRE FOR HUMANITARIAN DATA | SEPTEMBER 2020
6. HDX TODAY:KEY RESULTS
In 2015, we introduced Objectives and Key Results (OKRs) as a way to organize our work. Our team had grown to over twenty people spread across several continents. Inspired by Google, OKRs can help teams and individuals prioritize their work and learn from both success and failure. OKRs are both top-down and bottom-up with all team members committing to ambitious goals that are slightly out of reach. Progress is tracked quarterly.
We set five objectives for the HDX team in 2015 which have been mostly unchanged since:
1. Increase relevant data in HDX
2. Increase field use of HDX
3. Increase the number of datasets that have a corresponding visual
4. Increase awareness of HDX
5. Increase trust in HDX
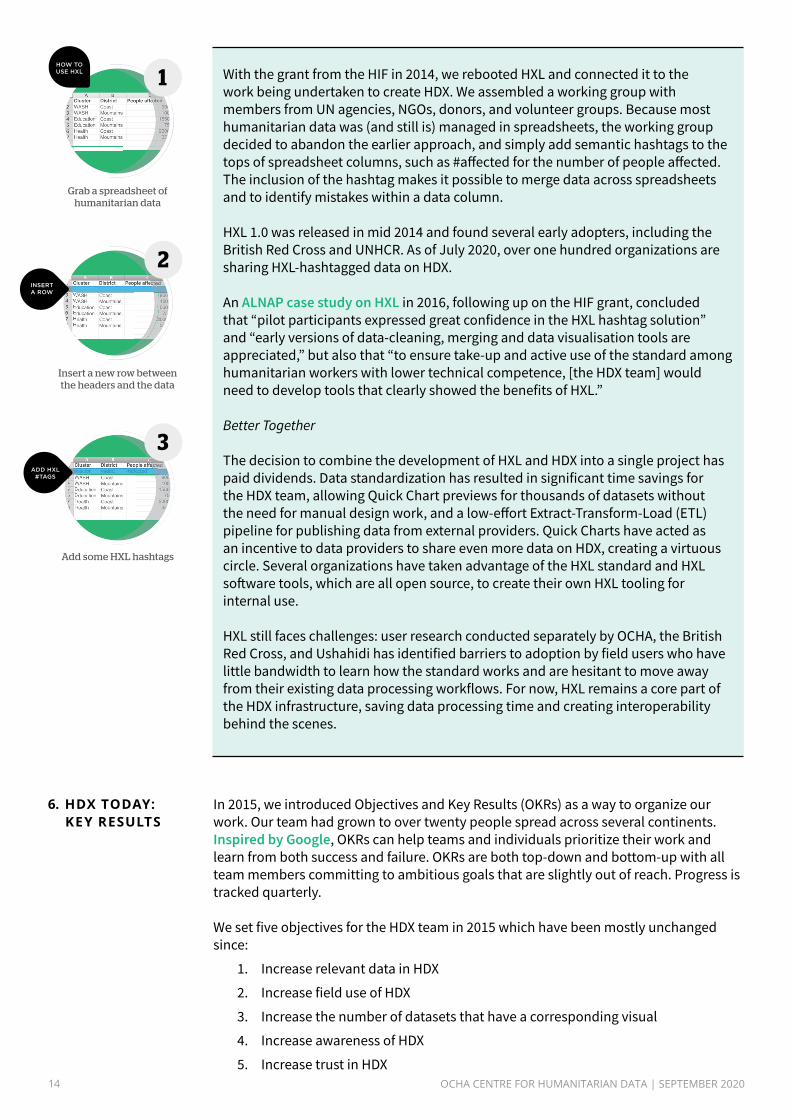
With the grant from the HIF in 2014, we rebooted HXL and connected it to the work being undertaken to create HDX. We assembled a working group with members from UN agencies, NGOs, donors, and volunteer groups. Because most humanitarian data was (and still is) managed in spreadsheets, the working group decided to abandon the earlier approach, and simply add semantic hashtags to the tops of spreadsheet columns, such as #affected for the number of people affected. The inclusion of the hashtag makes it possible to merge data across spreadsheets and to identify mistakes within a data column.
HXL 1.0 was released in mid 2014 and found several early adopters, including the British Red Cross and UNHCR. As of July 2020, over one hundred organizations are sharing HXL-hashtagged data on HDX.
An ALNAP case study on HXL in 2016, following up on the HIF grant, concluded that “pilot participants expressed great confidence in the HXL hashtag solution” and “early versions of data-cleaning, merging and data visualisation tools are appreciated,” but also that “to ensure take-up and active use of the standard among humanitarian workers with lower technical competence, [the HDX team] would need to develop tools that clearly showed the benefits of HXL.”
Better Together
The decision to combine the development of HXL and HDX into a single project has paid dividends. Data standardization has resulted in significant time savings for the HDX team, allowing Quick Chart previews for thousands of datasets without the need for manual design work, and a low-effort Extract-Transform-Load (ETL) pipeline for publishing data from external providers. Quick Charts have acted as an incentive to data providers to share even more data on HDX, creating a virtuous circle. Several organizations have taken advantage of the HXL standard and HXL software tools, which are all open source, to create their own HXL tooling for internal use.
HXL still faces challenges: user research conducted separately by OCHA, the British Red Cross, and Ushahidi has identified barriers to adoption by field users who have little bandwidth to learn how the standard works and are hesitant to move away from their existing data processing workflows. For now, HXL remains a core part of the HDX infrastructure, saving data processing time and creating interoperability behind the scenes.
Grab a spreadsheet of humanitarian data
Insert a new row between the headers and the data
Add some HXL hashtags
15 OCHA CENTRE FOR HUMANITARIAN DATA | SEPTEMBER 2020
Equally important to setting key results is having an easy way to measure them. We initially relied on Google Analytics for analyzing user behaviour, but in 2016 began using Mixpanel which allowed us to create more complex queries.
Mixpanel’s capability has also allowed us to add analytics data as a feature on the HDX platform: users can explore the number of visitors and downloads of top datasets on every organization page. Each quarter we share organization-specific analytics data with our top contributing organizations, which has proven to be a popular form of feedback helping them to justify their investment in data sharing to management.
There are three key quantitative metrics that the HDX team monitors closely: the number of organizations on HDX, the number of datasets, and the number of unique users. The charts below provide an overview of our progress for the six years from July 2014 to July 2020.
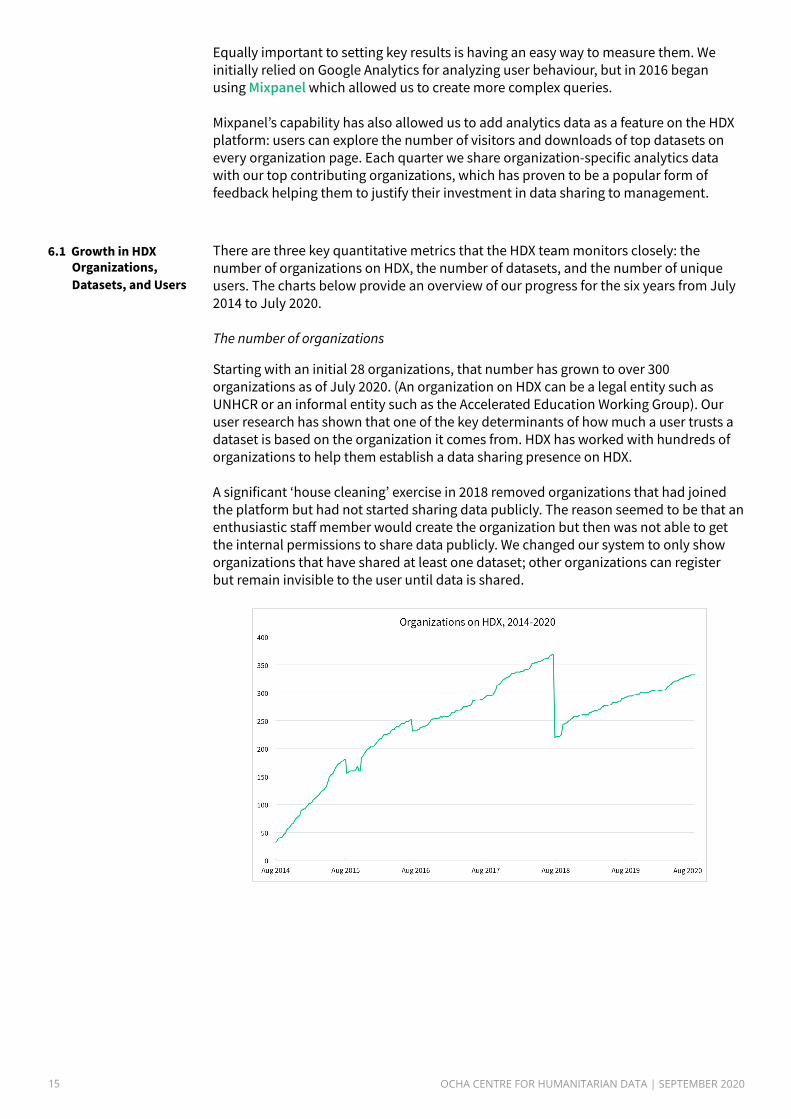
The number of organizations
Starting with an initial 28 organizations, that number has grown to over 300 organizations as of July 2020. (An organization on HDX can be a legal entity such as UNHCR or an informal entity such as the Accelerated Education Working Group). Our user research has shown that one of the key determinants of how much a user trusts a dataset is based on the organization it comes from. HDX has worked with hundreds of organizations to help them establish a data sharing presence on HDX.
A significant ‘house cleaning’ exercise in 2018 removed organizations that had joined the platform but had not started sharing data publicly. The reason seemed to be that an enthusiastic staff member would create the organization but then was not able to get the internal permissions to share data publicly. We changed our system to only show organizations that have shared at least one dataset; other organizations can register but remain invisible to the user until data is shared.
6.1 Growth in HDX Organizations, Datasets, and Users
16 OCHA CENTRE FOR HUMANITARIAN DATA | SEPTEMBER 2020
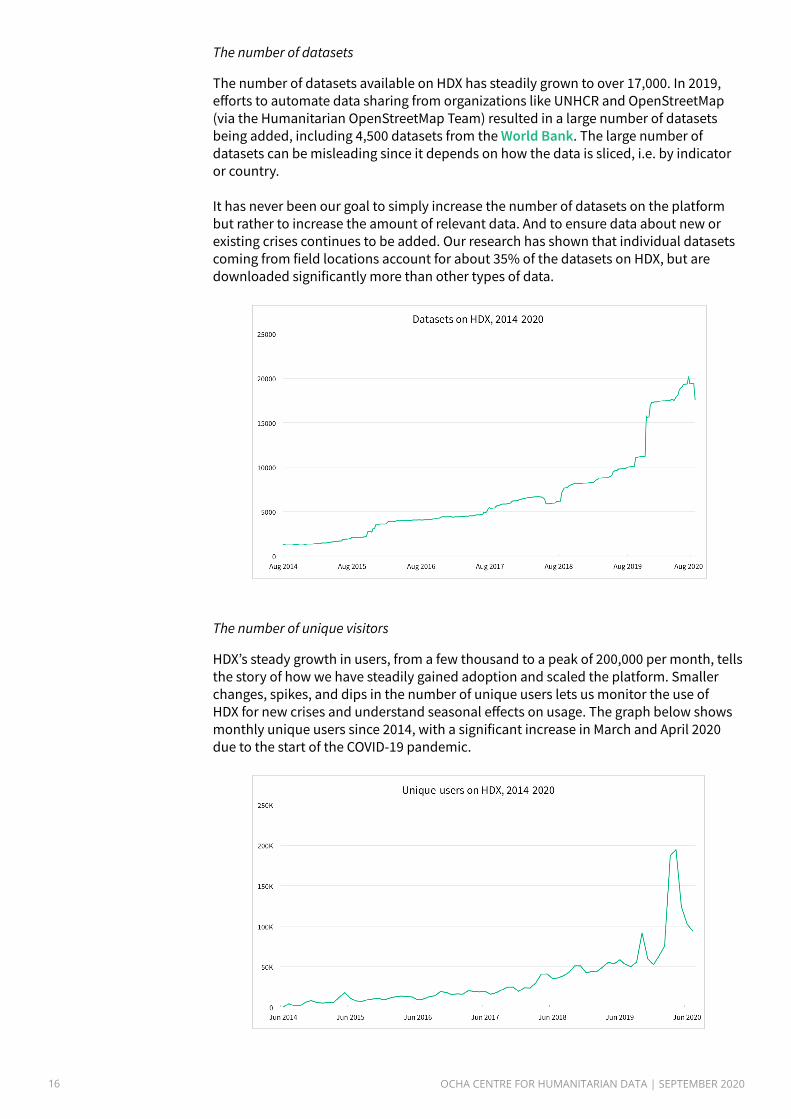
The number of datasets
The number of datasets available on HDX has steadily grown to over 17,000. In 2019, efforts to automate data sharing from organizations like UNHCR and OpenStreetMap (via the Humanitarian OpenStreetMap Team) resulted in a large number of datasets being added, including 4,500 datasets from the World Bank. The large number of datasets can be misleading since it depends on how the data is sliced, i.e. by indicator or country.
It has never been our goal to simply increase the number of datasets on the platform but rather to increase the amount of relevant data. And to ensure data about new or existing crises continues to be added. Our research has shown that individual datasets coming from field locations account for about 35% of the datasets on HDX, but are downloaded significantly more than other types of data.
The number of unique visitors
HDX’s steady growth in users, from a few thousand to a peak of 200,000 per month, tells the story of how we have steadily gained adoption and scaled the platform. Smaller changes, spikes, and dips in the number of unique users lets us monitor the use of HDX for new crises and understand seasonal effects on usage. The graph below shows monthly unique users since 2014, with a significant increase in March and April 2020 due to the start of the COVID-19 pandemic.
17 OCHA CENTRE FOR HUMANITARIAN DATA | SEPTEMBER 2020
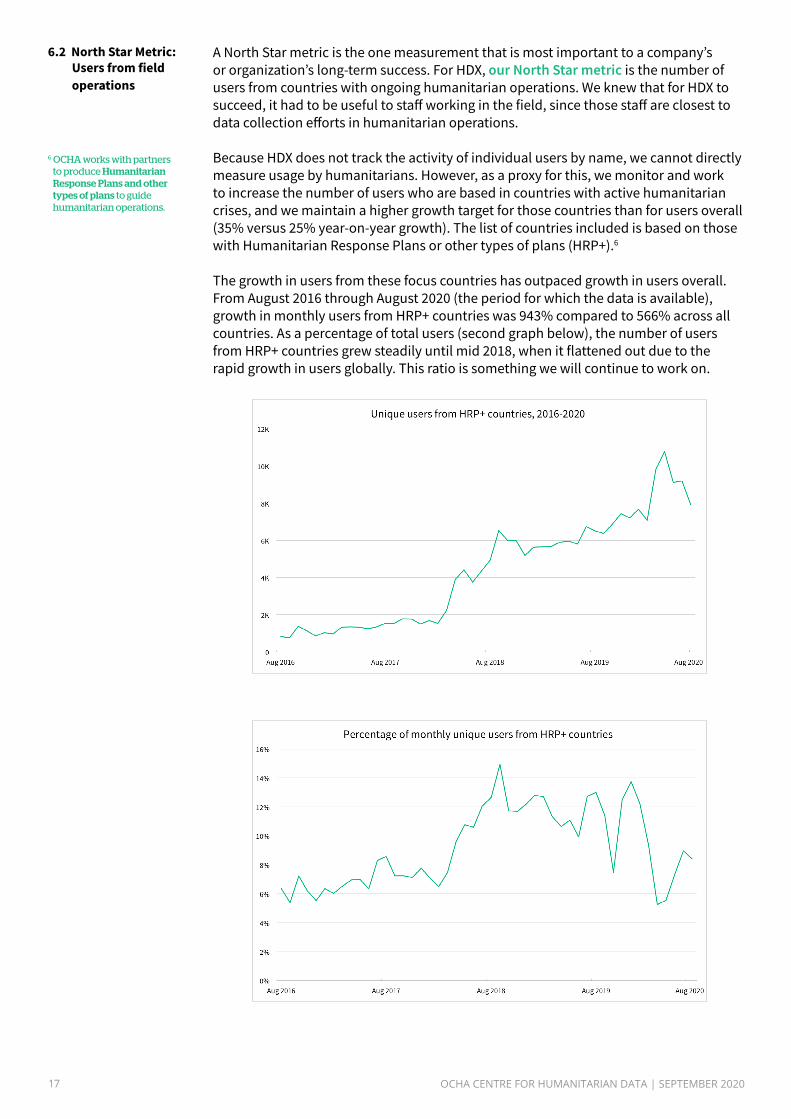
A North Star metric is the one measurement that is most important to a company’s or organization’s long-term success. For HDX, our North Star metric is the number of users from countries with ongoing humanitarian operations. We knew that for HDX to succeed, it had to be useful to staff working in the field, since those staff are closest to data collection efforts in humanitarian operations.
Because HDX does not track the activity of individual users by name, we cannot directly measure usage by humanitarians. However, as a proxy for this, we monitor and work to increase the number of users who are based in countries with active humanitarian crises, and we maintain a higher growth target for those countries than for users overall (35% versus 25% year-on-year growth). The list of countries included is based on those with Humanitarian Response Plans or other types of plans (HRP+).6
The growth in users from these focus countries has outpaced growth in users overall. From August 2016 through August 2020 (the period for which the data is available), growth in monthly users from HRP+ countries was 943% compared to 566% across all countries. As a percentage of total users (second graph below), the number of users from HRP+ countries grew steadily until mid 2018, when it flattened out due to the rapid growth in users globally. This ratio is something we will continue to work on.
6.2 North Star Metric: Users from field operations
6 OCHA works with partners to produce Humanitarian Response Plans and other types of plans to guide humanitarian operations.

18 OCHA CENTRE FOR HUMANITARIAN DATA | SEPTEMBER 2020
Another useful indicator of field use of HDX is the popularity of the Common Operational Datasets (CODs), which include standard subnational administrative divisions and baseline population data for each country. Before HDX was built, OCHA managed a catalogue of these datasets, which was migrated to HDX in 2015. CODs account for fewer than 3% of the datasets on HDX, but they are popular. At the beginning of 2020, 1 in 3 people who downloaded data on HDX downloaded a COD.
In the private sector, the cost per user is a way to estimate how much to charge for a service or subscription. For non-profits, it is a way to understand the level of investment needed over the course of the project or programme. The cost per user always starts high with significant upfront development costs and a small number of initial users, but that cost should go down.
The figure below illustrates that HDX’s average monthly cost per user has steadily decreased from 2014 until now. HDX was established in 2014 with an annual cost of approximately $2.4 million, which included $1.7 million project costs and the remainder in OCHA staff costs.
HDX operating costs have since decreased, falling most dramatically in 2017 when the Centre for Humanitarian Data was established. At that stage, HDX was absorbed into the overall costs of the Centre which includes additional workstreams for data responsibility, data literacy and predictive analytics. Staff and common costs are shared across the Centre’s workstreams. In 2020, the Centre budgeted approximately $1.7 million towards managing HDX.
An even bigger impact on the cost per user has been the growth of the HDX user base. While fixed costs have been stable, the number of unique users of the platform has grown to, on average, 100,000 per month by mid-2020. The combined effect of decreasing costs and increasing users has led to a significant drop in the monthly cost per user from $43.90 in 2014 to $1.30 by July 2020.
6.3 Cost per User
When HDX launched in 2014, only a handful of humanitarian organizations had dedicated websites and systems offering access to their data. Today, dozens of organizations do. This includes sophisticated sites such as WFP’s HungerMap and the International Federation of Red Cross and Red Crescent Societies’ GO platform. The increased investment in these organizational platforms has helped improve the quality and timeliness of the data shared on HDX and created a growing data ecosystem. It has also enabled a shift in the humanitarian sector towards more evidence-based decision making, although the dynamics of the data-to-decision-making continuum needs more investigation.
6.4 Connections in the Network
19 OCHA CENTRE FOR HUMANITARIAN DATA | SEPTEMBER 2020
In 2015, we developed a five-year vision for HDX. To be successful, we said that we required:
• A sustainable, diverse, multi-skilled team of highly motivated individuals who are geographically distributed but aligned around a common goal.
• An engaged community that believes in the need for HDX and wants to be part of the process of making it succeed.
• A supportive policy environment that encourages trust, quality, standards, access, sharing, and ease-of-use.
• Broadly adopted data standards for the interoperability (HXL) and quality (metadata) of humanitarian data.
• A data exchange platform that is easy-to-use, open, scalable, and supports data sharing throughout a global network of hosted data sources, and across the information lifecycle.
• Continuous development of products and services that demonstrate the value of shared data.
• Data literate practitioners, managers, leaders, and policy makers who are better able to use data.
• Multi-year funding to foster confidence, capacity, and cooperation among partners.
7. THE ROAD AHEAD
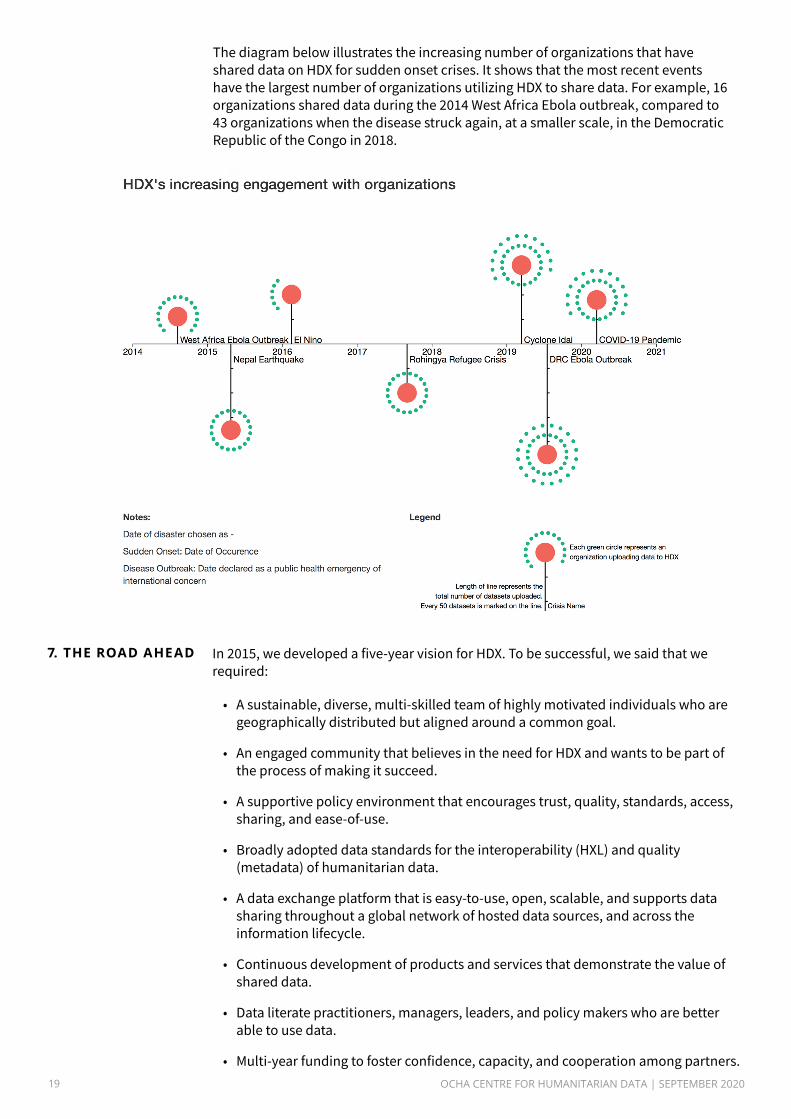
The diagram below illustrates the increasing number of organizations that have shared data on HDX for sudden onset crises. It shows that the most recent events have the largest number of organizations utilizing HDX to share data. For example, 16 organizations shared data during the 2014 West Africa Ebola outbreak, compared to 43 organizations when the disease struck again, at a smaller scale, in the Democratic Republic of the Congo in 2018.
20 OCHA CENTRE FOR HUMANITARIAN DATA | SEPTEMBER 2020
This list is as relevant today as it was in 2015 and we have made significant inroads towards turning the vision into a reality. What we began to see back then was that we need more than a data platform to advance data practices within the humanitarian sector. We also need humanitarians with the skills to use data and data policy frameworks to ensure we are not putting people’s lives at risk by making data available.
OCHA established the Centre for Humanitarian Data in The Hague in 2017 in order to take on these wider issues. Although the Centre manages HDX, it was the success of HDX that led to its creation. If HDX had not gained traction and exposed some of the deeper challenges with data in humanitarian operations, we would not have been able to attract investment for the ambitions inherent in creating an entity dedicated to humanitarian data. The Netherlands Ministry of Foreign Affairs provided foundational funding for the Centre in 2014 and renewed their commitment in 2020 for an additional three years.
Over the coming period, we will be focused on two areas for HDX: closing data gaps and ensuring sensitive data is managed responsibly.
Even with all of the gains our community has made with making data available, we still face critical data gaps. This has become even more evident — with COVID-19 pandemic, which has shown that subnational data on cases and deaths, comorbidities, vulnerabilities and gender disparities is missing in most countries with humanitarian operations.
We have created the HDX Data Grid as a way to measure data completeness across the humanitarian operations that we cover. The Data Grid divides the most important crisis data into six categories: affected people; coordination and context; food security and nutrition; geography and infrastructure; health and education; and population and socio-economy.7 Data is included in the Grid if it is subnational, in a commonly-used format, and up-to-date.
By mid-2020, HDX included Data Grids for 29 locations. The completeness of all Data Grids combined was 43 percent. That is, 43 percent of relevant, comprehensive data is available across 29 locations. If we add the data that is relevant but incomplete, the total is 72 percent. This leaves 28 percent of categories with data that does not meet the criteria or with no data at all. The Data Grids include an average of 20-30 datasets per location. Over the next three years, we aim to reach 80 percent data completeness through sustained advocacy and data sharing partnerships.
One of our most significant challenges with HDX is ensuring that sensitive or personal data is not exposed through the platform. As the saying goes, trust is hard to gain and easy to lose. We have made a concerted effort to maintain and build this trust by supporting data responsibility — the safe, ethical, and effective management of data — on HDX and within our community more broadly. We will continue to focus on this in the coming years.
While we have never allowed the sharing of personal data on HDX, we are careful to monitor every dataset added to the platform and flag sensitive, high-risk data to our contributors. This is generally related to survey or needs assessment data (i.e., microdata), which is the most valuable data produced in a crisis. To help ensure this data gets shared, we created HDX Connect which allows contributors to add just the metadata with the underlying data made available upon request. We also offer to assess the risk of re-identification of microdata through statistical disclosure control processes.
7.1 Closing Data Gaps
7 Learn more about the HDX Data Grids in our report on The State of Open Humanitarian Data.
7.2 Data Responsibility
21 OCHA CENTRE FOR HUMANITARIAN DATA | SEPTEMBER 2020
Although we may only find one dataset in several hundred with a high risk of re-identification, we find ourselves investing more of our time and technical resources in ensuring that this data is not exposed publicly. The HDX team will always prioritize ensuring that no high-risk data is shared over driving growth in datasets or users.
As HDX continues to scale and mature, its development will be guided by user feedback and our community of data contributors. While the majority of our time is now spent on maintenance — making sure things are working as they should be — we also want to optimize the experience in a number of ways, from quicker search results to more automated updates to the data and improved data ‘freshness’.
In May 2020, we ran a survey at the point of data download to better understand how people intend to use data from HDX and what type of entity they were affiliated with. We were trying to measure the derived value of the data, rather than just access to it. Over one thousand people — from academia, governments, international organizations, the media, NGOs and the private sector — responded to the survey over a two-week period. The results were as expected: people use data to do research, perform analysis, create maps, develop reports, validate models or for a math project, as one 14 year-old boy told us.
We also heard the following from respondents, with the type of entity they said they work for in parentheses:
“I rely on HDX heavily for analysis.” (government)
“I always refer to HDX to search for the latest administrative and health district boundaries.” (international organization)
“HDX is a valuable resource, fundamental for NGOs and those parties engaged in understanding conflict.” (international NGO)
“The datasets are very effective in capturing the IDP [internally displaced people] numbers and sites in Somalia.” (local NGO)
“The data has been very useful with understanding the amount of infrastructure and population at risk from sea level rise and flooding.” (academia)
“Fantastic. I love it. But I would like to see more real time data.” (media)
“Long life to HDX!” (NGO)
While the survey was encouraging, it did not help us to understand how a service like HDX and the products it supports leads to better decisions or moves us beyond efficiency and into a more effective humanitarian system. We know that better data is needed but it is not sufficient. We also need to look at how data is used. This is where the next set of humanitarian innovations can come in, moving beyond platforms and tools for data collection and sharing to machine learning and predictive modeling, an area that the Centre for Humanitarian Data is exploring.
Nevertheless, even as donor interest shifts to exciting new areas, it is critical that HDX and our data peers remain resourced. While we believe that predictive analytics has the potential to improve how response happens, models can only work based on good data used by skilled staff in an ethical way: they stand on the shoulders of services like HDX.
OCHA CENTRE FOR HUMANITARIAN DATA | SEPTEMBER 202021
7.3 “Long Life to HDX!”