he challenges of metrics in transit security management · the challenges of metrics in transit...
TRANSCRIPT
THE CHALLENGES OF METRICS IN TRANSIT SECURITY MANAGEMENT
Julie Schneider, CPP
Milwaukee County Transit System
Manager of Security and Street Operations
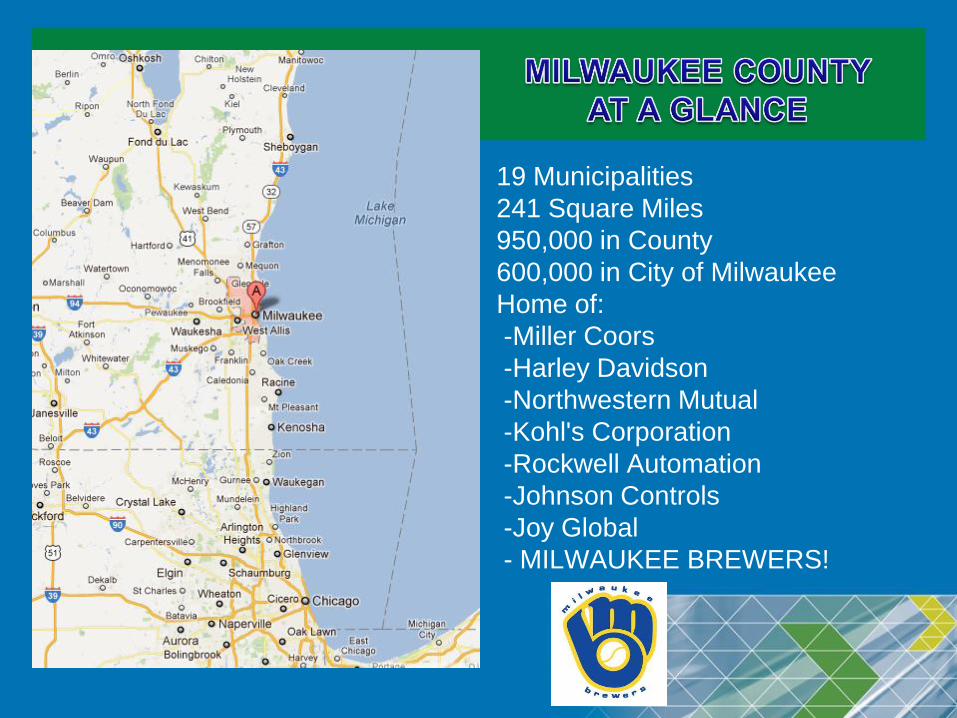
19 Municipalities
241 Square Miles
950,000 in County
600,000 in City of Milwaukee
Home of:
-Miller Coors
-Harley Davidson
-Northwestern Mutual
-Kohl's Corporation
-Rockwell Automation
-Johnson Controls
-Joy Global
- MILWAUKEE BREWERS!
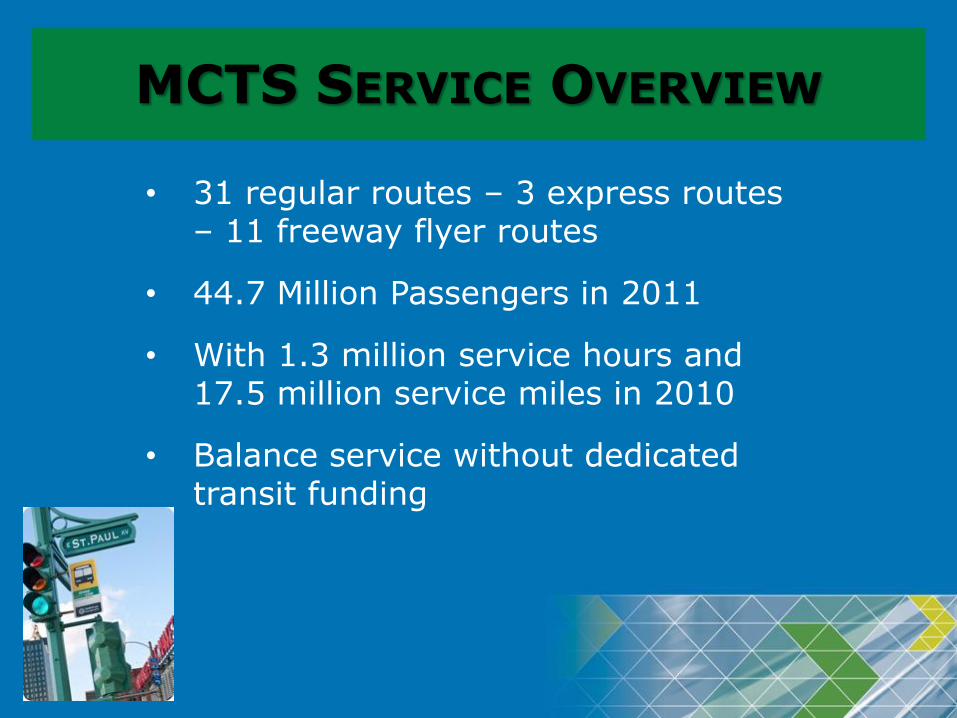
MCTS SERVICE OVERVIEW
• 31 regular routes – 3 express routes – 11 freeway flyer routes
• 44.7 Million Passengers in 2011
• With 1.3 million service hours and 17.5 million service miles in 2010
• Balance service without dedicated transit funding

MCTS SECURITY TEAM OVERVIEW
• Unarmed Contract Security Provider
• 848 weekly hours of service
• 60% of time riding buses
• On site management of team
• Good Law Enforcement Relationships
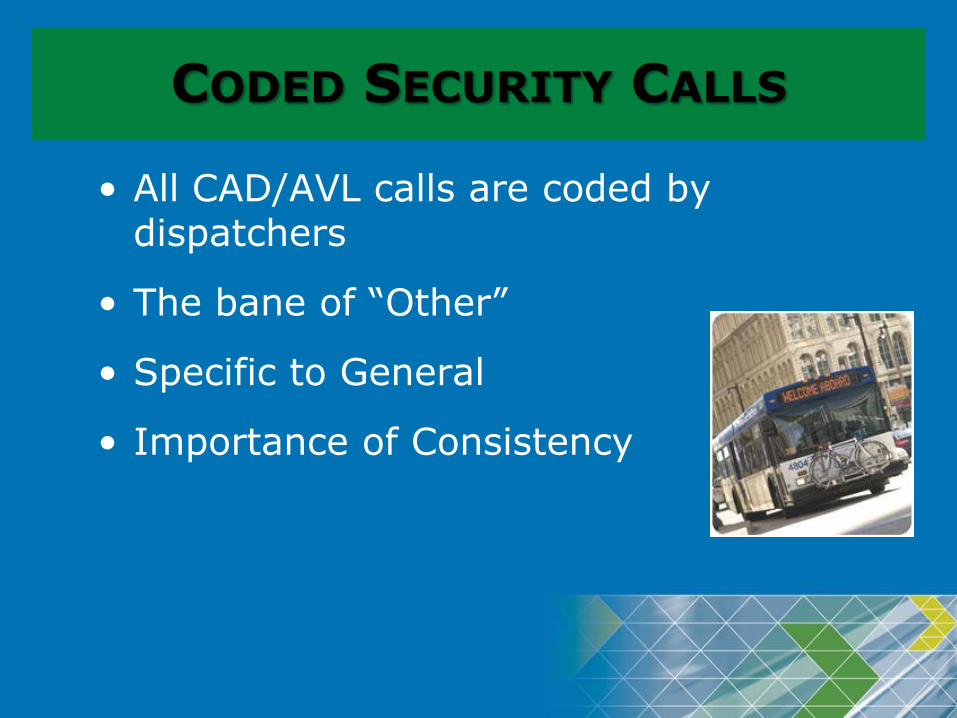
CODED SECURITY CALLS
• All CAD/AVL calls are coded by dispatchers
• The bane of “Other”
• Specific to General
• Importance of Consistency
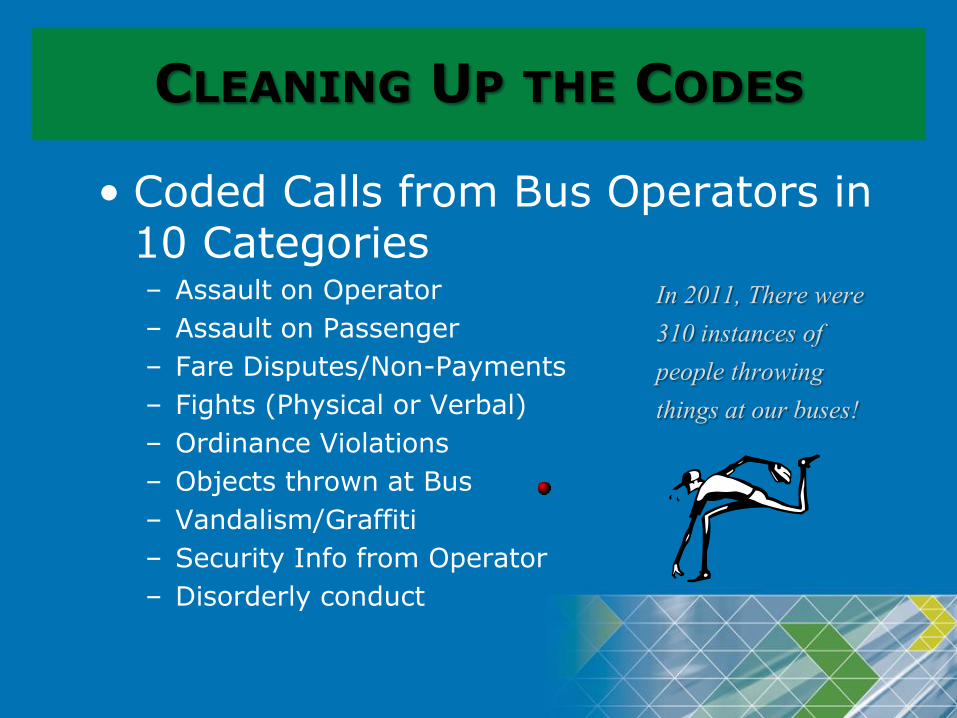
CLEANING UP THE CODES
• Coded Calls from Bus Operators in 10 Categories – Assault on Operator
– Assault on Passenger
– Fare Disputes/Non-Payments
– Fights (Physical or Verbal)
– Ordinance Violations
– Objects thrown at Bus
– Vandalism/Graffiti
– Security Info from Operator
– Disorderly conduct
In 2011, There were
310 instances of
people throwing
things at our buses!
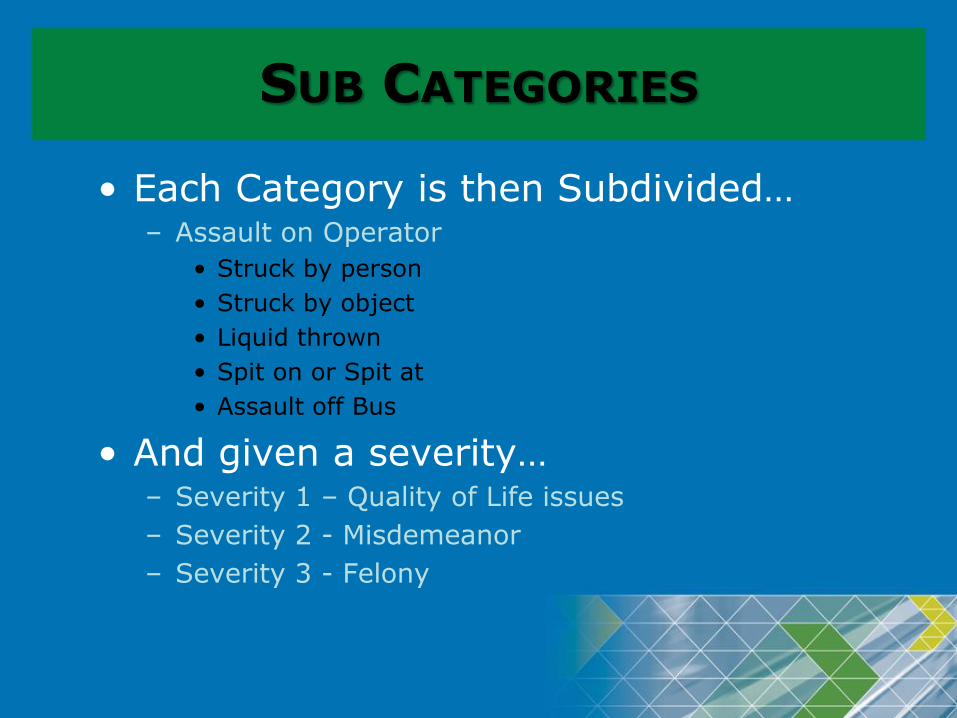
SUB CATEGORIES
• Each Category is then Subdivided… – Assault on Operator
• Struck by person
• Struck by object
• Liquid thrown
• Spit on or Spit at
• Assault off Bus
• And given a severity… – Severity 1 – Quality of Life issues
– Severity 2 - Misdemeanor
– Severity 3 - Felony

SO AT A GLANCE…
0
5
10
15
20
25
30
35
Jan Feb Mar Apr May Jun Jul Aug Sep Oct Nov Dec
2011 High Severity Incidents w/o Transfer Thefts

SO WE CAN AT A GLANCE…

BUT WHAT DOES THIS MEAN?
• Rely on Operators to Call in Issues
• Miscoding by Dispatchers
• What are the other Contributing Factors?
– City Population
– Crime Rate
– Ridership
– PBH?
– Operator Courtesy or Training
• How do we Qualify the Numbers?


HOW CAN WE COMPARE?
• NTD is not a comprehensive or reliable tool
• OSHA is able to compare the “safety” of like industries based on lost time injury or illness rates by doing the following:
(Number of injuries and illnesses X 200,000) / Employee hours worked = Incidence rate

SO WHERE DO WE GO FROM HERE?
• Can Transit do the same for Cities of like population and modes?
– Number of Security Incidents
– Hours
– Passenger volume
– Crime rate
– Police force vs. Security