he reference method - european commissionec.europa.eu/environment/air/pdf/finalwgreporten.pdfec...
TRANSCRIPT

EC Working Group on Particulate Matter Draft Final Report 22,January,200214,February,20011
EC WORKING GROUP ON PARTICULATE MATTER
A REPORT
ON
GUIDANCE TO MEMBER STATES
ON PM10 MONITORING AND INTERCOMPARISONS
WITH THE REFERENCE METHOD
Martin WilliamsPeter BruckmannCo-Chairmen

EC Working Group on Particulate Matter Draft Final Report 22,January,200214,February,20012
EC WORKING GROUP ON PARTICULATE MATTER
GUIDANCE TO MEMBER STATES ON PM10 MONITORING ANDINTERCOMPARISONS WITH THE REFERENCE METHOD
EXECUTIVE SUMMARY
Directive 1999/30/EC, the first Daughter Directive of the Air Quality FrameworkDirective 1996/62/EC, requires Member States to implement programmes monitoringambient air particulate matter from 19 July 2001, and report data over one calendar yearfrom those programmes to the Commission and make information available to thepublic. The Directive sets out the methodologies and techniques for measuring dataeither through reference method instrumentation or the use of instruments for whichequivalence to a reference instrument can be demonstrated.
Workshops on Particulate Matter Monitoring in London in October 1999 and Venice,June 2000, identified that whilst many Member States are carrying out the necessaryprogrammes some will not have made sufficient progress to achieve this legalrequirement by the appropriate dates. This was a special problem for Member Statesusing continuous, automatic instruments and those who have only recently startedprogrammes and will have insufficient data on which to make full intercomparison andthus determine equivalence factors.
There is a certain conflict regarding measurement methods within Directive 1999/30/EC.Whilst the Directive requires Member States to use non-automatic methods formonitoring, there is also the requirement to provide information to the public on a dailybasis which requires automatic monitoring.
Therefore, The European Commission (DG Environment) reconvened the WorkingGroup on Particulate Matter, with its original Member States and other members, tosummarise progress by Member States so far and determine whether it would bepossible to draft guidance and advice on the methodology for demonstrating equivalencebetween Reference Method and other methods, under Directive 1999/30/EC. TheWorking Group was also asked to consider guidance on monitoring and reportingexceedences caused by natural events.
The Terms of Reference for the Group were:
� To obtain information from Member States about work carried out to compare thedifferent methods for measuring particulate matter and to summarise the results.
� To draft advice on demonstrating equivalence with the aim of helping MemberStates fulfil the requirements of Directive 1999/30/EC.
� To advise on any difficulties and, if necessary, to suggest practical solutions duringthe first stage of implementation of Directive 1999/30/EC.
� To draft recommendations for the development of correction factors or correctionequations which may be applied to data obtained by measurement methods, for

EC Working Group on Particulate Matter Draft Final Report 22,January,200214,February,20013
PM10, other than the reference method set out in Directive 1999/30/EC in order toproduce equivalent results.
� To draft recommendations in respect of default factors which might be applied byMember States who have not completed intercomparison tests in time forimplementation of the Directive.
� The Group should also consider whether it is advisable to draft advice ondemonstrating that exceedences of limit values for PM10 are due to natural events,and if so, whether it is feasible to do so within the two planned meetings. It shouldbe noted that the Venice Workshop agreed that results presented by Spain and theUK were sufficient to demonstrate the influence of long range transport, and that thiswork will be published.
Following its first meeting in September 2000 the Working Group called for data onmeasurement and monitoring programmes from all Member States, which it thenconsidered at its meeting in November 2000. The Working Group set out a three tieredapproach:
Stage 1: Member States use the reference methods specified in the Directive. However,this will cause disproportionate efforts to fulfil the obligation of providing informationto the public, updated on a daily basis, which would be best served by automaticmonitorsStage 2 The (manual) reference method is, therefore, unlikely to be used at all sites. Tofulfil the reporting requirements of the directive, Member States may wish to usecontinuous monitors. In this case, they have either to use a monitor which has alreadybeen demonstrated to be equivalent to the reference method, or to determine equivalenceto the reference method or to establish a consistent relationship, by carrying out theirintercomparison measurements. The Commission has asked CEN to prepare guidanceon demonstrating equivalence. This document provides "best practice" guidance for useas an interim solution until advice from CEN is available. Finally, Member States haveto obtain bilateral agreement with the Commission.Stage 3: If Stage 1 is not adopted and Stage 2 has not been finished a Member State can,as an interim solution only, use default factors/equations to convert data fromcontinuous instruments for the purposes of reporting under Directive 1999/30/EC. It isstressed that this is an interim arrangement, and that Member States should carry outtheir own inter-comparison exercises as soon as possible.
At the start of its work, the Working Group requested data from those Member Stateswho were already carrying out their own intercomparison exercises. The WorkingGroup analysed all available appropriate data and concluded that a single default factorof 1.3 could be applied to data reporting both daily averages and annual means fromeither TEOM or β-attenuation instruments. This default factor was chosen to be on thesafe side for annual or seasonal means. The Working Group agreed that whilst in theirview, use of this correction factor by Member States should be acceptable to theCommission as an interim approach there was an over-riding legal responsibility onMember States to demonstrate equivalence or to establish a constant relationshipbetween the reference method and any other method they choose to use, as set out inStage 2 above.

EC Working Group on Particulate Matter Draft Final Report 22,January,200214,February,20014
The Working Group suggests an interim approach since without it there may be hardlyany data or public information available on particulate matter in the early stages ofimplementation of the Directive. It is vital that the public, the Member States and theCommission have as much information as possible on the likely magnitude of problemsand on trends. It is stressed that when data are reported it must always be clear whetherthe data were obtained by using the reference method, by using a method for whichequivalence has been shown, by using a correction factor which has been properlydemonstrated to be acceptable, or by the interim solution of applying a default correctionfactor to data from an existing instrument.
The Group also determined some general principles by which Member States canidentify particulate exceedences which result from natural events, and providejustification to the Commission that a natural event was the source and origin of theexceedence.
The Working Group remit was very specific and was designed to produce a pragmaticworking solution to a relatively short term problem. The Group recognised thereforethat while the Report should be technically acceptable, it was not appropriate to producea report which aimed at complete scientific rigour. There is still much work underwayin the development of measurement methods for particles and this report should be seenas an initial response to an immediate problem. It will be necessary to revisit theseissues as our scientific understanding develops and as CEN undertakes further work onmonitoring particulate matter and on demonstrating equivalence. This will be importantfor review of the implementation of Directive 1999/30 in 2003 .
EC Working Group on Particulate Matter Draft Final Report 22,January,200214,February,20015
TABLE OF CONTENTS
TITLE Page No
Executive Summary 2
Chapter 1. Introduction and background 7
Chapter 2. Legal Considerations 9
Chapter 3. The Reference Methods 11
Chapter 4. Member States intercomparison measurements ofcontinuous instruments with the reference method:A Structured Approach
13
Chapter 5. Default Correction Factors: Analysis Working Group Conclusions
16
23
Chapter 6. Natural Events 24
Annex A. Membership of the Working Group 32
Annex B Terms of Reference and Time Table 33
Annex C Interpolation of Seasonal Correction Factors/Equations
34
Annex D Data Collection questionnaire 36
Annex E Data Sets provided by Member States 39
References 72

EC Working Group on Particulate Matter Draft Final Report 22,January,200214,February,20016
1. INTRODUCTION AND BACKGROUND
The Air Quality Framework Directive 1996/62/EC(1) establishes a framework underwhich the EU will set limit values or target values for specified ambient air pollutants.These values would be set out in subsequent Daughter Directives; Directive1999/30/EC(2) is the first such Daughter Directive and addresses four pollutants, one ofwhich is particulate matter.
Directive 99/30/EC sets out the methodology for assessment of PM10 concentrations byuse of a reference method for sampling and measurement, as described in CEN StandardEN12341(3). At the same time, the Directive adopts an approach to PM10 measurementwhich has been used for other pollutants whereby Member States may use any othercandidate instruments or techniques which the Member State can demonstrate giveresults equivalent to the reference method, or display a consistent relationship to thereference method.
At the meeting of the Air Quality Steering Group on 3/4 July 2000, DG Environmentreported briefly on the Venice Workshop on Monitoring Particulate Matter(4), organisedfor Member States to report progress towards implementing the monitoring requirementsfor PM set out in Directive 1999/30/EC. An earlier Workshop in London, 13/14October 1999, heard presentations from many Member States on their progress onmeasurement methods, other than reference methods, to implement the Directive1999/30/EC.
It was clear from both Workshops that many Member States were undertakingconsiderable programmes of work on intercomparison of measurement methods forPM10 with a view to determining whether methods, other than the reference method setout in Directive 1999/30/EC, can be used. There was also much useful work being doneon measurement methods for PM2.5.
At the same time a number of problems were identified at the Venice Workshop.
• Firstly, most non-gravimetric methods in use at present tend not to produce resultsequivalent to the reference method.
• Secondly, there was no emerging consensus on whether correction factors, orcorrection equations, could be developed for non-gravimetric methods and if theywere applied, whether corrections should be universal or site specific.
• Thirdly, some Member States may not have completed their intercomparison workbefore the date on which they should begin monitoring PM10 and PM2.5 underDirective 1999/30/EC.
Clearly these problems must be solved. There are promising developments within someMember States and from manufacturers. But in the meantime there is a danger thatalmost no data and public information will be available in the crucial early stages ofimplementation of the Directive.
• Finally, whilst the Directive acknowledges that exceedences in particulate matterconcentrations could be due to natural events it requires Member States to reportsuch exceedences and to justify their conclusion as to the cause of such exceedences.

EC Working Group on Particulate Matter Draft Final Report 22,January,200214,February,20017
Therefore, the Commission proposed that the Working Group on Particulate Mattershould reconvene to summarise progress so far and determine whether it would bepossible to draft guidance and advice for Member States on particle monitoring underDirective 1999/30/EC in order that useable data should be available in the short term.As with the previous Group the Commission asked Germany and United Kingdom toco-chair the Working Group. Membership of the Working Group is given in Annex A.
The Commission made clear it was essential that the Working Group received as muchinformation as possible from all Member States who could provide it to the Group. Inaddition, technical experts from each country and from other interested parties shouldhave the opportunity to discuss any draft guidance in depth. Lastly, the Commissionconsidered that the Working Group�s members should not have a commercial or similarinterest in any particular type of monitoring equipment.
To meet these objectives, the Commission proposed that the Group should prepare adraft report for discussion in detail with all interested stakeholders at a further Workshopon PM Monitoring, prior to submission to the Air Quality Steering Group in February2001.
The Working Group was asked to provide the guidance for those Member States usingmeasurement methods other than the reference method where these have not beendemonstrated to produce results equivalent to the reference method, and was also askedto consider guidance for monitoring and reporting Natural Events, as defined inDirective 1999/30/EC.
The Terms of Reference and Timetable for the Working Group, were agreed at the AirQuality Steering Group meeting on 11/12 September 2000. They are set out in AnnexB.
This Report aims to assist Member States by providing guidance on how best they mightmeet the legal obligations under Directive 1999/30/EC to measure concentrations ofPM10 in ambient air by common methods in order to make information on thoseconcentrations readily available to the Commission, the public and other appropriateorganisations.
The Working Group remit was very specific and was designed to produce a pragmaticinterim working solution to a relatively short term problem. The Group recognisedtherefore that while the Report should be technically acceptable, it was not appropriateto produce a report which aimed at complete scientific rigour. There is still much workunderway in the development of measurement methods for particles and this reportshould be seen as an initial response to an immediate problem. It will be necessary torevisit these issues as our scientific understanding develops and as CEN undertakesfurther work on monitoring particulate matter and on demonstrating equivalence. Thiswill be important for review of the implementation of Directive 1999/30 in 2003 .

EC Working Group on Particulate Matter Draft Final Report 22,January,200214,February,20018
2. LEGAL CONSIDERATIONS
The objectives of Directive 1999/30/EC are described in Article 1 of the Directive.They include the need to assess concentrations of the four pollutants, covered by theDaughter Directive on the basis of common methods and criteria, and ensure thatadequate information on the concentration of each pollutant is made available to thepublic.
Specifically, Article 5 sets out the need for Member States to take measures necessary toensure that concentrations of PM10 in ambient air do not exceed the limit values laiddown elsewhere in that Directive. The same Article goes further to describe that wherelimit values for PM10 are exceeded owing to concentrations of PM10 in ambient air dueto natural events, which result in concentrations significantly in excess of normalsources, Member States shall inform the Commission and provide justification todemonstrate that such exceedences are due to natural events.
In addition, Article 8 sets out the requirements that Member States shall ensure up-to-date information is made available to the public as well as other appropriateorganisations on ambient concentrations of particulate matter, updated on at least a dailybasis.
From 19 July 2001 Member States must employ measurement programmes which meetthe requirements of Directive, requiring them to report information on exceedences oflimit values for PM10, within 9 months of the end of each calendar year and make thatinformation available to the public. Thus, whilst 19 July is the mandatory date forcommencement of monitoring and measurement, such a programme would only provide5 month�s data within the calendar year. Consequently, the Commission encouragedMember States to begin monitoring on 1 January 2001 in order to meet the requirementfor reporting one calendar year�s data within 9 months of the end of 2001.
Member States who have been using EN12341 reference method instruments, orcandidate instruments alongside reference instruments, for a reasonable period of timemay be in a position to meet their obligations for reporting data and making it widelyavailable. Explanations of what constitutes a reasonable period of time are discussed inChapter 3.
The problems identified at the Venice Workshop, and which the Working Group wereasked to address, relate mainly to those Member States who have not started equivalencemonitoring or who have only begun monitoring and will not have sufficient data forproper comparison to a reference method. These Member States will be unable to reportratified data to the Commission in a manner which meet the needs of the Directive, norwill they be able to make information available to the public.
There is a further point that Annex IX of Directive 1999/30/EC states that the referencemethod for sampling and measurement of PM10 is based on gravimetric techniques.This is a time consuming procedure, and potentially more expensive than the use ofcontinuous, automatic instruments. Thus, whilst continuous instruments offer the betteradvantage for reporting updated information to the public on daily means, as requiredunder Article 8 of the Directive, they are inconsistent with Annex IX. Therefore, theWorking Group was also asked to address this inconsistency.

EC Working Group on Particulate Matter Draft Final Report 22,January,200214,February,20019
The Working Group stress that their Report has the status of guidance. As such, it is notmandatory but has been adopted by the Air Quality Steering and if Member Statesadopt the approaches recommended by the Working Group, that should in the opinionof the Group be acceptable to the Commission. If Member States choose not to followthe recommendations of the Working Group they will have to justify their approach anddemonstrate its validity to the Commission.
In addition, and because Member States have used instruments they feel best fitted totheir purposes, this Report uses data acquired from a variety of instruments. It isstressed that the inclusion of any instrument or technique for measuring ambientsuspended particulate matter, other than reference instruments, in the data set does notimply endorsement of that instrument by either the Commission or the Working Group.The inclusion of a particular instrument or manufacturer is not an acceptance by theCommission that the instrument meets criteria for candidate equivalence.
It is also worth noting that whilst the Directive states that mass concentrations of thegaseous pollutants should be referenced to 200C and 101.3kPa, there is no such explicitstatement for the particulate pollutants PM10 or lead. The issue was discussed at the AirQuality Steering Group where it was agreed that the interpretation of the Directive onthis point was that measurements should be made, and reported, at ambient temperaturesand pressure, rather than at 200C.

EC Working Group on Particulate Matter Draft Final Report 22,January,200214,February,200110
3. THE REFERENCE METHODS
Directive 1999/30/EC cites European Standard EN12341 for details on the referencemethod for sampling and measurement of PM10. This Standard also specifies a testprotocol for comparing results from a candidate PM10 sampler with a reference PM10sampler in a field test. Award of reference equivalence applies only to the range ofconditions under which the field tests were conducted. Therefore, by carrying out thefield tests covering a wide range of relevant ambient parameters it is assumed thatequivalence holds good for prevailing conditions within European countries.
EN12341 states that the reference measuring methodology shall consist of a PM10sampling inlet directly coupled with a filter substrate and a regulated flow devicefollowed by gravimetric mass determination of that collected particulate matter.
The Standard refers to three devices which might be used:
� Low Volume system: the LVS-PM-10 sampler� High Volume system: the HVS PM-10 sampler� Superhigh Volume System: the WRAC-PM10 sampler (Wide Range
Aerosol Classifier)
Precise details of the methodology are not discussed here and the reader is referred to theoriginal EN12341 document for further information.
The WRAC system is usually referred to as the primary Standard, and the HVS and LVSas field standards. However, no distinction is made between these three methods for thepurposes of Working Group�s Report. Thus, the term �reference method�, used in thisReport, could refer to any of these three methods.
It should be noted that EN12341 also makes clear that any method based on the sameprinciple as the three methods identified above, that is a PM10 inlet directly coupled to afilter substrate and the regulated flow control followed by gravimetric massdetermination of the collected PM, will be recognised as �EN12341 equivalent�.
EN12341 also describes a range of factors which must be met in order to determinereference equivalence of candidate instruments. These factors include descriptions offield test sites, variety of aerosol composition, differing geographical locations, a rangeof seasons and meteorological conditions, data treatment and handing, as well as qualityassurance and quality control procedures for filter weighing and statistical analysis.
Again the reader is referred to EN12341 for the full description of test procedures.
It should be noted that EN12341 deals with candidate reference methods in itsdiscussion of equivalence and does not deal with equivalence of commonly employedautomated systems such as β-attenuation and oscillating mass balance methods. The useof automated methods alongside reference instruments under conditions and parametersdescribed in the Directive 1999/30/EC and EN12341 will provide a relationship toreference methods through intercomparison measurements.

EC Working Group on Particulate Matter Draft Final Report 22,January,200214,February,200111
However, it is important to note that CEN has recently begun to address the question ofprocedures to demonstrate equivalence between the reference methods described inEN12341 and candidate methods which Member States may wish to use in the ambientmonitoring. In advance of this work being finalised (which may take more than oneyear) this Report should serve as guidance.

EC Working Group on Particulate Matter Draft Final Report 22,January,200214,February,200112
4. MEMBER STATES INTERCOMPARISON MEASUREMENTS OFCONTINUOUS INSTRUMENTS WITH THE REFERENCE METHOD:- ASTRUCTURED APPROACH
As discussed in Chapter 1 the Working Group developed a structured approach, settingout guidance on best practice which would enable Member States using methods whichhave not yet been demonstrated as equivalent to the reference method to plan or toreview their procedures for their own intercomparison studies and to establish factors orequations by which they may relate the results of their continuous measurements to thereference procedures.
The following approach describes a recommended set of principles which MemberStates should adopt as far as practicable in carrying out their own intercomparisonexercises with reference methods. It is stressed that this approach represents guidance,based on the expert judgement of the WG. In the event that Member States have notcarried out these studies before the first reporting deadline, Chapter 5 deals with interimdefault procedures which can be used.
• Parallel measurements of the continuous instrument and the gravimetric referenceinstrument should be performed at least at two sites per Member State, or Region ina larger Member State, which are representative, as far as possible, for the majorityof conditions in the Member State or Region. These conditions might, for example,be an urban background site and an industrial or kerbside site. The conditionsshould also include amongst other things, climatic factors as described in Directive1999/30/EC and EN12341.
• As a minimum requirement there should be two sets of intercomparisonmeasurements; one set should be performed during a cold season (such as winter),and one set during a warm season (such as summer). The Member State or Regionshould also check for variations in the correction factors/equations obtained atdifferent geographical locations. If there are indications that conditions(composition of aerosols, climatic factors etc) vary significantly from site to sitewithin the network, then the Member State or Region should check whether the samecorrection factor/equation can be applied to all sites. This can be done, for example,by running intercomparison measurements of candidate and reference instruments atmore than one site and comparing results.
• The minimum number of validated data points (pairs of daily averages) per summerand winter data set should not be less than 30 at any one location. It would beadvisable to use significantly more than this minimum number of data points inorder to cover a wider range of climate and particle source conditions than mightoccur during one month.
• The correlation between candidate and reference instruments is regarded as valid ifthe regression or determination coefficient, r2 ≥0.8 and the intercept ≤5µg/m3. It isstressed that the fulfilment of these and other criteria does not necessarily mean thatthe slope of the regression between candidate analyser and the reference method is1:1. It simply means that the data can be used to determine the relationship betweenthe two methods.
• Since results of the intercomparison tests depend critically on technical detailsincluding: heating of the monitoring device or inlet system; the sampling head; the

EC Working Group on Particulate Matter Draft Final Report 22,January,200214,February,200113
temperature of the air stream or inlet tube; the calibration; any temperature/pressureadjustment, it is essential that comprehensive documentation of all measurementparameters is prepared and retained. The correction factor or equation derivedshould only be applied to the candidate instrument operated in the same way.
• If the correction factors/equations of the two seasons are equal, or almost equal, auniform correction factor/equation for the whole year may be applied. A measurefor the tolerable differences between seasonal factors/equations can be derived fromthe overall measurement uncertainty of 25% given in Annex VIII of the Directive1999/30/EC, for daily means. For simplicity, it might be considered that thisuncertainty can be allocated in roughly equal parts between systematic bias andrandom variations. The Working Group proposes that if the difference betweendaily means in the range of the limit value, corrected with the two seasonalfactors/equations, lies within ±10% then the daily means corrected with the twoseasonal factors/equations can then be regarded as equal and a single factor can beapplied throughout all seasons. At the same time, the Working Group agreed thatMember States or Regions are free to use any other factors they choose, but theymust be able to justify the arguments to support their decisions. The Working Groupchose not to be too prescriptive on determination of factors but their derivation mayinclude approaches such as Y=aX + b; Y=aX; the mean ratio of daily means overthe study period. Whatever the approach taken the Working Group stress the needfor Member States to provide justified arguments for their decisions.
• If seasonal correction factors/equations are necessary (differences of corrected dailymeans >±10%) it is recommended that interpolation through moving averages of thefactors/equations are used to avoid discontinuities in the time series when changingfrom season to season. An approach to this is suggested in Annex C although, aswith determination of factors, the Working Group stress that Member States developtheir own methodology which they subsequently agree with the Commission..Alternatively, a Member State might use the more stringent factor/equationthroughout the year; this would be easier for network operation and management aswell as erring on the safe side for reporting.
• The intercomparison should cover the range of concentrations expected to be found.Correction factors or equations should not normally be applied outside the rangetested, unless there is good evidence of linearity.
• Therefore, the Member State or Region should check for linearity of the correctionfactors/equations. If the relationship is non-linear it is recommended that acorrection equation is applied rather than a correction factor.
• Routine monitoring with continuous measurement will start with the correctionfactors/equations determined as described above. However, the Member State orRegion should check periodically during the routine operation of the network toensure whether the correction factors/equations once determined are stable over timescales longer than those used in the original study.
• Where a Member State is proposing corrections applicable at locations near those ina neighbouring Member State, it should liaise with the other Member State to ensure,as far as practicable and appropriate, the consistency of the corrections in the twoareas.
EC Working Group on Particulate Matter Draft Final Report 22,January,200214,February,200114
• Full and accurate documentation of both the candidate and referenceinstrumentation used is essential ( i.e. full model/serial number, date of manufacture,temperature of inlet, etc) as is a full description of the monitoring locations, timeperiods, and other relevant information.
• All raw data collected should be retained for a suitable period consistent with theprinciples of good data quality management.
The procedure described above should be regarded as a potentially interim strategy untilimproved instruments are available which sample a fraction of the ambient aerosolsimilar to that sampled by the gravimetric reference method.
For example, there are developments in progress on a new generation of automatedinstruments fitted with dryers to reduce water content of the samples thereby allowingmeasurements to be made at lower temperatures. This new generation is expected tocontain losses of volatiles to within 10%. In addition, other new equipment, such as βgauge and micro-balance instruments, is being developed; these too are expected tocontain losses to less than 10%.
However, this performance will have to be demonstrated in future measurementprogrammes and until such demonstration has been made the Working Group hasproposed the procedures set out above.

EC Working Group on Particulate Matter Draft Final Report 22,January,200214,February,200115
5. DEFAULT CORRECTION FACTORS
In setting the Working Group�s Terms of Reference the Commission recognised thatsome Member States might not have started any programme of equivalence or inter-comparison measurements, or had only a few data from limited geographical locationsand field test conditions. In this event Member States may not have been able to agreecorrections to their automatic data before they have to report data to the Commission asrequired by the Daughter Directive.
Consequently, the Working Group was asked to consider whether default factors orequations could be determined which allowed Member States to correct their data to acommon standard and acceptable to the Commission for reporting purposes. However,in agreeing the Terms of Reference the Air Quality Steering Group stressed that the useof default factors did not remove the statutory obligations to report data as described inChapter 2. Thus, those Member States who are pursuing reference measurement and/orequivalence monitoring with appropriate quality control/quality assurance protocolsapplied to their data in accordance with the guidance in Chapter 4 of this report do notneed to consider default factors.
Default factors have been developed specifically for a defined set of purposes: that iswhere Member States have no other mechanism by which to report their measured datato the Commission or make information available to the public.
In order to develop default factors/equations the Working Group called for informationfrom all Member States carrying out reference measurement or equivalence monitoring.This information was to be supplied through a questionnaire, set out in Annex D.
The information provided is set out in Annex E from which it will be seen that theWorking Group had access to data from a range of instruments, geographical locationsand measurement periods. (It should be noted that data were also received fromSwitzerland in addition to Member States that these data were used in the analysis). Inassessing all these data and noting in particular the range of sampling periods and thescatter in the data, the Group agreed it was essential to define criteria by which to selectthe most appropriate data for analysis in order to determine default equations or factors.It should be stressed that these were screening criteria to enable default procedures to bedeveloped and are not the same as those proposed in Chapter 4 for demonstratingequivalence.
Substantive amounts of data were received only for β-gauge and oscillating micro-balance methods and thus only these have been analysed. The data were of variablequality and in order to screen out data with large scatter the Working Group agreed aseries of criteria which it used as guidance for selection. These criteria were:
• There should be at least 30 days continuous data measurement in any givenperiod (e.g. summer or winter)
• Data have been compared with EN 12341 or a proven equivalent instrument• Only regression equations having r2 ≥ 0.8• Data with a regression equation constant >5 (b from y=ax+b) in absolute values
were rejected.

EC Working Group on Particulate Matter Draft Final Report 22,January,200214,February,200116
• Only period means >10µgm-3 would be used.Figures 1 and 2 show the intercomparison results of the selected studies fulfilling theabove criteria. In addition, it is noted that data from the Madrid-Berlin-Birminghamstudy, co-ordinated by the JRC, Ispra, (from end 1995 to mid-1996) were also included;the Working Group reasoned that whilst the data were only for a period of 25 days, theywere the only set which included data providing a direct relationship with the WRACinstruments.
The following conclusions were reached from the evaluation of the results of the fieldintercomparison tests.
For both the Tapered Element Oscillating Micro-balance (TEOM) instrument and β-gauge data there was considerably more scatter in the regression slopes of all countriesdata than there was in the ratios of the mean reference method PM10 to the meancandidate PM10 in each period. Accordingly, the Group decided to concentrate itsanalysis on the period means for each method (where period mean is taken to be theaverage concentration of PM10 over a measurement period e.g. summer or winter).
In taking this decision the Group was well aware that there is more scatter in dailymeans than in seasonal means and that applying correction factors derived from seasonalmeans may result in either an under-, or overestimate of daily means. Furthermore, theGroup recognised that underestimation for higher daily means may be greater if thecorrelation is non-linear. However, the Group was working towards an interim,pragmatic solution which was both easy to apply, and acceptable to the Commission, forreporting data.
TEOM instrumentation
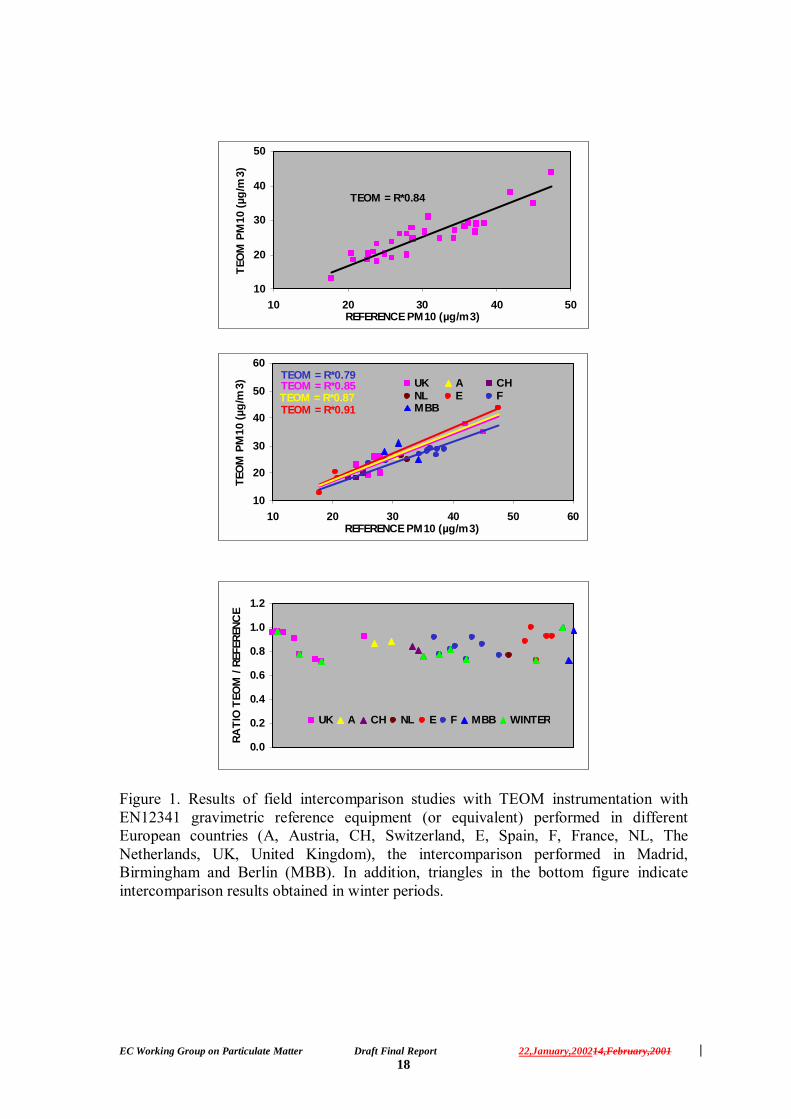
Figure 1 (top and middle) plots the period mean values of PM10 obtained with referencegravimetric equipment versus TEOM instrumentation obtained in differentintercomparison exercises. (For clarity it should be noted that each point in Figure 1represents a mean PM10 concentration over a measurement period in a country. Periodmeans are taken from Annex D).
The overall data show an underestimation of TEOM measurements of around 16% onaverage, i.e. REFERENCE=TEOM*1.19, (reciprocal =0.840) of the PM10 gravimetricvalues (see Figure 1 top). However, if regressions are obtained separately for thedifferent regions from Europe, it becomes evident that there is a wide range of factorsfrom REFERENCE=TEOM*1.27 (reciprocal =0.787) obtained in the French tests toREFERENCE=TEOM*1.09 (reciprocal =0.917) in the Spanish tests (see Figure 1middle).This range of factors may be due to the different aerosol composition present in thedifferent regions. It has been known for some time that the underestimation of TEOMmeasurements is due to the loss of semi-volatile compounds during the heating of theinlet or sample chamber. Thus, a high proportion of mineral dust or primaryanthropogenic particulates may account for a lower loss since the content of semi-volatile phases is considerably higher in the secondary particle load.

EC Working Group on Particulate Matter Draft Final Report 22,January,200214,February,200117
The differences in temperature between ambient air and the heated devices may accountalso for the different correction factors obtained under different micro-climates orseasonal conditions. Thus, for a given site a clear seasonal variation of the correctionfactor is demonstrated. Figure 1 (bottom) shows that most of the winter tests performedin Northern and Central Europe sites show an important TEOM underestimation,correction factors in the range of 1.25 (reciprocal =0.80) to 1.3 (reciprocal =0.769),whereas the tests performed in other seasons tend to show lower mass losses, and lowercorrection factors, commonly in the range 1.0 to 1.1 (reciprocal =0.909). This isprobably due to the differences in seasonal temperature between ambient air and theTEOM heating system. It must be pointed out that two winter tests performed in UKand Spain yielded factors close to 1.0. In these cases, a high mineral load in PM10probably accounts for a low loss of semi-volatile phases, even in winter conditions.
Some of these factors may also be due to different conditions of the referenceinstruments such as different temperatures of the sampling head and inlet system. It hasbeen demonstrated that losses of semi-volatile aerosols can also occur in unheated partsof the reference system, for example during warm and sunny periods.
EC Working Group on Particulate Matter Draft Final Report 22,January,200214,February,200118
TEOM = R*0.84
10
20
30
40
50
10 20 30 40 50REFERENCE PM10 (µg/m3)
TEO
M P
M10
(µg/
m3)
TEOM = R*0.91
TEOM = R*0.85TEOM = R*0.87
TEOM = R*0.79
10
20
30
40
50
60
10 20 30 40 50 60REFERENCE PM10 (µg/m3)
TEO
M P
M10
(µg/
m3) UK A CH
NL E FMBB
0.0
0.2
0.4
0.6
0.8
1.0
1.2
1 5 9 13 17 21 25 29 33 37 41 45 49 53 57
RATI
O T
EOM
/ RE
FERE
NCE
UK A CH NL E F MBB WINTER
Figure 1. Results of field intercomparison studies with TEOM instrumentation withEN12341 gravimetric reference equipment (or equivalent) performed in differentEuropean countries (A, Austria, CH, Switzerland, E, Spain, F, France, NL, TheNetherlands, UK, United Kingdom), the intercomparison performed in Madrid,Birmingham and Berlin (MBB). In addition, triangles in the bottom figure indicateintercomparison results obtained in winter periods.

EC Working Group on Particulate Matter Draft Final Report 22,January,200214,February,200119
BETA (β) -instrumentation
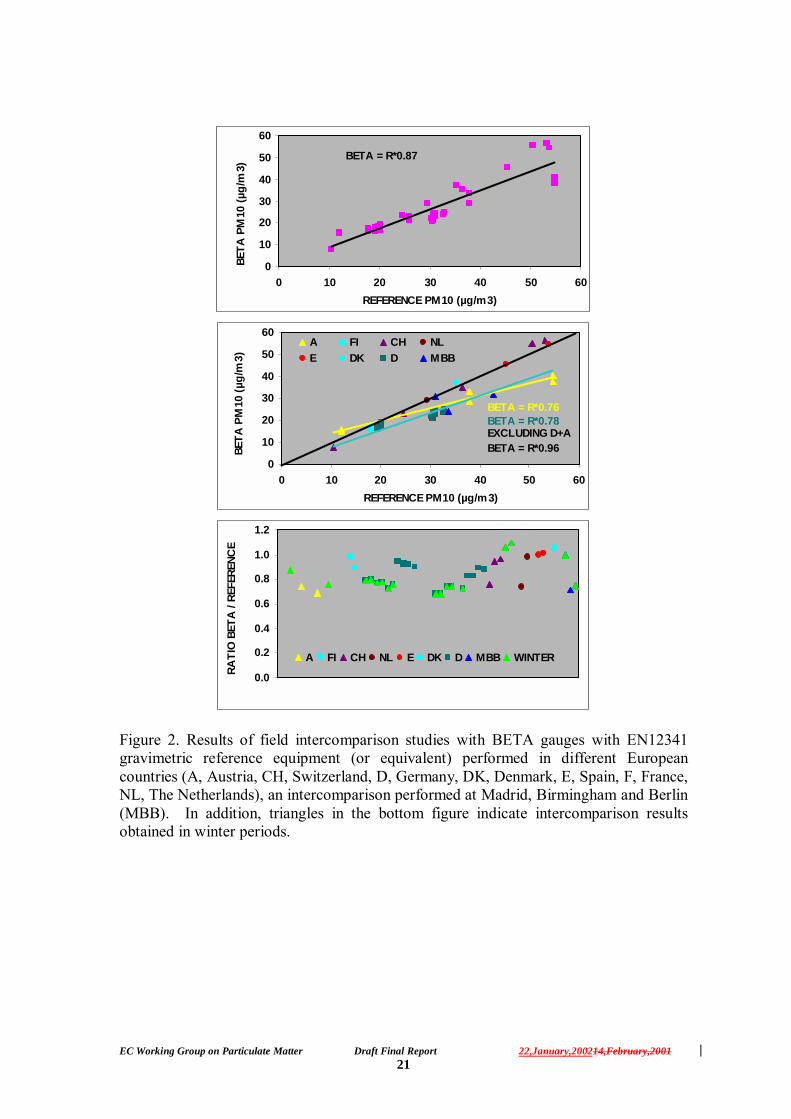
Figure 2 (top and middle) plots the mean values of PM10 obtained with referencegravimetric equipment versus β-instrumentation obtained in different intercomparisonexercises. The overall data show an underestimation of β-measurements of around 13%,i.e. REFERENCE=BETA*1.15, (reciprocal =0.870) of the PM10 gravimetric values (seeFigure 2 top). However, if this regression is split by obtaining factors for the differentregions from Europe, it becomes evident that the following factors are deduced from themajor intercomparison exercises (see Figure 2 middle):
• A factor of REFERENCE=BETA*1.04 (reciprocal =0.961) was obtained usingthe data from the experiments carried out in Denmark, Finland, Spain andSwitzerland, independently of the season when these were carried out.
• A factor of REFERENCE=BETA*1.30 (reciprocal =0.769) was obtained fromthe German and Austrian tests carried out in the winter season, whereas the testscarried out in non-winter periods at these sites yielded a similar factor to the oneobtained in the other European sites.
This range of factors may be due to the different heating systems of the sampling inlets.Thus, from the reported data with the equipment used in Denmark, Finland, Spain andSwitzerland there is only a slight underestimation of β-gauges with respect to thereference gravimetric methods, even in the winter periods. Consequently, it is evidentthat during these experiments, the loss of semi-volatile compounds was very low,probably due to the absence of inlet heating or to other instrumental reasons. However,in the tests performed in Germany and Austria in winter, and from one of the tests in theNetherlands in the same season, a high proportion of semi-volatile compounds were lostwith the subsequent underestimation of β-measurements with respect to the referencemethods. As for the TEOM results, a factor close to 1.0 was obtained in non-wintermeasurements from Austria and Germany. Therefore, the inlet heating is probably themajor cause of the winter underestimation of β-measurements.Another parameter which contributes to the range of factors encountered in differentnetworks may be the different basis of the calibration of instruments. Some networkshave used the calibration foil delivered by the manufacturer which is based purely onquartz dust. Other networks may have applied a calibration foil with an internalcalibration factor of 1.15, (reciprocal =0.870) also delivered by the manufacturer.Because of the lack of corresponding data these ambiguities could not be resolved by theWorking Group.
The results obtained evidenced a clear seasonal variation of the correction factor (Figure2 bottom), with a winter β underestimation (correction factors in the range of 1.3{0.769}) and non-winter factors close to 1.0 for the German and Austrian tests. Thisseasonal variation is probably induced by the loss of semi-volatile matter due to thedifferent seasonal temperature contrast between ambient air and the inlet heating systemused in Austria and Germany. However, the good fit between β-measurements andreference measurements (factors close to 1.0) obtained in the other Europeanexperiments, performed under very different micro- and macro-environments, indicateprobably that the heating system (if applied) or other characteristics β-attenuationinstruments are not inducing a loss of semi-volatile material. Consequently, althoughthe performance of intercomparison tests is highly encouraging for all types of automatic

EC Working Group on Particulate Matter Draft Final Report 22,January,200214,February,200120
measurements, in the case of β-instruments these are exceptionally important given thehigh influence of the measurement conditions used in each particular site.
EC Working Group on Particulate Matter Draft Final Report 22,January,200214,February,200121
BETA = R*0.87
0
10
20
30
40
50
60
0 10 20 30 40 50 60REFERENCE PM10 (µg/m3)
BETA
PM
10 (µ
g/m
3)
0
10
20
30
40
50
60
0 10 20 30 40 50 60REFERENCE PM10 (µg/m3)
BETA
PM
10 (µ
g/m
3)
A FI CH NLE DK D MBB
BETA = R*0.76
EXCLUDING D+ABETA = R*0.96
BETA = R*0.78
0.0
0.2
0.4
0.6
0.8
1.0
1.2
1 5 9 13 17 21 25 29 33 37 41 45 49 53
RATI
O B
ETA
/ RE
FERE
NCE
A FI CH NL E DK D MBB WINTER
Figure 2. Results of field intercomparison studies with BETA gauges with EN12341gravimetric reference equipment (or equivalent) performed in different Europeancountries (A, Austria, CH, Switzerland, D, Germany, DK, Denmark, E, Spain, F, France,NL, The Netherlands), an intercomparison performed at Madrid, Birmingham and Berlin(MBB). In addition, triangles in the bottom figure indicate intercomparison resultsobtained in winter periods.

EC Working Group on Particulate Matter Draft Final Report 22,January,200214,February,200122
Working Group Conclusions
The Group recognised that there was scatter in the pooled results from the variouscountries. Therefore, prescribing one default factor as a mean or median of these datamight run the risk of underestimating PM10 concentrations. The Group felt thereforethat a factor nearer the extreme of the distribution of period mean ratios would be moreappropriate. The Group felt that it was important to include this level of safety, bearingin mind that the default factor would be used in advance of the Member State havingcarried out its own intercomparison exercises. The Group accordingly concluded that adefault correction factor of 1.3 could be applied to measurement data from bothTEOM instruments and equipment measuring by β-attenuation techniques. (Althoughnot used in deriving the factor, it is interesting to note that this is approximately themean plus one standard deviation of the distribution of the ratios of the period means).
The Working Group agreed that this single factor could be applied to both dailyaverages and to annual means. At the same time the Working Group stressed that inchoosing to use this factor a Member State accepts and recognises the uncertaintyresulting from the Group�s analysis of limited data sets and range of locations andseasons from which the data are taken. The Working Group also stresses that whilst itdecided to use the ratios of seasonal mean values to derive the default factor, it wouldnot recommend that this should be done in Member States� own intercomparisonexercises discussed in the previous Chapter.
Therefore, the Group agreed that it would recommend that a Member State use thissingle default factor for reporting under Directive 1999/30/EC, in advance of havingcarried out their own intercomparison exercises and established their equivalenceprocedure with the Commission. At the same time the Group stresses that this factorshould only be used until such time as procedures in Chapters 3 or 4 can be developedand that a Member State should begin measurement and monitoring in accordance witheither of those Chapters as soon as possible. Once this has been done and the MemberState has agreed with the Commission the corrections appropriate to its own conditions,it no longer needs to use the 1.3 default factor.

EC Working Group on Particulate Matter Draft Final Report 22,January,200214,February,200123
6. CHECKING COMPLIANCE WITH THE LIMIT VALUE FOR SUSPENDEDPARTICULATE MATTER UNDER DIRECTIVE 80/779/EC USING PM10MEASUREMENTS
Article 9 (5) of Directive 1999/30 allows Members States to employ PM10 measurementstations as one means of assessing concentrations of suspended particulate matter for thepurpose of demonstrating compliance with the limit values for TSP laid down inDirective 80/779. For the purpose of demonstrating compliance, the data must bemultiplied by a factor of 1.2.
This assumes the use of the reference method or a method that produces equivalentresults to measure PM10. If a Member State is using a method which requires use of aPM10 correction factor to produce equivalent results to the reference method it mustapply the PM10 correction factor BEFORE applying the TSP factor of 1.2. For example,if the PM10 correction factor is 1.3, then TSP is calculated as:
TSP = measured data x 1.3 x 1.2
If this is not done the reported values for TSP from this site would always be lower thanreported values for PM10. Clearly this would not be correct,

EC Working Group on Particulate Matter Draft Final Report 22,January,200214,February,200124
7. METHODOLOGY FOR THE EVALUATION OF THE IMPACT OFNATURAL EVENTS ON PM10 LEVELS
Article 5.4, Directive 1999/30/EC, provides a derogation in cases where the limit valuesfor PM10 are exceeded owing to concentrations of PM10 in ambient air due to naturalevents which result in concentrations significantly in excess of normal backgroundlevels from natural PM10 sources. In these cases, the Article states that �Member Statesshall provide the necessary justification to demonstrate that such exceedences are due tonatural events�. Article 2 of the first Daughter Directive defines natural events as�volcanic eruptions, seismic activities geothermal activities, wild-land fires, high-windevents or the atmospheric re-suspension or transport of natural particles from dryregions�.
Furthermore, rural background stations in Southern Europe are characterised by aseasonal distribution of exceedences of the PM10 limit value with modes in the spring-summer periods. These higher summer PM10 levels contrast with the typical seasonalpattern of urban and industrial environments. This difference may be due to highernatural particulate input as a consequence of one or more of the following factors:a) low rainfall (low particulate scavenging potential)b) the intensive atmospheric convective dynamics (induced by the high insolation)
occurring mainly in spring and summer (favouring re-suspension),c) the possible higher frequency of African air mass intrusions.
It is recognised that Northern Europe Member States experience similar problems andalso face long range transport pollution from other sources such as secondary aerosolsand photo-chemically formed particles.
The Terms of Reference asked the Working Group to consider whether guidance couldbe developed to assist Member States who might need to provide justificationdemonstrating that exceedences were due to natural events. Since natural events mayhave a local origin (re-suspension) or an external origin, (long range transport of mineraldust from dry regions, volcanic activity), the Working Group developed the followingthree strategies as alternative options to detect these different origins. Papers on dailymean exceedences of particulate matter from long range transport and natural eventswere presented to the Workshop in Venice by Spain and United Kingdom. It should benoted that the Working Group was helped extensively by Spain in the development ofthe strategies described in Chapter 6.
This Chapter describes a series of techniques and research tools which could be used toidentify the contributions of natural events to measured PM10 levels. It should bestressed that this guidance is not meant to suggest that Member States should use all ofthese techniques, nor that detailed research level data need to be submitted to theCommission for all days. Member States should use those techniques which areappropriate and sufficient for the circumstances of natural events which they areinvestigating. There may be other techniques which Member States might wish to useand, provided these can be substantiated, Member States are of course free so to do.
The Working Group stressed that data on natural events were an important source ofknowledge and that information of such events should be clearly reported and madefreely available as a contribution towards understanding the phenomena.
EC Working Group on Particulate Matter Draft Final Report 22,January,200214,February,200125
Strategy 1: Detection of natural events due to long range transport of mineral dust suchas Sahara air mass intrusions
It is well known that high Sahara and Sahel dust air mass intrusions occur in Europe.Although these events are detected with a higher frequency in the Mediterraneandomain, Central and Northern Europe are also sporadically influenced by these events.The Sahara or Sahel dust is made up of mineral particles (mainly, calcite, iron oxide,quartz and clay minerals) which differ considerably, in composition and grain size, fromanthropogenic particles. Although a large proportion of this dust is made up by particlescoarser than 10 microns, the high dust load associated with these events accounts for theimpact on PM10 (particulate matter finer than 10 microns) measurements. In some partsof the EU territory, such as the Canary Islands, PM10 levels may remain up to about 10times the limit value for several consecutive days during Saharan dust intrusion events.Identification of such events is easy for these Member States. However, by the time thatSaharan dust plumes reach Northern European region, the dispersion processes and theinterference with the local particulate load may mask the easy detection of the events.
Objective of the method
The objective of this method is to identify high PM10 events, exceeding the PM10 dailylimit values (50µg/m3), caused by natural particulate inputs produced by long rangetransport events such as Sahara or Sahel air mass intrusions.
Procedure
1. Identify particulate peaks in the PM10 time series.2. Compile information from simultaneous time series of different monitoring stations
of the network and from a rural/remote/EMEP area (reference series) close to themonitoring site.
3. Compare the PM10 series for those events with high PM10 levels and identify a list ofcoincident high PM10 peaks. A daily collection of the results of the TOMSmeasurements of aerosol index and of the SKIRON model (Kallos et al., 1997) hasto be performed to evaluate the possible Sahara/Sahel influence on the PM10 levels.This information of TOMS index may be obtained for the previous day athttp://jwocky.gsfc.nasa.gov. Information is supplied in detail for Europe in graphswhich may be downloaded from ftp://jwocky.gsfc.nasa.gov/pub/tmp/meduse Thedaily dust load and 72 hr forecast ,maps over Europe deduced from SKIRON areavailable daily from http://forecast.uoa.gr.
4. Backwards trajectory analysis using isentropic meteorological models using 3 to 7days backwards transport periods may help to support the long transport input ofPM10. The Hysplit model (Draxler, 1994) is suitable for this analytical process; it isa relatively easy to operate and it may be downloaded free of charge from the NOAAweb site (ftp://www.arl.noaa.gov/pub/models). The 15 days meteorological datafiles needed to run the model can be downloaded fromftp://www.arl.noaa.gov/pub/archives/fnl/, free of charge, during one subsequentmonth or purchased from National Climatic Data Centre services in USA. Theresults of the analysis may be validated with the synoptic charts, available at:http://www.ecmwf.int/or at http://pcarx2.am.ub.es/infomet/arxiu/avn.
EC Working Group on Particulate Matter Draft Final Report 22,January,200214,February,200126
5. If the daily information from TOMS, SKIRON or the backwards trajectory modelshas been stored, a simple check of the TOMS and SKIRON mapping of the plume ofSahara/Sahel dust for the selected days, or the backwards trajectory analysis, willconfirm the Sahara/Sahel influence. In order to attribute the high PM10 levels to aSahara particulate input, the PM10 levels recorded at the reference station during thehigh particulate events will have to represent a high proportion of the PM10 levelsrecorded at the monitoring site. In the case of the exceedences of the PM10 limitvalues, the comparison of the reference and the monitoring site will help to supportthe justification that the limit value would not have been exceeded without this longrange transport event.
It is important to note that the meteorological data (for the back-trajectoriescalculations and ECWMF charts) and the forecast SKIRON are available at internetonly for a few days. Thus, it is necessary to down load the meteorological files andto run the forecast SKIRON every day in order to store data for the later study of thePM10 time series.
With the methodology described, the major long range dust transport events may bedetected but alternatively, the following strategies may also be able to identify theseevents: (a) Since the anthropogenic particulate load occurs mainly in the fraction finer than 2.5microns, (PM2.5), the presence of a large proportion of 2.5-10 micron particles indicatesthe influence of natural particulate sources. Therefore, if simultaneous TSP or PM2.5measurements are performed in urban areas, the proportions of PM10 in TSP or PM2.5 inPM10 will considerably decrease when Sahara/Sahel dust events occur. However, itshould be noted that this relationship is not valid for areas under the influence ofprimary particulate emissions (mining, tiling, demolition, cement and ceramicmanufacture) since the grain size of the particulate emissions are very similar to that ofthe natural dust load.
(b) The use of a reference station may be substituted by chemical mass balance of themajor components of PM10 for the days exceeding the limit value. Given thatSahara/Sahel dust is made up mainly of quartz, calcite, dolomite and clay minerals, thedirect analysis of Ca, Al2O3, Fe2O3, K, Mg, and the indirect determination of Si(2*Al2O3 = SiO2) and CO3
2-(1.5*Ca + 2.5*Mg = CO32-) allows the determination of the
mineral load supplied by the Sahara input. If this load is subtracted from the total PM10,and the limit value is not exceeded, it can be inferred that the natural input is responsiblefor the exceedence.
Further, detailed information on this procedure can be obtained from the followingreferences:
� Seasonal evolution of atmospheric suspended particles around a coal-fired powerstation: TSP levels and source origins. Atmospheric Environment, 32, 11, 1963-1978(1998). QUEROL X., ALASTUEY A., LOPEZ-SOLER A., PLANA F.PUICERCUS J.A, MANTILLA E., MIRO J.V.; ARTIÑANO B.

EC Working Group on Particulate Matter Draft Final Report 22,January,200214,February,200127
� Saharan dust contribution to PM10 and TSP levels in Southern and Eastern Spain.Atmospheric Environment (In Press, 2001). RODRIGUEZ S., QUEROL X.,ALASTUEY A., KALLOS G. and KAKALIAGOU O.
� Assessment of airborne particulate matter in Spain in response to the new EU-directive. Atmospheric Environment (In Press, 2001). ARTIÑANO B., QUEROLX., SALVADOR P., RODRIGUEZ S., ALASTUEY A.
� The regional weather forecasting system SKIRON: an overview. KALLOS, G.,KOTRONI, V., LAGOUVARDOS, K. Proceedings of the symposium on regionalweather prediction on parallel computer environments, 1997, University of Athens,Greece, pp. 109-122.
� Hybrid Single-Particles Lagrangian Integrated Trajectories. Version 3.2, DraxlerR.R. (1994). NOAA-ARL.
� Monitoring of PM10 and PM2.5 ambient air levels around primary anthropogenicemissions. Atmospheric Environment 35, 845 � 858. QUEROL X., ALASTUEY A,RODRIGUEZ S., PLANA F., MANTILLA E., and RUIZ CR.

EC Working Group on Particulate Matter Draft Final Report 22,January,200214,February,200128
Strategy 2: Detection of natural events due to local re-suspension
Atmospheric suspended particles from dry areas in Southern Europe have a highermineral load when compared with Central and Northern Europe. This differentiation isnot exclusive to Europe, since a number of studies have shown a similar differentiationbetween the Eastern and Western coasts of USA. A number of causes are thought toaccount for this higher mineral load:
a) poor soil cover allows re-suspension of soil particles;b) low rainfall accounts for a low particulate scavenging potential,c) intense atmospheric convective dynamics (induced by the high insolation) occurring
mainly in spring and summer, favouring re-suspension.
Given that the physical and chemical characteristics of natural re-suspended particlesdiffer considerably in most of the cases from the anthropogenic particles, both chemicaland physical measurements may allow identification of high particulate events inducedby local re-suspension processes.
Objective of the method
The objective of this method is to identify high PM10 events caused by naturalparticulate inputs due to local re-suspension of soil particles.
Procedure
If re-suspension processes are expected to increase the PM10 levels in a given monitoringsite, it is recommended to develop chemical mass balances procedures. This analysisshould be carried out for at least one year (around 75 samples homogeneouslydistributed throughout a year) to determine the periods of influence and to demonstratethe high proportion of the natural load on the PM10 levels. The direct analysis of Ca,Al2O3, Fe2O3, K, Mg, Ti and P and the indirect determination of Si (2*Al2O3 = SiO2)and CO3
2-(1.5*Ca + 2.5*Mg = CO32-) allows the determination of the mineral load. If
this load is subtracted from the total PM10 mass concentration and the limit value is notexceeded, it can be inferred that the natural input is responsible for the exceedence. Inurban background stations, levels of SO4
2-, NO3-, NH4
+ and non mineral C (organic C)shall represent the anthropogenic load, whereas the levels of Cl-, Na+ and marine SO4
2-
and Mg2+ (both determined indirectly from the Na+ levels) shall represent the marineaerosol load.
Once the importance of the re-suspended particulate load is demonstrate by a sourceapportionment analysis, the following steps may be applied in the subsequent years toidentify further re-suspension events.
1. Identify particulate peaks in the PM10 time series.
2. Compile information from simultaneous time series obtained in differentmonitoring sites of the network and from a rural/remote/EMEP area (reference series)close to the monitoring site. 3 Compare the PM10 reference series from those events with high PM10 levels in thetime series and identify a list of coincident high PM10 peaks. Lower concentrations of

EC Working Group on Particulate Matter Draft Final Report 22,January,200214,February,200129
particulate pollutants are expected in spring and summer, than in autumn and winter, asa consequence of the higher atmospheric dispersion conditions and the lower emissionrates. Therefore, any high PM10 events occurring in spring and summer may have ahigher natural input than those occurring in winter.
4 Obtain simultaneous measurements of TSP and/or PM10and PM2.5 levels in thereference and the monitoring sites. Mineral fractions of re-suspended soil particles aremainly in the coarse range (larger than 2.5 microns). Consequently, if the proportion ofPM2.5 in PM10, or in TSP for a high PM10 event recorded in both the reference and themonitoring stations, is very low (<50 %wt), then possible re-suspension processes mayaccount for the high PM10 values. However, it is important to note that the absence ofanthropogenic primary PM10 emission sources (ceramic, mining, cement) has to bedemonstrated since these sources emit particles mainly in the 2.5 to 10 micron range.
Further, detailed information on this procedure can be obtained from the followingreferences:
� Source assessment of particulate pollutants measured at the southwest European coast.Atmospheric Environment, 30, 19, 3309-3320 (1996). PIO C:A:, CASTRO L.M.,CERQUEIRA M. A., SANTOS I.M., BELCHIOR F., SALGUEIRO M.L.
� Comparative RECEPTOR MODELLING STUDY OF AIRBORNE PARTICULATEPOLLUTANTS IN Birmingham (United Kingdom), Coimbra (Portugal) and Lahore(Pakistan). Atmospheric Environment, 31, 3309-3321 (1997). HARRISON R.M.,SMITH D.J.T., PIO C.A. and CASTRO L.M.
� Spatial and temporal variations in PM10 and PM2.5 source contributions andcomparison to emissions during the 1995 integrated monitoring study AtmosphericEnvironment, 33, 4757-4773 (1999). MAGLIANO K.L., HUGHES V.N., CHINKING,L.R., COE D.L., HASTE T.L., KUMAR N., LURMANN F.W.
� Monitoring of PM10 and PM2.5 ambient air levels around primary anthropogenicemissions. Atmospheric Environment 35 5 848 � 858). QUEROL X., ALASTUEYA., RODRIGUEZ S., PLANA F., MANTILLA E. and RUIZ C.R.
� Seasonal evolution of atmospheric suspended particles around a coal-fired powerstation: Chemical Characterization. Atmospheric Environment, 32, 4, 719-731 (1998).QUEROL X., ALASTUEY A., LOPEZ-SOLER A., PLANA F. PUICERCUS J.A,RUIZ C.R., MANTILLA E., JUAN R.
EC Working Group on Particulate Matter Draft Final Report 22,January,200214,February,200130
Strategy 3: Detection of natural events due to volcanic, seismic events or wild fires
In addition to long range transport and re-suspension processes, other natural eventssuch as volcanic, seismic and wild fire events may induce sporadically high PM10 levelsin EU Member States. The detection of any of these events by one Member State isenhanced by similar detection in other Members States. Furthermore, the presence ofgaseous tracers at air monitoring stations throughout the affected Member States shouldalso help to determine the timing of these events more precisely.
Objective of the method
The objective of this method is to demonstrate that a high PM10 event is caused bynatural particulate inputs due to volcanic, seismic events or wild fire.
Procedure
1. Identify particulate peaks in the PM10 time series.
2. Compile information on a simultaneous time series from a rural/remote/EMEP area(reference series) relevant to the monitoring site.
3. Compare the PM10 series from those events with high PM10 levels and identify a listof coincident high PM10 peaks.
4. Compile a list of volcanic, seismic events or wild fires occurring during the timeseries.
5. Compare the time distribution of these events with that of the coincident high PM10peaks and review information on gaseous tracers for volcanic (SO2) or wild fires(NOx and CO) to confirm the relationship between these events and the PM10 peaksin the reference station.
6. Modelling of the dispersion of plumes from volcanic events and wild fires may alsodemonstrate the relationship of PM10 limit value exceedences and these naturalevents.

EC Working Group on Particulate Matter Draft Final Report 22,January,200214,February,200131
ANNEX A
Membership of the Working Group
Chairmen Peter BruckmannMartin Williams
Secretariat John StealeyMembers Lynne Edwards
Stefan JacobiDuncan KingDuncan LaxenFrançois MathéTon van der MeulenFinn PalmgrenXavier QuerolEmile de Saeger
EC Working Group on Particulate Matter Draft Final Report 22,January,200214,February,200132
ANNEX B
Terms of Reference
• To obtain information from Member States about work carried out to comparethe different methods for measuring particulate matter and to summarise theresults.
• To draft advice on demonstrating equivalence with the aim of helping MemberStates fulfil the requirements of Directive 1999/30/EC.
• To advise on any difficulties and, if necessary, to suggest practical solutionsduring the first stage of implementation of Directive 1999/30/EC.
• To draft recommendations for the development of correction factors orcorrection equations which may be applied to data obtained by measurementmethods, for PM10, other than the reference method set out in Directive1999/30/EC in order to produce equivalent results.
• To draft recommendations in respect of default factors which might be appliedby Member States who have not completed intercomparison tests in time forimplementation of the Directive.
Natural Events
The Group should also consider whether it is advisable to draft advice on demonstratingthat exceedences of limit values for PM10 are due to natural events, and if so, whether itis feasible to do so within the two planned meetings. It should be noted that the VeniceWorkshop agreed that results presented by Spain and the UK were sufficient todemonstrate the influence of long range transport, and that this work will be published.
The Commission asked the Working Group to gather information, review the data andproduce its draft recommendations, in order to report to the Air Quality Steering Groupmeeting, scheduled for 12 � 13 February 2001.
ANNEX C:INTERPOLATION OF SEASONAL CORRECTION FACTORS/EQUATIONS
In cases where seasonal factors/equations need to be applied (where the differences ofcorrected daily means are >±10%) it is recommended that moving averages of thefactors/equations are used to avoid a discontinuity or �step change� in the time serieswhen changing from one season to the next.
The method for interpolating the data depends upon whether a correction factor or acorrection equation is being applied. Examples of how interpolation may be carried outin each case are provided below.
EC Working Group on Particulate Matter Draft Final Report 22,January,200214,February,200133
Seasonal Correction Factors
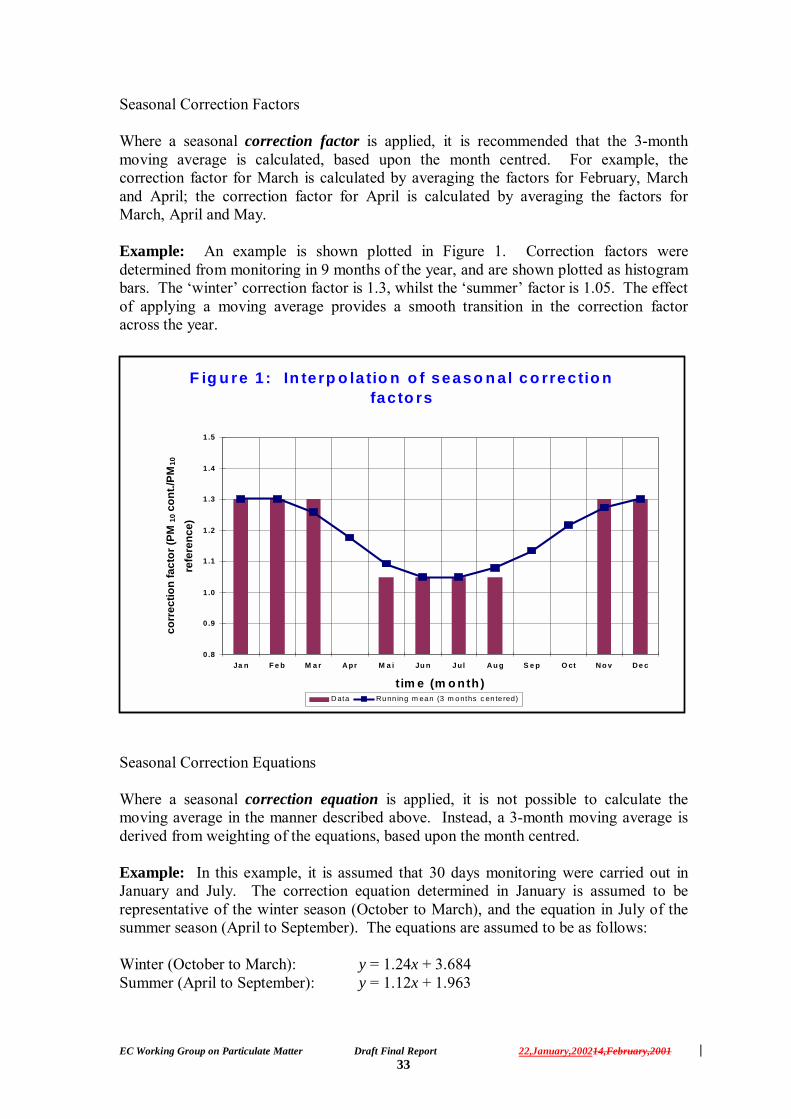
Where a seasonal correction factor is applied, it is recommended that the 3-monthmoving average is calculated, based upon the month centred. For example, thecorrection factor for March is calculated by averaging the factors for February, Marchand April; the correction factor for April is calculated by averaging the factors forMarch, April and May.
Example: An example is shown plotted in Figure 1. Correction factors weredetermined from monitoring in 9 months of the year, and are shown plotted as histogrambars. The �winter� correction factor is 1.3, whilst the �summer� factor is 1.05. The effectof applying a moving average provides a smooth transition in the correction factoracross the year.
Seasonal Correction Equations
Where a seasonal correction equation is applied, it is not possible to calculate themoving average in the manner described above. Instead, a 3-month moving average isderived from weighting of the equations, based upon the month centred.
Example: In this example, it is assumed that 30 days monitoring were carried out inJanuary and July. The correction equation determined in January is assumed to berepresentative of the winter season (October to March), and the equation in July of thesummer season (April to September). The equations are assumed to be as follows:
Winter (October to March): y = 1.24x + 3.684Summer (April to September): y = 1.12x + 1.963
F ig u re 1 : In terp o la tio n o f seaso n a l c o rrec tio n fac to rs
0.8
0 .9
1 .0
1 .1
1 .2
1 .3
1 .4
1 .5
Ja n F e b M a r A pr M a i Ju n Jul A u g S e p O ct N o v D e c
t im e (m o nth )
corr
ectio
n fa
ctor
(PM
10 c
ont./
PM10
refe
renc
e)
D ata Runn ing m ean (3 m onths c en te red)

EC Working Group on Particulate Matter Draft Final Report 22,January,200214,February,200134
Where y is the �corrected� PM10 concentration, and x is the measured PM10concentration as determined by the candidate automatic sampler.
The derivation of the correction factors for each month are described in the table below:
Month Calculation of weighted mean Correction Equation
January Weighted average of Dec-Feb y = 1.24x + 3.684February Weighted average of Jan-Mar y = 1.24x + 3.684March Weighted average of Feb-Apr y = (2*(1.24x + 3.684)+ (1.12x +
1.963))/3April Weighted average of Mar-May y = (1.24x + 3.684)+ (2*(1.12x +
1.963))/3May Weighted average of Apr-Jun y = 1.12x + 1.963June Weighted average of May-Jul y = 1.12x + 1.963July Weighted average of Jun-Aug y = 1.12x + 1.963August Weighted average of Jul-Sep y = 1.12x + 1.963September Weighted average of Aug-Oct y = (1.24x + 3.684)+ (2*(1.12x +
1.963))/3October Weighted average of Sep-Nov y = (2*(1.24x + 3.684)+ (1.12x +
1.963))/3November Weighted average of Oct-Dec y = 1.24x + 3.684December Weighted average of Nov-Jan y = 1.24x + 3.684

EC Working Group on Particulate Matter Draft Final Report 22,January,200214,February,200135
ANNEX D
Questionnaire Table
1.Site
2.Member State
CandidateInstrument
3.Reference
Instrument
4.Season &
Period
5.Season or
Period MeanCandidate
6.Season or
Period MeanReference
7RegressionEquation
8.Number of
Exceedences(50ug/m3
24hr mean)Candidate
9.Number of
Exceedences(50ug/m3 24
hr mean)References
10r2 value
&sample
size
11Modificationsto Instrument
12STP or
Ambient
13Modifications
to data
14Other
analysis
Key to Questionnaire
1. Site Classification: Describe monitoring site e.g. roadside, background urban, rural.
2. Member State Candidate Instrument: Describe type of instrument(s) selected byMember State and being tested for equivalence measurement technique e.g.gravimetric, automatic, β attenuation, housing conditions e.g. inside or outside ahousing, air conditioning and temperature control.
3. Reference Instrument: specify the type of reference instrument against whichintercomparison is being made and equivalence of the candidate instrument is beingsought, as stated in EN 12341.
4. Season & Period; Describe test period e.g. summer or winter and provide dates ofeach period.
5. Seasonal Mean for Candidate: the mean PM10 mass concentration values for each ofthe seasonal periods described.
6. Seasonal Mean for Reference: the mean PM10 mass concentration values for each ofthe seasonal periods described.
7. Number of Exceedences for Candidate: state number of fixed 24 hour periods whereconcentration is > 50 µg/m3
8. Number of Exceedences for Reference: state number of fixed 24 hour periods whereconcentration is > 50 µg/m3

EC Working Group on Particulate Matter Draft Final Report 22,January,200214,February,200136
9. Regression equation: the mathematical values for the regression analysis carried out.Please give as x axis = reference instrument; y axis = candidate instrument
10. r2 value and sample size: the numerical value for the regression coefficient and thesample size on which it is based.
11. Modifications to the candidate instrument: describe any modifications which mayhave been made to the instrument such as removal of air flow heating units,temperature of inlet, etc.
12. STP or ambient: are data corrected to STP or to ambient conditions.
13. Modifications to data: have data been modified to force regression line through theorigin. If so what mathematical analysis has been carried out to achieve this result.
14. Other Analysis: is regression analysis the preferred technique for demonstratingequivalence or have other measurement options, for example calculating the ratio ofcandidate instrument measurement to reference instrument measurement beeninvestigated and used.
Short narrative of useful points.
It would help the WG if you have found any particular approaches to gathering data,maintenance of instruments or ideas about good practice in your programme which havehelped the quality and reliability of data acquisition and analysis. The WG would like totake advantage of promulgating and sharing any ideas which Member States have usedin their intercomparison studies.
Please add any short notes you feel are relevant and may help others who have notreached the same level of progress in their intercomparison work.
EC Working Group on Particulate Matter Draft Final Report 22,January,200214,February,200137
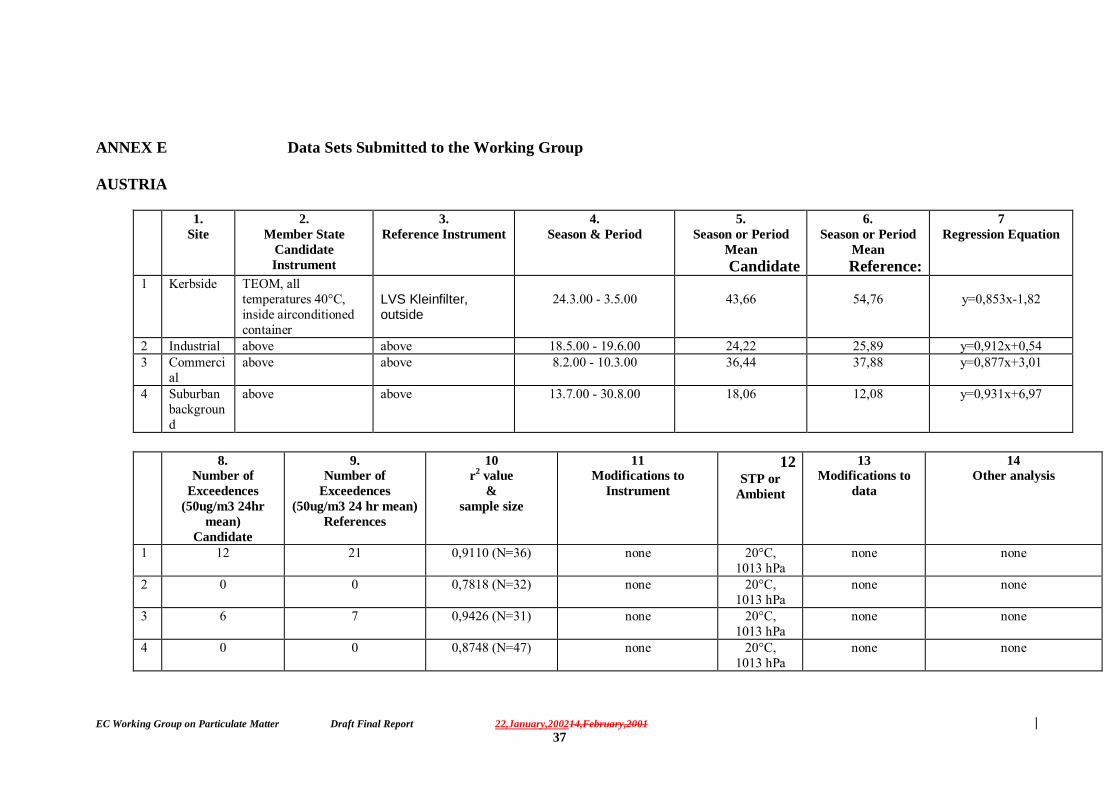
ANNEX E Data Sets Submitted to the Working Group
AUSTRIA
1.Site
2.Member State
CandidateInstrument
3.Reference Instrument
4.Season & Period
5.Season or Period
MeanCandidate
6.Season or Period
MeanReference:
7Regression Equation
1 Kerbside TEOM, alltemperatures 40°C,inside airconditionedcontainer
LVS Kleinfilter,outside
24.3.00 - 3.5.00 43,66 54,76 y=0,853x-1,82
2 Industrial above above 18.5.00 - 19.6.00 24,22 25,89 y=0,912x+0,543 Commerci
alabove above 8.2.00 - 10.3.00 36,44 37,88 y=0,877x+3,01
4 Suburbanbackground
above above 13.7.00 - 30.8.00 18,06 12,08 y=0,931x+6,97
8.Number of
Exceedences(50ug/m3 24hr
mean)Candidate
9.Number of
Exceedences(50ug/m3 24 hr mean)
References
10r2 value
&sample size
11Modifications to
Instrument
12STP or
Ambient
13Modifications to
data
14Other analysis
1 12 21 0,9110 (N=36) none 20°C,1013 hPa
none none
2 0 0 0,7818 (N=32) none 20°C,1013 hPa
none none
3 6 7 0,9426 (N=31) none 20°C,1013 hPa
none none
4 0 0 0,8748 (N=47) none 20°C,1013 hPa
none none

EC Working Group on Particulate Matter Draft Final Report 22,January,200214,February,200138
1.Site
2.Member State
CandidateInstrument
3.Reference Instrument
4.Season & Period
5.Season or Period
MeanCandidate
6.Season or Period
MeanReference:
7Regression Equation
1 Kerbside FH62IN insideairconditionedcontainer, 40°C inlettemparature
LVS Kleinfilter,outside
24.3.00 - 3.5.00 40,57 54,76 y=0,882x-6,59
2 Industrial as above above 18.5.00 - 19.6.00 22,86 25,89 y=0,954x-1,913 Commerci
alas above above 8.2.00 - 10.3.00 33,26 37,88 y=0,859x+0,42
4 Suburbanbackground
as above above 13.7.00 - 30.8.00 15,77 12,08 y=0,898x+4,89
8.Number of
Exceedences(50ug/m3 24hr
mean)Candidate
9.Number of
Exceedences(50ug/m3 24 hr mean)
References
10r2 value
&sample size
11Modifications to
Instrument
12STP or
Ambient
13Modifications to
data
14Other analysis
1 9 21 0,9782 (N=36) none 20°C,1013 hPa
none none
2 0 0 0,6886 (N=32) none 20°C,1013 hPa
none none
3 5 7 0,9773 (N=31) none 20°C,1013 hPa
none none
4 0 0 0,8725 (N=48) none 20°C,1013 hPa
none none

EC Working Group on Particulate Matter Draft Final Report 22,January,200214,February,200139
1.Site
2.Member State
CandidateInstrument
3.Reference Instrument
4.Season & Period
5.Season or Period
MeanCandidate
6.Season or Period
MeanReference:
7Regression Equation
1 Kerbside FH62IR, insideairconditionedcontainer, 40°C inlettemparature
LVS Kleinfilter,outside
24.3.00 - 3.5.00 37,94 54,76 y=0,816x-5,54
2 Industrial as above above 18.5.00 - 19.6.00 21,09 25,89 y=0,786x+0,393 Commerci
alas above above 8.2.00 - 10.3.00 28,75 37,88 y=0,759x-0,19
4 Suburbanbackground
as above above 13.7.00 - 30.8.00 14,97 12,08 y=0,851x+4,66
8.Number of
Exceedences(50ug/m3 24hr
mean)Candidate
9.Number of
Exceedences(50ug/m3 24 hr mean)
References
10r2 value
&sample size
11Modifications to
Instrument
12STP or
Ambient
13Modifications to
data
14Other analysis
1 6 21 0,9784 (N=36) none 20°C,1013 hPa
none none
2 0 0 0,7235 (N=32) none 20°C,1013 hPa
none none
3 2 7 0,9793 (N=31) none 20°C,1013 hPa
none none
4 0 0 0,8718 (N=48) none 20°C1013 hPa
none none

EC Working Group on Particulate Matter Draft Final Report 22,January,200214,February,200140
Additional information on data from Austria
• 4 sites have been tested, 1,2,3 in Austrian agglomerations• The number of samples is very small at each site, it is planned to revisit the site in different seasons• 2 Kleinfiltergeräte are used, alternating as sampling starts and stops at midnight• All gravimetric instruments use filters of the same type and manufacturer: glassfibre with organic binder• Studies are currently underway to examine reasons for the differences in the gravimetric methods, it seems that the Kleinfiltergeräte give a
systematic underestimation compared to the other ones, specially the Digitel: this has been cleared, the Digitel head was wrongly labeled(PM10 for 30m³/h flow) but contained nozzles for 64 m³/h, so data are skipped.
• There is strong evidence that the 2 PM10 inlets (US-EPA) of the Partisol have slightly different cut off characteristics, also this data areskipped; the same PM10 head as for the FH monitors are now used.
• the number of decimals used in the table for period mean and regression equation is due to calculation of these numbers (and the examplegiven)
Parallel measurements with 2 LSV Kleinfilter, 2 Digitel and one Partisol near to the Agency are underway to the end of the year.

EC Working Group on Particulate Matter Draft Final Report 22,January,200214,February,200141
DENMARK
Data submitted by Denmark were not in the format of the Questionnaire, described in Annex C. However, information was made available tothe Working Group and thus that information is included in this Report.
• PM10 gravimetric (average 35.19 µg/m3 ) v PM10 β Absorption (average 37.12 µg/m3 )
r2 = 0.93
y = 1.20x � 5.18
• PM10 gravimetric (average 35.20 µg/m3 ) v TSP gravimetric (average 47.50 µg/m3 )
r2 = 0.83
y = 1.35x � 0.10
Danish data of gravimetric results and the β gauge results are from the same filters sampled by an ADAM sampler. They are also compared tothe TSP data which shows a ratio of TSP/PM10 of 1.35.

EC Working Group on Particulate Matter Draft Final Report 22,January,200214,February,200142
FINLAND
1. Site 2. Member StateCandidate Instrument
3. ReferenceInstrument
4. Season & Period 5. Seasonor PeriodMeanCandidate
6. Seasonor PeriodMeanReference
7. RegressionEquation
1 VallilaKerbside
LVS Kleinfiltergerat2 LVSKleinfiltergerat1
Autumn (8/9/00 � 26/9/00) 17.5 17.9 y=1.0137x+0.1631
2 VallilaKerbside
TEOM � insidetemperature 50°C
LVSKleinfiltergerat1
Autumn (8/9/00 � 26/9/00) 16.4 17.9 y=0.7391x+3.1618
3 VallilaKerbside
Eberline FH 62 I-R 1 LVSKleinfiltergerat1
Autumn (8/9/00 � 26/9/00) 17.5 17.9 y=0.8385x+2.5308
4 VallilaKerbside
Eberline FH 62 I-R 2 LVSKleinfiltergerat1
Autumn (8/9/00 � 26/9/00) 16.0 17.9 y=0.7665x+2.27
5 VallilaKerbside
Virtual Impactor LVSKleinfiltergerat1
Autumn (8/9/00 � 26/9/00) 16.3 17.9 y=1.0133x-1.8178
6 VallilaKerbside
Dekati-Impactor LVSKleinfiltergerat1
Autumn (8/9/00 � 26/9/00) 17.0 17.9 y=0.9656x-0.3117
8. Number of Exceedences (50µg/m3 24 hr mean) Candidate
9. Number of Exceedences (50µg/m3 24 hr mean) Reference
10. r2 value &Sample size
11. Modifications toInstrument
12. STP orAmbient
13. Modifications todata
14. OtherAnalysis
1 0 0 0.9979 (N=17) None STP Regression not forcedthrough �0�
None
2 0 0 0.9705 (N=18) None STP Regression not forcedthrough �0�
None
3 0 0 0.9603 (N=18) None STP Regression not forcedthrough �0�
None
4 0 0 0.9615 (N=18) None STP Regression not forcedthrough �0�
None
5 0 0 0.9694 (N=18) None Ambient Regression not forcedthrough �0�
None
6 0 0 0.9945 (N=18) None Ambient Regression not forcedthrough �0�
None
EC Working Group on Particulate Matter Draft Final Report 22,January,200214,February,200143
Additional information on data from Finland
1. Site description:
The sampling site is located in downtown Helsinki (60°13�N, 24°58�E), Finland, at a distance of 14 m from a road with an average daily trafficof about 13 000 vehicles. The air was collected on a roof of the station, 3.5 m above the ground.
2. Candidate Instrument:
- TEOM (inside temperature 50°C), Eberline FH 62 I-R 1 and Eberline FH 62 I-R 2 were inside the station.- Virtual Impactor and Dekati-Impactor were on the roof of station and both techniques are based on the gravimetric technique
4. Season & Period:
Measurements were started on 8th September, 2000 and will be continue up to the end of October, 2000. Next measurement period (also 2months) will be carried out on spring, 2000.

EC Working Group on Particulate Matter Draft Final Report 22,January,200214,February,200144
FRANCE
French measurements: HVS PM10 Andersen vs. TEOM PM10
1.Site
2.Member State
CandidateInstrument
3.Reference
Instrument
4.Season & Period
5.Season or Period
MeanCandidate
6.Season or Period
MeanReference:
7Regression Equation
Traffic site TEOM � inside individual shelter- 500C inlet temperature
HVS - Graseby-Andersen (EN12341)
(06/05/98 � 02/09/98) 23,6 26 Y = 0,7741 X + 3,467
Traffic site TEOM � inside individual shelter- 500C inlet temperature
HVS - Graseby-Andersen (EN12341)
(12/10/98 � 31/03/99) 29 38,5 Y = 0,6266 X + 4,867
Traffic site TEOM � inside individual shelter- 500C inlet temperature
HVS - Graseby-Andersen (EN12341)
(01/04/99 � 18/06/99) 26,9 36,4 Y = 0,5974 X + 5,1398
Urban sitewith trafficinfluence
TEOM � inside big shelter - 500Cinlet temperature
HVS - Graseby-Andersen (EN12341)
(06/09/99 � 07/03/00) 27 34,4 Y = 0,6517 X + 4,6323
Urban sitewith trafficinfluence
TEOM � inside big shelter - 500Cinlet temperature
HVS - Graseby-Andersen (EN12341)
(06/04/00 � 24/08/00) 28,2 35,8 Y = 0,601 X + 6,6839
8.Number of Exceedences
(50ug/m3 24hr mean)Candidate
9.Number of Exceedences(50ug/m3 24 hr mean)
References
10r2 value
&sample size
11Modificationsto Instrument
12STP or
Ambient
13Modifications to data
14Other analysis
0 0 0,8807 (N=44) None STP If Regression forced through �0�Y = 0,9 X (r2=0,8562)
Mean ratio TEOM/HVS =0,913 ± 0,07
4 18 0,835 (N=82) None STP If Regression forced through �0�Y = 0,731 X (r2=0,807)
Mean ratio TEOM/HVS =0,779 ± 0,121
1 7 0,7836 (N=34) None STP If Regression forced through �0�Y = 0,7259 X (r2=0,7437)
Mean ratio TEOM/HVS =0,75 ± 0,11
5 8 0,8957 (N=56) None STP If Regression forced through �0�Y = 0,7544 X (r2=0,8666)
Mean ratio TEOM/HVS =0,813 ± 0,119
2 8 0,9344 (N=38) None STP If Regression forced through �0�Y = 0,7455 X (r2=0,8646)
Mean ratio TEOM/HVS =0,84 ± 0,147

EC Working Group on Particulate Matter Draft Final Report 22,January,200214,February,200145
FRANCE: HVS DIGITEL DA80 PM10 vs. TEOM PM10
1.Site
2.Member State
CandidateInstrument
3.Reference
Instrument
4.Season & Period
5.Season or Period
MeanCandidate
6.Season or Period
MeanReference:
7Regression Equation
Traffic site TEOM � inside individual shelter- 500C inlet temperature
HVS - Digitel DA80PM10 (EN12341)
(12/10/98 � 10/12/98) 29,2 33,6 Y = 0,5219 X + 11,652
Traffic site TEOM � inside individual shelter- 500C inlet temperature
HVS - Digitel DA80PM10 (EN12341)
(22/01/99 � 01/05/99) 26,6 37,2 Y = 0,6093 X + 4,014
Traffic site TEOM � inside individual shelter- 500C inlet temperature
HVS - Digitel DA80PM10 (EN12341)
(02/09/99 � 22/12/99) 24,6 28,8 Y = 0,688 X + 4,7565
Urban sitewith trafficinfluence
TEOM � inside big shelter - 500Cinlet temperature
HVS - Digitel DA80PM10 (EN12341)
(03/02/00 � 02/03/00) 22,9 28,8 Y = 0,5852 X + 5,9962
Urban sitewith trafficinfluence
TEOM � inside big shelter - 500Cinlet temperature
HVS - Digitel DA80PM10 (EN12341)
(06/04/00 � 28/08/00) 29,2 36,3 Y = 0,6234 X + 6,606
8.Number of Exceedences
(50ug/m3 24hr mean)Candidate
9.Number of Exceedences(50ug/m3 24 hr mean)
References
10r2 value
&sample size
11Modificationsto Instrument
12STP or
Ambient
13Modifications to data
14Other analysis
0 2 0,5969 (N=25) None STP If Regression forced through �0�Y = 0,8189 X (r2=0,3714)
Mean ratio TEOM/HVS =0,929 ± 0,21
2 18 0,9029 (N=82) None STP If Regression forced through �0�Y = 0,702 X (r2=0,8785)
Mean ratio TEOM/HVS =0,735 ± 0,08
3 10 0,9469 (N=77) None STP If Regression forced through �0�Y = 0,8117 X (r2=0,9061)
Mean ratio TEOM/HVS =0,913 ± 0,15
0 2 0,9206 (N=23) None STP If Regression forced through �0�Y = 0,7665 X (r2=0,8192)
Mean ratio TEOM/HVS =0,827 ± 0,11
4 13 0,9126 (N=54) None STP If Regression forced through �0�Y = 0,7655 X (r2=0,8518)
Mean ratio TEOM/HVS =0,856 ± 0,14

EC Working Group on Particulate Matter Draft Final Report 22,January,200214,February,200146
GERMANY
1.Site
2.CandidateInstrument
y
3.Reference
Instrumentx
4.Season & Period
5.Season or
Period MeanCandidate
6.Season or
Period MeanReference
7.Regression Equation
y = b •••• x + a
1 suburban, modestindustrial influence
DHA-80 KFG (1)(Typ: GS050/3-C)
18/05/98 - 30/09/98 21.7 21.4 y = 0,92x + 2,01
2 suburban, modestindustrial influence
DHA-80 KFG (2)(Typ: GS050/3-C)
18/05/98 - 30/09/98 21.6 21.2 y = 1,00x + 0,37
3 suburban, modestindustrial influence
FH 62 I-N (1) KFG (1)(Typ: GS050/3-C)
18/05/98 - 30/09/98 19.2 20.2 y = 0,88x + 1,39
4 suburban, modestindustrial influence
FH 62 I-N (1) KFG (2)(Typ: GS050/3-C)
18/05/98 - 30/09/98 17.9 19.3 y = 0,87x + 1,19
5 suburban, modestindustrial influence
FH 62 I-N (2) KFG (1)(Typ: GS050/3-C)
18/05/98 - 30/09/98 18.2 19.8 y = 0,75x + 3,25
6 suburban, modestindustrial influence
FH 62 I-N (2) KFG (2)(Typ: GS050/3-C)
18/05/98 - 30/09/98 17.4 19.4 y = 0,76x + 2,75
7 suburban, modestindustrial influence
FH 62 I-R (1) KFG (1)(Typ: GS050/3-C)
18/05/98 - 30/09/98 16.7 20.1 y = 0,79x - 0,94
8 suburban, modestindustrial influence
FH 62 I-R (1) KFG (2)(Typ: GS050/3-C)
18/05/98 - 30/09/98 16 19.3 y = 0,80x + 0,57
9 suburban, modestindustrial influence
FH 62 I-R (2) KFG (1)(Typ: GS050/3-C)
18/05/98 - 30/09/98 18 20.2 y = 0,81x + 1,68
10 suburban, modestindustrial influence
FH 62 I-R (2) KFG (2)(Typ: GS050/3-C)
18/05/98 - 30/09/98 17 19.3 y = 0,80x + 1,46

EC Working Group on Particulate Matter Draft Final Report 22,January,200214,February,200147
8.Number of
Exceedences(50µg/m3
24hr mean)Candidate
9.Number of
Exceedences(50µg/m3
24hr mean)Reference
10.
r2 value&
sample size
11.
Modifications to Instrument
12.
STP orAmbient
13.
Modifications to data
14.
Other analysis
1 1 1 0,93 (n=64) none ambient Grubbs test for outliers none2 1 1 0,89 (n=47) none ambient Grubbs test for outliers none3 2 0 0,85 (n=61) Candidate: sampling line heated (40 cm, 50°C) and
completely insulated inside the stationambient Grubbs test for outliers none
4 1 0 0,85 (n=46) Candidate: sampling line heated (40 cm, 50°C) andcompletely insulated inside the station
ambient Grubbs test for outliers none
5 1 0 0,81 (n=53) Candidate: sampling line heated (40 cm, 50°C) andcompletely insulated inside the station
ambient Grubbs test for outliers none
6 1 0 0,83 (n=45) Candidate: sampling line heated (40 cm, 50°C) andcompletely insulated inside the station
ambient Grubbs test for outliers none
7 2 0 0,84 (n=62) Candidate: sampling line heated (40 cm, 50°C) andcompletely insulated inside the station
ambient Grubbs test for outliers none
8 1 0 0,89 (n=46) Candidate: sampling line heated (40 cm, 50°C) andcompletely insulated inside the station
ambient Grubbs test for outliers none
9 0 0 0,85 (n=61) Candidate: sampling line heated (40 cm, 50°C) andcompletely insulated inside the station
ambient Grubbs test for outliers none
10 0 0 0,84 (n=46) Candidate: sampling line heated (40 cm, 50°C) andcompletely insulated inside the station
ambient Grubbs test for outliers none

EC Working Group on Particulate Matter Draft Final Report 22,January,200214,February,200148
1.Site
2.CandidateInstrument
y
3.Reference
Instrumentx
4.Season & Period
5.Season or
Period MeanCandidate
6.Season or
Period MeanReference
7.Regression Equation
y = b •••• x + a
11 suburban, modestindustrial influence
DHA-80 KFG (1)(Typ: GS050/3-C)
05/10/98 - 31/05/99 29.5 30.1 y = 1,00x - 0,70
12 suburban, modestindustrial influence
DHA-80 KFG (2)(Typ: GS050/3-C)
05/10/98 - 31/05/99 29.5 30 y = 1,00x - 1,39
13 suburban, modestindustrial influence
FH 62 I-N (1) KFG (1)(Typ: GS050/3-C)
05/10/98 - 31/05/99 24.5 31 y = 0,80x - 0,63
14 suburban, modestindustrial influence
FH 62 I-N (1) KFG (2)(Typ: GS050/3-C)
05/10/98 - 31/05/99 24.4 30.8 y = 0,80x - 0,23
15 suburban, modestindustrial influence
FH 62 I-N (2) KFG (1)(Typ: GS050/3-C)
05/10/98 - 31/05/99 23.8 30.8 y = 0,76x + 0,22
16 suburban, modestindustrial influence
FH 62 I-N (2) KFG (2)(Typ: GS050/3-C)
05/10/98 - 31/05/99 23.7 30.6 y = 0,76x + 0,09
17 suburban, modestindustrial influence
FH 62 I-R (1) KFG (1)(Typ: GS050/3-C)
05/10/98 - 31/05/99 20.9 30.7 y = 0,70x - 0,89
18 suburban, modestindustrial influence
FH 62 I-R (1) KFG (2)(Typ: GS050/3-C)
05/10/98 - 31/05/99 20.8 30.5 y = 0,71x - 0,85
19 suburban, modestindustrial influence
FH 62 I-R (2) KFG (1)(Typ: GS050/3-C)
05/10/98 - 31/05/99 22.9 31 y = 0,78x - 1,33
20 suburban, modestindustrial influence
FH 62 I-R (2) KFG (2)(Typ: GS050/3-C)
05/10/98 - 31/05/99 22.8 30.8 y = 0,78x - 1,35

EC Working Group on Particulate Matter Draft Final Report 22,January,200214,February,200149
8.Number of
Exceedences(50µg/m3
24hr mean)Candidate
9.Number of
Exceedences(50µg/m3
24hr mean)Reference
10.
r2 value&
sample size
11.
Modifications to Instrument
12.
STP orAmbient
13.
Modifications to data
14.
Other analysis
11 11 14 0,98 (n=102) none ambient Grubbs test for outliers none12 11 12 0,98 (n=98) none ambient Grubbs test for outliers none13 11 16 0,91 (n=97) Candidate: sampling line heated (40 cm, 50°C) and
completely insulated inside the stationambient Grubbs test for outliers none
14 11 14 0,93 (n=94) Candidate: sampling line heated (40 cm, 50°C) andcompletely insulated inside the station
ambient Grubbs test for outliers none
15 12 16 0,91 (n=101) Candidate: sampling line heated (40 cm, 50°C) andcompletely insulated inside the station
ambient Grubbs test for outliers none
16 12 14 0,92 (n=98) Candidate: sampling line heated (40 cm, 50°C) andcompletely insulated inside the station
ambient Grubbs test for outliers none
17 11 15 0,94 (n=97) Candidate: sampling line heated (40 cm, 50°C) andcompletely insulated inside the station
ambient Grubbs test for outliers none
18 11 13 0,95 (n=94) Candidate: sampling line heated (40 cm, 50°C) andcompletely insulated inside the station
ambient Grubbs test for outliers none
19 13 16 0,92 (n=100) Candidate: sampling line heated (40 cm, 50°C) andcompletely insulated inside the station
ambient Grubbs test for outliers none
20 13 14 0,93 (n=97) Candidate: sampling line heated (40 cm, 50°C) andcompletely insulated inside the station
ambient Grubbs test for outliers none
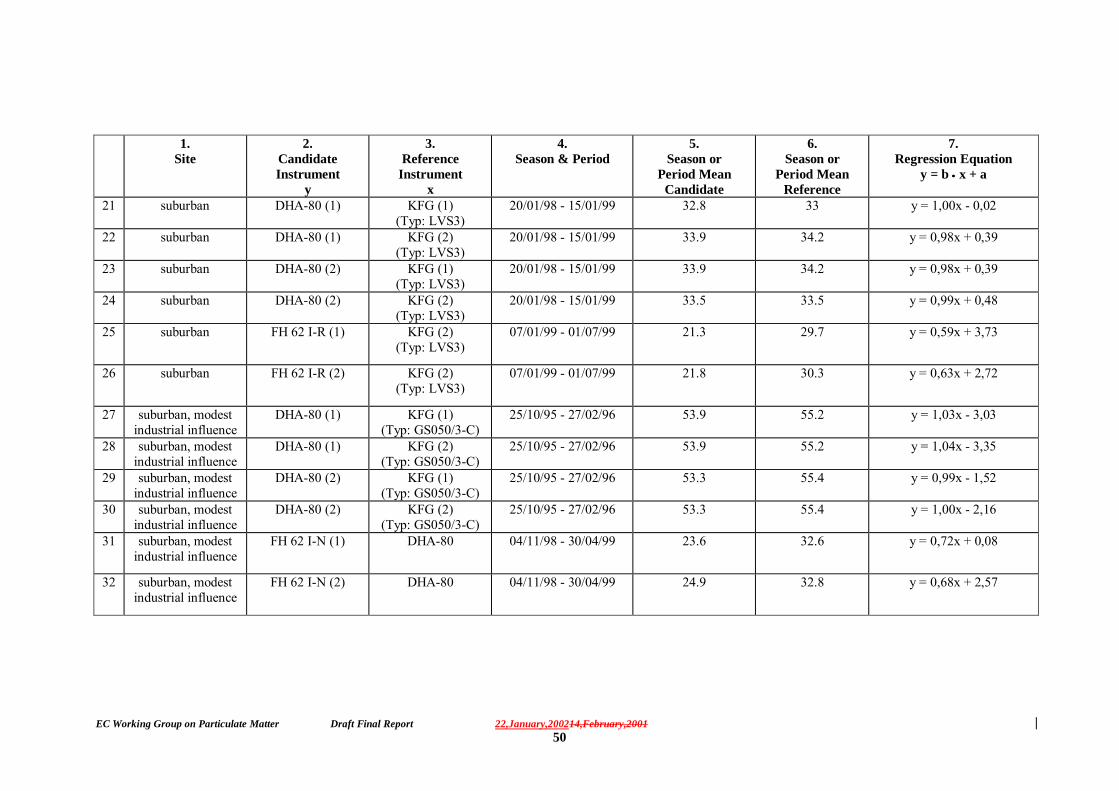
EC Working Group on Particulate Matter Draft Final Report 22,January,200214,February,200150
1.Site
2.CandidateInstrument
y
3.Reference
Instrumentx
4.Season & Period
5.Season or
Period MeanCandidate
6.Season or
Period MeanReference
7.Regression Equation
y = b •••• x + a
21 suburban DHA-80 (1) KFG (1)(Typ: LVS3)
20/01/98 - 15/01/99 32.8 33 y = 1,00x - 0,02
22 suburban DHA-80 (1) KFG (2)(Typ: LVS3)
20/01/98 - 15/01/99 33.9 34.2 y = 0,98x + 0,39
23 suburban DHA-80 (2) KFG (1)(Typ: LVS3)
20/01/98 - 15/01/99 33.9 34.2 y = 0,98x + 0,39
24 suburban DHA-80 (2) KFG (2)(Typ: LVS3)
20/01/98 - 15/01/99 33.5 33.5 y = 0,99x + 0,48
25 suburban FH 62 I-R (1) KFG (2)(Typ: LVS3)
07/01/99 - 01/07/99 21.3 29.7 y = 0,59x + 3,73
26 suburban FH 62 I-R (2) KFG (2)(Typ: LVS3)
07/01/99 - 01/07/99 21.8 30.3 y = 0,63x + 2,72
27 suburban, modestindustrial influence
DHA-80 (1) KFG (1)(Typ: GS050/3-C)
25/10/95 - 27/02/96 53.9 55.2 y = 1,03x - 3,03
28 suburban, modestindustrial influence
DHA-80 (1) KFG (2)(Typ: GS050/3-C)
25/10/95 - 27/02/96 53.9 55.2 y = 1,04x - 3,35
29 suburban, modestindustrial influence
DHA-80 (2) KFG (1)(Typ: GS050/3-C)
25/10/95 - 27/02/96 53.3 55.4 y = 0,99x - 1,52
30 suburban, modestindustrial influence
DHA-80 (2) KFG (2)(Typ: GS050/3-C)
25/10/95 - 27/02/96 53.3 55.4 y = 1,00x - 2,16
31 suburban, modestindustrial influence
FH 62 I-N (1) DHA-80 04/11/98 - 30/04/99 23.6 32.6 y = 0,72x + 0,08
32 suburban, modestindustrial influence
FH 62 I-N (2) DHA-80 04/11/98 - 30/04/99 24.9 32.8 y = 0,68x + 2,57

EC Working Group on Particulate Matter Draft Final Report 22,January,200214,February,200151
8.Number of
Exceedences(50µg/m3
24hr mean)Candidate
9.Number of
Exceedences(50µg/m3
24hr mean)Reference
10.
r2 value&
sample size
11.
Modifications to Instrument
12.
STP orAmbient
13.
Modifications to data
14.
Other analysis
21 10 10 0,99 (n=191) none STP Grubbs test for outliers none22 33 34 0,99 (n=197) none STP Grubbs test for outliers none23 33 34 0,99 (n=197) none STP Grubbs test for outliers none24 30 31 0,99 (n=198) none STP Grubbs test for outliers none25 0 4 0,77 (n=52) Candidate: sampling line heated (80 cm, 40°C) and
completely insulated inside the stationSTP Grubbs test for outliers none
26 1 6 0,81 (n=55) Candidate: sampling line heated (80 cm, 40°C) andcompletely insulated inside the station
STP Grubbs test for outliers none
27 35 39 0,98 (n=73) none STP Grubbs test for outliers none28 36 39 0,98 (n=74) none STP Grubbs test for outliers none29 34 36 0,97 (n=69) none STP Grubbs test for outliers none30 36 38 0,97 (n=72) none STP Grubbs test for outliers none31 12 28 0,98 (n=172) Candidate: sampling line heated (40 cm, 40°C) and
completely insulated inside the stationSTP Grubbs test for outliers none
32 11 28 0,95 (n=172) Candidate: sampling line heated (40 cm, 40°C) andcompletely insulated inside the station
STP Grubbs test for outliers none
Additional information on data from GERMANYThese results were gained during a federal campagne ("Exchange of experience on PM10- / PM2,5-measurements") in 1998/1999.Intercomparison exercises were carried out by: Hessian Agency for the Environment and for Geology (HLUG): No. 1-20; station: Wiesbaden,State Agency for the Environment North Rhine Westfalia (LUA NRW): No. 21-26; station: Essen and Company for Environmental Monitoringand Surveys Ltd. (UMEG): No. 27-32; station: Karlsruhe).

EC Working Group on Particulate Matter Draft Final Report 22,January,200214,February,200152
IRELAND
1.Site
2.Member
StateCandidateInstrument
3.Reference Instrument
4.Season & Period
5.Season or Period
MeanCandidate
6.Season or Period
MeanReference:
7Regression Equation
1 Roadside Osiris laserinstrument
Opsis (Adams) Samplerwith US inlet
Autumn/Winter (1/9/99 �14/12/99)
40.2 28.9 y=1.4232x-0.928
2 Industrial Osiris laserinstrument
Opsis (Adams) Samplerwith US inlet
Summer (8/6/00 � 25/7/00)
26.9 36.8 y=0.6683x+2.3306
3 Urbanbackground
Osiris laserinstrument
Opsis (Adams) Samplerwith US inlet
Winter(19/1/00 - 28/3/00)
46.8 41.3 y=1.0734x+2.5208
4 Urbanbackground
Osiris laserinstrument
Opsis (Adams) Samplerwith US inlet
Spring/Summer (3/2/00 �31/7/00)
29.1 24.7 y=1.131x

EC Working Group on Particulate Matter Draft Final Report 22,January,200214,February,200153
MADRID – BERLIN – BIRMINGHAM
1.Site
2.CandidateInstrument
3.Reference
Instrument
4.Season &
Period
5.Season or
PeriodMean
6.RegressionEquation
7r2 value
& samplesize
8.Modifications toInstru-ment
9.STP orambient
10.Modificationsto data
11Other
Analysis
MadridUrban background
TEOM 1400 WRAC Winter1996
~31 µg/m3 1.00x + 3.83 0.95
n = 22
STP
MadridUrban background
Environment MP 101(Beta)
WRAC Winter1996
~ 31 µg/m3 1.00x + 0.39 0.97
n = 28
STP
BerlinUrban highway
TEOM 1400 AndersenHigh Volume
Spring/summer
1996
~ 34 µg/m3 0.64x + 2.98 0.84
n = 64
STP
BerlinUrban highway
EnvironmentMP 101(Beta)
AndersenHigh Volume
Spring/summer
1996
~ 34 µg/m3 0.64x + 2.34 0.92
n = 68
STP
BirminghamUrban industrial
TEOM 1400 PartisolLow Volume
(1 m3/h)
Summer/autumn1997
~ 29 µg/m3 0.72x +4.4 0.92
n = 30
STP
BirminghamUrban industrial
BAM(Beta)
PartisolLow Volume
(1 m3/h)
Autumn1996
~ 36 µg/m3 0.89x + 3.0 0.89
n = 20
STP
BirminghamUrban industrial
EberlineFH62(Beta)
PartisolLow Volume
(1 m3/h)
Winter1997
~ 43 µg/m3 0.70x + 4.3 0.82
n = 33
STP FH62: 45°Cheated
sampling head
Eberline FH62 (β) 450C heated sampling head.

EC Working Group on Particulate Matter Draft Final Report 22,January,200214,February,200154
NETHERLANDS
1.Site
2.Candidate
3.Reference instrument
4.Season & Period
5.Period MeanCandidate(µg/m3)
6.Period MeanReference(µg/m3)
7.Number ofmeasurements >50µg/m3 24h meanCandidate:
1 Rural(Biest /Houtakker)
TEOMInside housing (10°C-25 °C)Inlet 50 °C
LVS- KleinfiltergerätDerenda
Winter-SpringFeb-May1999
26.31 31.45 2
2 Rural(Biest /Houtakker)
ß-attenuation FH62 I-NInside housing (20°C-25 °C)Inlet 50 °C
LVS- KleinfiltergerätDerenda
Winter-SpringFeb-May1999
28.87 29.42 2
3 urban/roadside(Utrecht)
TEOMInside housing (10°C-35 °C)Inlet 50 °C
LVS- KleinfiltergerätDerenda
Autumn-WinterSep-Dec 1999
24.72 32.35 0
4 urban/roadside(Utrecht)
ß-attenuation FH62 I-NInside housing (10°C-35 °C)Inlet 50 °C
LVS- KleinfiltergerätDerenda
Autumn-WinterSep-Dec 1999
22.95 31.00 1
8.Number ofmeasurements >50µg/m3 24h meanReference:
9.Regression Equation
10.r2 value
&n sample size
11.Modifications
12.STPor ambient
13.Modifications to data
14.Other analysis
1 4 y = 0.687 x + 4.8 0.7154 (n = 43) --- STP ---
2 4 y = 0.867 x + 3.4 0.9091 (n = 43) 25h filterchange STP First hour afterfilterchange skipped
3 5 y = 0.627 x + 4.5 0.8866 (n = 49) --- STP ---
4 5 y = 0.711 x + 0.9 0.9173 (n = 51) 25h filterchange STP First hour afterfilterchange skipped
Filter changes at 25 hrs on β-attenuation FH 62 I-N.
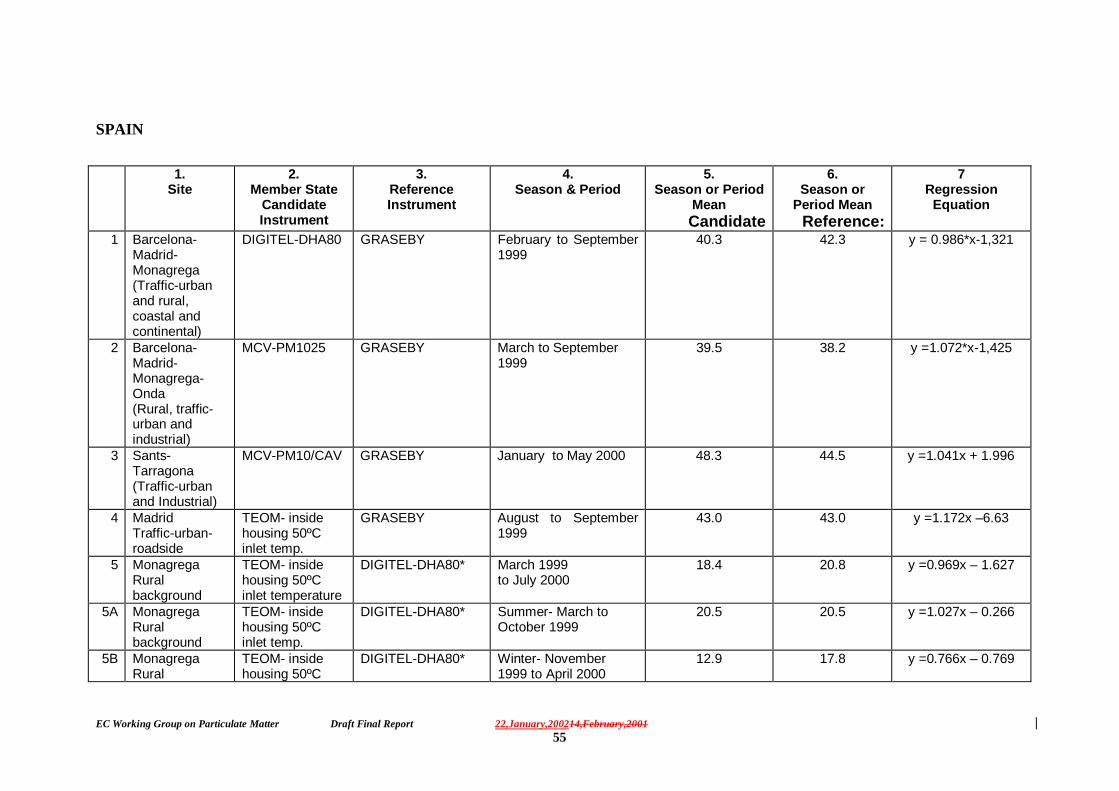
EC Working Group on Particulate Matter Draft Final Report 22,January,200214,February,200155
SPAIN
1.Site
2.Member State
CandidateInstrument
3.ReferenceInstrument
4.Season & Period
5.Season or Period
MeanCandidate
6.Season or
Period MeanReference:
7Regression
Equation
1 Barcelona-Madrid-Monagrega(Traffic-urbanand rural,coastal andcontinental)
DIGITEL-DHA80 GRASEBY February to September1999
40.3 42.3 y = 0.986*x-1,321
2 Barcelona-Madrid-Monagrega-Onda(Rural, traffic-urban andindustrial)
MCV-PM1025 GRASEBY March to September1999
39.5 38.2 y =1.072*x-1,425
3 Sants-Tarragona(Traffic-urbanand Industrial)
MCV-PM10/CAV GRASEBY January to May 2000 48.3 44.5 y =1.041x + 1.996
4 MadridTraffic-urban-roadside
TEOM- insidehousing 50ºCinlet temp.
GRASEBY August to September1999
43.0 43.0 y =1.172x –6.63
5 MonagregaRuralbackground
TEOM- insidehousing 50ºCinlet temperature
DIGITEL-DHA80* March 1999to July 2000
18.4 20.8 y =0.969x – 1.627
5A MonagregaRuralbackground
TEOM- insidehousing 50ºCinlet temp.
DIGITEL-DHA80* Summer- March toOctober 1999
20.5 20.5 y =1.027x – 0.266
5B MonagregaRural
TEOM- insidehousing 50ºC
DIGITEL-DHA80* Winter- November1999 to April 2000
12.9 17.8 y =0.766x – 0.769

EC Working Group on Particulate Matter Draft Final Report 22,January,200214,February,200156
background inlet temp.5C Monagrega
Ruralbackground
TEOM- insidehousing 50ºCinlet temp.
DIGITEL-DHA80* Summer - May to July2000
26.2 29.9 y =1.231x –10.86
6 Barcelona (L’H)Traffic-urban
Beta attenuation- inside housing50ºC inlet temp.
DIGITEL-DHA80* March to June 2000 45.3 45.4 y =0.843x +7.018
7 Barcelona,Madrid,Monagrega,OndaTraffic-urban,rural, industrial
GRIMM 1108,Laser-monitor
DIGITEL-DHA80* January 1999 to June2000
43.1 45.4 y =0.955x –0.259
8 BilbaoTraffic-urban
TEOM- insidehousing 50ºCinlet temp.
GRASEBY March 1999 to May2000
43.8 47.5 y=0.885x+1.876
9 BilbaoTraffic-urban
TEOM- insidehousing 50ºCinlet temp.
Low vol PM10reference
March 1999 to May2000
43.8 47.5 y=0.885x+1.922
10 Barcelona(Sants)Traffic-urban
Beta attenuation- inside housing50ºC inlet temp
MCV PM10 CAV February to July 2000 54.6 53.9 y =0.888x+6.652
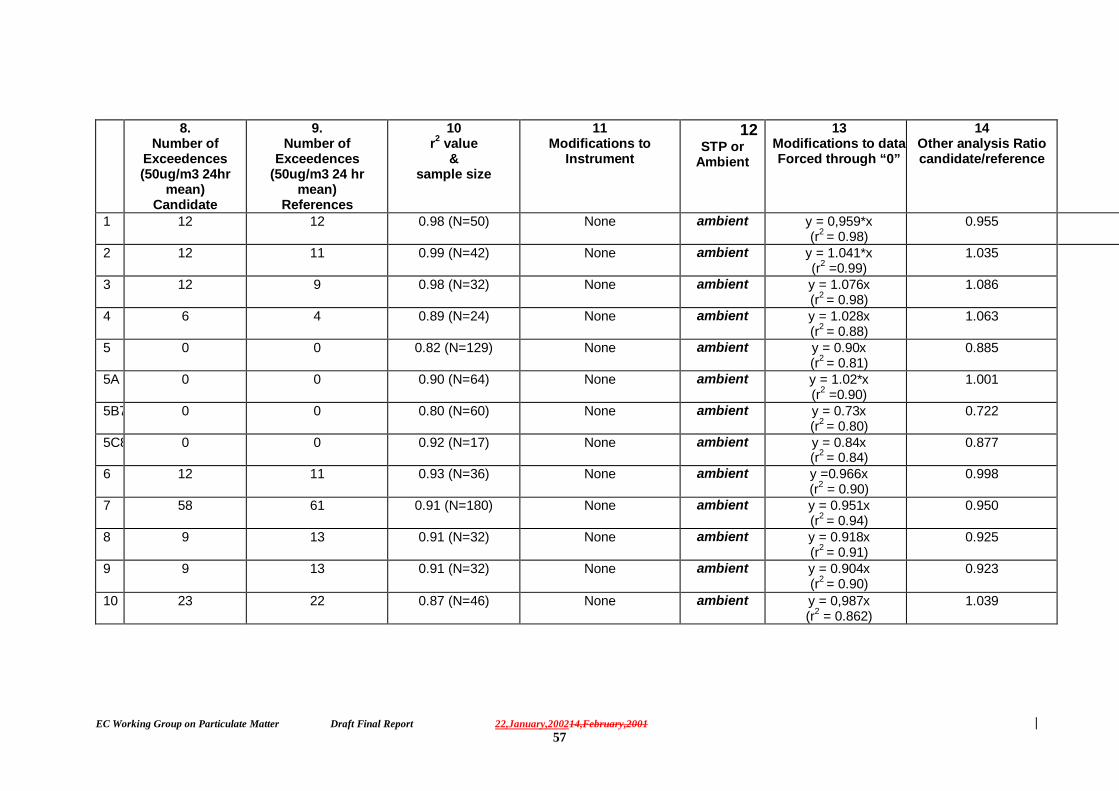
EC Working Group on Particulate Matter Draft Final Report 22,January,200214,February,200157
8.Number of
Exceedences(50ug/m3 24hr
mean)Candidate
9.Number of
Exceedences(50ug/m3 24 hr
mean)References
10r2 value
&sample size
11Modifications to
Instrument
12STP or
Ambient
13Modifications to dataForced through “0”
14Other analysis Ratiocandidate/reference
1 12 12 0.98 (N=50) None ambient y = 0,959*x(r2 = 0.98)
0.955
2 12 11 0.99 (N=42) None ambient y = 1.041*x(r2 =0.99)
1.035
3 12 9 0.98 (N=32) None ambient y = 1.076x(r2 = 0.98)
1.086
4 6 4 0.89 (N=24) None ambient y = 1.028x(r2 = 0.88)
1.063
5 0 0 0.82 (N=129) None ambient y = 0.90x(r2 = 0.81)
0.885
5A 0 0 0.90 (N=64) None ambient y = 1.02*x(r2 =0.90)
1.001
5B7 0 0 0.80 (N=60) None ambient y = 0.73x(r2 = 0.80)
0.722
5C8 0 0 0.92 (N=17) None ambient y = 0.84x(r2 = 0.84)
0.877
6 12 11 0.93 (N=36) None ambient y =0.966x(r2 = 0.90)
0.998
7 58 61 0.91 (N=180) None ambient y = 0.951x(r2 = 0.94)
0.950
8 9 13 0.91 (N=32) None ambient y = 0.918x(r2 = 0.91)
0.925
9 9 13 0.91 (N=32) None ambient y = 0.904x(r2 = 0.90)
0.923
10 23 22 0.87 (N=46) None ambient y = 0,987x(r2 = 0.862)
1.039

EC Working Group on Particulate Matter Draft Final Report 22,January,200214,February,200158
Additional information on data from Spain.
Location and type of the monitoring stations and instruments utilised for PM10measurements
NAME X UTM Y UTM HEIGHT (msnm)
TYPE
Catalunya Barcelona ( 432460 4586170 24 Traffic-Urban L'Hospitalet 426080 4580470 28 Traffic-Urban Tarragona 348300 4553400 41 Industrial-Traffic Endesa-Teruel Monagrega 727898 4536235 605 Rural background Madrid long lat Escuelas Aguirre 03 40 52 W 40 25 32 N Traffic-Urban Comunidad valencia Onda 00 15 43 W 39 57 43 N 167 Urban-Industrial
Tile primary emissions Bilbao 03 00 52 W 43 21 22 N 16 Traffic-Urban
2. Instrumentation
Candidate samplersManual PM10 samplers:
• DIGITEL DHA80 (30 m3 h-1)• PM10-MCV-PM1025 (40 m3 h-1)• PM10-MCV-PM10/CAV (68 m3 h-1)
All the manual samplers are outside housing
Automatic PM10 monitors:• TEOM R&P1400AB• BETA FAG FH-62I-N
• All this automatic instruments are inside housing with 50ºC inlettemperature.
Reference samplers• GRASEBY-ANDERSEN, high volume sampler (68 m3 h-1)• Low volume IND LVS3 PM10• *DIGITEL DHA80: is not a reference equipment in the sense of EN 1234/1,
but the equivalence with the HVS Graseby reference equipment has beendemonstrated previously
3. Filters
Filters used for the inercomparison were:Quartz filters Schleicher and Schuell QF20Filters were previously stabilised in a disecator at ambient temperature

EC Working Group on Particulate Matter Draft Final Report 22,January,200214,February,200159
SWITZERLAND
1. Site 2. MemberState/Candidate
Instrument
3. ReferenceInstrument
4. Seasons &Period
1 Aarau, downtownarea, near traffic(50 m distance)
TEOM 1400 ab50°C inlet temp.,enclosure temp.40°C
Digitel HVSDHA-80
April 1998 - Febr. 1999 (all seasons)Remarks: dependence on air temperature.T (average) > 15° (summer): coefficientTEOM(HIV~1T (average) < 5° (winter): coefficientTEOM/HIV~0.6spring, autumn: coefficientTEOM/HIV~0.8-0.9
5. Seasons orPeriod Mean
Candidate
6.Season or PeriodMean Reference
7. RegressionEquation
8. Number ofExceedences
(50 µg/m³ 24 hrmean) Candidate
9. Number ofExceedences
(50 µg/m³ 24 hrmean) References
1 20.2 25.1 Y=0.57x+6.0 5 31
10. r² value &sample size
11. Modifications toInstrument
12. STP orAmbient
13. Modifications todata
14. Other analysis
1 0.83 (N=334) none STP Regression notforced through "0"
multivariate linearregression (suitablefor summer)multivariatelogarithmicregression (suitablefor winter)variables: TEOM, T,rH, NOx

EC Working Group on Particulate Matter Draft Final Report 22,January,200214,February,200160
1. Site 2. MemberState/Candidate
Instrument
3. ReferenceInstrument
4. Seasons &Period
2 Winterthur,downtown neartraffic (10 m)
TEOM 1400 ab50°C inlet temp.,40°C enclosuretemp.
HVS Digitel DHA-80
autumn 25.9.-27.10.1998
5. Seasons orPeriod Mean
Candidate
6.Season or PeriodMean Reference
7. RegressionEquation
8. Number ofExceedences
(50 µg/m³ 24 hrmean) Candidate
9. Number ofExceedences
(50 µg/m³ 24 hrmean) References
2 18.3 22.6 y = 0.72x+2.00 0 1
10. r² value &sample size
11. Modifications toInstrument
12. STP orAmbient
13. Modifications todata
14. Other analysis
2 0.96 (N=30) none STP Regression notforced through "0"
none

EC Working Group on Particulate Matter Draft Final Report 22,January,200214,February,200161
1. Site 2. MemberState/Candidate
Instrument
3. ReferenceInstrument
4. Seasons &Period
3 Davos, urbanbackground
Eberline FH62I-Rsampling line heatedto 30°C (on 1.5 m)
HVS Digitel outsidestation
Jan. - March 1999 (winter)
5. Seasons orPeriod Mean
Candidate
6.Season or PeriodMean Reference
7. RegressionEquation
8. Number ofExceedences
(50 µg/m³ 24 hrmean) Candidate
9. Number ofExceedences
(50 µg/m³ 24 hrmean) References
3 7.9(low concentrations)
10.4 y = 0.95x-1.88 0 0
10. r² value &sample size
11. Modifications toInstrument
12. STP orAmbient
13. Modifications todata
14. Other analysis
3 0.92 (N=44) none STP Regression notforced through "0"
none
1. Site 2. MemberState/Candidate
Instrument
3. ReferenceInstrument
4. Seasons &Period
4 Zürich, kerbside Eberline FH62I-R(β-gauge) samplingline heated to 30°C(45 cm)
HVS Digitel Quarzfibre filter
a) summer 1.5. - 23.6.1998b) summer 1.7. - 31.8.1998c) winter 20.11.1198 - 14.1.1999d) winter 15.1. - 28.2.1999

EC Working Group on Particulate Matter Draft Final Report 22,January,200214,February,200162
5. Seasons orPeriod Mean
Candidate
6.Season or PeriodMean Reference
7. RegressionEquation
8. Number ofExceedences
(50 µg/m³ 24 hrmean) Candidate
9. Number ofExceedences
(50 µg/m³ 24 hrmean) References
4 a) 23.2b) 35.1c) 56.4d) 55.2
a) 24.5b) 36.4c) 53.2d) 50.5
a) y=1.19x-3.36b) y=0.95x+0.81c) y=1.18x-5.82d) y=1.16x-3.28
no data no data
10. r² value &sample size
11. Modifications toInstrument
12. STP orAmbient
13. Modifications todata
14. Other analysis
4 a) 0.92 (N=44)b) 0.96 (N=54)c) 0.99 (N=55)d) 0.98 (N=44)
none ambient Regression notforced through "0"
none
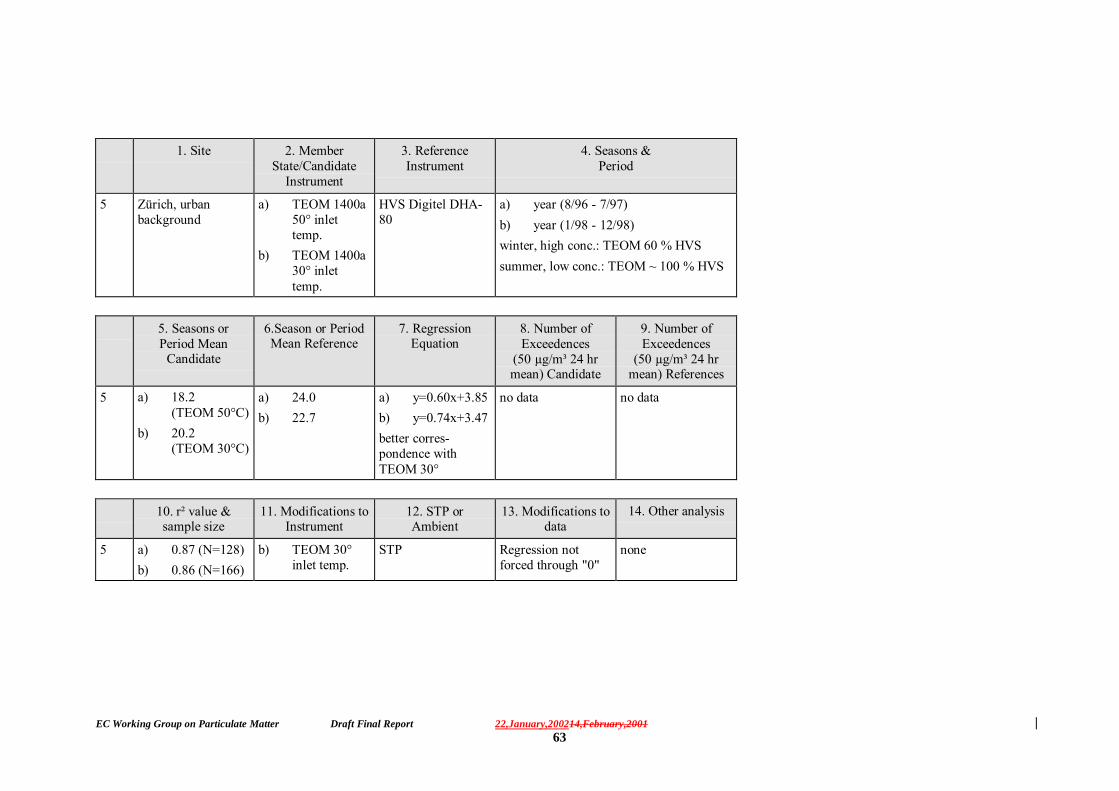
EC Working Group on Particulate Matter Draft Final Report 22,January,200214,February,200163
1. Site 2. MemberState/Candidate
Instrument
3. ReferenceInstrument
4. Seasons &Period
5 Zürich, urbanbackground
a) TEOM 1400a50° inlettemp.
b) TEOM 1400a30° inlettemp.
HVS Digitel DHA-80
a) year (8/96 - 7/97)b) year (1/98 - 12/98)winter, high conc.: TEOM 60 % HVSsummer, low conc.: TEOM ~ 100 % HVS
5. Seasons orPeriod Mean
Candidate
6.Season or PeriodMean Reference
7. RegressionEquation
8. Number ofExceedences
(50 µg/m³ 24 hrmean) Candidate
9. Number ofExceedences
(50 µg/m³ 24 hrmean) References
5 a) 18.2(TEOM 50°C)
b) 20.2(TEOM 30°C)
a) 24.0b) 22.7
a) y=0.60x+3.85b) y=0.74x+3.47better corres-pondence withTEOM 30°
no data no data
10. r² value &sample size
11. Modifications toInstrument
12. STP orAmbient
13. Modifications todata
14. Other analysis
5 a) 0.87 (N=128)b) 0.86 (N=166)
b) TEOM 30°inlet temp.
STP Regression notforced through "0"
none
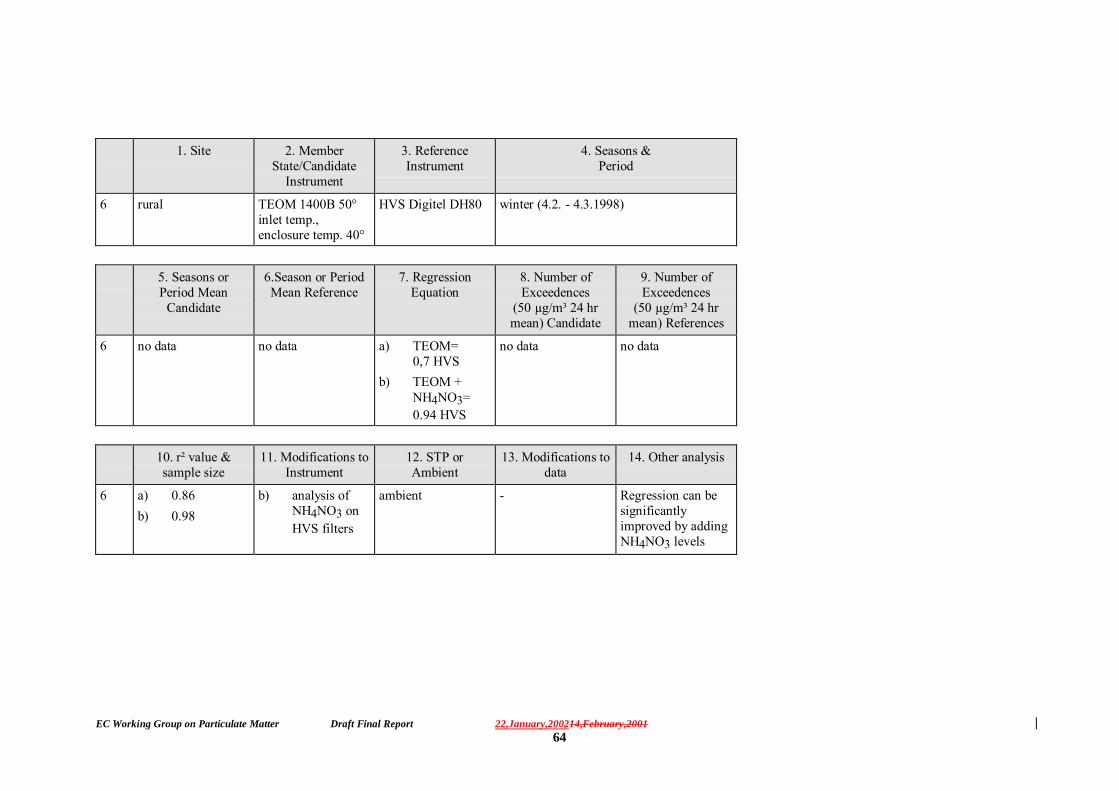
EC Working Group on Particulate Matter Draft Final Report 22,January,200214,February,200164
1. Site 2. MemberState/Candidate
Instrument
3. ReferenceInstrument
4. Seasons &Period
6 rural TEOM 1400B 50°inlet temp.,enclosure temp. 40°
HVS Digitel DH80 winter (4.2. - 4.3.1998)
5. Seasons orPeriod Mean
Candidate
6.Season or PeriodMean Reference
7. RegressionEquation
8. Number ofExceedences
(50 µg/m³ 24 hrmean) Candidate
9. Number ofExceedences
(50 µg/m³ 24 hrmean) References
6 no data no data a) TEOM=0,7 HVS
b) TEOM +NH4NO3=0.94 HVS
no data no data
10. r² value &sample size
11. Modifications toInstrument
12. STP orAmbient
13. Modifications todata
14. Other analysis
6 a) 0.86b) 0.98
b) analysis ofNH4NO3 onHVS filters
ambient - Regression can besignificantlyimproved by addingNH4NO3 levels

EC Working Group on Particulate Matter Draft Final Report 22,January,200214,February,200165
UNITED KINGDOM
1.Site
2.Member State
CandidateInstrument
3.Reference Instrument
4.Season & Period
5.Season or Period
MeanCandidate
6.Season or Period
MeanReference:
7Regression Equation
1 Kerbside TEOM � insidehousing 500C inlettemp
LVS - Kleinfiltergerat Summer (03/06/99 �30/09/99)
38 µgm-3 42 µgm-3 Y=0.7975x+4.4938
2 Kerbside TEOM � insidehousing 500C inlettemp
LVS - Kleinfiltergerat Winter (01/10/99 �31/03/00)
35 µgm-3 45 µgm-3 Y=0.6764x+4.9516
3 Kerbside TEOM � insidehousing 500C inlettemp
LVS - Kleinfiltergerat Summer (01/04/00 �16/08/00)
33 µgm-3 50 µgm-3 Y=0.3176x+16.565
4 UrbanB�kgrd
TEOM � insidehousing 500C inlettemp
LVS - Kleinfiltergerat Summer (27/05/99 �30/09/99)
19 µgm-3 26 µgm-3 Y=0.5667x+4.2932
5 UrbanB�kgrd
TEOM � insidehousing 500C inlettemp
LVS - Kleinfiltergerat Winter (01/10/99 �31/03/00)
20 µgm-3 28 µgm-3 Y=0.5902x+2.9435
6 UrbanBk�grd
TEOM � insidehousing 500C inlettemp
LVS - Kleinfiltergerat Summer (01/04/00 �15/08/00)
20 µgm-3 31 µgm-3 Y=0.4185x+6.8929
7 Rural TEOM � insidehousing 500C inlettemp
LVS - Kleinfiltergerat Summer (28/05/99 �30/09/99)
16 µgm-3 17 µgm-3 Y=0.4245x+8.6309
8 Rural TEOM � insidehousing 500C inlettemp
LVS - Kleinfiltergerat Winter (01/10/99 �31/03/00)
13 µgm-3 17 µgm-3 Y=0.3617x+7.3839
9 Rural TEOM � insidehousing 500C inlettemp
LVS - Kleinfiltergerat Summer (01/04/00 �10/08/00)
15 µgm-3 19 µgm-3 Y=0.2758x+9.8551

EC Working Group on Particulate Matter Draft Final Report 22,January,200214,February,200166
1.Site
2.Member State
CandidateInstrument
3.Reference Instrument
4.Season & Period
5.Season or Period
MeanCandidate
6.Season or Period
MeanReference:
7Regression Equation
10 Industr�l TEOM � insidehousing 500C inlettemp
LVS - Kleinfiltergerat Summer (19/08/99 �30/09/99)
23 µgm-3 24 µgm-3 Y=0.9616x+0.0414
11 Industr�l TEOM � insidehousing 500C inlettemp
LVS - Kleinfiltergerat Winter (01/10/99 �31/03/00)
26 µgm-3 27 µgm-3 Y=0.9315+0.3895
12 Industr�l TEOM � insidehousing 500C inlettemp
LVS - Kleinfiltergerat Summer (01/04/99 �09/08/00)
23 µgm-3 24 µgm-3 Y=0.7352+4.8743
13 CityCentre
TEOM � insidehousing 500C inlettemp
LVS - Kleinfiltergerat Winter (02/12/99 �31/03/00)
18 µgm-3 20 µgm-3 Y=0.602x+5.7831
14 CityCentre
TEOM � insidehousing 500C inlettemp
LVS - Kleinfiltergerat Summer (01/04/00 �12/07/00)
26 µgm-3 28 µgm-3 Y=0.874x+1.5559

EC Working Group on Particulate Matter Draft Final Report 22,January,200214,February,200167
8.Number of
Exceedences(50ug/m3 24hr
mean)Candidate
9.Number of
Exceedences(50ug/m3 24 hr mean)
References
10r2 value
&sample size
11Modifications to
Instrument
12STP or
Ambient
13Modifications to
data
14Other analysis
1 9 15 0.8512 (n=81) None STP Regression notforced through �0�
None
2 18 53 0.8139 (n=141) None STP Regression notforced through �0�
None
3 15 28 0.4358 (n=63) None STP Regression notforced through �0�
None
4 0 6 0.8623 (n=86) None STP Regression notforced through �0�
None
5 0 9 0.8391 (n=118) None STP Regression notforced through �0�
None
6 0 9 0.7716 (n=68) None STP Regression notforced through �0�
None
7 0 0 0.3905 (n=68) None STP Regression notforced through �0�
None
8 0 0 0.4754 (n=143) None STP Regression notforced through �0�
None
9 0 8 0.3725 (n=102) None STP Regression notforced through �0�
None
10 1 0 0.9335 (n=18) None STP Regression notforced through �0�
None
11 7 9 0.9582 (n=86) None STP Regression notforced through �0�
None
12 1 4 0.8241 (n=66) None STP Regression notforced through �0�
None
13 0 1 0.6445 (n=77) None STP Regression notforced through �0�
None
14 4 7 0.9005 (n=70) None STP Regression notforced through �0�
None

EC Working Group on Particulate Matter Draft Final Report 22,January,200214,February,200168
Additional information on data from UK
� Results shown cover only concentrations where both TEOM and LVS are less than 100 µg/m3. Where either instrument has registered afixed 24-hour concentration greater than this value, data have been removed from the regression analysis.
� The sites are located accordingly:Kerbside (records 1-3) � Marylebone RoadUrban Background (records 4-6) � ThurrockRural (records 7-9) � HarwellIndustrial (records 10-12) � Port TalbotCity Centre (records 13 and 14) � Glasgow
� For each of the locations listed above, results for seasonal periods broadly defined as �Summer� and �Winter� are given and which coverApril � Sept., and Oct.- March, respectively. Specific dates are given for each period in order to indicate exact monitoring periods.
� The data analysis has been carried out on data gathered from both instruments where a full 24-hour monitoring period has been carried out.
� Data gathered from the national network from the TEOM�s at each site have been fully ratified up to, and including, the second quarter of2000. Consequently, the results covering the period �Summer�2000 should be treated as provisional.

EC Working Group on Particulate Matter Draft Final Report 22,January,200214,February,200169
References:
1. Council Directive 1996/62/EC of 27 September 1996. On ambient air qualityassessment and monitoring.
2. Council Directive 1999/30/EC of 22 April 1999. Relating to limit values forsulphur dioxide, nitrogen dioxide and oxides of nitrogen, particulate matter andlead in ambient air.
3. European Standard EN 12341. Final draft July 1998. Air Quality �Determination of the PM10 fraction of suspended particulate matter � Referencemethod and field test procedure to demonstrate reference equivalence ofmeasurement methods.
4. Workshop on Particulate Matter Monitoring. Venice Italy 12 � 13 June 2000.http://192.167.230.2/meetings/venice2000/