head ct scans per 1,000 children (2007-10, age-sex-payer adj.) 14.7 to19.7 (13) 12.3 to
TRANSCRIPT
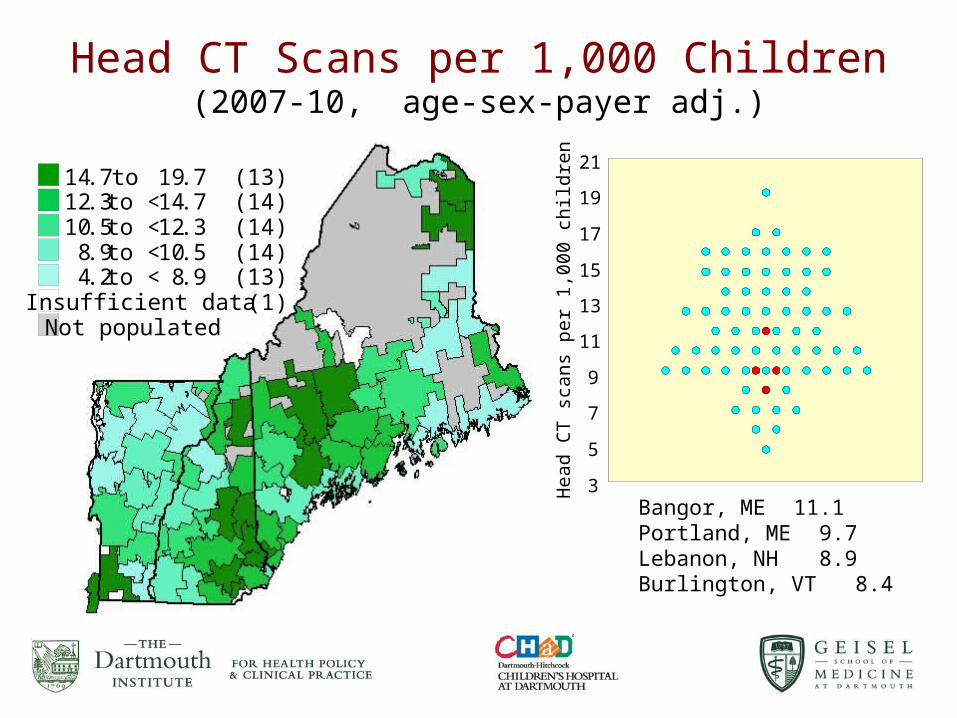
Head CT Scans per 1,000 Children(2007-10, age-sex-payer adj.)
14.7 to 19.7 (13)12.3 to < 14.7 (14)10.5 to < 12.3 (14)
8.9 to < 10.5 (14)4.2 to < 8.9 (13)
Insufficient data (1)Not populated
3
5
7
9
11
13
15
17
19
21
Hea
d CT
sca
ns p
er 1
,000
chi
ldre
n
Bangor, ME 11.1Portland, ME 9.7Lebanon, NH 8.9Burlington, VT 8.4

Is Capacity Destiny?
No, but levels of capacity are strong, and often invisible currents, that health systems row with, or against.

3
• Greater capacity leads to higher utilization of certain types of
care.
• Capacity is generally not located where needs are greater.
• Supply-sensitive tends to have:
– Weak evidence-base about which rate is right.
– Care that occurs after first contact with health care system.
• Often weakly associated with outcomes.
• Is responsible for substantial portion of variation in spending in
the Medicare population.
Supply-Sensitive Care

4
Supply-Sensitive Care
So What? Maybe more is better!

Use of potentially harmful medications Medicare beneficiaries hospital referral regions (2010)
33.2 to 43 .0% (60)28.2 to < 33 .2% (63)23.8 to < 28 .2% (61)21.0 to < 23 .8% (61)14.0 to < 21 .0% (61)Not populated
Just simply worrisome care.

The Dartmouth Atlas of Health Care
Research, surveillance, and public reporting of
unwarranted variation in health care.
Unwarranted variation is variation that cannot be explained by:
• Patient illness• Patient preference
Unwarranted variation is the variation that is explained by differences in health system performance.

7
National Hospital Service Areas
&Hospital Referral
Regions
Dartmouth Atlas of Health Care

Tonsillectomies per 1,000 children among hospital service areas (2007-10)
7.9 to 11.0 (6)5.9 to < 7.9 (6)5.4 to < 5.9 (6)4.3 to < 5.4 (6)2.6 to < 4.3 (6)Not populated
Pediatric Surgical Areas fromjoining Hospital Service Areas

Funded by the Health Services and Resource Administration

Causes, consequences, remedies of variationCategory Cause Consequence Remedy
Unwarranted variation
Evidence-based care Clinician decisions ≠ science
Lower probability of good outcomes
Clinical microsystem improvements
Preference sensitive care
Provider-driven decisions; patients uninformed and not involved in decisions
Pt. doesn’t receive preferred care: the care with highest individual pt. utility
Shared decision making, decisions aids. Better outcomes research. Research in decision quality
Supply sensitive care Capacity that is idiosyncratically located and poorly related to outcomes
Higher resource use with marginal or no patient benefit
Wiser capital and labor investments in health care.
Desired State: Warranted variationCare in response to differences in patient needs and preferences
Application of evidence-based medicine and Shared Decision Making
Better outcomes, including higher decision quality, and often lower costs

The Six Stages of Lossof Professional Certainty
• Denial: “The data is bad.” or “My patients are sicker.”
• Anger: “Who are you to show this information that will be misinterpreted.”
• Acceptance: “OK, something is going on.”
• Curiosity: “What could cause this?”
• Discovery: “I understand the cause!”
• Remedy: “Here’s how we can fix this and let’s do it.”

Challenges assumptions; stimulates new policy
Dissemination
Talks at National and Regional Meetings
Peer-reviewed
Papers
Reports,Atlases,
Web Site,General and
Health Media
Policy Community
Health systems(e.g. hospitals)
Professional Organizations
Media
States
Academic Community
Payers/ Insurance Plans
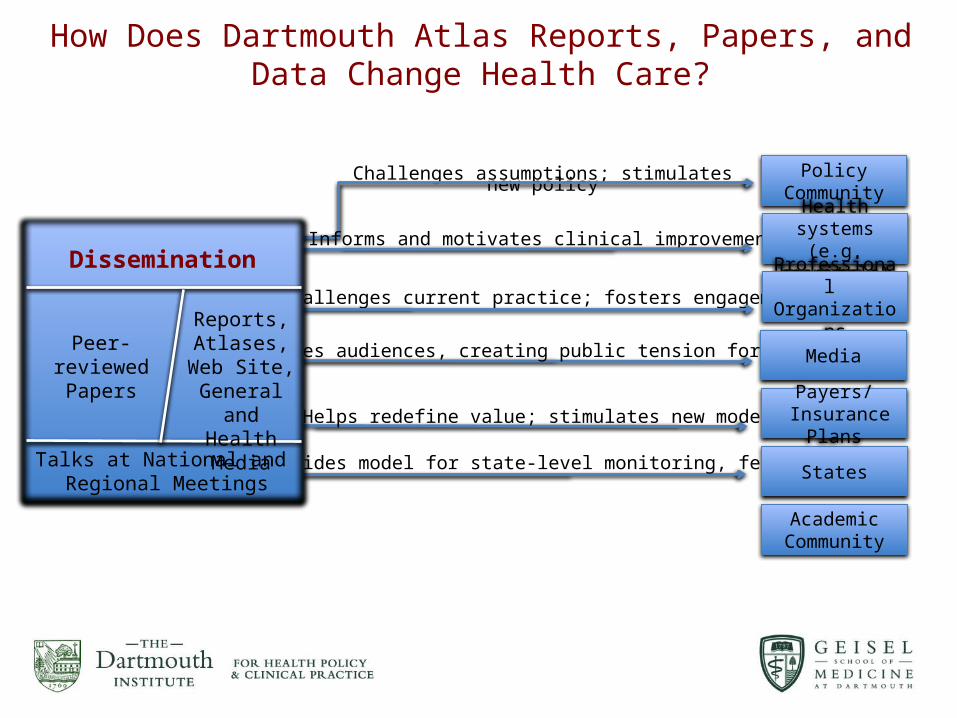
How Does Dartmouth Atlas Reports, Papers, and Data Change Health Care?

Atlas Research Greets Health Reform
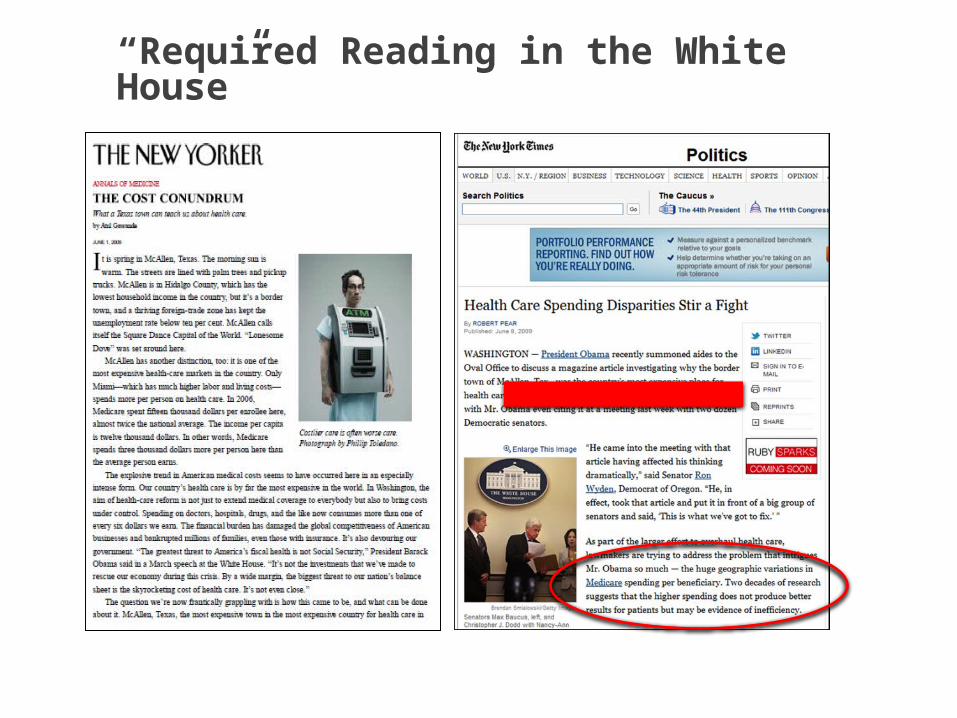
“Required Reading in the White House”
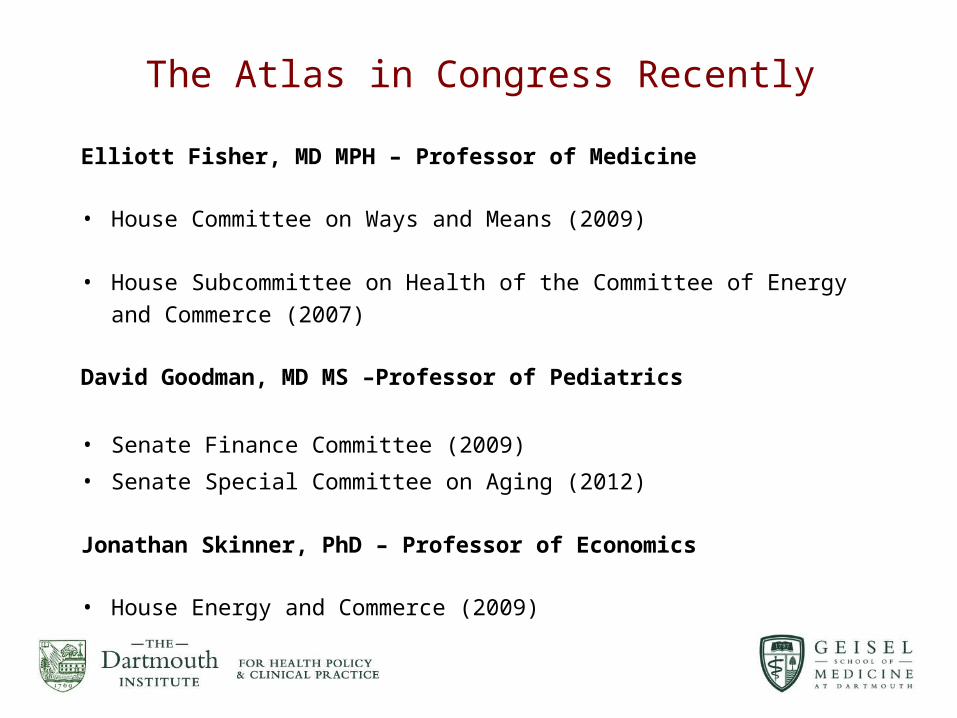
The Atlas in Congress Recently
Elliott Fisher, MD MPH – Professor of Medicine • House Committee on Ways and Means (2009)
• House Subcommittee on Health of the Committee of Energy and Commerce (2007)
David Goodman, MD MS –Professor of Pediatrics
• Senate Finance Committee (2009)
• Senate Special Committee on Aging (2012)
Jonathan Skinner, PhD – Professor of Economics
• House Energy and Commerce (2009)

Challenges assumptions; stimulates new policy
Informs and motivates clinical improvement
Challenges current practice; fosters engagement
Dissemination
Talks at National and Regional Meetings
Peer-reviewed
Papers
Reports,Atlases,
Web Site,General and
Health Media
Policy Community
Health systems(e.g. hospitals)
Professional Organizations
Media
States
Academic Community
Payers/ Insurance Plans
How Does Dartmouth Atlas Reports, Papers, and Data Change Health Care?


Challenges assumptions; stimulates new policy
Informs and motivates clinical improvement
Challenges current practice; fosters engagement
Engages audiences, creating public tension for change
Dissemination
Talks at National and Regional Meetings
Peer-reviewed
Papers
Reports,Atlases,
Web Site,General and
Health Media
Policy Community
Health systems(e.g. hospitals)
Professional Organizations
Media
States
Academic Community
Payers/ Insurance Plans
How Does Dartmouth Atlas Reports, Papers, and Data Change Health Care?

The Dartmouth Atlas of Health Carereports on unwarranted variation
First 6 months 2009:
118 million media impressionsAbout 2,000 unique media markets
Challenges assumptions; stimulates new policy
Informs and motivates clinical improvement
Challenges current practice; fosters engagement
Engages audiences, creating public tension for change
Helps redefine value; stimulates new models
Provides model for state-level monitoring, feedback
Dissemination
Talks at National and Regional Meetings
Peer-reviewed
Papers
Reports,Atlases,
Web Site,General and
Health Media
Policy Community
Health systems(e.g. hospitals)
Professional Organizations
Media
States
Academic Community
Payers/ Insurance Plans
How Does Dartmouth Atlas Reports, Papers, and Data Change Health Care?

Challenges assumptions; stimulates new policy
Informs and motivates clinical improvement
Challenges current practice; fosters engagement
Engages audiences, creating public tension for change
Helps redefine value; stimulates new models
Provides model for state-level monitoring, feedback
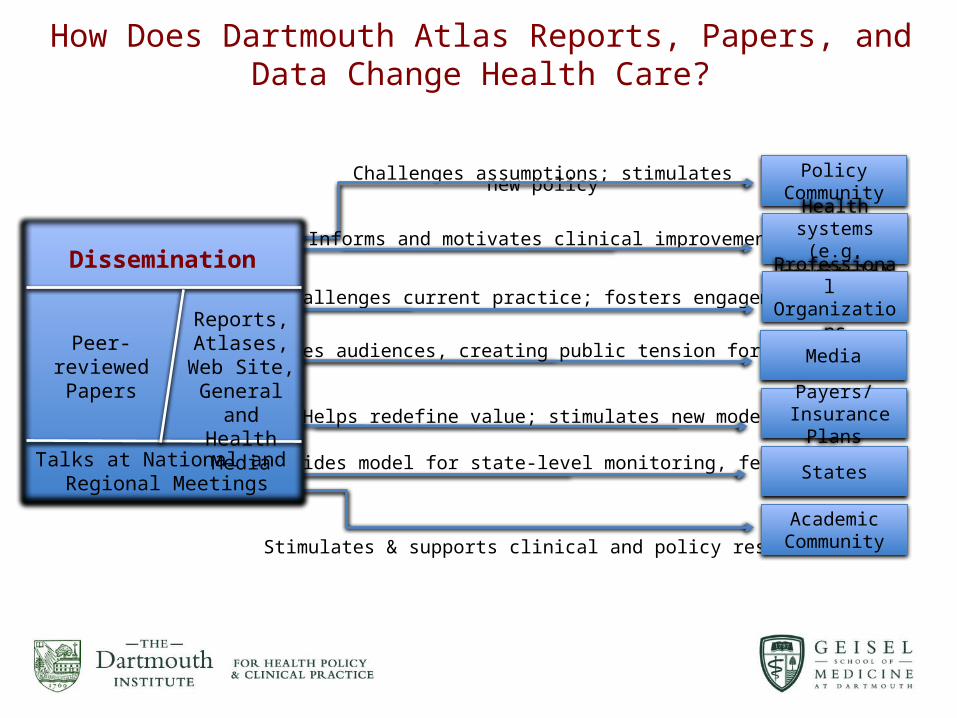
Stimulates & supports clinical and policy research
Dissemination
Talks at National and Regional Meetings
Peer-reviewed
Papers
Reports,Atlases,
Web Site,General and
Health Media
Policy Community
Health systems(e.g. hospitals)
Professional Organizations
Media
States
Academic Community
Payers/ Insurance Plans
How Does Dartmouth Atlas Reports, Papers, and Data Change Health Care?

The Scientific Foundation of the Atlas
A couple hundred research papers.
Lot’s of collaboration with other research groups, including critics.
Open access to as much Atlas data as CMS will permit, and we can afford to provide.

24