health, aging and sexuality in marginalized communities: lgbt older adults emerging from the margins...
TRANSCRIPT
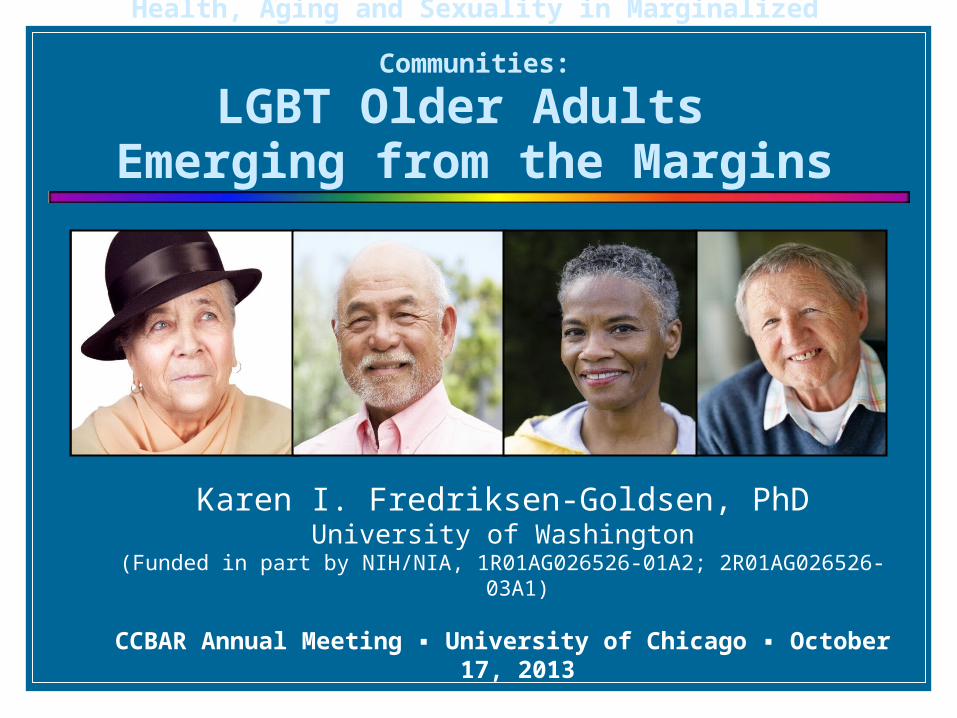
Health, Aging and Sexuality in Marginalized Communities:
LGBT Older Adults Emerging from the Margins
Karen I. Fredriksen-Goldsen, PhDUniversity of Washington
(Funded in part by NIH/NIA, 1R01AG026526-01A2; 2R01AG026526-03A1)
CCBAR Annual Meeting ▪ University of Chicago ▪ October 17, 2013
Marginalization, Health & Aging
Health and Aging in
Marginalized Communities HIV and Medication Adherence in China Healthy Hearts in Tulalip Native Community National Health, Aging and Sexuality: Caring and
Aging with Pride Over Time

Diversity in Aging
Global worldwide aging By 2050, 130 million 50 and older (U.S. Census, 2012) 42% people of color (Vincent & Velkoff, 2010) Two million LGBT adults, age 50 and older Increasing number of diverse LGBT older adults
Research Gaps
Sexual orientation key gap in health research (NIH, 2012; CDC, 2011) LGBT people at-risk and underserved
(Institute of Medicine, 2011) First time in Healthy People 2020 (DHHS, 2011) Rapidly changing social context, policies and laws
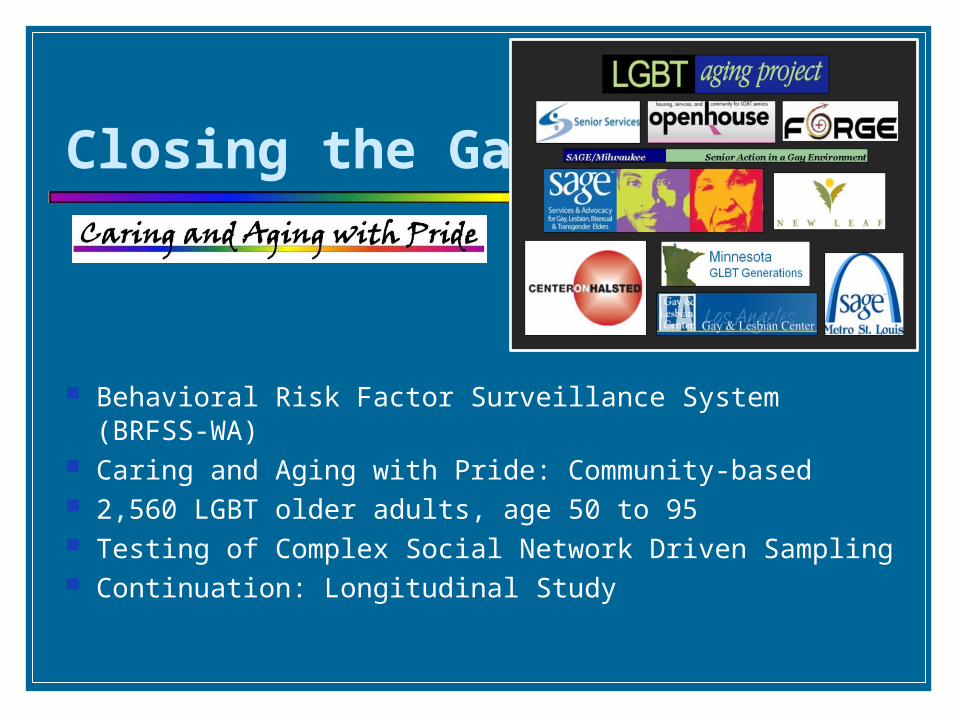
Closing the Gap
Behavioral Risk Factor Surveillance System (BRFSS-WA)
Caring and Aging with Pride: Community-based 2,560 LGBT older adults, age 50 to 95 Testing of Complex Social Network Driven Sampling Continuation: Longitudinal Study
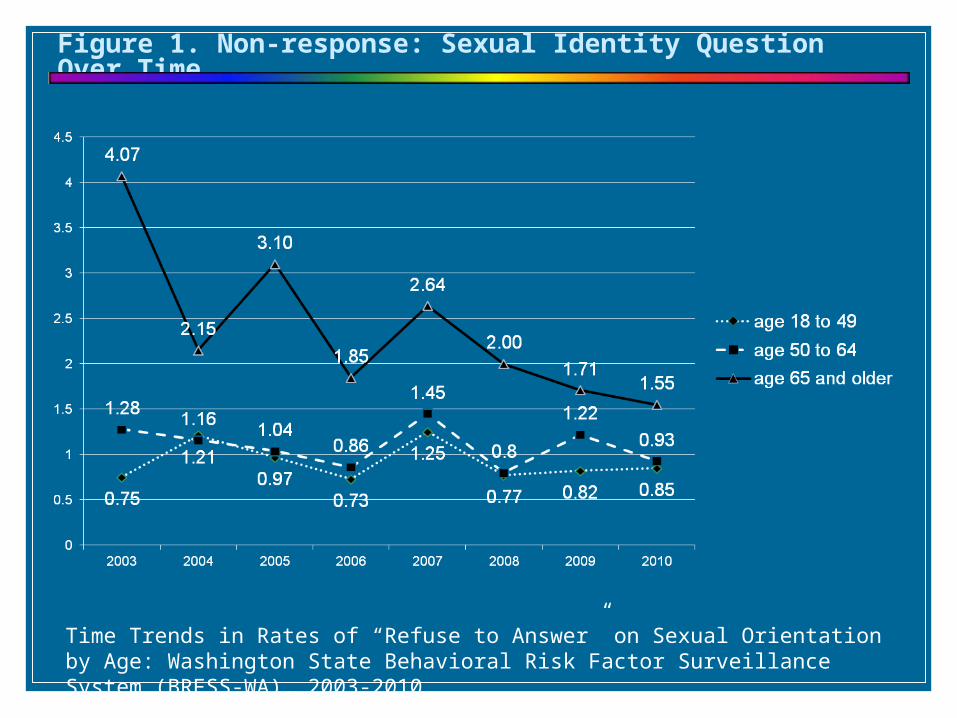
Figure 1. Non-response: Sexual Identity Question Over Time
Time Trends in Rates of “Refuse to Answer” on Sexual Orientation by Age: Washington State Behavioral Risk Factor Surveillance System (BRFSS-WA), 2003-2010
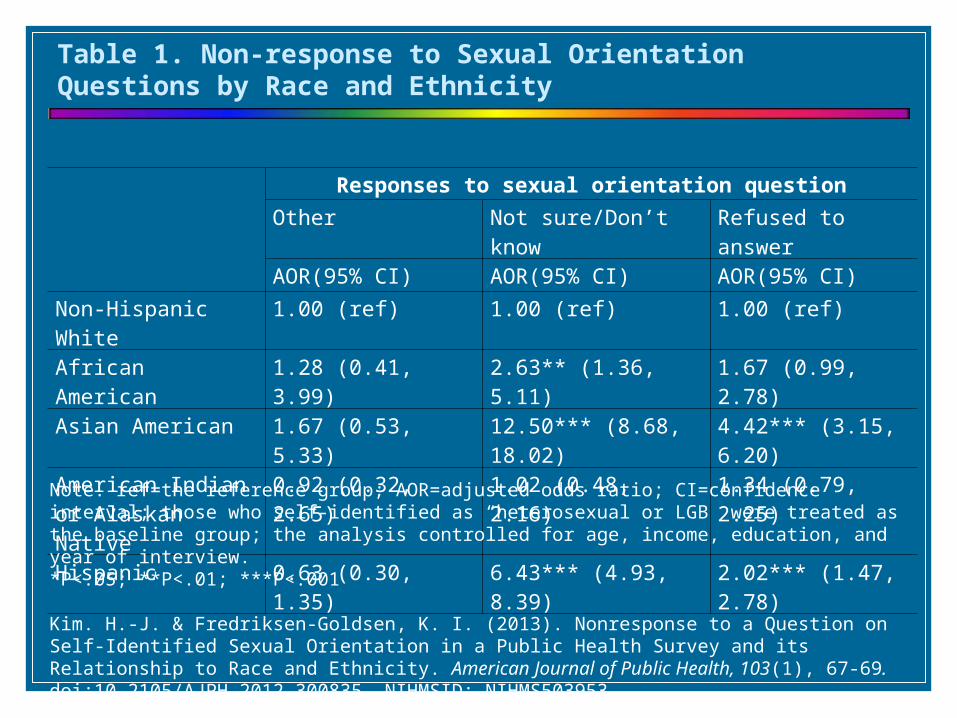
Responses to sexual orientation question
Other Not sure/Don’t know Refused to answer
AOR(95% CI) AOR(95% CI) AOR(95% CI)
Non-Hispanic White 1.00 (ref) 1.00 (ref) 1.00 (ref)
African American 1.28 (0.41, 3.99) 2.63** (1.36, 5.11) 1.67 (0.99, 2.78)
Asian American 1.67 (0.53, 5.33) 12.50*** (8.68, 18.02) 4.42*** (3.15, 6.20)
American Indian or Alaskan Native
0.92 (0.32, 2.65) 1.02 (0.48, 2.16) 1.34 (0.79, 2.25)
Hispanic 0.63 (0.30, 1.35) 6.43*** (4.93, 8.39) 2.02*** (1.47, 2.78)
Note. ref=the reference group; AOR=adjusted odds ratio; CI=confidence interval; those who self-identified as “heterosexual or LGB” were treated as the baseline group; the analysis controlled for age, income, education, and year of interview.*P<.05; **P<.01; ***P<.001
Kim. H.-J. & Fredriksen-Goldsen, K. I. (2013). Nonresponse to a Question on Self-Identified Sexual Orientation in a Public Health Survey and its Relationship to Race and Ethnicity. American Journal of Public Health, 103(1), 67-69. doi:10.2105/AJPH.2012.300835. NIHMSID: NIHMS503953
Table 1. Non-response to Sexual Orientation Questions by Race and Ethnicity
AOR = Adjusted Odds Ratio. Reference Group = Heterosexuals*p < .05. **p < .01. ***p < .001
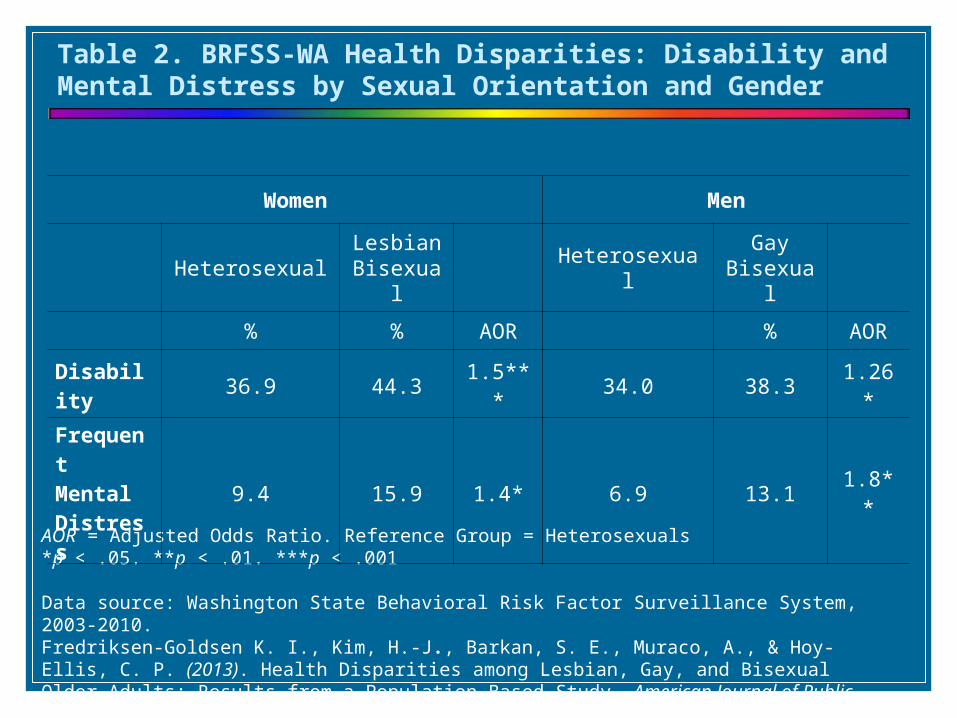
Data source: Washington State Behavioral Risk Factor Surveillance System, 2003-2010.Fredriksen-Goldsen K. I., Kim, H.-J., Barkan, S. E., Muraco, A., & Hoy-Ellis, C. P. (2013). Health Disparities among Lesbian, Gay, and Bisexual Older Adults: Results from a Population-Based Study, American Journal of Public Health, 103(10), 1802-1809. doi: 10.2105/AJPH.2012.301110
Women Men
HeterosexualLesbianBisexual
HeterosexualGay
Bisexual
% % AOR % AOR
Disability 36.9 44.3 1.5*** 34.0 38.3 1.26*
Frequent Mental Distress
9.4 15.9 1.4* 6.9 13.1 1.8**
Table 2. BRFSS-WA Health Disparities: Disability and Mental Distress by Sexual Orientation and Gender

Health Disparities: Distinct Risks
Lesbians and bisexual women:
CVD risk and obesity Gay and bisexual men:
Poor physical health and living alone
► “LGBT” is often used in research and services yet they are distinct groups with specific needs

Multi-level context
Structural levels(social exclusion,
institutional heterosexism)
Individual levels (micro-
aggressions, discrimination, victimization)
Adverse and Health-Promoting Pathways
Psychosocial (distinct social relations, social support, social network, LGBT community integration)
Behavioral (exercise, diet, preventative care, sexual behavior, smoking)
Biological (higher cortisol levels, allostatic load)
Health
Physical(physical health-
related quality of life, HIV, obesity,
cancer, CVD, disability)
Mental (mental health-
related quality of life, anxiety,
depression, suicidal ideation)
Social Positions (intersectionality)
Life course (risks and opportunities)
Figure 2. Health Equity Model
Life Course Perspective
Social context Cultural meaning Structural location
Pre-and Post-Stonewall Silent Generation Baby-Boomer
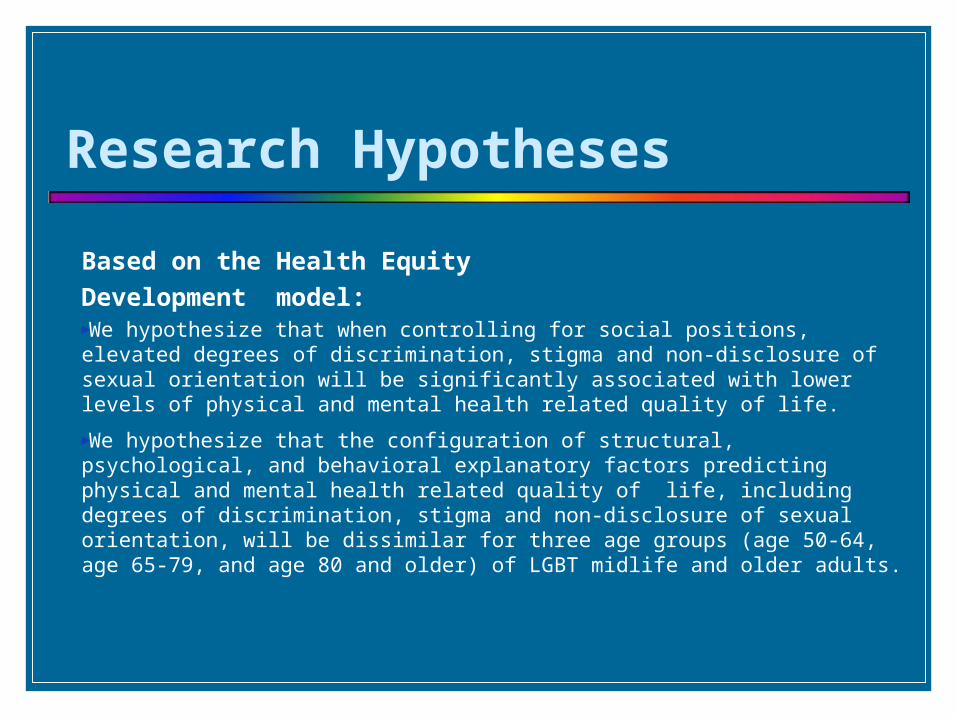
Research Hypotheses
Based on the Health Equity
Development model:►We hypothesize that when controlling for social positions, elevated degrees of discrimination, stigma and non-disclosure of sexual orientation will be significantly associated with lower levels of physical and mental health related quality of life.
►We hypothesize that the configuration of structural, psychological, and behavioral explanatory factors predicting physical and mental health related quality of life, including degrees of discrimination, stigma and non-disclosure of sexual orientation, will be dissimilar for three age groups (age 50-64, age 65-79, and age 80 and older) of LGBT midlife and older adults.
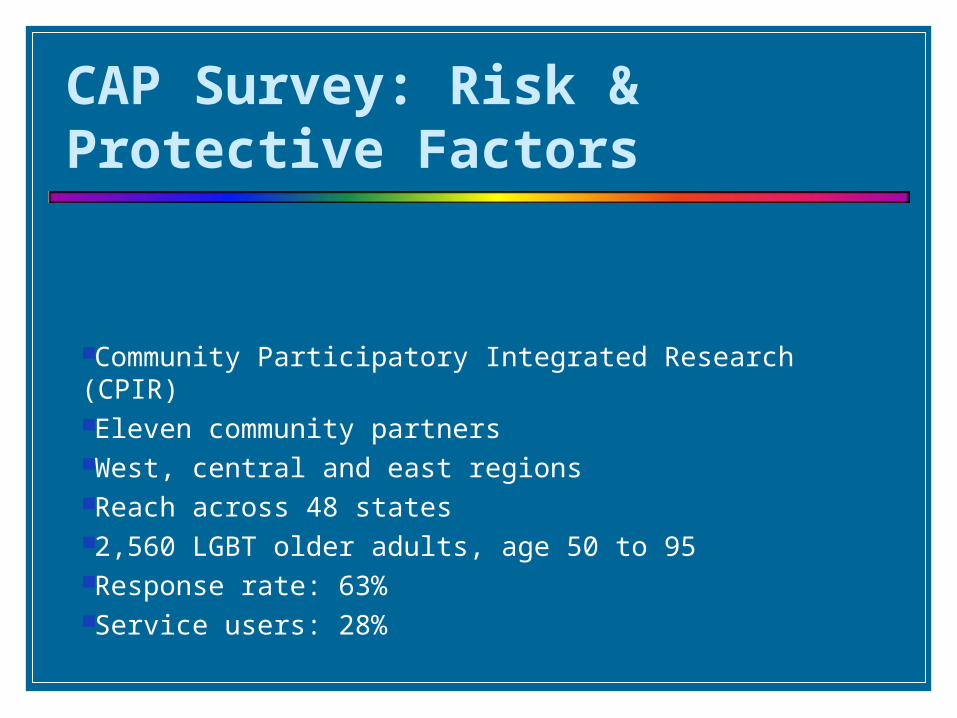
CAP Survey: Risk & Protective Factors
Community Participatory Integrated Research (CPIR)Eleven community partnersWest, central and east regionsReach across 48 states2,560 LGBT older adults, age 50 to 95Response rate: 63%Service users: 28%
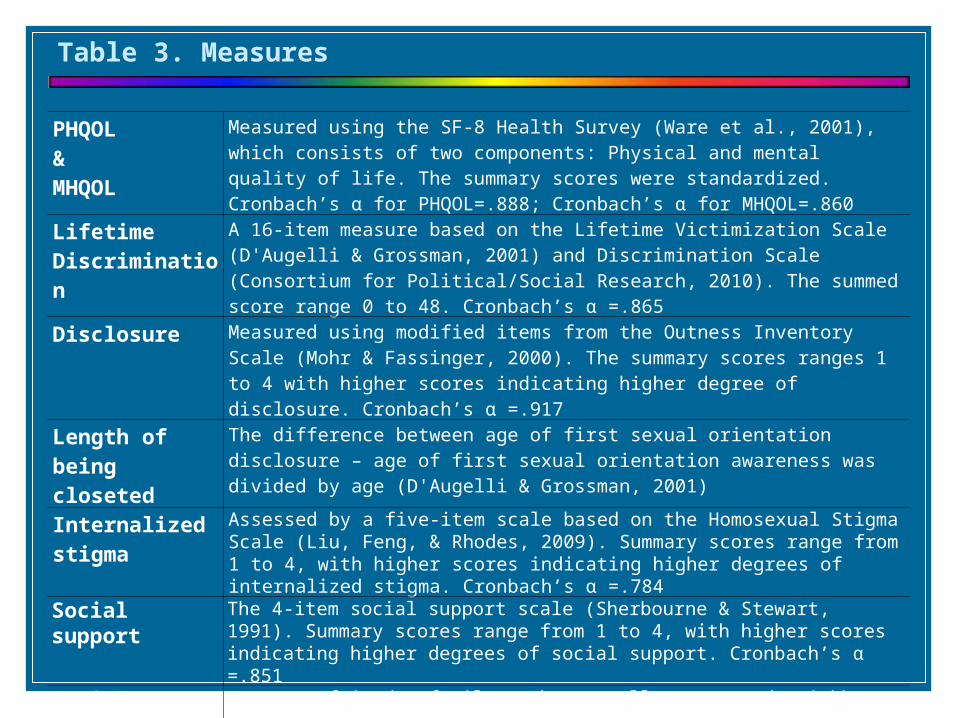
Table 3. Measures
PHQOL&MHQOL
Measured using the SF-8 Health Survey (Ware et al., 2001), which consists of two components: Physical and mental quality of life. The summary scores were standardized. Cronbach’s α for PHQOL=.888; Cronbach’s α for MHQOL=.860
Lifetime Discrimination
A 16-item measure based on the Lifetime Victimization Scale (D'Augelli & Grossman, 2001) and Discrimination Scale (Consortium for Political/Social Research, 2010). The summed score range 0 to 48. Cronbach’s α =.865
Disclosure Measured using modified items from the Outness Inventory Scale (Mohr & Fassinger, 2000). The summary scores ranges 1 to 4 with higher scores indicating higher degree of disclosure. Cronbach’s α =.917
Length of being closeted
The difference between age of first sexual orientation disclosure – age of first sexual orientation awareness was divided by age (D'Augelli & Grossman, 2001)
Internalized stigma
Assessed by a five-item scale based on the Homosexual Stigma Scale (Liu, Feng, & Rhodes, 2009). Summary scores range from 1 to 4, with higher scores indicating higher degrees of internalized stigma. Cronbach’s α =.784
Social support The 4-item social support scale (Sherbourne & Stewart, 1991). Summary scores range from 1 to 4, with higher scores indicating higher degrees of social support. Cronbach’s α =.851
Social network size
How many friends, family members, colleagues, and neighbors they interact with in a typical month? The total size of social network was calculated and summarized by quartiles, with 1 indicating small social network (bottom 25%) and 4 indicating very large social network (top 25%).
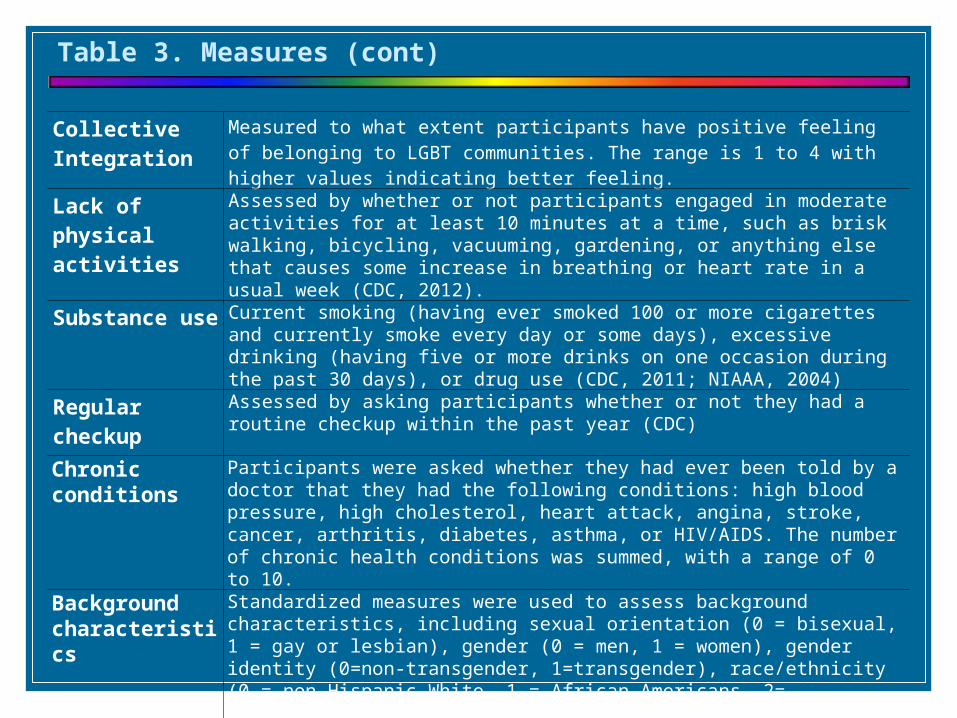
Table 3. Measures (cont)
Collective Integration
Measured to what extent participants have positive feeling of belonging to LGBT communities. The range is 1 to 4 with higher values indicating better feeling.
Lack of physical activities
Assessed by whether or not participants engaged in moderate activities for at least 10 minutes at a time, such as brisk walking, bicycling, vacuuming, gardening, or anything else that causes some increase in breathing or heart rate in a usual week (CDC, 2012).
Substance use Current smoking (having ever smoked 100 or more cigarettes and currently smoke every day or some days), excessive drinking (having five or more drinks on one occasion during the past 30 days), or drug use (CDC, 2011; NIAAA, 2004)
Regular checkup
Assessed by asking participants whether or not they had a routine checkup within the past year (CDC)
Chronic conditions
Participants were asked whether they had ever been told by a doctor that they had the following conditions: high blood pressure, high cholesterol, heart attack, angina, stroke, cancer, arthritis, diabetes, asthma, or HIV/AIDS. The number of chronic health conditions was summed, with a range of 0 to 10.
Background characteristics
Standardized measures were used to assess background characteristics, including sexual orientation (0 = bisexual, 1 = gay or lesbian), gender (0 = men, 1 = women), gender identity (0=non-transgender, 1=transgender), race/ethnicity (0 = non-Hispanic White, 1 = African Americans, 2= Hispanics, 3 = others), income (0 = above 200% of the federal poverty level [FPL], 1 = at or below 200% FPL), unemployment, education (0 = some college or more, 1 = high school or less), relationships status (0 = married or partnered, 1 = other), and residency (0=rural, 1=urban).

Table 4. Background Characteristics
All Sample Age 50-64 Age 65-79 Age 80 + p
Lesbian/Gay (vs. Bisexual) 92.94% 91.37% 94.64% 91.90% 0.008
Female 37.15% 44.78% 32.99% 22.35% 0.000
Transgender 6.83% 10.51% 4.23% 2.35% 0.000
Race
White 86.50% 84.22% 87.14% 93.70% 0.006
Black 3.50% 4.34% 3.11% 1.57%
Hispanic 5.59% 6.12% 5.78% 2.36%
Others 4.41% 5.32% 3.97% 2.36%
Poverty 30.72% 26.76% 32.97% 38.77% 0.000
Unemployment 56.11% 34.77% 70.34% 86.22% 0.000
High school or less 7.93% 6.98% 8.60% 9.06% 0.268
Partnered/married 44.32% 48.19% 43.45% 30.95% 0.000
Urban 96.63% 96.44% 96.60% 97.61% 0.712
# of Chronic Conditions 1.955 (.029) 1.666 (.042) 2.165 (.042) 2.286 (.090) .000
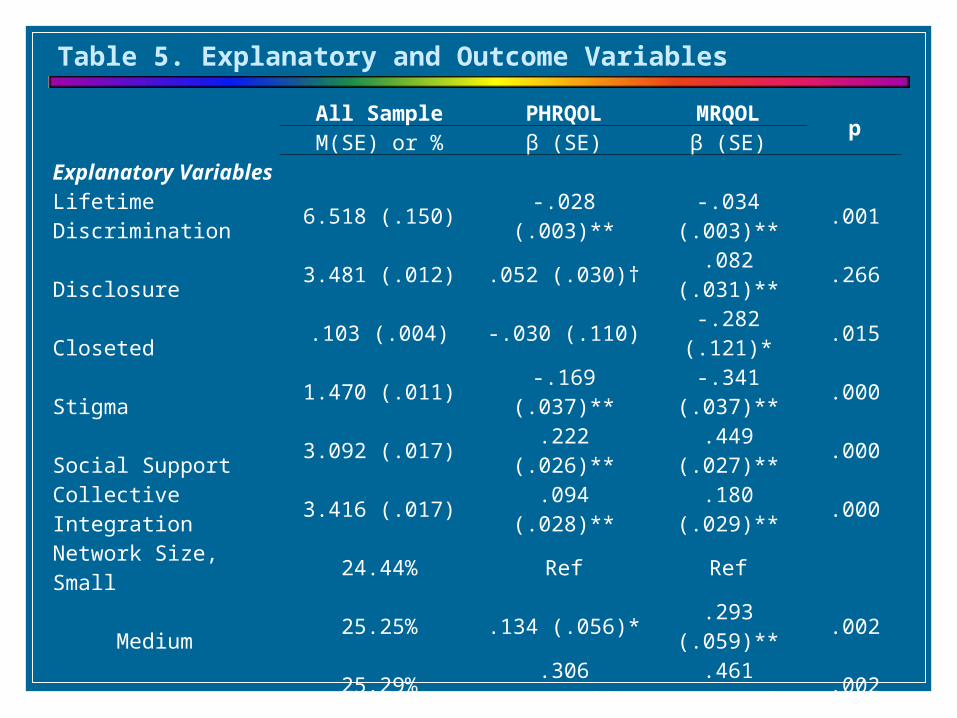
Table 5. Explanatory and Outcome Variables
All Sample PHRQOL MRQOLp
M(SE) or % β (SE) β (SE)Explanatory VariablesLifetime Discrimination 6.518 (.150) -.028 (.003)** -.034 (.003)** .001Disclosure 3.481 (.012) .052 (.030)† .082 (.031)** .266Closeted .103 (.004) -.030 (.110) -.282 (.121)* .015Stigma 1.470 (.011) -.169 (.037)** -.341 (.037)** .000Social Support 3.092 (.017) .222 (.026)** .449 (.027)** .000Collective Integration 3.416 (.017) .094 (.028)** .180 (.029)** .000Network Size, Small 24.44% Ref Ref Medium 25.25% .134 (.056)* .293 (.059)** .002 Large 25.29% .306 (.060)** .461 (.062)** .002 Very large 25.02% .276 (.059)** .580 (.059)** .000Lack of Physical Activity 15.06% -.659 (.057)** -.602 (.061)** .290Substance Use 25.05% -.084 (.047)† -.249 (.049)** .000Regular Health Check 82.32% .011 (.053) .163 (.051)** .000# of Chronic Conditions 1.955 (.029) -.280 (.012)** -.180 (.013)* .00Outcome VariablesPhysical Quality of Life .000 (.020) -- -- --Mental Quality of Life .000 (.020) -- -- --
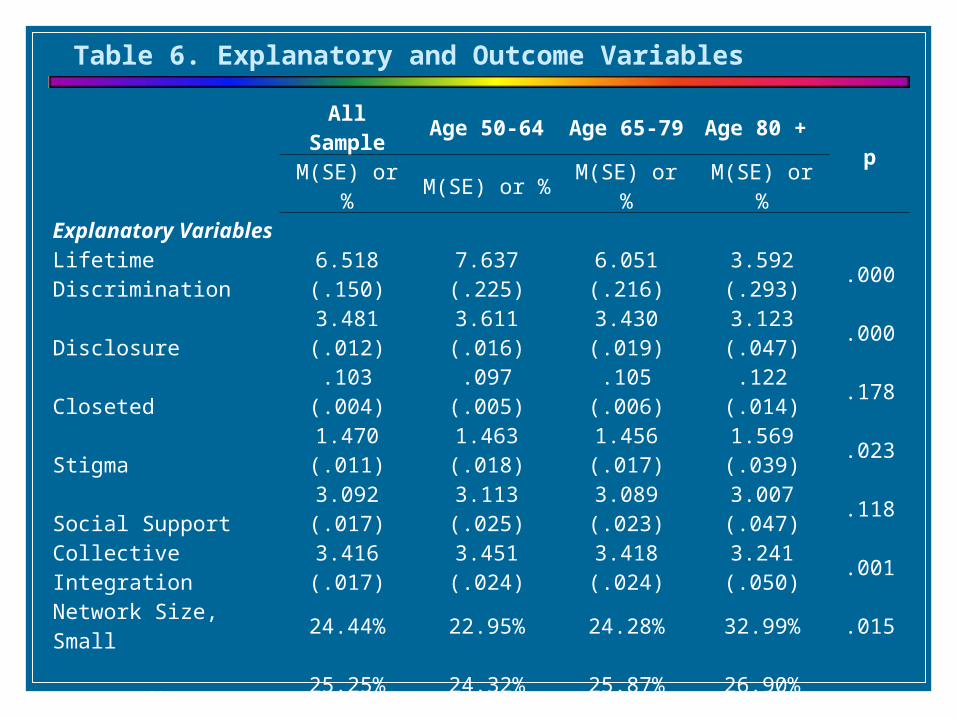
Table 6. Explanatory and Outcome Variables
All Sample Age 50-64 Age 65-79 Age 80 + p
M(SE) or % M(SE) or % M(SE) or % M(SE) or %Explanatory VariablesLifetime Discrimination 6.518 (.150) 7.637 (.225) 6.051 (.216) 3.592 (.293) .000Disclosure 3.481 (.012) 3.611 (.016) 3.430 (.019) 3.123 (.047) .000Closeted .103 (.004) .097 (.005) .105 (.006) .122 (.014) .178Stigma 1.470 (.011) 1.463 (.018) 1.456 (.017) 1.569 (.039) .023Social Support 3.092 (.017) 3.113 (.025) 3.089 (.023) 3.007 (.047) .118Collective Integration 3.416 (.017) 3.451 (.024) 3.418 (.024) 3.241 (.050) .001Network Size, Small 24.44% 22.95% 24.28% 32.99% .015 Medium 25.25% 24.32% 25.87% 26.90% Large 25.29% 25.29% 26.46% 19.29% Very large 25.02% 27.44% 23.39% 20.81%Lack of Physical Activity 15.06% 13.82% 14.06% 25.30% .000Substance Use 25.05% 31.64% 21.05% 12.61% .000Regular Health Check 82.32% 76.18% 87.09% 87.90% .000# of Chronic Conditions 1.955 (.029) 1.666 (.042) 2.165 (.042) 2.286 (.090) .000Outcome VariablesPhysical Quality of Life .000 (.020) .059 (.029) -.004 (.030) -.250 (.060) .000Mental Quality of Life .000 (.020) -.043 (.030) .054 (.030) -.057 (.051) .029
Physical Quality of LifeAge 50-64 Age 65-79 Age 80+
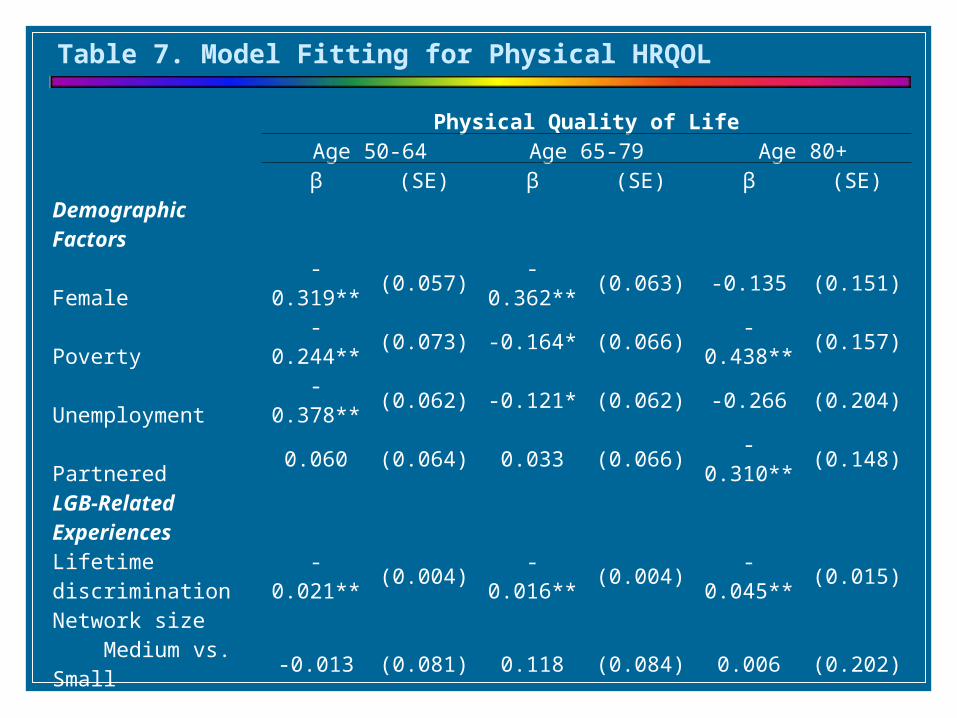
β (SE) β (SE) β (SE)Demographic FactorsFemale -0.319** (0.057) -0.362** (0.063) -0.135 (0.151)Poverty -0.244** (0.073) -0.164* (0.066) -0.438** (0.157)Unemployment -0.378** (0.062) -0.121* (0.062) -0.266 (0.204)Partnered 0.060 (0.064) 0.033 (0.066) -0.310** (0.148)LGB-Related Experiences Lifetime discrimination -0.021** (0.004) -0.016** (0.004) -0.045** (0.015)Network size Medium vs. Small -0.013 (0.081) 0.118 (0.084) 0.006 (0.202) Large vs. Small 0.139 (0.083) 0.203* (0.085) 0.094 (0.233) Very large vs. Small 0.059 (0.082) 0.194* (0.091) 0.236 (0.215)Health Related Conditions Lack of Physical Activity -0.431** (0.081) -0.357** (0.083) -0.546** (0.178)# of Chronic Conditions -0.207** (0.021) -0.238** (0.020) -0.192** (0.049)
Table 7. Model Fitting for Physical HRQOL
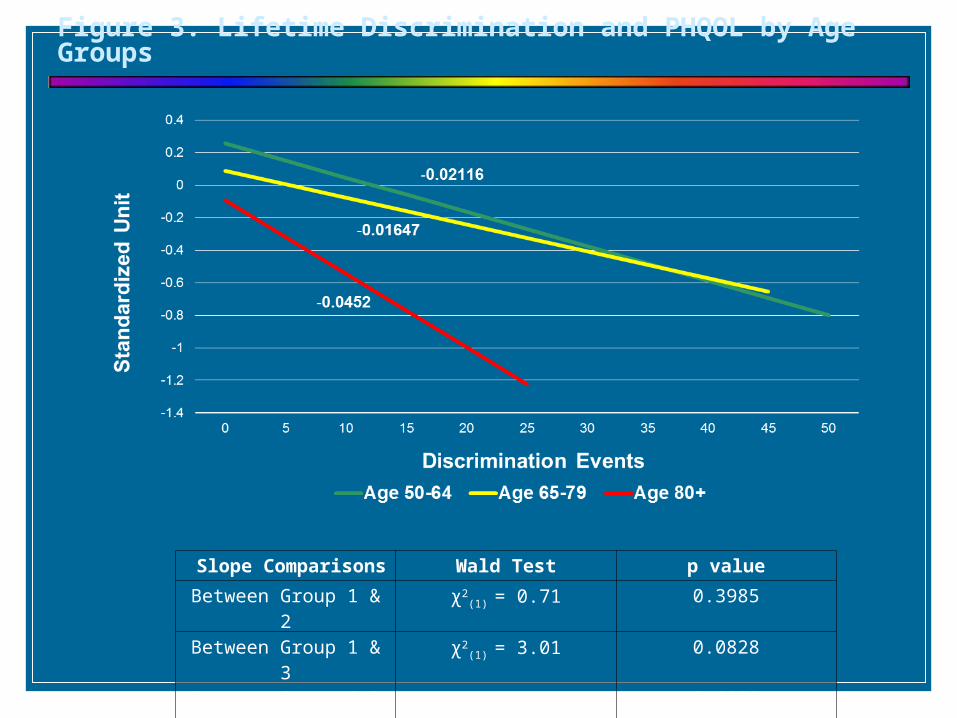
Figure 3. Lifetime Discrimination and PHQOL by Age Groups
Slope Comparisons Wald Test p value
Between Group 1 & 2 χ2(1) = 0.71 0.3985
Between Group 1 & 3 χ2(1) = 3.01 0.0828
Between Group 2 & 3 χ2(1) = 4.41 0.0358
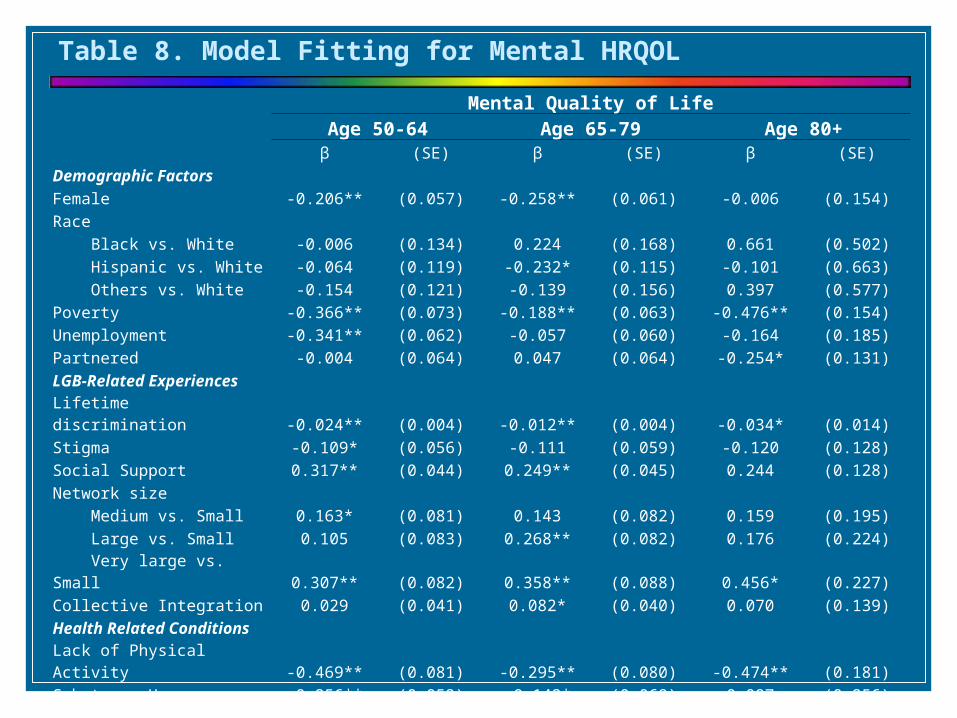
Mental Quality of LifeAge 50-64 Age 65-79 Age 80+
β (SE) β (SE) β (SE)Demographic FactorsFemale -0.206** (0.057) -0.258** (0.061) -0.006 (0.154)Race Black vs. White -0.006 (0.134) 0.224 (0.168) 0.661 (0.502) Hispanic vs. White -0.064 (0.119) -0.232* (0.115) -0.101 (0.663) Others vs. White -0.154 (0.121) -0.139 (0.156) 0.397 (0.577)Poverty -0.366** (0.073) -0.188** (0.063) -0.476** (0.154)Unemployment -0.341** (0.062) -0.057 (0.060) -0.164 (0.185)Partnered -0.004 (0.064) 0.047 (0.064) -0.254* (0.131)LGB-Related Experiences Lifetime discrimination -0.024** (0.004) -0.012** (0.004) -0.034* (0.014)Stigma -0.109* (0.056) -0.111 (0.059) -0.120 (0.128)Social Support 0.317** (0.044) 0.249** (0.045) 0.244 (0.128)Network size Medium vs. Small 0.163* (0.081) 0.143 (0.082) 0.159 (0.195) Large vs. Small 0.105 (0.083) 0.268** (0.082) 0.176 (0.224) Very large vs. Small 0.307** (0.082) 0.358** (0.088) 0.456* (0.227)Collective Integration 0.029 (0.041) 0.082* (0.040) 0.070 (0.139)Health Related Conditions Lack of Physical Activity -0.469** (0.081) -0.295** (0.080) -0.474** (0.181)Substance Use -0.256** (0.059) -0.142* (0.068) 0.087 (0.256)Regular Health Check -0.036 (0.064) 0.172* (0.084) 0.300 (0.283)# of Chronic Conditions -0.100** (0.021) -0.150** (0.019) -0.066 (0.049)
Table 8. Model Fitting for Mental HRQOL
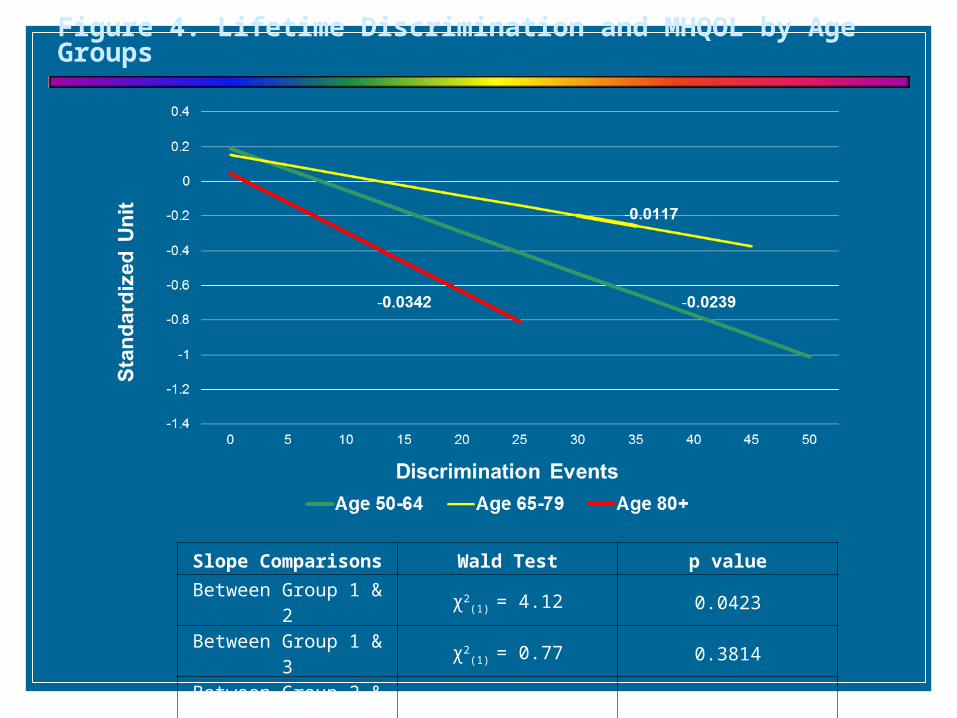
Figure 4. Lifetime Discrimination and MHQOL by Age Groups
Slope Comparisons Wald Test p value
Between Group 1 & 2 χ2(1) = 4.12 0.0423
Between Group 1 & 3 χ2(1) = 0.77 0.3814
Between Group 2 & 3 χ2(1) = 3.531 0.0602
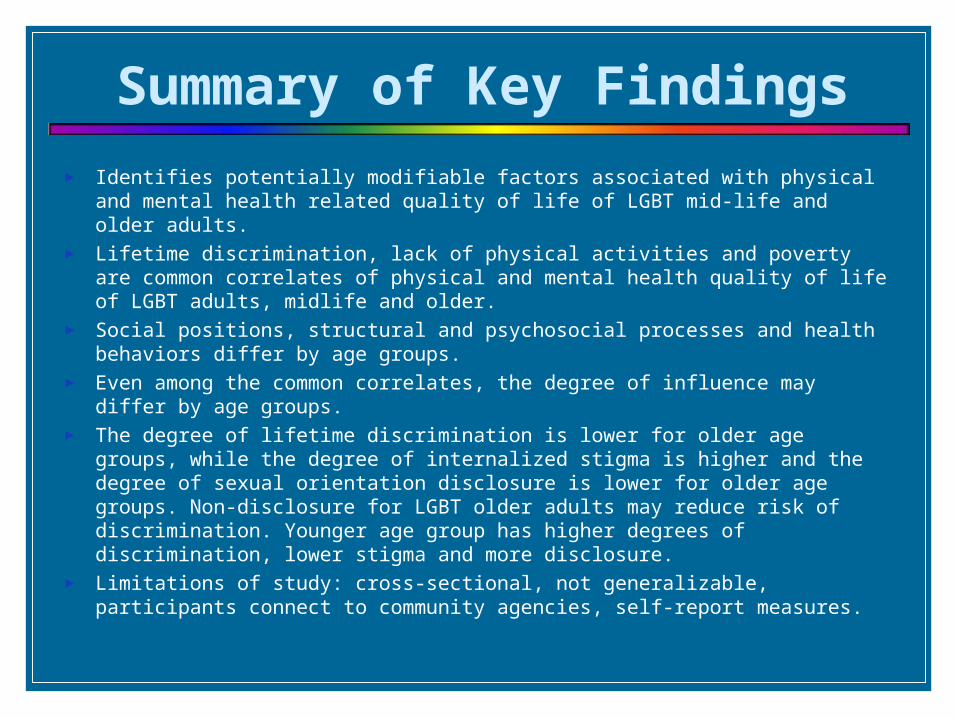
Summary of Key Findings
► Identifies potentially modifiable factors associated with physical and mental health related quality of life of LGBT mid-life and older adults.
► Lifetime discrimination, lack of physical activities and poverty are common correlates of physical and mental health quality of life of LGBT adults, midlife and older.
► Social positions, structural and psychosocial processes and health behaviors differ by age groups.
► Even among the common correlates, the degree of influence may differ by age groups.
► The degree of lifetime discrimination is lower for older age groups, while the degree of internalized stigma is higher and the degree of sexual orientation disclosure is lower for older age groups. Non-disclosure for LGBT older adults may reduce risk of discrimination. Younger age group has higher degrees of discrimination, lower stigma and more disclosure.
► Limitations of study: cross-sectional, not generalizable, participants connect to community agencies, self-report measures.
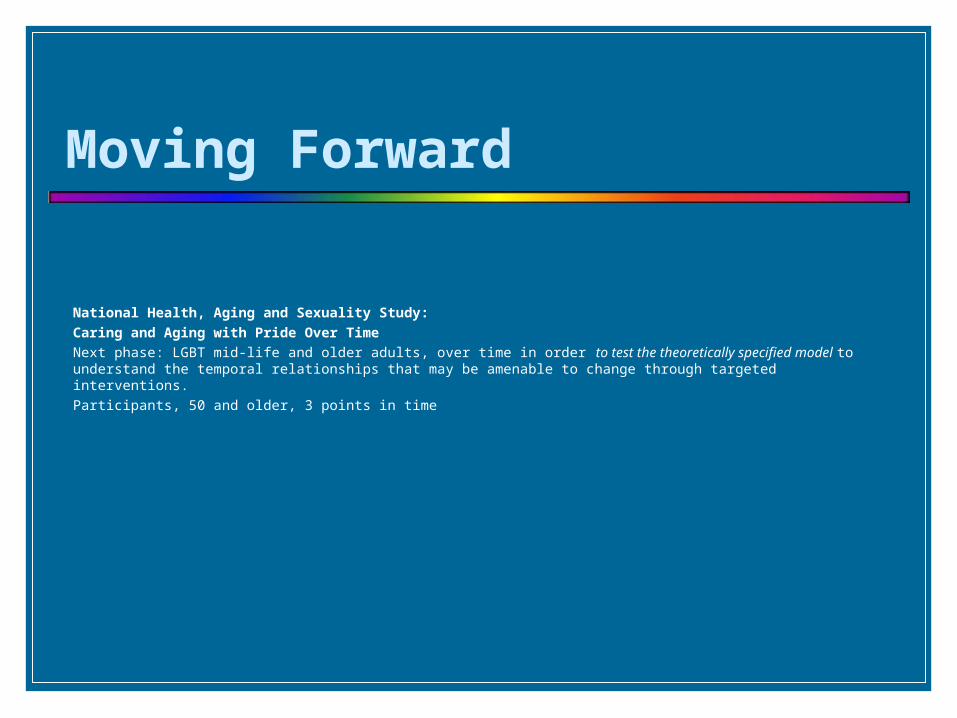
Moving Forward
National Health, Aging and Sexuality Study: Caring and Aging with Pride Over Time Next phase: LGBT mid-life and older adults, over time in order to test the theoretically specified model to understand the
temporal relationships that may be amenable to change through targeted interventions. Participants, 50 and older, 3 points in time
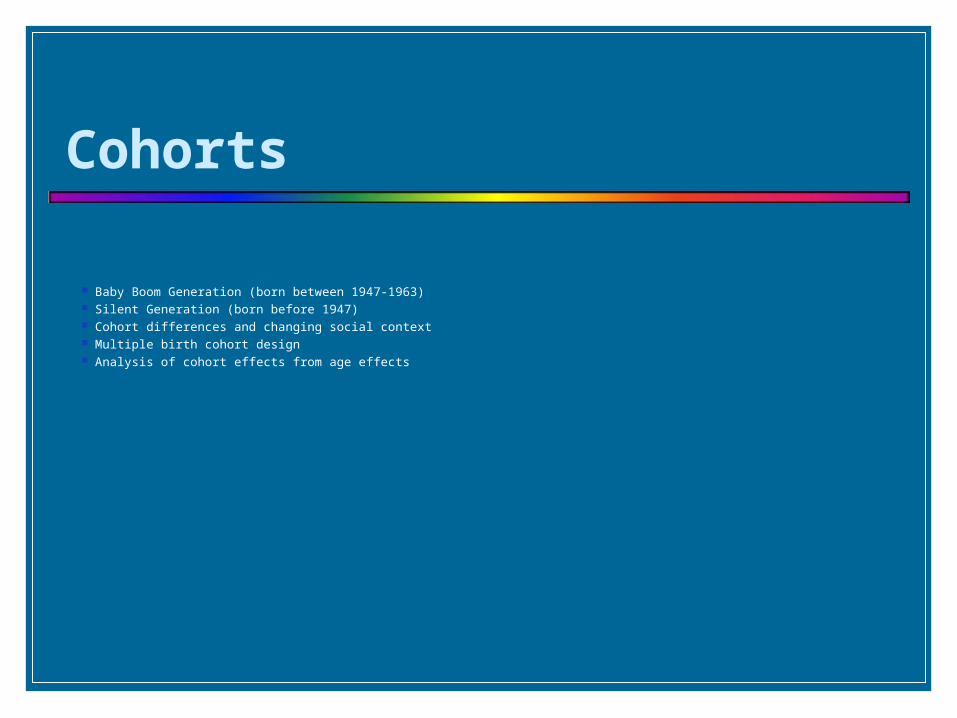
Cohorts
Baby Boom Generation (born between 1947-1963) Silent Generation (born before 1947) Cohort differences and changing social context Multiple birth cohort design Analysis of cohort effects from age effects
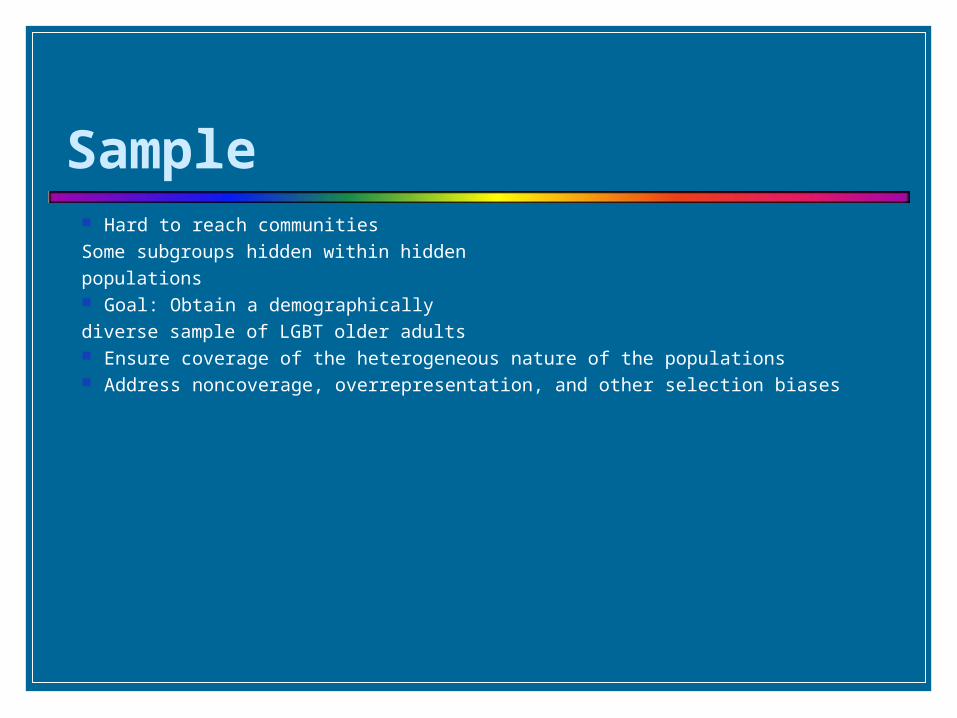
Sample Hard to reach communities
Some subgroups hidden within hidden
populations Goal: Obtain a demographically
diverse sample of LGBT older adults Ensure coverage of the heterogeneous nature of the populations Address noncoverage, overrepresentation, and other selection biases
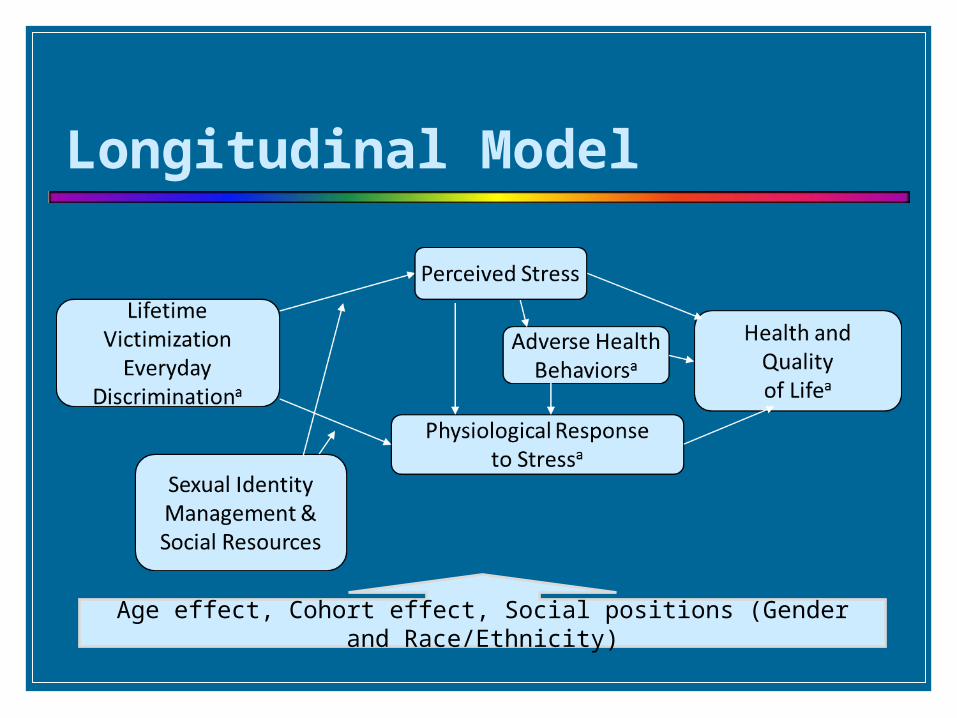
Age effect, Cohort effect, Social positions (Gender and Race/Ethnicity)
Longitudinal Model
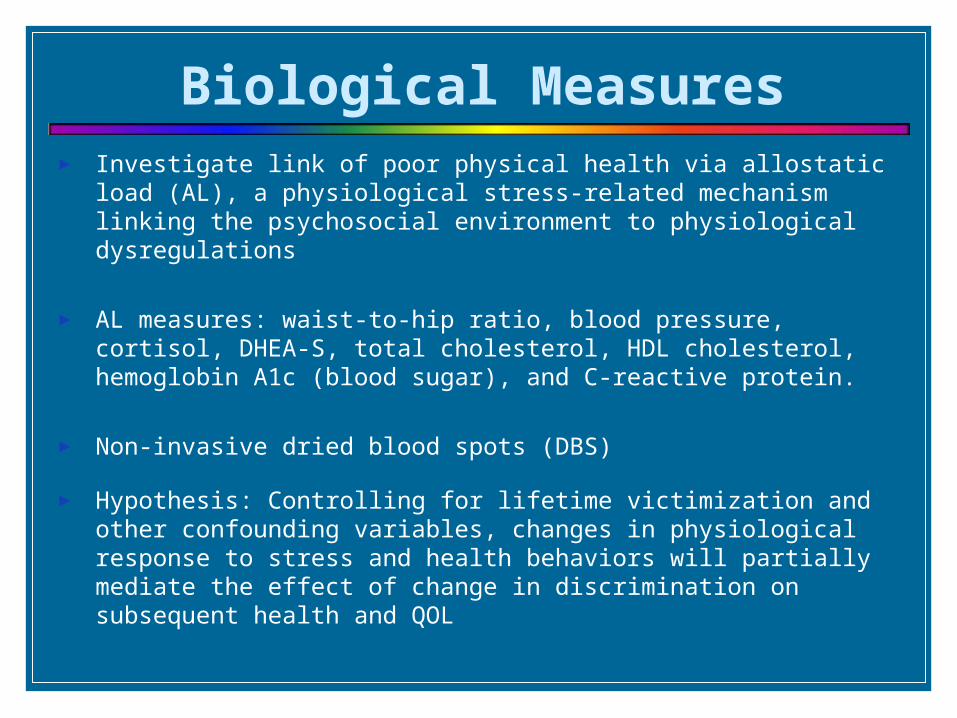
Biological Measures► Investigate link of poor physical health via allostatic load (AL), a
physiological stress-related mechanism linking the psychosocial environment to physiological dysregulations
► AL measures: waist-to-hip ratio, blood pressure, cortisol, DHEA-S, total cholesterol, HDL cholesterol, hemoglobin A1c (blood sugar), and C-reactive protein.
► Non-invasive dried blood spots (DBS)
► Hypothesis: Controlling for lifetime victimization and other confounding variables, changes in physiological response to stress and health behaviors will partially mediate the effect of change in discrimination on subsequent health and QOL
Discussion – How can we maximize the use of bio-measures in this study and obtain quality information given limited resources?
Next Steps