health and development of jamaican infants sally …
TRANSCRIPT

HEALTH AND DEVELOPMENT OF JAMAICAN INFANTS
- A longitudinal.study of the social background health growth,
diet and psychomoto'r development of infants from Kingston Jamaica.
A thesis submitted by
SALLY MARGARET McGREGOR
in fulfillment of the requirements
for the degree of
=Doctor of Medicine
in the.
University of London
August 1974
Department of Paediatrics
and .
Medical Research Council's Epidemiology Unit
University of the West Indies
Mona. Jamaica
la
ABSTRACT
In Chapter I the existing literature on Jamaican infants
is reviewed and the objectives of this study set out.
Chapter II describes how the present survey was carried
out. 300 infants from predominantly lower socio-economic
backgrounds in Kingston, Jamaica, were studied from birth to
1 year of age.
Chapter III describes the social background.
In Chapter IV the incidence of disease is recorded. There
was a generally high prevalence of gastroenteritis and respiratory
infections.
Chapters V and VI describe how the growth in weight, length
and head circumferences was exceptionally good in the first 3
months of life. After that growth was depressed.- 20% of the
children were underweight at some time during the year.
Chapters VII and VIII report the breast feeding habits and
diet of the children. Mixed breast and bottle feeding from 6
weeks to 5 months of age followed by bottle feeding alone was
the commonest method. Factors affecting the method of feeding
are determined. A high incidence of gastroenteritis and poor
weight gain were associated with bottle feeding in the first
few months of life. The brands of proprietary milk and the
solids given to the children are reported.
In Chapter IX the haematological results are presented.
Hb levels were low after 3 months of age, and were associated
with iron deficiency anaemia.
lb
Chapter X describes how the gross motor behaviour of the
children was accelerated compared with the normal child of the
Gesell Developmental Schedules and their language was at least
equal.
In Chapter X1 the factors associated with being underweight
are identified.
In Chapter X11 the mothers attitude to family planning and
their response to repeated personal encouragement to the use of
contraceptives is reported.
In Chapter X111 general conclusions are made, with
recommendations for short term methods of improving child welfare
in Kingston. Areas for future research are suggested.

ACKNOWLEDGMENTS
This work was carried out in the Department. of Paediatrics2University
Hospital of the West Indies, and was partly funded by the Josiah Macy Jnr.
Foundation.
I wish to thank Professor-E. H. Back Iiho was formerly head of the
Department. of Pediatrics and initiated the survey; he recruited the
staff obtained funding, and gave encouragement and help throughout.
I am also grateful to Mrs. P. Desai of the MRC Epidemiology Unit
who gave statistical help throughout and also advised on data collection
and the final text.
I wish to thank Mrs. Buchanan who was the study nurse and showed
great persistence in tracking down the children, and also showed .a
genuine concern for the families developing a good rapport with the
mothers.
My grateful thanks are also due to:-
Dr. M. A. Ashcroft of the MRC Epidemiology Unit who gave advice and
criticism.
Professor C. Miller of the Department of Paediatrics who gave advice
and criticism.
Dr. R. Gray, formerly of the Department of Paediatrics, who helped
with some of the clinics.
Dr. P. Milner of the Department of Haematology who supervised the
haematological laboratory investigations.
Miss Dyer, Mrs. Chambers, Miss Pitcan and Miss Williams who were
the laboratory technicians at different times.

The Hospital for Professor W. A. Hawke, Chief of Psychiatry
sick children, Toronto Canada collabo ra.ted wi'th the study and
did developmental assessments on 66 of the infants when they were
12 months of age. He gave considerable help in reporting this work
excerpts from the published paper are reproduced as an appendix.
would also like to thank the mothers who came to the clinics
in spite of poor public transport and adverse weather, and welcomed
us into their yards during the visits.
Finally, I would like to thank my husband, Roy. McGregor
encouraged; financed and gently bullied me until I finished the thesis.
CONTENTS
Acknowledgments
Contents
List of tables
List of figures
Chapter ' I'. Introduction
The problem
Review- of literature concerning
Jamaican infants
Objectives of the study
Note on- Jamaica
Sample selection and methods.;''.
Sample selection
Data collection
Bias of selection
Loss from study
Multiple births
Chapter III Social background and environment
Standard of housing
Civil status
The mothers.
Boarding out
Removals
Fathers
Maternal competency
Summary

Chapter IV
Page No.
Diseases
Congenital abnormalities 47
Diseases 47
Hospitalisation 5o
Death 50
Discussion 50
Summary 55
Chapter VI
Chapter VII
Weights, lengths and crown-rump lengths
Results 56
Discussion 56
Summary 65
Head circumferences
Results 67
Discussion 67
Summary 73
Breast feeding
Method of feeding 74
Reasons for method of feeding . 74
Other f9.ctors affecting breast feeding 77
Effect on infant Qs health 79
Discussion 80
Summary 81d

Chapter IX
Page No,
Diet
Milk 82
Solids 82
Discussion' 85
Summary 86
Haematology
Results
87
Discussion
93
Summary 100
Chapter Gross motor development
Results 102
Discussion 105
Summary 111
Factors associated with malnutrition
Weight records
Factors associated with low weight
Discussion.
Summary
Family Planning
Results
Discussion
Summary
Chapter VIII
112
113
113
115
121
122
124
127

Page No.
128
Chapter XIII Conclusions • Recommendations
Further relevant research 130
Future research
References
Appendix I
Excerpts from "Developmental Assessment
of Jamaican Infants".
S.M. Grantham-McGregor W.A. Hawke
Develop.Med. Child Neuro1.13,582
1971.
130
132
139
X111
XVII
LIST OF TABLES'
Civil status of mothers at beginning of year.
Civil status according to parity of mothers.
The occupation of mothers.
Age of baby when mothers first worked.
The number of different fathers for the children of 138 of the multiparous mothers.
Type of financial support given by fathers.
The occupation of the fathers.
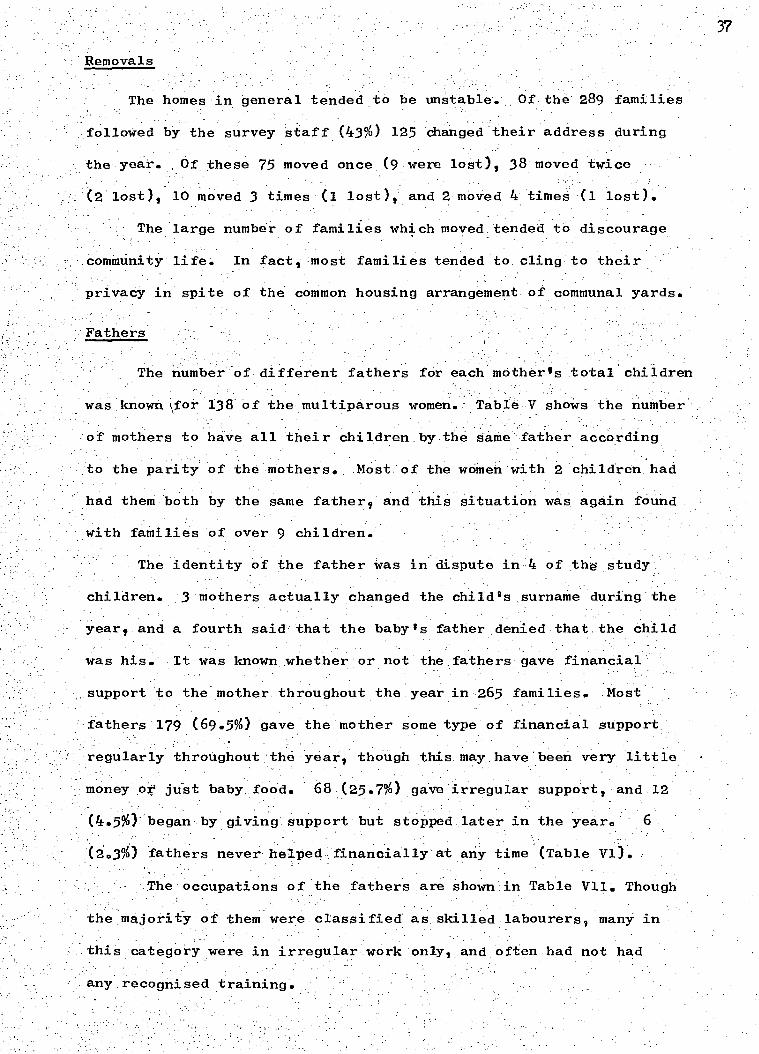
AssociatiOn betWeen maternal competency and standard..of housing.
Association between parity and maternal competency.
Congenital abnormalities found in 272 children.
Illnesses which occurred in 272 children.
Causes of hospitalisation in 272 children.
Means and stsndard deviations of weights, lengths' and crcwn-rump lengths from birth to 1 year of age.
Means and standard deviations of annual weight and length velocities, from birth to 1 year of age.
Comparison of mean birthweights (kgm) of first born male and female infants in the present study with those of infants born to British, Irish and Jamaican parents in London (Barron and Vessey 1966).
30
31
35
36
38
39
61
..XV1 l Incrementsin length (cm) and weight (kgm) from birth to:3monthS of age of male infants .in the present study compared with those mother studies •
Means and standard deviations of head circumference of infants from birth to one year of age.
Means and standard deviations of increments in head circumference of infants from birth to one year of age.
Mean head circumference during the first year of life of white and negro males in various studies.
Incidence of breast, bottle and combined feeding methods at various ages, as a percentage of total.
Answers given by mothers shown as percen.tage of total asked.
69
75

Reasons given by mothers for beginning bottle shown as percentage of total asked. 76
Factors influencing early lactation.
Factors affecting duration of lactation.
Effect of breast feeding on the 'incidence of gastroenteritis.
Effect of breast feeding on weight increments in first 3 months.
. Association between milk intake and the riuinbers in the 10th percentile for weight at 12 months.
Showing the milk formulae used= at 12 months and their cost.
Percentage of infants being given a particular food at each examination.
DiStribution of Hb genotYpes among 300 infants.
Haemoglobin levels (g/100m1) in infa.nts genotype SS, SC,C.C.
Mean haemoglobin levels during their first yearof singleton infants of birth weight 2.5 kgm or more and of haemoglobin genotype AA, AS orAC.
)(XXIII Means and standard deviations of iron indices at 10 months of age, and percentage of anaemic children .
The percentage of infants to achieve milestones at each examination, grouped by -birthweight.
Gross motor and language developmental items aChieved by majority of infants with birth-weights over 2.5 kgm. compated with Gesell Schedules.
Gross motor and language developmental items achieved by majority of infants with birth-weights 2.5 kgm. and under compared with Gesell Schedules.
XXXV11 The effect of sex and socio-economic status • on the age of walking of 216 infants.
9
Page Nos.
XXXV111.
XXX1X
XL
in 15 samples (Hindley
The effect of weight on the walking of 216 infants.
Age of walking 1966) compared with Kingston sample.
The association between different factors and poor weight'at 12 months of age in 270 children.
Association' between poor maternal; competency' and the number of children_on poor milk intake.:
XL11 Association between poor maternal competency and repeated attacks of gastroenteritis. 116
XL111 Association between children of birth order 6 or more and repeated attacks of gastro-enteritis. 117
XL1V,
XLV
XLV1
XLV11
Factors associated with weight in the 10th percentile at 12 months of age in'every child.
The preference of contraception at 3 months after delivery.
Time after delivery when mothers first used contraceptives.
123
123
The use of contraceptives by 169 mothers 12 months after delivery or at, the time of conception.
Reasons given by 55 mothers for not using family planning.
123
125
Time after delivery of estimated date, of conception.
Showing the multifaceted causes of poor infant health and nutrition as demonstrated in this study..
125
129
The mean score and-the distribution of score. in 65 infants at development evaluations. 142.
Factors affecting developmental score. 143
10

11
LIST OF FIGURES
Map of Jamaica
Photograph showing study nurse and technician taking a blood sample during a home visit.
Page No.
16
22'
An average house in front, and a below average house behind.
lV -An access road te. oneOf the study homes.
The infant in this photograph_was the only one admitted to hospital with severe malnutrition. The mother was graded inadequate and had 6 children.
28
28
53
Comparison of lengths of Kingston male infants with those of other studies.
Comparison of weights of Kingston male infants with those of other studies.
63
63
Comparison of mean ratio crown-rump length/ supine length of Kingston male infants with those of male infants in the U.S.A.•(Kasius et al, 1957)• :66
10th, 50th, and 90th percentiles of head circumference of male.infants in Kingston, Jamaica, and Boston, U.S.A. and head, circumferences of 8 Jamaican boys who were malnourished at .1 year of age. 71
The association between haemoglobin level and birthweight group in males and females.
Mean haemoglobin levels of the Kingston children compared with those in Bristol, U.K.(Burman 1972). 96
The percentage, of 226 Kingston children with haemoglobin levels below 11, 10 and 9 gms per 100m1 throughout the year. 98

12
CHAPTER 1
INTRODUCTION
The Problem
The 1st year of life for Jamaican infants is a particularly
vulnerable one as far as their nutritional status and general health
are concerned.
Infant mortality rates provide a good indication of the nutritional
status of infants (Wills and Waterlow 1958), and a comparison of the 1965
mortality figures between Jamaica and England and Wales revealed that
mortality rate in Jamaica for children aged 6 to 24 months was more than
- . 8 times that found in England and Wales (Nutrition Report). The
differences in mortality in other age groups were much less.
In spite of this problem, there was very little information
concerning the growth, diet and development or social background of
Jamaican infants. The scanty information available mostly concerned .
infants in rural areas and did not take into account the :effects
of urbanisation.
Kingston, the capital. city of Jamaical has expanded rapidly in
recent years. New industries have been established and an increasing
number of women were going out to work. People were being exposed to
advertising and the pressures of modern urban life, and due to the • . .
general low standard of education they were often ill-equipped to '.
cope with them. . It was unknown how child rearing habits, infant
feeding and other aspects of the life and health of infants were
being affected by this urbanisation.

13
Review of literature concerning Jamaican infants
Records from the Paediatric Department of the University Hospital
of the West:Indies show that gastroenteritis, respiratory infections,
and malnutrition accounted for the majority of admissions in children
under 2 years of age. Between 1963 and 1966 the incidence of these
diseases were gastroenteritis - 36%, respiratory infections - 22% and
malnutrition 18%. The same diseases were the principal causes of death
at the hospital in children between 1 month and 2 years. From 1963 -
1966 the differenteproportions were malnutrition - 26%, gastroenteritis . ,
- 21% and respiratory infections 16%. (Back - personal communication). iPv
In a review of a random selection of deaths in children aged 6 months
to 3 years in 1963 McKenzie, et al (1967) found that malnutrition was a
contributing cause of death in 64.7% of all deaths.
An examination of the case notes of all admissions to the.
Paediatric Department of the University Hospital of the West Indies
with primary or secondary malnutrition from 1965 to 1967 showed the
peak age incidence to be 12 months. - This agrees with previous findings
of Jelliffe et al (1954). Heights and weights of children also are a
good guide to their health nutritional status and general well being.
However, no systematic records were available for urban Jamaican infants
in 1967. 'A longitudinal study of rural children was being conducted
by the MRC Epidethiology Unit (Jamaica) and preliminary analysis of their
data revealed a serious, delay in growth after the 1st month of life.
Measurements of head circumferences during the 1st year of life
are important in paediatric practice, as many disorders of the central
nervous system cause abnormal rates of growth of the head. No longitudinal
records of head circumferences in Jamaican infants were available.
report of haemoglobin levels in Jamaican children could
14
be found one on rural infants some of whom'a tended welfare clinics,
by Ashcroft et al (1969). They suggested that minor degrees of iron
and folic acid deficiency might be common.
Not much data was available on the diets of infants, except a
few general descriptions of diets from rural areas (Jelliffe and
Williams, 1954) (Standard, 1958). .(Back, 1961). Fox (1968) studied a
small number of Jamaican urban infants and reported that their diets
were deficient in both calories and protein and that the diets of
children under 12 months of age were more deficient than those in any
other age group.
The only information available on the psychomotor developMent.
.of Jamaican infants was a study done in 1935 by Curti et al on 76
children between 1.and 3 years of age attendinga - Kingston creche.-
They evaluated the children on the Gesell schedules and found that
they functioned at a lower level than the North American children
used to standardise the test, except in gross motor behaviour.
There was only scanty information available on the social
background of infants and child-rearing habits of parents. Several
books referred to children, but often their information was not
systematic (Clarke 1957, Blake 19 61, Kerr 1963). Certainly they did
not take into account the changes brought about by rapid urbanisation.
A P.A.H.O. Technical Group Meeting (1970) reported that a short
interval between pregnancies increased the incidence of prematurity,
mortality and malnutrition were also increased dhring the'_first 5 years:
.0f - like.: The birth, rate in Jamaica was high 'at 380 per 1,000 in 1966.
(Annual abstract.of'statiStics.1968), and the''. large size of many families
In Jamaica appeared to play,a'part in the apParently poor health of infants,
HOwever the government of Jamaica had only recently begun to promote the

use of family planning.
Objectives of the Study
It was apparent to most paediatricians in Kingston that there
was a great need for some accurate and systematic information on all
aspects of the' growth, health,. development and social. background of
Kingston infants.
,Ever:Since Spence (1954) 'pioneered longitudinal studies of
child health, such studies have been considered t
comprehensive picture- Of the health and development- of children- and
pro-vide a better insight into the child as a. prodUct of his environment.
-.'It was proposed to conduct a longi-tUdinal study of Kingston
infants ■.■
born at the University Hospital from birth to 1 year of 'age,
with the following specific aims :
(1) To study their environment and social-:background,
and to determine how it was related to their health
and development.
(2) To determine their pattern of health.
(3) To establish records for heights weights and head
circumferences.
(4) To determine the details of breast feeding and the
weaning diet.
(5) To determine Hb levels and serum iron values.
(6) To examine their level of psychomotor development.
(7 ) . To determine . the attitude of Kingston mothers 'in
the.use. of family planning, •and their responSe. to,.
repeated encouragement to the use of contraCeptives. .


17
NOTE ON KINGSTON, JAMAICA
Jamaica is one of the West Indian islands and lies between latitudes
17° 14' and 18° 32' north and longitudes 76° 11' and 78° 21' west. The
island is 146 miles long and 51 miles wide - the total area being 4,441
square miles. Kingston is the capital city of Jamaica and is the island's
main port. It lies on the Liguanea plains with mountains to the north
and the Caribbean sea to the south. Its mean daily temperature is
80-86°F.
Kingston has a population of approximately 500,000 which is rapidly
increasing, both from its high birth rate and continual immigration
from the surrounding countryside. It is easily the largest town in
Jamaica, whose total population is just under 2 million. The city
cannot cope with its population,and though many housing developments
have been built recently, the standard of housing and public amenities
is generally poor.
Historical and social background
Most of the, present inhabitants are descendants from West African
slaves who were brought here in the 18th century, when Jamaica was a
British Colony. Jamaica became an independent territory in 1962 and
now has a democratic government with two major political parties.
The middle classes have to a large extent a similar family structure
to that found in Britain however, the working classes to which most
of the population belong have a very different pattern. Approximately
74% of the children are born outside formal marriage unions. Approximately
of the women are married, 3 live in common-law unions with the father
of their children and 3 live separately from the father of their children.
This family structure has been described by Clarke (1957) who points out
••'
18
that though slavery had a destructive effect on the formation of
stable, unions, "conditions still persist in present day Jamaica
which make it impossible for men to perform the roles of father
and husband as these roles are defined in the society to which
they belong%
As a result of this type of union status many families
tend to be matrifocal, with mothers or grandmothers being the
central figures in the upbringing of children and fathers playing
relatively minor role. Many single mothers must manage their
-children without the physical presence or sometimes economic
support of the fathers, and are obliged to form new unions with
other - men for economic survival. Consequently it is common to
find families with half siblings.
having their baby, and their babies were examined at the same time.
Subsequently, the babies were seen at a special clinic when they were
6 weeks 3 4,5,6,8,10 and 12 months of age. Those who did not attend
were visited at home by the doctor or nurse. Every home was visited
at least once
was assessed.
As the children were from a poor community, with a relatively
high incidence of infections, any illness was treated with the best
available medical care. Nutritional advice, however, was limited
when the standard of housing and maternal competency
19
CHAPTER II
'Sample Selection and Methods
The doctor..who conducted the study was assisted by the'same nurse
.throughout the year. :A laboratory technician assisted.when neCessary.
:.and a further doctor from the Paediatric department of'the University
Hospital occasionally assisted.
300 children were selected by taking consecutive births in the
University Hospital of the West Indies, between March and June 1967.
In order to get a more representative sample of the Kingston population,
private patients,,foreigners, and mothers who did•not intend to remain
in Kingston we-re excluded. •
Only 3 Of the mothers who were eligible for selection refused
enter the study because of:difficulties they expected to have in
attending the clinic regularly.
The resulting sample came from predominantly lower socio-
economic backgrounds. Ninety-two percent of the infants were of
predominantly Negro extraction,, and the remainder were a mixture of
Chinese, Indian, Negro and White parentage.
The mothers were all interviewed in hospital within 3 days of

20
to those cases where the child's health appeared to be in jeopardy.
The infants were immunised against smallpox,-diptheria tetanus,
pertussis and poliomyelitis.
DATA COLLECTION
illnesses the children had at the scheduled clinic visits
were recorded. The mothers were encouraged to bring the children
the clinics any time they were sick, and many mothers used this
Some mothers also took sick children to the Casualty
Department of.the hospital and a few went to other hospitals clinics,,
and private doctors. The notes of this hospital, were checked, but
the mothers word was taken about other episodes of illness not seen
this hospital.
WEIGHT
At each examination the infants were weighed, at birth by the
nurses who delivered them and subsequently by the survey nurse. The
infants were naked and the weights recorded to the last completed
ounce. A beam-balance scale was used, and checked frequently with
standard weights. An identical scale was used for home visits.
LENGTH AND CROWN-RUMP
Supine length was measured at each examination except the 6-week
one, and crown-rump measurements were taken at birth, 3,6,8,10 and 12
months only. These measurements were made on an aluminium measuring
tray which had a fixed headboard and a foot-board which could slide
up and down on a calibrated scale. The infants were stretched out
supine on the board and their heads held firmly against the headboard.
Lengths were then taken by moving the footboard to touch the soles
of the infants' feet (Tanner et al. 1966) and crown-rump lengths
were taken by holding the feet vertically above the buttocks with
bent and sliding the footboard to touch the buttocks
(Faulkner, 1958).,All.measurements were taken to :the-laSt.completed.
quarter-inch and made by the survey nurde witithe assistance of the
•mothen'or.doctOr..
HEAD CIRCUMFERENCE
All measurements of head circumferences were taken by the doctor
constantly compared techniques. The method used was
that'described•by Westropp and Barber (1956). •A•tape'measure.was laid
.on the supraorbital ridges and passed around.thehead.at the same level
o the occiput where it was moved until maximum circumference was.
obtained. Cloth measures were used rather than steel ones as they
were easier to manipulate with children in this age range and with
-very .curly hair The measures were regularly.Checked against a
•-standard measure. ,All recordings were made to the nearest 14 inch
below. (Measurements were made in inches or pounds and ounces
_accordanOei with the standard practice of the.Paediatric Department
of the University Hospital).
MILK FEEDING
At each visit careful enquiry was made as to the type and quantity
of milk given to the infant and the number of times a day the milk
was given. The mother was also questioned in an attempt, to find out
why she fed the infant as she did.
WEANING DIET
At each visit the mothers were asked what food other than milk
she was now giving the baby. No attempt was made to estimate the
quantities involved as actually weighing 'the food to be eaten is
inaccurate and recall is an even more inaccurate method of estimating
food intakes. (Ashworth 1968). When it became apparent that many
mothers were buying jars of proprietary baby food v the mothers were

22
Fig. 11
The study nurse and laboratory technician
taking a blood sample during a home visit.
asked if:they had ever bought these jars. They were alsO asked if
they had ever bought government subsidised packets of milk. The brancL
proprietarymiik beinggiven was recorded.and children receiving
only small amounts of. or no milk
HAEMATOLOGY
Blood specimens were taken at birth, -weeks, _. 10 And1
Months. They were obtained by venepuncture mOnthS,ofiage.ari'
by heel or finger prick at other times. All specimens were examined
on:the -same day as' they were taken. HaemoglOhin (Hb) leVels were •
estimated by thecyanmethaemoglobin method against a certified
cyanmethaemoglobin standard. A microhaematrocrit was performed a
and 12 months :of age and the mean corpusCular-haethoglOhin-=
concentrations (MCHCIs) estimated. At 10 months of age serum iron
and latent iron binding capacity were estimated using a routine method
-based on that of Beale Bostrom and Taylor (1961,1962). Haemoglobin
electrophoresis using a vertical filter paper technique was also
erformed at this time.
GROSS MOTOR AND LANGUAGE DEVELOPMENT
Developmental behaviour was observed the evaluation was, restricted
o fourteen items of:gross motor. behaviour and two items of language
behaviour. The items and procedure of examination were taken from
the more significant items from the Gesell Developmental Schedule
compiled byl{nehlOch. al. (1966). The items.;selectedwere considered '
to be .amongthe simplest to judge accurately. The:eXaMinations-in::the
clinics were done, with feW exceptions; ythesUrVeY.doctor.
PrOm three months of age those infants,viho did'hot attend, were
visited at home, and were examined if their surroundings were suitable.
20% of the total examinations from three months were done at home half
by the doctor and half by the nurse. The nurse was present at all the
clinics and the doctor and nurse constantly compared their findings.

24
The date when the gross motor items were first observed to be achieved
was recorded, but the motherts evidence had to be taken for the language
items. The mothers' accuracy of recording was frequently checked on
the gross motor items and was generally remarkably correct. Any sick,
unduly sleepy or upset child was excluded.
SOCIAL BACKGROUND
At every visit mothers were asked whether the father of her baby
was living with her, and was supporting the child, whether she was
working and who was looking after the baby if she was working.
FAMILY PLANNING
When the infants were seen at six weeks or three months of age,
the mothers were questioned on their knowledge of and attitudes to
family planning. Mn subsequent occasions they were asked about their
use of contraceptives. The disadvantages of too short an interval
between births were emphasized and various contraceptive techniques
were explained. The use of contraceptives was reviewed either at
the time of the next pregnancy or 1 year after delivery.
31 of the mothers had had tubal ligations while in hospital, 22
of these because they were of parity 6 or more, and did not want
another baby .and 9 for medical or obstetric reasons. These mothers
who had had tubal ligations were excluded from this investigation,
leaving 262 women.'
TIMING OF DATA COLLECTION
Only anthropometric dietary, haematological and developmental
data collected within a stated time of the scheduled visit was included
in the analysis. This time range was 3 days at births, and 6 weeks,
1 week at 3 4,5 and 6 months, 2 weeks at 8, 10 and 12 months of age.
The mothers word was accepted for illnesses and social events occurring
at any tithe'.between each consecutive visit.
BIAS OF SELECTION
All the infants in the study were born in hospital. There is
a great demand for obstetric beds in Kingston and the University Hospital
of the West Indies offers some of the best facilities in the area.
Not every expectant mother who desires can have delivery in hospital.
Mothers must request booking for delivery before they are 4 months
pregnant and primiparae, mothers of parity 6 or more and mothers
with medical or obstetric complications are given priority for the
hospital. beds. The sample consequently contained 146 (50%) primiparae,
42 (15%) mothers of parity 6. orTnoreabe mean age of the primiparae
was 20.8 years, of the mothers of parity 2 to 5 was 27.1 years, and of
the mothers of parity 6 or more was 31.3 years. This sample almost
certainly contained more primiparae and consequently younger mothers
than the population in general and the affect of this bias in the
selection will be discussed in relation to each major finding.
Apart from this however, the group was thought to be reasonably
representative of the Kingston population. The pattern of marital
status coincided with the general marital status in Jamaica.
LOSS FROM STUDY
A total of 21 children were lost to the study by the end of the
year. 13 children moved and could not be traced, and a further 7
children moved• too far away to' be visited. 1 mother refused to
co-operate after her child was 6 months old. A further 3 children
died and nine other children moved to rural areas and only visited
the clinic irregularly.
MULTIPLE BIRTHS
There were 5 sets of twins and 1 set of triplets in the study.
1 set of twins moved to a rural area and was lost to the study. The
remaining 11 children were excluded from the analyses of anthropo- .
metric and haematological data to facilitate comparisons with other studi

were divided into 2 socio-economic groups higher and mothers
lower. These groups did not correspond to the accepted class
differences as with a few exceptions the higher group would
-Socio-economic Status
In order to examine the effects of socio-economic status
on different aspects of child care and development, all the
26
have been considered as lower middle or better working class,
and the lower group would have been working class. Owing to
the high incidence of illegitimacy the occupation of the fathers
could not be used as the major criteria for classification. The
standard-of housing was used as the main criteria and the mother's
occupation and occupation of cohabitating fathers were considered
as associated criteria. The higher group consisted of all those •
living in above average housing (Chapter III) with few exceptions,
while the lower group consisted of all those living in average
below average housing with a few of the above average houses.

27
CHAPTER III
SOCIAL BACKGROUND AND ENVIRONMENT
A brief outline of the housing and social background will be given
in this chapter.
Standard of Housing
In general the standard of housing was poor and many houses
could be described as slums. During the home visits 275 of the
homes were graded according to the state of repair of the house,
the kitchen and bathroom facilities, the overcrowding and type of
neighbourhood. (35%) 96 homes were assessed as "above-average".
(52%) 143 homes as "average" and (13%) 36 homes as "poor".
A typical "above-average" home, was a housing unit with an'
indoor flush lavatory and kitchen, and no more than 3 people per
room, in a good state of repair.
A typical taveragel home was a small cottage or room in a
tenement in fair repair. There was usually an outside tap for water,
and either an outside, shared, flush lavatory or a pit latrine. Often
the kitchen was separate from the house and sometimes no more than a
wooden shack. Usually there were 3 to 5 people per room (Figure III).
A typical poor home was a wooden one roomed cottage probably
in poor repair with more than 5 people living in it, with an outside
tap and a pit latrine. Some of the houses had small outdoor areas
of their own, while others shared outdoor areas (yards). These
communal 'yards were of different types; some had small wooden cottages
scattered around them, while others had rows of adjacent rooms constructed
of concrete block, with a different family living in each room. In most
communal yards the lavatories and water taps were shared. Often
the yards had no grass and were just dirt areas. Many

28
Fig.111. An average house in front and a
below average house behind.
Fig.IV. An access road to one of the study
homes.

29
of the yards were well populated with dogs and chickens. The
neighbourhoods' of both poor and average homes were badly looked after,
with poor garbage disposal, badly kept sidewalks and poor street lighting.
The homes were often behind the main road, an unpaved lane being the
only access route. (Figure 11T).
Most of the homes except for the poor ones had , adequate furniture
usually consisting of a bed, table chairs, china cabinet and sometimes
a dressing table, while some of the poor little more than.a bed. •
The civil status of the mothers at the birth of their child is
shown in Table 1. 251 (84%) of the babies were illegitimate. This is
more than the 74% reported for Jamaica as a whole in 1967, however the ,
high proportion of primiparae in the study probably caused this difference.
The civil status of the mothers according to. parity is shown in
Table II. As previously described (Clarke 1960) the tendency in Jamaica
is - for women o get married relatively late in' life having had several
children, and often after living in a common-law union for some time.
It can also be seen that the married women tend to have the most.. children.
Clarke also found that many single mothers often•lived with
their own - mothers. In , this study 55 'of the:99 single mothers whcise
family structure was known were living with older female relatives,
but 44 were -living aiOne.'yith their children.
THE MOTHERS
19.2. The average age of the 293 mothers was 24.2 years. The age range
was wide with some very young mothers, of 14 yearS, 2 of 15 years and
10 of 16 years age while at the older end of the range there were
5 *otherS of '40-:Yearsyand 1 'of 45 :years. of age. The average gage of
the primiparous mothers was 20.8 years.


TABLE 11
Civil status according to Parity of the Mothers
Parity of Mothers .- Civil Status
Total Married Common-law Single Widow
1 36 (24.7%) 32 (21.9%) 78 (53.4%) 146 (100%)
2-5 39 (37.1%) 42 (40.0%) 23 (21.9%) 1 (.9%) 105 (100%)
7 and over 21 (50.0%) 14 (33.3%) 7 .(16.6%) 42 (100%)
Total 96 88 108 1 293

32
The educational level of 276 mothers was known and the general
standard was low. Only 1 mother had never been to school but 32 (12%)
had only reached primary school standard IV or less, and 175 (65%) had
only reached standard V or VI of primary school. Reaching a certain
standard did not necessarily indicate a certain level of achievement,
as some of the mothers had only attended school irregularly. Those
mothers who had not passed standard four were mainly illiterate, and
many of those who had reached standard five or six could not read
and write well, while 11 of them had passed local Jamaican exams.
Sixty-eight (26%) had been to secondary school, but many of these •
had only stayed for'one or two. years, 12 of,them had passed lobal
Jamaican ekams 13 of them had.passed 101 ,1evel of GCE and 2 mothers
had passed IA' level, of the
Standard of Housekeeping and Food:' Preparation:
Though many houses looked like slums from the outside the over-
whelming majority of mothers kept the. inside of their homes well.
They attempted to make their. rooms attractive polishing the floors,
and decorating their homes with plastic flowers and paper calendars.
Sixtr-five percent of the homes were assessed as having poor
kitchen facilities; many did not have inside running water or sinks
draining boards. Though most of the living rooms were remarkably•
well kept the same was not true of the kitchens. The mothers had
little idea of hygiene and the kitchens were often dirty and infested
with flies." The large number of flies was usually related to the
poor standard of garbage disposal found in most neighbourhoods. Under
these circumstances it is not surprising that very few bottles were
correctly sterilized. However most Moth@ilif made some attempt to .

33 clean the bottles at least once during the day, often rinsing them
in hot water. Very few mothers covered the bottles once the feed
was mixed. Many of them reported that their plastic bottles could
not be boiled and that boiling spoilt the nipples. 57% of the
mothers worked before their child was a year old, and many of them
left food for their child already prepared before they went to work.
As very few homes have refrigerators this was another possible source
of infection.
Child care
The children were kept remarkably clean, considering that towards
the end of the year, most of them played in earthen yards. The children
were usually dressed in their best clothes for the clinic visits,
complete with bootees and hat.
The mothers tended to be relaxed about their children and never
complained that they cried excessively. (This made an interesting
contrast to English mothers attending welfare clinics in London).
The relationship between mother and baby tended to be a close physical
one and the children were carried whenever they were taken out, as
very few mothers had prams.
158 (56%) of 283 mothers about whom the information was available,
slept in the same bed as their babies, for at least the first 6 months.
During the' first 4 months most of. the babies were breast fed, though
the incidence of breast feeding dropped rapidly after that. (Chapter VII).
The mothers appeared relatively indulgent with their babies
throughout most of the year but it was noticed that they, became more
demanding towards the end of the year and it was not unusual to see
a mother slapping her child of 12 months of age.
Very few babies were, given toys and the impression gained was
that they were considered too young for them. It was also noticed
• that there was a general lack of childrens books, paper and pencils
in the homes.

Very few had play pens, and the babies were often left outside
in the yards in their cribs. A few fathers had made wooden play pens
out of crates, and sometimes the babies were propped up in galvanised
iron wash pans, which were also used as baths.
Attitudes and Beliefs
The mothers had been influenced by advertisements and modern.
, health trends and they frequently requested 'tonics' and asked the
doctor to esound the baby . In contrast to this we found I mother
who had consulted an obeahman with a very, sick child, and several
others put assafoetida in their child's hair 'to keep cold from the
mole" (anterior fontenelle). Also several mothers would not cut their
babies' hair until they could speak. They believed that if a child's
he spoke well, that his speech would be delayed.
For 'the first few weeks after the baby's birth the mothers tended
to 'stay home and went out ,very little. Later in the year many of them
-went out to work. 57% of the mothers worked for-some time during •
the year, a quarter :ofthese onlyworked irregularly. Table III,shows
_.their occupation and Table 1V shows when they first went to work,
Approximately half of those who worked began working when their child
was 3 to 4 months of age.
Slightly fewer of the mothers with 6 or more children than those
with less than 6 children worked (difference not significant). However,
their marital status did not affect the incidence' of working.
Boarding out
32 children were boarded out away from their mothers during the
A further 3 mothers emigrated
leaving their child behind.

Occupation
Professional
Clerical
Factory `Worker sews at home
Domestic
House wife
Student -
Don't know
293
35
TABLE 111
The Occupation of Mothers
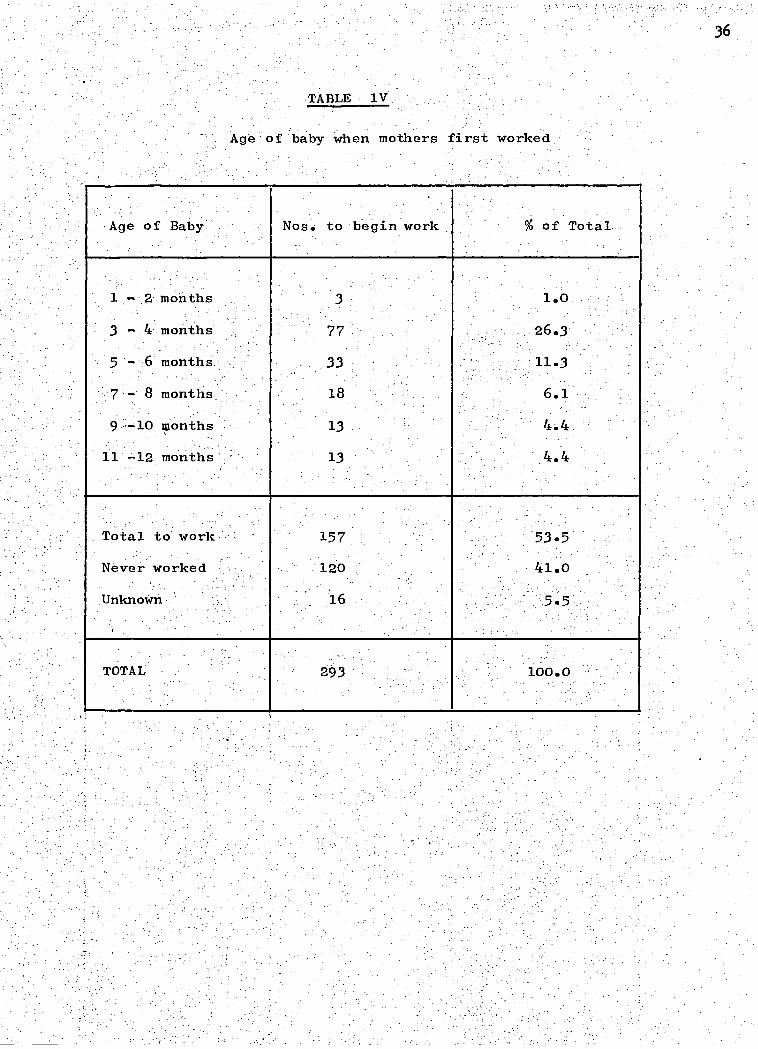
36
% of Total Nos. to begin work
3 - 4 months
5 - 6 months
8 months
9 -10 months
11 -12 months
. Total to work.-
Never worked
Unknown.
37
The homes in general tended_to be unStable..- Of,the 289 families
folloWed by the survey staff (43%) 125 Changed their address during
the year. Of these 75 moved once.(9 were lost), 38 moved
(2 lost), 10 moved .3 times (1 lost) and 2 moved 4 times (I lost).
large number of families which moved tended to discourage
community life. In fact most families tended to cling to their
privacy in spite of the common housing arrangement of communal yards.
Fathers
The number of different fathers for each mother's total children
twice
was known\for 138 of the multiparous women.
'of mothers to have all their children.by.the same father according
to the parity of the Mothers. .Most: f the women 'with 2 children. had
had them:beth by the same father, and thiS.situatiOn was again found
with families 'of over 9 children.
The identity -ot the father was in dispute- in 4 of .thd study .
children. .3 mothers actually changed the chiidls,sUrname during - the
year, and a fourth said'that the baby's father denied-that.the Child
was his. It was known whether or not the.fatherSigave financial',
support to the mother throughout theyear in 265 families. :Most
-tathers'179 (69.5%) gave the mother some type of financial support
regularly throUghout-the.Year, though this. may,have'been very little
money ,of juSt baby food. 68.(25.7%) gave .irregular support and 12
(4.5%):began-by giving support but stopped ,later in the year. 6.
:(203%) fathers never helpecijinanciaIlY atariy time (Table V1).
.The occupations of the fathers are shown in Table V11. Though
the, majority of them were classified as skilled labourers, many in
this category were in irregular work often had not had
any recognised training.

The number of different Fathers for the Children of 138 of the
Multiparous Mothers
Nos.of Fathers Total number of children born to each mother
2 3 4 5-6 7-8 9-12 Total
1
2 or more
34
14
(71%)
(29%)
11
11
(50%)
(50%)
6
10
(37%)
(63%)
5 (28%)
13 (72%)
6
11
(35%)
(65%)
11,
6
(65%)
(35%)
73
65
Total 48 (100%) 22 (100%) 16 (100%) 18 (100%) 17 (100%) 17 (100%) 138

39
TABLE V1
Type of Financial Support given by Fathers
Type of Support
Number % of Total.
Regular support 179 67.5
Irregular support 68 25.7 .
Stopped during year 12 - 4.5
None 6 2.3
Total 265 100.0

40
The Occupation of the Fathers

41
Maternal 'Competency
Throughout the year, the standard Of 'care the mothers gave
their children was assessed. An attempt was made not to confuse
the health of the children or the families degree of poyertY with
the mothers v competency. In cases of extreme poverty this was
difficult. Though the mothers competency was evaluated at all the
clinic visits, it was found that the home visits provided a much
better insight into the true standard of care the children received,
so only mothers who were visited a.t•home were classified (with. 2
exceptions).
Thee mothers were graded as adequate or poor and guidelines
or this grading were taken from these used by Thwaites e (1958)
and included
(1) The state of the' child;
(2) The state of the home.
(3 ) The attitude of .the • mother the child
.(4).:. The health and intelligence of the mother.
No actual scoring System was applied dust veliCh:of. the- above' faCtors
were conSidered separately. The, inadequate mothers. were exceedingly
poor - in at least 2: of the above factors.. owever in most sof'the poor:
mothers their good intentions were not questioned. Only a few of
them appeared to resent or have little interest in their child.
Of the 272 mothers classified 22 (8%) were considered inadequate,
and the rest were adequate.
Poor mothers
Two of the poor mothers had twins and it was thought probable
that one f these mothers could have cared •for a single child
adequately.:

5 of the poor mothers abandoned their children in other peoples
care A short case history of these will be given..'-
(1) A fifteen year old mother, who had nowhere live asked for
her child to be taken into government care and this was done,
when the baby was 6 weeks old. The mother subsequently visited
the baby- only occasiOnally, then Stopped altogether.-:The baby
waSeventually fostered into a middle clasSAlome, and the
foster parents. requested permission -adOPOhe:Child The
- - Y.Oung,Mother reappeared after many attempts a locating -her
. •
- _ and removed the child abruptly'into thecnre 3s_grandmther,
where :the care waSAudged.tobe_very
( ) A 24 year old mother of 4 who was illiterate and unmarried,
could not cope with the baby and eventually gave the child
o his father when the child was 8 months old. The, child
subsequently received adequate care.
( ) A 33 year old mother of 8, who was partially deaf and
illiterate, cared very badly for her baby. When her baby was
9 months old she left home one day, leaving him, with his
paternal grandmother, and never returned. The child subsequently was
given adequate care.
(4) A 26 year old mother of 9, who had twins left the babies with
their grandmother when they were 3 months old. Later she removed
them to a poorly run private nursery. When the children were
around ,8 months old, the mother stopped paying the nursery,
and changed her address. The nursery owners spent several
weekd trying to locate .the mother, and•eventually left the
children at their father's place of work. By this time the children
were 1 year old and their father returned them to their mother's care.

43
(5) .A 26 year old mother of 6 children who was living in a
: common-law union, quarrelled frequently with her consort
and eventually left home leaving ,5 children. The father gave
the, children no care, not even sufficient food. The children
were-ta:ken into government- care at-the:request of the study doctor.
The charaCteristics - of poor mothers were examined t
they could be readily distinguished from the-others.
Altogether.270. mothers and homes were assessed. (2mothers,_ poor
and :l adequate did not have their homes assessed). The poOr'mdthers
had significantly poorer housing than the adequate mothers
test p is less than 0.01) as shown in Table V111.
squared
Significantly more mothers of parity 6 or more were classified as
poor than mothers of parity 2-5 (p is 'less than 0.05). The incidence
of poor mothers among primiparae was intermediate between the other
2 parity groups (Table ix). It was particularly noticeable that :4
f the 7 young primiparae under, 18 years of age not living with an
older female relative were classified as poor mothers.
So it would appear that poverty, large families or extreme youth
inexperience all predispose to maternal incompetency.
of the poor mothers had been partially deaf since childhood and
this appeared to be .:a particularly serious handicap in this society.
Summary .
The general standard of housing was poor. The civil status of the
mothers reflected the typical Caribbean pattern with approximately.
1/3 married, 1/3 living in common-law unions and 1/3 single. The mothers
were generally poorly educated but usually kept their homes and children
clean and neat. The mothers usually had a close physical relationship
children during the first year of life.
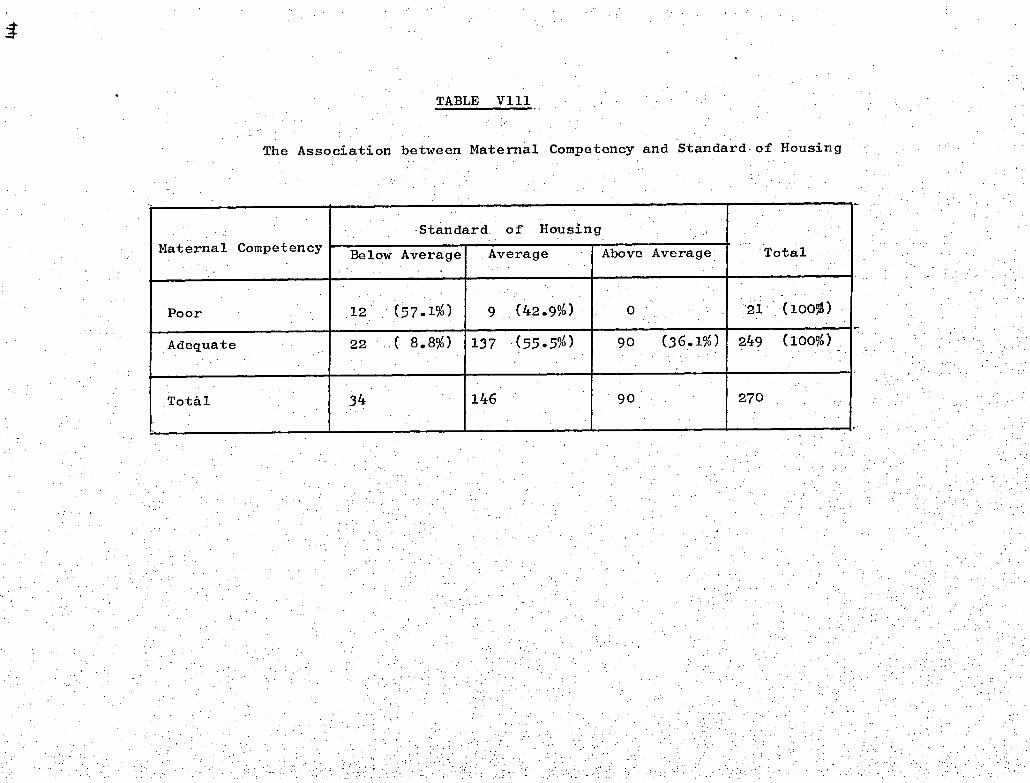
TABLE V111
The Association between Maternal Competency and Standard of Housing
Maternal Competency Standard of Housing
Total - Below Average Average Above Average
Poor 12 (57.1%) 9 (42.9%) 0 21 (100%)
Adequate 22 ( 8.8%) 137 (55.5%) 90 (36.1%) 249 (100%)
Total 34 146 90 270

TABLE 1X
The Association between Parity and Maternal Competency
11 ( 7.5%)
•
Parity Maternal Competency
2-5 6 or more Total 1
122 (83.6%)
13 ( 8.9%)
3 ( 2.9%)
94 "(89.5%)
8 ( 7.6%)
8 (19%)
34 (81%)
Ungraded
146 (100.0%) 105 (100.0%) 42 . (100.0%)
21
Poor
Adequate
Total

and had no supervision at home, tended to be incompetent.
Life tended to be unstable for the children, with over half
the mothers worki g and 43% moving house during the year. 12%
of the children were actually living away from their mothers.
Most fathers made some attempt to give financial support to
their children during the year.
8% of the mothers were classified as inadequate, and the case
histories of some of these are given. Mothers living in extreme
poverty or who had very large families or were extremely young

.47
CHAPTER IV.
DISEASES
There was only incomplete data available on the incidence of diseases
for 28 children this included the 21 who were lost to the study, and
'further 7 whose mothers were unable to be present. at the clinic visits,
and the:personwh6-accompanied the child did not have the:required.
information. The findings from the 272 children with full information
available are reported here.
Results
Congenital abnormalities: Table X shows the congenital abnormalities
fOUnd -in-theSe 272 Children. Umbilical hernias.'. were exceedingly common,
and were present in 168 (62%) of the children,-at- some 'time :between 3
anct,12 months of-age 44 of them closed by 12 months leaving 124.
At 12 months 84 of these hernias were-1 finger wide at the base, 2
were 2 fingers wide, 6 were . 3 fingers wide, 3 were 4 fingers and I
was 5 fingers wide. Extra digits were also common, extra fingers
were present in 7 children and extra toes in 1 child.
The child with a diaphragmatic hernia was operated on at birth
and made a good recovery. One child had a cyanotic heart disease
and died at 4 months of age, a definitive diagnosis not being made.
The second child with congenital heart disease was thought to have
ventricular Septal defect which caused no .symptoms.
Diseases:
Minor skin infections conjunctivitis and uncomplicated
"colds" were common but were not recorded systematically though
"colds" associated with fever, vomiting or diarrhoea were recorded.
Table X1 shows the number of illnesses recordea during the year.
Gastroenteritis and respiratory infections were the commonest diseases.
- - Congenital Abnormalities found in 272 children'
Diagnosis
Umbilical Hernia
Extra Digits
Bronchial Cyst Fistula
Congenital Heart Disease
Inguinal Hernia
Diaphragmatic Hernia
Congenital Laryngeal Stridor
Nos.
1.84:
48

Number of Cases Diagnosis
of Unknown Origin
TOnsillitis or Cervical Adenitis
Pyrexia
Illnesses which occurred in 272 children
Gastroenteritis
"Cold" fever or vomiting or diarrhoea
Measles
Eczema—
Bronchitis
Otitis Media
Miscellaneous.
PneUmonia.
Thrush
Constipation.-
253
131
34
31
28
25
22
18
12
11
10
9
8
7
4
Mumps.
ChiCken Pox -
Whooping Cough -
49

50
Gastroenteritis was defined as any attack of diarrhoea, unassociated
with other infections, consisting of more than .3 loose stools a day and
lasting more than 2 days or, diarrhoea causing the infant to be clinically
sick or associated with vomiting.- The incidence was high, 54% of the
children had at least I attack, this included 12% who had 2 attacks,
5% who had 3 or more attacks and 4% who had a prolonged episode of
diarrhoea lasting more than 1 month.
The incidence increased steadily from 2%. between 1 and 2 months
to 21% between 5 and 6 months of age. It then remained constant from
6 to 12 months, however, as the children were seen monthly before
6 months, then only 2 monthly after 6 months the figures are not strictly
comparable as the mothers recall may not have been so good'over
monthly periods.
Hospitalisation
25 of the 272 children were admitted to hospital during the year.
Gastroenteritis was the commonest cause for admission though often the
children were only kept in hospital overnight while they were rehydrated
with intravenous fluids. 11 children were hospitalised with gastro-
enteritis 2 on 2 occasions. 7 children were admitted with lower
respiratory infections and 7 with miscellaneous diseases.
Deaths
- There were 3 deaths in the study. One neonate died a few hours
birth due to severe asphyxia following a prolapsed cord during
congenital abnormalities in the population i
delivery. One child died at 2 months of age with virus pneumonia a
few hours after being brought to the hospital casualty department and
one child died at 4 months of age with congenital heart disease.
Discussion
Though the sample was too small to indicate the incidence of
general, it is apparent

TABLE X11
Causes of Hospitalisation in 272 children
Diagnosis . Nos.
13
7
Gastroenteritis
Bronchopneumonia, Bronchitis Lobar Pneumonia
1
1
Hydrobephalus
Repair of Inguinal Hernia
Congt. Laryngeal stridor 1
RYi.6iiaof:Unknown Origin 1 . .
Congenital Heart . Disease 1
Viral Meningitis
Skin Abscess 1
51

7 , -
52
that umbilical hernias are exceedingly common. A similarly high
incidence was found in Jamaican children under 2 years of age by
Miller in 1969 (personal communication).
The , morbidity rate of these children was high, in spite of the
comparatively easy access they had to medical services. It is possible
that without the help given by the special study clinics the morbidity
rate would have been higher. The high incidence of gastroenteritis
and respiratory diseases accords with Backs reports (1960,1969)
hospital , admissions among Kingston children.
54% of the patients had at least one attack of gastroenteritis,
during the year. This compares to an attack rate of 55% in Gambia
over an 18-month period (Marsden, 1964), and 6-9% in England (Wheatley,
1968). However, Wheatley had restricted his cases to diarrhoea associated
with vomiting. Very few of the recorded cases of diarrhoea in this study
could be attributed to malnutrition as described elsewhere (James,1968;
Wharton Howells and Phillips 1968; Chandra, Pawa, and Ghai,1968) as
only one patient in this study suffered from severe malnutrition.
The nutritional status of the children was generally poor and will
be discussed in more detail in the next chapter. The one case of severe
malnutrition was a male infant admitted to hospital at 6 months and
again at 10 months of age with marasmus. On both occasions he also had
gastroenteritis though there were no deaths due to malnutrition, this
child would almost certainly have died had it not been for intervention
- - by the survey staff.,
is not possible to determine definitely from this data to what
.extent the nutritional status of the, children lowered their resistance
infections or conversely to what extent the high morbidity rate
contributed to their poor nutritional status. However, there was an
by - twelve months_of age

53
Figure V. The infant in this photograph was the
only child admitted to hospital with severe
malnutrition. The mother was graded as inadequate,
she had 6 children.
54
and the number of attacks of gastroenteritis (Chapter X1). Gastro-
enteritis was also associated with loss of weight over short periods
of time, and out of a total of 39 episodes of loss of weight over a
2 month period 64% were associated with gastroenteritis.
Though no bacteriological or virologica.1 examination was carried
the stools, there appeared to be ample reason to suggest an
infective aetiology for the high rate of gastroenteritis considering
the generally low standard of hygiene practiced in food preparation,
the high prevalence of flies and the generally poor kitchen facilities.
(Chapter III). It was interesting that the number of attacks o
gastroenteritis that a child suffered increased, significantly if.he
was getting poor maternal care, or if he was of'birth order 6 or more
(Chapter X1). However, poor housing alone where the mother was judged
to be- adequate, was not associated with a higher_ attack rate of
gastroenteritis. These findings would appear to stress the importance
of practising good hygiene in preventing attacks of gastroenteritis.
Respiratory infections were also common and the overcrowded
living-conditions probably contributed to these as well.. Robinson
(1951) also found morbidity in infants was related to the size of
the family.
Not only was the incidence of infections high but the infections
tended to be severe as reflected by the 28 hospital admissions. There
is , a shortage of hospital beds in Kingston and usually children are
, very sick before they are admitted.• A much higher rate of hospital
admissions was found in these Kingston children than thee children
studied in a rural area of Jamaica (Miall et, al 1970). It may be
that the particularly overcrowded living conditions found in Kingston
are responsible for this. It would appear that while the present living
conditions persist comprehensive medical supervision will be necessary
throughout the first year of life for Kingston infants.
A high incidence of umbilical hernia ;and extra digits was found.
A high morbidity rate throughout the year was recorded with gastro-
enteritis and respiratory infections being the most common dizeases.
There were 28 admissions to hospital, 48% of which were due-to
gastroenteritis.
Lack of hygiene, overcrowded living Conditions, poor sanitation
and the poor nutritional status of the children were considered to be
possible causes of the high morbidity rate.

from
and 16 whO were
Cross-sectional and longitudinal analyses of measurements of length,
weight and crown-rump length are presented in this chapter.A/esults
29 children were excluded:- 13 children from multiple births,
lost to the study by 10 months of age.
Table Y111 shiaws cross-sectional means and standard deviations of weight, •
length and crown-rump length for both sexes. Table X1V shows means
and standard deviations of weight and length velocities for each sex
during the first year of life: the annual rates in this table are
based on velocities for 3- or month periods.
Discussion
As the study had a high proportion of primiparae and first babies in
other populations have been shown to be smaller at birth than
Subsequent ones (Thomson et al. 1968), weight data were examined to
. assess the.influence of the method of selection upon the results.
Mean birthweights of first babies in this study were only slightly
ower (.15 Kg, males;.09Kg, females) than those of other babies,
and an examination of weight increments from 0-3 and 0-12 months
showed non-significant and inconsistent differences between birth
It therefore seems unlikely that the over-representation
made any appreciable difference to the results.
56
..TABLE
MALES
0 0.00
0.12
3 0.25 4 0.33 • 5 0.42 6 0.50
8 0.67
10 0.83
12 1.00
FEMALES
0.00
0.12
0.25 0.33
0.42 0.50
0.67
10 0.83 12 1.00
135 3.12 0.51 48.4 2.28 32.1 1.70 117 4.73 0.58
- 131 6.21 0.85 60.5 2.55 39.3 1.70
- 132 6.82 0.93 63.4 2.43 -124 7.34 1.01 65.5 2.44 126 7.69 1.06 67.0 2.39 42.6 1.63 132 8.31 1.15 69.8 2.55.. 44.5 1.71 127 8.91 1.22 72.3 2.71 45.9 1.57 128 9.45 1.26 74.4 2.68 47.0 1.63
136 3.07 0.47 48.0 .11 31.9 1.62 117 4.36 0.51 - - -
128 5.74- 0.66 59.7 2.27 38.3 1.55 134 6.34 0.72 62.5 2.11 - -
124 6.84 0.82 64.4 2.18 - _
125 . 7.18 0.88 65.9 2.24 41.6 1.52 127 7.76 0.98 68.8 2.36 43.5 1.55 132 8.14 1.08 71.2 2.48 45.0 1.64 128 8.96 1.17 73.3 2.65 46.3 1.58
57
Means:and - Standard .Deviations of. Weights, Lengths . and Crown-Rump Lengths from Birth. to one Year of Age
Sex Age Age
, , Weight (kg)
Length (cm)
Crown-Rump Length (cm)
(mo.) (yr.) No. Mean S.D.' Mean S.D. Mean S.D.
TABLE .%1V
58
Means and Standard Deviations of Annual Weight and
Length Velocities from Birth to one Year of Age
Mid-Point of Age Interval (yr.) No.
Weight Velocity (Kg./yr.)
Length Velocity (cm./yr.)
Mean* S.D* Mean* S.D.*
0.13 131 12.33 2.74 48.5 6.60
0.38 124' - 6.03 2.20', 26.7 6.30,:
0.58 125 3.61 2.25 16.5 . 6.02
0.75 ' 124 3.43 2.45 14.4 - 6.34
0.92 121 . 3.30 2.54 12.7 5.60. .
0.13 133 10.73 2.17 47.1 6.95
0.38 127 5.79 1.88 24.7 6.56
0.58 122 3.38 2.29 17.3 6.24
0.75 124 4.01 2.53 14.5 6.16
0.92 128 3.19 2.39 12.3 5.71
Sex, Age Interval
(mo.)
MALES
0-3
3-6
6-8
8-10
10-12
FEMALES
0-3
3-6
6-8
8-10
10-12
* Means and standard deviations were 'derived from those for
3- or 2- monthly intervals. ,

.1On of the hair.
59
Weights lengths and crown-rump lengths were consistently greater
for males than for females. The males' mean length velocities were
greater than the females' up to 6 months and their mean weight
velocities were gr'Oater up to 8 months of age, after which there
were no consistent differences between the sexes.
In order to overcome the difficulties of assessing infantile malnutrition,
and to facilitate comparisons between groups, an international working
party recently formulated a classification of protein-calorie malnutrition
based solely on weight deficit and presence or absence of oedema. It
was suggested that the 50th percentile of the Boston standards (Stuart
and Stevenson 1959) should be taken as normal weight for age: children
underweight' without oedema and 60-80% of normal weight should be termed ,
and those weighing under 60% 'marasmic', children with oedema and 60-80%
of normal weight should be described as having kwashiorkor (Lancet,1970).
Using these definitions the percentage of underweight infants in the
present study rose from 2% of the total at 3 months to 15% at _12 months
of age; 18% (24) of the boys and 23% (31) of the girls were underweight
on one or more occasions. Only 1 of the infants became marasmic and
there were no cases of kwashiorkor. The only clinical signs of mal-
nutrition among the children were general thinness and inelasticity
of the skin due to loss of subcutaneous fat; and one case of depigmentat-
Loss of weight over a 2-month period was a frequent occurrence.
Forty-three children experienced such episodes of weight loss, 7 of
soder were associated
with gastroenteritis.
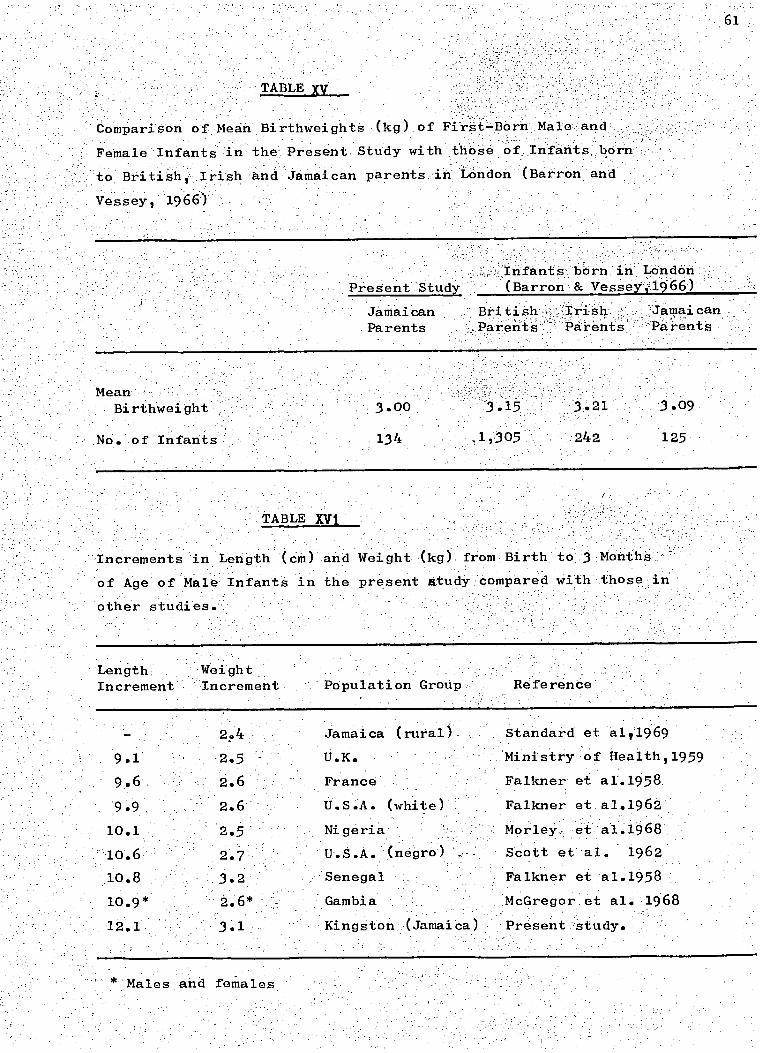
Birthweights in. this study. were low, even when Tai7ity was taken into
account. Table XV compares the birthweighlts of firstboim children
in this study with firstborn children of British, Irish and Jamaican
parents in London (Barron and Vessey, 1966). A11 the groups included
small birthweight infants. The babies born to Jamaican parents in
London were smaller" than either the British or. Irish babies, and the
babies in the present study were smaller than the Jamaican ones born
Other investigators; e.g. Morley and Knox - (1960) in Nigeria,
Bradshaw (1951) in S. Africa and Birch and Gussow (1970)
in London.
Salber. and
in the U.S.A. have shown that Negro babies ha.ve smaller mean birthweights
than European or White North American babies. However, since birthweights
of infants are related to the socio-economic status of their mothers
(Crump al. 1957;: Dean, 1951), and since most - Negro populations
investigated haire lower socio-economi backgrounds than White North
American or European populations it is not clear whether socio--economic
factors alone determine the.di&erences:i birthweigh r Whether'
genetic factors are also important.
in the other studies of Negroes referred to above, there was a high
proportion of small birthweightinfants in this study (11.4% of infants
weighed , less - than 2.5 WO. Levin -et al. (1959')and Thomson (1956) found
that small birthweight infants grew faster in the first year of life
than infants of greater birthweights but a similar analysis of our
data revealed no such tendency.
61
TABLE XV
ComParkSbn of,MeailBirthweightS-(kg).of
FeMale'InfantsinthePresent-Study withtbOeOf:_InfantsbOrn
to. BritiShIrishand Jamaican parents:in tOndon (Barron and .
Vessey,19661
Pres ent Study Infants born in London (Barron & Vessey,1966)
Jamaican British , Trish Jamaican Parents Parents arents Parents
Mean Birthweight 3.00 3.15 3.21 3.09
. f Infants 134 1,305 242 125
TABLE XVI.
:increments `in Length 1CMYand- Weight..(kg) .fromBirth to 3 Month
of Age of Male InfantS in the present Atudy:comPared with -jhosein .
other studies.
Length Weight Increment Increment Population Group Reference
204 : Jamaica (rural)̀- Standai-d et a41969
9.1 2.5 U.K. Ministry of Health,1959
9.6. 2.6 France - • Falkner et al.1958.
9.9. 2.6 - U.S.A. (white) - Falkner et al.1962 .
10.1 - 2.5 -- Nigeria. . Morley.,.-etal.1968.
' - 10-.6• - 2:7-- U.S.A. (negro) • Scott et -al. 1962
-10.8 3.2' . Senegal Falkner et a1.1958
10.9* - 2.6* - Gambia .McGregor et al. 1968
12.1- • 3.1, Icangston (Jamaica) Present:study.
Males and females
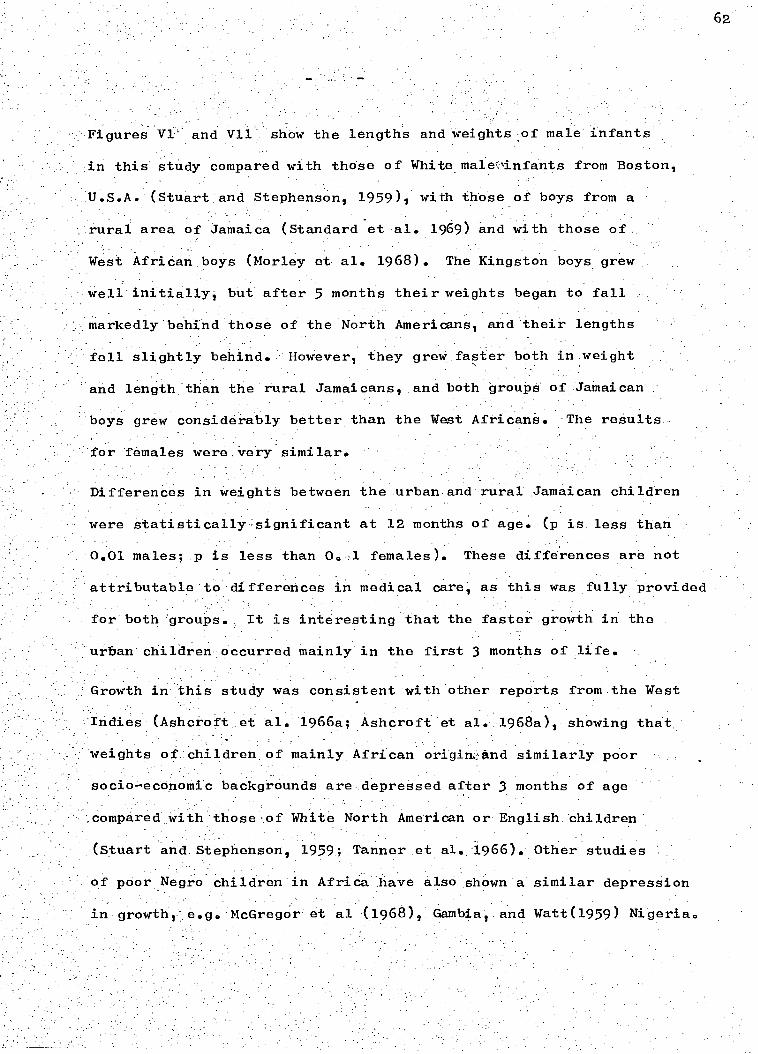
Figures V1 and V11 show the lengths and weights of male infants
62
in this study compared with those of White maleinfants from Boston,
U.S.A. (Stuart and Stephenson, 1959), with those of boys from a
rural area of Jamaica (Standard et al. 1969) and with those of.
West African boys (Morley et al. 1968). The Kingston boys grew
well initially, but after 5 months their weights began to fall
markedly behind those of the North Americans, and their lengths
fell slightly behind. However, they grew faster both in weight
and length than the rural Jamaicans, and both groups of Jamaican
boys grew considerably better than the West Africans. The results
for females were• very similar.
Differences in weights between the urban and rural Jamaican children
were statistically-:significant at 12 months of age. (p is. less than
0.01 males; p is less than 00 ,1 females). These differences are not
attributable to differences in medical care, as this was fully provided
for both groups. It is interesting that the faster growth in the
urban children occurred mainly in the first 3 months of life.
Growth in this study was consistent with other reports from the West
Indies (Ashcroft et al. 1966a; Ashcroft et al. 1968a) showing that
weights of children of mainly African origimand similarly poor
socio-economic backgrounds are depressed after 3 months of age
compared,With - thoseof White North. American or English:children
(Stuart.and.Stephenson 19591 Tanner .et al. 1966). Other studies .
of poor Negro children in Afriba .have also shown a- similar depression
et al (1968), Gambia, and Watt(1959) Nigeria.

7
Fig. V1
Comparison of Lengths of Kingston
•- 'Male infants with those of other
studies
Fig. V11
Comparison of Weights of Kingston
Male infants with those of other
studies
LENGTH (cm)
80-
3 6 9 AGE (months)
75-
70-
65-
60-
55-
50
45 0
./(7NGSTON *RURAL JAMAICA
,oNIGERIA
12
•-• U.S.A.. MEDIAN !STUART 8. STEVENSON. 1959)
KINGSTON, MEAN (PRESENT STUDY)
x----)e RURAL JAMA`C A. ME AN (STANDARD ET ø'L ,1969I
N`GERIA, MEDIAN MORLEY ET AL.19615)
U.S.A.
JAMAICA
/ NIGERIA
U.S.A., MEDIAN (STUART I STEVENSON, 1959)
KINGSTON. MEAN (PRESENT STUDY)
1.-.74 RURAL JAMAICA. MEAN (STANDARD ET AL. 1969)
- .4( NIGERIA. MEDIAN (MORLEY Et AL, 19611
3 6 9 AGE (months)
12

64
The poor growth among the African children was associated with a high
incidence of infectious disease.
..Environmental rather than genetic factors almost certainly accounted
for the poor -growth in this.study after 3.months of age. Scott et a ,
(1962): found' that loW-middle class Negro infants had at least the
.same growth potential as North American White children. Similarly,
Ashcroft and Lovell 4964)1 -and Ashcroft et al. (1966b) have shown
'that Jamaican Negro school children have at least the same height
potentials as White school children living in.Jamaica.
The children i this study had an exceptionally high rate of length
and weight gain in the first 3 months of life.. Table.XV1 compares
'length and weight increments for the first 3 months in male infants •
this study with those of male infants in some other studies. The
Kingston children had a higher rate of growth than those in any other
study except those from Dakar, Senegal whose weight though not length,
increments were larger (Falkner et al. 1958)•
'The. high rate of growth often found in Negro infants in the first 3
months of-life has generally . been attributed . to very successful
time when infectious diseases are at their lowest
,incidence (Falkner et al. 1958; Watt', :1959). In this study, 68% of
the'-infants were being partly bottle-fed by 6 weeks Of age.. Thus .
it appears, that successful breast feeding was not the reason for the
rapid initial.growth. Jamaican Negro children under 3 years of Age:
have Also Iteen'found to have greater skeletal maturity than European
breast feeding,

infants grew faster than a group from a rural area in Jamaica.
65
children (Marshal et al. 1970).
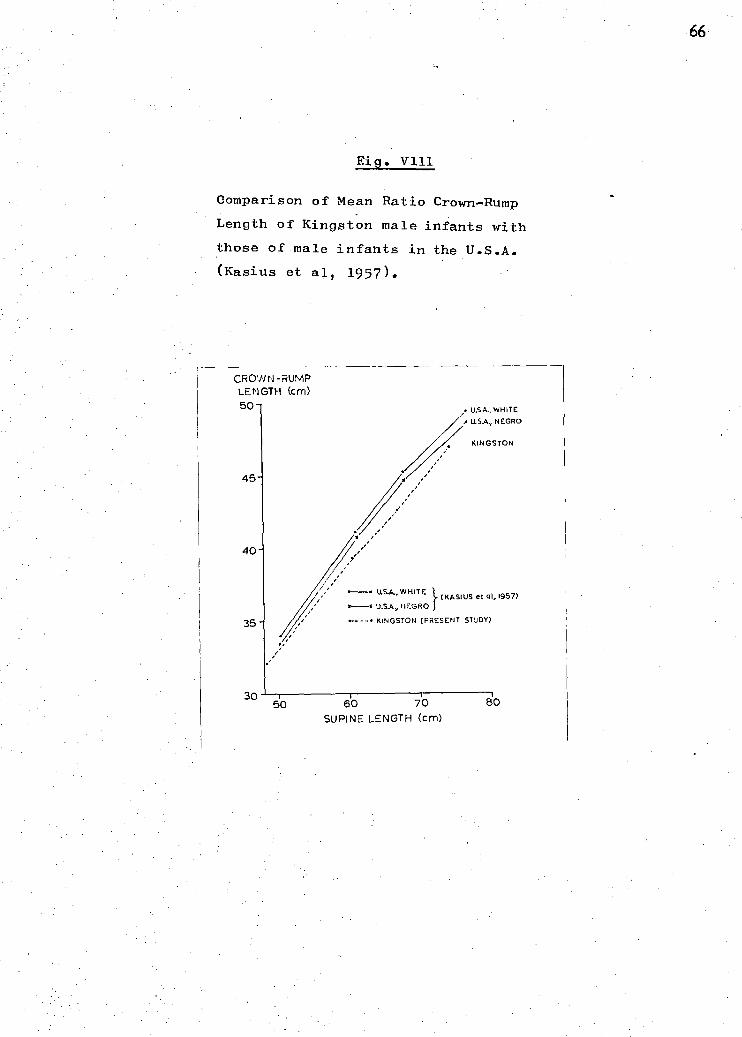
The ratios of crown-rump lengths/supine lengths in this study were
compared with";Ithose of Negro and White infants in the U.S.A. reported
by Kasius et al. (1957). Figure V111 shows that the ratio declines
'throughout the year.in 'all samples. In both Negro. groups. the ratio
was less than in the White infants. This finding that Negro children
have comparatively short bodies and long legs has been demonstrated
at greater ages also (Vergheze et al. 1969; Ashcroft et al.1968b).
Summary
Cross-sectional tables for weights, lengths and crown-rump lengths,
and longitudinal tables for weights and lengths are presented.
Fifty-four (20%) of the, infants were underweight and 1 was marasmic
at some time during the year. The infants grew exceptionally fast
during the first 3 months of life. This rapid growth was not associated
with a high incidence of breast feeding as 67% were partly or wholly
bottle-fed at 6 weeks of age. 'After 3 months of age growth was depressed
compared with North American and European standards. The Kingston
CROWN -RUMP LENGTH (cm) 50 • U.S.A., WHITE
.• U.S.A., NEGRO
30 50 60 70 80
SUPINE LENGTH (cm)
KINGSTON
45-
40
•-• U.S.A„ WHITE (KASIUS et al, 1957) U.SA., NEGRO
•----• KINGSTON (PRESENT STUDY) 35 -
66
Fig. V111
Comparison of Mean Ratio Crown-Rump
Length of Kingston male infants with
those of male infants in the U.S.A.
(Kasius et al, 1957).

CHAPTER VI
HEAD CIRCUMFERENCES
This chapter reports cross-sectional and longitudinal
measurements of head circumferences. Results from the same 29
children:excluded in the previous chapter were excluded.from:
'this analysis.
Results
Means and standard deviations of head circumference at each
age are given in Table XV11. Means and standard deviations of
increments of head circumference over certain age intervals are
given in Table XVIII.
Discussion
Means and standard deviations of head circumference were
slightly larger in males'than in females throughout the first
year of life. After the first three months, during which boys
grew faster than girls, there was no consistent difference between
the sexes in the rate of growth.
Nellhaus (1968) reviewed the literature on head circumferences
and reported that there was no appreciable difference between races,
though he referred to only two negro groups (those of Scott et al.
1962 and Kasius et al. 1957). Table X1X shows head circumferences
of males in the present study and in other studies of negroes and
whites. Although negroes tend to have smaller heads than whites,
results may be influenced by measuring technique and sample selection,
and evidence for or against racial differences, is inconclusive.
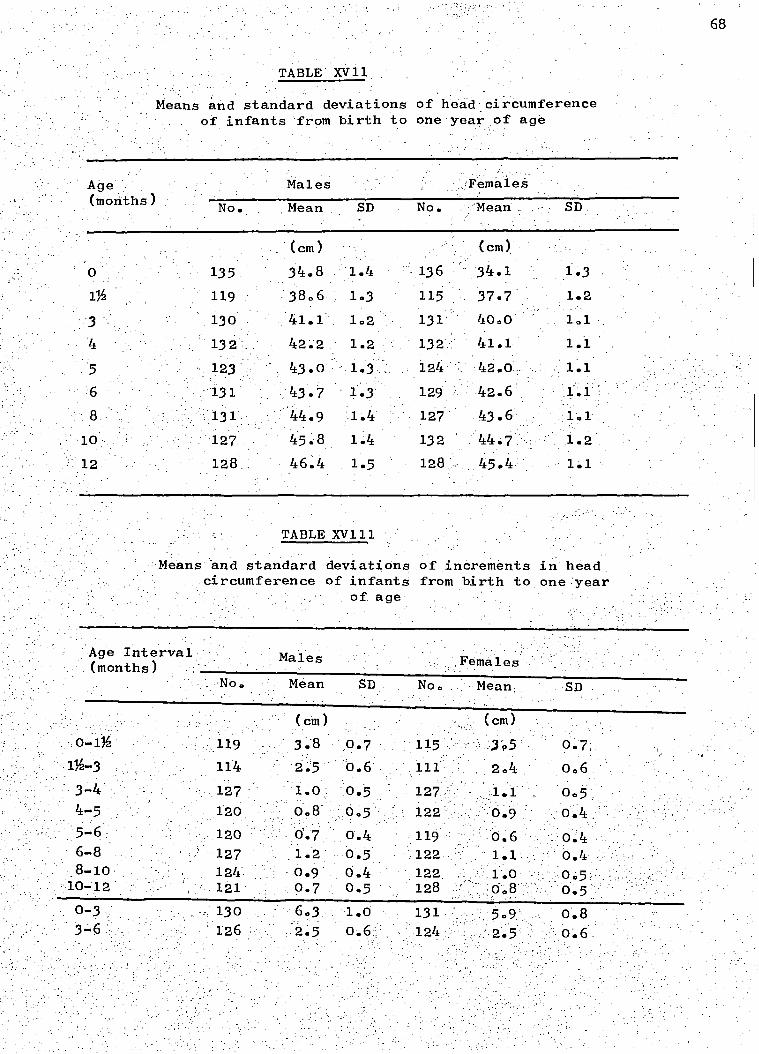
68
TABLE XVII
Means and standard deviations of head circumference of infants 'from birth to one year of age
Age (months)
Males :FemaleS
No. Mean SD No. -;Mean . SD
(cm) (cm) 0 135 34.8 1.4 136 34.1 1.3 Ilh 119 38.6 1.3 115 37.7 1.2
3 130 41.1 1.2 131 40.0 1.1 4 132'_ 42.2 1.2 132 41.1 1.1 5 123 43.0 1.3 , 124 42.0 1.1 6 131 43.7 1.3 129 42.6 1.1 8 131 44.9 1.4 127 43.6 1.1
10 127 45.8 1.4 132 44.7 1.2
12 128 46.4 1.5 128 45.4 1.1
TABLE XV111
Means and standard deviations of increments in head circumference of infants from birth to one :year
of age
Age InterVal, (months)
Males ::FemaleS
No. Mean SD No, Mean. SD
(cm) (cm) 0-1 119 3.8 ,0.7 115 . 3'95 0.7
1%-3 114 2.5 0.6 111 2.4 006 3-4 127 1.0 0.5 127 . .1.1 0.5 4-5 120 0.8 0.5 122 .9 0.4 5-6 120 0'.7 0.4 119 0.6 0.4 6-8 127 1.2 0.5 122 1.1, 0.4 8-10 124 0.9 0.4 122 1.0 0.5 10-12 - 121 0.7 0.5 128 , 0.8 0.5 0-3 130 6.3. 1.0 131 5.9 0.8 3-6 126 2.5 0.6:: 124 2.5
,

*Median. +Males and females. ++Semi-longitudinal study,1964-1967 (unpublished data).
TABLE XIX
Mean head circumference during the first year of life of white and negro males in various studies
White males U.K. Westropp & Barber 1956 USA Falkner 1962. ' USA Stuart & Stevenson 1959 USA Kasius at al.1957 USA Nelson & Deutschberger 1970
Negro males , USA Kasius et al.1957 USA Nelson & Deutschberger 1970 USA Scott et al. 1962 USA Verghese et al.1969
st.Vincent+ Antrobus 1970 Rural Jamaica MRC Epidemiology Unit(Ja.)++ Urban Jamaica Persaud at al .1971
. Urban Jamaica Present study
O Age (months) 3 6 12
Number of infants
(cm) (cm)
40.7
(cm)
43.6
(cm)
46.8 331 35.1 , 41.0 44.0 47.0 - 35.5 40.9* 43.9* 47.3* 34.6 40.6 43.7 46.9 131-506
46.4 2154
34.4 40.9 - 44.1 47.1 92-161 - 46.1 2585
34.1 39.7 43.0 46.7 38 40.0 42.5 44.6 31-56 39.1 42.4 45.0 166-182
- 40.5 43.3 46.0 71-88 34.1 - - - 211 34.8 41.1 43.7 46.4 128-135
ample Reference
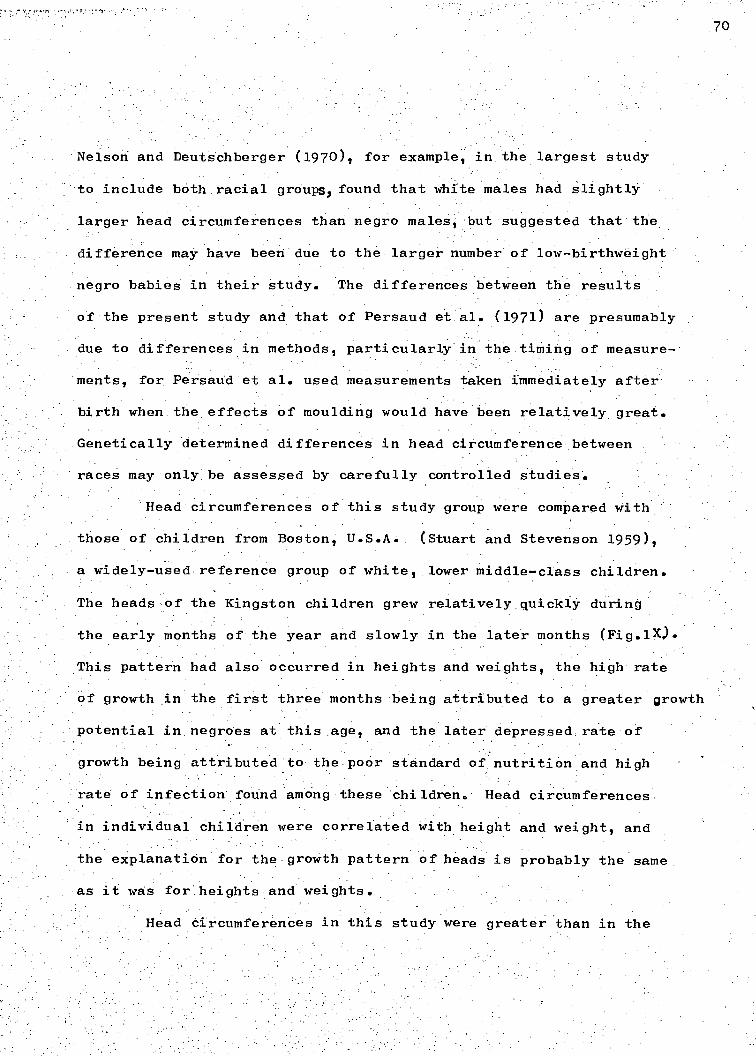
70
Nelsori and Deutschberger (1970), for example in the largest study
to include both racial groups, found that white males had slightly
larger head circumferences than negro males but suggested that the
difference may have been due to the larger number of low-birthweight
negro babies in their study. The differences between the results
of the present study and that of Persaud et al. (1971) are presumably
due to differences in methods, particularly in the timing of measure-
ments, for Persaud et al. used measurements taken immediately after
birth when the effects of moulding would have been relatively, great.
Genetically determined differences in head circumference between
races may only be assessed by carefully controlled studies.
Head circumferences of this study group were compared with
those of children from Boston, U.S.A. (Stuart and Stevenson 1959),
a widely-used reference group of white, lower middle-class children.
The heads of the Kingston children grew relatively quickly during
the early months of the year and slowly in the later months (Fig.1X)•
This pattern had also occurred in heights and weights, the high rate
growth in the first three months being attributed to a greater growth
potential in negroes at this age and the later depressed rate of
growth being attributed to the poor standard of nutrition and high
rate of infection found among these children. Head circumferences
in individual children were correlated with height and weight, and
the explanation for the growth pattern of heads is probably the same
as it was for heights and weights.
Head circumferences in this study were greater than in the
BOSTON, USA
KINGSTON, JAMAICA 0 Malnourished child
10th, 50th and 90th percentiles of head circumference of male infants in Kingston, Jamaica and Boston, USA, and head circumferences of 8 Jamaican boys who were malnourished at 1 year of age
Head circumference
(in) (cm)
48
18 a
00
0
14
6 Age (months)
12
0
a
16
71
Fig. 1X

group of rural Jamaicans shown in Table X1X. Heights and weights
of children in the same rural area were also smaller than those
of the Kingston group. These differences may have been due to a
poorer' standard of nutrition in the rural group.
There is increasing evidence of link between infant mal.-
nutrition and poor mental development (Cravioto and DeLicardie 1971).
Malnutrition in the first years of life is associated with reduced
brain weight (Brown 1966) reduced cell number (Winick and Rosso 1969b),
and very small head-circumference at one year is related to low IQ in
later childhood (Nelson and Deutschberger 1970). Eight boys and eight
girls in the present study were moderately malnourished at one year
of age, by the definition of Gomez et al (1956); the head circumferences
of these boys are shown in Fig. 1 and can be seen to be very small.
Some of these children, at least, would appear to be at risk of not
achieving their full intellectual potential.
Many of the Kingston children were growing up in unstimulating
surroundings,' there was a low standard of education among the mothers,
frequent separation of children from parents1 and a general lack of
books,. toys, paper and, pencils in the children's homes. Some of these
Kingston children in whom head size was found to be small had potentially
been at the double disadvantage of poor nutrition and cultural deprivation.
It is possible that small head size in this population is more predictive
f mental retardation than it is in other populations living in more
stimulating environments.

73
Summary
Measurements of head circumferences in 271 babies during their
first year of life are reported. Growth was particularly good in the
very early months and poor during the later months. Comparisons are
made with other studies of negroes and whites, and the effects of
malnutrition and unstimulating environments upon mental development
are briefly discussed.
CHAPTER V11
BREAST FEEDING
71-1.
n most tropical countries breast feeding is of paramount importance
to infants in their first year of life. Widespread poverty makes
other milk foods prohibitively expensive, and the risk of infection
due to unhygienic feeding habits is high. This is still the situation
in Jamaica, and so it was decided to investigate: (a) How the breast
feeding habits of, the population were being affected; (b) What
factors were important in influencing the incidence of breast feeding;
(c) If, and in what way, the method of feeding affected the infant's
health. The results are reported in this chapter.
RESULTS
Method of feeding. The method of feeding recorded as breast alone,
bottle alone, and combined bottle and breast feeding, divided into
predominantly bottle and predominantly breast are shown in Table XX.
From 6 weeks to 5 months of age combined feeding was the most popular.
Bottle feeding was used more often after 3 months than breast feeding.
Reasons for method of feeding. While in the obstetric ward all the
mothers were asked which they considered best for their baby breast
or bottle feeding. The overwhelming majority chose breast, as shown
in Table XX1. It must be remembered that they were in hospital,
where they are encouraged to breast feed, and replies may reflect
more what the mothers thought we wanted to hear than what they
actually believed. On the first occasion that bottle feeding was
recorded the mothers were asked why they began the bottle.
We found that it was more relevant to ask why they began the bottle

A e Breast Mostly Mostly Bottle No No.of Alone Breast . Bottle Alone Milk Cases
17 73
87
5 297
21 10 298
33 22 296
41 28 291
34 44 0.3 288
31 48 2 288
21 63 4 282
277
273
67
23 47 .
18 27
10 22
Birth
6 Weeks
3 Months
4 Months
5 Months
8 Months
10 Months
1 Year
TABLE,XX
75
Incidence of Breast, Bottle, and Combined Feeding Methods at Various Ages, as a Percentage of Total

Answers given by Mothers shown as percentage of total asked
TABLE XX1
Breast is best .. 84%
Bottle is best .. 12%
DonIt know .. 4%
TABLE .XX11
Reasons given by Mothers for' beginning bottle shown as percentage of total. asked
rather than why they stopped breast feeding. Most mothers gave
their babies combined bottle and breast milk for long periods,
.gradually stopping the breast. When breast feeding was eventually
mothers were afraid they would lose weight if the
milk also there was the necessity to leave the baby to o shopping
onto save time for other household'_work.
contained all those mothers who said that a nurse
commercial milk firm had either told her to start the bottle :o
given her a free milk sample at a time
satisfactorily breast fed.
when the child was being
Other factors affecting breast feeding. Several-factors shown in
77
stopped there was little milk left, and the commonest reason given
was that the baby refused the breast. Table XX11 Shows the
iven by the mothers. The miscellaneous
of interesting views, such as they liked to reserve their breast
milk for the night or they considered their milk was, bad for the
baby if they were hot, tired, or in any way uncomfortable. Other
Tables XXIII and XX1V were examined for their effect on breast feeding.
(1) Hospital complementing. 33% of all babies were either wholly
or partially on the bottle when leaving hospital. ,SeVeral factOrs
contributed to this number; there were 10 mothers with breast trouble
who constitute a group who are likely to bottle feed (Miller,1952,
part III) and there were 14 multiple births. It is well known that
premature babies are less likely to. breast feed due to their poor
ability to suck and separation from their mothers in a nursery
(Miller, 1952, part II). The diets of a higher prot.ortion o
singleton babies with birthweight under 2.27 k . were complemented on
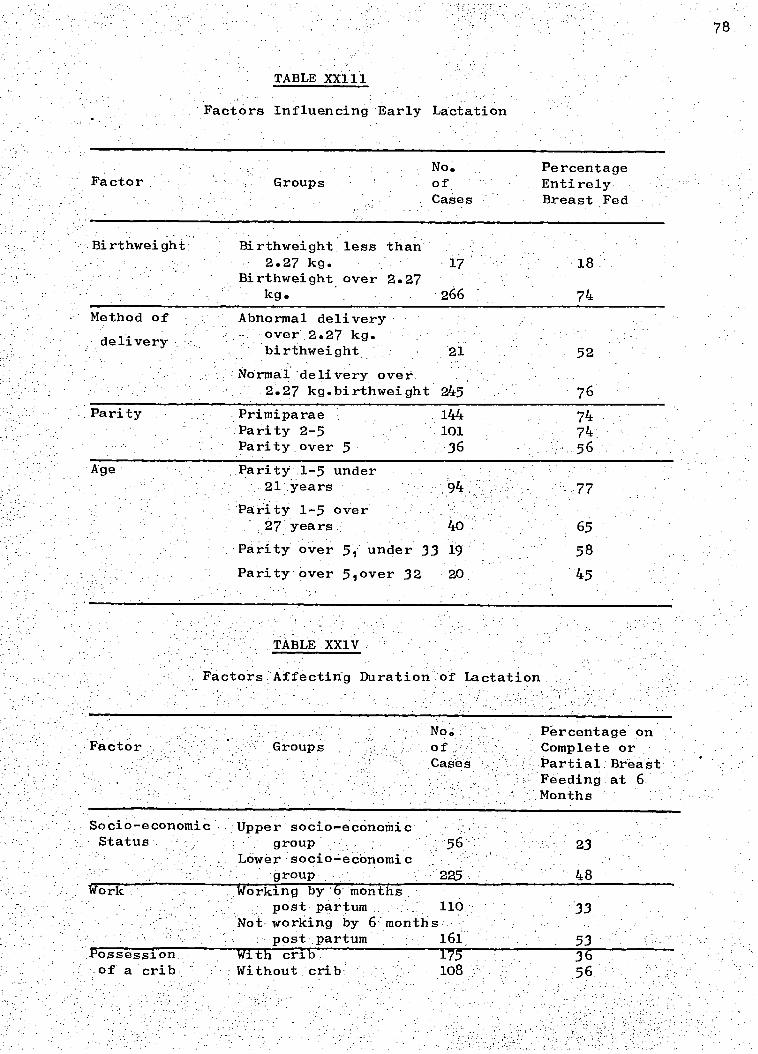
78
TABLE XX111
Factors Influencing Early Lactation
No. Percentage Factor Groups of Entirely
Cases Breast Fed
Birthweight Birthweight less than 2.27 kg. 17
18 Birthweight over 2.27
kg. 266
74 Method of
delivery
Abnormal delivery over 2.27 kg. birthweight 21 52
Normal delivery over 2.27 kg.birthweight 245 76
Parity Primiparae 144 74 Parity 2-5 101 74 Parity over 5 36 56
Age Parity 1-5 under 21 years 94 77
Parity 1-5 over 27 years 40 65
Parity over 5, under 33 19 58
Parity over 5,over 32 20 45
TABLE XX1V
Factors Affecting Duration of Lactation
Factor :GroUps No. Percentage on of Complete or Cases Partial Breast
Feeding at 6 Months
Socio-economic Upper socio-economic Status group 56 23
Lower socio-economic group 225 48
Work Working by 6 months post partum 110 33
Not working by 6 months post partum 161 53
Possession With crib 175 36 of a crib Without crib 108 56
79
leaving hospital than singleton babies with birthweight over 2.27 kg.
( p less than 0.01). Abnormal deliveries are also associated with
a decreased incidence of breast feeding (Miller, 1952, part II).
In the present study more singleton babies of birthweight over
2.27 kg. with abnormal deliveries were complemented on leaving
hospital than those with normal deliveries ( p less than 0.05).
For 46 babies complemented in hospital there was no obvious reason
for insufficient lactation. Only 5% of all those complemented on
leaving hospital subsequently returned to complete breast feeding.
(2) Parity and age. Ax2 test showed no over-all association
between lactation and parity. However, fewer mothers of parity
6 and over established early lactation than mothers of parity .1 to
5 (p less than 0.05). Parity made no difference to the number
lactating at . 6 months. In this study age made no significant
difference to the incidence of early lactation.
(3) Working. At 6 months a higher percentage of non-working mothers
breast fed their babies than those who were working (p less than 0.01).
(4) 'Socio-economic and-cultural factors. In the present study
a higher p.roportion of mothers in the .lower economic group than
mothers.in the upper economic group were breait feeding at 6 months
(significant to less than 0.01). ,During the visits it was questioned •
whether.the possesSioh . of a crib influenced breast feeding. More of
the .108 - mothers without cribs lactated'at'6 months than the 175'mothers
with cribs ( p less than
study the incidence of gastro-enteritis

8o
was high (Chapter III). So few babies were entirely breast fed for
any length of time that gastro-enteritis was associated with breast
feeding for only the first 4 months. Data from 885 infant-months
up to 4 months of age with adequate information on infection and
feeding were available. As shown in Table XIV there was an increased
attack rate in the bottle-fed babies (p less than 0.01). There
was a general increase in the incidence of gastro-enteritis up to
6 months of age and this coincided with the decline in breast feeding.
However, other factors such as the beginning of crawling and the
introduction of solid foods have to be considered.
(2)
Weight gain.. Weight increments for the first three months were
calculated for each infant. The 25% of infants with the lowest
increments were then compared in their method of feeding to the
ramaining ones. As shown in Table XXV1 a higher proportion of infants
in the lowest 25% were bottle fed than those infants in the remaining
group ( p less than 0.05). This was not true after 3 months.
DISCUSSION
The patients studied represent a selected group, as they were all born
in hospital. Richardson (1950) stated that the enthusiasm of the
staff for breast feeding had a direct bearing on the success of it.
We had a higher proportion of primiparae and consequently younger
mothers than there are in the population in general. Many different
reports have shown that parity affects the incidence of breast feeding
in conflicting ways. Westropp (1953) found primiparae breast fed
their infants less often than did multiparae; Salber and Feinleib (1966)
found they breast fed more often, and Miller (1952) found no difference.
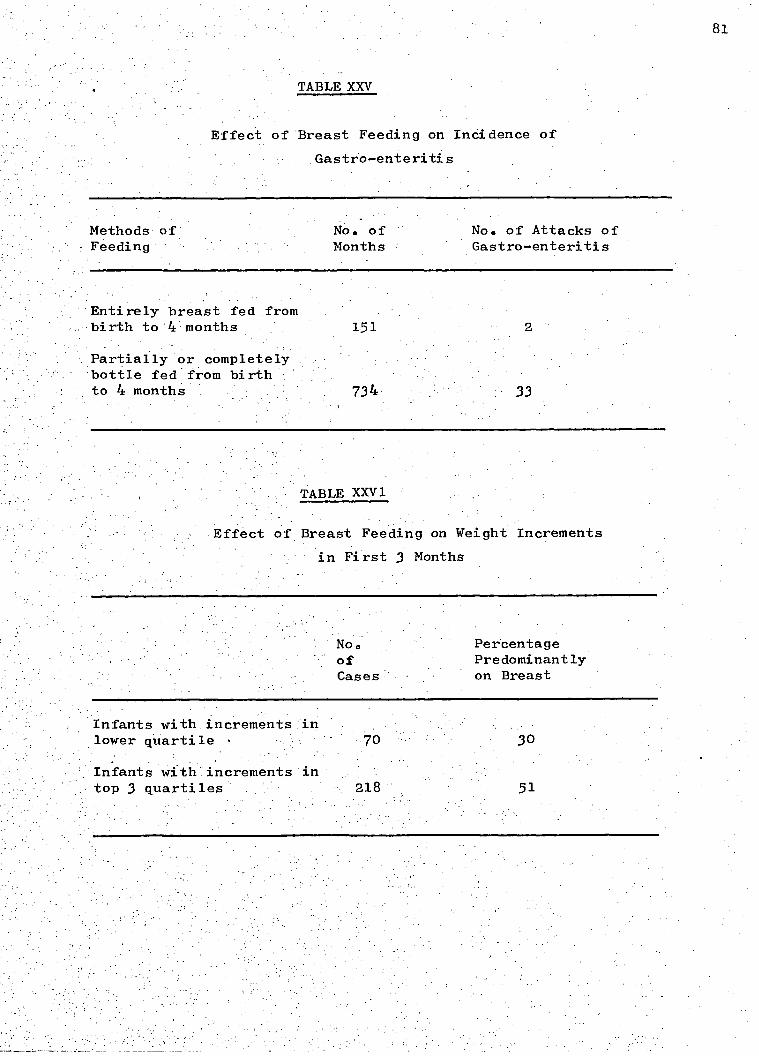
81
TABLE XXV
Effect of Breast Feeding on Incidence of
Gastro-enteritis
Methods of
No. of
No. of Attacks of - Feeding Months Gastro-enteritis
Entirely breast fed from birth to '4 months 151
Partially or completely bottle fed from birth.. to 4 months . 734. 33
TABLE XXV1
Effect of Breast Feeding on Weight Increments
in First 3 Months
No Percentage of Predominantly Cases on Breast
Infants with increments in lower quartile •
Infants withAncrements'in top 3 quartiles 218 51
Perhaps the best investigations were by Dean (1951), when he described
the actual yield of breast milk in 22,000 mothers, found by test
weighing their babies before and after each feed. He found primiparae
produced less milk than multiparae, and young primiparae produced more
milk than older primiparae. Miller (1952) found that older members
breast fed less than younger mothers, whereas Douglas (1950) found
no difference.' In this study only grandmultiparity made a significant
difference to early lactation, and parity had no effect on the duration
of lactation. Age made no significant difference to the incidence of
lactation. It is unlikely, therefore that a large proportion of
primiparae altered the over-all pattern of breast feeding a great deal.
No previous study could be found in Jamaica except a recent one by the
Medical Research Council's Epidemiology Unit, in a rural area where
the duration of breast feeding was much longer - 85% of babies still
received breast milk at 6 months. The pattern of feeding in Kingston
has no similarity to that in Africa. Morley, Bicknell and Woodland
(1968) found that in Nigeria it is exceptional to wean an infant
before 1 year. Marsden (1964) reported that in Gambia weaning begins
at '7 months. The prevalance of breast feeding in this study is less
than reported by Ross and Herdan (1951) in Bristol, England, but more
than that reported by Newson and Newson in 1962 in Nottinghaml England.
There was some doubt as to the validity of the. reasons given by some
of the mothers for-beginning the bottle,' Many - mothers who said they
had insufficient breast milk obviously had enough when questioned
further. .The large:number'who gave this reason coincides with the
findings.of:Ross and Herdan.(1951) and Newson and Newson (1962) in
8lb
England.- The latter came to the conclusion that this was no more
than an . excuse. Complementing with bottle feeds in', hosPital was
perhaps an important factor in the high number of _ infants on the
bottle by 6 weeks. The majority of mothers leave hospital on the
fifth day, lactation is not fully established until the eight day,
and the largest daily increase in yield is on the fifth day (Dean
1951). This must be a contributing factor to the large number
complemented in hospital, but - most mothers did not understan
.::that complementing was done as .a temporary measure until lactation
'was':ftillestablished: Only 5% of:n all those complemented on leaving
'hOspital sUbsequently gaVe up the bottle.. added n responsibilities
f household duties mitigated against establishing successful
_ actation (Hill, 1955).
e• strong impression 'was obtained that though most mothers thought
:that breast feeding alone was better than bottle alone, they felt
- 'that a combination of the two must be better than either one alone.
Working was another significant factor in the high incidence of
ottle feeding. 57%- the mothers worked before their infants
were 1 year old including 12% who boarded their infant away from them.
Many mothers were uncertain whether they, would have to leave their . infants in - the near future, and in case of this eventuality were
reassured-if their infants were at least partly weaned.
ocio econothic faCtors affect the incidence of lactation differently , . n .
n.diffei•ent counti-ies. Salber and Feinleib in Baston, U.S.A.(1966),.
ound :that . nthe upper clas.s: *breast • fed more - than the lower class, and
WestropP (1953)1 in Oxford, England, :found the same. Meyer (1958)
Though not systematically investigated,
81e
found that different regions in the U.S.A. had a different incidence
of lactation. In this study the lower socio-economic group breast
fed more often than the upper socio-economic group. There was no
significent difference between the upper and lower socio-economic
groups in the number of working mothers. More of the mothers without
fed than those with cribs. The possession of a crib
may just be another measure of the socio-economic status, or it
may be that it is easier to breast feed when the baby is in the
same bed..
Advertising by commercial milk firms was on an even vaster scale
than at first anticipated. 14% of the mothers said they were
encouraged to bottle feed by a commercial milk nurse. However,
many had been visited at home and given samples o proprietary
milk. The hospital itself was used as 'a centre for easy access to
post-partum mothers and the commercial milk nurses waited outside
the postnatal clinics with free milk samples. Many mothers were•
given up to three different brands of milk samples. The influence
of advertising is probably much greater than the 14% indicated.
In view of the increased incidence of gastro-enteritis associated
with bottle feeding this must be a cause for concern. Wheatley
(1968) was unable to correlate the incidence of gastro-enteritis
with bottle feeding, though he referred to the investigations by
Gatherer and Wood (1966). They investigated bacterial contamination
of teats and bottles and found only 69% of the bottles and 46% of
the teats were satisfactory Robinson (1951) found from the records
of , 3 3,266 welfare babies that breast feeding reduced both the morbidity
and': the mortality from gastro-enteritis.
81d
There seems ample explanation for the low incidence of breast
feeding and every expectation that it will continue to decline
as Salber and Feinleib (1966) found in the U.S.A., and Newson
and Newson (1962) in Britain. Unfortunately in Jamaica the
results Will probably be much more serious due to poverty and
the general low standards of hygiene.
The method of milk feeding and the reasons given by the mothers
for beginning bottle feeding are recorded. Other factors
influencing the incidence of breast feeding were examined.
Complementing in hospital, maternal employment, improving
socio-economic status, advertising, and general misinformation
were considered important. A higher incidence of gastro-enteritis
was found in the first 4 months of life among partly or wholly
bottle-fed babies than among breast-fed babies. Weight increments
were calculated for the first 3 months of life. A higher
proportion of infants with increments in the lowest 25% were
bottle fed than those infants with increments in the remaining 75%.
82
Full information about the childrents diets was known for 270
children and is reported in this chapter.
RESULTS.
MILK
Particular attention was paid to infants on no milk or very small
amounts of milk. Very small amounts were defined as less than pint
of milk a day or less than 3 breast feeds a day. 37 infants were
recorded as being on no milk or very small amounts of milk at one
visit and a further 19 at more than one visit. The weights of
these children were examined (Table XXVII) and significantly more
of them were found to be in the 10th percentile for weight by 12
months of age than the remaining children (p = less than 0.01).
Every mother bought some proprietary infant milk preparation
during the year. The brands of milk being given at the twelve-month
visit or the nearest visit to twelve months when it was recorded:
are shown in Table XXVII1 alongside the current market prices. It
was remarkable that many mothers constantly changed the brand of
milk. On the few occasions dried skimmed milk or cow's milk was
used it was introduced late in the year. Of the 247 mothers asked
only 37% said that they had bought half cream milk subsidized by
the Government on at ,least one occasion. However it was rarely
obtained regularly and only 18% were having it at twelve months.
SOLIDS'
The percentage of infants 'to be given various foods at each
visit is shown in Table XX1X. Maize meal was the commonest cereal
used and waS.usually'given in a bottle with a large hole in the
nipple., Unfortunately instead of. supplementing the milk intake the
TABLE XXV11
Showing Association between milk intake and the numbers in the 10th percentile for weight
at 12 months
Infants divided into groups .Nos. of
'Nos. in 10th percentile According to milk intake Infants at 12 months
Observed Expected
-Repeatedly on very small or no milk intake
On very small or no milk intake on one occasion
Never recorded as being on very small intake
19 13 1.9
37 6 3.7
214 '10 21.4
83
TABLE XXVIII.
Showing the 'Milk Formulae used at 12 months and their cost
-Brand name of milk Cost per 1 lb. Percentage 'of total on this brand
9/- 21%
2/- 18%
7/6 14% 6/9 8%
7/6 8%
2/- 5%
9/- 3%
8/3 3%
7/3 3%
11/9 1%
10/6 1%
8/3 1%
1%
2/- per qt. 7%
1/5 per tin 5%
,Olac
Subsidised Semilko
Lactogen
Nespray
Ostermilk
Skim
S.M.A.
Cow & Gate
Semilko
s. 26 Sustagen
Klim
Miscellaneous
Cows
Evaporated

- 84
TABLE XXIX
Percentage of Infants being given a particular food at each examination
AM/
Orange Cereal Egg and Juice Cheese
Legumes, Vegetables Meat and and Fruits Fish
6 Weeks .51%' .. :1%
3 Months . . 91% 41% 2%
.4 Months. • 98% - . 71%_ 25%..
5 Months .99% 87% 47%
6 Months 96% 67%
-8 MonthS 99% 85%
10 Months 91%
12 Months : 94%
1% 4%
-26%
50%
77%
4%
10%
17%
95%:
-99%
100%
•
39%
75% .
93%
Never 1% 1% 5% 0% 6%

85
maize meal often replaced milk which h d previously been given.-,
Irish potatoes, chocho and pumpkin were the commones egumes
and vegetables given. Peas and beans were very rarely given.
Meat was more often' given than fish, and when the latter was
used it was Usually fresh and not. salted' SouP was commonly
introduced around five to six months, however, the particles o
meat were often discarded as 'trash'. Soup was not recorded
separately but as vegetables and meat when these ingredients
were actually given. 66% of the 167 mothers questioned had
bought at least one jar of proprietary baby food.
DISCUSSION
It is not possible to do a "bird watching" survey amongst
poor and relatively uninformed population, and a' certain amount
of advice was given. It is probable that a slightly optimistic
picture of the diets is recorded here. Certainly a.11 the 56
mothers found to be giving very small amounts of milk or no milk
were advised to give more milk. The number on repeatedly small
amounts of milk, thei-efore, i probably smaller than it would
otherwise have been. However, in a recent longitudinal study
on child growth conducted in the rural district of Lawrence
Tavern by the Medical Research Council's Epidemiblogy Unit s
:frequent 'advice and attention made no significant difference
the weights of the children compared with a control group
Who were observed but not advised.
nalysis-Cf:the ageifOi beginning Meat ,arid fish and the
duration :of breast feeding ehOwed no significant. diffei'ence
between children of primiparae and multiparae. It is therefore
unlikely that the large number of primiparae in the study made
a great difference to the overall pattern of feeding.

86
The mothers had little idea of budgeting. They tended to
buy certain brands of proprietary milk without regard for obtaining
good value for money. In the same way a high proportion of them
bought jars of proprietary baby food an expensive source of food.
Conversely skimmed milk an extremely economical source of food was
rarely bought.
It would appear from Table XXVII. that an.adequate supply of
milk is the one most important factor in an infant is diet during
the first year of life. This confirms Fox's (1968) finding that
_milk is the main source of protein in the first year of life in
Jamaica. The present subsidized milk scheme is not reaching many
children. Many mothers did not know how to get the milk, or could
not get a regular supply.
Table XXIX does not represent the beginning of a regular or
adequate supply of the foods mentioned, however it does indicate
that Kingston mothers have some idea of when foods should be
introduced into their infant's diet.
SUMMARY
56 children were on very poor or no milk intake at one visit
or more. These children were more likely to be underweight at 12
months of age than the remaining children. The brands of proprietary
milk preparation that were being given to the children are listed.
n general the mothers did not get goOdValUefOr'themoney'they
spenton infant food. The age when.various' sOlidsWerediven:to
the children is liSieth :67%:Of the Children had been` given jars
of proprietary baby food.'

87
CHAPTER 1X
HAEMATOLOGY
In this chapter the results of the haematological investigations
are reported.
RESULTS.
The distribution of Hb genotypes among the infants is shown in
Table XXX. The group is too small to assess the incidence of
genotypes in the total population.
The Hb levels of the 7 children with genotypes SS, SC and CC
varied, some falling below the mean as early as 6 weeks, and all
'being below by the end of the year (Table XXX1). These children
were excluded from further analyses.
n order to examine only ?normal' children a further 37 children
of small birth weight (below 2.5 Kg), or multiple birth — both causes
of anaemia in infancy were excluded. 'A further 30 whose Hb genotype
was not determined were also excluded. The results presented here
refer to 226 children (118 boys and 108 girls) who were singletons
of birth weight 2.5 Kg or more and of Hb genotypes AA, AS or AC.
25 children with genotype AS and 6 with AC were included among this
'normall group as.all their other haematological findings were similar
to th0se of children with genotype AA.
At least 96% of the children in this group were seen at each
scheduled visit, though technical problems caused some further loss
Table XXX11 shows Hb levels during the year. Males had lower
mean Hb le'vels than females at 6 weeks of age (p is less than .01);

TABLE XXX
Distribution of Hb genotypes among 300 infants
Hb genotype
Number of % infants
of those with known genotypes
AA 231 85.6
AS 25 9.3
AC 7 2.6
SS 4
1.5
SC 2.. 0.7
CC 1 0.4
Unknown 30
Total 300 100.1
A 18.0
Geno- CHILD type
19.4
19.8
CC 17.2
A G E (months)
3 6 8
11.8 10.1 10.7
10.8 10.3 9.5
9.4 8.0 8.6 7.7
8.5 7.2 7.8
9.6 8.4
9.3 8.1. 9.7 8.2
7.1 9.9 9.2 9.0
8.8 9.6
7.9 8.7
10 12
8.3 8.8
9.1
7.5 7.4
9.5 9.0
SS
.19.8
16.5
16.0
SC
TABLE XXX1
Haemoglobin levels (g/100 ml) in infants of genotype SS,SC and CC
Sex ' Mean Hb level .. age (mo.). No. (g/100 ml)
Males (118 children)
0 118 19.5 1.1A 115 10.9
3 111 10.7
6 114 10.5
8 47 10.0
10 100 10.6
Standard deviation
2.2
1.4
1.3
1.2
1.0
1.3
12 111 10.6 1.4
TABLE XXXII.
Mean haemoglobin levels during their first year of singleton infants of birth weight 2.5 Kg or more and of haemoglobin genotype AA, AS, or AC.
this trend continued for the rest of the yearAhough the differences
not again reach statistical significance.
varied with age with the well known primary fall from birth to 3
Months and a secondary dip around 8 months.
were low. at 8 monthS'i the few children whose Hbts were measured
then did not have lower Hb levels at 6 and 10 months than the other
children so the dip at 8 months was a real one.
There was little difference between the2socio-economic%groups.:
throughout the first 6 thoiiths . of life. - . From 8 months onwards
upper socio-economid:groUp had higher Hb leVels than the lower group
rind'the'Aifference beCame . significant by 12.mcirithsof :Age(p is
than .05). The relationship existed in both sexes, but was stronger
in boys.
The relationship'between weight gain and Hb level was examined.
' A very weak negative correlation (r = -.212 p 1S less than .05)
between weight , gain during the first . 3 months of life and Hb level
3 months of age was found. A similar correlation was found between
weight gain frOM 3 to 12 mOnthS of age andjib'level at.12 months
p is -less than .05). The mean Hb levels of 25 children
who were 'underweight. ' at 12 months of age (by the definition of an
international working party 'Jamaica, Lancet 1970) were not
significantly different from those of the group as a whole.
Haemoglobin levels were related to birth weight in both sexes
in this study even though -small birth weight babies were excluded.
Among the boys correlation between Hb level and birth weight was not
significant a 3 months.ofage.but became stronger and was significant
y 12 months of age ( = 0.352 p is less than .01). In girls the

O
92
Fig. X
The Association between Haemoglobin levels and
Birthweight group in Males and Females
Hb g/100ml
MALES FEMALES
c' o\x" No `o
, • I 0 6 12 0
12
AGE (months)
x—x &wt. over 3Kg (81 males, 71 females) 0-0 B. wt. 2.5 -3-0Kg (37 males, 37females)
10

93
correlation was significant at 3 months of age Cr = 0.20, p is less
than .05) but there was no consistent relationship later. These
results are illustrated in Figure X, where the children have been
divided into 2 groups according to birth weight.
We attempted to assess the effect of certain parasites upon
Hb levels. The stools of 148 unselected infants were examined for
parasitic cysts and ova at 10 or 12 months of age. In 88.4% of the
stools no parasites were found. 7.5% had Giardia lamblia, 2.7% had
As lumbricoides, 0.7% Trichuris trichiura and 0.7% both As
and Trichuris. No hookworm was found. The Hb levels in the few
children in whom the findings were positive were' not significantly
lower than the rest.
Table XXX111 shows means and standard deviations of MCHCis,
serum iron total iron binding capacity, uncombined iron binding
capacity and % saturation of transferrin t 10 months of age.jvlean
MCHCis at 12 months were similar to th6se at 10 months.
DISCUSSION
The sample contained a higher proportion of first borns than
occurs in the general population the Hb levels of first born
babies were not different from the rest however, and it appears
that the large proportion of first borns did not bias the results.
Any further bias due to the method of selection for hospital delivery
probably have been eliminated by the exclusion of small birth
weight babie6 from the 'analyses.
There are few reports on the growth and healthof infants with
homozygous sickle cell disease, particularly before its clinical
presentation. this study, the 4 girls who had the disease were
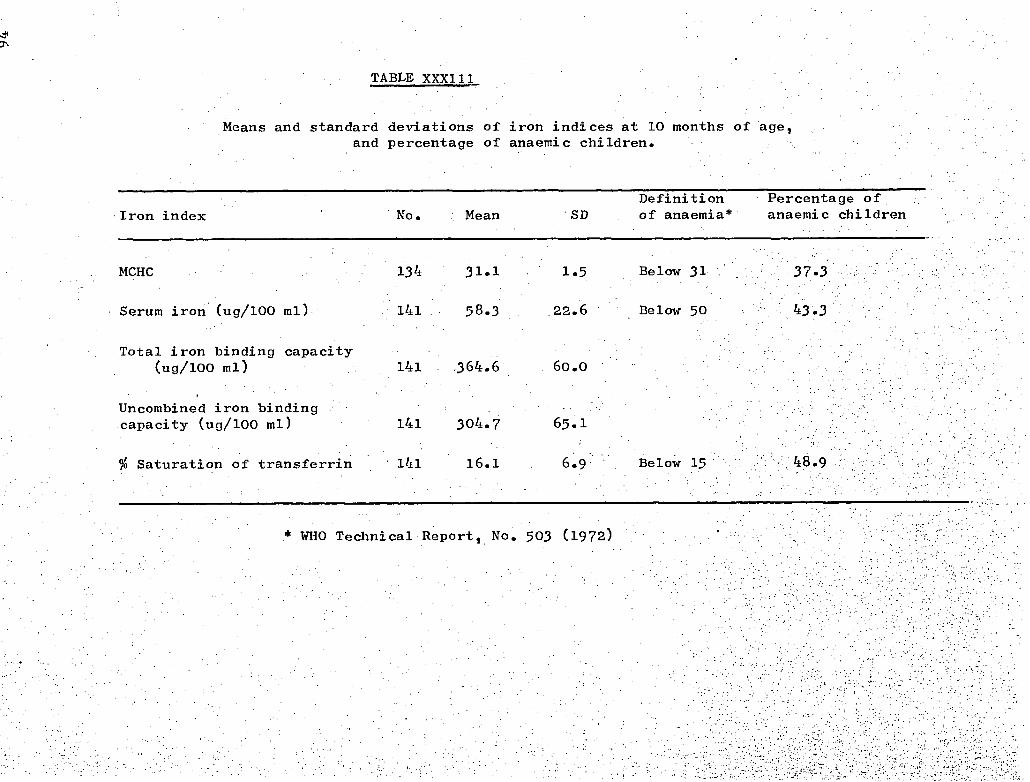
MCHC
Serum iron (ug/100 ml)
Total iron binding capacity (ug/100 ml)
Uncombined iron binding capacity (ug/100 ml)
% Saturation of transferrin
TABLE XXX111
Means and standard deviations of iron indices at 10 months of age, and percentage of anaemic children.
Definition Percentage of Iron index No. Mean
SD of anaemia* anaemic children
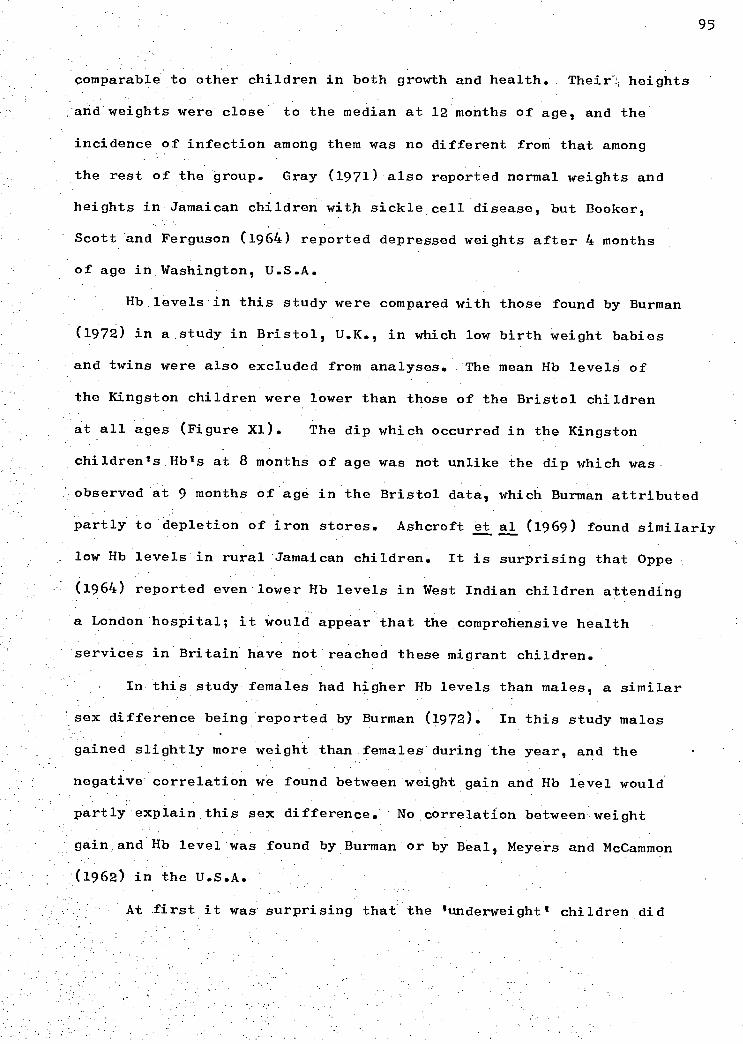
95
comparable to other children in both growth and health. Their" heights
and weights were close to the median at 12 months of age, and the
incidence of infection among them was no different from that among
the rest of the group. Gray (1971) also reported normal weights and
heights in Jamaican children with sickle cell disease, but Booker,
Scott and Ferguson (1964) reported depressed weights after 4 months
of age in Washington, U.S.A.
Hb levels in this study were compared with those found by Burman
(1972) in a study in Bristol, U.K., in which low birth weight babies
and twins were also excluded from analyses,. The mean Hb levels of
the Kingston children were lower than those of the Bristol children
at all ages (Figure X1). The dip which occurred in the Kingston
children's Hb's at 8 months of age was not unlike the dip which was
observed at 9 months of age in the Bristol data, which Burman attributed
partly to depletion of iron stores. Ashcroft et al (1969) found similarly
low Hb levels in rural Jamaican children. It is surprising that Oppe
(1964) reported even lower Hb levels in West Indian children attending
a London hospital; it would appear that the comprehensive health
services in Britain have not reached these migrant children.
In this study females had higher Hb levels than males, a similar
sex difference being reported by Burman (1972). In this study males
gained slightly more weight than females during the year, and the
negative correlation we found between weight gain and Hb level would
partly explain this sex difference. No correlation between weight
gain and Hb level was found by Burman or by Beal Meyers and McCammon
(1962) in the U.S.A.
At first it was' surprising that the 'underweight' children did

96
Fig. X1
Mean Haemoglobin levels of the Kingston children
compared with those in Bristol l U.K. (Burman 1972)
19-
\
Bristol Hb
g/100 ml
Kingston
10-
0
3 6 6 12
12-
AGE (months)
11g/100 ml. and 41% below 10g/100 ml.
The normal range of serum iron in infants is not well documented.
Bainton and Finch (1964) have shown that•in adults erythropoeisis is
97
not have lower Hb's than the rest, as presumably they were on poorer
diets. However, the association between lower Hb levels and higher
weight gains may provide a partial explanation.
In Kingston we found a relationship between social class and mean
Hb level, unlike the findings of Burman in the U.K., Lovric (1970) in
Australia and Kripke and Sanders (1970) in the U.S.A. However, it is
unlikely that their lowest socio-economic groups were so poor as ours,
and it is possible that low Hb levels are only associated with low
socio-economic class when standards of living are very poor.
It is difficult to define anaemia in infancy by reference to Hb
levels though by most commonly accepted standards there was a high
rate of anaemia among the children in this study. A WHO Technical
Report (1972) suggested that the definition of anaemia in infancy
should be a Hb level below llg/100 ml. A Committee on Nutrition
(1969) cited Sturgeon's work (1958) and suggested a Hb level of
12g/100 ml_ was probably optimal in infancy and that levels down to
11g/100 ml.. could be considered normal. Burman considered this lower
level unrealistic and suggests criteria of 10 or 9.5 g/100 ml. Figure
X11 shows the percentage of children in our study with Hb levels below
11 10 and 9g/100 m1 at each age. There was a high incidence of
anaemia reaching peak at 8 months of age with 76% of children below
limited by iron deficiency when the saturation of transferrin falls
below 16 percent. Sturgeon (1954), Hunter (1970) and Smith (1960)
a.11 quote different values. The WHO Technical' Report (1972) referred
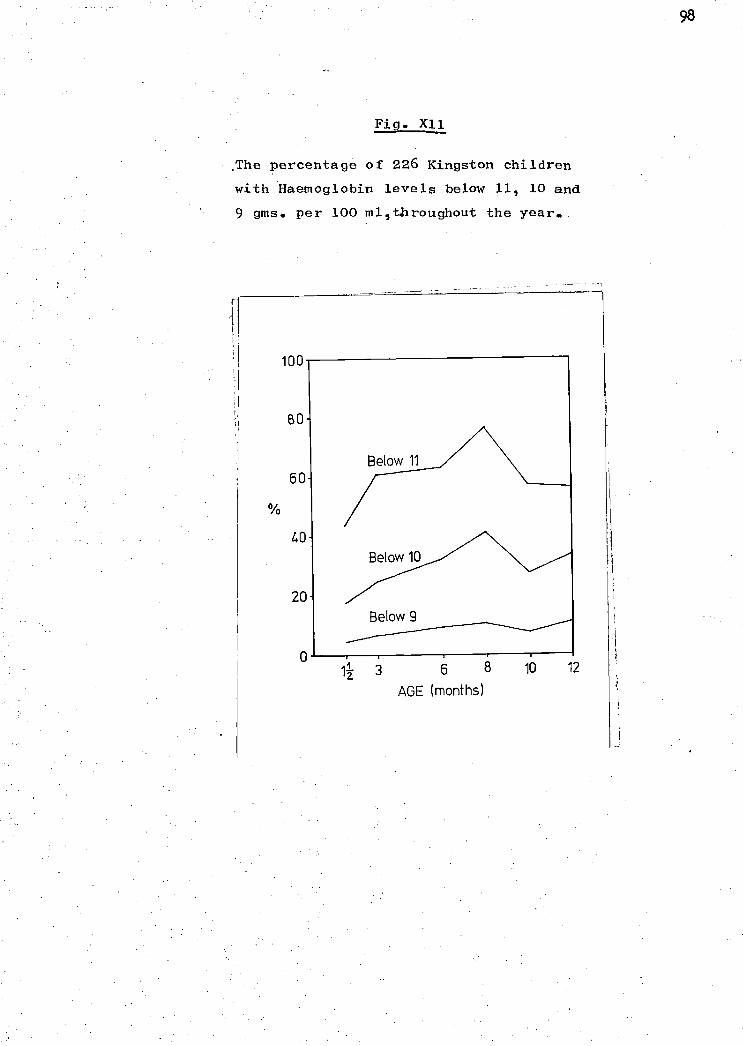
Fig. X11
,The percentage of 226 Kingston children
with Haemoglobin levels below 11, 10 and
9 gms. per 100 mil -throughout the year.
12 3 6 8 10
12
AGE (months)
the loSs was cause of the high
transferrin levels.
It is unlikely that blood
99
need for standardised laboratory techniques and methods of
sample selection, and suggested that serum iron values below 5Oug/100
ml„ per cent saturation of transferrin below. 15 and MCHCIs below 31
indicate iron deficiency. The high percentage of children with values
below these critical levels is shown in Table =111.
Hb levels at 10 months of age were positively correlated with
percent saturation of transferrin and serum iron values '(r = .44, p
is less than .01 for both results). It would seem' that the low Hb
levels at 10 months of age were at least in part due to iron deficiency.
The mean transferrin level in this study was low compared with
- other studies but no correlation was found between Hb levels and
incidence of iron deficiency. The prevalence of intestinal parasites
was low,' and only a few children were fed on whole cows milk, another
possible cause of enteric blood loss (British Medical...Journal, 1973).
In view of the low levels of Hb found as early as 3 months of
age it would appear that the iron stores at birth in these children -
were' poor. The low mean birth weights found in this study would
have contributed to the low iron stores at birth, and there was no
policy of late clamping of the cord which may have improved iron
stores (Yao, Moinian and Lind, 1969). There is conflicting evidence
(reviewed by Smith, 1970) as to whether iron deficiency in pregnancy
affects the foetus. The high incidence 'of,iron deficiency anaemia
(24% of Patients with Hb levels below llg/100 ml) in women attending
antenatal clinics at the University Hospital of the West Indies
(Pathak, Wood and Sorhaindo, 1967) might have been an additional
The high incidence of anaemia later in the yeartfaa
-:certainly due at least in part to poor iron intake or:absorption.
diets of children in this study were generally poor, maize meal was
the staple food of most weaning diets. Ashworth et al,(1973) showed
that iron from this source is very poorly absorbed by Jamaican infants.
Beresford, Neale and Brooks (1971) have shown that iron absorption
is reduced in the preSence of fever, so that infection and .fever.iri.
infants could be a cause of iron deficiency. In this 'study there Was
'high intidence of infections, particularly of gastroenteritis
'this .may have.-reduced the'amount of iron absorbed by 'the infanta.
and
It is also possible that folic acid deficiency contributed
to the low Hb levels as cases of 'severe folic acid deficiency
anaemia are not uncommon in paediatric practice in Kingston (MacIver.
and Back, 1960),
Though there is conflicting evidence as- to the clinical
significance of iron deficiency anaemia in infancy, Andelman and Sered
.(1966) showed a higher incidence of respiratory infections in 'children
with iron deficiency;.and recently Howell (1970) found that attentive-
ness and ability. to.sustain interest in a learning task.were poor in
iron deficient'pre-schoOl children compared with'non-defidient children.
It would seem worthwhile to investigate the possibility of
reinforcing the diet of Jamaican infants with iron..
-In singleton children with Hb genotype AA, AS, or AC and of birth
over, Hb. leVela were low after 3 months of ages
These low levels were associated with iron deficiency which was probably

101
due to poor iron stores at birth followed by poor intake or absorption.
It was not possible to determine whether folic acid deficiency or
protein deficiency were also important.
Hb levels varied with age socio-economic class, birth weight,
sex and rate of weight gain.
A note is made on the growth and health of 4 girls with
homozygous sickle cell disease.

CHAPTER X
GROSS MOTOR DEVELOPMENT
Gross motor development was evaluated at every scheduled visit
102
after birth. 1,908 examinations on 252 infants were accepted for
analysis. 48 infants were excluded, 21 of whom were lost to the
study, 3 died and 24 failed to attend on more than 2 occasions and
were not examined satisfactorily at home.
RESULTS
Table XXX1V shows the percentage of the total infants examined
at each age,to achieve the different items of development! The
infants are divided into two groups according to their birthweight.
The small birthweight infants were significantly slower in achieving
the items indicated.
Table XXXV shows the age at which over 70% of the infants with
birthweight over 2.5 kg achieved each item of development. Although
the two items 'Pull to sit, no head lag' and 'stands alone momentarily'
are included in the Table only 64% and 66% (respectively) of the
infants actually achieved these items at the specified age. Opposite
each item the age at which they were attained by the normal white
child according to 'Gesell Developmental. Schedules' is recorded.
The ages of examination were not identical; the Gesell evaluations
every four weeks, while in the, present study they were
done at intervals of one or two calendar months.' However, the.
Kingston infants consistently attained each gross motor item earlier
than the normal Gesell infant. The language items were attained
at the same ages. After six months of age the examinations were
'done at twomonthly .intervals so that a certain.amount of. precocity
the Kingston infants,marb hidden. when coMpared with.four-weekly. .
schedules.-

TABLEXXX1V
‘lhe Percentage of Infants to Achieve the Milestones at each Examination Grouped by Birthweight
Milestones
Age at Examinations .
10 mths] 12 mths '6 wks. • 3 mths 4 mths ' 5 mths 6 mths 8 mths
I1 2 1 2 1 2 1 2 1 2 1 2 1 2 1 2 Momentary lift head 100 100
Head set forward.Bobs 72 *57 100 97 100 100
Head steady,set forward 16 * 3 81 +47 100 100
Head steady and erect 0 0 23 * 6 80 +48 100 100
Suspended prone,no lag 94 93 100 100
Pull to sit. No lag 3 0 20 * 6 64 *45 96 +80 100 100
Sit, lean on hands 1 0 31 *13 85 76 100 97 100 100
Stand with hands held 10 3 42 *24 90 +53 100 97 100 100
Sit steady & erect 10 min. 19 + 0 77 +31 100 94 100 100
Pull self to stand 4 0 33 + 9 90 +74 100 97 100 100
Repetitive syllables 2 0 37 47 90 +68 100 100
Creep 1 0 11 * 0 77 +48 99 94 100 100
Walk with aid 19 10 79 68 97 97
Stand alone 10 3 66 61 93 87
Walk 1 0 24 26 72 *55
2 words and Imamal,tdadal • 1 0 36 26 83 84
N°s•axamined 21 30 23 1 1
Column 1 = infants with birthweights above 2.5 kg;column 2 =infants with birthweights under 2.5 kg.
*Difference between the two groups of infants significant to less than 5 per cent
+Difference between the two groups of infants significant to less than 1 per cent

TABLE XXXV
104
Gross Motor and Language Developmental Items Achieved by
Majority of Infants with Birthweights Above 2.5 kg,
compared with Gesell Schedules
Supported sitting° Erects head momentarily Supported sitting. Head =set forward. Bobs Suspended prone. No head lag
A
6 4 12 8
Supported sitting. Head steady, set forward 13 16
Supported sitting. Head steady and erect 17+ 20 Pull to sit. No head lag 20
Sit for a moment. Lean on hands 21+ 28
Stand with hands held shoulder height 26 32 Sit steady and erect for 10 mins. 36
Pull self to stand at rail 40 Creep on hands and knees 34+ 40 Repetitive syllables, without meaning 36
Walk with only one hand held 43+ 52 Stand alone momentarily 56
Walk few stepsalone - .52 56 .2 words and /menial and 'Idadat 52
Column A m age in weeks when infants examined; column B = age in weeks when items achieved in Gesell schedules.
similar results for infants with birthweights
below 2.5 kg. In:-this table also, two items includedStanding and 68%
alone momentarily' a.nd 'Walks with aid' although only 61V(respectively)
of the infants hactachieVed them:at -the ages shown. All the :other
items were achieved by over 70% of the infants at the age specified.
The infants in this study attained each item at the same age as or
earlier than the normal child of the Gesell Schedules.
Therage of walking alone wasHihen. eXaMined4eParaidly.; (71rilythe.
216 infantS examined at each 8!-Month, 10-monthand'12-month visitAwere
jnclUded. As shown imjable XXXV11, neither_sex nor socio-economic
. group made any SignificantAifference to theage bf walking.
. • XXXV111, the infants are grouped into the(-t-op.or;bnifom 50th percentile
into Whibhjhey,fell to the age when they began te Walk. ,At both; the.
10-month and 12-month examinations it was suggestive that':more.i.'of the
heavier babies began to walk. When all the infants walking by 12 months
are examined, significantly more (to less than 5%) were in the upper
50th percentile.
DISCUSSION
however, We had more firstr.bOrn babies than the population in generalyWhen
the age of -11walking alone' was analysed by birth rank there was no
significant difference between the first born babies and the later
born ones.
This group of infants showed definite acceleration in gross motor
behaviour compared with the normal white child f the Gesell Schedules,
and were- at least equal in.language.behaViOur. Hindley et al (1966)
described'the median age' of walking from 'longitudinal studies in five
_different European p3untries .(Table'XXX1X). They used the same criteria
for walking as the present study, but recorded the actual age walking
began according to the mother's report. n- this study only the doctor's
Tabl •
106
TABLE XXXV1
Gross Motor and Language Developmental Items Achieved by
Majority of Infants with Birthweights 2.5 kg. and
Stand with hands held .shoulder height. Sit steady and erect for).0 mins. Pull self: to stand at rail Repetitive syllables: without meaning
32 36 4o 36
under compared with Gesell Schedules
Supported sitting. Erects head momentarily Suspended prone. No head lag
Supported sitting. Head set forward. Bobs 13 12
Supported sitting.. Head steady and set forward 17+ 16
Supported sitting. Head steady and erect' 20 Pullto sit. NO head:lag - 21+ 20 Sit, lean on hands 28
Creep on hands and knees 40 Walk with only one hand held
43+ 52 Stand alone momentarily 56
2 words and Imama and 'dada' 52 52
Column A = age in weeks when infants examined; column B = age in weeks when items achieved in Gesell schedules.

TABLE XXXV111
The Effect of Weight on the Age of Walking 216 Infants
Age when first
Walking at walked
12 months
0 mths ' 10 mths 12 mths
107
TABLEXXXV11
The Effect of Sex and Socio-economic Status on the
Age of Walking of 216 Infants
Group Age when first Not walking Total nose
walked at 12 mths of infants
8 mths. 10 mths.12 mths.
Male .. 20 50 32 104
Female 48 32 112
Upper Socio-economic group .. 10 .28 13
53
Lower socio-economic group 70 51 163
Weight in the upper 50th percentile. .. .32 56 88 Weight in the lower 50th percentile• .. 2 20 42 64
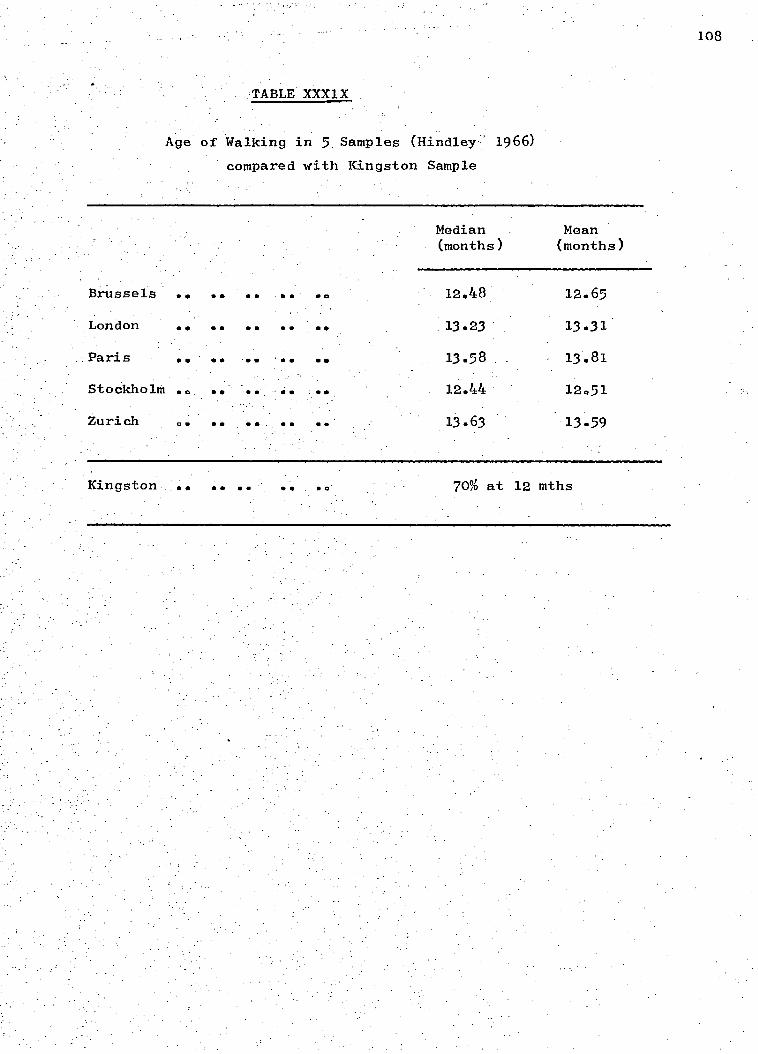
TABLE XXX1X
.. • • •
Median (months)
Mean (months)
12.48 12.65
.. •• 13.23 13.31
- OS 'OO 00 13.58 . 13.81
• .. 12.44 12.51
... 13.63 13.59
Brussels
London • • • •
Paris
Stockholm
Zurich ..
108
Age of Walking in 5 Samples (Hindley 1966)
compared with Kingston Sample
Kingston • • • • 70% at 12 mths

109 •
observations at two-monthly intervals up to 12 months of age were
recorded. Though it was not possible to give the median age in
this study, as the observations stopped at one year of age, it can
be seen from TableXXX1X that the Kingston infants walked earlier
than the infants from the other five countries.
In 1958 Knobloch and Pasamanick reported a study in which the
gross motor behaviour of both white and Negro Baltimore infants was
accelerated over the normal white child on the Gesell Schedules. They
suggested more permissive_child rearing or general improvement in
health as possible causes.
Williams and Scott (1953) investigated the methods of handling
105 Negro babies from Washington, D.C. They found the lower socio-
economic group showed significant gross motor acceleration compared
with the upper socio-economic group, and also child-rearing practices
permissive among the lower socio-economic group..
No systematic enquiry was done into child-rearing practices in
present study. However, the large number of children sleeping
their mothers and feeding on demand, and the lack of physical
restrictions such as cribs and playpens, gave the impression of great
permissiveness in handling children of this age. Unlike the Williams
and Scott (1953) study the socio-economic group made no difference
to the age of walking in this study which is in agreement with Hindley
al. (1966) however '-the difference between the - upper and lower.
gronps in our own study was not, great.- Graffar and Corbier (1966)
also found socio-economic class made no' difference to the level of
develcipment in -infants from fiVe European countries, until' after one
year of age.
Cravioto (1966) reviewed the literature describing the effects

of nutritional deprivation on psychobiological development. H
a highly significant correlation between weight
and motor and adaptive scores i
from five different communities
He also sUggested there. was a concurrent deCeleration
growth in pre-school children.
• • • :In•this:present Studyi 'signifiCantly:MtireOf:-the heaVier children
were walking..bY twelve months than. the lighter ones. Peatman
Higgens (1942) found weight made no difference to the age of walking.
subjects in their study were North American children reared under
conditions and, as-.1 is unlikely that even
malnourished
probably reflected genetic tendencies.
the variations in weights
mean weights were poor and the diet far from adequate. The weights.
therefore were more likely, to reflect the nutritional state of the
child, rather than genetic inheritance.
14% of the children in this study had birth weights below
2.5 kg (516 lb.) a well-established cause
(Drillien 1961, Eaves
of -slow motor development
et. al.'1970). The attainments of the infants
with birthweights below 2.5 kg were significantly slower than those
of the remaining infants in eleven of the items observed. However,
the low birthweight infants were at least as good as the normal child ' • ,
of the Gesell Schedules. jhese , reSults would agree with the report
Of Vincent and HUgOn (1962) from Leopoldville, which stated that
16W birthweight.',African infants were:more'mature in the..Developmental
processes than European infants of the Same 'Weight.
Evidence concerning the effect of, race, on the motor development
of infants is controversial: Knobloch and Pasamanick (1958), in contrast
to their earlier findings (1946-1953) found race made no difference,
while Bayley (1965) found Negro infants scored higher than white
advanced - state'.of development that newborn:Negro infants are in a more
of gross motor and language development behaviour
than European infants (Gerber and Dean 1957) Vincent and Hugon 1962.
It is impossible to say if the acceleration which we found in this
present study was due to environmental or racial factors, as there
was no white control group.
SUMMARY
Some items
The effect of environment and race on development is discussed.
infants in motor development. Studies in the neonatal period show
_Were evaluated throUghout the year. They were found' to be atcelerated
over the normal white child of the Gesell DeVelOpMental-Schedules.
-Children of low'birthweight were•Significantly SloWer'•thari.the
remaining children in. attaining several items b •
the normal white child of the GeSell SCheduldS. Sex and Socio
economic class made, no difference to the age of walking, although
high weight at 12 months h d a beneficial effect.
111
112
CHAPTER XI
Factors associated with Malnutrition
In the hope of assisting personnel working in the field of child
health and nutrition in Jamaica, an attempt was made to further identify
those' children who were at risk of suffering from malnutrition. Though
only one child was severely malnourished, many more were moderately
or mildly malnourished. The second 6 months were the most critical
ones from a nutritional stand point and the incidence of malnutrition
rose up to 12 months of age.
The records of all the children who were in the tenth percentile
for weight by 12 months of age were examined in detail,, t determine
when they first showed signs of being undei-'Weight.and.whether-there
were any.factOrs in their social backgrounds the type of care they
received or their pattern of health which were particularly associated
with malnutrition. The following factors , which were considered to
possible precursors of malnutrition were examined::.
(1) Civil status 'of mother IChapter III)
(2) Bitth order of child
(3) Standard of housing 11"
(4) Maternal competency
(5) Attacks of gastroenteritis " 1V
(6) Attendance at the clini
(7) Milk intake viii )
All the factors except "clinic attendance' have been discussed
previously in the chapters indicated. In order assess "clinic
attendance" only the visits each child made to the clinic for their . ,_•
regular appointments were counted. Additional visits made at other
113
times due to sickness were excluded. Good attendance was defined as
keeping at least 8 out of 9 possible appointments, fair attendance
as keeping at least.6 and poor attendance as 5 or less,
Results
Weight Records: The weight records of the 28 children in the 10th
percentile at 12 months, of age showed that 3% had birthweights in the
10th percentile, had birthweights between the 10th and the 50th;
while only '% had birthweights above the 50th percentile. By 6 months
age none of the children had weights above the 40th percentile and
15 (54%) were already in the 10th percentile.
Factors affecting Weight
The associations between the factors examined and the children
in the 10th percentile for weight at 12 months are shown in Table XL.
Civil. Status: The civil status of the mother made no, significant
difference to the weight of the children. However, those born to
mothers living in common-law unions had a slightly greater tendency
to be small at 1 year of age than those born to married or single
mothers.
Birth Order:
The birth order of the children was significantly
associated with their chances of being small by 12 months of age
(p is less than 0.05). The children 'of birth rank 6 or more were,
more likely to have low weight than the children of birth rank
'2 to 51.and first borns were in an intermediate position.
Standard of Housing: More children living in houses of a poor standard
were small at.12 months than those living in above average or average
hOuses. (p is less than 0.05).
Maternal Competency: Children of mothers who were classified as
incompetent or poor were more likely td. be small at 12 months than
'children with adequate.mOthers (p -isr.less than 0.01).
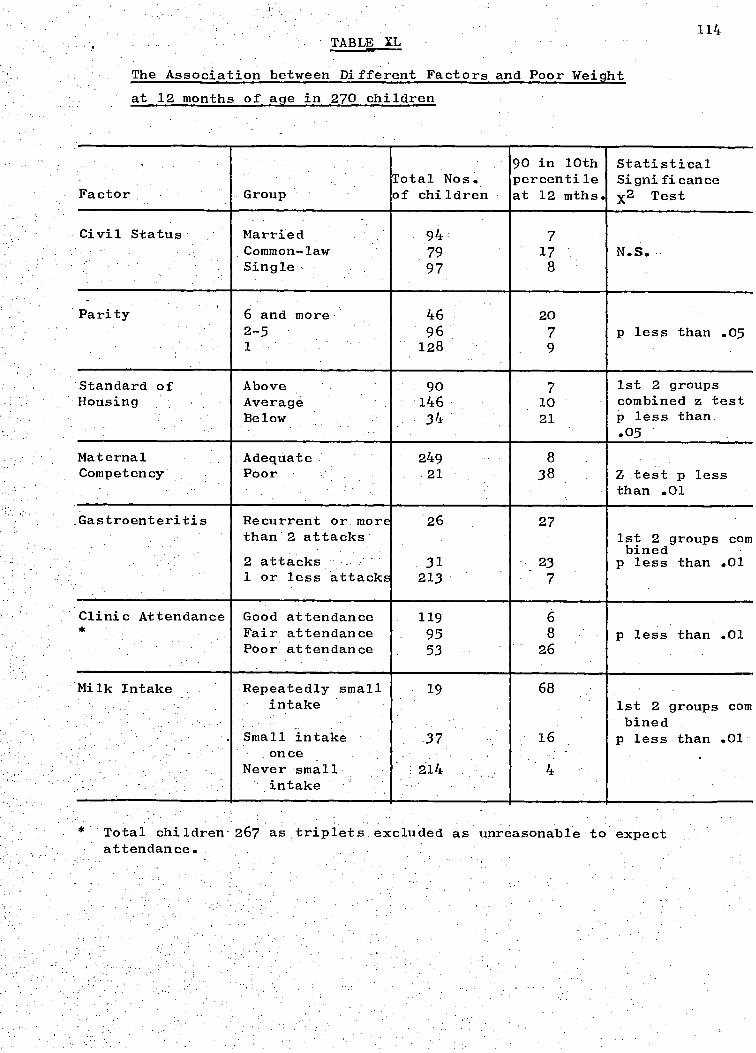
*. Total children- 267 as triplets excluded as unreasonable to expect attendance..
114 TABLE XL
The Association between Different Factors and Poor Weight
at 12 months of age in 270 children
.
Factor . Group Total Nos. of children
90 in 10th percentile at 12 mths.
Statistical Significance x2 Test
Civil Status Married 94 7 Common-law 79 17 N.S. Single , 97 8
Parity 6 and more 46 20 2-5 96 7 p less than .05 1 128 9 .
Standard of Above 90 7 1st 2 groups Housing Average 146 10 combined z test
Below 34 21 p less than .05
Maternal Adequate 249 8 Competency Poor 21 38 Z test p less
than .01
Gastroenteritis Recurrent or more' than , 2 attacks
26 27 1st 2 groups com bined
2 attacks 31 23 p less than .01 1 or less attacks 213 7
Clinic Attendance Good attendance 119 6 * Fair attendance 95 8 p less than .01
Poor attendance 53 26
Milk Intake Repeatedly small intake
19 68 1st 2 groups com bined
Small intake once
37 16 p less than .01 .
Never small intake
214 4
115
Attacks of Gastroenteritis: There was asignificant association between
the number of attacks of gastroenteritis during the year and the tendency
to be in the 10th percentile for weight at 1 year (p is less than 0.01).
Those who had more than 2 attacks were the most likely to be under weight.
Clinic Attendance: There was a significant association between the
frequency of clinic attendance and the number of children in the 10th
percentile. Poor attenders were more likely to be under weight than
fair attenders, while good attenders were the least likely.(p is less
than 0.01).
Milk Intake:• There was a highly significant association between small
or no milk intake and being in the 10th percentile at 1 year (p is
less than 0.01).0f the children who were recorded as having a poor
milk intake on more than 1 occasion,. 68% were in the 10th percentile
by 12 months.
Discussion
There is as yet no truly satisfactory measure of malnutrition
and it was realised that the criterion used in this chapter to define
children at risk of malnutrition had limitations both in specificity
and sensitivity. A few children were probably included who had a low
genetic potential for growth or who had very small birthweights and
were growing satisfactorily. Conversely a few children may have been
excluded who were suffering from some degree of malnutrition. However
the criterion used was considered of some use as most of the children
who had caused clinical concern during the year were included in the
group.
A high proportion of small birthweight babies might well be
expected to be in the 10th percentile by 12 months of age. However
Levin (1959) and Thompson (1956) have shown that small birthweight
babies grow faster in the first year of life than heavier born babies.

270 249 100%
Children of Poor Mothe.rs
8 38%.
5 24%.
8 38%
Children of Adequate Mothers
11 4%
32 -13%
206 83%
-
Milk Intake
Repeatedly poor milk intake
Small milk intake once
Never small milk intake
Total
Total
19
37
1 , 214
270:
116
TABLE XL1
Azsociatiqn between Poor MaternalCoMpetenCY:.. H-•
and the number of children on PoorMilk Intake.
TABLE XL11
Association between Poor Maternal competency and
Repeated attacks of gastroenteritis
Gastroenteritis Children of Poor Mothers
Children of Adequate Mothers Total
2:or more attacks:
2:attacks
or lesa attack
Total
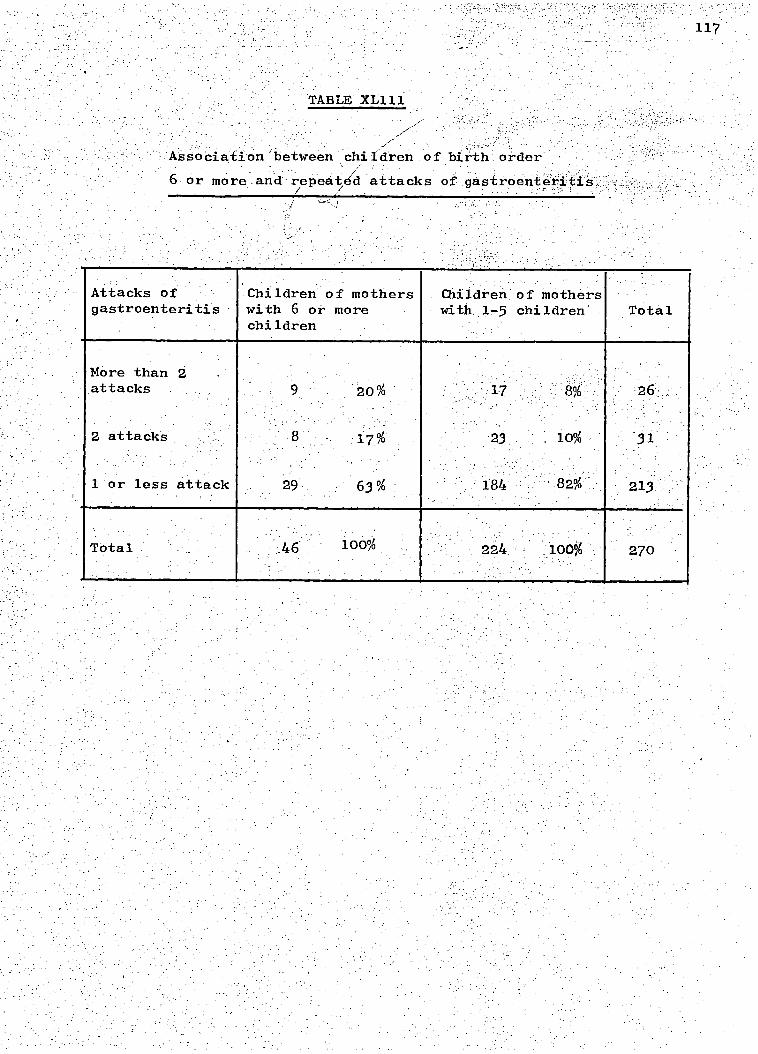
ASSoCiationAjetWeen children of birth : order
6 or more_and:repeated'attacks of gastrOenteriti
100% .46 270
63 % 29
Attacks of gastroenteritis
Children of mothers with 6 or more children
Children of mothers with 1-5 children Total
More than 2 attacks
1 or less attack
Total
118
An analysis of the data in this study showed no such tendency (Chapter V).
Birch and Gussow (1970) report-that the development of small birthweight
children is much worse in those from lower socio-economic families than
those from higher socio-economic levels. It is .possible that small
birthweight in children from lower socio-economic backgrounds in an
..Under-developed country is'an even greater disadvantage.'
Sudden and unexpected deterioration in a child's weight was not
a common occurrence in this study. The usual picture was rather one
of continual poor growth often with frequent infections none of the
children who were small at 12 months had been above the 40th percentile
at " 6 months of age.
The factors found to be, associated with low weight at 12 months
age were often inter-related and probablyinter-dependent.
example, children receiving poor maternal care suffered in many different
ways; they were more likely to be living in housing of a poor standard
than children receiving adequate care (Chapter III). They were more
likely to have repeated attacks of gastroenteritis (Table XL1‘p is
less than 0.01) and they were more likely to be on a poor milk intake
(Table XL11 p is less than 0.01). They were also more likely to be
of birth order 6 or more (Chapter III).
Similarly children of birth order 6 or more were more likely
o receive poor maternal care than children of a lower birth order
they were more likely to have repeated attacks of gastroenteritis
(Table XL111 p is less than 0.01) and be in the 10th percentile
for; weight at 1 year of age. Further associations between other
factors almost certainly existed.
Table XL1V shows how frequently several of the factors
associated with low weight were found to be operating in the same
child. A scoring system was devised whereby each factor which was

Weight at 12 mths. in lbs.
LowBirth-weight
Insufficient Milk Intake
Gastroenteritis 2 or more attacks
Poor Maternal Competency
Poor Clinic Attendance
6 or more children
Poor Homes Score
5 6 5 6. 5 2 3 5 4 1 1 1 2 5 4 3 0 2 5 2 1 1 1 0 4 3 2 1
13.4,
14.0 14.5 14.5 14.8 15.3 15.5 15.8 15.8 16.0 16.0 16.0 16.1 16.3 16.3. 16.4 16.5 16.6 16.6 16.6 16.6 16.7 17.1 17.4 17.4 17.4 17.4
TABLE XL1V
factors associated with weight in the 10th percentile at 12 months of age in every child
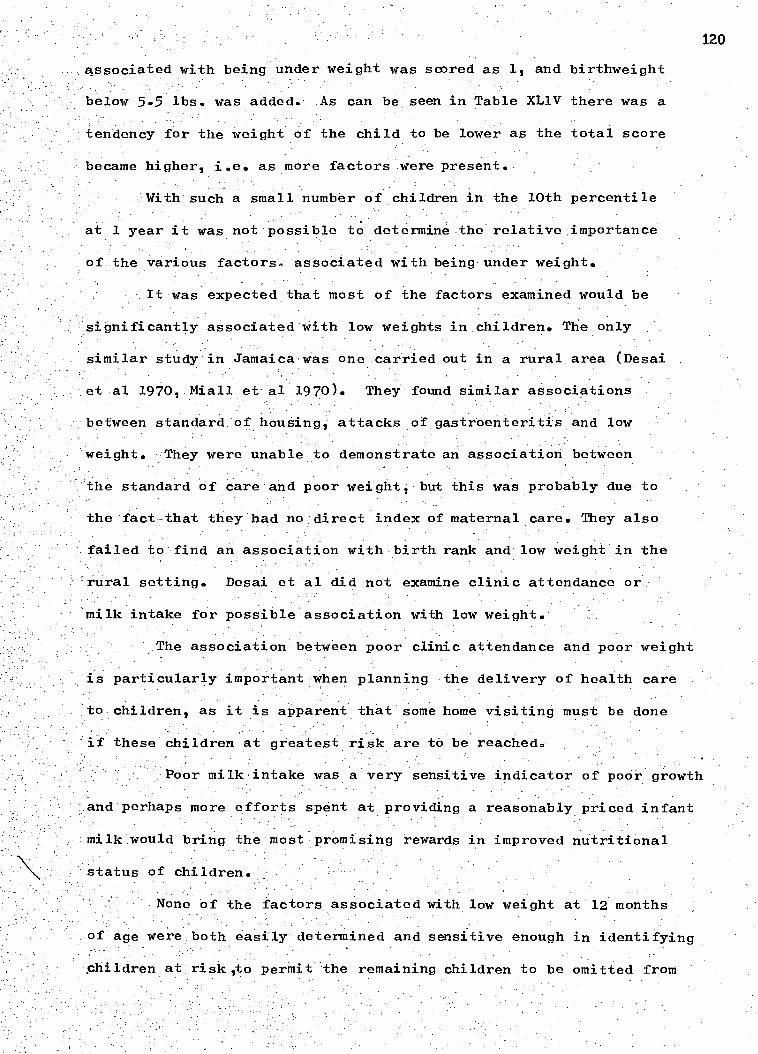
120
.associated with being underweight was scored as 1, and birthweight
below 5.5 lbs. was added. As can be seen in Table XL1V there was .a
tendency for the weight of the child to be lower as the total score
became higher i .e. as more factors were present.
With such a small number of children in the 10th percentile
at 1 year it was not possible to determine the relative importance
of the various factors associated with being under weight.
It was expected that most of the factors examined would be
significantly associated with low weights in, children. The only
similar study in Jamaica was one carried out in a rural area (Desai
et al 1970, Miall et al 1970). They found similar associations
between standard of housing attacks of gastroenteritis and low
weight. They were unable to demonstrate an association between
the standard of care and poor weight, but this was probably due to
the fact that they had no direct index of maternal care. They also
failed to find an association with birth rank and low weight in the
'rural setting. Desai et al did not examine clinic attendance or
milk intake for possible association with low weight.
The association between poor clinic attendance and poor weight
is particularly important when planning the delivery of health care
to children, as it is apparent that some home visiting must be done
if these children at greatest risk are to be reached.
Poor milk intake was a very sensitive indicator of poor growth
and perhaps more efforts spent at providing a reasonably priced infant
milk would bring the most promising rewards in improved nutritional
status of children.
None of the factors associated with low weight at 12 months
of age were both easily determined and sensitive enough in identifying
children at risk,to permit the remaining children to be omitted from
orders poor standard of housing, incompetent mothers,repeated High birth
121
nutritional supervision,, but the list gives , some indication as to which
children need the most help.
Summary
records of the children at risk of malnutrition were examined
o determine if they differed in-their health care or social background
from the remaining children.
Small birthweight children unlike those in other studies did not
grow faster than the others and tended to remain in the 10th percentile.
attacks of gastroenteritis, poor clinic attendance and poor milk intake
were all significantly associated with being under weight at 12 months
of age. These factors tended to be inter-related and often several
were present in the same child. The more factors present, the smaller
The
the child tended to b
122
Chapter XII
Family Planning
As -anticipated at the .berginning of the study , itivaSehOWn::that',
Children of birthr order 6 or more were disadvantaged .in several ways
(Chapter X1),.eo that a reduction of the number of large families might
well help to eliminate some of the worst standards f child care.
The attitude of the mothers to the use of family planning during
the first year after delivery; and their response to repeated encouragement
to use contraceptives is reported in this chapter.
Results
By the end f the year complete information was available for 224
mothers, as it was not possible to interview 38
were working and could not be interviewed although their infants were
examined..
When the infants were 6 weeks or 3 months old 224, (90.4%) 248
mothers asked, said that they had been told about family planning at
University Hospital. 217 (871,5%) of the mothers said they wished to
use contraceptives and the majority, 137 (55.2%), preferred oral
contraceptives (Table XLV). Only 31 (12.5%) of the mothers Eiaid they
would never use contraceptives under any circumstances.
The use of contraceptives was known for 224 women immediately
before the next pregnancy or 12 months after delivery. Table XLV1
shows the time after delivery these women began use contraceptives.
At every visit throughout the year some women began to use contraceptives
for the first time. The number who began using contraceptives later
in the year might well have been influenced by repeated advice and
persuasion.
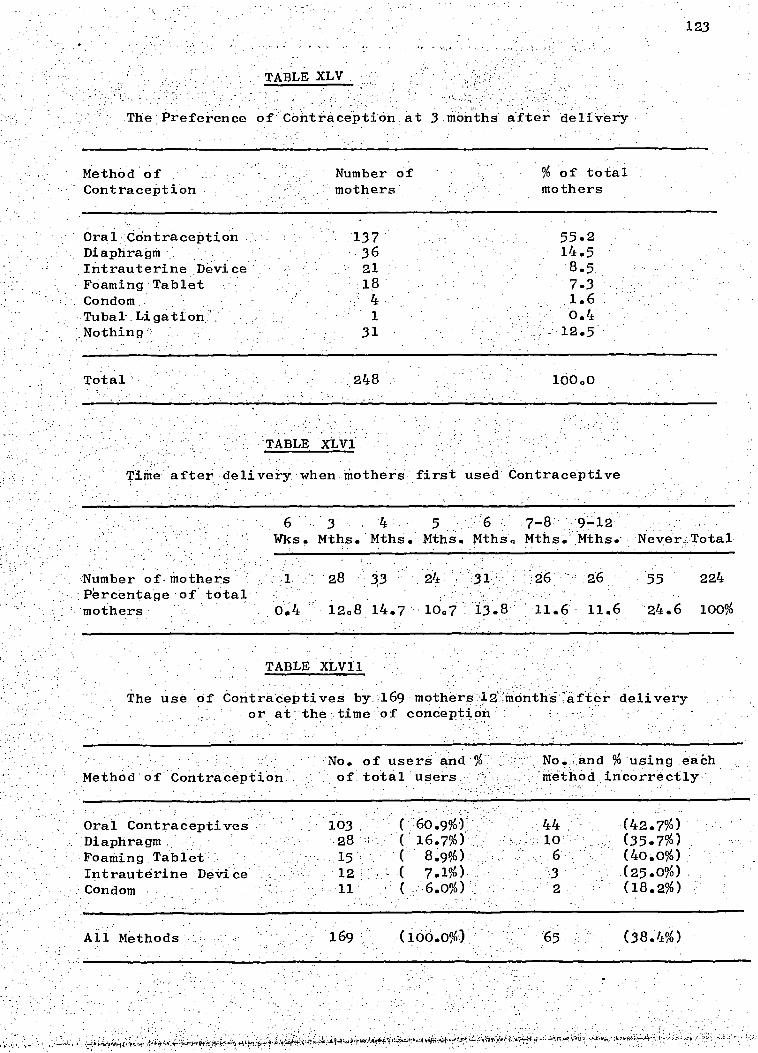
Method of Number of
% of total Contraception mothers mothers
Oral Contraception 137 Diaphragm 36 Intrauterine Device 21 Foaming Tablet 18 Condom 4 Tubak Ligation 1 Nothing 31
55.2 14.5 8.5 7.3 1.6 0.4
Total 248
100.0
123
TABLE XLV .
The Preference of Contraception at 3 months after delivery
TABLE XLV1
Time after delivery when mothers first used Contraceptive
6 3 4 5 6 7-8 9-12 Wks. Mths. Mths. Mths. Mths. Mths. Mths. Neverr.Total
Number of, mothers 1 28 33 26 55 224 Percentage of total mothers 0.4 12.8 14.7 10.7 13.8 11.6 11.6 24.6 100%
TABLE XLV11
The use of ContraceptiveS by .169 mothers .12 inonthi .after delivery or at the . time of conception
Method of Contraception No. of users and % of total users
No. and % using each method incorrectly
Oral Contraceptives . 103 ( 60.9%) 44 (42.7%) Diaphragm 28 I ( 16.7%) 10 (35.7%) Foaming Tablet.- .15. (' 8.9%) 6 (40.0%) Intrauterine Device 12 - ( 7.1%), '3 (25.0%) Condom 11 ( , 6.0%) 2 (18.2%)
Ail Methods 169 •(100.0%) 65 (38.4%)
■71

devices, 3 used foaming tablets and one each had used spermicidal jelly,
a diaphragm and oral contraceptives.
be of value in demonstrating the attitudes to
and the•use of contraceptives in a group of mothers who:were given
124
169 (75.4%) of the 224 women used contraceptives at some time
during the year. Table XLV11 shows the type of contraceptives and
whether they used them correctly. 55 (24.6%) of the women never
used contraceptives, and the reasons they gave for not using them are
listed in Table XLV111. The largest group (14 women) were not having
sexual relations. The "fear" group (7 subjects) included those who,
said they - were afraid of family planning or that it had harmed a
friend or relative. The difficulties at family planning clinics
given as a reasons by a group of 6 women included lack of contraceptive
supplies, waiting too long for their turn, not being able to afford
and not knowing the times when the clinic was open. The miscellaneous
group contained 2 women who said they never got around, to itt.
of,the.224 women were aware they were pregnant
again before the end of the year. The estimated date of conception
after the previous delivery is shown in. Table XL1X. Only one of the
53 women said that she had wanted another pregnancy so soon. 27 had
actually used contraceptives at sometime during the year but on
questioning it became apparent that 19 of them had not been using
them correctly. Of the 8 mothers who became pregnant despite having
appeared to have used contraceptives correctly, 2 had intra-uterine
repeated personal encouragement to use family planning. Of the 261
women at the start of the survey information was available for
224 (85.8%). The lack of information of 37 (14.2%) of subjects was
unlikely to affect the conclusions ioany great extent.
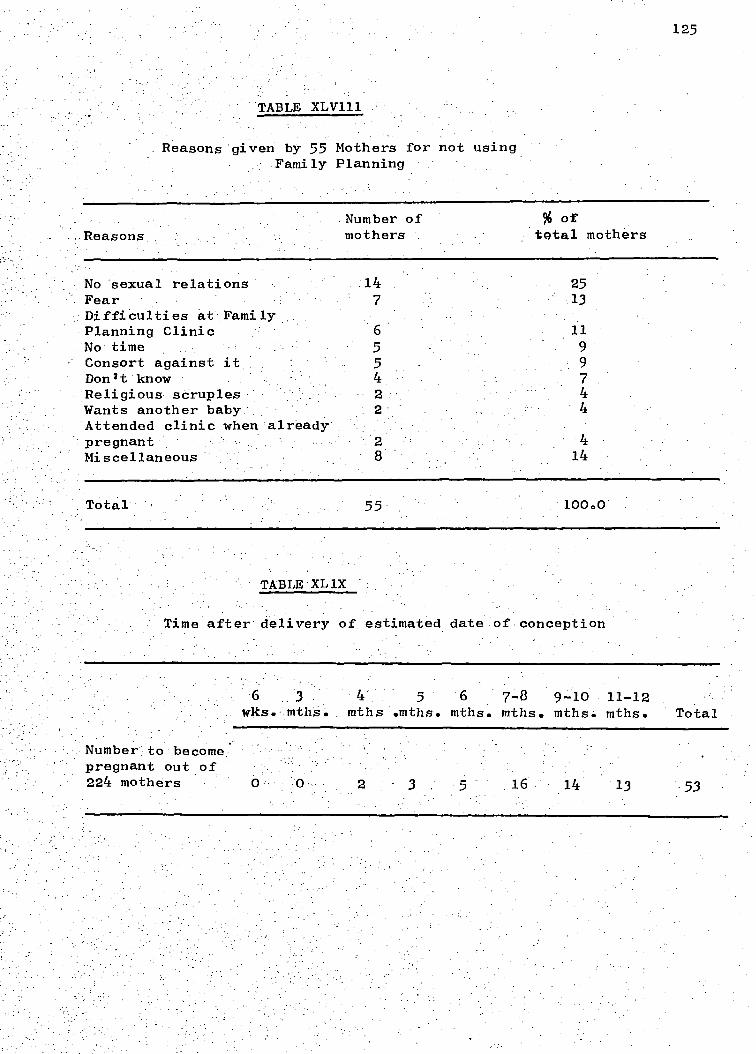
Reasons given by 55 Mothers for not using Family Planning
125
...Reasons .Number of mothers
% of total mothers
No sexual relations 14 25 Fear 7 13 Difficulties at Family Planning Clinic 6 11 No time 5 9 Consort against it 5 9 Donit know 4 7 Religious scruples 2 4 Wants another baby 4 Attended clinic when already pregnant 2 4 Miscellaneous 8 14
Total 55 100.0
TABLE'XL1X
Time after delivery of estimated date of conception
6 3 4 5 6 7-8 9-10 11-12
wks. mths. mths .mths. mths. mths. mths. mths. Total
Number': to become. pregnant out of 224 mothers 16 14 13 .53

126 Most of the mothers accepted the idea of family planning and
expressed a desire to space their children. Repeated encouragement
to use family planning appeared reasonably successful in-as much as
75.4% of the women used contraceptives at some time during the year.
This figure compared favourably with that found in other studies
( Smith 1968, J.F.P.A. Annual Report 1969). However, this study
was not successful preventing a number of unplanned pregnancies.
53 women (28.6%) became pregnant and only one said that she had
wanted another baby so soon.
One reason for the pregnancies was that many women failed to use
contraceptives correctly because about half the pregnancies (27)
occurred in women who said they were using contraceptives. The
'incorrect use of oral contraceptives in particular was a constant
`problem and by the end of the year 44 women were still using them
incorrectly. Many of the women had difficulty in either reading or
understanding the instructions on the packets and they often forgot
the verbal instructions given at the clinic. It was necessary to
check the use of oral contraceptives carefully at every visit.
Problems at the family planning"clinics often made it inconvenient
for the women to use contraceptives regularly. These problems •
included having to wait a long time, not being able to afford the
cost and finding supplies had run out. Working women and women
with large familles found it particularly difficult to find time
visit the clinics. About half the pregnancies (26) occurred
in women who had never used contraceptives. In the group of 55
women who did not use contraceptives, 14 had.no sexual relations;
of the remaining women, 63% became pregnant.
The reasons for not using contraceptives were very varied,
but it was interesting that few women objected to family planning

pregnant despite using contraceptives, mostly because of incorrect use.
127
,on principle.
contraceptives, many of their attempts at using
n spite of the mothers' expressed desire to use
them appeared to be
half-hearted, and the strength of their motivation must be questioned.
For example, many women frequently "forgot" to get new supplies of
contraceptives and "forgot" to take oral contraceptives regularly.
Abstract
The attitude of 224 mothers to family planning and their response
to repeated personal encouragement to use contraceptives was observed.
Most women said they favoured family planning and 75.4% used
contraceptives at some time during the year. Oral contraceptives were
preferred. 53 women were known to be pregnant before the end of the
year although only one pregnancy was desired so soon. 27 women became
Zn this community, attitudes towards family planning are
favourable but much effort is needed to encourage women and to instruct
them in the correct use of contraceptives well as improving the
available services.
These kingston infants were found to be advanced
behaviour compared with North American children.
confirmed by Hawke who carried out developmental assessments
of the children at 12 months of age (Appendix I).
The standard of health and nutrition deneral
particular the weights after 6 months of age tended to be lowl and
there was :a high morbidity rate and a high incidence of iron deficiency
anaemia. This poor level of health was intimately related to, the
children's social and economic backgrounds. Urbanisation has
new problems which threaten to further" aggravate the situation.
These iriclUde the decline of breast feeding and the ready susceptibility
of the mothers to advertising which results in their purchasing
unnecessarily expensive infant milk and foods.. Also the general lack
of hygiene and overcrowding found in most of the homes were probably
responsible for the high prevalence of gastroenteritis. Table L
illustrates the various factors found to be associated with malnutrition
and gastroenteritis and emphasises the complexity of the problem.
It is evident from this table that there is no one panacea to the
problem, b t rather many different attacks are needed covering 'a wide
Recommendations •
: Though the multifaceted nature of poor :infant ihealth,necesSitates
long range plEtnning to improve the general standard of living, it does
not negate the need to begin certain programmes immediately. This study
has indicated some of the areas•where urgent
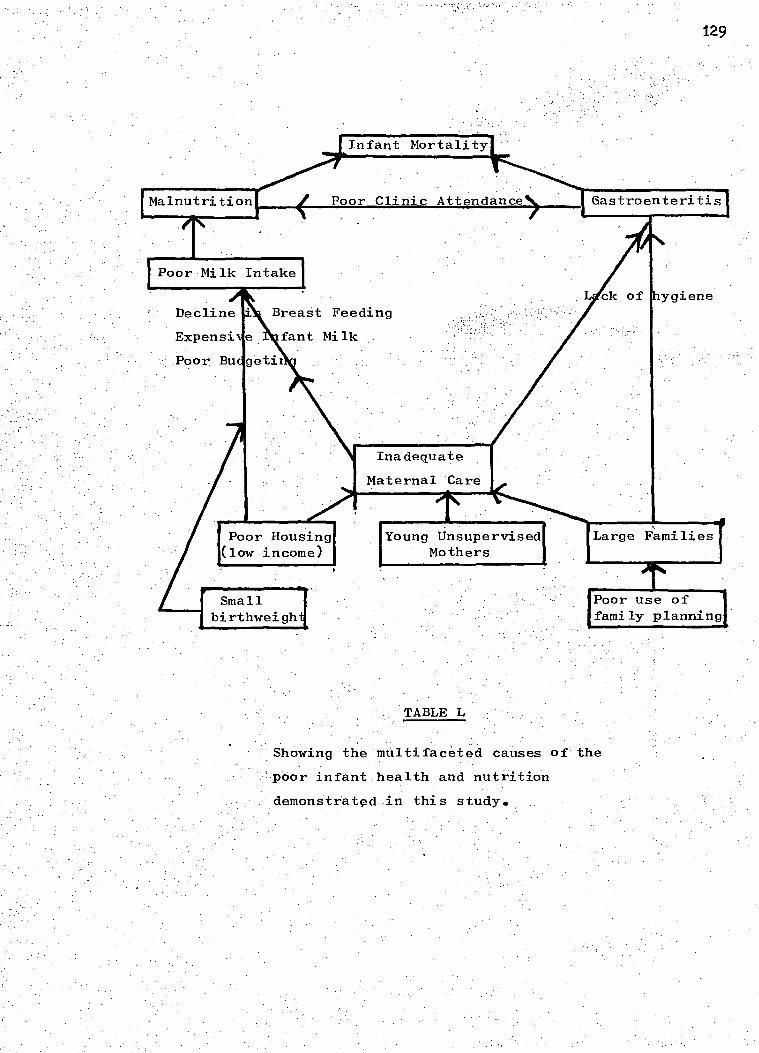
129
Malnutrition Poor Clinic Attendance
Poor Milk Intake
hygiene
Inadequate
Maternal 'Care
I.
Small birthweigh
Poor use of family planning
Young Unsupervised Mothers
Large Families
Showing the mUltifaceted causes of the
'poor infant,health and nutrition
demonstrated in this study..
(5) Improve and establish more day .care facilities
for children of working mothers.
did a follow up study of 80 children also born at the University Hospital.
found that breast feedinghad continued to:decline, the number of She
of infant milk - attacks of gastroenteritis had increased and the cost
had risen sharply. Hawke continued to do yearly developmental assess--
ments on the samegroup.of children hetested at 12 months of age
.scores
infant
(Appendix I) and found a gradual decline in
3 years (personal communication).
Future Research
As Jamaica h s limited resource's, most future research into
which are carefully evaluated. This study- has provided base
(6) Improve family planning facilities.
Further Relevant Research
Since the results of this survey were first known Landman (1974)
health and nutrition should perhaps take the form
programmes
of, intervention
lines for Kingston infants amd could be used changes in their
future welfare.
The field of child development which now poses the mOst.gUestioris
is that:Of emotionall socialYand cOgnitive development. How' the unstable
Provide and promote an economically packaged
infant milk at a reasonable price.
Restrict commercial advertising of expensive
infant milk and foods.
Provide a home visiting health service for
the non-clinic attenders.
Promote parent education and school. education
programmes.: on hygiene, child care, nutrition,
budgeting and family planning.. •
130

131 environment, with poor community development, working mothers, boarding
out of children, and frequent removals and a relative absence of toys
and books affects the children is largely unknown.
Hawkes findings (above) and those of Grant (Appendix 1) suggest
that the mental development of Jamaican children from lower socio-
economic backgrounds is gradually depressed between 1 and 4 years
of age. Further investigations into this possibility and into the
role played by malnutrition are indicated.
Grantham-McGregor, S. M. and Back, E.H. (1971).
Developmental Medicine and Child Neurology,
13 79.
Grantham-McGredor, S. M. and Back E.H. (1972).
West Indian Medical Journal, 21, 249.
Grantham-McGregor, S. M., Desai, P. and Back (1972).
Human Biology, 44 549.
Grantham-McGregor, S. M. and Desai, P. (1973).
Developmental Medicine and Child Neurology,15, 441.
Grantham-McGregor, S. M., Desai, P. and Milner,P.F.
(1974). Archives of Disease in Childhood 49.
Grantham-McGregor, S. M., and Hawke, W.A. (1971)
Developmental Medicine and Child Neurology,13, 582.
REFERENCES
Excerpts of this thesis have already been published :-
Grantham-McGregor, S. M. and Back, E.H. (1970a).
Archives of Disease in Childhood, 45, 404.
Grantham-McGregor, S. M. and Back, E.H. (1970b)
West Indian Medical Journal, 19, 111.
132
133
,GENERAL REFERENCES
Andelman, M.B., and Sered, B.R. (1966). American Journal of Diseases of Children, 111, 45.
Annual Abstract of Statistics (1968). Department of Statistics, Jamaica.
Antrobus, A.C.K. (1970). Journal of. Tropical Pediatrics and Environmental Child Health, 17, 188.
Ashcroft, M.T. and H.G. Lovell (1964). Tropical Geographical Medicine, 41 346.
Ashcroft, M.T.1 Buchan, I.C., Lovell, H.G. and Welsh, B. (1966a).American Journal Clinical Nutrition 19, 37.
Ashcroft, M.T.1 Heneage, P. and Lovell, H.G. (1966b). American Journal Physical Anthropology 24, 35.
Ashcroft, M.T.1 Bell, R., Nicholson C.C. and Pemlerton, S. (1968a). Transactions of the Royal Society of Tropical Medicine and Hygiene263 811.
Ashcroft ,; M.T., Bell, R. and. Nicholson, C.C. (1968-0. Tropical Geographical Medicine 20, 159.
Ashcroft, M.T., Milner, P.F. and Wood,C.W. (1969). Transactions of the Royal Society of Tropical Medicine and Hygiene, 63, 811.
Ashworth, A. (1968) Sep de Archivos Latino Americanos de Nutricion, 19 No. 2
Ashworth, A. Milner, P.F.1 Waterlow J.C.1 and Walker, R.B.,British Journal of Nutrition 29, 269.
Back E.H. (1960). Quarterly Review of Pediatrics1- 15, 224.
(1961). West Indian Medical Journal 10, 28.
(1969). "Pediatric. Patterns in Jamaica . In Report of a Macy Conference, Santiago.
Bainton, D.F., and Finch C.A. (1964). American Journal of Medicine,37,62. Barron, S.L. and Vessey, M.P. (1966). British Journal of Preventive and Social Medicine, 20, 127.
Bayley, . (1965). Child Development 36,379.
Beal, V.A. Meyers, and'McCammon,R.W. (1962). Pediatrics,30, 518.
: Bealei Bostrom J.O. and Taylor (1961). Journal of Clinical Pathologyi. 14,.488.
134
!Beale, R.N., Bostrom, J.O. and Taylor, R.F. (1962). Journal of Clinical Pathology, 151:156.-
.Beresford, C.H. .Neale R.J. and Brooks '0.G. (1971).Lancet 1;'568.
Birch, H.G; and Gussow, J.D. (1970). "Disadvantaged Children: Health, Nutrition and School Failure". Harcourt, Brace and World with Grune and Stratton.
Birren, J.E., Hess R. D. (1968) Perspectives an Human Deprivation. U.S. Dept. of. Health, Education, and Welfare._
Blake, J. (1961) "Family Structure in Jamaican New York: Free Press of Glencoe, Inc.
Booker, C. R., Scott, R.B. and Ferguson, A.D. (1964). Clinical Pediatrics, 32 111.
British Medical Journal (1973). 437.
Brown, R. E. (1966). Developmental Medicine and Child Neurology, 512.
Burman, D. (1972). Archives of Disease in Childhood, 47,:261.
Chandra, R.K., Pawa, and Ghai - 0.P. (1968).. British Medical Journal,_4, 611..
Clarke,-E. (1957) "My Mother. who. Fathered me". London. Allen and Unwin.
Committee on Nutrition (1969). Pediatrics 43, 134.
Cravioto, J. (1966) /Nutritional deprivation in psychobiological development studies in man'. In Proceedings of the Special Session held during the 10th Meeting of the P.A.H.O. Advisory Committee on Medical Research 1965, Publication No. 134.
Cravioto, DeLicardie, E.R. (1971). Nutrition Reviews 29, 107.
Crump, E. P., Horton, C.P. Masuoka A.J. and Ryan D. (1957)., Journal of Pediatrics, 511 678.
Curtis, M. W., Marshall, F.B.1 Steggerda Comparative Psychology, 20, 125. ..
Dean, R.F.A. (1951). Medical Research Council. Special Report. Series.. 275, 346.
Douglas J.W.B. (1950). Journal of Obstetrics and Gynaceology of the British Empire, 57, 335.
Drillien, C. M. (1961). Archives of. Disease of Childhood, 36, 233.
Falkner, F. (1962). Pediatrics, 29, 467.
Falkner, Pernot (1958). Courrier. 8
Fox, H. C., Campbell, V.S., and Morris,- J.C. (1968). Bulletin of the S.R.C. Jamaica, 18, 33.

Gatherer, A. and Wood, N. (1966). Monthly Bulletin,Offthe Mini'Stry of Health and:. Pub1iC Health Laboratory Seryice,25,.J26.
Geber, . Dean R.F.A. (1957a) Lancet,
(1957b) Pediatrics,
Gomez, F., Ramos-Galvan, R. Frenk,'S., Cravioto, J.M., Vazquez, J. (1956. Journal of. Tropical Pediatrics, 2,
Graffar, M. Corbier, J. (1966). Courrier, 14 .
135
Grant
•
(1970). Institute of Education. University of the West Indies.
Gray, . . (1971). West . Indian Medical Journal, 2046.0.
Hill L. I> F. (1955). American Journal of Clinical NutritiOn 75.
Hindley, C. B., Filliozat -A.M.,)(lackenberg,-f i-coletMeister, Sand, E.A. (1966). Human Biology 381.364.
'HOwell, D. A...(1976). 'Iron Nutrition inInfancy,' p.24. RePort of the 62nd Ross Conference on Pediatric. Research.Columbus,ROssLaboratories.-
Hunterl - R..E. (1970)..Iron,'Nutrition in:Infancy.18. Report.. Of the 62nd Ross COnference on'Pediatric Research. Columbus,Ross Laboratories.
James
▪
T. (1968). Laneet. 1, 333.
jamaiCa Family Planning AssociatiOn (1969)"
▪
Annual..; nnnal Report.
Jelliffe .D.B., and Williams, L.L..(1954). Journal Of Tropical ,Medicine and. Hygiene. ,, 57;,27. .
-Bras G. and Stuart, K.L.(1954). West:Indian: Medical.:Journal 43.
Kasius, R.V., Randa14'A..,:TompkinS,,W. ifiehli (1957).-.Millbank MeMoriarFund QUarter1352.:323.
Kerr.(1963) "Personality and confliCt inHJadalcat London Collins.
Knobloch, ii,4Pasamanick,B.(1953).Journal Of Genetic PsychOlOgy.03 '137.
(1958). Psychiatry Research '10, 123'.
Sherard,E.S. (1966) Pediatrics 38,(Suppl.)1095.
Rider, Re, Harper, P., Pasamanick,B. (1950). Journal of the American Medical Association 161, 581.
Kripke, S.S. and Sanders, E. (1970). American Journal of Clinica Nutrition, 23, 716.
_LanCet (1970) Leader "ClaSsifiCatiOn_Of:Infantile'MaInutrition 2 302.',
Landman, J. (1974)" Decline of Breast Feeding in Kingston 73/74" Proceedings of the Commonwealth Caribbean MedI*al Research Council.
Levin, B., McKay, M.M., Neill, C.A., Oberholzer, V.G. and Whitehead, T. P. (1959). Medical . Research Council, S pecial Report Senes:No. 296,' Part 1.
Lovric, V. A. (1970). Medical Journal of Australia, 2, 366.
and Child • Nelson, K.B.2 Deutschberger, Neurology, 12 -487.
(1970). Developmental Medicine
Scientific,
Newson L.J., and . NewSon' E. (1962). .British Medical Journal, 2, 1744.
Nutrition Report (1970). Report of the Nutrition. Committee Research Council, Jamaica."
Morley, R., Bicknell, J. and Woodland, M. (1968). Transactions of the Royal Society of Tropical Medicine and Hygiene, 62, 164.
Morley, D.C. and Knox, .G..(1960). Journal of Obstetrics and Gynaecology British Empire, 67, 97.
Morley, D. Co, Woodland, M., Martin, African Medical Journal 17, 8..
M. J.. and Allen I. (1968). West
Nellhaus G. (1968). Pediatricsi 41, 106.
Oppe T. E. (1964). Proceedings of the. Royal Society of Medicine 57 321.
Pathak, U.N., Wood, J.K. and Sorhaindo, B.A. (1967). Obstetrics and Gynaecology, 292 500.
136
McGraw, M. B. (1931). Genetic Psychology Monographs, 10, 1.
McGregor, I. A., Rahman, A.K., Thompson B., Billewicz, W.Z. and Thompson, A. M. (1968). Transactions of the Royal Society of Tropical Medicine
- and Hygiene, 62, 341.
Maclver, J.E. and Back, E. H. (1960). Archives of Disease in Childhood, 35, 134.
McKenzie, H.I.2 Lovell, H.G., Standard, K.I., and Miall, W.E. (1967). Milbank Memorial Fund Quarterly, i45, 303.
Marsden, P.D. (1964). Transactions of the Royal Society of Tropical Medicine and Hygiene, 58, 455•
Marshall, W.A., Ashcroft, M.T., and Bryan, G. (1970). Human Biology 42,419.
Pediatrics, 22, 116.
Miller, R. A. (1952). Archives of Disease in Childhood, 27,. 187,195 and 200.
137 Persaud, T.V.N., Roopnarinesingh, S.S.2 Morris, D. (1971). Journal of Tropical Pediatrics and Environmental Child Health, 17, 113.
Pasamanick (1946). Journal of Genetic Psychology, 69, 3•
Peatman, J.G. Higgens, R.A. (1942). American Journal of Orthopsychiatry„ 12, 234.
Poole H. E. (1969). Journal of Tropical Pediatrics, 15, 172.
Report of a P.A.H.O. Technical Group Meeting 1970 "Maternal Nutrition and Family Planning in the Americas". Scientific Publication No.204.
Richardson F.H. (1950). Journal of the American Medical Association, 142, 863.
Richardson, S. A. (1965) in Proceedings of the Special Session of the 10th Meeting of the P.A.H.O. Advisory Committee on Medical Research. P.A.H.O. publication No. 134. Washington: Pan American Health Organization.
Robinson, M. (1951). Lancet, 1, 788.
Ross, A. I., and Herdan, G. (1951). Lancet 1, 630.
Salber, E. J. and. Bradshaw, W.S. (1951). British Journal of the Society of Medicine, 5, 113.
Salber, E.J. and Feinleib, M. (1966). Pediatrics, 37, 299.
Scott, R. B., Howard, H.H., Clark, B.G., Kessler, A.D. and Ferguson, A.D. (1962). Pediatrics 29, 65.
Smith, C.H., (1960). "Blood Diseases of Infancy and Childhood". p.174. Mosby, St. Louis.
Smith, K.A. (1968). Millbank Memorial Fund Quarterly, 46, 257.
Smith, N. J.1(1970). Iron Nutrition in Infancy,,p.320 Report of the . 62nd Ross Conference on Pediatric Research. Columbus, Ross Laboratories.
F.J.W. and Court, S.D.M. "A Thousand The Nuffield Foundation, Oxford
•
Spence, J., Walton, W.S.,.Miller, Families in Newcastle-upon-Tyne".
.University Press, 1954.
.,Standard, K.L. (1958). West Indian Medical Journal,
Standard,' K.L.1 Desai, ,Science„ 11 53•
Stoch, M.B.s. Smythel.P.MA1963). Archives of Disease
.Stuart,.H.C., Stevenson, S.S. (1959) 'Physical growth In Nelson, .W.E. (Ed.) Textbook of Pediatrics. '7th Ed. W. B. Saunders. p. 48,,
. (1954). Pediatrics,
in Childhood,38,546.
and developmentg. Philadelphia:
7, 215.
P. and Miall, W.E. (1969). Journal of Biosocial

Sturgeon, P. (1958). Studies of iron requirements in infants and children. In Iron in Clinical Medicine, p. 183. Ed. by R. O. Wallerstein and S. R. Mettler. University of California Press, Berkeley.
Tanner, J.M., Whitehouse, R.F. and Takaishis M. (1966). Archives of Disease of Childhood, 41, 454, 613.
Thomson2. A. M., Billewicz, W.Z., and Hytten, F.E. (1968). Journal of Obstetrics and Gynaecology of the British Commonwealth 75, 903.
,Thwaites, E.J. and Sutherland, L. (1952). Archives of Disease in Childhood 27, 60.
U.K. Ministry of Health 1959 Standards of normal weight in infancy. Reports on Public Health and Medical Matters, No.99 H.M.S.O.,London.
Verghese, K.P., Scott, R.B.1 Teixiera, G., Ferguson, A.D. (1969). Pediatrics, 44, 243.
Vincent, M. Hugon, J. (1962). Bulletin of the World Health Organization 26, 146.
Watt A. (1959). West African Medical Journal 8, 53.
Wills, V.G. and Waterlow, J.C. (1958). Journal of Tropical Pediatrics 3, 167.
Westropp, C. (1953). British Medical Journal, 1, 138.
Westropp, C. R., Barber, C. R. (1956). Journal of Neurology, Neuro-surgery and Psychiatry, 19, 52.
Wharton, B., Howell, G. and Phillips, I. (1968). British Medical Journal, 4, 608.
Wheatley D. (1968). Archives of Disease in Childhood, 43, 53.
Williams, J.R.1 Scott R.B. (1953). Child Development, 24, 103.
Winick, M., Rosso, P., (1969a). Pediatric Research 3, 181.
(1969b). Journal of Paediatrics, 741 774.
World Health OFganization (1972). Nutritional Anaemias: report of a WHO Group of Experts. World Health Organization Technical Report Series, 503.
Moinian, M. and Lind J. (1969). Lancet 2, 871.

139
APPENDIX
Excerpts from "DEVELOPMENTAL ASSESSMENT OF JAMAICAN INFANTS"
Introduction
Recently there has been increasing emphasis on the effects of cultural
and nutritional deprivation on the intellectual and psychological
development of infants (Cravioto 1965, Richardson 1965, Birch and
Gussow 1970). Only one report of the psychological and biological
development of infants could be found from Jamaica (Curti et al.1935):
this was a study of 76 children between one and three years of age
from the Kingston City Creche. They were evaluated on the Gesell
schedules and were found to function at a lower level, apart from the
gross motor behaviour than the normal white children used to standardize
the Gesell schedules.
Procedure
The children in the present study were part of the main group of 300
children. When they were born the birth class was recorded by the midwife
attending each delivery. The newborn was graded, on the time that
elapsed between birth and the first spontaneous respiration. The
gradings ran from A (less than one minute) to D (more than 5 minutes).
66 infants from the 300 infants had full developmental evaluations
at one year of age. They were an unselected group from the 134
infants whose first birth date fell during the time the evaluations
took place, mid-March to mid-April 1968. All infants with birthweights
below 2.5 kg were excluded, except for four children who happened to
be attending the clinic when the expected children did not appear.
The group contained 30 male and 36 female infants: 62 were predominantly
Negro, 3 were of mixed parentage (Negro, Caucasian and Indian) and 1
was Indian.
All the developmental evaluations were carried out by .a paediatric
140
neurologist and psychiatrist (W.A.H.). The children were evaluated
using the. Yale Developmental Schedules and the general procedures of
the examination were those in Developmental Diagnosis by Gesell and
Armatruda.
-Comments on the Tests
The infants were all examined while sitting on their mother's
laps. Many appeared overwhelmed and withdrawn in the testing.situation
and considerable time had to be taken to allow the children to become
More comfortable.. Test procedures were not initiated until it was
felt the children were ready io.co-operate in th:e.assessment. Verbal
communication With..the children was limited since the more attempts
the examiner made to communicate with the-children- the more interested..
they became in the examiner and the less'interested they became i
the test materials.
The assessments were 'carried out.in a'room adjacent to the
Paediatric'Clinic: although'the room was noisy, most of the children •
did not appearto be distracted by the surroundings, probably because
they were accustomed to living in crowded and noisy `situations.
iOnce the:children-became interested in the testing materials-
there was little difficulty in continuing With the assessment.
During-the testing most of the children were very quiet; their
mothers-were also. quiet, with little verbal' communication with
the children.
The children tended to fail certain items at the one-year
level. For example many 'Children did not drink 'from the cup
because-they had been kept on,the bottle by their parents and
not been given a cup at home. Many failed to 'squeak the doll,
."probably because they had no previous experience-with this type
of toy. Many found it difficult to release blocks to the examiner:
the reason for this was uncertain, but it appeared
shyness.
The children tended to succeed in certain items above the one-year
level: '`For example most of the children- showed 'gross motor activities
141
at a higher level and were able to place pellets in the bottle at the
15-months level. Most knew four or more twords ; 'ma-ma', -da I
'tat, bye-bye and also the names of members of the household.
Since most of the children were living in crowded homes they knew
a sufficient number of such names to do well on this item.
Results
Table Li shows the mean scores azid:*h9' distribution of the scores
of 65 children.• One child was so withdrawn that he could not be assessed
accurately.,.. feW- infants were very shy:and withdrawn and.
e assessed on the first occasion, but were re-assessed at a later
date and the results of the second assessment were used` for the survey.
Different factors were examined to determine their effect on the
children. Table L11 summarizes the results.
The infants from the higher socio-economic group were better
than those in the lower socio-economic group in, language behaviour
( p < 0.01) and in fine motor behaviour (p <0.05). First-born
infa.nts were slightly but consistently better than later-born infants•
in all areas of development. The difference was significant <0.05 )
in gross motor behaviour.
Increasing weight also had a slight but , consistently beneficial
effect on all areas of development. The 10.heaviest male and female
infants were , significantly •better in language behaviour (p =<0.01)
than the 10 lightest male and female infants.

The mean score and the distribution of score in 65 infants
at developmental evaluations
Nos. of infants at each age level of deVelopMnt
Type of behaviour
44- 45 wks.
48- 49 wks
Mean score in weeks of development
46- 47 wks.
`50- 51
wks..
52- 53 wics.
54-7 • -55 wks.
56- '57' wks,
58- 59 wks.
60- 61 wks.
627 . 63 wks.
64- 65 wks.
66-: 67
-68- 69 wks.
70- 71 wks.
Gross motor 58.3 4 19 3 8 4 2 11' 5
6 Fine motor 4 11 6 14 4 7 55.6 3
1 3 5 6 9 5 Adaptive .53.6 23 10 ,3
Language 55.4 3 1 2 6 8 8 3 6 3 -7 6 2
Personal-social 53.9 3 7 5 23 3 10 3 3 4

TABLE T.TT Factors affecting developmental scores
Factor Groups ..._
Gross motor Fine motor Adaptive Language Nos.
Mean S.D. Mean S.D. MegurS.D. Mean S.D
Socio economic groups
Upper
Lower
58.3
58.4
6.3
6.4
+ +57.2
4. +55.1
4.9
4.2
54.8
53.2
3.7
3.1
*58.o
*54.6
5.7
5.4
18
47
Birth First born
order infants *59.9 6.2 56.2 4.6 54.2 303 56.o 6.1 36
Later-born infants *56.4 6.0 55.0 4.2 53.0 3.4 54.9 5.1 29
Heaviest
Weight
10 males and 10 females
57.9 6.6 55.6 4.6 53.8 3.7 +57.3 5.0 20
Lowest
' 10 males and 9 females
57.0 5.9 54.6 4.3 52.9 3.0 4.52.2 5.2 .19
Female *5906 6.4 55.5 4.4 53.7 309 55.3 5.8 36 Sex Male t56.9 5.8 55.9 4.5 53.7 2.6 55.7 5.4 29
Birth Grade A 58.4 6.4 5600 4.3 + +54.0 3.2 *56.1 5.6 57 class Grades B1 + C,D 58.0 5.7 53.6 4.9 +51.5 4.2 *51.4 4.2 8
* significant 2-tail test (p=0.05) + significant 2-tail test (p=0.01) .1. significant 1-tail test (p=0.05)

for this discrepancy. Perhaps the gross motor items selected for
examination in the original group f children were not representative
all-over gross motor behaviour. Bayley (1965) found that first-born
144
Infants whose initial spontaneous respiration took place in less
than one minute after birth did better than those whose initial
spontaneous respiration took longer. The former were better in all
areas of development and the difference was significant (p =1.70.05)
in language and adaptive behaviour.
Sex made no consistent difference to the infants' performances,
thotigh female infants were better (p =.-c0.05) than male infants in
gross motor behaviour, except for the onset of walking which was
the same for both sexes.
Discussion
There were no significant differences in any of the recorded
social factors between the 66 infants in this study and the survey
group of 300. When the babies with birthweights less than 2.5 kg
were removed, there was no significant difference in either the
weights or the haemoglobins between the, main study group and the
66 infants. Items of gross motor behaviour in the 300 infants
were assessed throughout the year and showed a similar pattern
to those reported in this survey. (Chapter X).
In this study, first-born babies were better in gross motor
behaviour than later born babies (p =<0.05). It is possible,
therefore; that the method of selection of the survey exaggerated
the reported precocity in gross motor development. The birth order
made no significant difference to the other, behaviour. However,
in the assessment of items of grodd motor behaviour in the original
group of survey children (Chapter X); the.first borns were not more
advanced than later born children. It is unknown what accounted
145 infants functioned slightly but inconsistently better than later-born
infants at psychometric testing, and postulated that this could be
due to the individual attention first babies received.
The group of infants in this present study showed an acceleration
in development when compared with the normal standard of the Gesell
schedules based on white North American children. It was not, possible
to determine whether this was due to racial factors, as it was impossible
to set up a comparable control group of white Caucasian infants since
there are very few working class Caucasians in Jamaica.
Geber and Dean (1957) found an all-round precocity in infants
in Uganda in the first year of life, particularly in gross motor
behaviour. Poole (1969) found a similar acceleration in infants in
Nigeria. However, the acceleration found in this study was not so
great as that reported in Uganda. Several studies have shown advanced
grosd motor behaviour in Negro infants (Pasamanick 1946 Williams and
Scott 1953, Bayley 1965). Williams and Scott (1953) suggested that
gross motor precocity was due to more permissive child-rearing practices.
Permissive parental attitudes towards very young children in this study
were reported in Chapter III.
Birren and Hess (1968) reviewed many studies on socio-economic
differences and cognitive developmmt and found there was a
common tendency for children from high socio-economic backgrounds to
perform better at developmental and intellectual tests than children
from low socio-economic backgrounds. Bayley (1965) found little or
no difference in development based on social, classes until'after the
infant was two years of age. Because of this it was not anticipated
that socio-economic status would make a significant difference at one
year of age in the children surveyed. However, the study did show
an increased level of function in all areas except for gross motor

146 behaviour in the; higher socio-economic group as compared with the: lower.
socio-economic grOub.
Recently a study was carried out by the Institute
University of. the West Indies, on four-year old'JamaiCan children
from basic Schools and private schools (dtant 1970). The results
showed that the basic school child was an aVerage-of 1.75 years
behind the private school child: further evidence of the effect
of socio-economic factors on development in Jamaica.
The weightS of children provide information about their, nutritional
status (Morley et al. 1968). Thi is particularly so in underdeveloped
countries like Jamaica where weights at one, year reflect to a
degree nutritional status than genetic inheritance.
The accelerated performance found in heavier children
agree with Cravioto (1965) who found that there was a high correlation
between deficits in height and weight and scores in developmental
ThOUgh.the smallest children i theAUn6Ston study were not
severely malnourished the mean weights
and the 9 lightest female infants were 8.7 kg and 8.3 kg respectively.
Both theseweights fall be1oW the 10th4erCentile'ofthe
standard.of Stuart and. Stevenson (1959);
North'American
Sex made no difference,to the'infanis2 performantes except in
gross motor behaviour, when female infants were_slightly better
male infants (p = 0.05 ,one-tail test). ,HindleY et:al. (1966). and
BayleY (1965) were unable to find such difference in samples from
five different European countries, and from 12 U.S. cities respectively.
The general acceleration in developMent found n this study
in contrast to the findings of Curti et al.
study, the Kingston infants, apart from gross
(1935). their
a. lower level than the normal Gesell infant. The reason for this

147
is unknown. However, their subjects came from exceptionally pool-
socio-economic backgrounds and most of the homes in the present study
• were of a better standardf perhaps reflecting the economic improvement
which has occurred in Jamaica over the last 30 years. There may also
be a relationship to nutrition, since the average weight of the one -year
old infants of their study was-8.2 kg compared with 9.6 kg in the
present study.
Summary
The Yale Developmental Schedules were administered to 66 infants
at one year of age. The.infants.showed slightly accelerated develcp-inent
over the normal white child of the Gesell Schedules, partZcularly,
in gross motor behaviour. Socio-economic status, birth order, ireick-t
at one year and birth class all affected the infant's performanms.
The effects of race could not be. assessed as no comparable Caucasiar
group 'could be found as controli.