health and energy, making the connections
TRANSCRIPT

Health and Energy, Making the Connections
John T. Cook, Ph.D., MA Ed.
Assoc. Professor of Pediatrics, BU School of Medicine; Senior Research Scientist and Principal Investigator for Children's
HealthWatch, Boston Medical Center
NYSERDA LIFE Statewide Conference Albany Marriott in Albany, NY
May 22 – 23, 2012

A research center made up of a national network of clinicians and public health specialists for research in multiple pediatric settings on the effect of U.S. social policy on young, low-income children’s health and nutrition. Research sites in: Little Rock, AR, Boston, MA, Baltimore, MD, Minneapolis, MN, Philadelphia, PA (Active) Los Angeles, CA, Washington, D.C. (Inactive)
www.childrenshealthwatch.org
Children’s HealthWatch (Previously the Children’s Sentinel Nutrition Assessment Program – C-SNAP) is:

Overview
1. What kind of Legacy do we want to leave? Why do we care about child health and development?
2. Energy insecurity, food insecurity and housing insecurity are systemic conditions that threaten our future prosperity.
3. How is energy insecurity related to adverse health outcomes?
4. What are the impacts of those adverse outcomes? Impacts of “toxic stress” on children’s cognitive
development and long-term health 5. Toward Solutions: The need for investment in
effective social infrastructures

Energy Insecurity,
Food Insecurity, Housing
Insecurity
Policy Failures
Regulatory Failures
Failures of Representative
Democracy
Market Failures
Energy insecurity, food insecurity and housing insecurity are results of systemic failures, not individuals’ failures

Energy Insecurity,
Food Insecurity, Housing
Insecurity
Policy Failures
Regulatory Failures
Failures of Representative
Democracy
Market Failures
Energy insecurity, food insecurity and housing insecurity are results of systemic failures, not individuals’ failures
Weaknesses • No short-term fix for the systemic problems
Strengths • But systemic problems are amenable to policy solutions

Energy Insecurity,
Food Insecurity, Housing
Insecurity
Policy Failures
Regulatory Failures
Failures of Representative
Democracy
Market Failures
Energy insecurity, food insecurity and housing insecurity are results of systemic failures, not individuals’ failures
Crony- Capitalism
Crisis-Capitalism

Energy Insecurity,
Food Insecurity, Housing
Insecurity
Policy Failures
Regulatory Failures
Failures of Representative
Democracy
Market Failures
Energy insecurity, food insecurity and housing insecurity are results of systemic failures, not individuals’ failures
Crony- Capitalism
Crisis-Capitalism
Voter Suppression
Citizens United

0
2,000
4,000
6,000
8,000
10,000
12,000
14,000
16,000
Jan-07
Apr-07
Jul-07
Oct-07
Jan-08
Apr-08
Jul-08
Oct-08
Jan-09
Apr-09
Jul-09
Oct-09
Jan-10
Apr-10
Jul-10
Oct-10
Jan-11
Apr-11
Jul-11
Oct-11
Jan-12
Recession ends, Jun ‘09
Thousands
Source: US Bureau of Labor Statistics
Recession begins, Dec 07
Number Unemployed per Month, US Labor Force Ages 16 years and Above; Seasonally Adjusted

Total Food Insecure Number Percent
Adults 32,624,000 14.2 Latino 8,214,000 25.7
Non-Latino Black 6,319,000 24.3 Non-Latino White 16,321,000 10.4
All Children < 18 years 16,208,000 21.6 Latino 5,117,000 32.5
Non-Latino Black 3,675,000 34.8 Non-Latino White 6,498,000 14.9
All People 48,832,000 16.1 Source: Coleman-Jensen A, Nord M, Andrews M, Carlson S. Household Food Security in the U.S., 2010, Statistical Supplement, September 2011.
Prevalence of Food Insecurity by Race/Ethnicity, All Adults and Children, 2010

Prevalence of Food Insecurity by Race/Ethnicity, All Adults and Children, 2010
Total Food Insecure Number Percent
Adults 32,624,000 14.2 Latino 8,214,000 25.7
Non-Latino Black 6,319,000 24.3 Non-Latino White 16,321,000 10.4
All Children < 18 years 16,208,000 21.6 Latino 5,117,000 32.5
Non-Latino Black 3,675,000 34.8 Non-Latino White 6,498,000 14.9
All People 48,832,000 16.1 Source: Coleman-Jensen A, Nord M, Andrews M, Carlson S. Household Food Security in the U.S., 2010, Statistical Supplement, September 2011.
Prevalence of Food Insecurity by Race/Ethnicity, All Adults and Children, 2010

0.0%
5.0%
10.0%
15.0%
20.0%
25.0%
30.0%
35.0%
40.0%
45.0%
Allconsumer
units
Second20%
Fourth20%
Food
Housing
Transportation
Health care
Personal insurance andpensions
Source: US Bureau of Labor Statistics. Percents do not add to 100% as some expenditure categories are not included.
Shares of Total Average Expenditures for Select Major Categories By Income Quintile, 2010

Source: US Bureau of Labor Statistics..
100
150
200
250
300
350
400
450 Ja
n08
Mar
May
Jul
Sep
Nov
Jan0
9
Mar
May
Jul
Sep
Nov
Jan1
0
Mar
May
Jul
Sep
Nov
Jan1
1
Mar
May
Jul
Sep
Nov
Jan1
2
Mar
Food
Shelter
Fuels and utilities
Transportation
Motor fuel
Medical care
Recession ended
Trends in Prices for Selected Categories of Expenditures, Jan 2008 – Mar 2012

Source: US Bureau of Labor Statistics..
Trends in Weekly Earnings By Characteristics of Workers, Jan 2008 – Mar 2012
Recession Ended
300
400
500
600
700
800
900
All Wage & Salary Workers
White Workers
Black Workers
Latino Workers
Less Than High School Degree
High School, No College
Some College or Associate Degree

Source: US Bureau of Labor Statistics..
0.0%
1.0%
2.0%
3.0%
4.0%
5.0%
6.0%
7.0%
2001 2002 2003 2004 2005 2006 2007 2008 2009 2010 2011 2012
Union
U Goods Producing
U Service Producing
Non-union
NU Goods Producing
NU Service Producing
Trends in Annual Employment Cost Change By Bargaining Status of Workers, 2001 – 2012

Energy Insecurity and Health

Cold: Chill, discomfort, frostbite, hypothermia House fires, carbon-monoxide poisoning, unsafe travel conditions, power outages, floods after snow & ice melt, food insecurity
Heat: Sunburn, heat rash, heat edema, dehydration, syncope, heat cramps, heat exhaustion, heat stroke
Power outages, food spoilage, vector-borne disease, food insecurity
Those most at risk for cold and heat problems are: Infants and young children The elderly Overweight people Homeless Those who work/exercise inside/outside in the heat or cold People who are ill or taking medicines
Extreme Temperatures Stress the Body
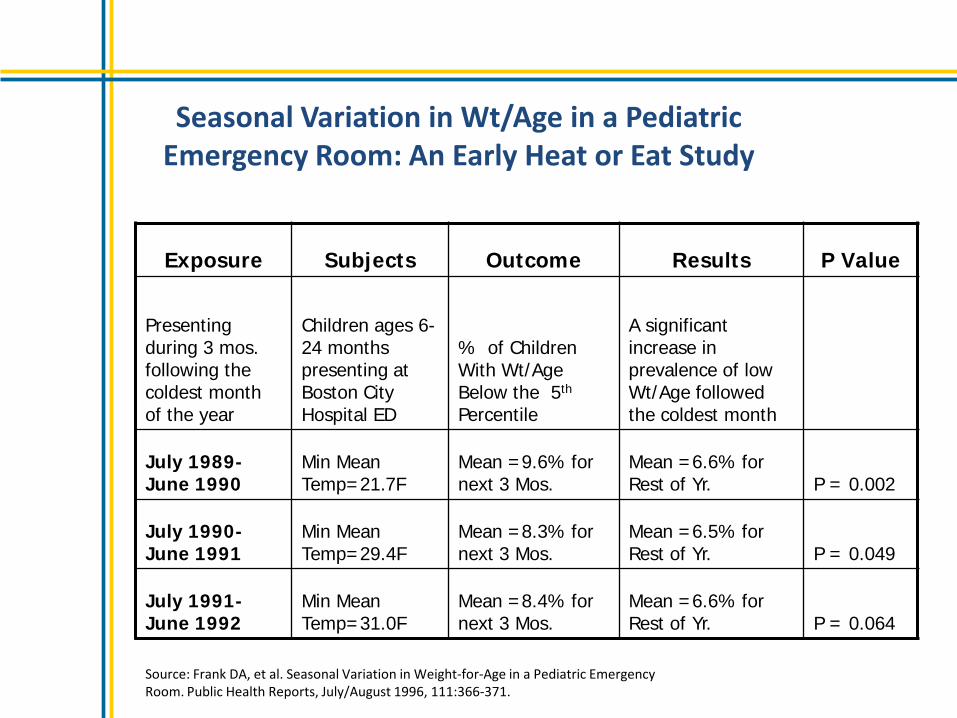
Exposure Subjects Outcome Results P Value
Presenting during 3 mos. following the coldest month of the year
Children ages 6-24 months presenting at Boston City Hospital ED
% of Children With Wt/Age Below the 5th Percentile
A significant increase in prevalence of low Wt/Age followed the coldest month
July 1989-June 1990
Min Mean Temp=21.7F
Mean =9.6% for next 3 Mos.
Mean =6.6% for Rest of Yr. P = 0.002
July 1990-June 1991
Min Mean Temp=29.4F
Mean =8.3% for next 3 Mos.
Mean =6.5% for Rest of Yr. P = 0.049
July 1991-June 1992
Min Mean Temp=31.0F
Mean =8.4% for next 3 Mos.
Mean =6.6% for Rest of Yr. P = 0.064
Seasonal Variation in Wt/Age in a Pediatric Emergency Room: An Early Heat or Eat Study
Source: Frank DA, et al. Seasonal Variation in Weight-for-Age in a Pediatric Emergency Room. Public Health Reports, July/August 1996, 111:366-371.

Heat or Eat? Cold-Weather Shocks and Nutrition in Poor American Families
Source: Bhattacharya J, DeLiere T, Haider S, Currie J. Heat or Eat? Cold Weather Shocks and Nutirtion in Poor American Families. Am J Public Health. 2003;93:1149–1154.
A study reported in 2003 used Consumer Expenditure Survey (CEX) and National Health and Nutrition Examination Survey(NHANES) data to compare food expenditures by “poor” and “non-poor” households during exceptionally cold months, finding:
• Both poor and non-poor households increased fuel expenditures in response to unusually cold weather (by $37 and $53 on average respectively, in 1982-84 dollars).
• Poor families also reduced food expenditures by roughly the same amount as their increase in fuel expenditures, whereas richer families just increased food expenditures.
• Poor parents and their children spend less on and eat less food during cold-weather budgetary shocks.

LIHEAP Protects Children from Adverse Effects of Energy Insecurity
Source: Frank, et al. Heat or Eat: The Low Income Energy Assistance Program and Nutritional Risk Among Children Less Than 3 Years of Age. Pediatrics, Nov 2006, 118(5):e1293-e1302.
Outcome
Does Not Receive LIHEAP
(n=5925)
Receives LIHEAP
(n=1149) P Value
Mean Wt/Age Z-Score -0.333 0.076 P = 0.01
At Nutritional Risk for Growth Problems 1.23 1.00 P = 0.05
Acute Hospital Admission 1.32 1.00 P = 0.05

In high-cooling states, the odds of food insecurity with hunger for poor elderly-only households were 27% higher in the summer than in the winter (cool or eat). In high-heating states the pattern was reversed for such households; the odds of food insecurity with hunger were 43% lower in the summer (heat or eat).
Seasonal Variation in Food Insecurity is Associated with Heating and Cooling Costs among Low-
Income Elderly Americans
Source: Nord M, Kantor LS. Seasonal variation in food insecurity is associated with heating and cooling costs among low-income elderly Americans. J Nutr, November 2006. 136:2939-2944.

Derived from four questions in the Children’s HealthWatch survey interview questionnaire
1. In the last year, has the [gas/electricity] company sent you a
letter threatening to shut off the [gas/electricity] in the house for not paying bills?
2. In the last year, has the [gas/electric/oil] company [shut off/refused to deliver] the [gas/electricity/oil] for not paying bills?
3. In the last year, have you ever used a cooking stove to heat the [house/apartment]?
4. In the last year, were there days that the home was not [heated/cooled] because you couldn’t pay the bills?
The Children’s HealthWatch Ordinal Energy Insecurity Indicator
Low
Seve
rity
High

Adjusted Logistic Regression Results: Energy Security as Predictor, Household and Child Food Security as Outcomes
Outcomes
Energy Secure (n=6,385;
66%)
Moderate Energy Insecurity: Shutoff
Threatened (n=1,043; 11%)
Severe Energy Insecurity: Heat with
Cooking Stove/Shutoff/
Unheated/cooled Days (n=2,293; 23%)
P value
Household Food Insecurity (yes/no)
1.00
2.37
(1.78, 3.16) P < 0.01
3.06
(2.46, 3.81) P < 0.01
P < 0.01
Child Food Insecurity (yes/no)
1.00
1.79
(1.13, 2.72) P < 0.01
3.46
(2.56, 4.67) P < 0.01
P < 0.01
Controlling for Site, mother’s age, race, marital status, education level, depressive symptoms, US-born, employment, housing subsidy; child’s low birthweight status, breastfeeding, type of insurance, age, WIC participation. Source: Cook JT, Frank DA, Casey PH, et al. A Brief Indicator of Household Energy Security: Associations with Food Security, Child Health, and Child Development in US Infants and Toddlers. Pediatrics, 2008, Oct, 122(4):e867-e875.

Adjusted Logistic Regression Results: Energy Security as Predictor, Child Health and Development as Outcomes
Controlling for Site, mother’s age, race, marital status, education level, depressive symptoms, US-born, employment, housing subsidy; child’s low birthweight status, breastfeeding, type of insurance, age, WIC participation. Source: Cook JT, Frank DA, Casey PH, et al. A Brief Indicator of Household Energy Security: Associations with Food Security, Child Health, and Child Development in US Infants and Toddlers. Pediatrics, 2008, Oct, 122(4):e867-e875.
Outcomes
Energy Secure (n=6,385; 66%)
Moderate Energy Insecurity: Shutoff
Threatened (n=1,043; 11%)
Severe Energy Insecurity: Heat with
Cooking Stove/Shutoff/ Unheated/cooled Days
(n=2,293; 23%)
P value
Child Health Fair/poor
1.00
1.34 (1.08, 1.68)
P = 0.01
1.36 (1.15, 1.61)
P < 0.01
P < 0.01
Hospitalized Since Birth (yes/no)
1.00
1.22 (1.03, 1.45)
P = 0.02
1.02 (0.89, 1.17)
P = 0.74
P = 0.07
PEDS Significant Concerns
1.00
1.00 (0.71, 1.41)
P = 0.99
1.82 (1.38, 2.39)
P < 0.01
P < 0.01
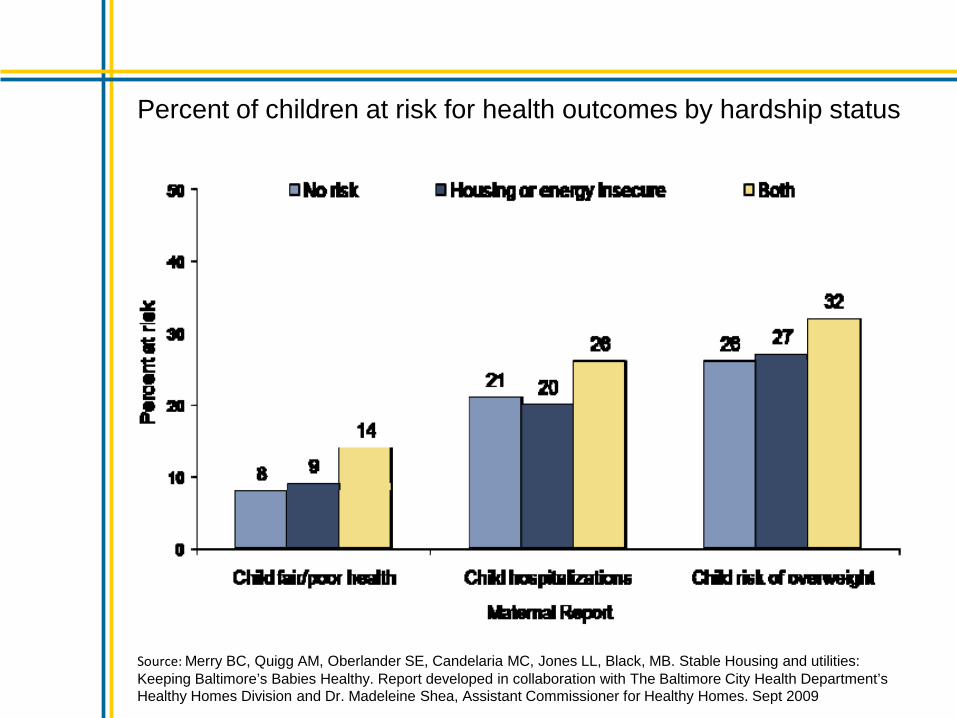
Source: Merry BC, Quigg AM, Oberlander SE, Candelaria MC, Jones LL, Black, MB. Stable Housing and utilities: Keeping Baltimore’s Babies Healthy. Report developed in collaboration with The Baltimore City Health Department’s Healthy Homes Division and Dr. Madeleine Shea, Assistant Commissioner for Healthy Homes. Sept 2009
Percent of children at risk for health outcomes by hardship status

Source: Frank DA, et al., Pediatrics, Apr 2010

7,918,993
8,775,919 9,440,933
9,836,689 9,896,107
5,428,918 6,098,753
6,715,203 6,681,498 6,833,988
2,490,075 2,677,166 2,725,730 3,155,191 3,062,119
0
2,000,000
4,000,000
6,000,000
8,000,000
10,000,000
12,000,000
2006 2007 2008 2009 2010
Number of Children in Marginally Food Secure Households by Age Group, 2006-2010
Children < 18 Yrs Children 5-17 Yrs Children < 5 yrs

Outcomes
Food Insecure
(≥3 items endorsed) (n=6,422)
Marginal Food
Security (n=4,544)
High Food
Security (n=17,482)
Child Health Fair/Poor 1.84
(1.69, 2.02) 1.21
(1.10, 1.34) 1.00
Hospitalized Since Birth 1.26
(1.17, 1.36) 1.12
(1.03, 1.21) 1.00
At Risk Underweight^ 0.94
(0.86, 1.03) 0.91
(0.82, 1.00) 1.00
Overweight* 1.03
(0.94, 1.13) 0.94
(0.85, 1.04) 1.00 PEDS –Significant Development Concerns Age>4 months; n=9,270
2.01 (1.74, 2.33)
1.38 (1.17, 1.63) 1.00
Mother Health Fair/Poor 2.48
(2.29, 2.70) 1.41
(1.29, 1.56) 1.00
Maternal Depression 3.29
(3.05, 3.55) 1.80
(1.66, 1.96) 1.00
Housing Insecurity 1.63
(1.52, 1.74) 1.22
(1.13, 1.31) 1.00
Energy Insecurity 4.14
(3.81, 4.52) 2.43
(2.22, 2.67) 1.00
Associations of Food Insecurity and Marginal Food Security With Child and Maternal Health Outcomes and Hardships

New findings from genetics, neuroscience, developmental psychology and the economics of human capital formation are converging to indicate:
• Early experience and gene-environment interactions affect the architecture of the maturing brain, (0-3 yrs)
• Positive stress (short term, quickly relieved) can be growth producing and generally beneficial, (0-3 yrs)
• Tolerable stress (moderate, short-lived) (0-3 yrs)
• Toxic stress (inescapable, acute or chronic) harms the brain architecture of developing children, associated with serious later disease (0-6 yrs)
New Research and Knowledge On Food Insecurity’s Impacts on Child Health & Development
Why Does this All Matter?

Toxic stress response can occur when a child experiences strong, frequent, and/or prolonged adversity—such as:
Physical or emotional abuse, chronic neglect, caregiver substance abuse or mental illness, exposure to violence, and/or the accumulated burdens of family economic hardship—without adequate adult support.
This kind of prolonged activation of the stress response systems can disrupt the development of brain architecture and other
organ systems, and increase the risk for stress-related disease and cognitive
impairment, well into the adult years.
Source: Center on the Developing Child, Harvard University ; http://developingchild.harvard.edu/topics/science_of_early_childhood/toxic_stress_response/
What is Toxic Stress?

Toxic stress response can occur when a child experiences strong, frequent, and/or prolonged adversity—such as:
The accumulated burdens of family economic hardship—without adequate adult support. Homeostasis versus allostasis
Allostatic load
Can Childhood Energy, Food and Housing Insecurity Become or Exacerbate
Toxic Stress?

What if the child is one of the 6.3 million children under 6 years old living in families in poverty? I.e., with an annual income of $22,113 (family of four with two children). What if the child is one of the 9.0 million children
in families with children under 6 years old that are food insecure? Can the child avoid toxic stress?
But what if adults in the child’s life lack sufficient resources to provide “adequate adult support”?
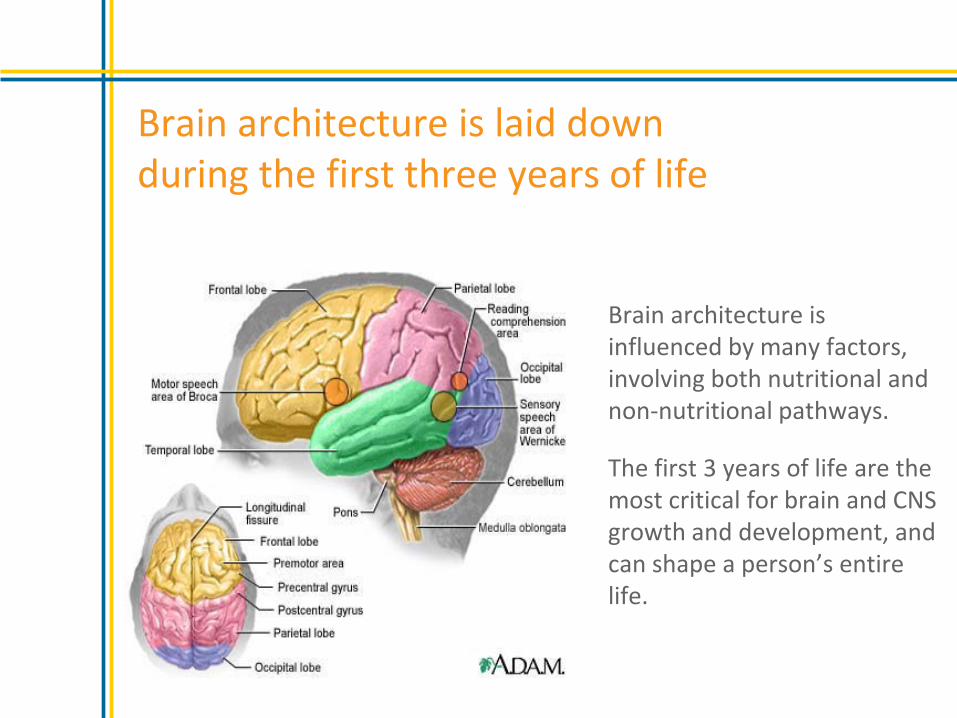
Brain architecture is influenced by many factors, involving both nutritional and non-nutritional pathways.
The first 3 years of life are the most critical for brain and CNS growth and development, and can shape a person’s entire life.
Brain architecture is laid down during the first three years of life

Brain “architecture” is physical structure, and interconnections. There are about 100 billion cells in the brain.
Brain architecture is influenced by many factors, including many associated with “toxic stress” related to poverty, energy insecurity, food insecurity and housing insecurity.
The first 3 years of life are the most critical for “laying down” the brain architecture.
Brain architecture is physical structure, interconnections, & neural networks
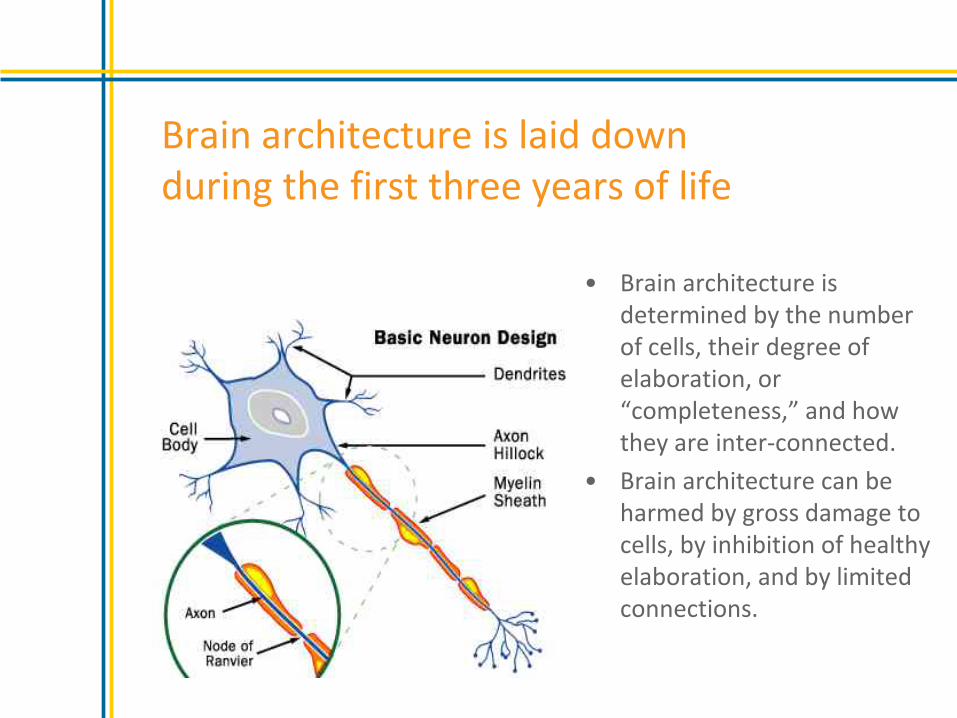
• Brain architecture is determined by the number of cells, their degree of elaboration, or “completeness,” and how they are inter-connected.
• Brain architecture can be harmed by gross damage to cells, by inhibition of healthy elaboration, and by limited connections.
Brain architecture is laid down during the first three years of life

Brain architecture is harmed by “toxic” stress

National Unemployment Rate, Persons Ages 25 Years and Above by Education Level Attained
0%
2%
4%
6%
8%
10%
12%
14%
16%
18%
2001 2002 2003 2004 2005 2006 2007 2008 2009 2010 2011
Less than High SchoolGraduate
High School Graduate
Some College
College Graduate orHigher
Why Impacts of Energy Insecurity on Child Development and Health Matter


"Albert Einstein once commented that the most fundamental question we can ever ask ourselves is whether or not the universe we live in is friendly or hostile. He hypothesized that your answer to that question would determine your destiny."
What kind of legacy will we leave for our children, and their children, and on for seven generations?

What Kind of Legacy Are We Leaving for our Children?

2007 2008 2009 2010
Annual Average Unemployment Level
7,078,000
8,924,000
14,265,000
14,825,000
Annual Average Unemployment Rate
4.6%
5.8%
9.3%
9.6%
Child Food Insecurity Level
12,435,000
16,673,000
17,197,000
16,208,000
Child Food Insecurity Prevalence
16.9%
22.5%
23.2%
21.6%
Source: Nord, et al. Food Security in the U.S., various years, USDA/ERS, and Bureau of Labor Statistics, Current Population Survey.
Social Infrastructures for Reducing Energy Insecurity, Food Insecurity and Housing Insecurity Work!
Unemployment and Food Insecurity in U.S. Children
(< 18 yrs) in The Great Recession 2007-2010

LIHEAP Protects Children from Adverse Effects of Energy Insecurity
Source: Frank, et al. Heat or Eat: The Low Income Energy Assistance Program and Nutritional Risk Among Children Less Than 3 Years of Age. Pediatrics, Nov 2006, 118(5):e1293-e1302.
Outcome
Does Not Receive LIHEAP
(n=5925)
Receives LIHEAP
(n=1149) P Value
Mean Wt/Age Z-Score -0.333 0.076 P = 0.01
At Nutritional Risk for Growth Problems 1.23 1.00 P = 0.05
Acute Hospital Admission 1.32 1.00 P = 0.05

Source: March, EL, et al. Rx For Hunger: Affordable Housing. A report by Children’s HealthWatch and the Medical Legal Partnership for Children. Dec 2009.

1. About framing: It’s normal. Everybody engages in it all the time. Frames are just structures of thought that we use every day. All words in all languages are defined in terms of frame-circuits in the brain. But, ultimately, framing is about ideas, about how we see the world, which determines how we act.
2. It’s a general principle: Unless you frame yourself, others will frame you — the media, your enemies, your competitors, your well-meaning friends.
Framing

1. The role of government is to protect and empower all citizens equally via The Public: public infrastructure, laws and enforcement, health, education, scientific research, protection, public lands, transportation, resources, art and culture, trade policies, safety nets, and on and on.
2. Nobody makes it purely on their own without The Public; that is, without public infrastructure, the justice system, health, education, scientific research, protections of all sorts, public lands, transportation, resources, art and culture, trade policies, safety nets,
Some Frames Worth Considering

Some Frames Worth Considering
1. Middle-class wages have not gone up significantly in 30 years, and there is pressure to lower them. But when most people get more money, they spend it and spur the economy, making the economy and the country stronger, as well as making their individual lives better.
2. Democracy starts with citizens caring about one another and acting responsibly on that sense of care, taking responsibility both for oneself and for one’s family, community, country, people in general, and the planet. A robust public is necessary for private success.

Thank You!
771 Albany Street | Dowling Bldg, Grnd Floor | Boston, MA 02118 | 617.414.5129
http://www.childrenshealthwatch.org/