health and wellbeing indicators at your… fingertips
TRANSCRIPT

Health and wellbeing indicators at your…
Fingertips
An introduction to using Fingertips API

An introduction to using Fingertips API 2
Table of contents Section 1: Overview......………………………………………………….3 Section 2: Key parameters........……………………………………......4 Section 3: Fingertips API call builder.................................................6 Section 4: API call response to Excel................................................7 4.1 Importing JSON data into Excel............................................................................7 4.2 Saving JSON responses as text files and importing into Excel.............................8 4.3 Importing data in other formats into Excel..............................................................8
Section 5: Retrieving public health data...........................................10 5.1 Example 1: Retrieving data for a single indicator...............................................10
5.2 Example 2: Retrieving latest data for a group of indicators................................12
5.3 Example 3: Retrieving trend data partitioned by category..................................14
Section 6: Beyond basic API calls – Q&A…….................................16 Section 7: Annex..............................................................................19

An introduction to using Fingertips API 3
Section 1: Overview
The purpose of this guide is to provide initial guidance on the use of Fingertips Application
Programming Interface (API). This document has a practical focus and while no previous
experience of working with an API is required, basic familiarity with the Fingertips site is
desirable, as much of the terminology used in this guide comes from the Fingertips tool itself.
The intention of this guide is, on one hand, to provide examples of problems you may want
to solve with the API and, on the other, leave you with enough guidance to perform more
complex operations in the future.
Upon reading this material, you should:
• have a basic understanding of what a Fingertips API call is and how it should be structured,
• be able to create a simple ‘Data’ call and import the output into Excel,
• know where to look for additional parameters needed for more complex API calls
What is Fingertips API?
Fingertips API is an alternative method of retrieving public health data available on the
Fingertips site. The main advantage of the API over the traditional ‘Download’ option is the
flexibility that it offers – you can create bespoke calls and get data for several indicators, from
a number of Profiles, in one go. Data from the API can be also exported as JSON files and
used seamlessly in other applications such as Power BI or Tableau. Fingertips API works in
all major browsers (except Internet Explorer) and can be accessed via:
https://fingertips.phe.org.uk/api
API calls are grouped into five sections, namely: Areas, Data, Entities, IndicatorMetadata and Profiles. By clicking on ‘List Operations’ next to the section heading (e.g. Profiles), you can see all calls within a single section. A brief description is at the right of the screen. To create a call, you should click on ‘GET’ or the URL, e.g. /api/profile. You will then be presented with an API call builder, which lists the required parameters. Indicator values can only be retrieved through calls available in the ‘Data’ section of the API. Operations listed in other sections are there to help you tailor the calls, so that the API returns exactly what you need. In other words, these operations act as lookup tables, which contain identifiers needed to build more complex data requests.
Description of what the call does
Click to access a call

An introduction to using Fingertips API 4
Section 2: Key parameters
Most queries in Fingertips API rely on the input of some parameters, which specify the
sub-set of data requested. These can be broadly divided into Profile and Geography-specific
parameters, which are usually the ID numbers for these items in the underlying database.
The parameters most frequently asked for in basic API calls are described below, together
with information on where to find them, including respective lookup tables provided in the
Annex to this guide.
Profile and indicator-specific identifiers
profile_id – unique numerical identifier of each Profile within Fingertips, e.g. 18 for the Local
Tobacco Control Profiles
profile_key – unique textual identifier of each Profile within Fingertips, e.g. ‘tobacco-
control’ for the Local Tobacco Control Profiles (as found in the URL on the tool:
https://fingertips.phe.org.uk/profile/tobacco-control)
group_ids – unique numerical identifiers of individual topics within a Profile, e.g. 1938132890
for the ‘Smoking quitters’ topic in the Local Tobacco Control Profiles
indicator_ids – unique numerical identifiers of individual indicators, e.g. 91736 for ‘Smokers
setting a quit date’; these can be also obtained from ‘Definitions’ view on the main site
Change Data view to ‘Definitions’ by clicking on the ellipsis (‘...’)

An introduction to using Fingertips API 5
Geography-specific identifiers
area_type_id (or child_area_type_id) – unique numerical identifier of the type of area you
want to see the data for; these can be administrative or health geographies, e.g. 302 for
Counties & UAs (4/20 – 3/21) or 7 for General Practices
parent_area_type_id – unique numerical identifier for the type of area to group areas by,
e.g. 6 if you want to group Counties & UAs (4/20 – 3/21) by Region or 166 if you want to
group General Practices by Clinical Commissioning Groups (2020/21)
area_code – code of a geographical entity, e.g. P81029 for Ash Trees Surgery (NHS code),
E38000228 for Morecambe Bay CCG (ONS code) or E08000002 for Bury (ONS code)
Note: Geography-specific parameters assume you have some knowledge of administrative
and health geographies and that you are familiar with the relationships between different
types of areas. You can use the AreaTypeIDs sheet of the Annex to find the identifiers for
both child_area_type_id and parent_area_type_id.
You may also choose to get these identifiers from URLs generated whilst navigating
individual Profiles. For example, if you wanted to explore the most recent data for the rate of
‘Smokers setting a quit date’ in Lancashire, compared to all other Counties & UAs
(4/20 – 3/21) across the North West, you could do so by looking at the following page from
the Local Tobacco Control Profiles:
https://fingertips.phe.org.uk/profile/tobacco-control/data#page/3/gid/1938132890/pat/6/
par/E12000002/ati/302/are/E10000017/iid/91736/age/164/sex/4/cid/4/tbm/1
child_area_type_id = 302
(Counties & UAs 4/20 – 3/21)
parent_area_type_id = 6
(Region)
indicator_id
profile_key group_id
area_code =
ONS code for Lancashire
parent_area_code =
ONS code for the North West ids of other parameters
(see Section 6)
An introduction to using Fingertips API 6
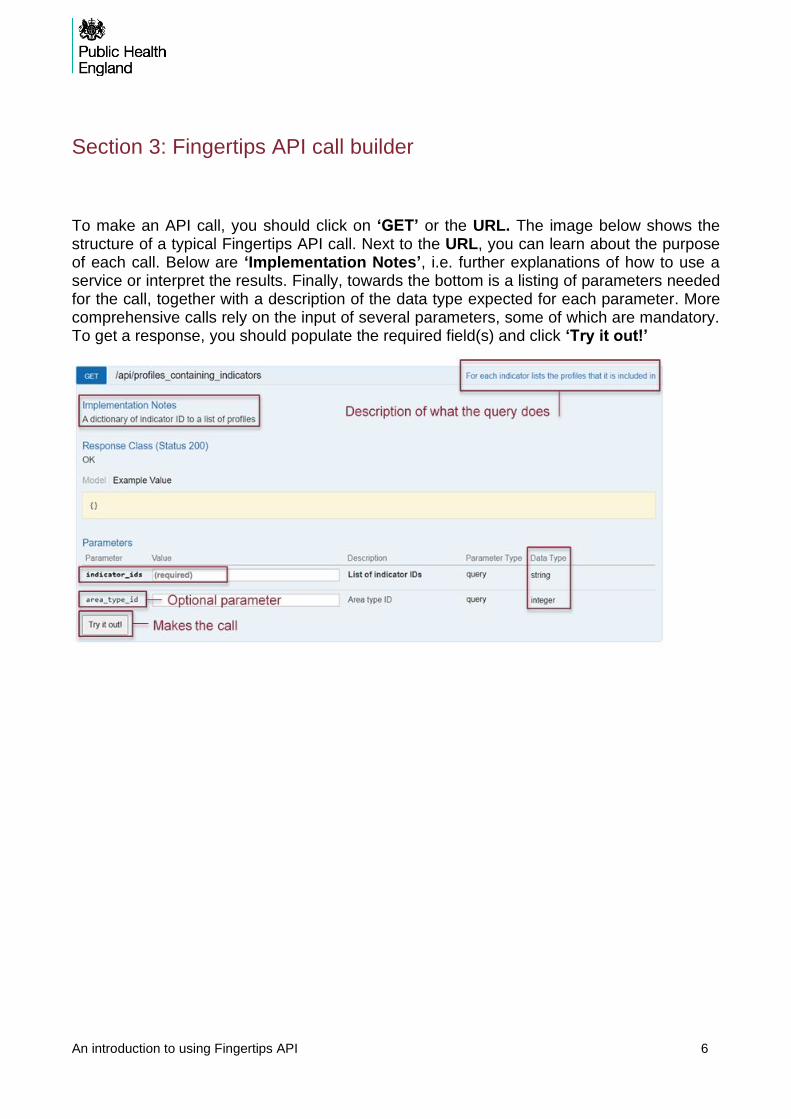
Section 3: Fingertips API call builder
To make an API call, you should click on ‘GET’ or the URL. The image below shows the structure of a typical Fingertips API call. Next to the URL, you can learn about the purpose of each call. Below are ‘Implementation Notes’, i.e. further explanations of how to use a service or interpret the results. Finally, towards the bottom is a listing of parameters needed for the call, together with a description of the data type expected for each parameter. More comprehensive calls rely on the input of several parameters, some of which are mandatory. To get a response, you should populate the required field(s) and click ‘Try it out!’

An introduction to using Fingertips API 7
Section 4: API call response to Excel By default, responses are presented as JSON data. More complex calls are likely to produce longer responses. In such cases, you may have to scroll down the response body or perform a text search (Ctrl + F) to find the information you require.
Just above the ‘Response body’ is a box containing the ‘Request URL’, representing the
database query.
4.1 Importing JSON data into Excel
You can import JSON response data directly into a spreadsheet by selecting (in Excel):
Data (1) -> From web (2) and then pasting the URL into the text box (3) and clicking ‘OK’ (4),
as in the example below:
A Power Query editor should open, where you will be able to convert source data into a table,
before importing the data into Excel or converting them to a range of cells (within Excel).
1
2
3
4

An introduction to using Fingertips API 8
4.2 Saving JSON responses as text files and importing into Excel
You can also choose to save JSON output as a text file and import it into Excel. To do that,
you should highlight and right-click on the ‘Request URL’ and open it in a new tab. You
should then select the data (Ctrl + A), copy them into a Notepad and save as a text file. To
import a text file into Excel, you should select Data (1) -> From Text/CSV (2). Same steps
can be applied when importing CSV files, e.g. downloaded from the Fingertips main site, into
Excel.
4.3 Importing data in other formats into Excel
The default format for API call returns is JSON. Contents of those responses are viewable in
the response body and can be imported into Excel according to the steps described above.
If no content is displayed in the response body, you should look at the ‘Implementation
Notes’ for explanation – in some cases (e.g. /api/all_data/csv/by_indicator_id), data are
returned as CSV and may not viewable on the call page. However, you can easily import
these data into Excel by following the steps detailed in Section 4.2.

An introduction to using Fingertips API 9
In case of an error message (see above), you should hit ‘Edit’ and, from the drop down,
choose to open the file as a CSV Document, then click ‘OK’. A preview of the data in the
correct format should then appear.
Alternatively, you can import CSV data using Power Query. To open the Editor, click (in
Excel): Data -> Get data -> From other sources -> Blank query. In the Editor, type in the
following syntax into the formula bar: = Csv.Document(Web.Contents(“Request URL”)).
The Editor should then automatically promote headers and transform column types, after
which a correctly formatted preview of the data should be displayed.
The steps above describe ways of importing API returns into Excel, as this is how users
frequently handle data available in Fingertips. While similar steps can be followed in products
from the MS suite (e.g. Power BI), it is beyond the scope of this guide to describe the process
of importing data into all other packages. If you are struggling to use our API to load data into
other software, please seek product-specific help in the first place.
Users more interested in programming may want to explore our bespoke packages (i.e.
fingertipsR and fingertips_py), which use the API to load data into R or Python for further
processing.

An introduction to using Fingertips API 10
Section 5: Retrieving public health data using Fingertips API
The aim of this section is to demonstrate how to retrieve public health data through Fingertips
API. This is achieved through a series of illustrated examples built around calls found in the
‘Data’ section of the API. This is the only section of the API from which indicator values can
be downloaded. Other sections can be used alongside the Annex to find parameters required
for more complex calls (see Section 6).
Example 1: Retrieving data for a specific indicator
Aim: Retrieve all available data for the percentage of individuals reporting a long-term
Musculoskeletal (MSK) problem, for the current generation of Lower Tier Local Authorities
(i.e. Districts & UAs), grouped by Region.

An introduction to using Fingertips API 11
Step 1: Find the relevant API call and see which parameters are required.
Step 2: Open the Annex and find identifiers for the required parameters:
• indicator_id: 93377
• child_area_type_id1: 401
• parent_area_type_id1: 6
Alternatively, you can view the selected indicator in Fingertips and extract these parameters
from the URL (see Section 2). To get the indicator_id, you can also see the ‘Definitions’ tab
on the main Fingertips site.
Step 3: Populate the call builder with required parameters and click ‘Try it out!’.
Step 4: Load data into Excel (see Section 4) or other software.
1 Identifiers for both area types can be found in the same sheet of the Annex (i.e. AreaTypeIDs).
Look at the response body, if no content is displayed check ‘Implementation Notes’ or the ‘Response Code’ for potential errors. In this case, the call returns data in a CSV format which is not viewable on this page.

An introduction to using Fingertips API 12
Example 2: Retrieving latest data for a group of indicators
Aim: Retrieve only the latest data, for all indicators in the ‘Practice Summary’ topic, for the
general practice located on 68A Portsmouth Road, Woolston, Southampton, SO19 9AN.
Step 1: Find the relevant API call and see which parameters are required.
Step 2: See which parameters you can get from the Annex and think where you could get
any of the missing parameters from (think of a Fingertips Profile most likely to contain this
information). Find the missing parameters.

An introduction to using Fingertips API 13
Step 3: Populate the call with the required parameters and click ‘Try it out!’.
Step 4: Load data into Excel (see Section 4) or other software.
This call returns data in a JSON format, therefore contents of the response are viewable on this page.
Practice code for the Old Fire Station Surgery, SO19 9AN.
An introduction to using Fingertips API 14
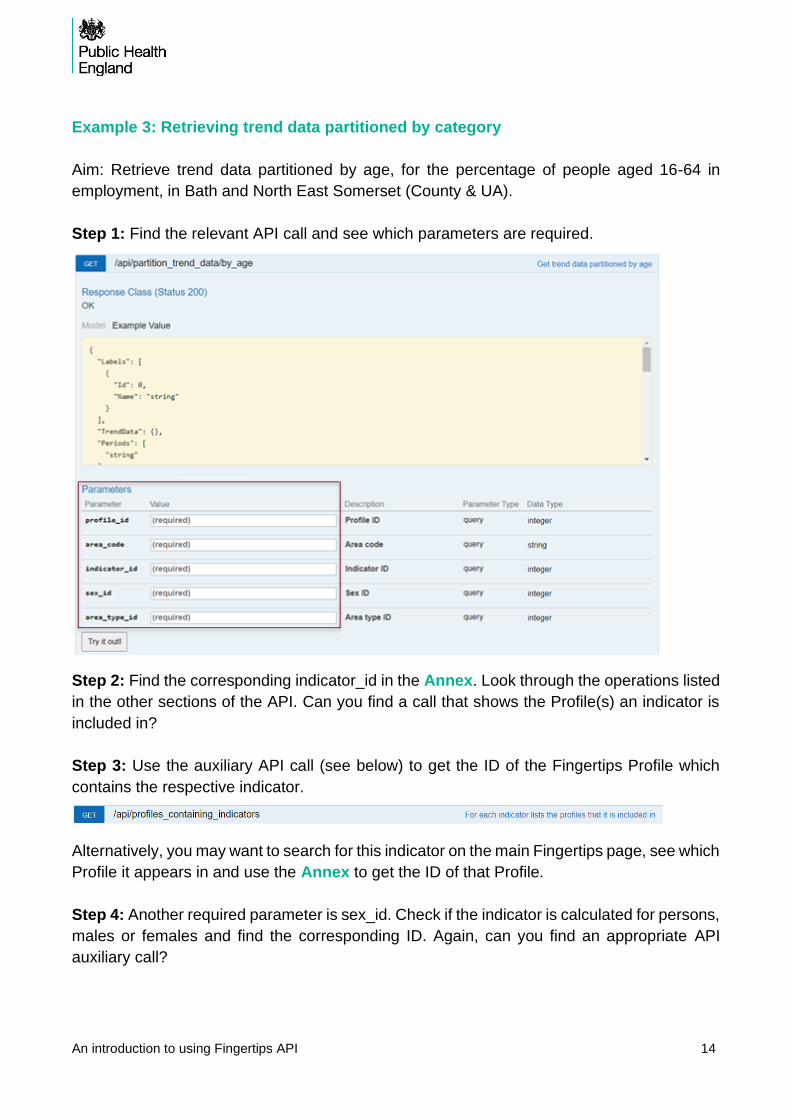
Example 3: Retrieving trend data partitioned by category
Aim: Retrieve trend data partitioned by age, for the percentage of people aged 16-64 in
employment, in Bath and North East Somerset (County & UA).
Step 1: Find the relevant API call and see which parameters are required.
Step 2: Find the corresponding indicator_id in the Annex. Look through the operations listed
in the other sections of the API. Can you find a call that shows the Profile(s) an indicator is
included in?
Step 3: Use the auxiliary API call (see below) to get the ID of the Fingertips Profile which
contains the respective indicator.
Alternatively, you may want to search for this indicator on the main Fingertips page, see which
Profile it appears in and use the Annex to get the ID of that Profile.
Step 4: Another required parameter is sex_id. Check if the indicator is calculated for persons,
males or females and find the corresponding ID. Again, can you find an appropriate API
auxiliary call?

An introduction to using Fingertips API 15
Step 5: Find the area_code for Bath and North East Somerset and use the Annex to look up
the correct area_type_id.
Step 6: Populate the call with the required parameters and click ‘Try it out!’.
Step 7: Import data into Excel (see Section 4) or other software.

An introduction to using Fingertips API 16
Section 6: Beyond basic API calls – Q&A
The aim of this section is to demonstrate the use of auxiliary operations to retrieve additional
parameters or facilitate the interpretation of API returns. If the return is long, you may need
to scroll down the screen or use the search facility (Ctrl + F) to find what you need in the
response body. By following these principles, you should be able to make more complex
‘Data’ requests using the API.
1. Can I get all the identifiers listed in the Annex using separate API calls?
Yes. For example, GET /api/profiles, listed under ‘Profiles’ on the main Fingertips API page,
returns the names and identifiers of all Fingertips Profiles, together with the identifiers of the
topics indicators are grouped into.
2. Can I extract data for indicators belonging to different Profiles in a single API call?
Yes. To do that, you should explore other operations listed in the ‘Data’ section of the API.
Data for multiple indicators can be retrieved in a single API call, as long as all are available
at a shared geography, for example Counties & UAs (4/20 – 3/21). Below are just two
examples of API calls that facilitate the retrieval of data for multiple indicators in a single
operation.
Profile_id

An introduction to using Fingertips API 17
3. Can I find the area_code if I know the area_type_id?
Yes. A list of area_type_ids is in the Annex (correct as at June 2021). For an up-to-date list
of area_type_ids, you can also explore GET /api/area_types. You can then use the
area_type_ids to populate the following call: GET /api/areas_by_area_type. The example
below returns ONS codes and names for all Combined Authorities in England.
4. My data download contains columns that I find hard to interpret. For example, what
does the age_id of 298 stand for?
Fingertips API, just like downloads from the main Fingertips site, returns significant amounts
of data which are not always easy to interpret. These often contain additional information
about an indicator, for example details of the age group for which an indicator is calculated.
To find out what does the age_id of 298 stand for, you can explore the result of the following
call: GET /api/ages. Here we can see that age_id of 298 corresponds to population aged
19 and over. You can access other lookup values (e.g. on how sex or polarity of an indicator
is encoded in Fingertips) via the ‘Entities’ section of the API.
ONS code for Greater Manchester Combined Authority

An introduction to using Fingertips API 18
5. Can I extract indicator metadata using the API, too?
Yes. To extract metadata for a single indicator in a CSV format, go to
GET /api/indicator_metadata/csv/by_indicator_id and populate the call with the identifier
of the indicator for which you want to retrieve the metadata. Other calls enable you to extract
metadata for a group of indicators or even an entire Profile. Since the service returns data in
CSV and not JSON format, the response is not viewable on the page and may need loading
into Excel or other software (see Section 4).
6. Why should I use Fingertips API?
Fingertips API offers more flexibility than other means of downloading data from Fingertips.
By embedding ‘Request URLs’ generated by the API, you can get real time data straight into
your interactive reports, e.g. in Power BI. Users more interested in programming do not need
to make API calls via the browser. Instead, they can connect to the API from within a
programming environment via our dedicated packages: fingertipsR (R users) and
fingertips_py (Python users).
Contact us
Your feedback helps us improve the quality of our products and services. Please contact us
at [email protected] if you have any questions or comments about this guide or
the API itself.
Version control
Version Author Date Notes
1.0 Maciej Dobras June 2021 First version

An introduction to using Fingertips API 19
Section 7: Annex This Annex contains the identifiers for the key parameters that are needed to make ‘Data’
calls using Fingertips API. It is a set of four lookup tables that cover:
• Fingertips Profiles (ProfileIDs)
• Topics within Fingertips Profiles (GroupIds)
• Indicators (IndicatorIDs)
• Area types (AreaTypeIDs)
To find out unique identifiers for other parameters (e.g. age, sex, etc.), please explore the
‘Entities’ section of the API. These resources should give you enough guidance to perform
most tasks with the API. The Annex can be accessed here.
Please contact us at [email protected] if you have any comments or
suggestions for improvements to this material.