health care and social assistance industry sector -- what...
TRANSCRIPT
Health Care and Social Assistance industry sector -- What does the future hold for South Dakota?
Projections indicate the health care industry, thanks mostly to an aging population and longer life expectancies, will continue its strong employment growth in South Dakota's future. This growth will affect not only the Health Care and Social Assistance industry sector, but also industries outside of the sector.
This analysis focuses on the subsectors within the Health Care and Social Assistance industry sector. The subsectors within this sector are all projected to show a relatively high rate of employment growth based on long-term employment projections data produced by LMIC. The projections data, which includes both industry and occupational data, is available on the Labor Market Information Center's (LMIC) website. This data is often referenced for planning future training needs related to the expected demand for workers, aiding in workforce recruiting efforts, and analyzing occupational supply/demand.
This analysis also forecasts the economic impact related to the projected employment growth for the Health Care and Social Assistance sector. When industry sectors experience a significant increase or decrease inemployment, the use of modeling software proves helpful in determining the related economic impact. This type of analysis identifies the primary, as well as the far reaching ripple effects of on other industries, which impact a local or regional economy.
LMIC utilizes IMPLAN (economic impact analysis) software for research purposes. This software uses a model to estimate the impact of growth or expansion within industry sectors. A common use of IMPLAN is to measure the effects of an expected economic change in a regional or local economy.
March 2015
Labor Market Information Center SD Department of Labor & Regulation
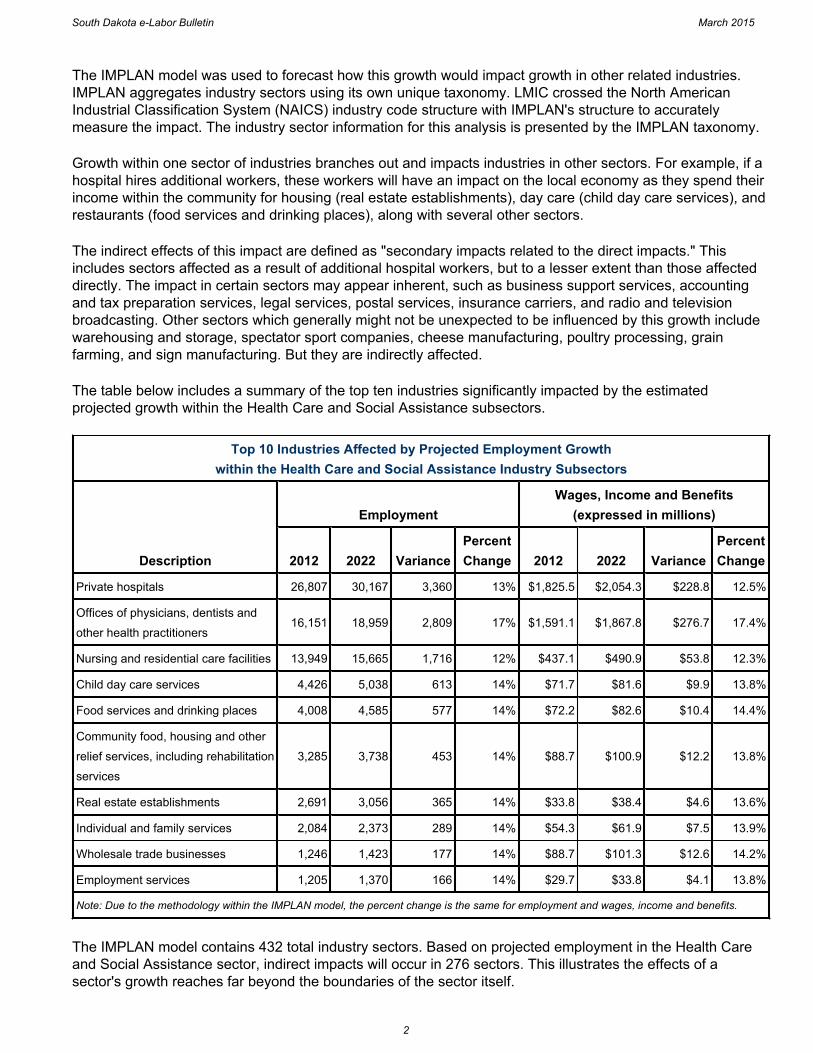
Employment Projections forSouth Dakota's Health Care and Social Assistance Industry Sector
2012 to 2022
Industry2012
Workers2022
WorkersActual
ChangePercent Change
Ambulatory Health Care Services 14,910 17,540 2,630 17.6%
Hospitals 25,065 28,175 3,110 12.4%
Nursing and Residential Care Facilities 12,900 14,465 1,565 12.1%
Social Assistance 8,830 10,045 1,215 13.8%
Total 61,705 70,225 8,520 13.8%
South Dakota e-Labor Bulletin March 2015
1
The IMPLAN model was used to forecast how this growth would impact growth in other related industries. IMPLAN aggregates industry sectors using its own unique taxonomy. LMIC crossed the North American Industrial Classification System (NAICS) industry code structure with IMPLAN's structure to accurately measure the impact. The industry sector information for this analysis is presented by the IMPLAN taxonomy.
Growth within one sector of industries branches out and impacts industries in other sectors. For example, if a hospital hires additional workers, these workers will have an impact on the local economy as they spend their income within the community for housing (real estate establishments), day care (child day care services), and restaurants (food services and drinking places), along with several other sectors.
The indirect effects of this impact are defined as "secondary impacts related to the direct impacts." This includes sectors affected as a result of additional hospital workers, but to a lesser extent than those affected directly. The impact in certain sectors may appear inherent, such as business support services, accounting and tax preparation services, legal services, postal services, insurance carriers, and radio and television broadcasting. Other sectors which generally might not be unexpected to be influenced by this growth includewarehousing and storage, spectator sport companies, cheese manufacturing, poultry processing, grain farming, and sign manufacturing. But they are indirectly affected.
The table below includes a summary of the top ten industries significantly impacted by the estimated projected growth within the Health Care and Social Assistance subsectors.
The IMPLAN model contains 432 total industry sectors. Based on projected employment in the Health Care and Social Assistance sector, indirect impacts will occur in 276 sectors. This illustrates the effects of a sector's growth reaches far beyond the boundaries of the sector itself.
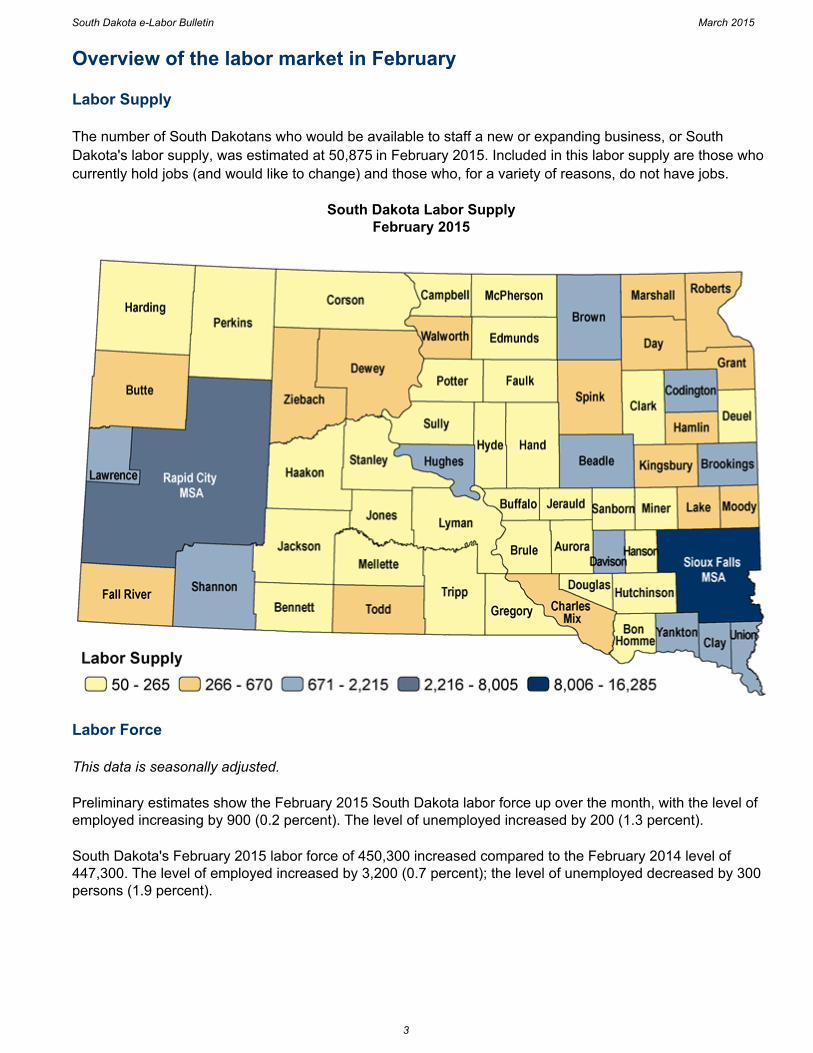
Top 10 Industries Affected by Projected Employment Growth within the Health Care and Social Assistance Industry Subsectors
Description
EmploymentWages, Income and Benefits
(expressed in millions)
2012 2022 VariancePercentChange 2012 2022 Variance
PercentChange
Private hospitals 26,807 30,167 3,360 13% $1,825.5 $2,054.3 $228.8 12.5%
Offices of physicians, dentists and
other health practitioners16,151 18,959 2,809 17% $1,591.1 $1,867.8 $276.7 17.4%
Nursing and residential care facilities 13,949 15,665 1,716 12% $437.1 $490.9 $53.8 12.3%
Child day care services 4,426 5,038 613 14% $71.7 $81.6 $9.9 13.8%
Food services and drinking places 4,008 4,585 577 14% $72.2 $82.6 $10.4 14.4%
Community food, housing and other
relief services, including rehabilitation
services
3,285 3,738 453 14% $88.7 $100.9 $12.2 13.8%
Real estate establishments 2,691 3,056 365 14% $33.8 $38.4 $4.6 13.6%
Individual and family services 2,084 2,373 289 14% $54.3 $61.9 $7.5 13.9%
Wholesale trade businesses 1,246 1,423 177 14% $88.7 $101.3 $12.6 14.2%
Employment services 1,205 1,370 166 14% $29.7 $33.8 $4.1 13.8%
Note: Due to the methodology within the IMPLAN model, the percent change is the same for employment and wages, income and benefits.
South Dakota e-Labor Bulletin March 2015
2
Overview of the labor market in February
Labor Supply
The number of South Dakotans who would be available to staff a new or expanding business, or SouthDakota's labor supply, was estimated at 50,875 in February 2015. Included in this labor supply are those whocurrently hold jobs (and would like to change) and those who, for a variety of reasons, do not have jobs.
South Dakota Labor SupplyFebruary 2015
Labor Force
This data is seasonally adjusted.
Preliminary estimates show the February 2015 South Dakota labor force up over the month, with the level of employed increasing by 900 (0.2 percent). The level of unemployed increased by 200 (1.3 percent).
South Dakota's February 2015 labor force of 450,300 increased compared to the February 2014 level of 447,300. The level of employed increased by 3,200 (0.7 percent); the level of unemployed decreased by 300 persons (1.9 percent).
South Dakota e-Labor Bulletin March 2015
3
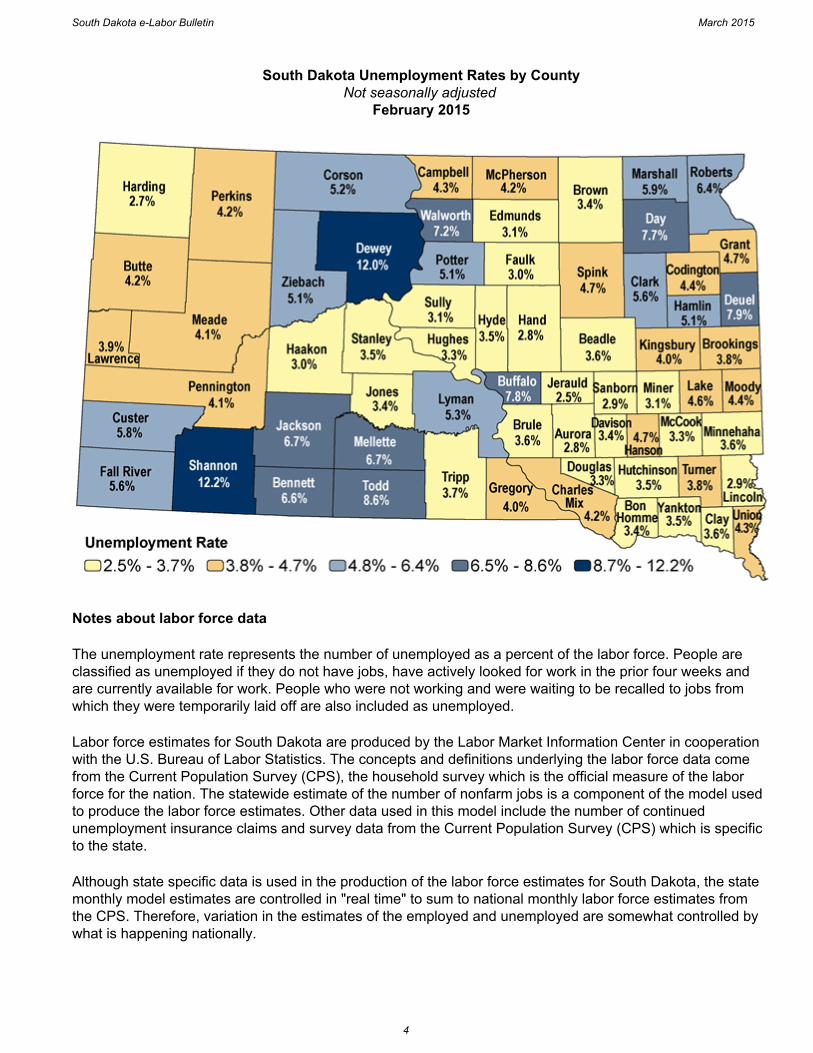
South Dakota Unemployment Rates by CountyNot seasonally adjusted
February 2015
Notes about labor force data
The unemployment rate represents the number of unemployed as a percent of the labor force. People are classified as unemployed if they do not have jobs, have actively looked for work in the prior four weeks and are currently available for work. People who were not working and were waiting to be recalled to jobs from which they were temporarily laid off are also included as unemployed.
Labor force estimates for South Dakota are produced by the Labor Market Information Center in cooperation with the U.S. Bureau of Labor Statistics. The concepts and definitions underlying the labor force data come from the Current Population Survey (CPS), the household survey which is the official measure of the labor force for the nation. The statewide estimate of the number of nonfarm jobs is a component of the model used to produce the labor force estimates. Other data used in this model include the number of continued unemployment insurance claims and survey data from the Current Population Survey (CPS) which is specific to the state.
Although state specific data is used in the production of the labor force estimates for South Dakota, the state monthly model estimates are controlled in "real time" to sum to national monthly labor force estimates fromthe CPS. Therefore, variation in the estimates of the employed and unemployed are somewhat controlled by what is happening nationally.
South Dakota e-Labor Bulletin March 2015
4
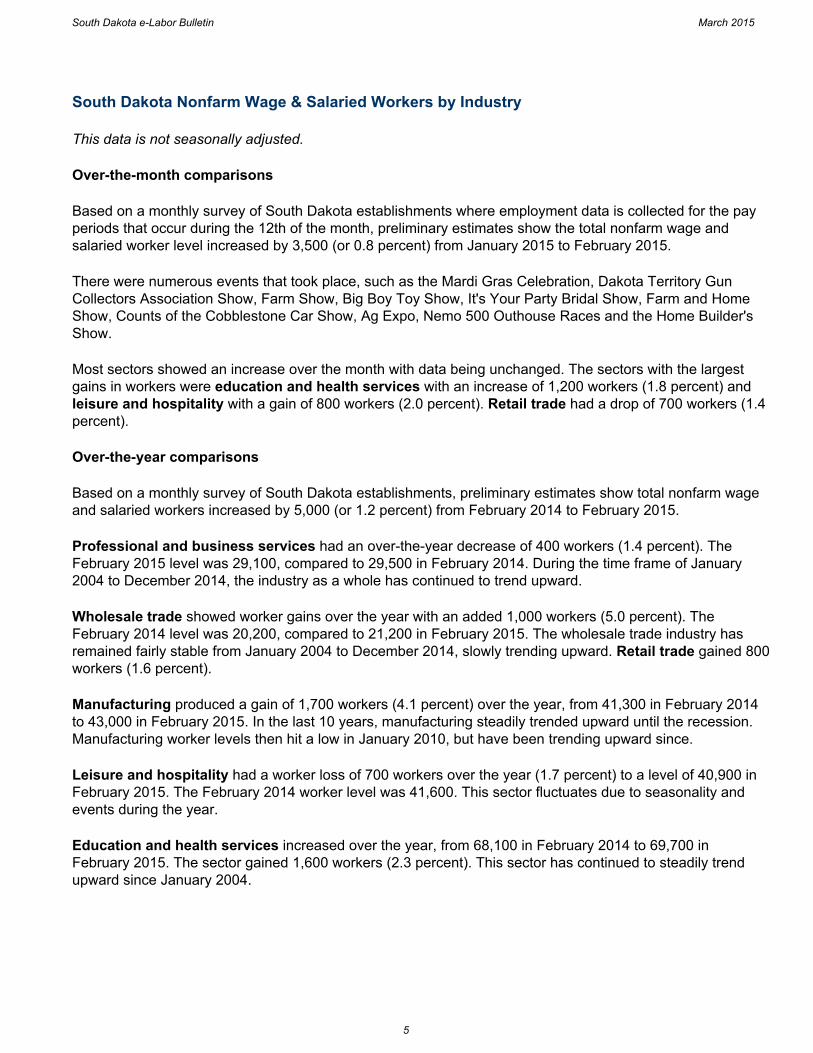
South Dakota Nonfarm Wage & Salaried Workers by Industry
This data is not seasonally adjusted.
Over-the-month comparisons
Based on a monthly survey of South Dakota establishments where employment data is collected for the pay periods that occur during the 12th of the month, preliminary estimates show the total nonfarm wage and salaried worker level increased by 3,500 (or 0.8 percent) from January 2015 to February 2015.
There were numerous events that took place, such as the Mardi Gras Celebration, Dakota Territory Gun Collectors Association Show, Farm Show, Big Boy Toy Show, It's Your Party Bridal Show, Farm and Home Show, Counts of the Cobblestone Car Show, Ag Expo, Nemo 500 Outhouse Races and the Home Builder's Show.
Most sectors showed an increase over the month with data being unchanged. The sectors with the largest gains in workers were education and health services with an increase of 1,200 workers (1.8 percent) and leisure and hospitality with a gain of 800 workers (2.0 percent). Retail trade had a drop of 700 workers (1.4 percent).
Over-the-year comparisons
Based on a monthly survey of South Dakota establishments, preliminary estimates show total nonfarm wage and salaried workers increased by 5,000 (or 1.2 percent) from February 2014 to February 2015.
Professional and business services had an over-the-year decrease of 400 workers (1.4 percent). The February 2015 level was 29,100, compared to 29,500 in February 2014. During the time frame of January 2004 to December 2014, the industry as a whole has continued to trend upward.
Wholesale trade showed worker gains over the year with an added 1,000 workers (5.0 percent). The February 2014 level was 20,200, compared to 21,200 in February 2015. The wholesale trade industry has remained fairly stable from January 2004 to December 2014, slowly trending upward. Retail trade gained 800 workers (1.6 percent).
Manufacturing produced a gain of 1,700 workers (4.1 percent) over the year, from 41,300 in February 2014 to 43,000 in February 2015. In the last 10 years, manufacturing steadily trended upward until the recession. Manufacturing worker levels then hit a low in January 2010, but have been trending upward since.
Leisure and hospitality had a worker loss of 700 workers over the year (1.7 percent) to a level of 40,900 in February 2015. The February 2014 worker level was 41,600. This sector fluctuates due to seasonality and events during the year.
Education and health services increased over the year, from 68,100 in February 2014 to 69,700 in February 2015. The sector gained 1,600 workers (2.3 percent). This sector has continued to steadily trend upward since January 2004.
South Dakota e-Labor Bulletin March 2015
5
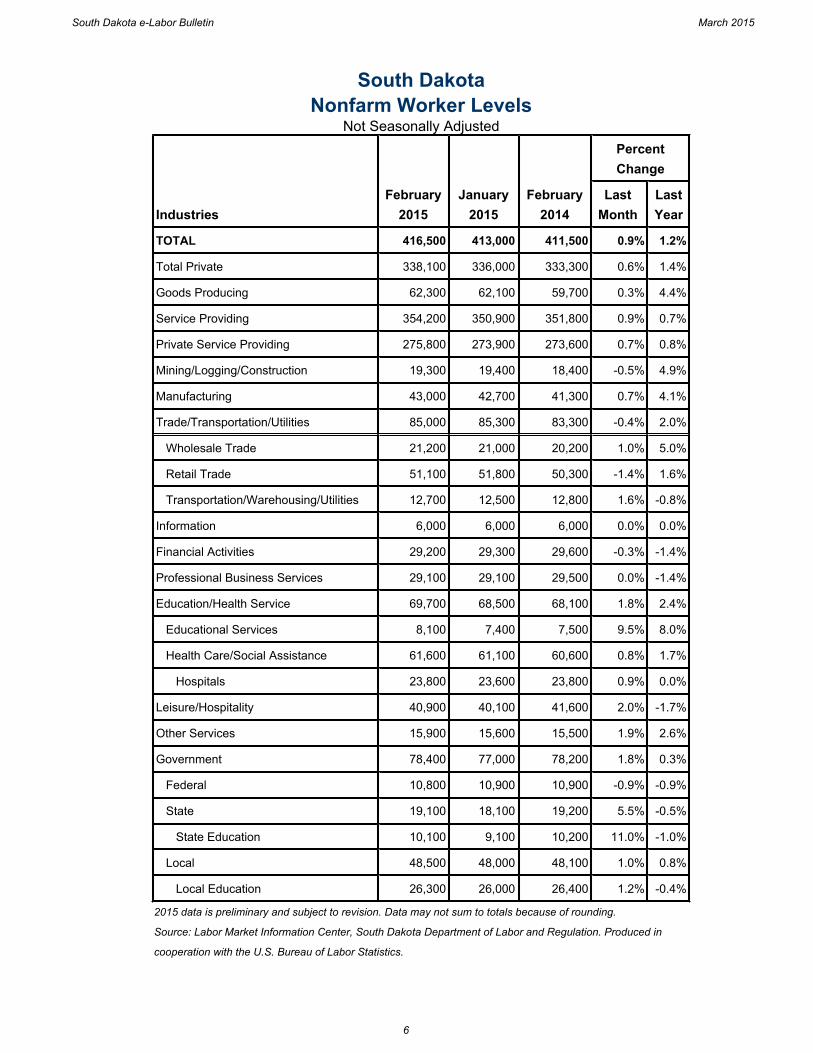
South DakotaNonfarm Worker Levels
Not Seasonally Adjusted
IndustriesFebruary
2015January
2015February
2014
PercentChange
Last Month
LastYear
TOTAL 416,500 413,000 411,500 0.9% 1.2%
Total Private 338,100 336,000 333,300 0.6% 1.4%
Goods Producing 62,300 62,100 59,700 0.3% 4.4%
Service Providing 354,200 350,900 351,800 0.9% 0.7%
Private Service Providing 275,800 273,900 273,600 0.7% 0.8%
Mining/Logging/Construction 19,300 19,400 18,400 -0.5% 4.9%
Manufacturing 43,000 42,700 41,300 0.7% 4.1%
Trade/Transportation/Utilities 85,000 85,300 83,300 -0.4% 2.0%
Wholesale Trade 21,200 21,000 20,200 1.0% 5.0%
Retail Trade 51,100 51,800 50,300 -1.4% 1.6%
Transportation/Warehousing/Utilities 12,700 12,500 12,800 1.6% -0.8%
Information 6,000 6,000 6,000 0.0% 0.0%
Financial Activities 29,200 29,300 29,600 -0.3% -1.4%
Professional Business Services 29,100 29,100 29,500 0.0% -1.4%
Education/Health Service 69,700 68,500 68,100 1.8% 2.4%
Educational Services 8,100 7,400 7,500 9.5% 8.0%
Health Care/Social Assistance 61,600 61,100 60,600 0.8% 1.7%
Hospitals 23,800 23,600 23,800 0.9% 0.0%
Leisure/Hospitality 40,900 40,100 41,600 2.0% -1.7%
Other Services 15,900 15,600 15,500 1.9% 2.6%
Government 78,400 77,000 78,200 1.8% 0.3%
Federal 10,800 10,900 10,900 -0.9% -0.9%
State 19,100 18,100 19,200 5.5% -0.5%
State Education 10,100 9,100 10,200 11.0% -1.0%
Local 48,500 48,000 48,100 1.0% 0.8%
Local Education 26,300 26,000 26,400 1.2% -0.4%
2015 data is preliminary and subject to revision. Data may not sum to totals because of rounding.
Source: Labor Market Information Center, South Dakota Department of Labor and Regulation. Produced in
cooperation with the U.S. Bureau of Labor Statistics.
South Dakota e-Labor Bulletin March 2015
6
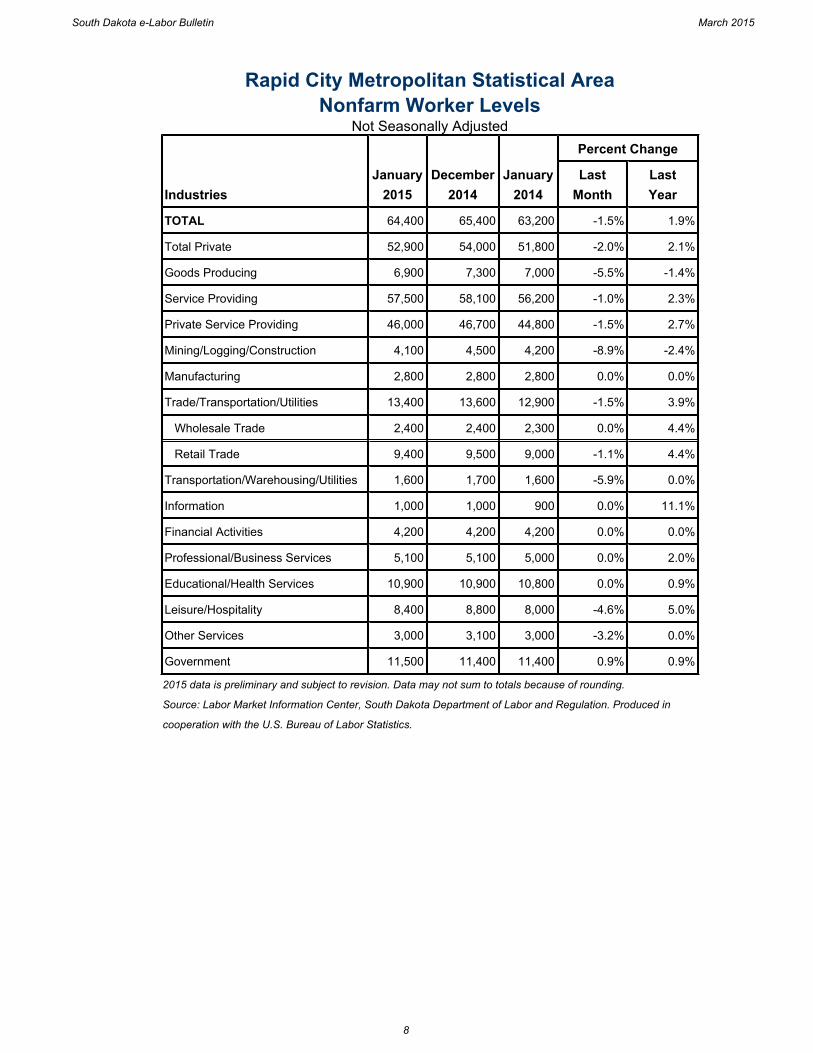
Rapid City Metropolitan Statistical AreaNonfarm Worker Levels
Not Seasonally Adjusted
IndustriesJanuary
2015December
2014January
2014
Percent Change
LastMonth
LastYear
TOTAL 64,400 65,400 63,200 -1.5% 1.9%
Total Private 52,900 54,000 51,800 -2.0% 2.1%
Goods Producing 6,900 7,300 7,000 -5.5% -1.4%
Service Providing 57,500 58,100 56,200 -1.0% 2.3%
Private Service Providing 46,000 46,700 44,800 -1.5% 2.7%
Mining/Logging/Construction 4,100 4,500 4,200 -8.9% -2.4%
Manufacturing 2,800 2,800 2,800 0.0% 0.0%
Trade/Transportation/Utilities 13,400 13,600 12,900 -1.5% 3.9%
Wholesale Trade 2,400 2,400 2,300 0.0% 4.4%
Retail Trade 9,400 9,500 9,000 -1.1% 4.4%
Transportation/Warehousing/Utilities 1,600 1,700 1,600 -5.9% 0.0%
Information 1,000 1,000 900 0.0% 11.1%
Financial Activities 4,200 4,200 4,200 0.0% 0.0%
Professional/Business Services 5,100 5,100 5,000 0.0% 2.0%
Educational/Health Services 10,900 10,900 10,800 0.0% 0.9%
Leisure/Hospitality 8,400 8,800 8,000 -4.6% 5.0%
Other Services 3,000 3,100 3,000 -3.2% 0.0%
Government 11,500 11,400 11,400 0.9% 0.9%
2015 data is preliminary and subject to revision. Data may not sum to totals because of rounding.
Source: Labor Market Information Center, South Dakota Department of Labor and Regulation. Produced in
cooperation with the U.S. Bureau of Labor Statistics.
South Dakota e-Labor Bulletin March 2015
8

Sioux Falls Metropolitan Statistical AreaNonfarm Worker Levels
Not Seasonally Adjusted
IndustriesFebruary
2015January
2015February
2014
Percent Change
Last Month
LastYear
TOTAL 144,900 144,100 143,500 0.6% 1.0%
Total Private 131,600 131,000 130,300 0.5% 1.0%
Goods Producing 20,900 20,600 19,900 1.5% 5.0%
Service Providing 124,000 123,500 123,600 0.4% 0.3%
Private Service Providing 110,700 110,400 110,400 0.3% 0.3%
Mining/Logging/Construction 7,000 6,800 6,400 2.9% 9.4%
Manufacturing 13,900 13,800 13,500 0.7% 3.0%
Trade/Transportation/Utilities 31,800 31,900 30,500 -0.3% 4.3%
Wholesale Trade 8,100 8,100 7,800 0.0% 3.9%
Retail Trade 18,400 18,500 17,500 -0.5% 5.1%
Transportation/Warehousing/Utilities 5,300 5,300 5,200 0.0% 1.9%
Information 2,700 2,700 2,700 0.0% 0.0%
Financial Activities 16,000 16,000 16,100 0.0% -0.6%
Professional/Business Services 12,700 12,900 13,500 -1.6% -5.9%
Educational/Health Services 29,900 29,500 29,400 1.4% 1.7%
Leisure/Hospitality 12,800 12,700 13,400 0.8% -4.5%
Other Services 4,800 4,700 4,800 2.1% 0.0%
Government 13,300 13,100 13,200 1.5% 0.8%
2015 data is preliminary and subject to revision. Data may not sum to totals because of rounding.
Source: Labor Market Information Center, South Dakota Department of Labor and Regulation. Produced in
cooperation with the U.S. Bureau of Labor Statistics.
South Dakota e-Labor Bulletin March 2015
10
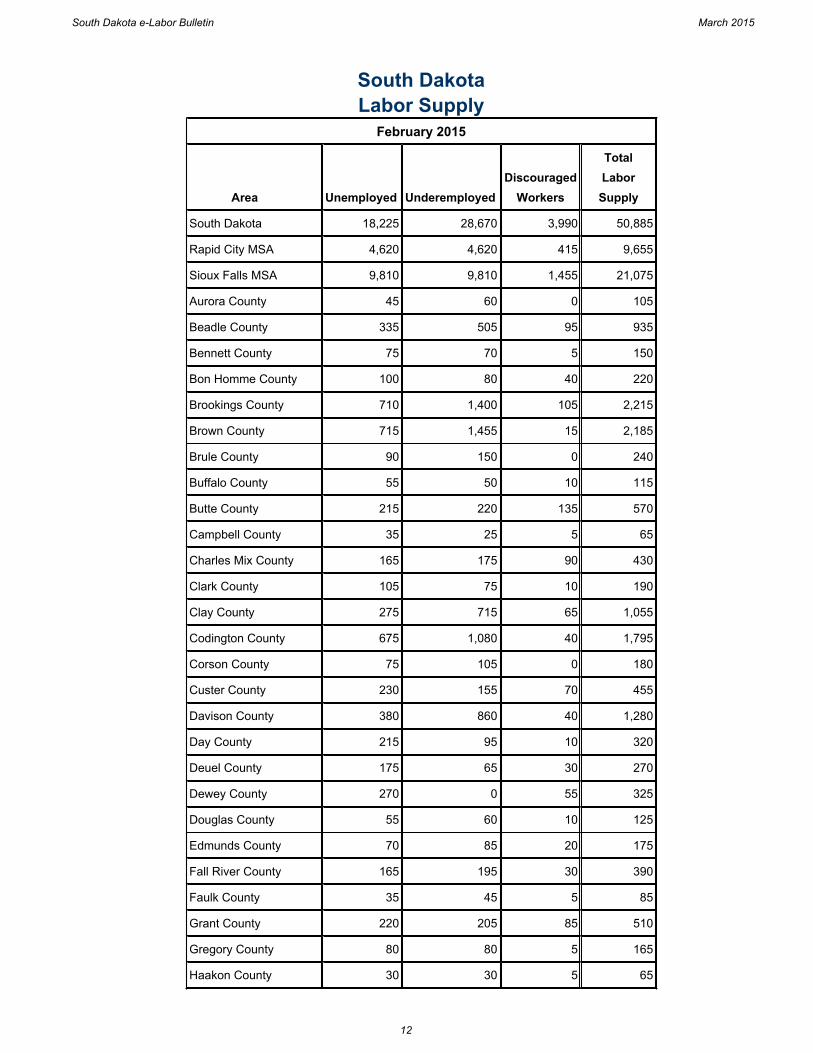
South DakotaLabor Supply
February 2015
Area Unemployed UnderemployedDiscouraged
Workers
TotalLaborSupply
South Dakota 18,225 28,670 3,990 50,885
Rapid City MSA 4,620 4,620 415 9,655
Sioux Falls MSA 9,810 9,810 1,455 21,075
Aurora County 45 60 0 105
Beadle County 335 505 95 935
Bennett County 75 70 5 150
Bon Homme County 100 80 40 220
Brookings County 710 1,400 105 2,215
Brown County 715 1,455 15 2,185
Brule County 90 150 0 240
Buffalo County 55 50 10 115
Butte County 215 220 135 570
Campbell County 35 25 5 65
Charles Mix County 165 175 90 430
Clark County 105 75 10 190
Clay County 275 715 65 1,055
Codington County 675 1,080 40 1,795
Corson County 75 105 0 180
Custer County 230 155 70 455
Davison County 380 860 40 1,280
Day County 215 95 10 320
Deuel County 175 65 30 270
Dewey County 270 0 55 325
Douglas County 55 60 10 125
Edmunds County 70 85 20 175
Fall River County 165 195 30 390
Faulk County 35 45 5 85
Grant County 220 205 85 510
Gregory County 80 80 5 165
Haakon County 30 30 5 65
South Dakota e-Labor Bulletin March 2015
12

South Dakota Labor Supply, continuedFebruary 2015
Area Unemployed UnderemployedDiscouraged
WorkersTotal
Labor Supply
Hamlin County 160 110 65 335
Hand County 50 70 5 125
Hanson County 85 25 20 130
Harding County 20 30 5 55
Hughes County 335 755 195 1,285
Hutchinson County 125 130 5 260
Hyde County 25 25 5 55
Jackson County 80 45 50 175
Jerauld County 30 75 10 115
Jones County 20 25 5 50
Kingsbury County 115 130 90 335
Lake County 290 300 45 635
Lawrence County 495 885 35 1,415
Lincoln County 865 1,475 30 2,370
Lyman County 90 115 0 205
McCook County 105 90 25 220
McPherson County 45 30 5 80
Marshall County 145 105 60 310
Meade County 560 455 100 1,115
Mellette County 55 25 0 80
Miner County 35 30 20 85
Minnehaha County 3,870 8,120 1,375 13,365
Moody County 170 120 0 290
Pennington County 2,180 4,010 245 6,435
Perkins County 65 60 0 125
Potter County 60 40 15 115
Roberts County 315 240 120 675
Sanborn County 35 40 5 80
Shannon County 440 445 155 1,040
Spink County 155 155 20 330
Stanley County 65 100 10 175
Sully County 25 30 5 60
South Dakota e-Labor Bulletin March 2015
13
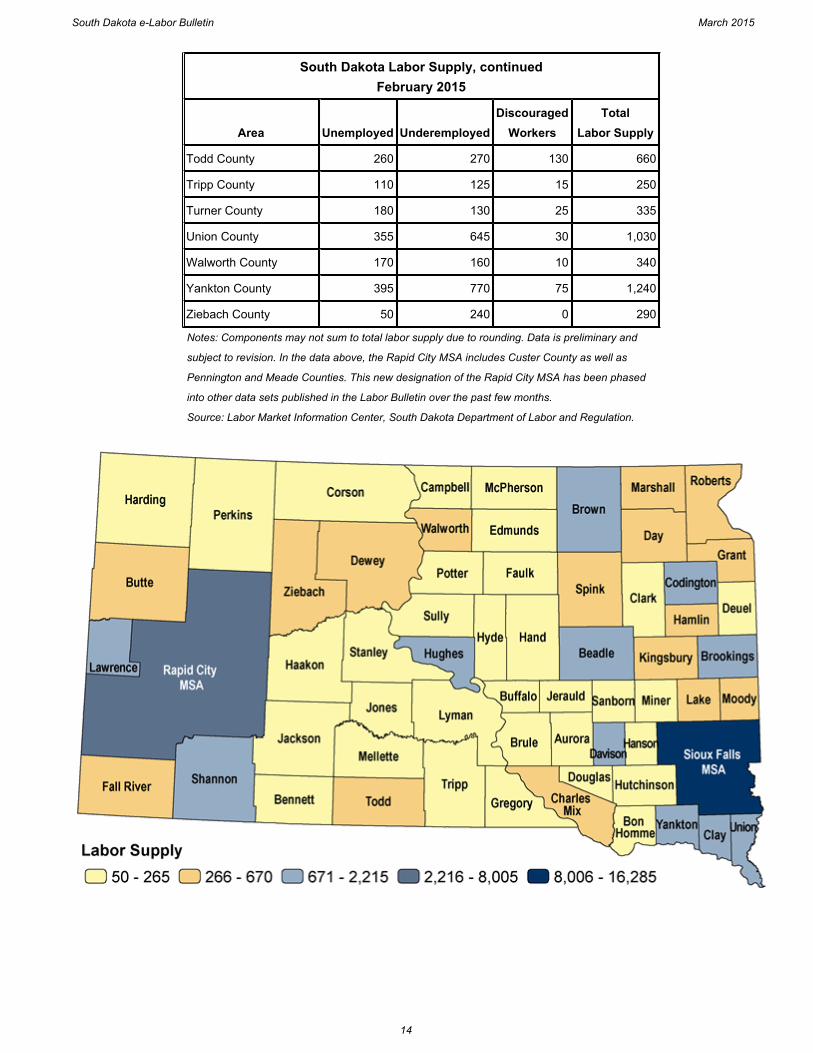
South Dakota Labor Supply, continuedFebruary 2015
Area Unemployed UnderemployedDiscouraged
WorkersTotal
Labor Supply
Todd County 260 270 130 660
Tripp County 110 125 15 250
Turner County 180 130 25 335
Union County 355 645 30 1,030
Walworth County 170 160 10 340
Yankton County 395 770 75 1,240
Ziebach County 50 240 0 290
Notes: Components may not sum to total labor supply due to rounding. Data is preliminary and
subject to revision. In the data above, the Rapid City MSA includes Custer County as well as
Pennington and Meade Counties. This new designation of the Rapid City MSA has been phased
into other data sets published in the Labor Bulletin over the past few months.
Source: Labor Market Information Center, South Dakota Department of Labor and Regulation.
South Dakota e-Labor Bulletin March 2015
14

United States and South DakotaLabor Force
Seasonally AdjustedFebruary 2015 February 2014
Area Labor Force Employed Unemployed Rate Labor Force Employed Unemployed Rate
United States 157,002,000 148,297,000 8,705,000 5.5% 155,688,000 145,301,000 10,387,000 6.7%
South Dakota 450,300 435,000 15,300 3.4% 447,300 431,800 15,600 3.5%
2015 data is preliminary and subject to revision. Data may not sum to totals because of rounding.
Source: Labor Market Information Center, South Dakota Department of Labor and Regulation. Produced in cooperation with the U.S. Bureau
of Labor Statistics.
South Dakota e-Labor Bulletin March 2015
15
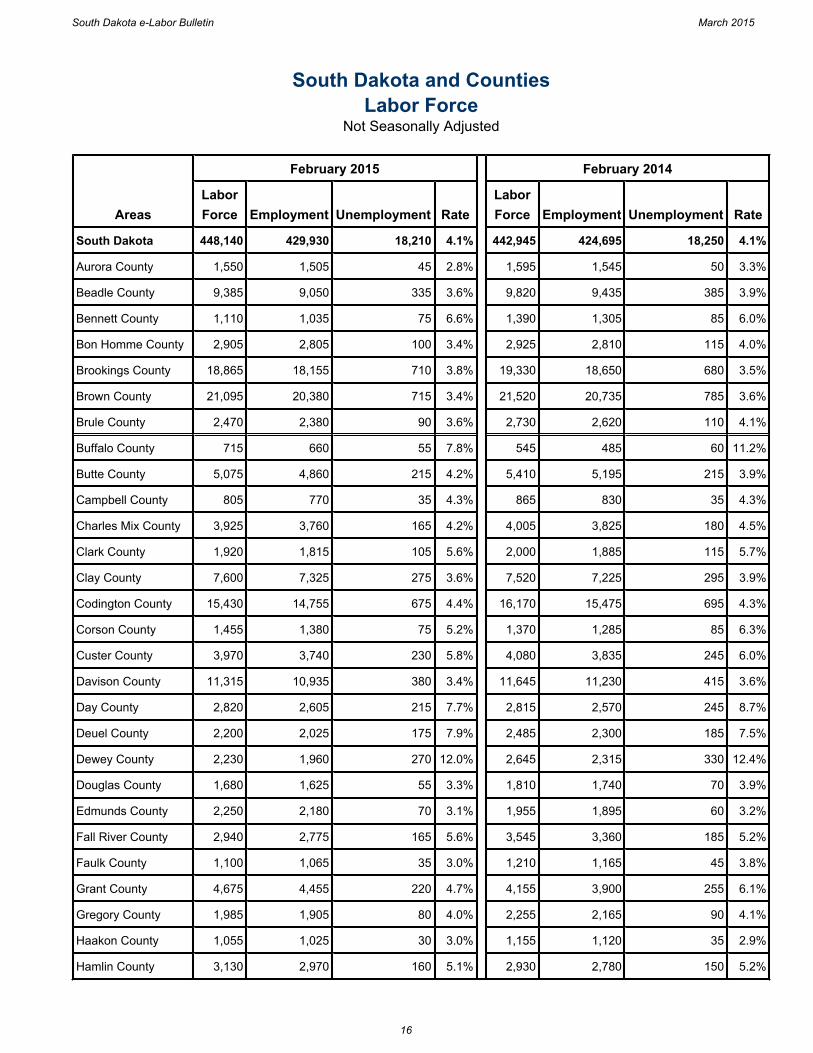
South Dakota and CountiesLabor Force
Not Seasonally Adjusted
Areas
February 2015 February 2014
Labor Force Employment Unemployment Rate
Labor Force Employment Unemployment Rate
South Dakota 448,140 429,930 18,210 4.1% 442,945 424,695 18,250 4.1%
Aurora County 1,550 1,505 45 2.8% 1,595 1,545 50 3.3%
Beadle County 9,385 9,050 335 3.6% 9,820 9,435 385 3.9%
Bennett County 1,110 1,035 75 6.6% 1,390 1,305 85 6.0%
Bon Homme County 2,905 2,805 100 3.4% 2,925 2,810 115 4.0%
Brookings County 18,865 18,155 710 3.8% 19,330 18,650 680 3.5%
Brown County 21,095 20,380 715 3.4% 21,520 20,735 785 3.6%
Brule County 2,470 2,380 90 3.6% 2,730 2,620 110 4.1%
Buffalo County 715 660 55 7.8% 545 485 60 11.2%
Butte County 5,075 4,860 215 4.2% 5,410 5,195 215 3.9%
Campbell County 805 770 35 4.3% 865 830 35 4.3%
Charles Mix County 3,925 3,760 165 4.2% 4,005 3,825 180 4.5%
Clark County 1,920 1,815 105 5.6% 2,000 1,885 115 5.7%
Clay County 7,600 7,325 275 3.6% 7,520 7,225 295 3.9%
Codington County 15,430 14,755 675 4.4% 16,170 15,475 695 4.3%
Corson County 1,455 1,380 75 5.2% 1,370 1,285 85 6.3%
Custer County 3,970 3,740 230 5.8% 4,080 3,835 245 6.0%
Davison County 11,315 10,935 380 3.4% 11,645 11,230 415 3.6%
Day County 2,820 2,605 215 7.7% 2,815 2,570 245 8.7%
Deuel County 2,200 2,025 175 7.9% 2,485 2,300 185 7.5%
Dewey County 2,230 1,960 270 12.0% 2,645 2,315 330 12.4%
Douglas County 1,680 1,625 55 3.3% 1,810 1,740 70 3.9%
Edmunds County 2,250 2,180 70 3.1% 1,955 1,895 60 3.2%
Fall River County 2,940 2,775 165 5.6% 3,545 3,360 185 5.2%
Faulk County 1,100 1,065 35 3.0% 1,210 1,165 45 3.8%
Grant County 4,675 4,455 220 4.7% 4,155 3,900 255 6.1%
Gregory County 1,985 1,905 80 4.0% 2,255 2,165 90 4.1%
Haakon County 1,055 1,025 30 3.0% 1,155 1,120 35 2.9%
Hamlin County 3,130 2,970 160 5.1% 2,930 2,780 150 5.2%
South Dakota e-Labor Bulletin March 2015
16
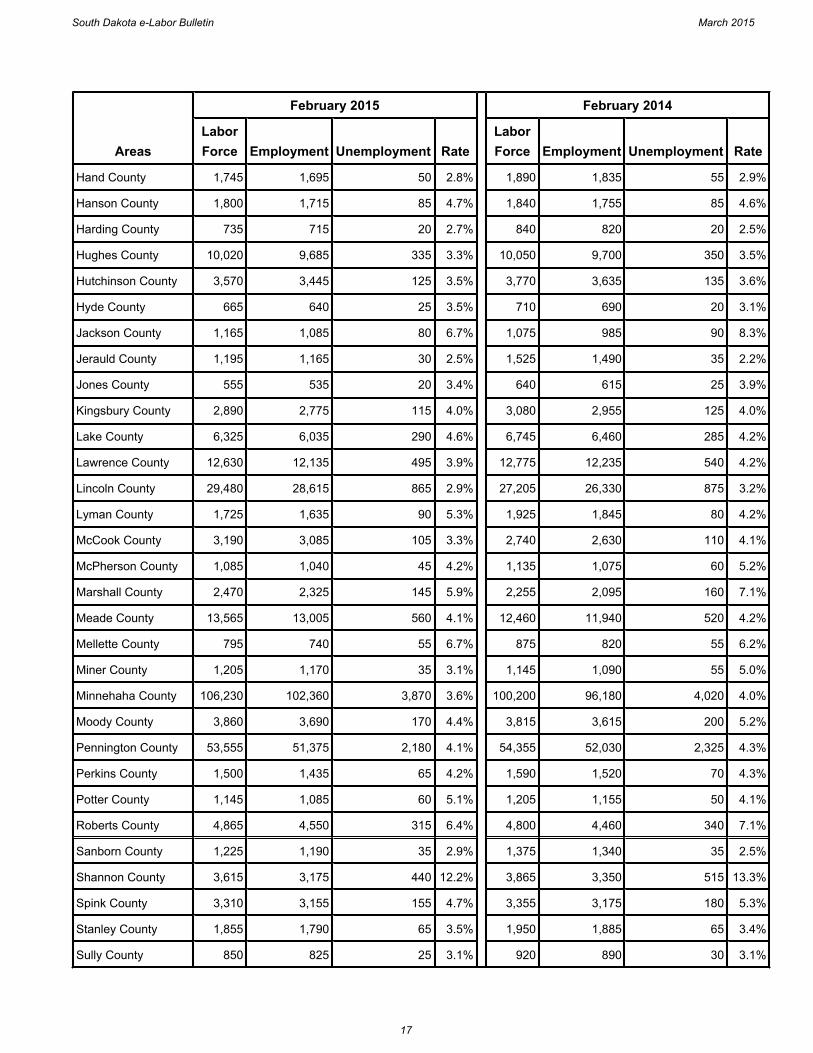
Areas
February 2015 February 2014
Labor Force Employment Unemployment Rate
Labor Force Employment Unemployment Rate
Hand County 1,745 1,695 50 2.8% 1,890 1,835 55 2.9%
Hanson County 1,800 1,715 85 4.7% 1,840 1,755 85 4.6%
Harding County 735 715 20 2.7% 840 820 20 2.5%
Hughes County 10,020 9,685 335 3.3% 10,050 9,700 350 3.5%
Hutchinson County 3,570 3,445 125 3.5% 3,770 3,635 135 3.6%
Hyde County 665 640 25 3.5% 710 690 20 3.1%
Jackson County 1,165 1,085 80 6.7% 1,075 985 90 8.3%
Jerauld County 1,195 1,165 30 2.5% 1,525 1,490 35 2.2%
Jones County 555 535 20 3.4% 640 615 25 3.9%
Kingsbury County 2,890 2,775 115 4.0% 3,080 2,955 125 4.0%
Lake County 6,325 6,035 290 4.6% 6,745 6,460 285 4.2%
Lawrence County 12,630 12,135 495 3.9% 12,775 12,235 540 4.2%
Lincoln County 29,480 28,615 865 2.9% 27,205 26,330 875 3.2%
Lyman County 1,725 1,635 90 5.3% 1,925 1,845 80 4.2%
McCook County 3,190 3,085 105 3.3% 2,740 2,630 110 4.1%
McPherson County 1,085 1,040 45 4.2% 1,135 1,075 60 5.2%
Marshall County 2,470 2,325 145 5.9% 2,255 2,095 160 7.1%
Meade County 13,565 13,005 560 4.1% 12,460 11,940 520 4.2%
Mellette County 795 740 55 6.7% 875 820 55 6.2%
Miner County 1,205 1,170 35 3.1% 1,145 1,090 55 5.0%
Minnehaha County 106,230 102,360 3,870 3.6% 100,200 96,180 4,020 4.0%
Moody County 3,860 3,690 170 4.4% 3,815 3,615 200 5.2%
Pennington County 53,555 51,375 2,180 4.1% 54,355 52,030 2,325 4.3%
Perkins County 1,500 1,435 65 4.2% 1,590 1,520 70 4.3%
Potter County 1,145 1,085 60 5.1% 1,205 1,155 50 4.1%
Roberts County 4,865 4,550 315 6.4% 4,800 4,460 340 7.1%
Sanborn County 1,225 1,190 35 2.9% 1,375 1,340 35 2.5%
Shannon County 3,615 3,175 440 12.2% 3,865 3,350 515 13.3%
Spink County 3,310 3,155 155 4.7% 3,355 3,175 180 5.3%
Stanley County 1,855 1,790 65 3.5% 1,950 1,885 65 3.4%
Sully County 850 825 25 3.1% 920 890 30 3.1%
South Dakota e-Labor Bulletin March 2015
17

Areas
February 2015 February 2014
Labor Force Employment Unemployment Rate
Labor Force Employment Unemployment Rate
Todd County 3,025 2,765 260 8.6% 3,375 3,080 295 8.8%
Tripp County 3,000 2,890 110 3.7% 2,860 2,740 120 4.2%
Turner County 4,765 4,585 180 3.8% 4,280 4,115 165 3.8%
Union County 8,170 7,815 355 4.3% 8,550 8,200 350 4.1%
Walworth County 2,370 2,200 170 7.2% 2,735 2,555 180 6.5%
Yankton County 11,360 10,965 395 3.5% 11,740 11,290 450 3.8%
Ziebach County 975 925 50 5.1% 1,025 975 50 4.9%
2015 data is preliminary and subject to revision. Data may not sum to totals because of rounding.
Source: Labor Market Information Center, South Dakota Department of Labor and Regulation. Produced in cooperation with the U.S. Bureau of
Labor Statistics.
South Dakota e-Labor Bulletin March 2015
18
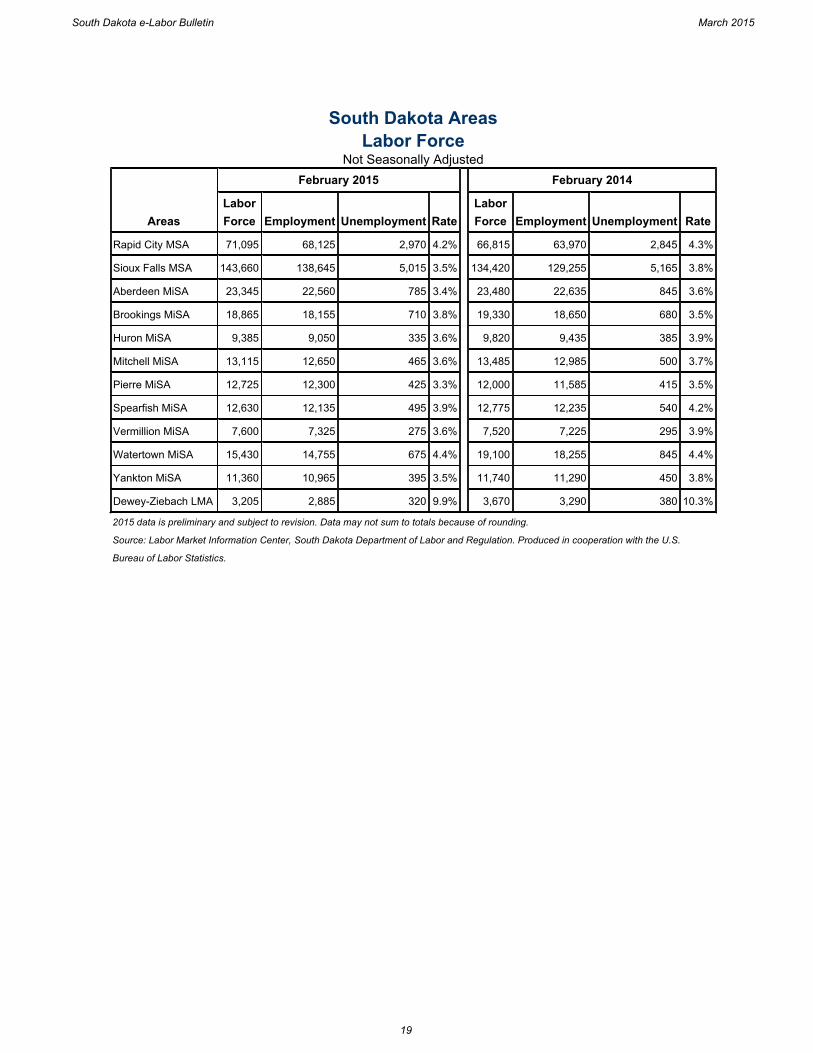
South Dakota AreasLabor Force
Not Seasonally Adjusted
Areas
February 2015 February 2014
Labor Force Employment Unemployment Rate
Labor Force Employment Unemployment Rate
Rapid City MSA 71,095 68,125 2,970 4.2% 66,815 63,970 2,845 4.3%
Sioux Falls MSA 143,660 138,645 5,015 3.5% 134,420 129,255 5,165 3.8%
Aberdeen MiSA 23,345 22,560 785 3.4% 23,480 22,635 845 3.6%
Brookings MiSA 18,865 18,155 710 3.8% 19,330 18,650 680 3.5%
Huron MiSA 9,385 9,050 335 3.6% 9,820 9,435 385 3.9%
Mitchell MiSA 13,115 12,650 465 3.6% 13,485 12,985 500 3.7%
Pierre MiSA 12,725 12,300 425 3.3% 12,000 11,585 415 3.5%
Spearfish MiSA 12,630 12,135 495 3.9% 12,775 12,235 540 4.2%
Vermillion MiSA 7,600 7,325 275 3.6% 7,520 7,225 295 3.9%
Watertown MiSA 15,430 14,755 675 4.4% 19,100 18,255 845 4.4%
Yankton MiSA 11,360 10,965 395 3.5% 11,740 11,290 450 3.8%
Dewey-Ziebach LMA 3,205 2,885 320 9.9% 3,670 3,290 380 10.3%
2015 data is preliminary and subject to revision. Data may not sum to totals because of rounding.
Source: Labor Market Information Center, South Dakota Department of Labor and Regulation. Produced in cooperation with the U.S.
Bureau of Labor Statistics.
South Dakota e-Labor Bulletin March 2015
19

South Dakota CitiesLabor Force
Areas
February 2015 February 2014
Labor Force Employment Unemployment Rate
Labor Force Employment Unemployment Rate
Aberdeen 15,170 14,625 545 3.6% 15,570 14,975 595 3.8%
Brookings 13,245 12,735 510 3.8% 13,585 13,090 495 3.6%
Huron 6,740 6,485 255 3.8% 7,150 6,850 300 4.2%
Mitchell 8,910 8,595 315 3.5% 9,105 8,755 350 3.8%
Pierre 8,180 7,895 285 3.5% 8,170 7,865 305 3.7%
Rapid City 34,960 33,350 1,610 4.6% 36,160 34,495 1,665 4.6%
Sioux Falls 97,215 93,630 3,585 3.7% 91,925 88,260 3,665 4.0%
Sioux Falls -
Lincoln County14,400 14,005 395 2.8% 12,955 12,570 385 3.0%
Sioux Falls -
Minnehaha County82,810 79,625 3,185 3.8% 78,965 75,685 3,280 4.2%
Spearfish 5,830 5,575 255 4.3% 5,245 4,980 265 5.1%
Vermillion 5,760 5,545 215 3.7% 5,910 5,685 225 3.8%
Watertown 12,045 11,470 575 4.8% 12,765 12,190 575 4.5%
Yankton 7,050 6,765 285 4.0% 7,595 7,260 335 4.4%
2015 data is preliminary and subject to revision. Data may not sum to totals because of rounding.
Source: Labor Market Information Center, South Dakota Department of Labor and Regulation. Produced in cooperation with the U.S. Bureau of
Labor Statistics.
South Dakota e-Labor Bulletin March 2015
20
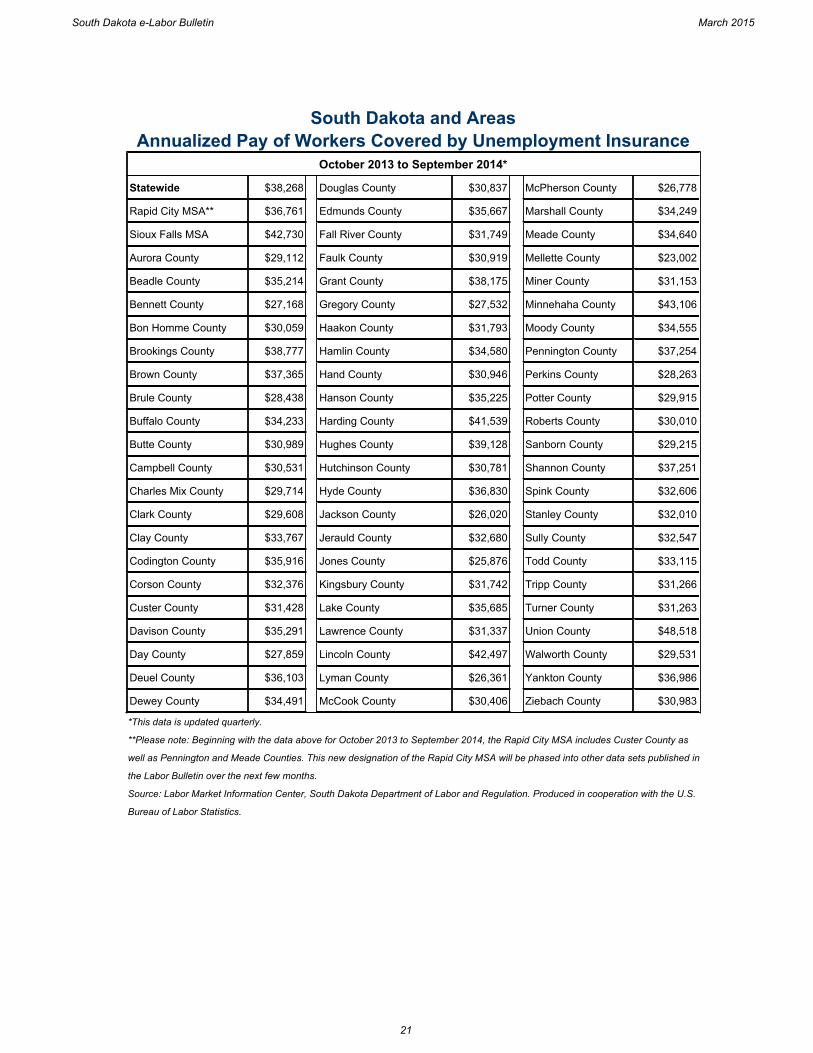
South Dakota and AreasAnnualized Pay of Workers Covered by Unemployment Insurance
October 2013 to September 2014*
Statewide $38,268 Douglas County $30,837 McPherson County $26,778
Rapid City MSA** $36,761 Edmunds County $35,667 Marshall County $34,249
Sioux Falls MSA $42,730 Fall River County $31,749 Meade County $34,640
Aurora County $29,112 Faulk County $30,919 Mellette County $23,002
Beadle County $35,214 Grant County $38,175 Miner County $31,153
Bennett County $27,168 Gregory County $27,532 Minnehaha County $43,106
Bon Homme County $30,059 Haakon County $31,793 Moody County $34,555
Brookings County $38,777 Hamlin County $34,580 Pennington County $37,254
Brown County $37,365 Hand County $30,946 Perkins County $28,263
Brule County $28,438 Hanson County $35,225 Potter County $29,915
Buffalo County $34,233 Harding County $41,539 Roberts County $30,010
Butte County $30,989 Hughes County $39,128 Sanborn County $29,215
Campbell County $30,531 Hutchinson County $30,781 Shannon County $37,251
Charles Mix County $29,714 Hyde County $36,830 Spink County $32,606
Clark County $29,608 Jackson County $26,020 Stanley County $32,010
Clay County $33,767 Jerauld County $32,680 Sully County $32,547
Codington County $35,916 Jones County $25,876 Todd County $33,115
Corson County $32,376 Kingsbury County $31,742 Tripp County $31,266
Custer County $31,428 Lake County $35,685 Turner County $31,263
Davison County $35,291 Lawrence County $31,337 Union County $48,518
Day County $27,859 Lincoln County $42,497 Walworth County $29,531
Deuel County $36,103 Lyman County $26,361 Yankton County $36,986
Dewey County $34,491 McCook County $30,406 Ziebach County $30,983
*This data is updated quarterly.
**Please note: Beginning with the data above for October 2013 to September 2014, the Rapid City MSA includes Custer County as
well as Pennington and Meade Counties. This new designation of the Rapid City MSA will be phased into other data sets published in
the Labor Bulletin over the next few months.
Source: Labor Market Information Center, South Dakota Department of Labor and Regulation. Produced in cooperation with the U.S.
Bureau of Labor Statistics.
South Dakota e-Labor Bulletin March 2015
21
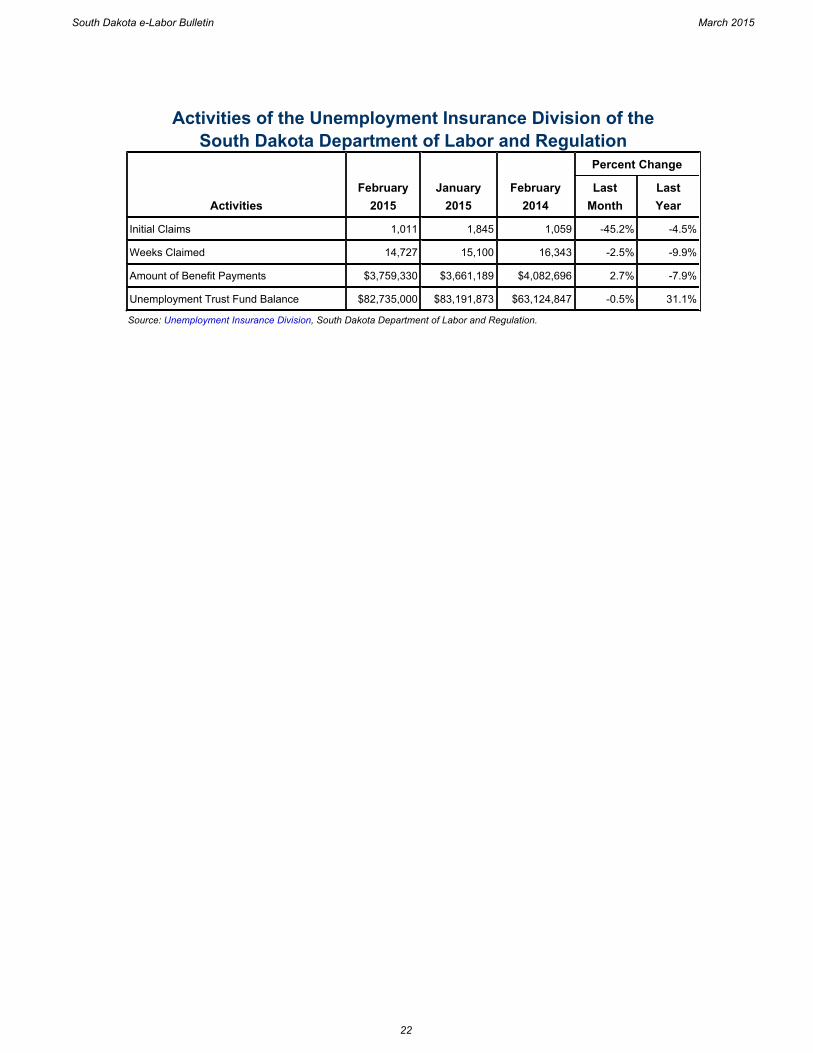
Activities of the Unemployment Insurance Division of theSouth Dakota Department of Labor and Regulation
ActivitiesFebruary
2015January
2015February
2014
Percent Change
LastMonth
LastYear
Initial Claims 1,011 1,845 1,059 -45.2% -4.5%
Weeks Claimed 14,727 15,100 16,343 -2.5% -9.9%
Amount of Benefit Payments $3,759,330 $3,661,189 $4,082,696 2.7% -7.9%
Unemployment Trust Fund Balance $82,735,000 $83,191,873 $63,124,847 -0.5% 31.1%
Source: Unemployment Insurance Division, South Dakota Department of Labor and Regulation.
South Dakota e-Labor Bulletin March 2015
22
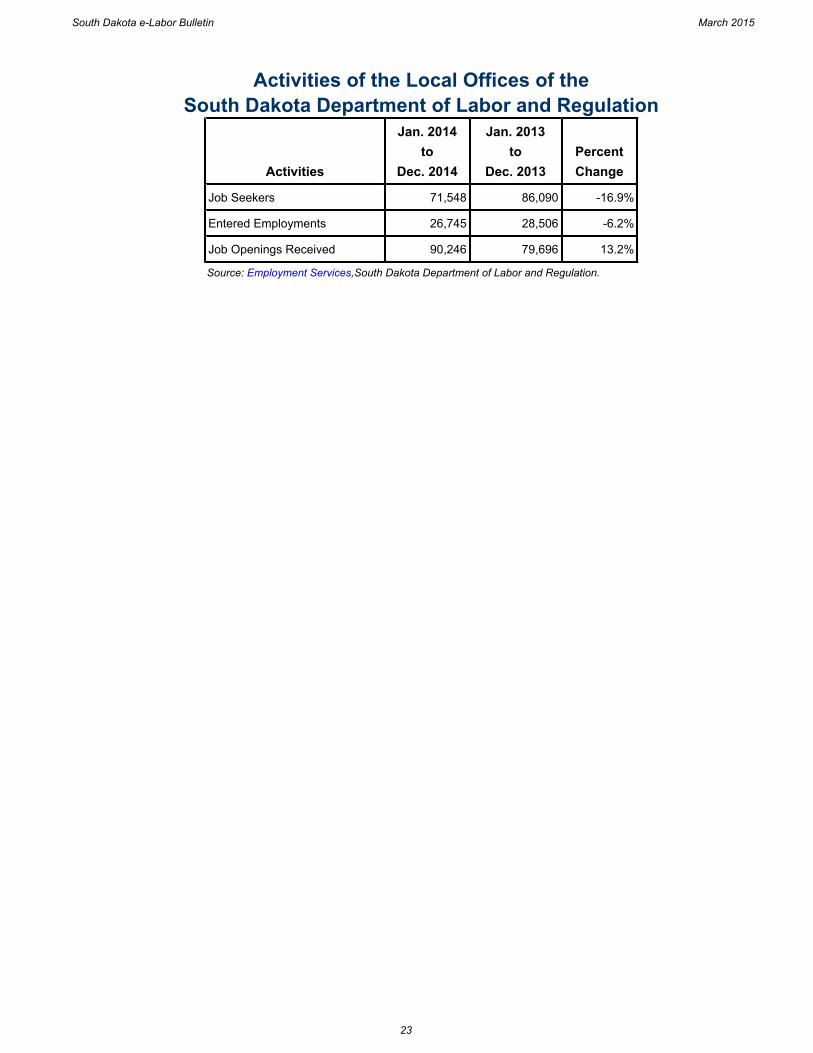
Activities of the Local Offices of theSouth Dakota Department of Labor and Regulation
Activities
Jan. 2014to
Dec. 2014
Jan. 2013to
Dec. 2013Percent Change
Job Seekers 71,548 86,090 -16.9%
Entered Employments 26,745 28,506 -6.2%
Job Openings Received 90,246 79,696 13.2%
Source: Employment Services,South Dakota Department of Labor and Regulation.
South Dakota e-Labor Bulletin March 2015
23
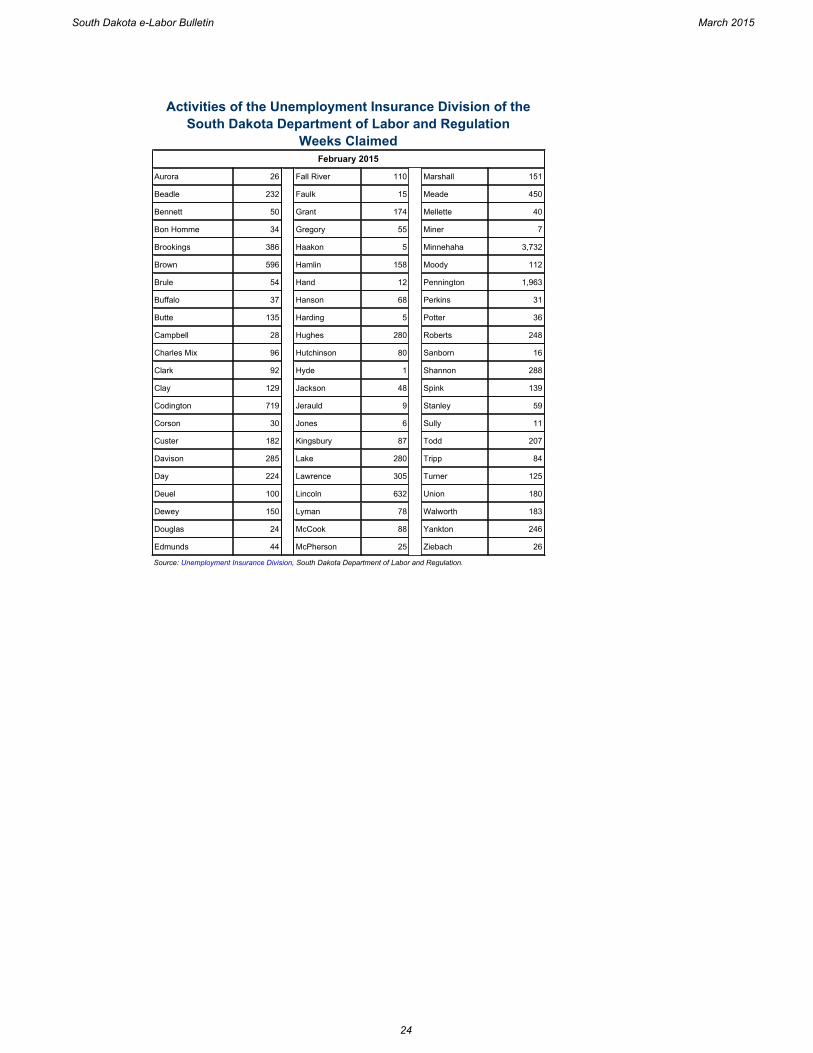
Activities of the Unemployment Insurance Division of theSouth Dakota Department of Labor and Regulation
Weeks ClaimedFebruary 2015
Aurora 26 Fall River 110 Marshall 151
Beadle 232 Faulk 15 Meade 450
Bennett 50 Grant 174 Mellette 40
Bon Homme 34 Gregory 55 Miner 7
Brookings 386 Haakon 5 Minnehaha 3,732
Brown 596 Hamlin 158 Moody 112
Brule 54 Hand 12 Pennington 1,963
Buffalo 37 Hanson 68 Perkins 31
Butte 135 Harding 5 Potter 36
Campbell 28 Hughes 280 Roberts 248
Charles Mix 96 Hutchinson 80 Sanborn 16
Clark 92 Hyde 1 Shannon 288
Clay 129 Jackson 48 Spink 139
Codington 719 Jerauld 9 Stanley 59
Corson 30 Jones 6 Sully 11
Custer 182 Kingsbury 87 Todd 207
Davison 285 Lake 280 Tripp 84
Day 224 Lawrence 305 Turner 125
Deuel 100 Lincoln 632 Union 180
Dewey 150 Lyman 78 Walworth 183
Douglas 24 McCook 88 Yankton 246
Edmunds 44 McPherson 25 Ziebach 26
Source: Unemployment Insurance Division, South Dakota Department of Labor and Regulation.
South Dakota e-Labor Bulletin March 2015
24

National Economic Indicators
IndicatorsFebruary
2015January
2015February
2014
PercentChange
LastMonth
LastYear
Consumer Price Index 234.7 233.7 234.8 0.4% 0.0%
Nonfarm Payroll Employment 139.6 138.7 136.3 0.6% 2.4%
Privately Owned Housing Starts 897 1,081 928 -17.0% -3.3%
Bank Prime Loan Rate 3.25 3.25 3.25 0.0% 0.0%
Sources:
Consumer Price Index and Nonfarm Payroll Employment (in thousands), U.S. Bureau of Labor Statistics.
Privately Owned Housing Starts, U.S. Census Bureau.
Bank Prime Loan Rate, Federal Reserve Board.
South Dakota e-Labor Bulletin March 2015
25