health care databases for research€¦ · health care databases for research denise boudreau, phd,...
TRANSCRIPT

Health Care Databases for
Research
Denise Boudreau, PhD, RPh
Group Health Research Institute
(GHRI)

Outline
Overview of data resources
Examples
Strengths, weaknesses, and differences in
data
Approaches to choosing and working with
databases
What is administrative data?
Administrative data refers to information
collected primarily for administrative (not
research) purposes. This type of data is
collected by public and private
organizations for the purposes of
registration, transaction and record
keeping, usually during the delivery of a
service
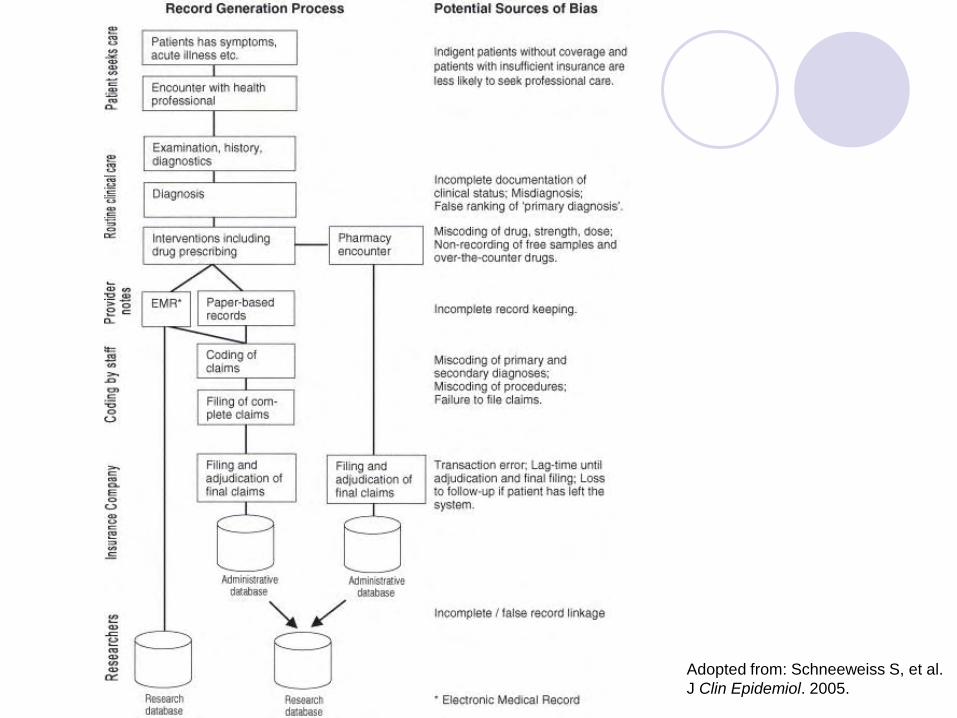
Adopted from: Schneeweiss S, et al.
J Clin Epidemiol. 2005.

Example uses of
administrative/automated/health care
utilization databases
Observational research studies (e.g., epidemiology, comparative effectiveness, health services)
Public health surveillance
Policy analyses/evaluations
Economic evaluations
Cost-effectiveness
Clinical studies
Risk adjustment
Health Effectiveness Data and Information Set (HEDIS) requirements

US public databases, examples:
Healthcare Cost and Utilization Project (HCUP) Nationwide Inpatient Sample (NIS)
State Ambulatory Surgery Databases (SASD)
State Emergency Department Databases (SEDD)
Kids' Inpatient Database (KID)
Medicare and Medicare Part D
SEER-Medicare Linked Databases
Veterans Administrative Databases
http://www.riskfactor.cancer.gov/tools/pharmaco/epi/
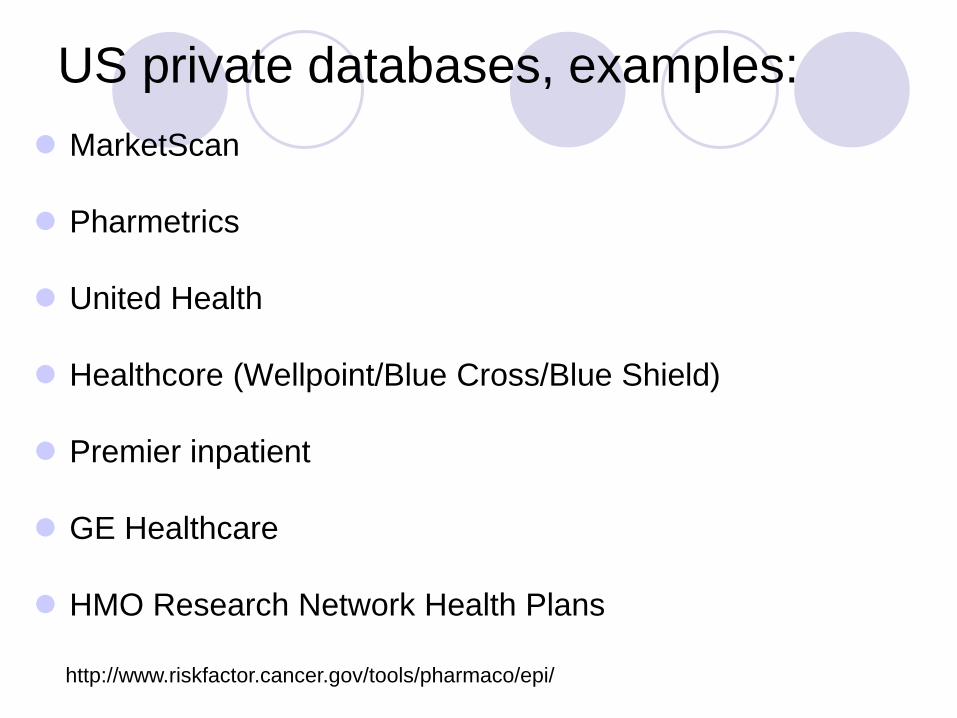
US private databases, examples:
MarketScan
Pharmetrics
United Health
Healthcore (Wellpoint/Blue Cross/Blue Shield)
Premier inpatient
GE Healthcare
HMO Research Network Health Plans
http://www.riskfactor.cancer.gov/tools/pharmaco/epi/

International databases, examples:
Saskatchewan Health Services, Canada
Clinical Practice Research Datalink – formerly General
Practice Research Database (GPRD), UK
The Health Improvement Network (THIN) database, UK
PhARMO Record Linkage System, Netherlands
IMS Oncology Analyzer, 14 countries

Basic contents of databases
Diagnoses (ICD-9 or ICD-10, dates)
Procedures (CPT/HCPCS, dates)
Medication dispensings
Demographics (age, sex, enrollment)
Cost or charge of medical services
Care setting (e.g., Outpatient, ER)
Type of provider (e.g., primary care,
specialty)

Supplemental data elements
Laboratory results
Electronic medical records Vital signs (e.g., BP, weight, height)
Procedure results (e.g., EF for heart failure, images)
Medication order and indication for prescription
Flow sheets (PHQ-9, Medicare wellness survey)
Disease registries (e.g., cancer, diabetes)
Date and cause of death
Census data
Provider characteristics (e.g., gender, years practice)
Patient characteristics (e.g., race, education, smoking status, family history, health behaviors)
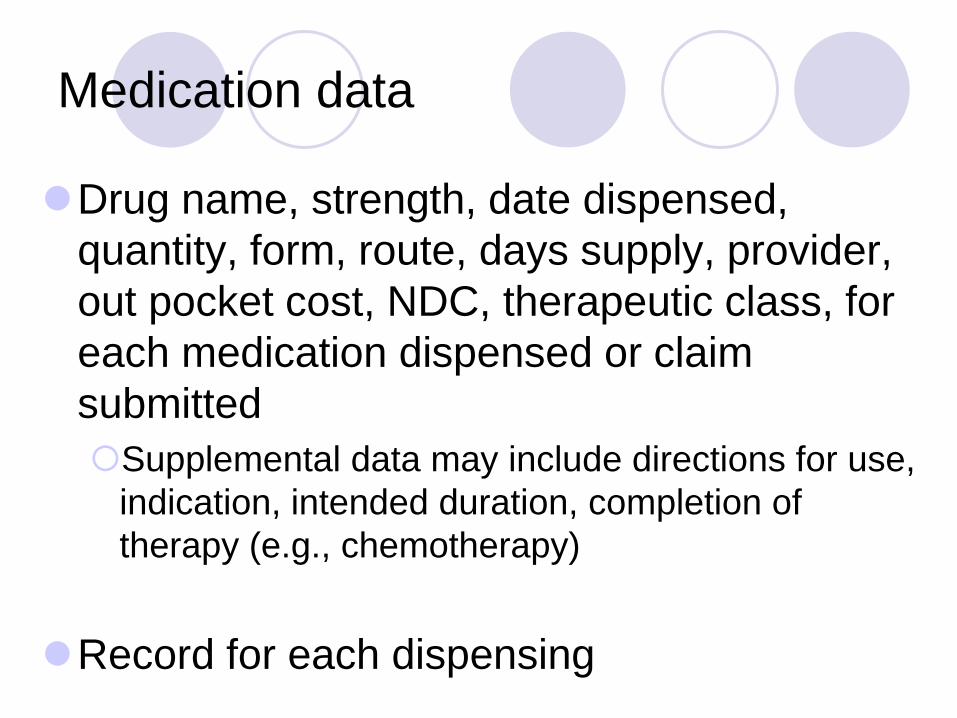
Medication data
Drug name, strength, date dispensed,
quantity, form, route, days supply, provider,
out pocket cost, NDC, therapeutic class, for
each medication dispensed or claim
submitted
Supplemental data may include directions for use,
indication, intended duration, completion of
therapy (e.g., chemotherapy)
Record for each dispensing
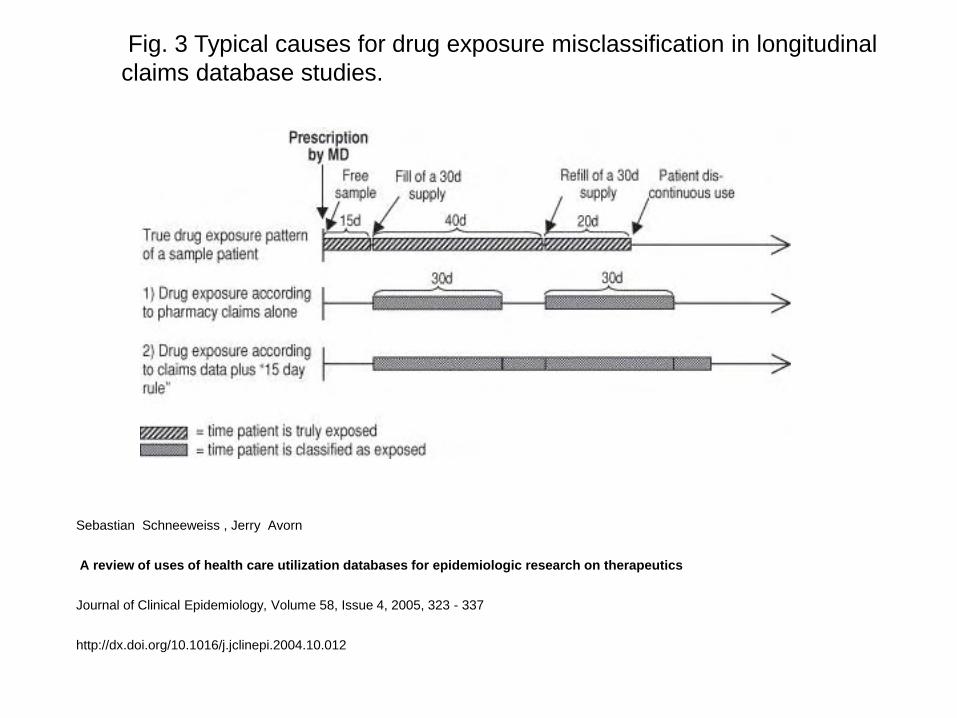
Fig. 3 Typical causes for drug exposure misclassification in longitudinal
claims database studies.
Sebastian Schneeweiss , Jerry Avorn
A review of uses of health care utilization databases for epidemiologic research on therapeutics
Journal of Clinical Epidemiology, Volume 58, Issue 4, 2005, 323 - 337
http://dx.doi.org/10.1016/j.jclinepi.2004.10.012

Data Capture
Created for administrative and clinical purposes Encounters with the health system (i.e., outpatient visits,
inpatient stays, procedures, laboratory tests, medication dispensings, etc.) generate claims to the payer and medical record trail (electronic or paper) for documentation of encounter.
Hospital reimbursed base on diagnostic related groups (DRGs). ICD-9 codes mapped to DRGs with highest reimbursement.
Outpatient codes (ICD-9, CPT, HCPCS) assigned by provider or office staff for reimbursement. Reimbursement often based on intensity of services provided during visit.
Data across various sources can then be linked
An integrated picture of the patient’s health and
healthcare can emerge.
HMO Research Network National consortium of research centers that work in close
partnership with integrated health systems
Mission: To facilitate and promote the unique scientific research capabilities of its member organizations Fostering collaborative studies
Sharing methodologies & best practices
Disseminating & translating research findings
Combined population of ~15 million individuals
Geographically & socio-culturally diverse 800,000 African American enrollees
Henry Ford Health System: 37% African American
KP Southern California: 37% Latino
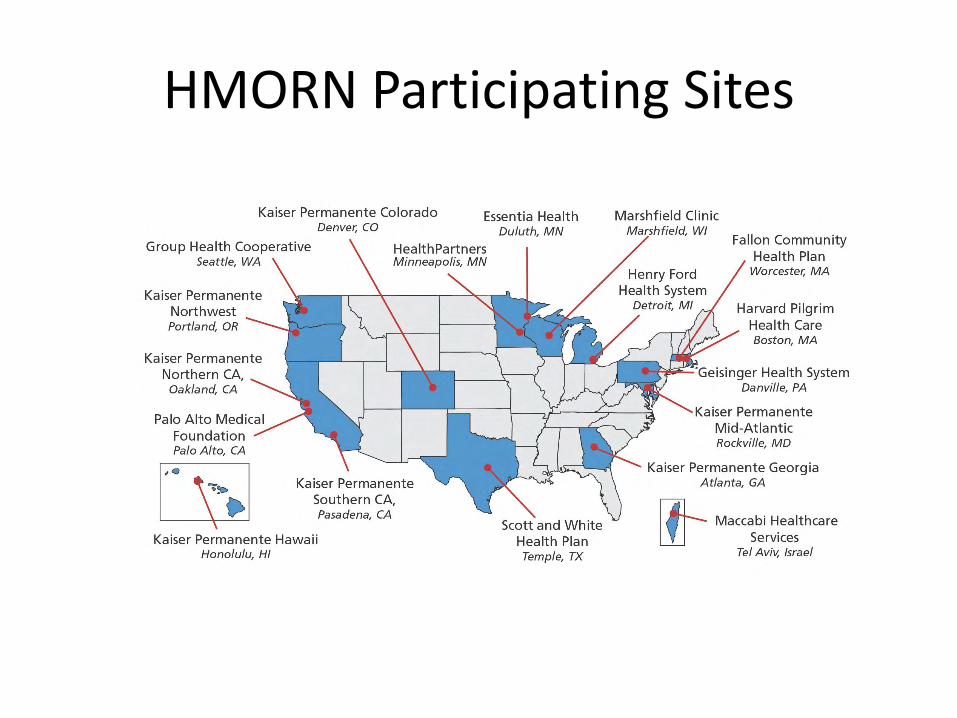
HMORN Participating Sites

Interconnected Data Resources at GHRI
and other HMORN partners

Virtual Data Warehouse (VDW)
Tumor registry
Enrollment
Demographics
Pharmacy
Utilization – includes diagnoses & procedures
Some vitals such as BMI & blood pressure
Geocoding
Laboratory
Chemotherapy
Radiology
Pathology
VDW is populated by automated data from the following sources:

1950 1960 1970 1980 1990 2000 2010
Demographics
Enrollment
UtilizationDiagnoses
ProceduresLab
Outpatient Pharmacy
VitalsProvider Specialty
DeathMultiple Cause of Death
Census
Tumor
So
urc
e
GHC Data Availbility
Example of longitudinal data within
HMORN

Mini-Sentinel Partner Organizations
Institute for
Health
Lead – HPHC Institute
Data and
scientific
partners
Scientific
partners
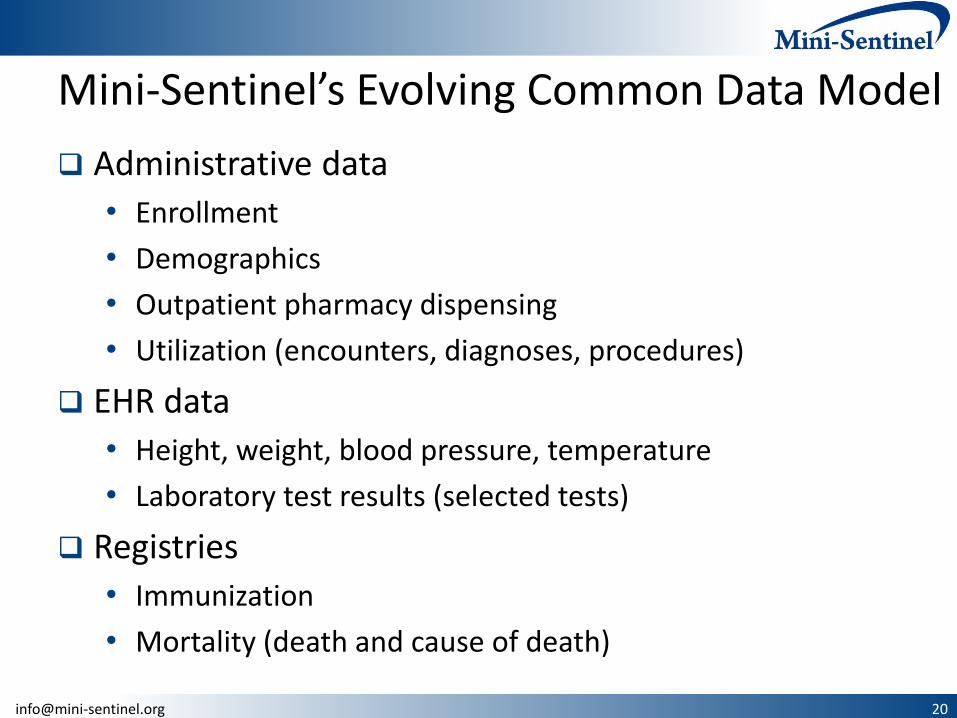
Mini-Sentinel’s Evolving Common Data Model
Administrative data
• Enrollment
• Demographics
• Outpatient pharmacy dispensing
• Utilization (encounters, diagnoses, procedures)
EHR data
• Height, weight, blood pressure, temperature
• Laboratory test results (selected tests)
Registries
• Immunization
• Mortality (death and cause of death)

The Mini-Sentinel Distributed Database
Populations with well-defined person-time for which medically-attended events are known
126 million individuals*
• 345 million person-years of observation time (2000-2011)
• 44 million individuals currently enrolled, accumulating new data
• 27 million individuals have over 3 years of data
*As of 12 December 2011. The potential for double-counting exists if individuals moved between data partner health plans.

The Mini-Sentinel Distributed Database
3 billion dispensings
• Accumulating 37 million dispensings per month
2.4 billion unique encounters
• 40 million acute inpatient stays
• Accumulating 41 million encounters per month including over 400,000 hospitalizations
13 million people with >1 laboratory test result
*As of 12 December 2011
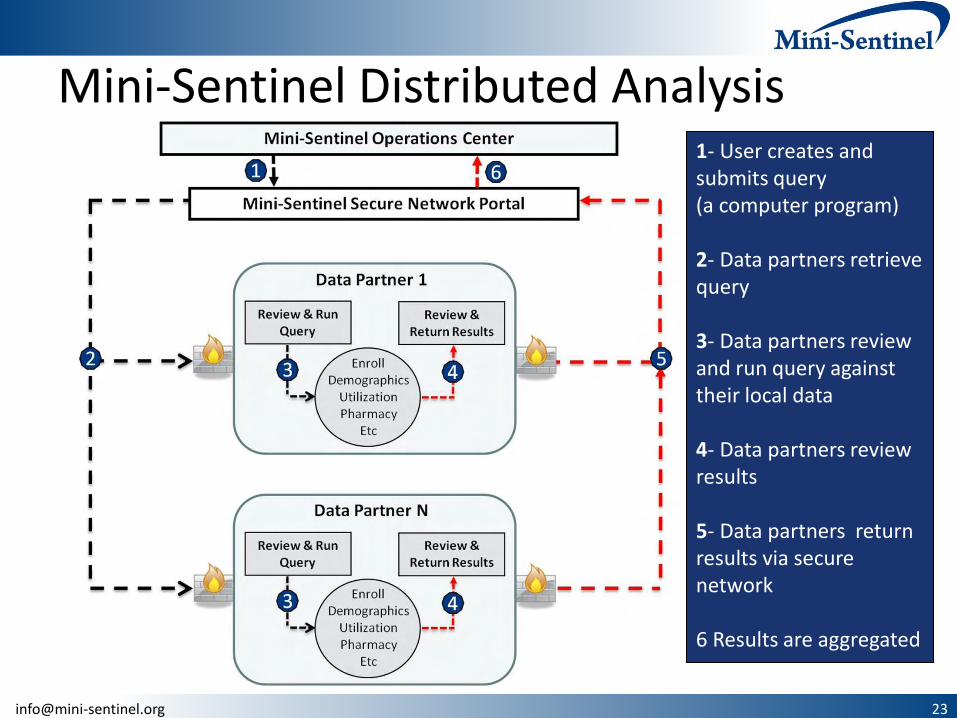
Mini-Sentinel Distributed Analysis 1- User creates and submits query (a computer program) 2- Data partners retrieve query 3- Data partners review and run query against their local data 4- Data partners review results 5- Data partners return results via secure network 6 Results are aggregated

General Strengths of Health Care
Utilization Data
Valuable source of data for relatively quick and less costly studies
Most contain large samples and are population based
Ability to study “real world” effectiveness, safety, and utilization
Most contain continuous services as opposed to interval assessments Continuous assessment of exposures and outcomes
Some have near complete data on: Outpatient prescription medication dispensings
Outpatient and inpatient diagnoses and procedures
Not subject to recall bias or non-response
Denominator!
Technology has advanced capabilities and ease of accessing and working with the data

General Limitations
Data is collected for care and reimbursement – not research Requires encounter w/ health care system (not under control of investigator)
Generalizability to other populations and settings Commercially insured population, Medicaid, or elderly (i.e., Medicare)
Integrated group practice vs fee for service setting
Often missing important data on confounders such as SES, diet, and behaviors
Potential misclassification of exposure, outcome, and covariates Often missing inpatient medication use and OTC medicine use
Missing data on medications or procedures not covered or when patients seek treatment out of the contract settings
Uncertainty in the validity of diagnosis data (e.g., rule out codes)
Only captures illnesses severe enough to come to medical attention
Incident date of disease may be difficult to determine
Some databases lack info on mortality
Turnover rate in most health plans is 20-30% a year Different by age, employment, illness, etc. .

Limitations (cont.)
Often cannot contact study subjects for further data collection or interventions
Few have or allow access to medical charts
Supplemental data mentioned earlier is not always available
Missing data fields
E.g., smoking status, weight, height, race, days supply of medication dispensing, laboratory and procedure results
Data is influenced by formularies, policies, practice patterns, etc.
Breaks or changes in data collection
ICD-9 to ICD-10 codes
Introduction of EMRs
Software
Inability to track the same individual coming in and out of the system

Selecting a database
Clearly defined population
Adequate sample size
Coverage of population of interest (e.g., pediatrics, elderly)
Generalizable
Capture of required study variables
% missing, multiple records, etc.
Accessibility
Structured field vs free text, scanned pdf, etc.
Level of detail
E.g., can you differentiate screening mammograms from diagnostic, cost vs
charges of care, dose of chemotherapy, etc.
Continuous and consistent capture
Individual or aggregate data
Limited or de-identified

Selecting a database (cont.)
Cost and feasibility of obtaining data.
E.g., private sources may require collaboration with an internal investigator or substantial amount of money to buy data
Human subject hurdles
Existing documentation on completeness and quality of data and/or opportunities to validate data.
Availability of published studies using the data
Representativeness of the population and setting
Trends in prescribing, encounters, diagnoses, etc.
Selecting a database (cont.)
Available follow-up
Date all needed data first became available
E.g. Height and weight not available electronically until
adoption of EMR
Frequency of data collection and uploading
E.g. lag of 2 years for death data
Need to go to multiple data sources
E.g., link to National Death Index Validated and reliable linkage algorithms

Extra tips
Consider a feasibility study to start if new
area or new data and unsure of ability to
answer research question with the
available data
Collaborate with someone who is
experienced working with the data source

Conclusions
Enormous growth in the use of large healthcare databases in North America and Europe Focus on CER is motivating improvements and expansion of current
data and infrastructures to support data collection
Data contents, quality, and integrity differ among databases Know your data or add an expert to your team
Carefully frame research questions (i.e., avoid data mining)
All same limitations of observational studies apply Confounding, bias, missing data, etc.
Exciting new advanced statistical techniques
Follow good research practices and be good stewards of the data
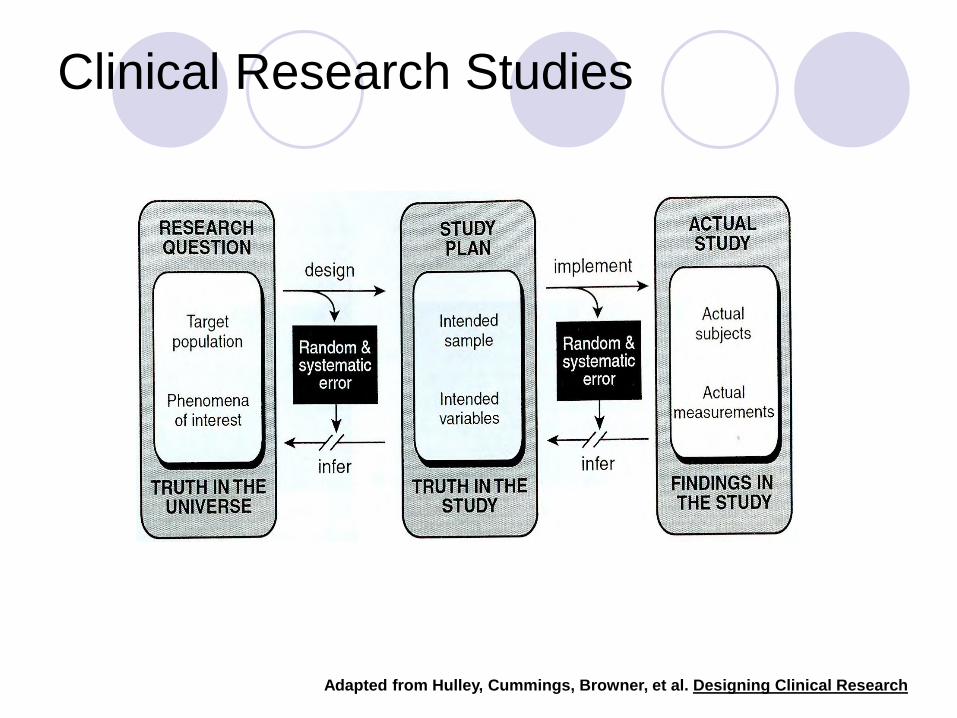
Clinical Research Studies
Adapted from Hulley, Cummings, Browner, et al. Designing Clinical Research

Additional References
List of commonly used databases: http://www.riskfactor.cancer.gov/tools/pharmaco/epi/
ISPE’s Good Pharmacoepidemiology Practices: http://www.pharmacoepi.org/resources/guidelines_08027.cfm
ISPOR’s Good Outcomes Research Practices: http://www.ispor.org/workpaper/practices_index.asp
GRACE’s Good Research for CER: www.graceprinciples.org