health care quality report - mncmsecure.org
TRANSCRIPT

MINNESOTA HEALTH CARE QUALITY REPORTRESULTS FOR CARE DELIVERED IN 2019
RELEASED MARCH 2021

MN Community Measurement MINNESOTA HEALTH CARE QUALITY REPORT 2
ACKNOWLEDGEMENTSMINNESOTA HEALTH CARE QUALITY REPORTResults for Care Delivered in 2019
WHO IS MN COMMUNITY MEASUREMENT?
As an independent nonprofit dedicated to empowering health care decision makers with meaningful data, MN Community Measurement (MNCM) is a statewide resource for timely, comparable information on health care costs and quality. While Minnesota has some of the best health indicators in the country, there continues to be wide variation in health care quality. Quality measurement in health care delivers value to patients, providers, payers and purchasers and the community. This report summarizes all clinical quality measures collected by MNCM in 2019. The measures were developed or chosen for public reporting to address gaps in quality and to focus community efforts on improvement.
PURPOSE OF THIS REPORT
This report provides a summary view of all measures collected and reported by MNCM as well as historical trend. Additional data is available on mnhealthscores.org and in the detailed tables included in the Appendices to this report.
This report is possible by the engagement of several stakeholders who are committed to continuous improvement and recognize the important role measurement plays in helping our community establish priorities and improve together.
MNCM extends our thanks to all medical groups and payers for contributing the data necessary for measurement, to the State of Minnesota for its support through the Statewide Quality Reporting and Measurement System, and to the many members of MNCM committees and workgroups providing ongoing guidance to shape this important work.
REPORT AUTHORS
Jess Donovan, MPH, RN, PHNClinical Measurement Analyst
Gunnar NelsonHealth Economist
DIRECT QUESTIONS OR COMMENTS TO [email protected]

MN Community Measurement 3
KEY FINDINGS AND NOTESKEY FINDINGS• The rates of performance for the following measures significantly increased since the 2019 report year:
o Colorectal Cancer Screening (increased from 71.1% to 73.2%)
o Optimal Diabetes Care (increased from 44.9% to 45.4%)
o Adolescent Mental Health and/or Depression Screening (increased from 86.1% to 88.7%)
• Within the Optimal Diabetes Care measure, the percentage of patients with diabetes whose blood sugar is controlled (HbA1c component) has significantly increased since the 2019 report year, which was the main driver in the overall increase in the performance rate for optimal care.
• The rate of performance for the following measures significantly decreased since the 2019 report year:o Optimal Asthma Control – Children (decreased from 59.9% to 58.3%)
o Optimal Vascular Care (decreased from 61.1% to 60.3%)
• Within the Optimal Vascular care measure, the rate of the daily aspirin component has been steadily decreasing since the 2016 report year, contributing to the overall decrease in the performance rate for optimal care.
NOTES• Due to COVID-19 related impacts on the availability of audited HEDIS data from participating health plans, the following HEDIS measures are
unable to be reported at the statewide level for the 2020 report year:
• New to this year’s report is the addition of the Adolescent Depression suite. The complete Depression measure suite is now stratified by Adults (18 years and older) and Adolescents (12 – 17 years).
o The Depression measure suite recently underwent significant measure changes, making trending unavailable for this year’s report. A complete summary of these changes can be found here.
• Also new to this year’s report is the inclusion of the rates for the individual components of the Optimal Diabetes Care and the Optimal Vascular Care measures.
MINNESOTA HEALTH CARE QUALITY REPORT
o Breast Cancer Screening o Use of Spirometry Testing in the Assessment and Diagnosis of COPD
o Cervical Cancer Screening o Avoidance of Antibiotic Treatment in Adults with Acute Bronchitis
o Childhood Immunization Status (Combo 10) o Follow-Up Care for Children Prescribed ADHD Medication
o Immunizations for Adolescents (Combo 2) o Osteoporosis Management in Women who had a Fracture
o Diabetes Eye Exam

MN Community Measurement 4
STATEWIDE RESULTS FOR PRIMARY CARE MEASURES2020 report year (2019 dates of service)
This table provides an overview of the statewide rates by measure for primary care and shows significant variation and/or room for improvement in all measures. Even for measures where the statewide average is high, wide variation exists in performance across medical groups.
Statewide average: The average performance rate among medical groups for the 2020 report year.
How to read variation chart
Min Max
Statewide average
MINNESOTA HEALTH CARE QUALITY REPORT

MN Community Measurement 5
HIGH PERFORMING MEDICAL GROUPSNine medical groups had rates significantly above the statewide average on at least 50 percent of the measures for which they were eligible.*
Detailed results by medical group and clinic are available in the online appendix to this report and at mnhealthscores.org.
*Included if eligible for at least five measures.
Above average
<
⚫
Average or below average
Not reportable for this measure (too few patients in measure denominator)
- HP Central reports under HealthPartners Clinics for HEDIS measures
MINNESOTA HEALTH CARE QUALITY REPORT
CentraCare
Health
Entira
Family
Clinics
Essentia
Health
Fairview
Health
Services
Health-
Partners
Central
Minnesota
Clinics
Health-
Partners
Clinics
Mankato
Clinic, Ltd.
Park
Nicollet
Health
Services
Westfields
Hospital
and Clinic
Colorectal Cancer Screening ⚫ ⚫ ⚫ ⚫ ⚫ ⚫ ⚫ ⚫ ⚫
Chlamydia Screening in
Women⚫ ⚫ ⚫ - ⚫ ⚫
Optimal Diabetes Care ⚫ ⚫ ⚫ ⚫ ⚫ ⚫ ⚫
Optimal Vascular Care ⚫ ⚫ ⚫ ⚫ ⚫ ⚫
Optimal Asthma Control -
Adults ⚫ ⚫ ⚫ ⚫ ⚫ ⚫ ⚫ ⚫
Optimal Asthma Control -
Children ⚫ ⚫ ⚫ ⚫ ⚫ ⚫ ⚫
Adolescent Mental Health
and/or Depression Screening⚫ ⚫ ⚫ ⚫ ⚫
Adolescent Depression: PHQ-
9/PHQ-9M Utilization⚫ ⚫ ⚫ ⚫ ⚫ ⚫ ⚫ ⚫ <
Adult Depression: PHQ-
9/PHQ-9M Utilization⚫ ⚫ ⚫ ⚫ ⚫ ⚫ ⚫
Adolescent Depression:
Follow-Up at Six Months⚫ ⚫ ⚫ ⚫ <
Adolescent Depression:
Response at Six Months⚫ ⚫ ⚫ <
Adolescent Depression:
Remission at Six Months⚫ ⚫ ⚫ <
Adolescent Depression:
Follow-Up at 12 Months⚫ ⚫ ⚫ ⚫ ⚫ ⚫ <
Adolescent Depression:
Response at 12 Months⚫ ⚫ ⚫ ⚫ <
Adolescent Depression:
Remission at 12 Months⚫ ⚫ ⚫ ⚫ ⚫ <
Adult Depression: Follow-Up
at Six Months ⚫ ⚫ ⚫ ⚫ ⚫ ⚫ ⚫
Adult Depression: Response
at Six Months ⚫ ⚫ ⚫ ⚫ ⚫ ⚫ ⚫
Adult Depression: Remission
at Six Months ⚫ ⚫ ⚫ ⚫ ⚫ ⚫ ⚫
Adult Depression: Follow-Up
at 12 Months ⚫ ⚫ ⚫ ⚫ ⚫ ⚫ ⚫
Adult Depression: Response
at 12 Months ⚫ ⚫ ⚫ ⚫ ⚫ ⚫ ⚫
Adult Depression: Remission
at 12 Months ⚫ ⚫ ⚫ ⚫ ⚫ ⚫ ⚫
11 19 13 11 13 16 19 18 9
21 21 21 21 20 21 21 21 14Total number of eligible measures
PR
EV
EN
TIV
E
HE
AL
TH
CH
RO
NIC
CO
ND
ITIO
NS
ME
NT
AL
HE
AL
TH
Total number of measures as high
performers

MN Community Measurement 6
VARIATION BY MEDICAL GROUP*STATEWIDE RESULTS
How to read a box plot
See page 3 for notes related to measures not reported due to COVID-19 disruption in data collection
STATEWIDE RESULTS• Just over half of eligible females
received a chlamydia screening during 2019 dates of service.
VARIATION BY MEDICAL GROUP• There continues to be significant
variation in medical group performance for both screening measures.
• The range in medical group performance was wider for colorectal cancer screening than for chlamydia screening.
For complete measure descriptions, click here.
*Does not include medical groups with less than 30 patients
MINNESOTA HEALTH CARE QUALITY REPORT
PREVENTIVE HEALTH MEASURES2020 report year (2019 dates of service)

MN Community Measurement 7
^ The criteria for including patients in the measure denominator changed in 2017. This change may have contributed to a change in statewide rates for this measure.* Changes to the measure denominator definition resulted in a significant drop in population for this measure and may have contributed to a chance in statewide rates reported in the 2018 report year for this measure** Results for 2015-2019 were reweighted to match the current year’s mix of insurance product
^
CHLAMYDIA SCREENING IN WOMEN** COLORECTAL CANCER SCREENING
MINNESOTA HEALTH CARE QUALITY REPORT
PREVENTIVE HEALTH MEASURES2020 report year (2019 dates of service)
STATEWIDE TREND OVER TIMEThe rate of performance for the Chlamydia Screening in Women measure did not significantly change from the 2019 report year to the 2020 report year.
The rate of performance for the Colorectal Cancer Screening measure significantly increased from the 2019 report year to the 2020 report year.
Significant change from previous report year

MN Community Measurement 8
CHRONIC CONDITIONS MEASURES2020 report year (2019 dates of service)
STATEWIDE RESULTSVARIATION BY MEDICAL GROUP*
*For complete measure descriptions, click here.
STATEWIDE RESULTS• Of the measures included here, the
Optimal Diabetes Care measure has the most room for improvement
• Approximately 55 percent of patients with diabetes have a least one component of the measure that is not optimally managed
VARIATION BY MEDICAL GROUP• There continues to be significant
variation in medical group performance for all four chronic condition measures
• The widest range in performance among these screening measures was in the Optimal Asthma Control- Children measure.
How to read a box plot
* Does not include medical groups with less than 30 patients
MINNESOTA HEALTH CARE QUALITY REPORT
See page 3 for notes related to measures not reported due to COVID-19 disruption in data collection

MN Community Measurement 9
STATEWIDE TREND OVER TIMEThe rate of performance for the Optimal Diabetes Care measure significantly increased in the 2020 report year (2019 dates of service) compared to the 2019 report year. Additional analyses of the components show that the rate for the Hemoglobin A1c component significantly decreased in the 2018 report year and then remained constant in the 2019 report year. However, in the 2020 report year, the HbA1c rate significantly increased, leading to a significant increase in optimal care overall.
The rate of performance for the Optimal Vascular Care measure significantly decreased in the 2020 report year compared to the 2019 report year. Additional analyses of the components shows that the rates for the aspirin component have been significantly decreasing since the 2018 report year, which has significantly contributed to the overall decline in optimal vascular care performance.
OPTIMAL DIABETES CARE
OPTIMAL VASCULAR CARE
CHRONIC CONDITIONS MEASURES2020 report year (2019 dates of service)
MINNESOTA HEALTH CARE QUALITY REPORT
Component 2017
HbA1c Control
HbA1c < 8.0 mg/dL
On Daily AspirinIf ischemic vascular disease
present and not contraindicated
On Statin Medication
Unless contraindicated
Tobacco-free 83.7% 83.9% 84.0% 84.2%
BP Control
BP < 140/90 mm Hg
OPTIMAL CARE 44.8% 44.9% 44.9% 45.4% p
q Significantly lower than previous year (95% confidence interval)
p Significantly higher than previous year (95% confidence interval)
83.0%
88.3%
99.3%
70.2%
q
p
83.7% 83.1%
88.1%
99.4%
69.5%
q
p
q
83.4%
87.8%
99.5%
69.2%
q
q
99.4%
86.9%
2018 2019 2020
69.4%
Component 2017
On Daily Aspirin
Unless contraindicated
On Statin Medication
Unless contraindicated
Tobacco-free 82.5% 82.4% q 82.4% 82.5%
BP Control
BP < 140/90 mm Hg
OPTIMAL CARE 61.6% 61.5% q 61.1% q 60.3% q
q Significantly lower than previous year (95% confidence interval)
p Significantly higher than previous year (95% confidence interval)
84.1% 83.5% q 83.7% 83.8%
q
90.9% 91.6% 91.6% 91.6%
93.6% 93.3% q 92.5% q 90.9%
2018 2019 2020

MN Community Measurement 10
STATEWIDE TREND OVER TIMEThe rate of performance for Optimal Asthma Control – Children measure significantly decreased in the 2020 report year compared to the 2019 report year.
The rate of performance for the Optimal Asthma Control – Adults measure remained consistent between report years.
CHRONIC CONDITIONS MEASURES2020 report year (2019 dates of service)
MINNESOTA HEALTH CARE QUALITY REPORT
OPTIMAL ASTHMA CONTROL - ADULTS OPTIMAL ASTHMA CONTROL - CHILDREN
Significant change from previous report year

MN Community Measurement 11
MENTAL HEALTH MEASURESScreening measures2020 report year (2019 dates of service)
STATEWIDE RESULTSVARIATION BY MEDICAL GROUP*
For complete measure descriptions, click here.
STATEWIDE RESULTS• The adolescent and adult
populations have similar rates of PHQ-9/PHQ-9M Utilization
VARIATION BY MEDICAL GROUP• There continues to be significant
variation in medical group performance for all three mental health screening measures
• The widest variation in performance among medical groups is found in the Adult PHQ-9/PHQ-9M Utilization measure
How to read a box plot
* Does not include medical groups with less than 30 patients
MINNESOTA HEALTH CARE QUALITY REPORT

MN Community Measurement MINNESOTA HEALTH CARE QUALITY REPORT 12
MENTAL HEALTH MEASURESScreening measures2020 report year (2019 dates of service)
ADOLESCENT MENTAL HEALTH AND/OR DEPRESSION SCREENING
STATEWIDE TREND OVER TIMEThe rate of performance for the Adolescent Mental Health and/or Depression Screening measure significantly increased in the 2020 report year compared to the 2019 report year.
Since 2015, the statewide rates have significantly increased by 48.8 percent points.
NOTE: Due to significant measure changes, trending is unavailable for the PHQ-9/PHQ-9M Utilization measures. For a complete summary of these changes, click here.
Significant change from previous report year

MN Community Measurement 13
STATEWIDE RESULTS
VARIATION BY MEDICAL GROUP*
How to read a box plot
MENTAL HEALTH MEASURESSix Month Depression Measures2020 report year (for assessment period ending in 2019)
STATEWIDE RESULTSOn average, out of every 100 patients with depression:• Approximately 43 adolescents and
49 adults are re-assessed with a PHQ9/PHQ-9M tool after six months (+/- 60 days).
• Approximately 16 adolescents and 19 adults have a response to treatment.
• Approximately eight adolescents and 11 adults are considered in remission.
VARIATION BY MEDICAL GROUP• The Follow-Up at Six Months
measures have the widest performance variation for both adults and adolescents
For complete measure descriptions, click here.
* Does not include medical groups with less than 30 patients
MINNESOTA HEALTH CARE QUALITY REPORT
NOTE: Due to significant measure changes in the 2020 report year, trending is unavailable for these measures. For a complete summary of these changes, click here.
MN Community Measurement 14
STATEWIDE RESULTS
VARIATION BY MEDICAL GROUP*
How to read a box plot
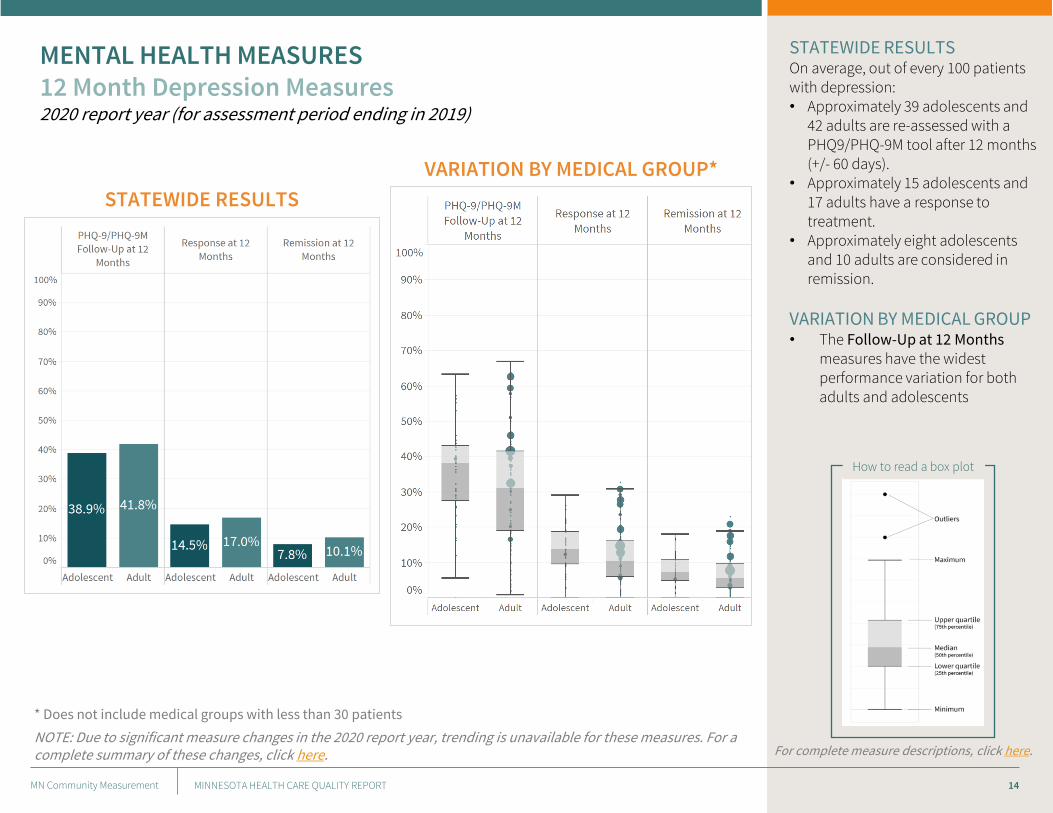
MENTAL HEALTH MEASURES12 Month Depression Measures2020 report year (for assessment period ending in 2019)
For complete measure descriptions, click here.
* Does not include medical groups with less than 30 patients
STATEWIDE RESULTSOn average, out of every 100 patients with depression:• Approximately 39 adolescents and
42 adults are re-assessed with a PHQ9/PHQ-9M tool after 12 months (+/- 60 days).
• Approximately 15 adolescents and 17 adults have a response to treatment.
• Approximately eight adolescents and 10 adults are considered in remission.
VARIATION BY MEDICAL GROUP• The Follow-Up at 12 Months
measures have the widest performance variation for both adults and adolescents
MINNESOTA HEALTH CARE QUALITY REPORT
NOTE: Due to significant measure changes in the 2020 report year, trending is unavailable for these measures. For a complete summary of these changes, click here.

MN Community Measurement 15
DEFINITIONS & METHODOLOGY
MINNESOTA HEALTH CARE QUALITY REPORT

MN Community Measurement 16
• Chlamydia Screening: The percentage of sexually active women ages 16-24 who had at least one test for chlamydia during the measurement year.
• Colorectal Cancer Screening: The percentage of adults ages 50-75 who are up-to-date with the appropriate screening for colorectal cancer. Appropriate screenings include one of the following:o Colonoscopy during the measurement period or the nine years prior; ORo Flexible sigmoidoscopy during the measurement year or the four years prior; ORo CT colonography during the measurement year or the four years prior; ORo Fecal immunochemical test (FIT)-DNA during the measurement year or the two years prior; ORo Guaiac-based fecal occult blood test (gFOBT) or FIT during the measurement year
• Optimal Diabetes Care: The percentage of patients 18-75 years of age who had a diagnosis of type 1 or type 2 diabetes and whose diabetes was optimally managed during the measurement period as defined by achieving all of the following:o HbA1c less than 8.0 mg/dLo Blood pressure less than 140/90 mm Hgo On a statin medication, unless allowed contraindications or exceptions are presento Non-tobacco usero Patient with ischemic vascular disease on daily aspirin or anti-platelets, unless allowed contraindications or
exceptions are present
• Optimal Vascular Care: The percentage of patients 18-75 years of age who had a diagnosis of ischemic vascular disease (IVD) and whose IVD was optimally managed during the measurement period as defined by achieving all of the following:o Blood pressure less than 140/90 mm Hgo On a statin medication, unless allowed contraindications or exceptions are presento Non-tobacco usero On daily aspirin or anti-platelets, unless allowed contraindications or exceptions are present
MINNESOTA HEALTH CARE QUALITY REPORT

MN Community Measurement 17
• Optimal Asthma Care – Adults: The percentage of adults 18-50 years of age who had a diagnosis of asthma and whose asthma was optimally controlled during the measurement period as defined by achieving both of the following:
o Asthma well-controlled as defined by the most recent asthma control tool result available during the measurement period
o Patient not at elevated risk of exacerbation as defined by less than two emergency department visits and/or hospitalizations due to asthma in the last 12 months
• Optimal Asthma Care – Children: The percentage of children 5-17 years of age who had a diagnosis of asthma and whose asthma was optimally controlled during the measurement period as defined by achieving both of the following: o Asthma well-controlled as defined by the most recent asthma control tool result available during the
measurement periodo Patient not at elevated risk of exacerbation as defined by less than two emergency department visits and/or
hospitalizations due to asthma in the last 12 months
SCREENING MEASURES
• Adolescent Mental Health and/or Depression Screening: The percentage of patients ages 12-17 who were screened for mental health and/or depression at a well-child visit using a specified tool. Note: Adolescents diagnosed with depression are excluded from this measure.
• PHQ-9/PHQ-9M Utilization (Adult & Adolescent): The percentage of patients with a diagnosis of Major Depression or Dysthymia who also have a completed PHQ-9 tool during the measurement period.
MINNESOTA HEALTH CARE QUALITY REPORT

MN Community Measurement 18
6 MONTH MEASURES (Adult & Adolescent)
• PHQ-9/PHQ-9M Follow-up at Six Months: The percentage of patients with depression who have a completed PHQ-9/PHQ-9M tool within six months after the index event (+/- 60 days)
• Response at Six Months: The percentage of patients with depression who demonstrated a response to treatment (at least 50 percent improvement) six months after the index event (+/- 60 days)
• Remission at Six Months: The percentage of patients with depression who reached remission (PHQ-9/PHQ-9M score less than five) six months after the index event (+/- 60 days)
12 MONTH MEASURES (Adult & Adolescent)
• PHQ-9/PHQ-9M Follow-up at 12 Months: The percentage of patients with depression who have a completed PHQ-9/PHQ-9M tool within 12 months after the index event (+/- 60 days)
• Response at 12 Months: The percentage of patients with depression who demonstrated a response to treatment (at least 50 percent improvement) 12 months after the index event (+/- 60 days)
• Remission at 12 Months: The percentage of patients with depression who reached remission (PHQ-9/PHQ-9M score less than five) 12 months after the index event (+/- 60 days)
MINNESOTA HEALTH CARE QUALITY REPORT

MN Community Measurement 19
• Composite Measures: A measure of two or more component measures, each of which individually reflects quality of care, combined into a single performance measure with a single score. The individual components are treated equally (not weighted). Every component must meet criteria to be counted in the numerator for the overall composite measure.
• Outcome Measures: These measures reflect the actual results of care. They are generally the most relevant measures for patients and the measures that providers most want to change.
• Patient-Reported Outcome Measures (PROM): A validated survey instrument or tool used to collect information directly from a patient.
• Patient-Reported Outcome – Performance Measure (PRO-PM): The measure built from a PROM.
• Process Measures: A measure that shows whether steps proven to benefit patients are being used. They measure whether an action was completed (e.g., having a medical exam or test, writing a prescription or administering a drug).
MINNESOTA HEALTH CARE QUALITY REPORT

MN Community Measurement 20
The following changes were implemented during the 2020 report year:
Age criteria 18 years and older at time of encounter 12 years and older at time of encounter
Expansion of follow-up window
+/- 30 days• 6-month measures: 5 – 7 months• 12-month measures: 11 – 13 months
+/- 60 days• 6-month measures: 4 – 8 months• 12-month measures: 10 – 14 months
Acceptable PRO tool PHQ-9 only PHQ-9 or PHQ-9M (regardless of age)
Required Exclusions • Bipolar disorder• Personality disorder
• Bipolar disorder• Schizophrenia/psychotic disorder
Allowable Exclusions • Permanent nursing home resident• Hospice/palliative care• Death
• Permanent nursing home resident• Hospice/palliative care• Death• Personality disorder – emotionally labile• Pervasive developmental disorder
Behavioral health provider
Diagnosis of major depression or dysthymia must be in the primary position for encounters in a behavioral health setting.
No restrictions on major depression or dysthymia diagnosis positioning for behavioral health providers.
Allowable timing of PHQ-9 /PHQ-9M
PHQ-9 score at the time of encounter PHQ-9/PHQ-9M score at time of encounter or up to seven days prior
MINNESOTA HEALTH CARE QUALITY REPORT

MN Community Measurement 21
PATIENT-REPORTED OUTCOME (PRO) TOOLS USED
OPTIMAL ASTHMA CONTROLMeasure accepts any of these tools:• Asthma Control Test (ACT)• Childhood Asthma Control Test
(C-ACT)• Asthma Control Questionnaire
(ACQ)• Asthma Therapy Assessment
Questionnaire
ADOLESCENT AND ADULT DEPRESSION• Patient Health Questionnaire
(PHQ-9/PHQ-9M)
PRO-PM: Patient-reported Outcome
Performance Measure
QUALITY MEASURES BY MEASURE TYPE
Process Outcome PRO-PM HEDIS
Chlamydia Screening in Women
Colorectal Cancer Screening
Optimal Asthma Control - Adults
Optimal Asthma Control - Children
Optimal Diabetes Care
Optimal Vascular Care
Adolescent Mental Health and/or Depression
Screening
Adolescent Depression: PHQ-9/PHQ-9M Utilization
Adolescent Depression: Follow-Up at Six Months
Adolescent Depression: Response at Six Months
Adolescent Depression: Remission at Six Months
Adolescent Depression: Follow-Up at 12 Months
Adolescent Depression: Response at 12 Months
Adolescent Depression: Remission at 12 Months
Adult Depression: PHQ-9/PHQ-9M Utilization
Adult Depression: Follow-Up at Six Months
Adult Depression: Response at Six Months
Adult Depression: Remission at Six Months
Adult Depression: Follow-Up at 12 Months
Adult Depression: Response at 12 Months
Adult Depression: Remission at 12 Months
TOTAL 9 12 10 1
MINNESOTA HEALTH CARE QUALITY REPORT

MN Community Measurement 22
The measures in this report are collected from two separate data sources: clinics and health plans. Direct Data Submission (DDS) measures use data from clinics. This data enables reporting of results by clinic location as well as by medical group. In contrast, the Healthcare Effectiveness Data and Information Set (HEDIS) measures use data from health plans. This data enables reporting of results by medical group only.
The table on the next slide shows the number of patients included in each measure and the data source. HEDIS measures include patients enrolled in commercial health insurance products, Medicare managed care or Medicaid managed care programs. Patients who are uninsured, or those served by a Medicaid/Medicare fee-for-service program are not included. The number of patients eligible for these measures is further narrowed by criteria specifying a minimum amount of time a member/patient must be continuously enrolled in a health plan to be eligible for the measure.
In contrast, DDS measures rely on data from clinics across Minnesota to identify the number of patients eligible for the measure. All eligible clinic patients are reflected regardless of insurance coverage type and duration. As a result, DDS measures have a larger number of eligible patients for the measures.
MINNESOTA HEALTH CARE QUALITY REPORT

MN Community Measurement 23
DATA SOURCESNUMBER OF PATIENTS INCLUDED IN QUALITY MEASURES
The measures in this report are collected from two separate data sources: clinics and health plans.
• Direct Data Submission (DDS) measures use data from clinics, which enables reporting by clinic location and medical group.
• HEDIS measures use data from health plans, which enables reporting of results by medical group only.
This table shows the number of patients included in each measure.
HEDIS MEASURES
• Include patients enrolled in commercial health insurance products, Medicare managed care or Medicaid managed care programs.
• Does NOT include patients who are uninsured or those served by a Medicaid/Medicare fee-for-service program, patients who do not meet continuous enrollment criteria for measure
DDS MEASURES
• Rely on data from clinics across Minnesota to identify eligible patients
• All eligible clinic patients are reflected, regardless of insurance coverage type and duration
TABLE OVERVIEW
MINNESOTA HEALTH CARE QUALITY REPORT
Data
Source
Age
Range
Number of
Patients
Eligible for
Measure
Number of
Patients in
Measure
Denominator
Chlamydia Screening in Women Health Plan 16-24 93,221 93,221
Colorectal Cancer Screening DDS 50-75 1,422,385 1,419,934
Optimal Asthma Control - Adults DDS 18-50 142,932 142,612
Optimal Asthma Control - Children DDS 5-17 71,256 70,905
Optimal Diabetes Care DDS 18-75 322,178 321,962
Optimal Vascular Care DDS 18-75 189,299 189,299
Adolescent Mental Health and/or Depression Screening DDS 12-17 166,398 166,311
Adolescent Depression: PHQ-9/PHQ-9M Utilization DDS 12-17 19,574 19,574
Adolescent Depression: Follow-Up at Six Months DDS 12-17 11,658 11,658
Adolescent Depression: Response at Six Months DDS 12-17 11,658 11,658
Adolescent Depression: Remission at Six Months DDS 12-17 11,658 11,658
Adolescent Depression: Follow-Up at 12 Months DDS 12-17 11,658 11,658
Adolescent Depression: Response at 12 Months DDS 12-17 11,658 11,658
Adolescent Depression: Remission at 12 Months DDS 12-17 11,658 11,658
Adult Depression: PHQ-9/PHQ-9M Utilization DDS 18+ 248,162 248,162
Adult Depression: Follow-Up at Six Months DDS 18+ 120,344 120,344
Adult Depression: Response at Six Months DDS 18+ 120,344 120,344
Adult Depression: Remission at Six Months DDS 18+ 120,344 120,344
Adult Depression: Follow-Up at 12 Months DDS 18+ 120,344 120,344
Adult Depression: Response at 12 Months DDS 18+ 120,344 120,344
Adult Depression: Remission at 12 Months DDS 18+ 120,344 120,344
PR
EV
HE
AL
TH
CH
RO
NIC
CO
ND
ITIO
NS
ME
NT
AL
HE
AL
TH

MN Community Measurement 24
DDS measures use data submitted directly to MNCM by medical groups and clinics.
DATA COLLECTIONData are reported at two levels: by clinic site and medical group.
Clinic abstractors collect data from medical records either by extracting the data from an electronic medical record (EMR) via data query or from abstraction of paper-based medical records. All appropriate Health Insurance Portability and Accountability (HIPAA) requirements are followed for data transfer to MNCM.
MNCM staff conduct an extensive validation process including pre-submission data certification, post submission data quality checks of all files, and audits of the data source for selected clinics. For medical record audits, MNCM uses NCQA’s “8 and 30” File Sampling Procedure, developed in 1996 in consultation with Johns Hopkins University. For a detailed description of this procedure, see www.ncqa.org. Audits are conducted by trained MNCM auditors who are independent of medical groups and/or clinics. The validation process ensures the data are reliable, complete and consistent.
ELIGIBLE POPULATION SPECIFICATIONSThe eligible population for each measure is identified by a medical group on behalf of their individual clinics. MNCM’s 2019 DDS Data Collection Guides provide technical specifications for the standard definitions of the eligible population, including elements such as age.
NUMERATOR SPECIFICATIONS For DDS measures, the numerator is the number of patients identified from the eligible population who meet the numerator criteria. The numerator is calculated using the clinical quality data submitted by the medical group; this data is verified through MNCM’s validation process.
MINNESOTA HEALTH CARE QUALITY REPORT

MN Community Measurement 25
CALCULATING RATESDue to the dynamic nature of patient populations, rates and 95 percent confidence intervals are calculated for each measure for each medical group/clinic regardless of whether the full population or a sample is submitted. The statewide average rate is displayed when comparing a single medical group/clinic to the performance of all medical groups/clinics to provide context. The statewide average is calculated using all data submitted to MNCM which may include some data from clinics located in neighboring states.
RISK ADJUSTMENT
Risk adjustment is a technique used to enable fair comparisons of clinics/medical groups by adjusting for the differences in risk among specific patient groups. MNCM uses an “Actual to Expected” methodology for risk adjustment. This methodology does not alter a clinic/medical group’s result; the actual rate remains unchanged. Instead, each clinic/medical group’s rate is compared to an “expected rate” for that clinic/medical group based on the specific characteristics of patients seen by theclinic/medical group, compared to the total patient population.
All expected values for DDS measures are calculated using a logistic regression model including the following variables:
health insurance product type (commercial, Medicare, Medicaid, uninsured, unknown), patient age, and deprivation index.
The deprivation index was added in 2018 and includes ZIP code level average of poverty, public assistance, unemployment,
single female with child(ren), and food stamps (SNAP) converted to a single index that is a proxy for overall socioeconomic
status.
A population proportions test is used to determine whether there is a statistically significant difference between the
expected and actual rates of optimally managed patients attributed to each clinic/medical group. The methodology uses a
95 percent test of significance.
MINNESOTA HEALTH CARE QUALITY REPORT

MN Community Measurement 26
RISK ADJUSTMENT CONTINUEDThe tables for the risk-adjusted measures include the following information:
• Medical group/clinic name
• Performance
o “Above Average ” = Clinic or medical group’s actual rate is significantly above its expected rate
o “Expected” = Clinic or medical group’s actual rate is equivalent to its expected rate
o “Below Average” = Clinic or medical group’s actual rate is significantly below its expected rate
• Patients = Number of patients at a medical group/clinic site that meet the denominator criteria for the measure.
• Actual Rate = Actual percentage of patients meeting criteria (unadjusted rate).
• Expected Rate = Expected percentage of patients meeting criteria based on the clinic’s/medical group’s mix of patient
risk (adjusted rate).
• Actual to Expected Ratio = Actual percentage of patients meeting criteria divided by the expected percentage of
patients meeting criteria for the clinic’s/medical group’s mix of patient risk.
THRESHOLD FOR PUBLIC REPORTING MNCM has established minimum thresholds for public reporting of DDS measures to ensure statistically reliable rates. Only medical groups and clinics that meet the threshold of 30 patients in the denominator of each measure are publicly reported.
MINNESOTA HEALTH CARE QUALITY REPORT

MN Community Measurement 27
HEDIS is a national set of performance measures used in the managed care industry that were developed and maintained by the National Committee for Quality Assurance (NCQA). Clinic HEDIS measures use data from the administrative or hybrid data collection methodology.
DATA COLLECTION• Administrative Method: These HEDIS measures use health plan claims data to identify the patients who are eligible for
the measure (denominator) and for the numerator.
• Hybrid Method: These HEDIS measures use health plan claims data to identify the patients who are eligible for the measures. Numerator information comes from health plan claims and medical record review data. Because medical record review data is costly and time-consuming to collect, health plans select a random sample from the eligible patients to identify the measure denominator. For the immunization measures, health plans also use data from the Minnesota Immunization Information Connection (MIIC).
• Continuous enrollment criteria: The minimum amount of time for a member/patient to be enrolled in a health plan to be eligible for a HEDIS measure. It ensures the health plan has enough time to render services. If a member/patient does not meet minimum continuous enrollment criteria, they are not eligible to be included in the measure denominator.
ELIGIBLE POPULATION SPECIFICATIONSThe eligible populations for the administrative and hybrid measures are identified by each participating health plan using its respective administrative claims database. Health plans assign patients to a medical group using a standard medical group definition based on a tax identification number (TIN). Administrative billing codes determine the frequency of a patient’s visit to a medical group. For most measures, patients are assigned to the medical group they visited most frequently during the measurement period. Patients who visited two or more medical groups with the same frequency are attributed to the medical group visited most recently in the measurement period. The TIN is used as the common identifier for aggregating data across health plans.
MINNESOTA HEALTH CARE QUALITY REPORT

MN Community Measurement 28
NUMERATOR SPECIFICATIONSFor HEDIS administrative measures, the numerator is the number of patients from the eligible population who met the numerator criteria. For HEDIS hybrid measures, the numerator is the number of patients from the sample who met numerator criteria.
CALCULATING RATESHEDIS administrative and hybrid measures are reported at a medical group level and are expressed as percentages. Rates calculated for hybrid measures require weighting because of the sampling procedures applied. Rates and 95-percent asymmetrical confidence intervals are calculated for each measure for each medical group. (Asymmetrical confidence intervals are used to avoid confidence interval lower bound values less than zero and upper bound values greater than one hundred.). The medical group overall average is used to compare to the individual medical group’s rate for the performance ratings. The statewide average includes attributed and unattributed patients.
HEDIS measures are not risk adjusted, therefore do not have Actual to Expected Ratios. Columns for Lower and Upper 95% Confidence Intervals are included. HEDIS measures are rated on the following scale: • Above = Clinic or medical group’s actual rate is significantly above the medical group average• Average = Clinic or medical group’s actual rate is equivalent to the medical group average • Below = Clinic or medical group’s actual rate is significantly below the medical group average
THRESHOLDS FOR PUBLIC REPORTINGMNCM has established minimum thresholds for HEDIS public reporting to ensure statistically reliable rates. Only medical groups that meet the thresholds of 30 patients in the denominator of HEDIS administrative measures and 60 patients in the denominator of HEDIS hybrid measures are publicly reported.
LIMITATIONSData used to calculate rates for the HEDIS measures reflect patients insured through 10 health plans doing business in Minnesota. Patients who are uninsured, self-pay, or who are served by Medicaid/Medicare fee-for-service are not reflected in the HEDIS results.
MINNESOTA HEALTH CARE QUALITY REPORT

MN Community Measurement 29
ONLINE APPENDIX TABLES
• Preventive Health
• Chronic Conditions
• Mental Health Screening
• Adolescent Depression: Six Month Measures
• Adolescent Depression: 12 Month Measures
• Adult Depression: Six Month Measures
• Adult Depression: 12 Month Measures
MINNESOTA HEALTH CARE QUALITY REPORT