health care spending and quality benchmark …€¦ · recommendations on how the spending and...
TRANSCRIPT
HEALTH CARE SPENDING AND QUALITY
BENCHMARK RECOMMENDATIONS
KARA ODOM WALKER, MD, MPH, MSHS
CABINET SECRETARY, DEPARTMENT OF HEALTH AND SOCIAL SERVICES
HEALTH CARE COMMISSION
SEPTEMBER 6, 2018
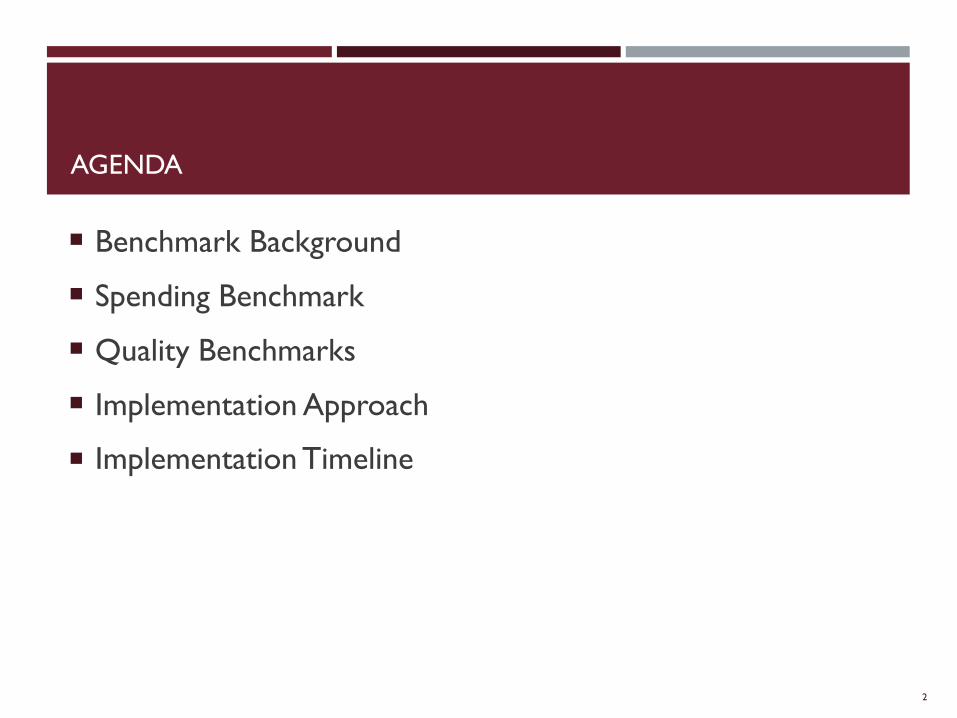
AGENDA
2
Benchmark Background
Spending Benchmark
Quality Benchmarks
Implementation Approach
Implementation Timeline

BENCHMARK BACKGROUND
3
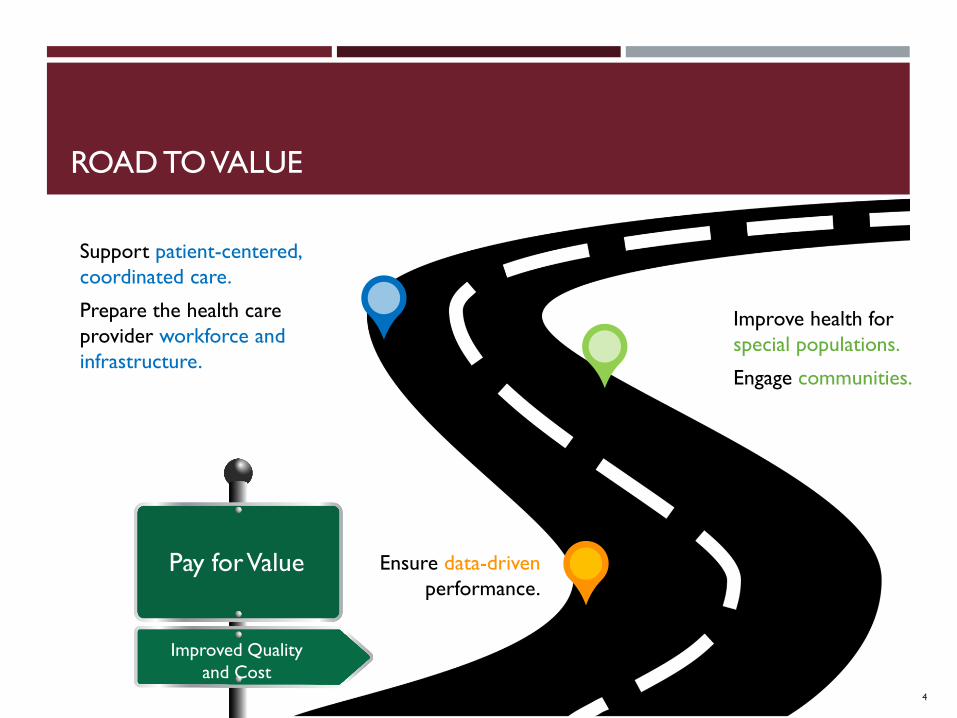
ROAD TO VALUE
4
Support patient-centered,
coordinated care.
Prepare the health care
provider workforce and
infrastructure.
Improve health for
special populations.
Engage communities.
Ensure data-driven
performance.Pay for Value
Improved Quality
and Cost
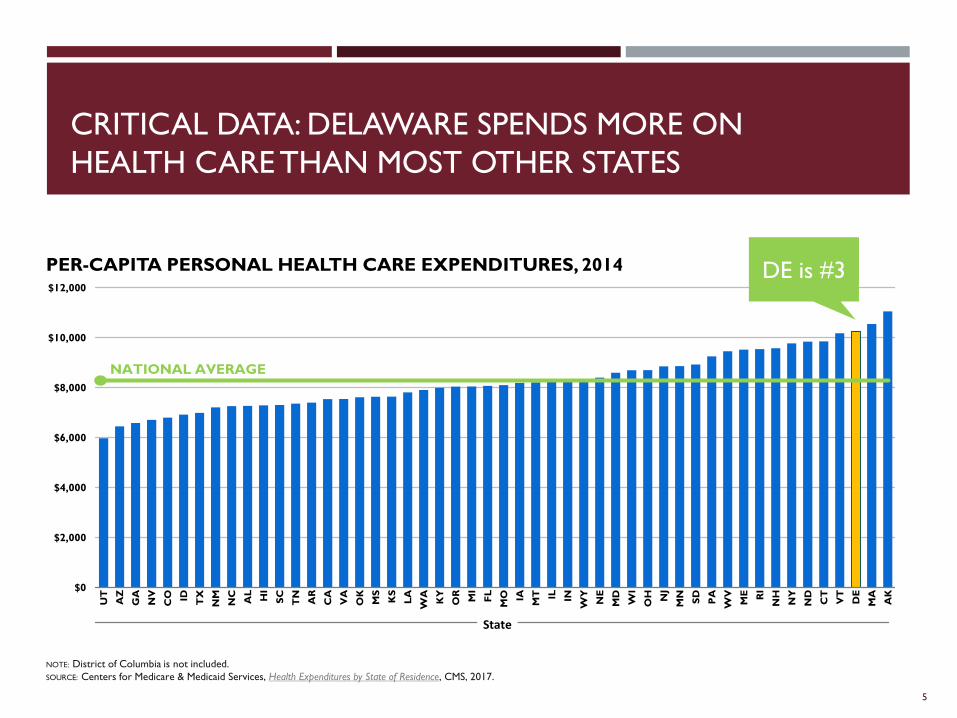
CRITICAL DATA: DELAWARE SPENDS MORE ON
HEALTH CARE THAN MOST OTHER STATES
5
PER-CAPITA PERSONAL HEALTH CARE EXPENDITURES, 2014
NOTE: District of Columbia is not included.
SOURCE: Centers for Medicare & Medicaid Services, Health Expenditures by State of Residence, CMS, 2017.
$0
$2,000
$4,000
$6,000
$8,000
$10,000
$12,000
UT
AZ
GA
NV
CO ID TX
NM
NC
AL
HI
SC
TN
AR
CA
VA
OK
MS
KS
LA
WA
KY
OR
MI
FL
MO IA
MT IL IN
WY
NE
MD
WI
OH NJ
MN
SD
PA
WV
ME RI
NH
NY
ND
CT
VT
DE
MA
AK
State
NATIONAL AVERAGE
DE is #3
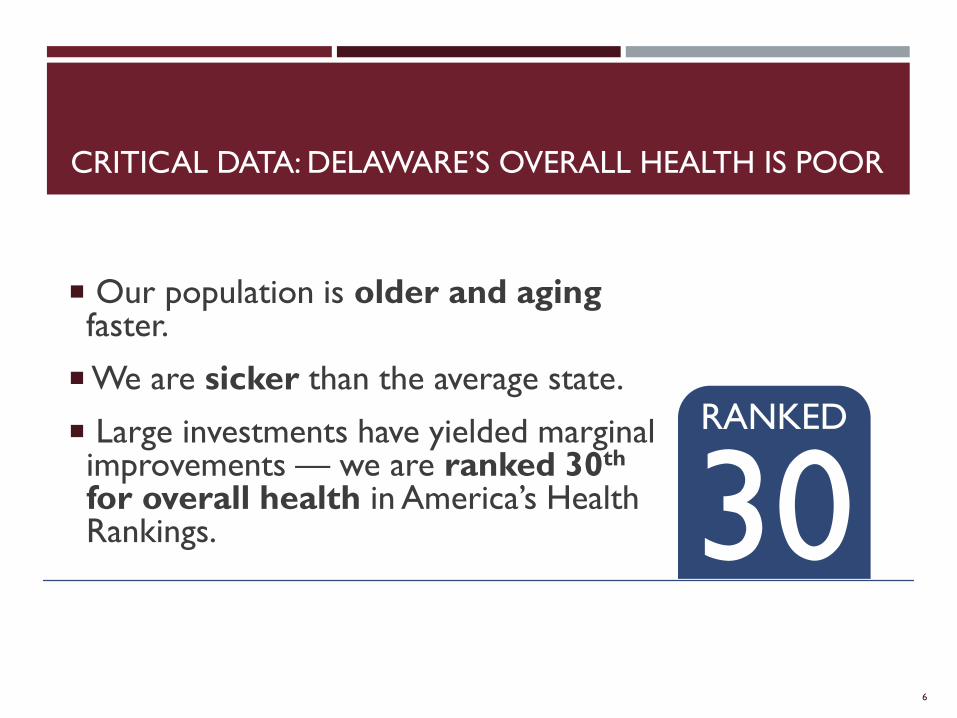
CRITICAL DATA: DELAWARE’S OVERALL HEALTH IS POOR
Our population is older and aging faster.
We are sicker than the average state.
Large investments have yielded marginal improvements — we are ranked 30th
for overall health in America’s Health Rankings.
6
30RANKED
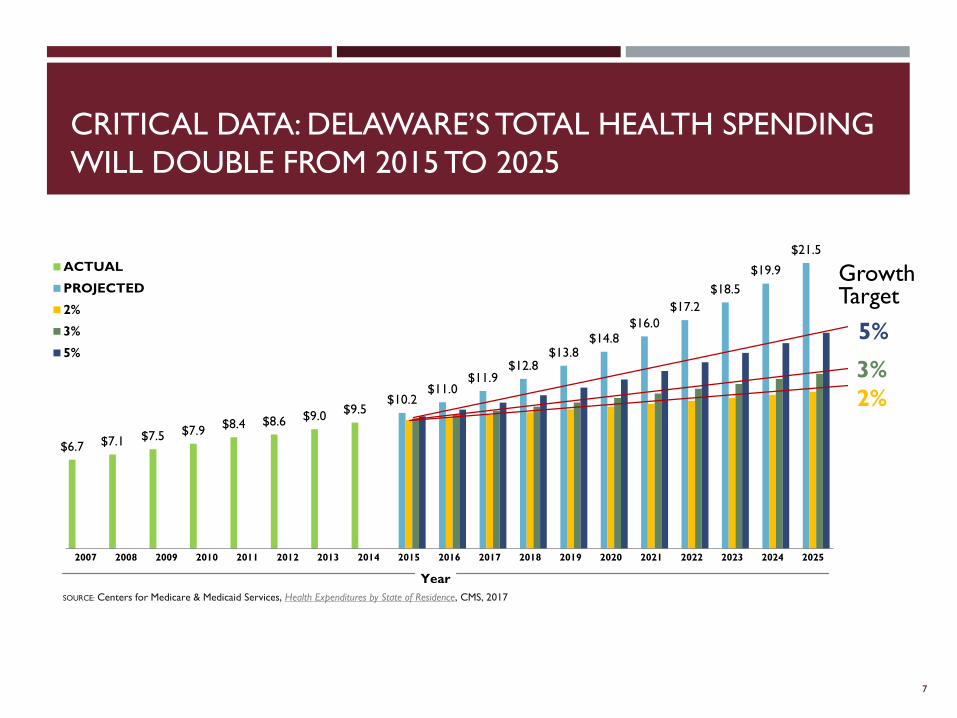
CRITICAL DATA: DELAWARE’S TOTAL HEALTH SPENDING
WILL DOUBLE FROM 2015 TO 2025
7
$6.7 $7.1 $7.5 $7.9$8.4 $8.6 $9.0
$9.5$10.2
$11.0$11.9
$12.8$13.8
$14.8$16.0
$17.2
$18.5
$19.9
$21.5
2007 2008 2009 2010 2011 2012 2013 2014 2015 2016 2017 2018 2019 2020 2021 2022 2023 2024 2025
ACTUAL
PROJECTED
2%
3%
5%
SOURCE: Centers for Medicare & Medicaid Services, Health Expenditures by State of Residence, CMS, 2017
Year
Growth Target
5%
3%
2%
FOUNDATION FOR BENCHMARK DEVELOPMENT
Early payment reform work of the Delaware Center for Health Innovation
House Joint Resolution 7 authorized the establishment of an annual health care benchmark
Benchmark summits
Executive Order19 established an Advisory Group of Delaware health care leaders
o The group was formed, met multiple times, and then submitted its report on spending and quality benchmark methodologies in June 2018
Based on the Advisory Group’s feedback, Secretary Walker made recommendations on health care spending and quality benchmarks to Governor Carney in August 2018
8
SPENDING AND QUALITY BENCHMARKS
9

PURPOSE OF THE SPENDING AND QUALITY BENCHMARKS
Spending and quality benchmarks measure and monitor both the cost of health care in Delaware and the quality of the care being delivered.
The ultimate goal is to deliver better care at an affordable cost, which will lead to an overall healthier Delaware.
10
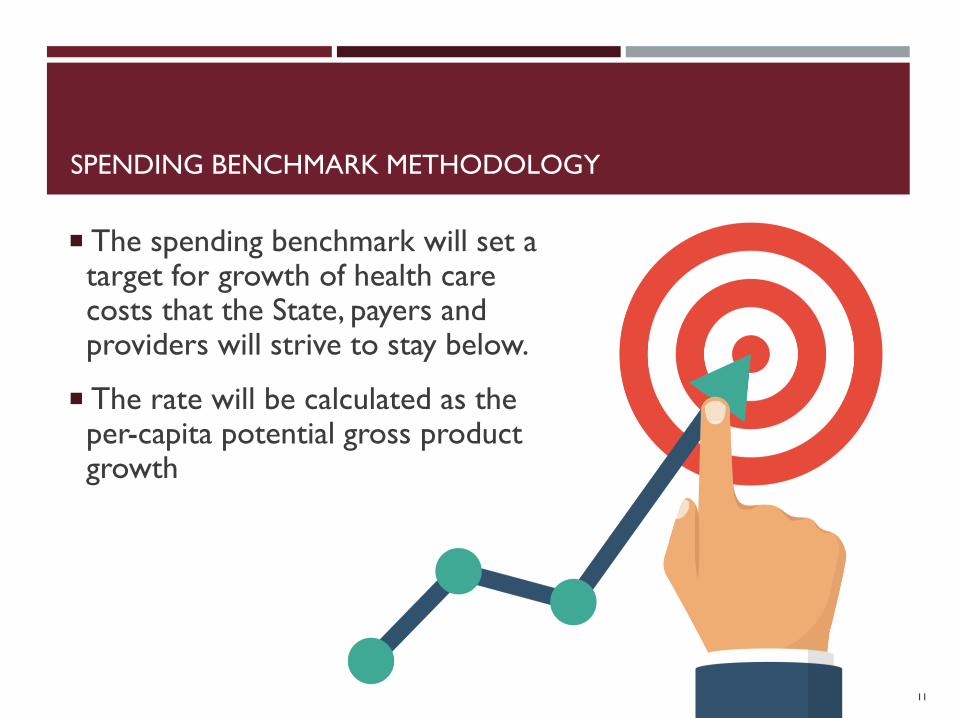
SPENDING BENCHMARK METHODOLOGY
The spending benchmark will set a target for growth of health care costs that the State, payers and providers will strive to stay below.
The rate will be calculated as the per-capita potential gross product growth
11
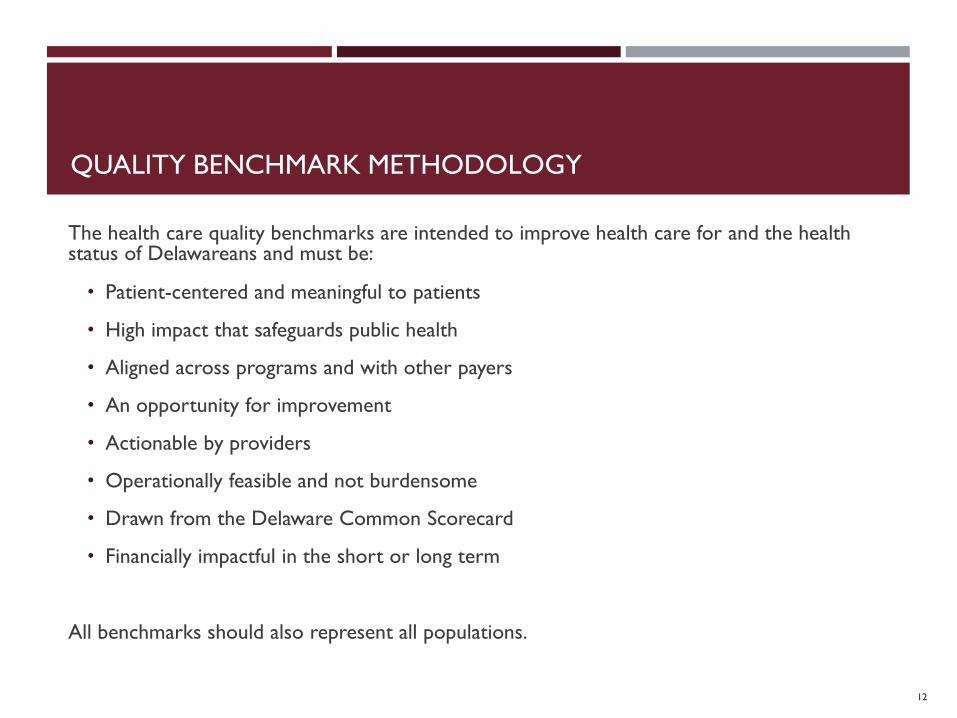
QUALITY BENCHMARK METHODOLOGY
The health care quality benchmarks are intended to improve health care for and the health status of Delawareans and must be:
• Patient-centered and meaningful to patients
• High impact that safeguards public health
• Aligned across programs and with other payers
• An opportunity for improvement
• Actionable by providers
• Operationally feasible and not burdensome
• Drawn from the Delaware Common Scorecard
• Financially impactful in the short or long term
All benchmarks should also represent all populations.
12
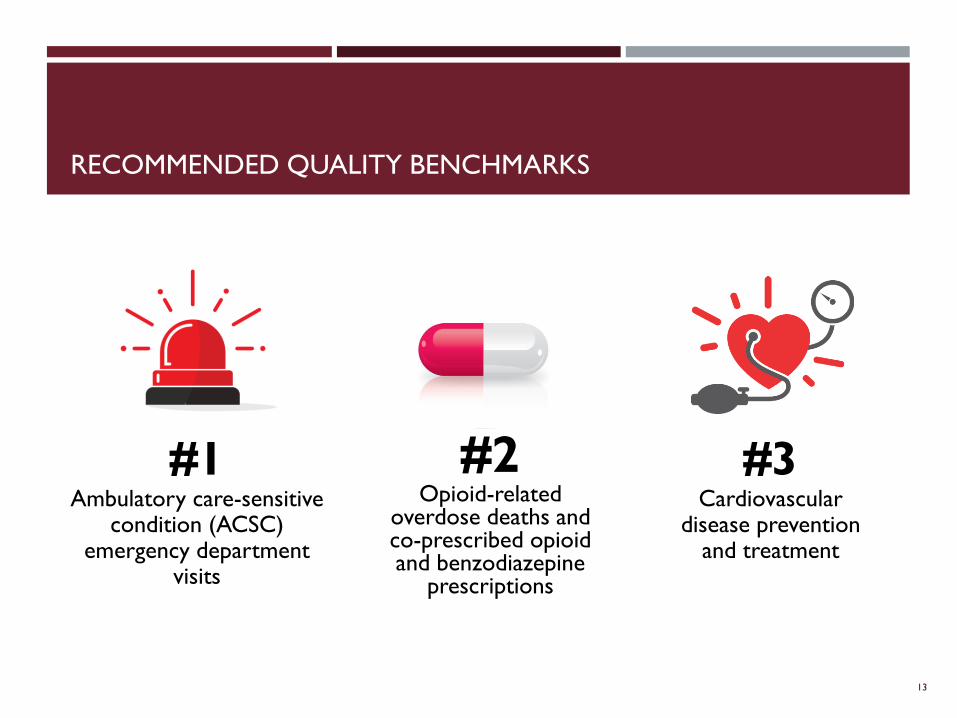
RECOMMENDED QUALITY BENCHMARKS
#1Ambulatory care-sensitive
condition (ACSC) emergency department
visits
13
#2Opioid-related
overdose deaths and co-prescribed opioid and benzodiazepine
prescriptions
#3Cardiovascular
disease prevention and treatment

REDUCING ACSC EMERGENCY DEPARTMENT VISITS
ED visits in the state are above the expected level, but below the national average.
According to the CDC, in the U.S. overall, there are 42 ED visits per 100 persons.
Many ED visits are for non-urgent or primary-care-treatable issues.
14
Quality Benchmark
#1
TAKING EFFECTIVE ACTION TO COMBAT THE OPIOID EPIDEMIC
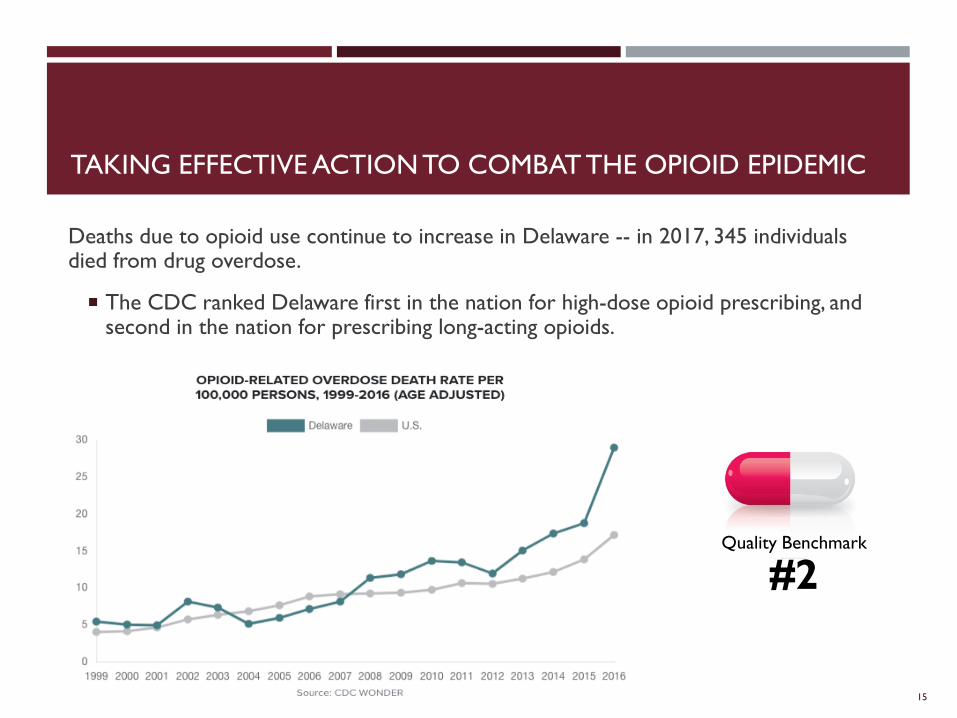
Deaths due to opioid use continue to increase in Delaware -- in 2017, 345 individuals died from drug overdose.
The CDC ranked Delaware first in the nation for high-dose opioid prescribing, and second in the nation for prescribing long-acting opioids.
15
Quality Benchmark
#2
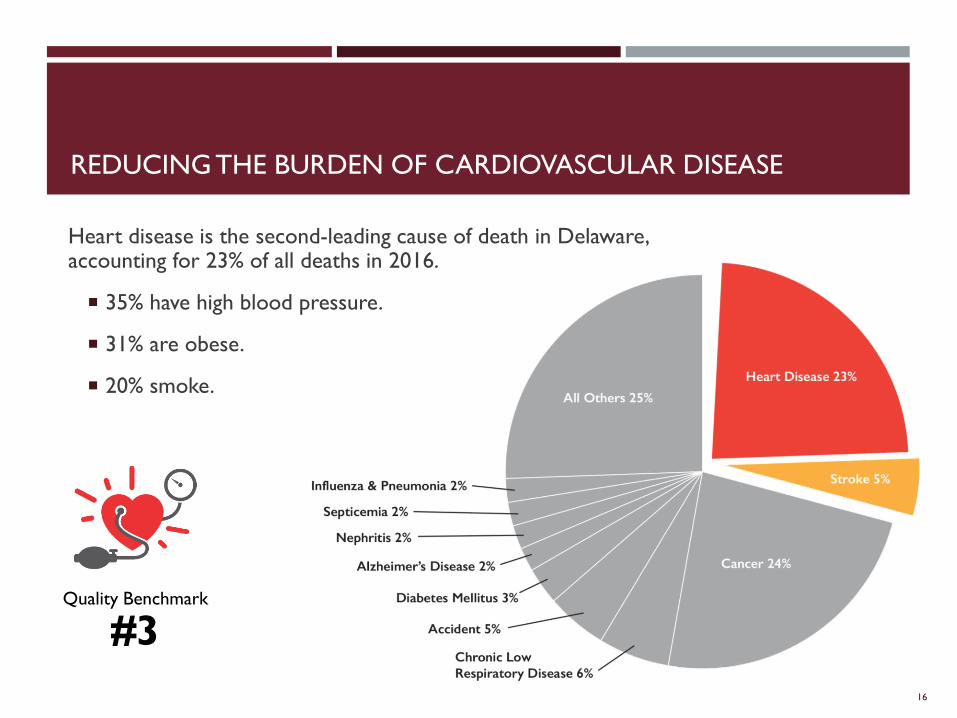
REDUCING THE BURDEN OF CARDIOVASCULAR DISEASE
Heart disease is the second-leading cause of death in Delaware, accounting for 23% of all deaths in 2016.
35% have high blood pressure.
31% are obese.
20% smoke.
16
Quality Benchmark
#3
RECOMMENDATIONS ON HOW THE SPENDING AND
QUALITY BENCHMARKS WILL BE MET
Set aspirational and attainable goals.
Evaluate where we are every three years for quality and every five years for costs.
Oversight by a Health Care Commission advisory group who will:
o Contract for analytics.
o Leverage existing data from DHIN.
o Publicize findings.
Create a technical manual to describe the process for assessing performance against the benchmarks.
Analyze variations in health care delivery and costs.
Give community partners and other interested parties a way to use our analysis to address identified opportunities for improvement.
17
RECOMMENDATIONS ON HOW TO MANAGE THE SPENDING
AND QUALITY BENCHMARKS
In the recommendations to Governor Carney, the Health Care Commission would change in these ways:
Include one or more insurers
Limit the number of provider seats
With the next Chair, ensure that individuals employed by or contracting with insurer or provider organizations subject to the benchmarks not head the HCC
18
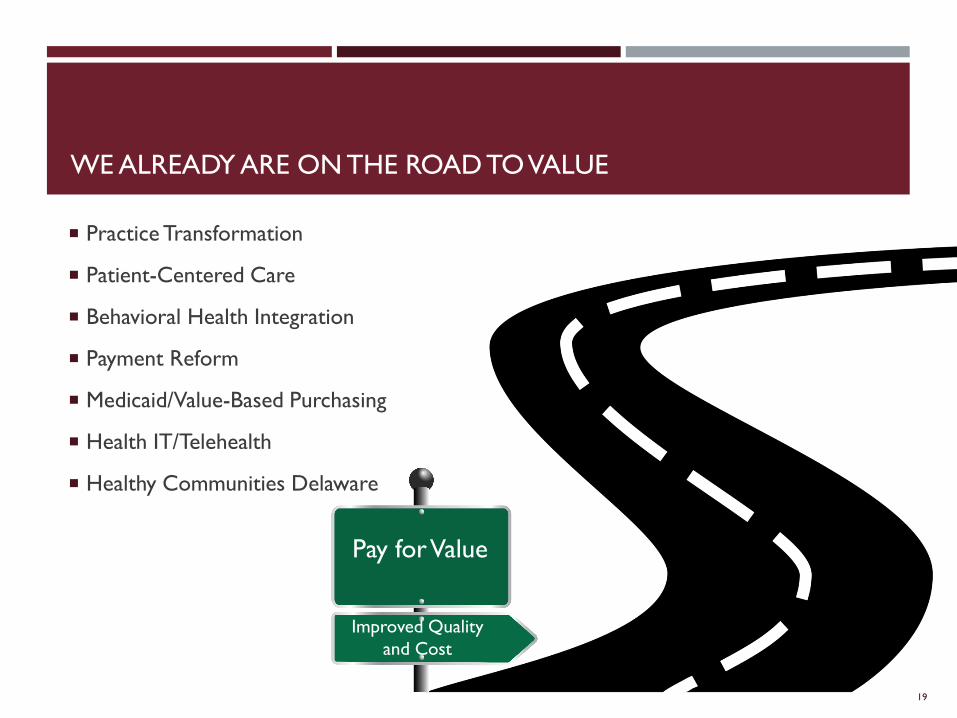
WE ALREADY ARE ON THE ROAD TO VALUE
Practice Transformation
Patient-Centered Care
Behavioral Health Integration
Payment Reform
Medicaid/Value-Based Purchasing
Health IT/Telehealth
Healthy Communities Delaware
19
Pay for Value
Improved Quality
and Cost
SPENDING AND QUALITY BENCHMARKS TIMELINE
20
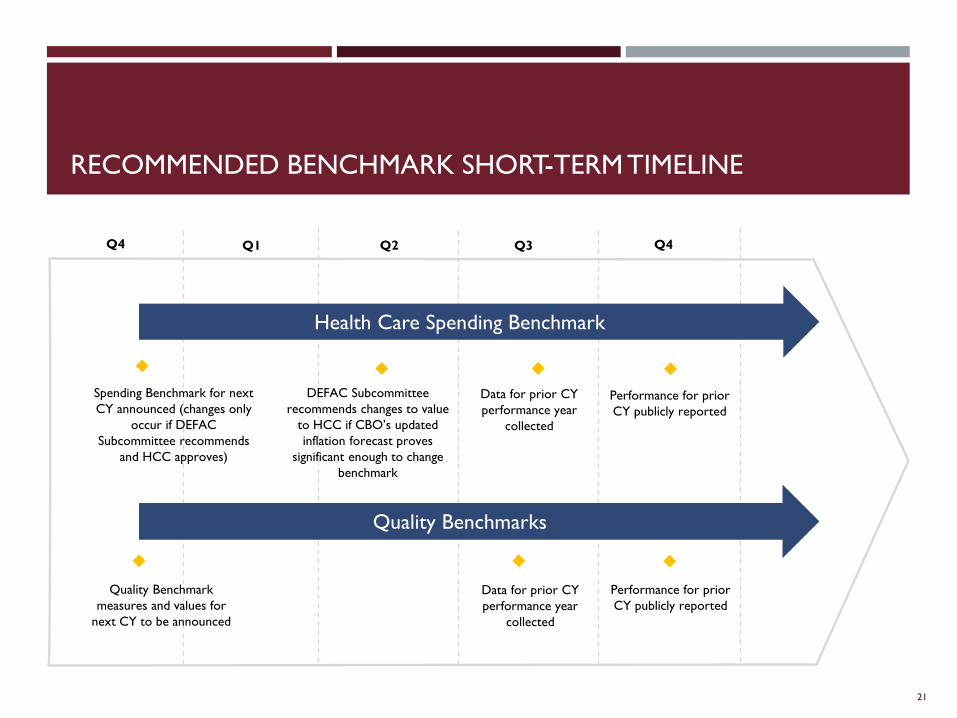
RECOMMENDED BENCHMARK SHORT-TERM TIMELINE
21
Q4
Health Care Spending Benchmark
Quality Benchmarks
Spending Benchmark for next
CY announced (changes only
occur if DEFAC
Subcommittee recommends
and HCC approves)
DEFAC Subcommittee
recommends changes to value
to HCC if CBO’s updated
inflation forecast proves
significant enough to change
benchmark
Quality Benchmark
measures and values for
next CY to be announced
Data for prior CY
performance year
collected
Performance for prior
CY publicly reported
Data for prior CY
performance year
collected
Performance for prior
CY publicly reported
Q1 Q2 Q3 Q4
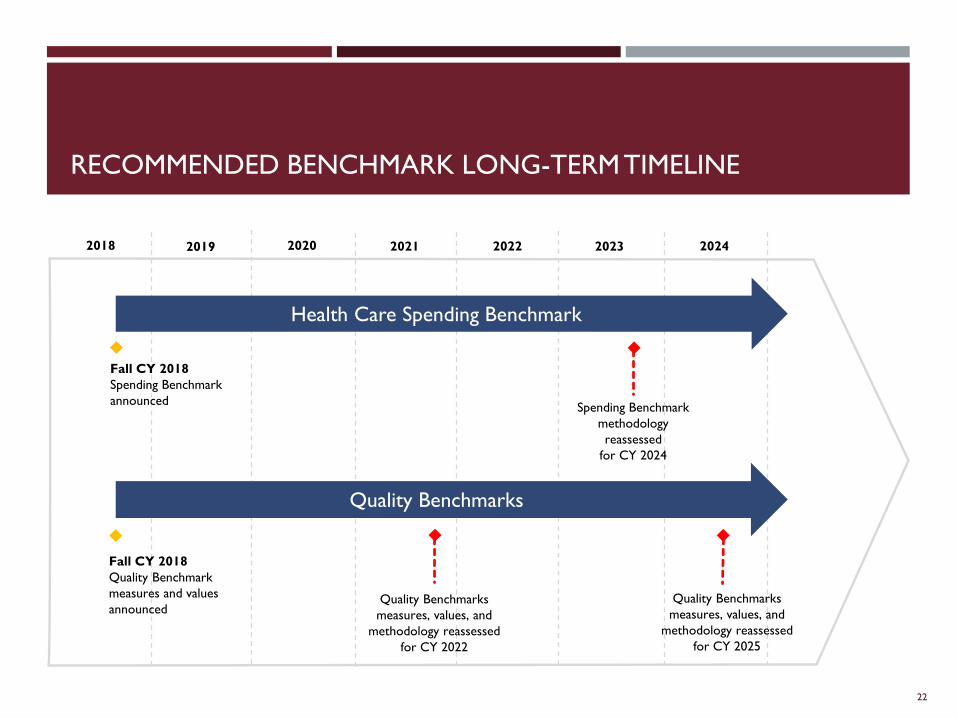
RECOMMENDED BENCHMARK LONG-TERM TIMELINE
22
Health Care Spending Benchmark
Quality Benchmarks
Fall CY 2018
Spending Benchmark
announcedSpending Benchmark
methodology
reassessed
for CY 2024
Quality Benchmarks
measures, values, and
methodology reassessed
for CY 2022
2018
Fall CY 2018
Quality Benchmark
measures and values
announcedQuality Benchmarks
measures, values, and
methodology reassessed
for CY 2025
2019 2020 2021 2022 2023 2024

CONTINUE THE CONVERSATION
Share your feedback with us through [email protected].
Visit ChooseHealthDE.com for more information and to sign up for updates.
23

THANK YOU. QUESTIONS?
24