health data jungle: fundamentals of data and...
TRANSCRIPT

MAKE Health 01Holzinger Group, hci‐kdd.org 1
Andreas Holzinger185.A83 Machine Learning for Health Informatics
2017S, VU, 2.0 h, 3.0 ECTSModule 01 – 14.03.2017
Health Data Jungle:Selected Topics on Fundamentals of Data
and Information Entropya.holzinger@hci‐kdd.org
http://hci‐kdd.org/machine‐learning‐for‐health‐informatics‐course

MAKE Health 01Holzinger Group, hci‐kdd.org 2
01 Data – the underlying physics of data 02 Biomedical data sources – taxonomy of data 03 Data integration, mapping, fusion 04 Probabilistic Information 05 Information Theory – Information Entropy 06 Cross‐ Entropy ‐ Kullback‐Leibler Divergence
Red thread through the lecture today

MAKE Health 01Holzinger Group, hci‐kdd.org 3
Holzinger, A. 2014. Trends in Interactive Knowledge Discovery for Personalized Medicine: Cognitive Science meets Machine Learning. IEEE Intelligent Informatics Bulletin, 15, (1), 6‐14.
ML needs a concerted effort fostering integrated research
http://hci‐kdd.org/international‐expert‐network
MAKE Health 01Holzinger Group, hci‐kdd.org 4
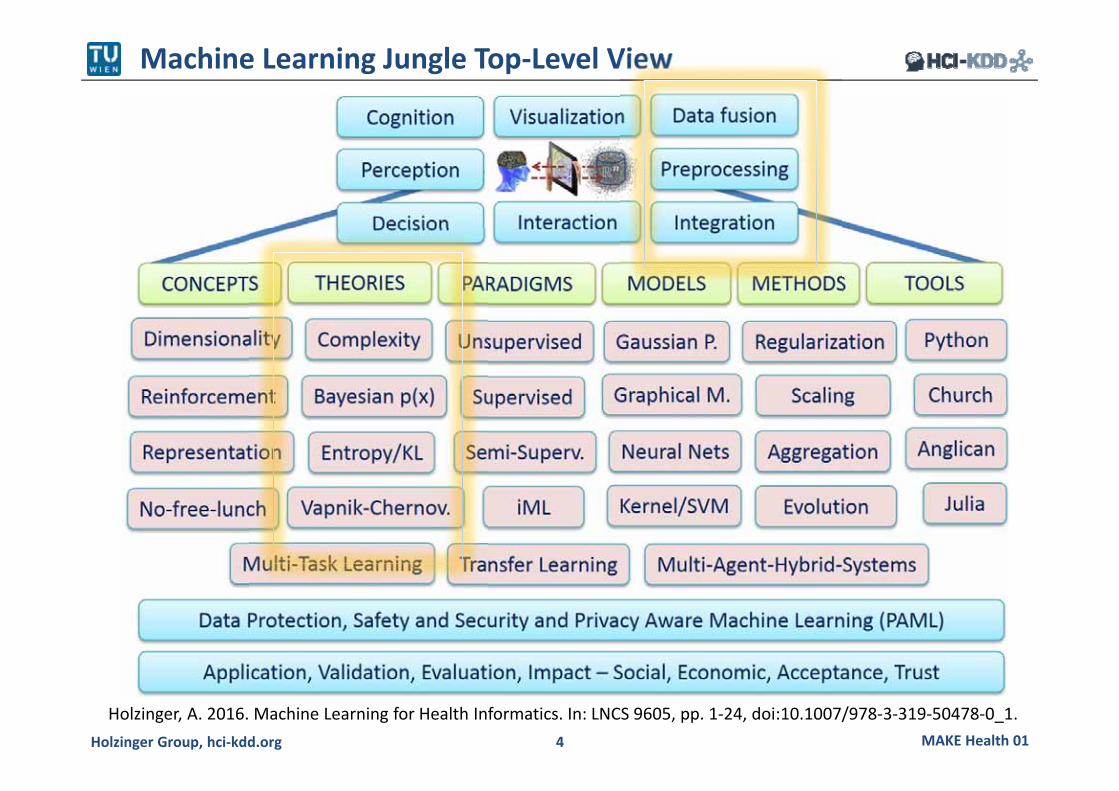
Machine Learning Jungle Top‐Level View
Holzinger, A. 2016. Machine Learning for Health Informatics. In: LNCS 9605, pp. 1‐24, doi:10.1007/978‐3‐319‐50478‐0_1.

MAKE Health 01Holzinger Group, hci‐kdd.org 5
01 Reflection
Image source: http://www.hutui6.com/reflection‐wallpapers.html

MAKE Health 01Holzinger Group, hci‐kdd.org 6
Warm‐up Quiz
213
4 5 6
7 8context
9

MAKE Health 01Holzinger Group, hci‐kdd.org 7
Question: Where is the Biologist in this image?
Domingos, P. 2015. The Master Algorithm: How the Quest for the Ultimate Learning Machine Will Remake Our World, Penguin UK.
Image source: http://www.efmc.info/medchemwatch‐2014‐1/lab.php

MAKE Health 01Holzinger Group, hci‐kdd.org 8
Repetition of Bayes ‐ on the work of Laplace

MAKE Health 01Holzinger Group, hci‐kdd.org 9
Your MD has bad news and good news for you. Bad news first: You are tested positive for a serious disease, and the test is 99% accurate (T)
Good news: It is a rare disease, striking 1 in 10,000 (D) How worried would you now be?
Practical Example: Diagnoses
1 1 0,99 1 0,0001
, ∗ ,, ∗ , , ∗ ,
=
= 0,0098
= ∗

MAKE Health 01Holzinger Group, hci‐kdd.org 10
Heterogeneous, distributed, inconsistent data sources (need for data integration & fusion) [1] Complex data (high‐dimensionality – challenge of dimensionality reduction and visualization) [2] Noisy, uncertain, missing, dirty, and imprecise, imbalanced data (challenge of pre‐processing) The discrepancy between data‐information‐knowledge (various definitions) Big data sets in high‐dimensions (manual handling of the data is often impossible) [3]
Key Problems
1. Holzinger A, Dehmer M, & Jurisica I (2014) Knowledge Discovery and interactive Data Mining in Bioinformatics ‐ State‐of‐the‐Art, future challenges and research directions. BMC Bioinformatics 15(S6):I1.
2. Hund, M., Sturm, W., Schreck, T., Ullrich, T., Keim, D., Majnaric, L. & Holzinger, A. 2015. Analysis of Patient Groups and Immunization Results Based on Subspace Clustering. In: LNAI 9250, 358‐368.
3. Holzinger, A., Stocker, C. & Dehmer, M. 2014. Big Complex Biomedical Data: Towards a Taxonomy of Data. in CCIS 455. Springer 3‐18.

MAKE Health 01Holzinger Group, hci‐kdd.org 11
What is this?

MAKE Health 01Holzinger Group, hci‐kdd.org 12
Goal of Machine Learning in Health Informatics
Statistical inference & Decision support:Better a good solution
in time,than a perfect solution never …

MAKE Health 01Holzinger Group, hci‐kdd.org 13
01 The underlying physics of data

MAKE Health 01Holzinger Group, hci‐kdd.org 14
Data in traditional Statistics Low‐dimensional data ( < ) Problem: Much noise in the data Not much structure in the data but it can be represented by a simple model
Traditional Statistics versus Machine Learning
Data in Machine Learning High‐dimensional data ( ) Problem: not noise , but complexity Much structure, but the structure can not be represented by a simple model
Lecun, Y., Bengio, Y. & Hinton, G. 2015. Deep learning. Nature, 521, (7553), 436‐444.
MAKE Health 01Holzinger Group, hci‐kdd.org 15
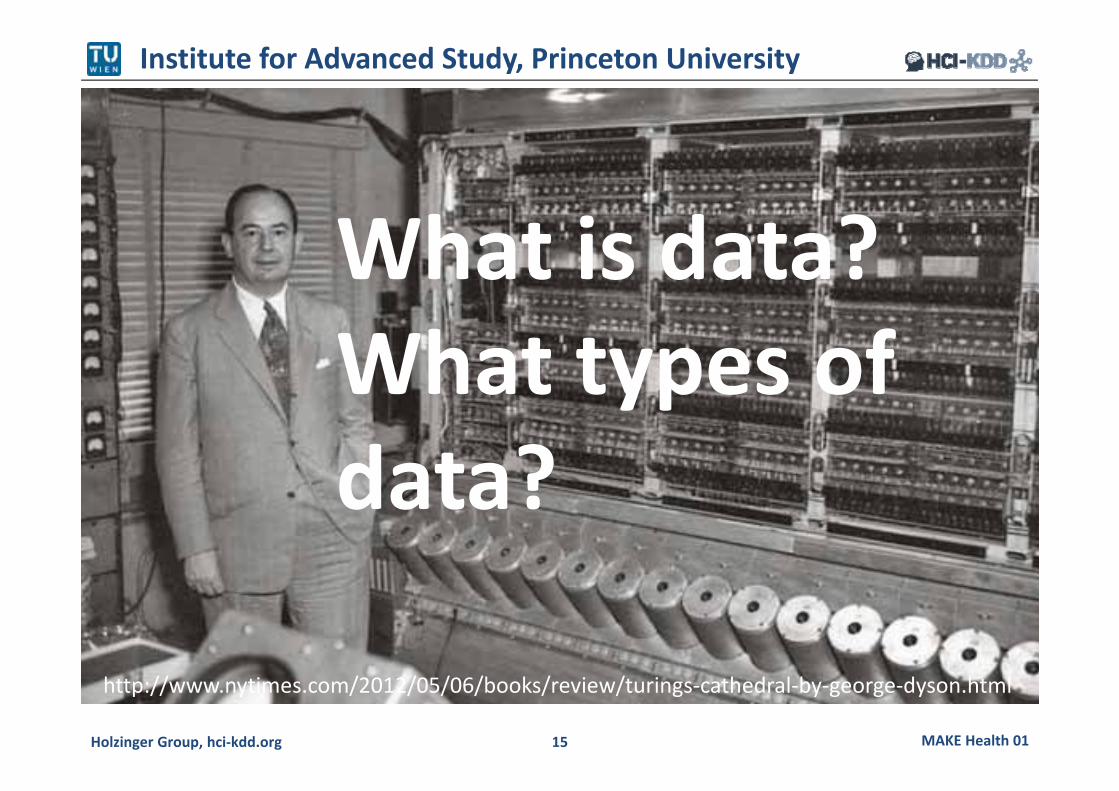
Institute for Advanced Study, Princeton University
http://www.nytimes.com/2012/05/06/books/review/turings‐cathedral‐by‐george‐dyson.html
What is data?What types of data?

MAKE Health 01Holzinger Group, hci‐kdd.org 16
Example: Neonatal Screening (1/3)
http://www.nlm.nih.gov/cgi/mesh/2011/MB_cgi?mode=&index=15177&view=expanded#TreeE01.370.500.580

MAKE Health 01Holzinger Group, hci‐kdd.org 17
Example: Neonatal Screening (2/3)
Yao, Y., Bowen, B. P., Baron, D. & Poznanski, D. 2015. SciDB for High‐Performance Array‐Structured Science Data at NERSC. Computing in Science & Engineering, 17, (3), 44‐52, doi:10.1109/MCSE.2015.43.

MAKE Health 01Holzinger Group, hci‐kdd.org 18
Neonatal Screening (3/3)
Baumgartner, C., Bohm, C. & Baumgartner, D. 2005. Modelling of classification rules on metabolic patterns including machine learning and expert knowledge. Journal of Biomedical Informatics, 38, (2), 89‐98, doi:10.1016/j.jbi.2004.08.009.

MAKE Health 01Holzinger Group, hci‐kdd.org 19
02 Biomedicaldata sources:
Taxonomy of data

MAKE Health 01Holzinger Group, hci‐kdd.org 20
Top Level View: Biomedical Data Sources
Atom
Molecule
Virus
Bacteria
Cell
Tissue
Individual
Collective
Ecosystem

MAKE Health 01Holzinger Group, hci‐kdd.org 21
Example: Type of Cells
Karp, G. 2010. Cell and Molecular Biology: Concepts and Experiments, Gainesville, John Wiley.

MAKE Health 01Holzinger Group, hci‐kdd.org 22
To get a feeling of biological data sources (bionumbers)
http://book.bionumbers.org/how‐many‐genes‐are‐in‐a‐genome/
bionumbers.hms.harvard.edu/

MAKE Health 01Holzinger Group, hci‐kdd.org 23
Biological data is getting more complex (big sowieso ;)
Navlakha, S. & Bar-Joseph, Z. 2011. Algorithms in nature: the convergence of systems biology and computational thinking. Molecular Systems Biology, 7.

MAKE Health 01Holzinger Group, hci‐kdd.org 24
Costs more decreasing than in Moor’s law (also cost!)

MAKE Health 01Holzinger Group, hci‐kdd.org 25
Example: Genetic Data
For further reading this is recommended:Buffalo, V. 2015. Bioinformatics Data Skills: Reproducible and Robust Research with Open Source Tools, Sebastopol (CA), O'Reilly.

MAKE Health 01Holzinger Group, hci‐kdd.org 26
Example Species: Bacterium E. coli
MAKE Health 01Holzinger Group, hci‐kdd.org 27
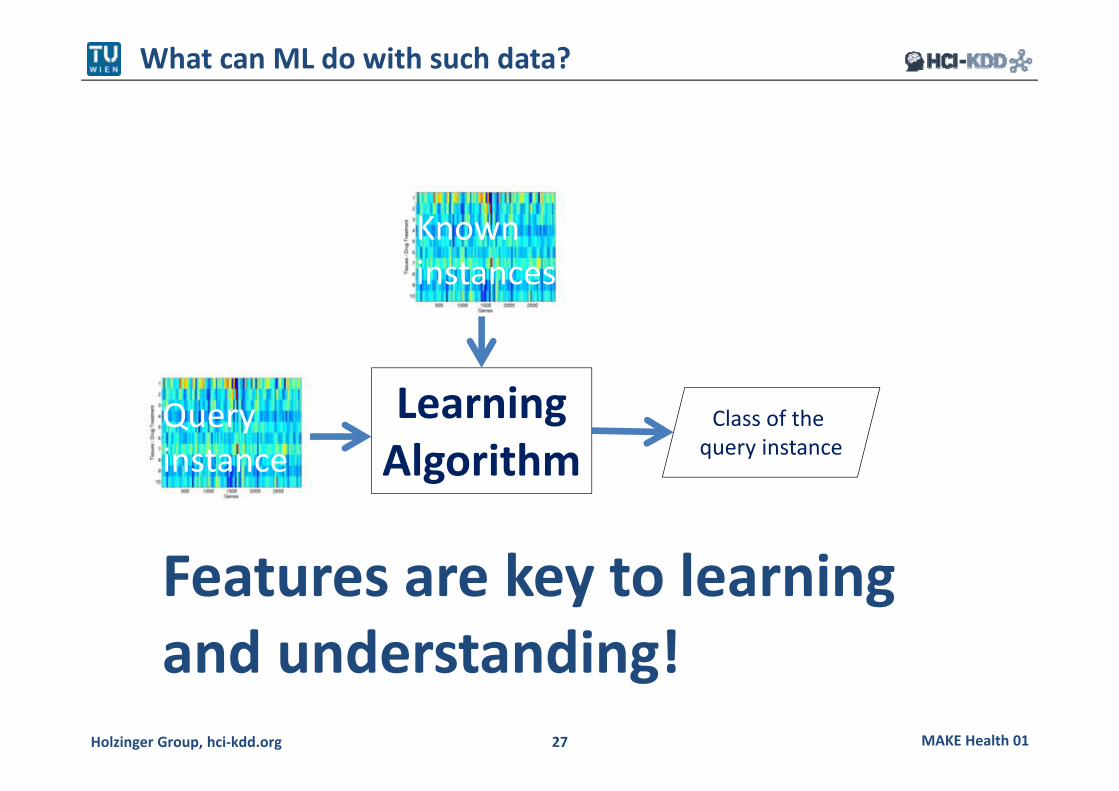
What can ML do with such data?
Features are key to learning and understanding!
LearningAlgorithm
Class of the query instance
Query instance
Knowninstances

MAKE Health 01Holzinger Group, hci‐kdd.org 28
Billions of biological data sets are openly available, here only some examples: General Repositories: GenBank, EMBL, HMCA, …
Specialized by data types: UniProt/SwissProt, MMMP, KEGG, PDB, …
Specialized by organism: WormBase, FlyBase, NeuroMorpho, …
Details: http://hci‐kdd.org/open‐data‐sets
Where do we get the data sets from?

MAKE Health 01Holzinger Group, hci‐kdd.org 29
Example Data Set from an High‐Throughput Experiment
MAKE Health 01Holzinger Group, hci‐kdd.org 30
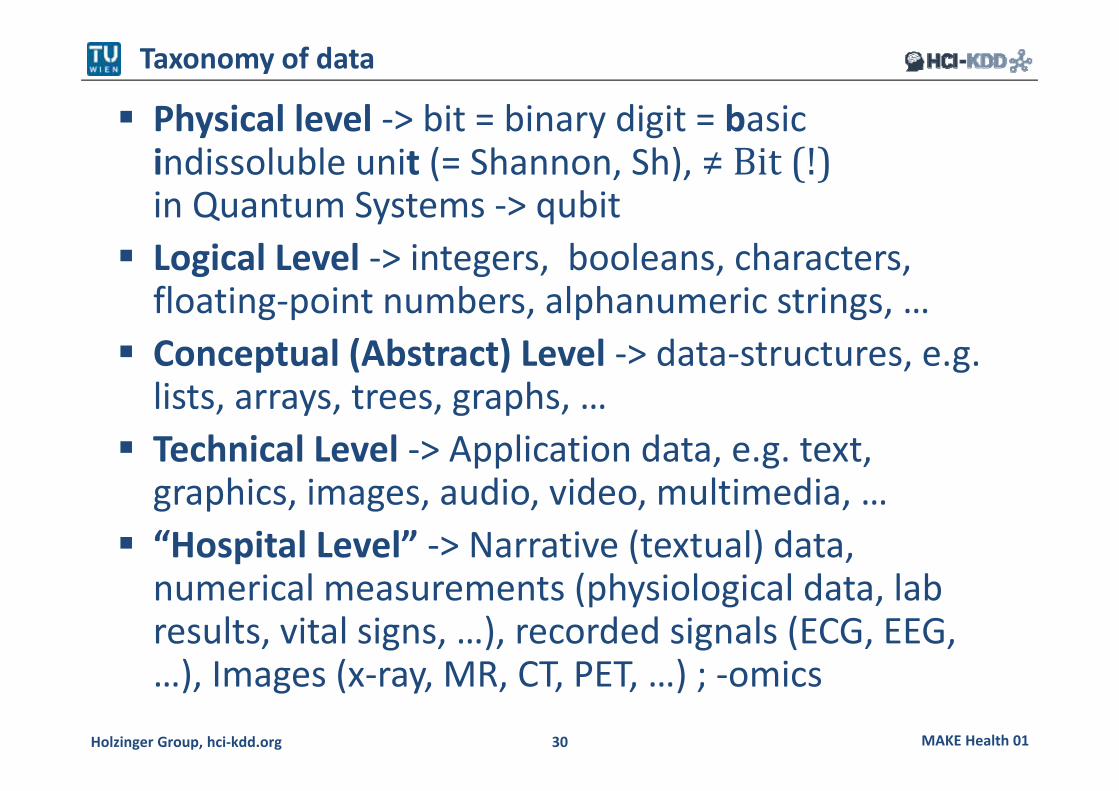
Physical level ‐> bit = binary digit = basic indissoluble unit (= Shannon, Sh), ≠Bit(!)in Quantum Systems ‐> qubit
Logical Level ‐> integers, booleans, characters, floating‐point numbers, alphanumeric strings, …
Conceptual (Abstract) Level ‐> data‐structures, e.g. lists, arrays, trees, graphs, …
Technical Level ‐> Application data, e.g. text, graphics, images, audio, video, multimedia, …
“Hospital Level” ‐> Narrative (textual) data, numerical measurements (physiological data, lab results, vital signs, …), recorded signals (ECG, EEG, …), Images (x‐ray, MR, CT, PET, …) ; ‐omics
Taxonomy of data

MAKE Health 01Holzinger Group, hci‐kdd.org 31
Clinical workplace data sources Med.docs: text (non‐standardized (free‐text), semi‐structured, standard terminologies (ICD, SNOMED‐CT)
Measurements: lab results, ECG, EEG, EOG, … Surveys, Clinical studies, trials
Image data sources Radiology: MRI (256x256, 200 slices, 16 bit per pixel, uncompressed, ~26 MB); CT (512x512, 60 slices, 16 bit per pixel, uncompressed ~32MB; MR, US;
Digital Microscopy : WSI (15mm slide, 20x magn., 24 bits per pixel, uncompressed, 2,5 GB, WSI 10 GB; confocal laser scanning, etc.
‐omics data sources Sanger sequencing, NGS whole genome sequencing (3 billion reads, read length of 36) ~ 200 GB; NGS exome sequencing (“only” 110,000,000 reads, read length of 75) ~7GB; Microarray, mass‐spectrometry, gas chromatography, …
Taxonomy of data at Hospital Level

MAKE Health 01Holzinger Group, hci‐kdd.org 32
Example Data Structures (1/3): List
Crooks, G. E., Hon, G., Chandonia, J. M. & Brenner, S. E. (2004) WebLogo: A sequence logo generator. Genome Research, 14, 6, 1188‐1190.

MAKE Health 01Holzinger Group, hci‐kdd.org 33
Example Data Structures (2/3): Graph
Lieberman, E., Hauert, C. & Nowak, M. A. (2005) Evolutionary dynamics on graphs. Nature, 433, 7023, 312‐316.
Evolutionary dynamics act on populations. Neither genes, nor cells, nor individuals evolve; only populations evolve.

MAKE Health 01Holzinger Group, hci‐kdd.org 34
Example Data Structures (3/3) Tree
Hufford et. al. 2012. Comparative population genomics of maize domestication and improvement. Nature Genetics, 44, (7), 808‐811.

MAKE Health 01Holzinger Group, hci‐kdd.org 35
http://cacm.acm.org/magazines/2015/1/181614‐distributed‐information‐processing‐in‐biological‐and‐computational‐systems/abstract
Algorithms in nature: Shared principles
Navlakha, S. & Bar‐Joseph, Z. 2014. Distributed information processing in biological and computational systems. Commun. ACM, 58, (1), 94‐102.
https://www.youtube.com/watch?v=4u47nwHzqI4&feature=youtu.be

MAKE Health 01Holzinger Group, hci‐kdd.org 36
Translational Health Informatics Continuum
Sarkar, I. 2010. Biomedical informatics and translational medicine. Journal of Translational Medicine, 8, (1), 2‐12.

MAKE Health 01Holzinger Group, hci‐kdd.org 37
Grand Challenges in this area: – Production of Open Data Sets – Synthetic data sets for learning algorithm testing – Privacy preserving machine learning – Data leak detection – Data citation – Differential privacy – Anonymization and pseudonymization – Evaluation and benchmarking
Biomedical Research needs Open Data Access
Please visit:http://hci‐kdd.org/privacy‐aware‐machine‐learning‐for‐data‐science/

MAKE Health 01Holzinger Group, hci‐kdd.org 38
03 Data Integration, mapping, fusion

MAKE Health 01Holzinger Group, hci‐kdd.org 39
Unsolved Problem: Data Integration and Data Fusion in the
Life Sciences
Navlakha, S. & Bar-Joseph, Z. 2014. Distributed information processing in biological and computational systems. Commun. ACM, 58, (1), 94-102, doi:10.1145/2678280.

MAKE Health 01Holzinger Group, hci‐kdd.org 40
In medicine we have two different worlds …
Our central hypothesis:Information may bridge this gap
Holzinger, A. & Simonic, K.‐M. (eds.) 2011. Information Quality in e‐Health. Lecture Notes in Computer Science LNCS 7058, Heidelberg, Berlin, New York: Springer.

MAKE Health 01Holzinger Group, hci‐kdd.org 41
Not only a problem at cell level …
Manyika, J., Chui, M., Brown, B., Bughin, J., Dobbs, R., Roxburgh, C. & Byers, A. H. (2011) Big data: The next frontier for innovation, competition, and productivity. Washington (DC), McKinsey Global Institute.
Biomedical R&D data(e.g. clinical trial data)
Clinical patient data(e.g. EPR, images, lab etc.)
Health business data(e.g. costs, utilization, etc.)
Private patient data(e.g. AAL, monitoring, etc.)
Weakly structured, highly fragmented, with low integration

MAKE Health 01Holzinger Group, hci‐kdd.org 42
Example Data Integration Architecture
Kirsten, T., Lange, J. & Rahm, E. 2006. An integrated platform for analyzing molecular‐biological data within clinical studies. Current Trends in Database Technology–EDBT 2006. Heidelberg: Springer, pp. 399‐410, doi:10.1007/11896548_31.

MAKE Health 01Holzinger Group, hci‐kdd.org 43
Example: Integrated Data Set
Kirsten, T., Lange, J. & Rahm, E. 2006. An integrated platform for analyzing molecular‐biological data within clinical studies. Current Trends in Database Technology–EDBT 2006. Heidelberg: Springer, pp. 399‐410, doi:10.1007/11896548_31.

MAKE Health 01Holzinger Group, hci‐kdd.org 44
‐Omics‐data jungle
Genomics (sequence annotation) Transcriptomics (microarray) Proteomics (Proteome Databases) Metabolomics (enzyme annotation) Fluxomics (isotopic tracing, metabolic pathways) Phenomics (biomarkers) Epigenomics (epigenetic modifications) Microbiomics (microorganisms) Lipidomics (pathways of cellular lipids)

MAKE Health 01Holzinger Group, hci‐kdd.org 45
Omics‐data integration
Joyce, A. R. & Palsson, B. Ø. 2006. The model organism as a system: integrating'omics' data sets. Nature Reviews Molecular Cell Biology, 7, 198‐210.

MAKE Health 01Holzinger Group, hci‐kdd.org 46
50+ Patients per day 5000 data points per day … Aggregated with specific scores (Disease Activity Score, DAS) Current patient status is related to previous data = convolution over time time‐series data
Example of typical clinical data sets
Simonic, K. M., Holzinger, A., Bloice, M. & Hermann, J. (2011). Optimizing Long‐Term Treatment of Rheumatoid Arthritis with Systematic Documentation. Pervasive Health ‐ 5th International Conference on Pervasive Computing Technologies for Healthcare, Dublin, IEEE, 550‐554.

MAKE Health 01Holzinger Group, hci‐kdd.org 47
DAS28 Predicted Mean Responses
Simonic, K. M., Holzinger, A., Bloice, M. & Hermann, J. (2011). Optimizing Long‐Term Treatment of Rheumatoid Arthritis with Systematic Documentation. Pervasive Health ‐ 5th International Conference on Pervasive Computing Technologies for Healthcare, Dublin, IEEE, 550‐554.

MAKE Health 01Holzinger Group, hci‐kdd.org 48
RDF, OWL
Omics DataWeakly‐Structured
Well‐Structured
DatabasesLibraries
XML
Standardized Non‐Standardized
Standardization versus Structurization
Holzinger, A. (2011) Weakly Structured Data in Health‐Informatics: The Challenge for Human‐Computer Interaction. In: Baghaei, N., Baxter, G., Dow, L. & Kimani, S. (Eds.) Proceedings of INTERACT 2011 Workshop: Promoting and supporting healthy living by design. Lisbon, IFIP, 5‐7.
NaturalLanguage

MAKE Health 01Holzinger Group, hci‐kdd.org 49
0‐D data = a data point existing isolated from other data, e.g. integers, letters, Booleans, etc.
1‐D data = consist of a string of 0‐D data, e.g. Sequences representing nucleotide bases and amino acids, SMILES etc.
2‐D data = having spatial component, such as images, NMR‐spectra etc.
2.5‐D data = can be stored as a 2‐D matrix, but can represent biological entities in three or more dimensions, e.g. PDB records
3‐D data = having 3‐D spatial component, e.g. image voxels, e‐density maps, etc.
H‐D Data = data having arbitrarily high dimensions
Data Dimensionality examples

MAKE Health 01Holzinger Group, hci‐kdd.org 50
SMILES (Simplified Molecular Input Line Entry Specification)
... is a compact machine and human‐readable chemical nomenclature:
e.g. Viagra:CCc1nn(C)c2c(=O)[nH]c(nc12)c3cc(ccc3OCC)S(=O)(=O)N4CCN(C)CC4
...is Canonicalizable
...is Comprehensive
...is Well Documented
Example: 1‐D data (univariate sequential data objects)
http://www.daylight.com/dayhtml_tutorials/languages/smiles/index.html

MAKE Health 01Holzinger Group, hci‐kdd.org 51
Example: 2‐D data (bivariate data)
Kastrinaki et al. (2008) Functional, molecular & proteomic characterisation of bone marrow mesenchymal stem cells in rheumatoid arthritis. Annals of Rheumatic Diseases, 67, 6, 741‐749.

MAKE Health 01Holzinger Group, hci‐kdd.org 52
Example: 2.5‐D data (structural information & metadata)
http://www.pdb.org

MAKE Health 01Holzinger Group, hci‐kdd.org 53
Example: 3‐D Voxel data (volumetric picture elements)
Scheins, J. J., Herzog, H. & Shah, N. J. (2011) Fully‐3D PET Image Reconstruction Using Scanner‐Independent, Adaptive Projection Data and Highly Rotation‐Symmetric Voxel Assemblies. Medical Imaging, IEEE Transactions on, 30, 3, 879‐892.

MAKE Health 01Holzinger Group, hci‐kdd.org 54
Note: The curse of dimensionality
Bengio, S. & Bengio, Y. 2000. Taking on the curse of dimensionality in joint distributions using neural networks. IEEE Transactions on Neural Networks, 11, (3), 550‐557.
http://www.iro.umontreal.ca/~bengioy/yoshua_en/research.html

MAKE Health 01Holzinger Group, hci‐kdd.org 55
Example: Data structures ‐ Classification
Dastani, M. (2002) The Role of Visual Perception in Data Visualization. Journal of Visual Languages and Computing, 13, 601‐622.
Aggregated attribute = a homomorphicmap H from a relational system A; into a relational system B; ; where A and B are two distinct sets of data elements. This is in contrast with other attributes since the set B is the set of data elements instead of atomic values.

MAKE Health 01Holzinger Group, hci‐kdd.org 56
Scale Empirical Operation
Mathem. Group Structure
Transf.in
BasicStatistics
Mathematical Operations
ORDINAL Determination of more/less
Isotonicx’ = f(x) x … mono‐tonic incr.
x ↦ f(x) Median,Percentiles
=, ≠, >, <
INTERVAL Determination of equality of intervals or differences
General linearx’ = ax + b
x ↦ rx+s Mean, Std.Dev. Rank‐Order Corr., Prod.‐Moment Corr.
=, ≠, >, <, ‐, +
RATIO Determination of equality or ratios
Similarityx’ = ax
x ↦ rx Coefficient of variation
=, ≠, >, <, ‐, +, ,
Stevens, S. S. (1946) On the theory of scales of measurement. Science, 103, 677‐680.
NOMINAL Determination of equality
Permutationx’ = f(x) x … 1‐to‐1
x ↦ f(x) Mode, contingency correlation
=, ≠
Categorization of Data (Classic “scales”)

MAKE Health 01Holzinger Group, hci‐kdd.org 57
Bridging the gap between natural sciences and clinical medicine (who has seen genomics and patient data integrated in routine?) Organizational barriers, data provenance, data ownership, privacy, accessibility, usability, fair use of data, security, safety, data protection Combine Ontologies with Machine Learning Stochastic Ontologies, Ontology learning Integration of data from wet‐labs with in‐silico experimental data (e.g. tumor growth simulation)
Challenges in Data Integration

MAKE Health 01Holzinger Group, hci‐kdd.org 58
04 Probabilistic Information p(x)

MAKE Health 01Holzinger Group, hci‐kdd.org 59
Boolean modelsAlgebraic modelsProbabilistic models *)
Please always distinguish models between …
*) Our probabilistic models describes data which we can observe from our environment – and if we use the mathematics of probability theory , in order to express the uncertainties around our model then the inverse probability allows us to infer unknown unknowns … learning from data and making predictions – the core essence of machine learning and of vital importance for health informatics
Ghahramani, Z. 2015. Probabilistic machine learning and artificial intelligence. Nature, 521, (7553), 452‐459, doi:10.1038/nature14541.
MAKE Health 01Holzinger Group, hci‐kdd.org 60
5 m
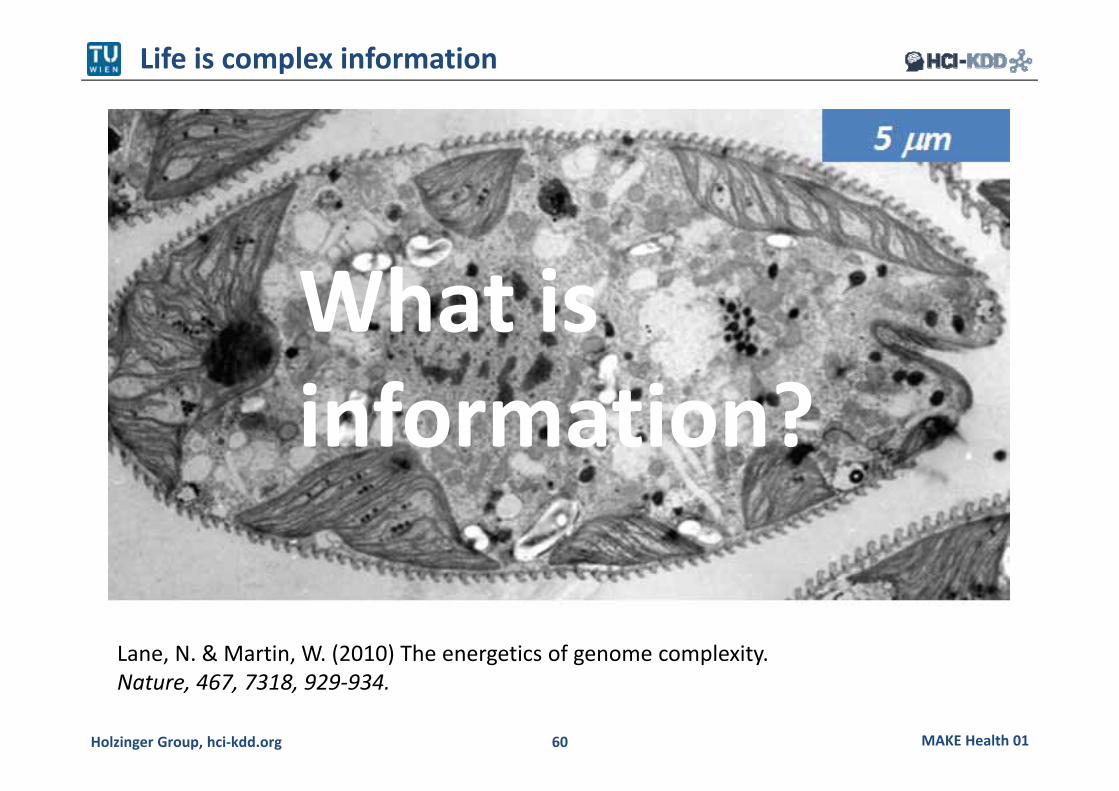
Life is complex information
Lane, N. & Martin, W. (2010) The energetics of genome complexity. Nature, 467, 7318, 929‐934.
What is information?

MAKE Health 01Holzinger Group, hci‐kdd.org 61
Information is everywhere …
Manca, V. 2013. Infobiotics: Information in Biotic Systems, Heidelberg, Springer, doi:10.1007/978‐3‐642‐36223‐1.

MAKE Health 01Holzinger Group, hci‐kdd.org 62
For ML and Health always remember
Probabilistic Information p(x)
Bayes’ Rule is a corollary of the Sum Rule and Product Rule:
Barnard, G. A., & Bayes, T. (1958). Studies in the history of probability and statistics: IX. Thomas Bayes'sessay towards solving a problem in the doctrine of chances. Biometrika, 45(3/4), 293‐315.
Bayes, T. (1763). An Essay towards solving a Problem in the Doctrine of Chances (Postum communicated by Richard Price). Philosophical Transactions, 53, 370‐418.

MAKE Health 01Holzinger Group, hci‐kdd.org 63
Bayes Law of Total Probability = data modelling
Bayes’ Rule in wordsd … data; h … hypothesisH ={H1, H2, … , Hn} … Hypothesis space
Posterior Probability
Prior Probability
=
Likelihood
Evidence = marginal likelihood
Sum over space of alternative hypotheses

MAKE Health 01Holzinger Group, hci‐kdd.org 64
Always remember:
The inverse probability allows to infer unknowns, learn from data and make predictions:1) Maximum‐Likelihood Learning
finds a parameter setting, that maximizes the p(x) of the data: P (
2) Maximum a Posteriori Learning (e.g. for MCMC)assumes a prior over the model parameters P ) and finds a parameter setting that maximizes the posterior:
(
3) Bayesian Learningassumes a prior over the model parameters and computes the posterior distribution

MAKE Health 01Holzinger Group, hci‐kdd.org 65 65
Parameter Estimation
General setting: Given a (hypothesized & probabilistic) model that governs the random experiment
The model gives a probability of any data | that depends on the parameter
Now, given actual sample data 1, … , ,what can we say about the value of ?
Intuitively, take your best guess of “best” means “best explaining/fitting the data” Generally an optimization problem

MAKE Health 01Holzinger Group, hci‐kdd.org 66
Maximum Likelihood vs. Bayesian
1) Maximum likelihood estimation (given X) “Best” means “data likelihood reaches maximum”
Problem: massive amount of data necessary
2) Bayesian estimation (use posterior)
)
“Best” means being consistent with our “prior” knowledge and explaining data well
Problem: how to define prior?An example can be found in: Banerjee, O., El Ghaoui, L. & D'aspremont, A. 2008. Model selection through sparse maximum likelihood estimation for multivariate gaussian or binary data. The Journal of Machine Learning Research, 9, 485‐516. Available via: http://arxiv.org/pdf/0707.0704

MAKE Health 01Holzinger Group, hci‐kdd.org 67
Illustration of Bayesian Estimation
Prior: p()
Likelihood:p(X|)
X=(x1,…,xN)
Posterior:p(|X) p(X|)p()
: prior mode ml: ML estimate: posterior mode
=
For more basic information: Bishop, C. M. 2007. Pattern Recognition and Machine Learning, Springer.For application examples in Text processing refer to: Jiang, J. & Zhai, C. X. 2007. An empirical study of tokenization strategies for biomedical information retrieval. Information Retrieval, 10, (4‐5), 341‐363.
MAKE Health 01Holzinger Group, hci‐kdd.org 68
05 Information Theory &Entropy

MAKE Health 01Holzinger Group, hci‐kdd.org 69
Information is the reduction of uncertainty If something is 100 % certain its uncertainty = 0 Uncertainty is a max. if all choices are equally probable Uncertainty (as information) sums up for independent sources
Probability > Information > Entropy
MAKE Health 01Holzinger Group, hci‐kdd.org 70
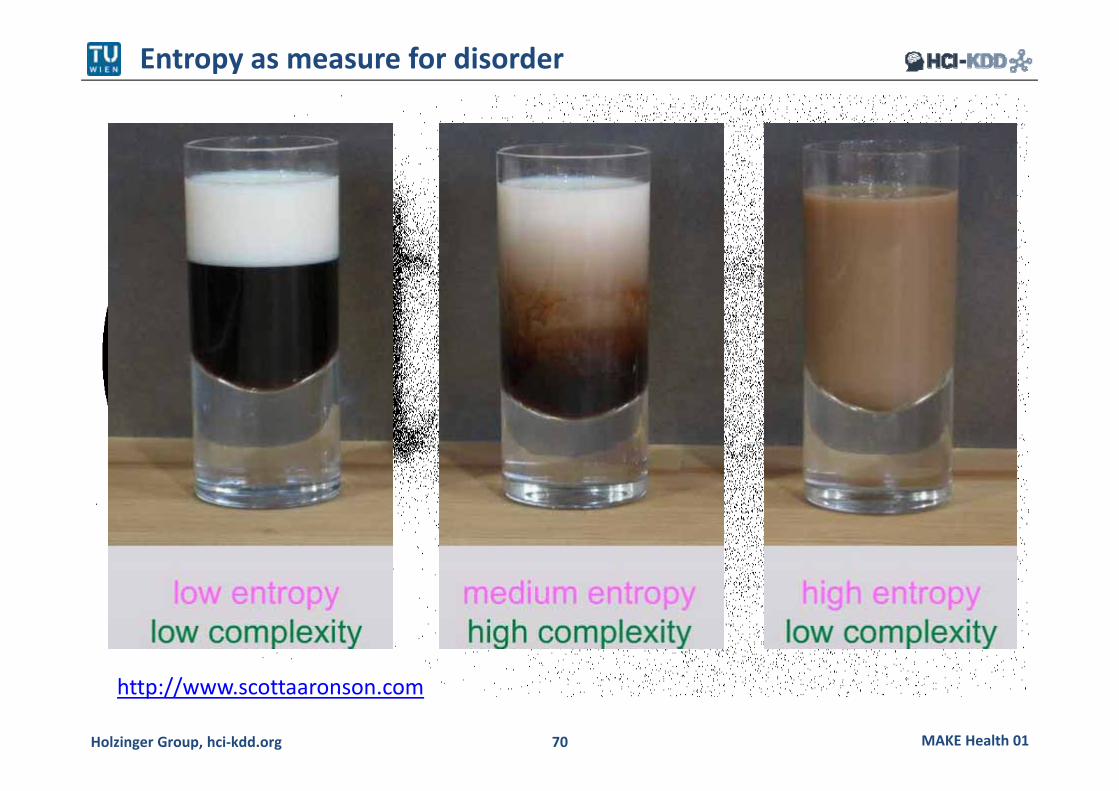
Entropy as measure for disorder
http://www.scottaaronson.com

MAKE Health 01Holzinger Group, hci‐kdd.org 71
An overview on the History of Entropy
Bernoulli (1713) Principle of Insufficient
Reason
Maxwell (1859), Boltzmann (1871), Gibbs (1902) Statistical Modeling
of problems in physics
confer also with: Golan, A. (2008) Information and Entropy Econometric: A Review and Synthesis. Foundations and Trends in Econometrics, 2, 1‐2, 1‐145.
Bayes (1763), Laplace (1770)How to calculate the state of
a system with a limited number of expectation values
Jeffreys, Cox (1939‐1948)Statistical Inference
Bayesian Statistics
Shannon (1948)Information Theory
Pearson (1900) Goodness of Fit
measure
Fisher (1922)Maximum Likelihood
See next slide
Generalized EntropyEntropy Methods

MAKE Health 01Holzinger Group, hci‐kdd.org 72
Towards a Taxonomy of Entropic Methods
Entropic Methods Generalized Entropy
Jaynes (1957)Maximum Entropy (MaxEn) Renyi (1961)
Renyi‐Entropy
Tsallis (1980)Tsallis‐Entropy
Rubinstein (1997)Cross Entropy (CE)
Posner (1975)Minimum Entropy (MinEn)
Richman (2000)Sample Entropy (SampEn)
Pincus (1991)Approximate Entropy (ApEn)
Mowshowitz (1968)Graph Entropy (MinEn)
Adler et al. (1965)Topology Entropy (TopEn)
Holzinger, A., Hörtenhuber, M., Mayer, C., Bachler, M., Wassertheurer, S., Pinho, A. & Koslicki, D. 2014. On Entropy‐Based Data Mining. In: Holzinger, A. & Jurisica, I. (eds.) Lecture Notes in Computer Science, LNCS 8401. Berlin Heidelberg: Springer, pp. 209‐226.

MAKE Health 01Holzinger Group, hci‐kdd.org 73
EU Project EMERGE (2007‐2010)
Example of the usefulness of ApEn (1/3)
Holzinger, A., Stocker, C., Bruschi, M., Auinger, A., Silva, H., Gamboa, H. & Fred, A. 2012. On Applying Approximate Entropy to ECG Signals for Knowledge Discovery on the Example of Big Sensor Data. In: Huang, R., Ghorbani, A., Pasi, G., Yamaguchi, T., Yen, N. & Jin, B. (eds.) Active Media Technology, Lecture Notes in Computer Science, LNCS 7669. Berlin Heidelberg: Springer, pp. 646‐657.

MAKE Health 01Holzinger Group, hci‐kdd.org 74
11 1 ln
, ,…,
→
Example of the usefulness of ApEn (2/3)
Pincus, S. M. (1991) Approximate Entropy as a measure of system complexity. Proceedings of the National Academy of Sciences of the United States of America, 88, 6, 2297‐2301.
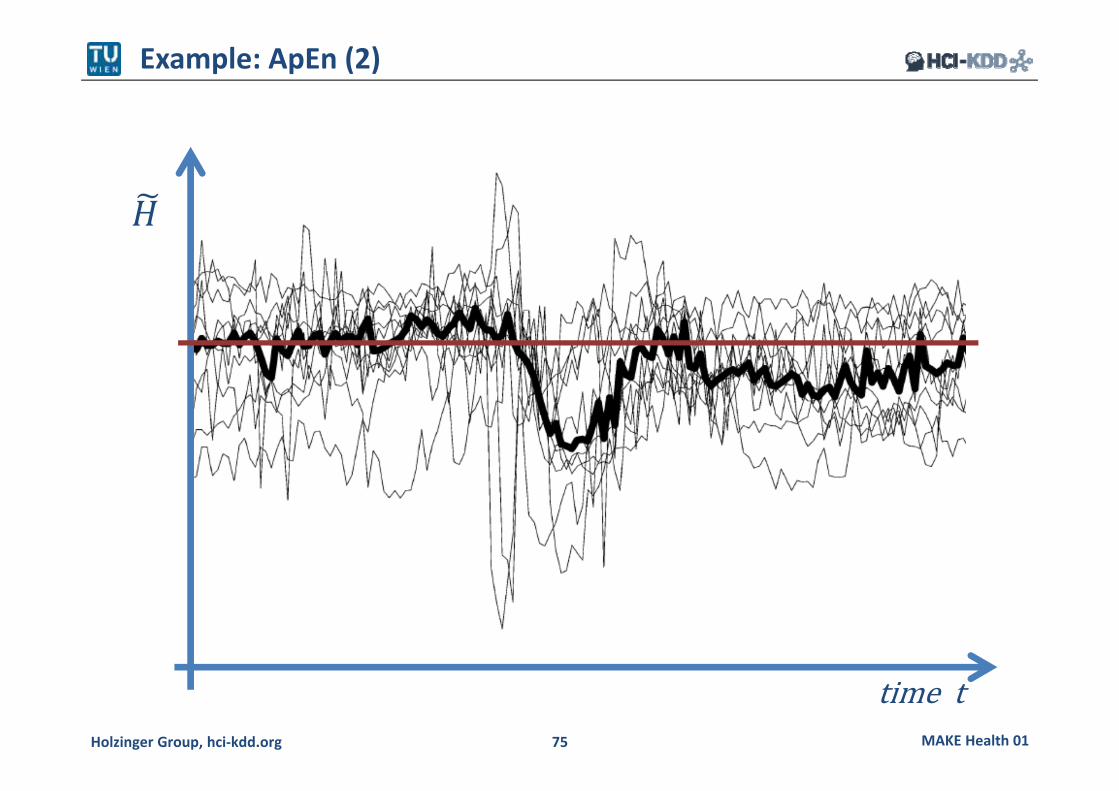
MAKE Health 01Holzinger Group, hci‐kdd.org 75
timet
Example: ApEn (2)

MAKE Health 01Holzinger Group, hci‐kdd.org 76
ApEn
Holzinger, A., Hörtenhuber, M., Mayer, C., Bachler, M., Wassertheurer, S., Pinho, A. & Koslicki, D. 2014. On Entropy‐Based Data Mining. In: Holzinger, A. & Jurisica, I. (eds.) Interactive Knowledge Discovery and Data Mining in Biomedical Informatics, Lecture Notes in Computer Science, LNCS 8401. Berlin Heidelberg: Springer, pp. 209‐226.
MAKE Health 01Holzinger Group, hci‐kdd.org 77
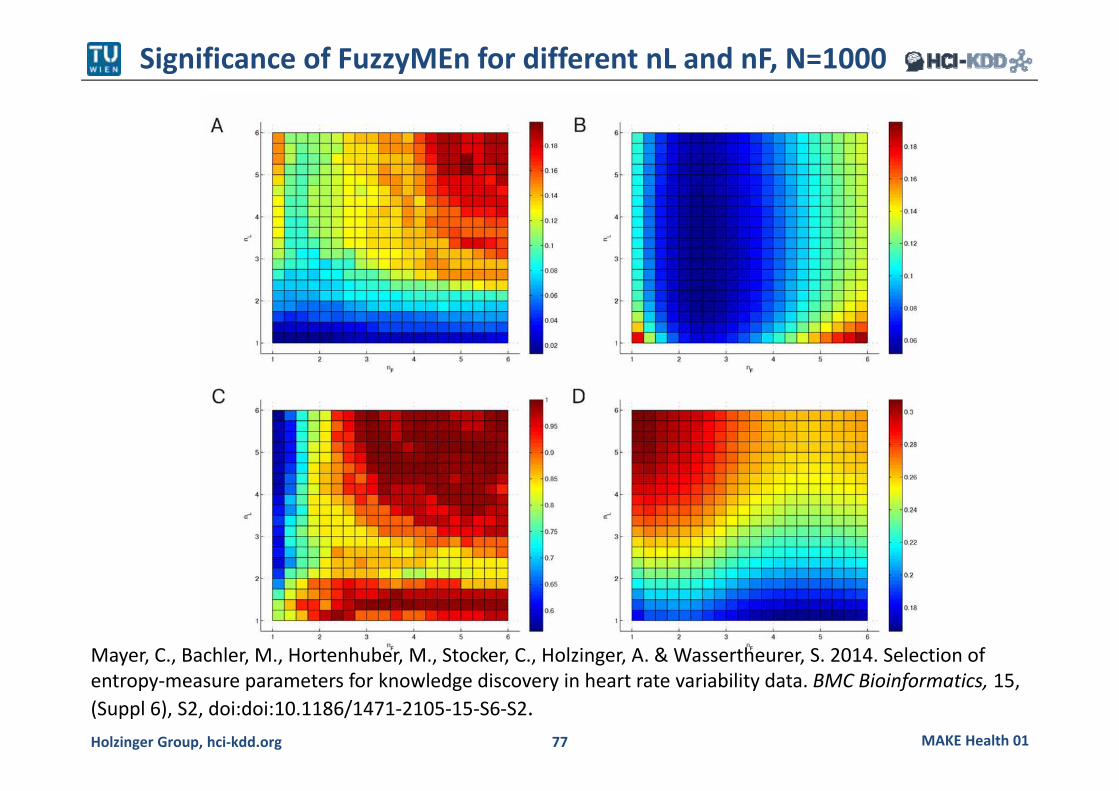
Significance of FuzzyMEn for different nL and nF, N=1000
Mayer, C., Bachler, M., Hortenhuber, M., Stocker, C., Holzinger, A. & Wassertheurer, S. 2014. Selection of entropy‐measure parameters for knowledge discovery in heart rate variability data. BMC Bioinformatics, 15, (Suppl 6), S2, doi:doi:10.1186/1471‐2105‐15‐S6‐S2.

MAKE Health 01Holzinger Group, hci‐kdd.org 78
Heart Rate Variability (HRV) can be used as a marker of cardiovascular health status.
Entropy measures represent a family of new methods to quantify the variability of the heart rate.
Promising approach, due to ability to discover certain patterns and shifts in the "apparent ensemble amount of randomness" of stochastic processes,
measure randomness and predictability of processes.
Summary: Example Heart Rate Variability
Mayer, C., Bachler, M., Holzinger, A., Stein, P. K. & Wassertheurer, S. 2016. The Effect of Threshold Values and Weighting Factors on the Association between Entropy Measures and Mortality after Myocardial Infarction in the Cardiac Arrhythmia Suppression Trial (CAST). Entropy, 18, (4), 129, doi::10.3390/e18040129.

MAKE Health 01Holzinger Group, hci‐kdd.org 79
Baseline: A,B,C – After treatment: D,E,F N=1200
Mayer, C., Bachler, M., Holzinger, A., Stein, P. K. & Wassertheurer, S. 2016. The Effect of Threshold Values and Weighting Factors on the Association between Entropy Measures and Mortality after Myocardial Infarction in the Cardiac Arrhythmia Suppression Trial (CAST). Entropy, 18, (4), 129, doi::10.3390/e18040129.

MAKE Health 01Holzinger Group, hci‐kdd.org 80
06 Cross‐Entropy Kullback‐Leibler Divergence

MAKE Health 01Holzinger Group, hci‐kdd.org 81
Entropy: Measure for the uncertainty of random variables
Kullback‐Leibler divergence: comparing two distributions
Mutual Information: measuring the correlation of two random variables
Entropy – KL‐Div. – Mutual Information

MAKE Health 01Holzinger Group, hci‐kdd.org 82
Solomon Kullback & Richard Leibler (1951)
Solomon Kullback1907‐1994
Richard Leibler1914‐2003
Kullback, S. & Leibler, R. A. 1951. On information and sufficiency. The annals of mathematical statistics, 22, (1), 79‐86, www.jstor.org/stable/2236703

MAKE Health 01Holzinger Group, hci‐kdd.org 83

MAKE Health 01Holzinger Group, hci‐kdd.org 84
Remember Shannon Entropy
Important quantity in• coding theory• statistical physics• machine learning
Shannon, C. E. 1948. A Mathematical Theory of Communication. Bell System Technical Journal, 27, 379‐423.
MAKE Health 01Holzinger Group, hci‐kdd.org 85
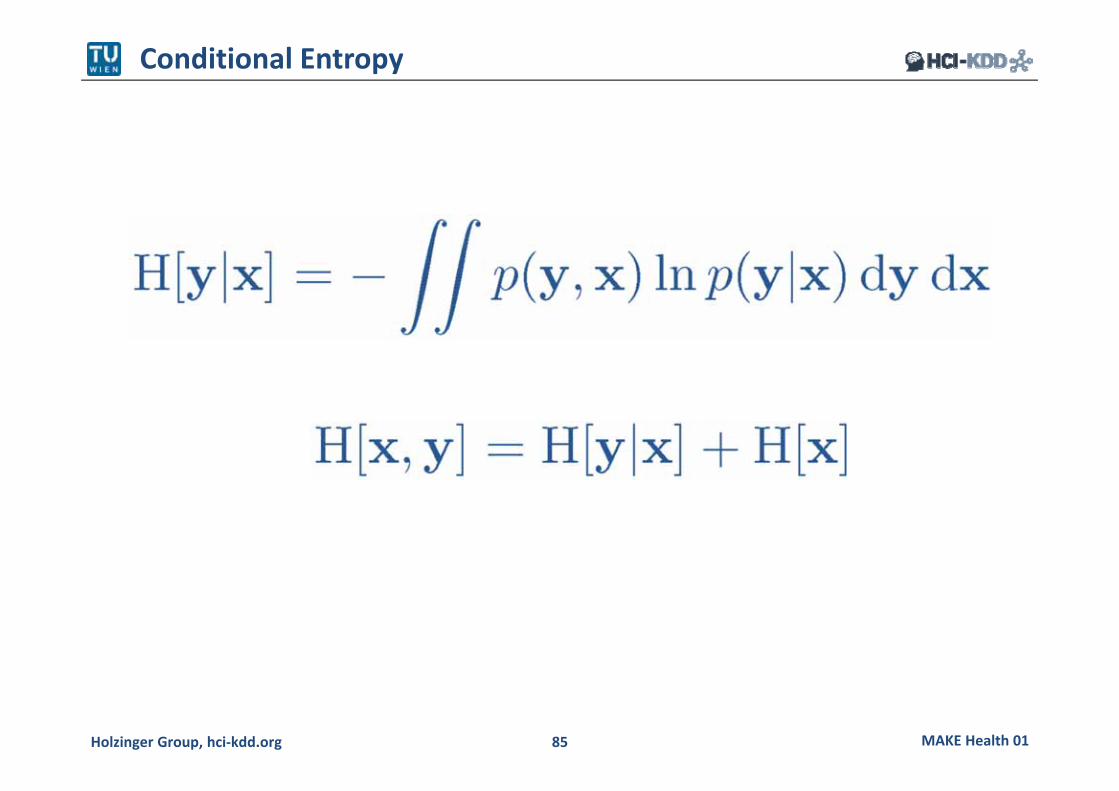
Conditional Entropy

MAKE Health 01Holzinger Group, hci‐kdd.org 86
The Kullback‐Leibler Divergence
KL‐divergence is often used to measure the distance between two distributions

MAKE Health 01Holzinger Group, hci‐kdd.org 87
Note: KL is not symmetric!
Goodfellow, I., Bengio, Y. & Courville, A. 2016. Deep Learning, Cambridge (MA), MIT Press.
MAKE Health 01Holzinger Group, hci‐kdd.org 88
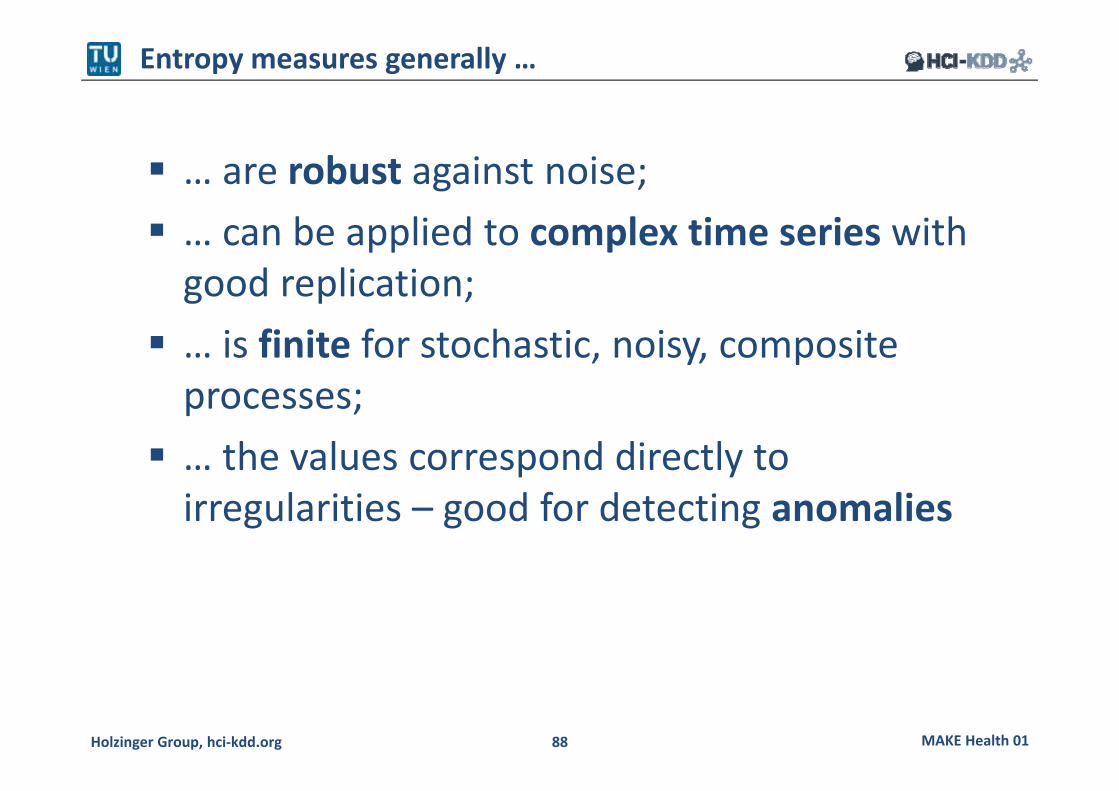
… are robust against noise; … can be applied to complex time series with good replication; … is finite for stochastic, noisy, composite processes; … the values correspond directly to irregularities – good for detecting anomalies
Entropy measures generally …

MAKE Health 01Holzinger Group, hci‐kdd.org 89
Mutual Informationand Point Wise MI

MAKE Health 01Holzinger Group, hci‐kdd.org 90
Mutual Information I(X;Y): Comparing two distributions
Measures how much reduction in uncertainty of X given the information about Y Measures correlation between X and Y Related to the “channel capacity” in the original Shannon information theory Bishop, C. M. 2007. Pattern
Recognition and Machine Learning, Heidelberg, Springer.
MAKE Health 01Holzinger Group, hci‐kdd.org 91
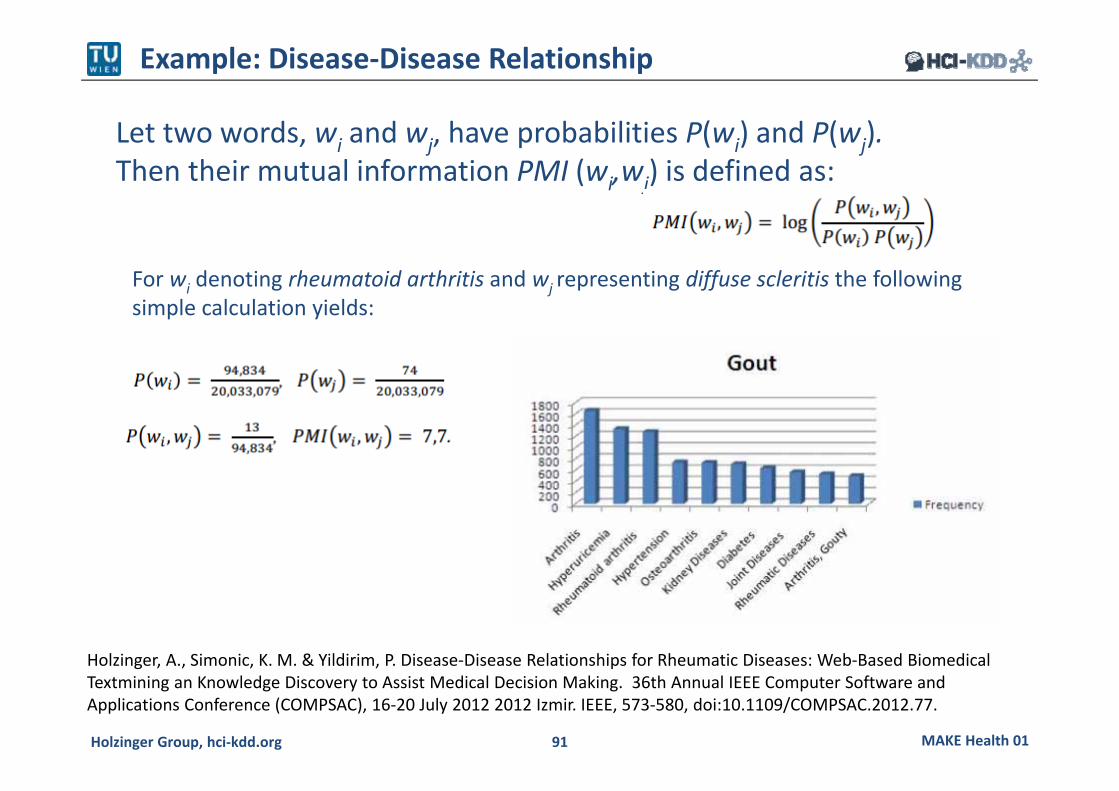
Example: Disease‐Disease Relationship
Let two words, wi and wj, have probabilities P(wi) and P(wj).Then their mutual information PMI (wi,wj) is defined as:
For wi denoting rheumatoid arthritis and wj representing diffuse scleritis the following simple calculation yields:
Holzinger, A., Simonic, K. M. & Yildirim, P. Disease‐Disease Relationships for Rheumatic Diseases: Web‐Based Biomedical Textmining an Knowledge Discovery to Assist Medical Decision Making. 36th Annual IEEE Computer Software and Applications Conference (COMPSAC), 16‐20 July 2012 2012 Izmir. IEEE, 573‐580, doi:10.1109/COMPSAC.2012.77.

MAKE Health 01Holzinger Group, hci‐kdd.org 92
Holzinger, A., Yildirim, P., Geier, M. & Simonic, K.‐M. 2013. Quality‐Based Knowledge Discovery from Medical Text on the Web. In: Pasi, G., Bordogna, G. & Jain, L. C. (eds.) Quality Issues in the Management of Web Information, Intelligent Systems Reference Library, ISRL 50. Berlin Heidelberg: Springer, pp. 145‐158, doi:10.1007/978‐3‐642‐37688‐7_7.

MAKE Health 01Holzinger Group, hci‐kdd.org 93
1) Challenges include –omics data analysis, where KL divergence and related concepts could provide important measures for discovering biomarkers.
2) Hot topics are new entropy measures suitable for computations in the context of complex/uncertain data for ML algorithms.
Inspiring is the abstract geometrical setting underlying ML main problems, e.g. Kernel functions can be completely understood in this perspective. Future work may include entropic concepts and geometrical settings.
Open Questions, future outlook, hot topics, challenges

MAKE Health 01Holzinger Group, hci‐kdd.org 94
The case of higher order statistical structure in the data – nonlinear and hierarchical ? Outliers in the data – noise models?
There are parameters in a multi‐variate
Gaussian model – what happens if ? dimensionality reduction
Limitations and Open Problems

MAKE Health 01Holzinger Group, hci‐kdd.org 95
Thank you!

MAKE Health 01Holzinger Group, hci‐kdd.org 96
Questions
10 Appendix

MAKE Health 01Holzinger Group, hci‐kdd.org 97
What are the grand challenges in ML for health? What is the key problem before you can apply ML? Describe the taxonomy of data at Hospital level! What does translational medicine mean? Give an example for a 2.5D‐data set! Why would be the combination of ontologies with machine learning provide a benefit?
How did Van Bemmel and Musen describe the interplay between data‐information‐knowledge?
What is the “body‐of‐knowledge” in medical jargon? How do human process information?
Sample Questions (1)

MAKE Health 01Holzinger Group, hci‐kdd.org 98
What was our definition of “knowledge”? What is the huge benefit of a probabilistic model? Please explain Bayes law with view on ML! What is information in the sense of Shannon? Why is information theory for us important? Which benefits provide entropic methods for us? Why is feature selection so important? What can you do with the Kullback‐Leibler Divergence?
Sample Questions (2)

MAKE Health 01Holzinger Group, hci‐kdd.org 99
Appendix
10 Appendix

MAKE Health 01Holzinger Group, hci‐kdd.org 100
Back‐up Slide: Poincare Plot for gait analysis
Khandoker, A., Palaniswami, M. & Begg, R. (2008) A comparative study on approximate entropy measure and poincare plot indexes of minimum foot clearance variability in the elderly during walking. Journal of NeuroEngineering and Rehabilitation, 5, 1, 4.

MAKE Health 01Holzinger Group, hci‐kdd.org 101
Back‐up Slide: SampEn (1/2)
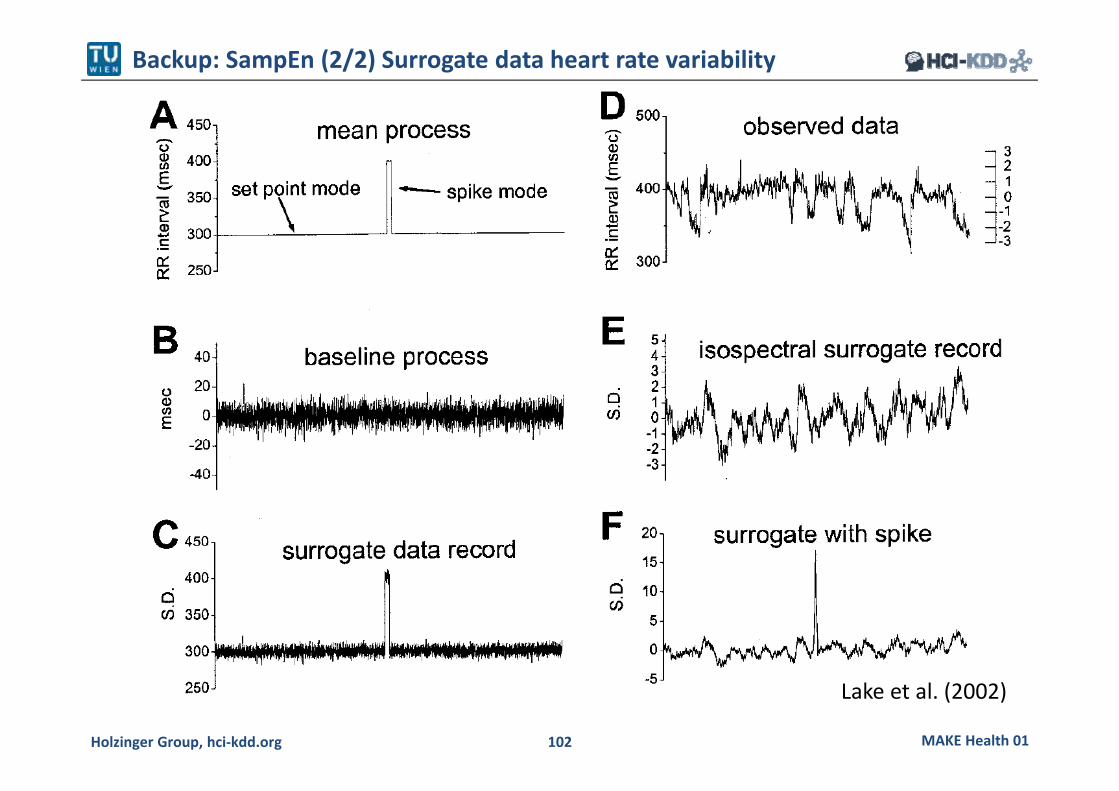
Lake, D. E., Richman, J. S., Griffin, M. P. & Moorman, J. R. (2002) Sample entropy analysis of neonatal heart rate variability. American Journal of Physiology‐Regulatory Integrative and Comparative Physiology, 283, 3, R789‐R797.
MAKE Health 01Holzinger Group, hci‐kdd.org 102
Backup: SampEn (2/2) Surrogate data heart rate variability
Lake et al. (2002)

MAKE Health 01Holzinger Group, hci‐kdd.org 103
Backup Slide: Comparison ApEn ‐ SampEn
Xinnian, C. et al. (2005). Comparison of the Use of Approximate Entropy and Sample Entropy: Applications to Neural Respiratory Signal. Engineering in Medicine and Biology IEEE‐EMBS 2005, 4212‐4215.

MAKE Health 01Holzinger Group, hci‐kdd.org 104
The most important question: Which kind of structural information does the entropy measure detect?
the topological complexity of a molecular graph is characterized by its number of vertices and edges, branching, cyclicity etc.
Backup Slide: Graph Entropy Measures
Dehmer, M. & Mowshowitz, A. (2011) A history of graph entropy measures. Information Sciences, 181, 1, 57‐78.

MAKE Health 01Holzinger Group, hci‐kdd.org 105
Backup: English/German Subject Codes OEFOS 2012
106005 Bioinformatics Bioinformatik106007 Biostatistics Biostatistik304005 Medical Biotechnology Medizinische Biotechnologie305901 Computer‐aided diagnosis
and therapy Computerunterstützte Diagnose und Therapie
304003 Genetic engineering, ‐technology
Gentechnik, ‐technologie
3906 (old)
Medical computer sciences
MedizinischeComputerwissenschaften
305906 Medical cybernetics Medizinische Kybernetik 305904 Medical documentation Medizinische Dokumentation 305905 Medical informatics Medizinische Informatik 305907 Medical statistics Medizinische Statistikhttp://www.statistik.at

MAKE Health 01Holzinger Group, hci‐kdd.org 106
Backup: English/German Subject Codes OEFOS 2012
102001 Artificial Intelligence Künstliche Intelligenz102032 Computational Intelligence Computational Intelligence102033 Data Mining Data Mining 102013 Human‐Computer Interaction Human‐Computer Interaction102014 Information design Informationsdesign102015 Information systems Informationssysteme102028 Knowledge engineering Knowledge Engineering102019 Machine Learning Maschinelles Lernen102020 Medical Informatics Medizinische Informatik102021 Pervasive Computing Pervasive Computing102022 Software development Softwarenetwicklung102027 Web engineering Web Engineering
http://www.statistik.at

MAKE Health 01Holzinger Group, hci‐kdd.org 107
Abduction = cyclical process of generating possible explanations (i.e., identification of a set of hypotheses that are able to account for the clinical case on the basis of the available data) and testing those (i.e., evaluation of each generated hypothesis on the basis of its expected consequences) for the abnormal state of the patient at hand;
Abstraction = data are filtered according to their relevance for the problem solution and chunked in schemas representing an abstract description of the problem (e.g., abstracting that an adult male with haemoglobin concentration less than 14g/dL is an anaemic patient);
Artefact/surrogate = error or anomaly in the perception or representation of information trough the involved method, equipment or process;
Data = physical entities at the lowest abstraction level which are, e.g. generated by a patient (patient data) or a (biological) process; data contain no meaning;
Data quality = Includes quality parameter such as : Accuracy, Completeness, Update status, Relevance, Consistency, Reliability, Accessibility;
Data structure = way of storing and organizing data to use it efficiently; Deduction = deriving a particular valid conclusion from a set of general premises; DIK‐Model = Data‐Information‐Knowledge three level model DIKW‐Model = Data‐Information‐Knowledge‐Wisdom four level model Disparity = containing different types of information in different dimensions Heart rate variability (HRV) = measured by the variation in the beat‐to‐beat interval; HRV artifact = noise through errors in the location of the instantaneous heart beat,
resulting in errors in the calculation of the HRV, which is highly sensitive to artifact and errors in as low as 2% of the data will result in unwanted biases in HRV calculations;
Advance Organizer (1/2)

MAKE Health 01Holzinger Group, hci‐kdd.org 108
Induction = deriving a likely general conclusion from a set of particular statements; Information = derived from the data by interpretation (with feedback to the clinician); Information Entropy = a measure for uncertainty: highly structured data contain low
entropy, if everything is in order there is no uncertainty, no surprise, ideally H = 0 Knowledge = obtained by inductive reasoning with previously interpreted data,
collected from many similar patients or processes, which is added to the “body of knowledge” (explicit knowledge). This knowledge is used for the interpretation of other data and to gain implicit knowledge which guides the clinician in taking further action;
Large Data = consist of at least hundreds of thousands of data points Multi‐Dimensionality = containing more than three dimensions and data are multi‐
variate Multi‐Modality = a combination of data from different sources Multivariate = encompassing the simultaneous observation and analysis of more than
one statistical variable; Reasoning = process by which clinicians reach a conclusion after thinking on all facts; Spatiality = contains at least one (non‐scalar) spatial component and non‐spatial data Structural Complexity = ranging from low‐structured (simple data structure, but many
instances, e.g., flow data, volume data) to high‐structured data (complex data structure, but only a few instances, e.g., business data)
Time‐Dependency = data is given at several points in time (time series data) Voxel = volumetric pixel = volumetric picture element
Advance Organizer (2/2)

MAKE Health 01Holzinger Group, hci‐kdd.org 109
Mathematical Notation
“Inmathematicsyoudon’tunderstandthings.Youjustgetusedtothem”–
JohnvonNeumann

MAKE Health 01Holzinger Group, hci‐kdd.org 110
ApEn = Approximate Entropy; ℂdata = Data in computational space; DIK = Data‐Information‐Knowledge‐3‐Level Model; DIKW = Data‐Information‐Knowledge‐Wisdom‐4‐Level Model;
GraphEn = Graph Entropy; H = Entropy (General); HRV = Heart Rate Variability; MaxEn = Maximum Entropy; MinEn = Minimum Entropy; NE = Normalized entropy (measures the relative informational content of both the signal and noise);
ℙdata = Data in perceptual space; PDB = Protein Data Base; SampEn = Sample Entropy;
Glossary

MAKE Health 01Holzinger Group, hci‐kdd.org 111
Scientists in data integration ‐ selection ‐ incomplete!
Status as of 04.04.2016

MAKE Health 01Holzinger Group, hci‐kdd.org 112
Clinical view on data –information, and knowledge

MAKE Health 01Holzinger Group, hci‐kdd.org 113
Patient orBioprocess
Inter‐pretation
Medical Professional
Inter‐pretation
Data
Inter‐action
Data
Inter‐pretation
Data
.
.
.
.
.
.
InductionBody of
Knowledge
Interpreted Data
Explicit Knowledge
Information
Implicit Knowledge
Clinical View of Data, Information, Knowledge
Bemmel, J. H. v. & Musen, M. A. (1997) Handbook of Medical Informatics. Heidelberg, Springer.

MAKE Health 01Holzinger Group, hci‐kdd.org 114
SymptomsDiagnoses…ImagesVisualizationsBiosignals…HISMISRISPACS…
NosologyPathologyPhysiologyAnatomy…Therapeutic Knowledge
ExperiencePre‐KnowledgeIntuition
Induction
manypatients
generalknowledge
Deduction
single patient
generalknowledge
Holzinger (2007)
From Patient Data to Medical Knowledge

MAKE Health 01Holzinger Group, hci‐kdd.org 115
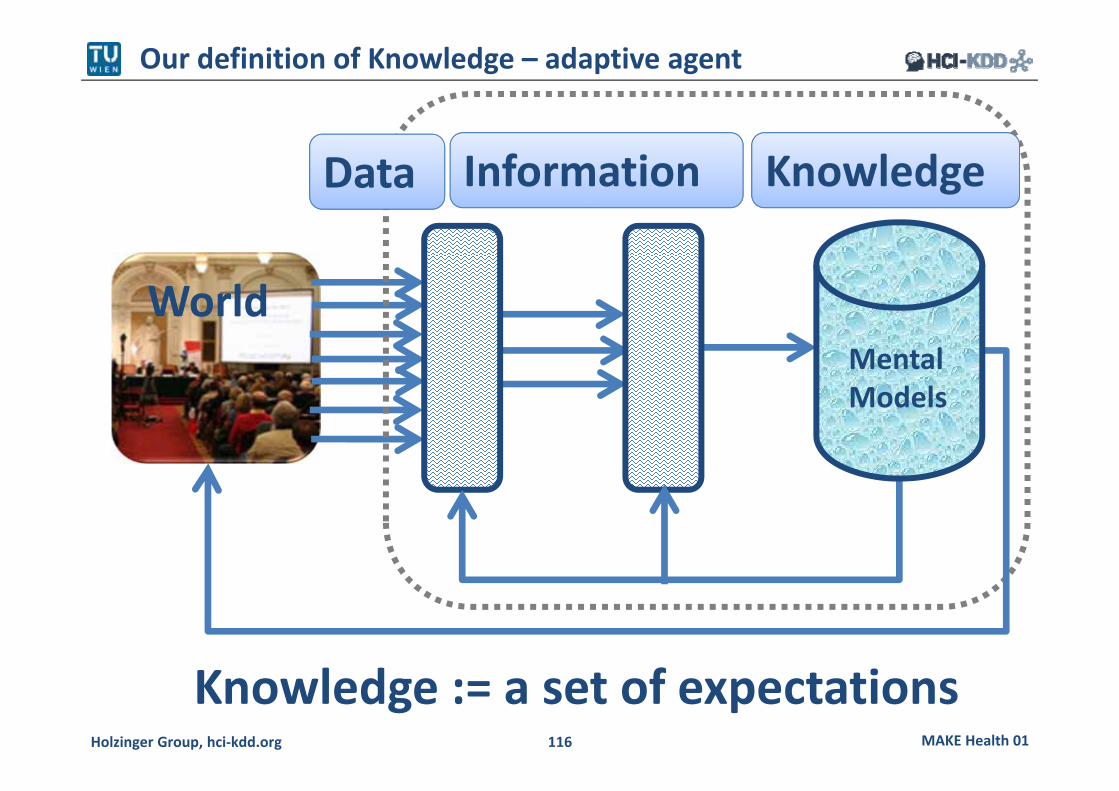
Human Information Processing Model
Wickens, C. D. (1984) Engineering psychology and human performance. Columbus: Merrill.
→ℙ
MAKE Health 01Holzinger Group, hci‐kdd.org 116
Our definition of Knowledge – adaptive agent
World
Knowledge := a set of expectations
Data Information Knowledge
MentalModels

MAKE Health 01Holzinger Group, hci‐kdd.org 117
A space as a set of points
Hou, J., Sims, G. E., Zhang, C. & Kim, S.‐H. 2003. A global representation of the protein fold space. Proceedings of the National Academy of Sciences, 100, (5), 2386‐2390.

MAKE Health 01Holzinger Group, hci‐kdd.org 118
Point Cloud Data Sets
Zomorodian, A. J. 2005. Topology for computing, Cambridge (MA), Cambridge University Press.
Point cloud in topological space metric space
Let us collect ‐dimensional observations:

MAKE Health 01Holzinger Group, hci‐kdd.org 119
Example Metric Space
A set S with a metric function d is a metric space
Doob, J. L. 1994. Measure theory, Springer New York.

MAKE Health 01Holzinger Group, hci‐kdd.org 120
ML‐Jungle Top Level View and the focus of today …
CONCEPTS THEORIES MODELSPARADIGMS METHODS TOOLS
unsupervised
Data structure
Preprocessing
Integration
supervised
Semi‐supv.
online
iML
RLPrivacy MLExp. & Eval.
Always with a focus/application in health informatics
Cognition
Perception
Decision Interaction
VisualizationMaths
Curse of Dim
PL AL
Challenges
NfL‐Theorem
Overfitting
Non‐Parametric
DRBayesian p(x)
Complexity
KL‐Divergence
Info Theory
Gaussian P.
Graphical M.
NN DL
SVM
Linear Models
D. Trees
Regularization
Validation
Aggregation
Input Processes
Python
Julia
Etc.
Azure
MAKE Health 01Holzinger Group, hci‐kdd.org 121
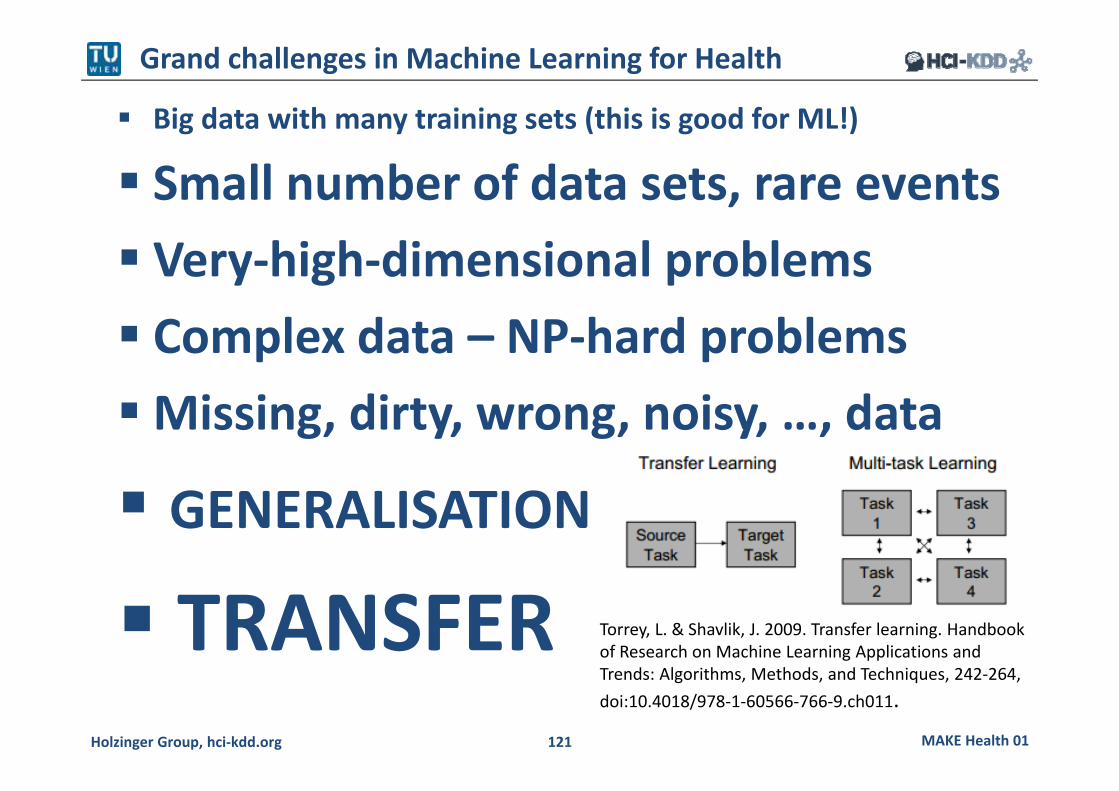
Big data with many training sets (this is good for ML!)
Small number of data sets, rare events Very‐high‐dimensional problems Complex data – NP‐hard problemsMissing, dirty, wrong, noisy, …, data
GENERALISATION
TRANSFER
Grand challenges in Machine Learning for Health
Torrey, L. & Shavlik, J. 2009. Transfer learning. Handbook of Research on Machine Learning Applications and Trends: Algorithms, Methods, and Techniques, 242‐264, doi:10.4018/978‐1‐60566‐766‐9.ch011.

MAKE Health 01Holzinger Group, hci‐kdd.org 122
RDF, OWL
StructuralHomologism
Weakly‐Structured
Well‐Structured
Databases
XML
Standardized Non‐Standardized
Blogs
Social StreamsE‐Mail
Wikis
Data Mining
TopologicalMining
Methods for Mining …
Holzinger, A. 2014. On Topological Data Mining. In: Lecture Notes in Computer Science LNCS 8401. Heidelberg, Berlin: Springer, pp. 331‐356.

MAKE Health 01Holzinger Group, hci‐kdd.org 123
X: S (“measure” of outcome) Events can be defined according to X E(X=a) = {si|X(si)=a} E(Xa) = {si|X(si) a}
Consequently, probabilities can be defined on X P(X=a) = P(E(X=a)) P(aX) = P(E(aX))
partitioning the sample space
Discrete versus continuous random variable

MAKE Health 01Holzinger Group, hci‐kdd.org 124
Tribus, M. & McIrvine, E. C. (1971) Energy and Information. Scientific American, 225, 3, 179‐184.

MAKE Health 01Holzinger Group, hci‐kdd.org 125
A measure for uncertainty (2/3)
Shannon, C. E. (1948) A Mathematical Theory of Communication. Bell System Technical Journal, 27, 379‐423.

MAKE Health 01Holzinger Group, hci‐kdd.org 126
2 2
2 2
Entropy H as a measure for uncertainty (3/3)

MAKE Health 01Holzinger Group, hci‐kdd.org 127
Background on Information Theory
Developed by Claude Shannon in the 1940s Maximizing the amount of information that can be transmitted over an imperfect communication channel Data compression (entropy) Transmission rate (channel capacity)
Claude E. Shannon: A Mathematical Theory of Communication, Bell System Technical Journal, Vol. 27, pp. 379–423, 623–656, 1948

MAKE Health 01Holzinger Group, hci‐kdd.org 128
The VC dimension is a measure of the capacity of a space of functions that can be learned by a statistical classification algorithm. It is defined as the cardinality of the largest set of points that the algorithm can shatter. It is a core concept in Vapnik–Chervonenkis theory
Vapnik – Chervonenkis
Vapnik, V. N. & Chervonenkis, A. Y. 1971. On the Uniform Convergence of Relative Frequencies of Events to Their Probabilities. Theory of Probability & Its Applications, 16, (2), 264‐280, doi:10.1137/1116025.

MAKE Health 01Holzinger Group, hci‐kdd.org 129
with P =
Entropy H as a measure for uncertainty (1/3)
Shannon, C. E. & Weaver, W. (1949) The Mathematical Theory of Communication. Urbana (IL), University of Illinois Press.
Shannon, C. E. (1948) A Mathematical Theory of Communication. Bell System Technical Journal, 27, 379‐423.

MAKE Health 01Holzinger Group, hci‐kdd.org 130
1) Set of noisy, complex data 2) Extract information out of the data 3) to support a previous set hypothesis Information + Statistics + Inference = powerful methods for many sciences Application e.g. in biomedical informatics for analysis of ECG, MRI, CT, PET, sequences and proteins, DNA, topography, for modeling etc. etc.
Entropic methods – what for?
Mayer, C., Bachler, M., Hortenhuber, M., Stocker, C., Holzinger, A. & Wassertheurer, S. 2014. Selection of entropy‐measure parameters for knowledge discovery in heart rate variability data. BMC Bioinformatics, 15, (Suppl 6), S2.