health effects of indoor and outdoor air pollution jie-sheng tan-soo subhrendu k. pattanayak duke...
TRANSCRIPT

Health effects of indoor and outdoor air pollution
Jie-Sheng Tan-SooSubhrendu K. Pattanayak
Duke UniversityCamp Resources 2012

2
Research questions
• What are the joint impacts of indoor and outdoor air pollution on children’s health?– Are impacts different for self-reported and
objective health measurements?

3
Introduction• Respiratory illnesses is top disease burden for developing
countries (WHO, 2008)• Environmental causes: indoor and outdoor air pollution• Indoor air pollution from ‘dirty’ household fuel (PM2.5 air
particulates, carbon monoxide)• Outdoor air pollution from emissions and forest fires (PM10 air
particulates, SO2, NOX, CO, O3)• Climate change to result in worsening outdoor air pollution
(IPCC, 2007)• Need better understanding on the concurrent effects of indoor
and outdoor air pollution• Need to consider endogenous exposure to indoor air pollution
4
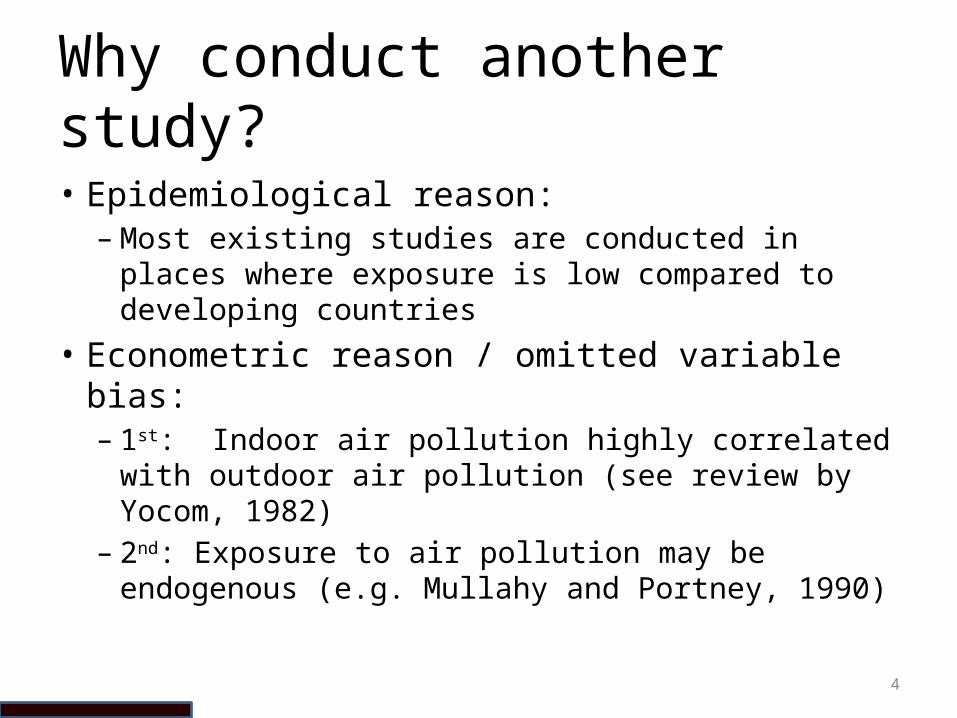
Why conduct another study?
• Epidemiological reason: – Most existing studies are conducted in places
where exposure is low compared to developing countries
• Econometric reason / omitted variable bias: – 1st: Indoor air pollution highly correlated with
outdoor air pollution (see review by Yocom, 1982)– 2nd: Exposure to air pollution may be endogenous
(e.g. Mullahy and Portney, 1990)

5
Study Approach
• Panel individual-level dataset from Indonesia• Include measurements for both indoor air
pollution (IAP) and outdoor air pollution (OAP)• Use household fixed effects to control time-
invariant heterogeneity• Use a wide range of self-reported and
objective health measures

6
Literature Review
• Use 1997 Indonesian forest fires as exogenous shock to OAP (Frankenberg et al., 2005 ; Jayachandran, 2008)
• Use fuel price as instrument for stove usage (Hanley, 2006)
• Include both IAP & OAP in India (Ghosh & Mukherji, 2011)

7
Model• Health production framework (Rosenzwig & Schultz, 1983)
– Maximize household utility subject to health production function and budget constraint
• X: consumption good• R: child’s respiratory health• I: indoor air pollution• O: outdoor air pollution• : prices• Y: income• : unobserved family factors such as health preferences or attitudes
• Reduced-formed child’s health equation
• ‘Hybrid’ health equation are typically estimated because of data constraint

8
Model
• Bias 1: IAP is correlated with OAP where
Marginal effect of IAP is If IAP is not included, then estimates of will be
biased as • Bias 2: Exposure to IAP is endogenous and
correlated with other determinants of health Marginal effect of IAP is

9
Empirical strategy
• Estimating equation
• i: child; j: household; k: district• Measures for both IAP and OAP– Dirty stove indicator for IAP– Aerosol index for OAP
• Inclusion of household fixed effects to control for time-invariant household heterogeneity– Neglect cross-sectional variation– Identification of the IAP parameter is from households that
switched stoves type
10
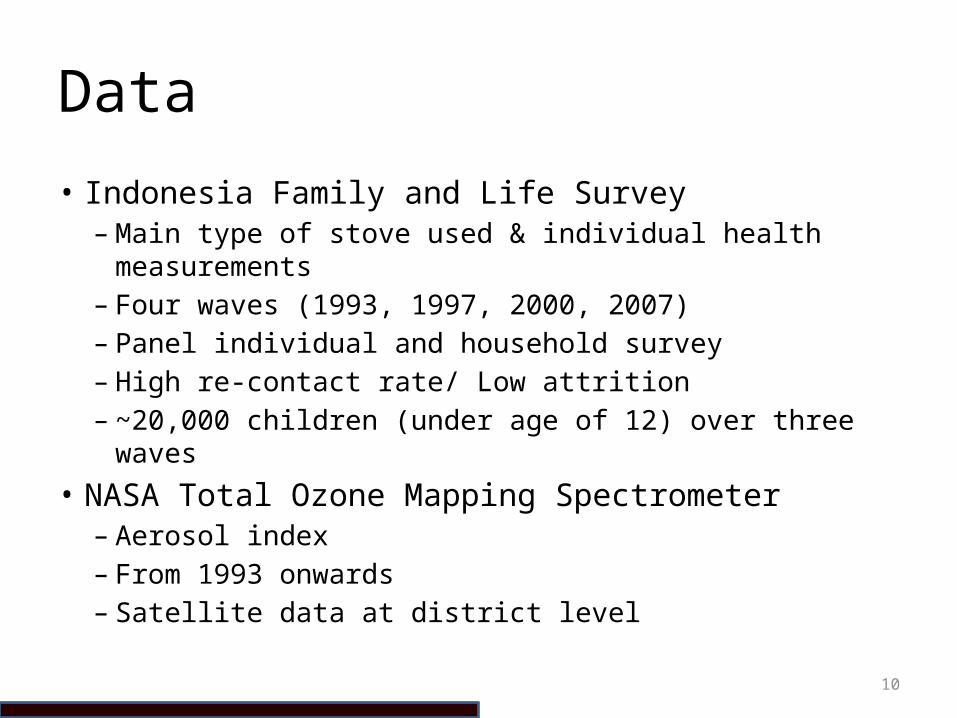
Data
• Indonesia Family and Life Survey– Main type of stove used & individual health measurements– Four waves (1993, 1997, 2000, 2007)– Panel individual and household survey– High re-contact rate/ Low attrition– ~20,000 children (under age of 12) over three waves
• NASA Total Ozone Mapping Spectrometer– Aerosol index– From 1993 onwards– Satellite data at district level
11
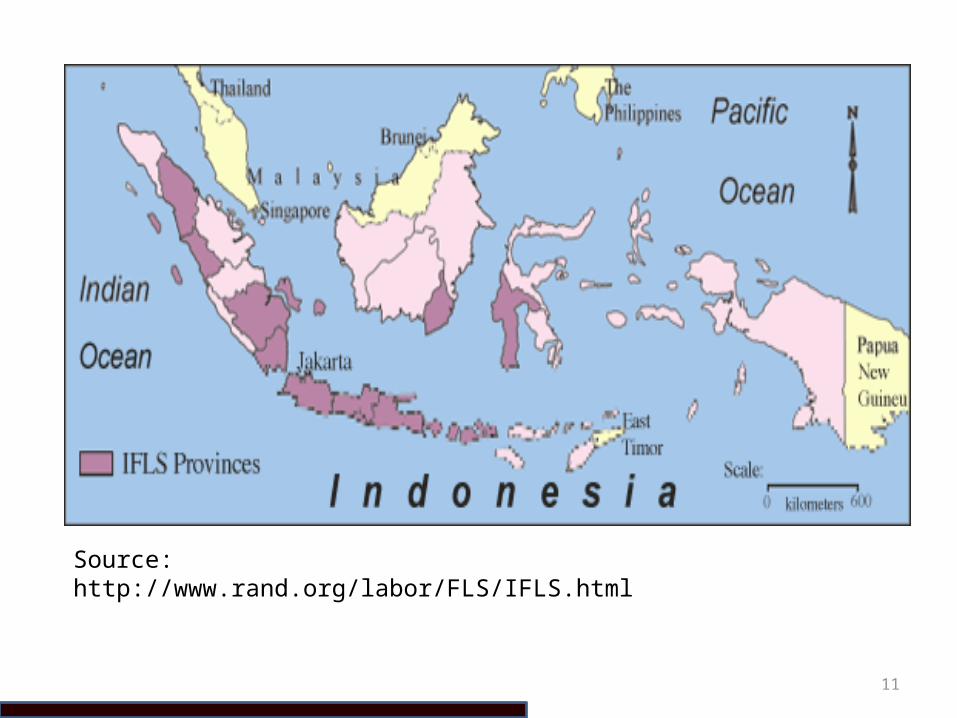
Source: http://www.rand.org/labor/FLS/IFLS.html
12
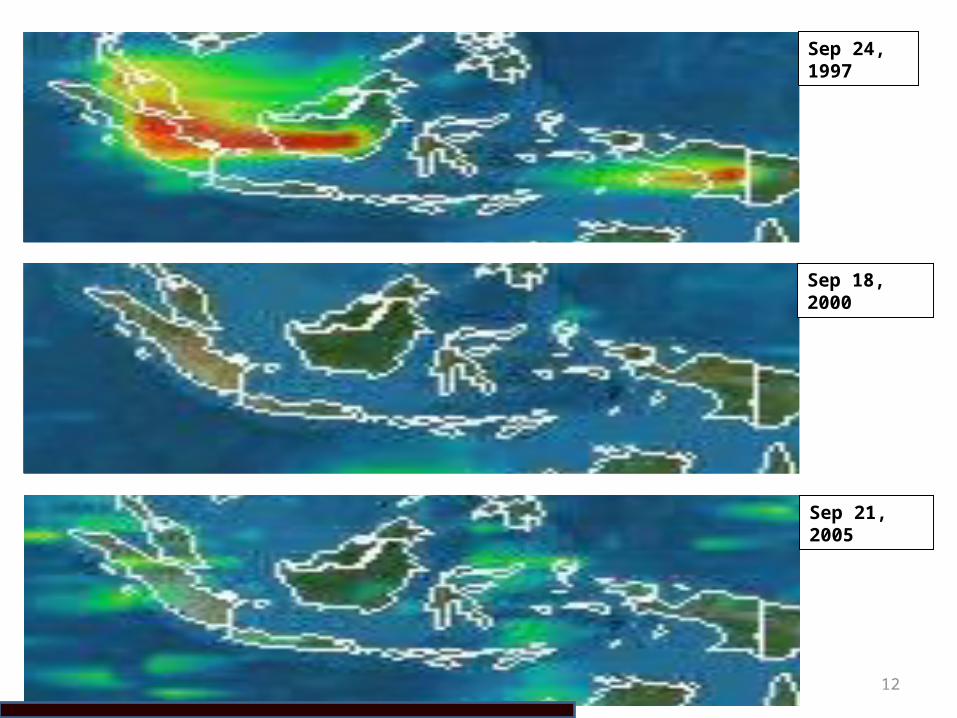
Sep 24, 1997
Sep 18, 2000
Sep 21, 2005

13
Data
• Self-reported health measurements– Cough in last 4 weeks?– Breathing difficulties in last 4 weeks?– Number of days ill in last 4 weeks?– Number of days in bed due to poor health in last weeks?– Assessment of overall health (1-4 with 1 being very unhealthy)
• Objective health measures:– Lung capacity– Body-mass index– Height-for-age z-score– Weight for age z-score

14
Results – self-reported health
(1) (2) (3) (4) (5)
VARIABLESCough Breathing difficulty Days ill Days miss activity Negative health
self-assessment
Aerosol index (AI) -0.00140** 0.000144 -0.00473*** -0.00603* 2.26e-06(p-value) (0.0168) (0.510) (0.00442) (0.0695) (0.997)
Dirty stove indicator 0.00559 -0.00559 -0.0149 -0.0117 -0.0421**
(0.757) (0.375) (0.796) (0.907) (0.0129)
Observations 20,863 20,842 20,852 20,851 20,866
R-squared 0.021 0.003 0.006 0.022 0.013
Number of hh_id 7,009 7,008 7,009 7,010 7,011
Controls: Age, Gender, Household assets, Year FEExpected signs: +ve for column (1) to (5)
15
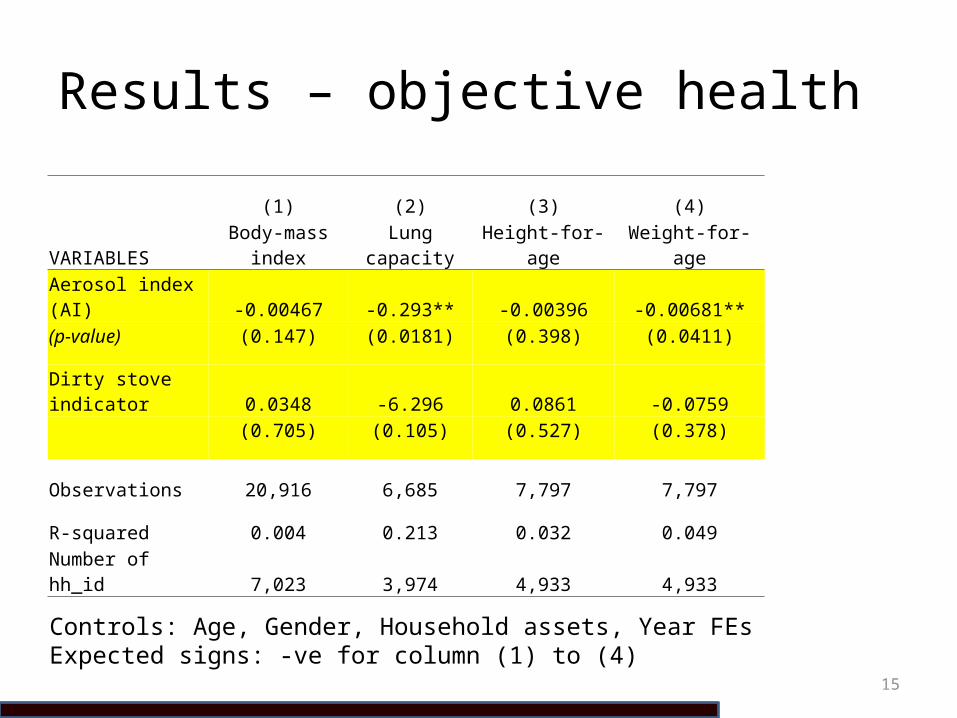
Results – objective health
(1) (2) (3) (4)
VARIABLES Body-mass index Lung capacity Height-for-age Weight-for-age
Aerosol index (AI) -0.00467 -0.293** -0.00396 -0.00681**(p-value) (0.147) (0.0181) (0.398) (0.0411)
Dirty stove indicator 0.0348 -6.296 0.0861 -0.0759
(0.705) (0.105) (0.527) (0.378)
Observations 20,916 6,685 7,797 7,797
R-squared 0.004 0.213 0.032 0.049
Number of hh_id 7,023 3,974 4,933 4,933
Controls: Age, Gender, Household assets, Year FEsExpected signs: -ve for column (1) to (4)
16
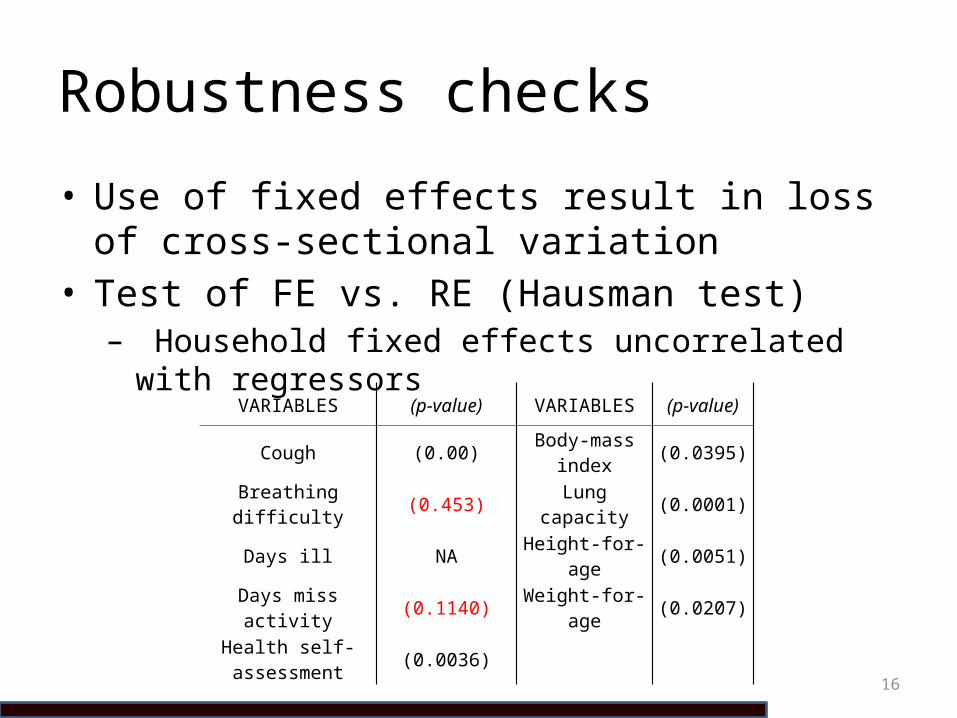
Robustness checks
• Use of fixed effects result in loss of cross-sectional variation
• Test of FE vs. RE (Hausman test)– Household fixed effects uncorrelated with regressors
VARIABLES (p-value) VARIABLES (p-value)
Cough (0.00) Body-mass index (0.0395)
Breathing difficulty (0.453) Lung capacity (0.0001)
Days ill NA Height-for-age (0.0051)
Days miss activity (0.1140) Weight-for-age (0.0207)
Health self-assessment (0.0036)

17
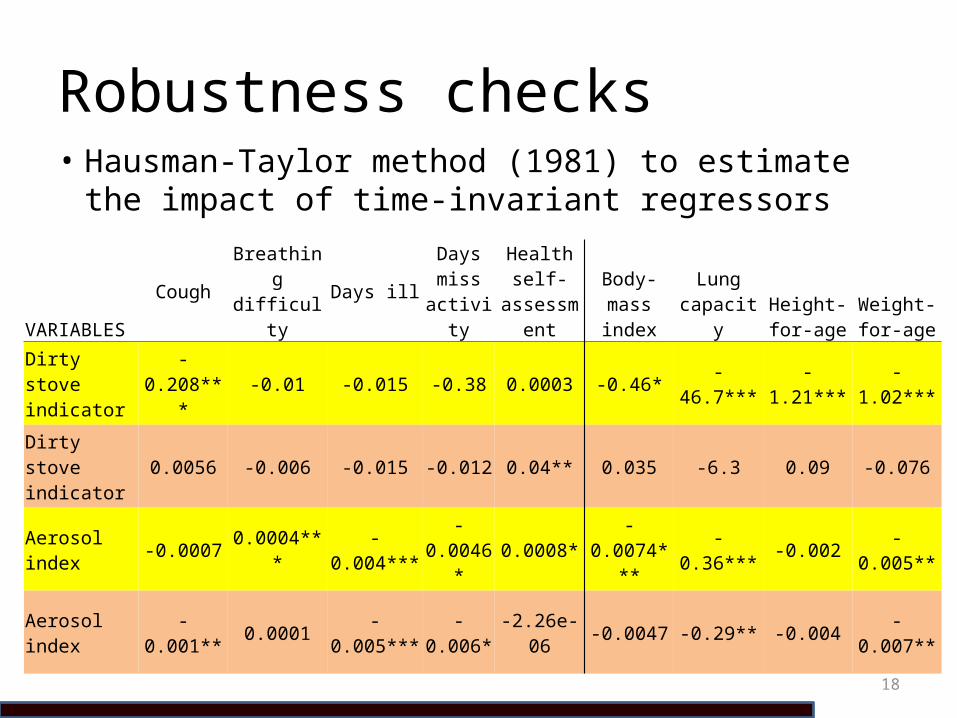
Robustness checks• Hausman-Taylor method (1981) to estimate
the impact of time-invariant regressors
VARIABLES
Cough Breathing difficulty Days ill
Days miss
activity
Health self-assessment Body-mass
indexLung
capacityHeight-for-
ageWeight-for-age
Dirty stove indicator -0.208*** -0.01 -0.015 -0.38 0.0003 -0.46* -46.7*** -1.21*** -1.02***
Aerosol index -0.0007 0.0004*** -0.004*** -0.0046* 0.0008* -0.0074*** -0.36*** -0.002 -0.005**
18
Robustness checks• Hausman-Taylor method (1981) to estimate
the impact of time-invariant regressors
VARIABLES
Cough Breathing difficulty Days ill
Days miss
activity
Health self-assessment Body-mass
indexLung
capacityHeight-for-
ageWeight-for-age
Dirty stove indicator -0.208*** -0.01 -0.015 -0.38 0.0003 -0.46* -46.7*** -1.21*** -1.02***
Dirty stove indicator 0.0056 -0.006 -0.015 -0.012 0.04** 0.035 -6.3 0.09 -0.076
Aerosol index -0.0007 0.0004*** -0.004*** -0.0046* 0.0008* -0.0074*** -0.36*** -0.002 -0.005**
Aerosol index -0.001** 0.0001 -0.005*** -0.006* -2.26e-06 -0.0047 -0.29** -0.004 -0.007**
19
Summary
• Self-reported health likely unreliable• Only OAP has adverse impact on health– Results are driven by HHs that switch stove
• Hausman-Taylor estimator however shows that both OAP & IAP are damaging to health– But results are driven by non-switcher HHs
• In all, results suggest differences between switchers & non-switchers– Long term exposure vs. short term?– Switchers and non-switchers fundamentally different?
20
Key points
• Effects of air pollution on health is a very important and complex problem– Respiratory illnesses is a major burden– Close relationship between indoor and outdoor
pollution– Endogenous exposure to pollution
• Indoor and outdoor air pollution harm health– Switchers vs. non-switchers– Self-reported vs. objective health measures
• Need structural modeling