health expenditure trends in new zealand 1990–2002
TRANSCRIPT

Health Expenditure Trends in New Zealand
1990–2002

Published in April 2004 by the Ministry of Health
PO Box 5013, Wellington, New Zealand
ISBN 0-478-25896-8 (Book) ISBN 0-478-25897-6 (Internet)
HP 3768
This document is available on the Ministry of Health’s website: http://www.moh.govt.nz

Health Expenditure Trends in New Zealand 1990–2002 iii
Foreword This report provides updated estimates of health and disability services expenditure in New Zealand at the aggregate level, on a per capita basis, by source of funds, and in nominal and real terms since 1989/90. The report provides consistent information across various health sector changes. The definitions of health and categories of health care used in the study were developed by the World Health Organization (WHO). They enable comparisons to be made between countries, and also provide consistency with previous reports. However, the WHO definition of ‘health’ is relatively narrow, excluding significant aspects of disability support services. Its narrow focus is particularly significant in New Zealand after the integration of the funding and purchasing of health and disability support services during the 1990s. Following the tradition of previous reports of health expenditure trends in New Zealand, funding transferred from social agencies (transfers) to Vote Health, except the amounts directly related to health care, is classified as ‘non-health’ expenditure. The information in this report provides a basis for understanding the reasons for changes in the patterns of health and disability expenditure in New Zealand. The data provided are also useful in evaluating policies related to health and disability expenditure. These data, together with other information supplied by the Ministry of Health, provide the information resources necessary for the public, researchers and policy makers to assess the performance of the health system over time. It should be noted that Vote Health service providers transferred to Vote Health on 1 August 2000 and the Health Funding Authority was disestablished on 31 December 2000 with its functions transferred to the Ministry of Health. Health Benefits Ltd became part of the Ministry of Health on 31 December 2000. Hospital and Health Services, the companies responsible for running hospitals, were disestablished on 31 December 2000 and these functions transferred to newly created District Health Boards (DHBs). Devolution of funding of community-based providers to DHBs has occurred progressively since 1 July 2001. DHBs are responsible for the health of their local population and plan, fund and provide health services. The financial information for 2001/02 includes the combined activities of these agencies.
John Hazeldine Manager Finance DHB Funding and Performance Directorate

iv Health Expenditure Trends in New Zealand 1990–2002
Acknowledgements The author is indebted to the many individuals who provided information and gave generously of their time to assist with this study. The people and organisations involved are named in Appendix 10. The author would like to thank all those people and organisations for their assistance. Special thanks to Andrea Pettett and Faye Pulley of the Health Funds Association of New Zealand Inc for their invaluable assistance in producing this report. Thanks also to Harvey Steffens at the Ministry of Health, who reviewed the report.
Health Expenditure Trends in New Zealand 1990–2002 v
Contents
Foreword iii
Acknowledgements iv
Executive Summary viii
Chapter 1: Introduction 1
Chapter 2: Definitions 2 2.1 Health services 2 2.2 Personal health services 2 2.3 Disability 3 2.4 Disability support services 3 2.5 Public health services 3 2.6 Teaching and research 3
Chapter 3: Methods and Conventions 4 3.1 Report coverage 4 3.2 Structure of the New Zealand health and disability sector 4 3.3 Crown Health Enterprise/health service provider deficit financing and deficit switch 7 3.4 Transfers 8 3.5 Categories of health expenditure 9 3.6 Items of health expenditure by main expenditure category 9 3.7 Vote Health conventions and definitions 10 3.8 Deflating health expenditure 10 3.9 Goods and services tax and overhead charges 10 3.10 Populations 11
Chapter 4: Trends in Health Expenditure by Funding Source 12 4.1 Introduction 12 4.2 Aggregate health expenditure 12 4.3 Trends in real per capita expenditure on health 14 4.4 Pattern of health care funding by source of funds 16 4.5 Trends in uses of aggregate health and disability funds 18
Chapter 5: Public Sector Funding Sources I – Vote Health and Vote Health Service Providers 19
5.1 Introduction 19 5.2 Vote Health and Health Service Provider deficit financing 19 5.3 Vote Health by major expenditure category 21 5.4 Trends in uses of Vote Health funding 26

vi Health Expenditure Trends in New Zealand 1990–2002
Chapter 6: Public Sector Funding Sources II – Other Government Agencies 27
6.1 Introduction 27 6.2 Accident Compensation Corporation 27 6.3 Other government agencies 28 6.4 Local authorities 33 6.5 Trends in uses of public funding 34
Chapter 7: Private Sector Funding Sources 35 7.1 Introduction 35 7.2 Out-of-pocket expenditure 35 7.3 Health insurance 36 7.4 Voluntary and not-for-profit organisations 37 7.5 Trends in uses of private source funding 38
Chapter 8: International Comparisons 39 8.1 Data comparison issues 39 8.2 Per capita health expenditure in US dollar purchasing power parities 39 8.3 Health expenditure as a percentage of GDP 41 8.4 Publicly funded health expenditure as a proportion of total health expenditure 42 8.5 Health expenditure and GDP per capita 44
Appendices Appendix 1: Categories of health expenditure – definitions 47 Appendix 2: Definition of disability and examples of disability support services 50 Appendix 3: Health expenditure nominal and real (‘non-health’ related items excluded),
1989/90–2001/02 51 Appendix 4A: Health expenditure trends in New Zealand (‘non-health’ items excluded),
1989/90–2001/02 52 Appendix 4B: Health expenditure trends in New Zealand (‘non-health’ items excluded),
1989/90–2001/02 (real 2001/02) 53 Appendix 5A: Health expenditure by funding source and expenditure category, 2001/02
(‘non-health’ items included, $000) 54 Appendix 5B: Health expenditure by funding source and expenditure category, 2000/01
(‘non-health’ items included, $000) 56 Appendix 6A: Health expenditure by funding source and expenditure category, 2001/02
(‘non-health’ items excluded, $000) 58 Appendix 6B: Health expenditure by funding source and expenditure category, 2000/01
(‘non-health’ items excluded, $000) 60 Appendix 7A: Private health insurance trends, 1989/90–2001/02 ($000) 62 Appendix 7B: Private health insurance trends, 1989/90–2001/02 (real 2001/02, $000) 63 Appendix 8A: Trends in expenditure on major health benefits, 1989/90–2001/02 ($000) 64 Appendix 8B: Trends in expenditure on major health benefits, 1989/90–2001/02 (real
2001/02, $000) 65 Appendix 9: A note on transfers and capital expenditure 66 Appendix 10: Contributors 67
References 69

Health Expenditure Trends in New Zealand 1990–2002 vii
List of Tables Table 3.1: CHE/HSP annual deficits, 1994/95–2001/02 7 Table 3.2: Net interdepartmental transfers ($000), 1994/95–2001/02 8 Table 3.3: Reconciliation of 2001/02 Vote Health expenditure ($ million) 10 Table 3.4: Breakdown of 2001/02 Vote Health expenditure ($000) 11 Table 4.1: Real health expenditure trends, 1989/90–2001/02 14 Table 4.2: Health expenditure by source of funds (%), 1989/90–2001/02 16 Table 4.3: Destinations of total health funding, 1999/00–2001/02 (‘non-health’ items excluded) 18 Table 5.1: Vote Health expenditure (excluding capital and transfers) plus CHE/HSP deficit
financing, 1989/90–2001/02* 20 Table 5.2: Components of Vote Health expenditure (excluding capital and including transfers),
1998/99–2001/02 (‘non-health’ items included) 21 Table 5.3: Personal health expenditure by main service category, 2001/02 (‘non-health’ items
included) 22 Table 5.4: Continuing impact of Vote Social Welfare transfers to Vote Health ($000) 1997/98–
2001/02 23 Table 5.5: Disability support expenditure by disability category, 2001/02 23 Table 5.6: Categories of public health expenditure by the Ministry of Health, 1999/00–2001/02 24 Table 5.7: Independent service provider expenditure, 2001/02 24 Table 5.8: Ministry of Health expenditure by output class, 2001/02 25 Table 5.9: Destinations of Vote Health funding (excluding capital and ‘non-health’ items),
1999/00–2001/02 26 Table 6.1: ACC health-related expenditure ($ million), 1998/99–2001/02 28 Table 6.2: Health-related expenditure by other government agencies, 1999/00–2001/02 29 Table 6.3: Health-related expenditure by local authorities ($ million), 1998/99–2001/02 33 Table 6.4: Destinations of public funding of health services, 1999/00–2001/02 34 Table 7.1: Proportion of the New Zealand population covered by medical insurance (by age
group), 2000/01 and 2001/02 36 Table 7.2: Destinations of private health funding, 1999/00–2001/02 38 Table 8.1: Per capita health expenditure (US$ PPP) for OECD countries, 1990–2001 40 Table 8.2: Health expenditure as a percentage of GDP, 1990–2001 42 Table 8.3: Publicly funded health expenditure as a proportion of total health expenditure, 1990–
2001 43 Table 8.4: Per capita GDP and per capita health expenditure (US$ PPP) for OECD countries,
2001 46 Table A9.1: Net interdepartmental transfers, 1993/94–2001/02 ($000) 66 Table A9.2: Vote Health including, and excluding, capital and transfers, 1993/94–2001/02 ($000) 66
List of Figures Figure 3.1: Structure of the New Zealand health and disability sector 5 Figure 4.1: Aggregate real ($ million 2001/02) health expenditure, 1925–2002 13 Figure 4.2 Publicly and privately funded expenditure shares, 1925–2002 13 Figure 4.3: Trends in real total expenditure on health ($ million 2001/02), 1989/90–2000/01 15 Figure 4.4: Trends in real per capita expenditure on health ($ million 2001/02), 1989/90–2000/01 16 Figure 4.5: Total health funding (%) in 1989/90 and 2001/2002 17 Figure 8.1 Relationship between health expenditure and GDP in OECD countries, 2001 44

viii Health Expenditure Trends in New Zealand 1990–2002
Executive Summary This document reports on health and disability expenditure in New Zealand during 2001/02 and provides information on expenditure trends for the period 1990–2002. Expenditure data are provided both inclusive and exclusive of ‘non-health’ items transferred from social agencies to Vote Health. The main focus of this report is on the expenditure series that excludes ‘non-health’ items. In this area, key statistics for 2001/02 include the following:
• Total nominal health and disability expenditure rose 7.9% during the year to $10,680 million. Publicly funded expenditure increased 9.4% and private spending increased 2.6%. Within the latter, private health insurance expenditure increased 0.3% to $612.3 million, private household spending grew 3.5% to $1,715 million. Expenditure by the not-for-profit sector was $33.4 million.
• Real (consumer price index adjusted) total expenditure increased 4.7% for the year compared with a rise of 7.0% the previous year. Real publicly funded expenditure grew by 6.3% and real private expenditure fell by 0.3% (compared to a 13.2% increase in the previous year).
• Real per capita publicly funded expenditure increased 5.2% (compared with 4.7% the year before) to $2,127.
• Real per capita aggregate expenditure increased 3.7% (compared with 6.5% the year before) to $2,731.
• The estimated share of public funding was 77.9%, up 1.2% on the previous year.
• New Zealand’s total health expenditure as a percentage of Gross Domestic Product (GDP) was 8.7%, compared with 8.8% the previous year. When the funding for ‘non-health’ items (mostly disability support activities) is included, the proportion increases to 9.2%, the same increase as in the previous year.
• New Zealand’s publicly funded health expenditure as a percentage of GDP was 6.8%. When the funding for ‘non-health’ items included in Vote Health is added, the proportion of publicly funded health and disability spending to GDP rises to 7.2%.

Health Expenditure Trends in New Zealand 1990–2002 1
Chapter 1: Introduction This report is the latest in a regular series of health expenditure trends in New Zealand reports prepared by the Ministry of Health. The primary purpose of the series is to provide information on expenditure in the health and disability sector for use by interested agencies and individuals, and to foster informed debate on health funding and expenditure issues. The format of the report is similar to that of others in this series. Chapter 2 sets out the approach and definitions used in preparing the report. In Chapter 3 the methods and conventions followed in the report are presented, along with a description of the types of data collected. The chapter also discusses the movements in ‘transfers’ between Vote Health and the votes of other departments over recent years. Chapter 4 presents trends in real expenditure and in real per capita expenditure on health from 1990 to 2002. Information on the source and final use of funds is also provided. Chapters 5 to 7 give a more detailed discussion of expenditure by funding source for the year under review, 2001/02, and for previous years. The purpose of these chapters is to present the data and to explain the effects of recent changes in health sector funding. New Zealand’s expenditure on health and disability services is discussed in Chapter 8 in the context of health expenditure by other member countries of the Organisation for Economic Co-operation and Development (OECD). The chapter provides comparisons of the level of health expenditure, the proportion of health expenditure to GDP and the percentage of publicly funded health expenditure in OECD countries. Appendices 1 to 9 give more in-depth definitions, provide further detailed historical information on expenditure and discuss the methods used to estimate out-of-pocket expenditure. Appendix 10 lists the organisations and individuals who provided information for this report. Readers should note that some of the data have been collected by means of sample surveys and then estimated across the population. Therefore, care should be taken in interpreting changes in individual categories of expenditure from year to year.

2 Health Expenditure Trends in New Zealand 1990–2002
Chapter 2: Definitions
2.1 Health services The expenditure on health care included in Health Expenditure Trends in New Zealand reports conforms to the definitions of health care categories developed for the World Health Organization (WHO) (Abel-Smith 1963). In defining health services, Abel-Smith states:
‘The purpose of health services is to promote health; to prevent, diagnose and treat diseases, whether acute or chronic, whether physical or mental in origin, and to rehabilitate people incapacitated by disease or injury.’
This general statement does not define which services are, or should be, included in or excluded from what is termed ‘health expenditure’. However, following the conventions of earlier Health Expenditure Trends in New Zealand, funding transferred from social agencies (transfers) to Vote Health, except the amounts directly related to health care, is classified as ‘non-health’ expenditure. The following are generally defined as ‘non-health’ items of expenditure: • rest home subsidies • home help and provider subsidies • expenditure on community funding agencies • the Intellectually Disabled subsidy • Salvation Army subsidies. Unless otherwise indicated, these items are excluded from this report to enable comparisons between countries and to provide consistency with previous reports. However, in order to provide a comprehensive picture of actual expenditure on health and disability services, Health Expenditure Trends in New Zealand also provides expenditure information that includes ‘non-health’ items (and indicates the data to which this more inclusive approach applies). Full definitions of health services categories are provided in Appendices 1 and 2. Brief descriptions of the main service categories are given below.
2.2 Personal health services All personal health services are included in the WHO definition of ‘health services’. They are defined as those goods, services and facilities provided to an individual for the purpose of improving or protecting the health of that individual, regardless of whether they are also provided for another purpose. Most personal health services have the aim of improving, rather than providing ongoing support to, the health status of individuals. For example, vaccinations are provided as personal health services to individuals, but the planning and purchasing of immunisation programmes are public health services.

Health Expenditure Trends in New Zealand 1990–2002 3
2.3 Disability A person with a disability is a person who has been assessed as having a physical, a psychiatric, an intellectual, a sensory or an age-related disability (or a combination of these) that is likely to continue for a minimum of six months and reduce independent function to the extent that ongoing support is required.
2.4 Disability support services A disability support service (DSS) is a service provided to someone with a disability or long-term illness, where ‘long-term’ is defined as relating to a condition that has been, or is likely to be, present for six months or more. The limitations of the data collection system mean that these patients tend to be classified as everyone cared for by certain services (ie, services for people with an intellectual handicap or older people) as well as those within other services who are discharged after a stay of longer than six months or, in the case of psychiatric patients, who have been resident for more than six months. The WHO definition of ‘health services’ includes only some of the current disability support services. The definition states that care to an individual must be provided on medical grounds as distinct from social, educational or legal grounds. Under this system of categorising care, services provided to people diagnosed as mentally ill, whether chronically ill (DSS) or acutely ill (personal health), are regarded as ‘health services’. On the other hand, provision of care to people with an intellectual disability is classified as outside the definition of ‘health services’. Similarly, while rest home care for older people is considered to be a DSS, it is not included within the WHO definition of ‘health services’ because people in those institutions are no more ill, in a medical sense, than older people who remain in their own homes.
2.5 Public health services Public health services are those goods, services and facilities that are provided for the purposes of improving, protecting and promoting the health of the whole population or population groups. With this broad focus, they are distinct from individual personal health services.
2.6 Teaching and research The teaching component of this category of expenditure relates to the cost of formal education as part of a professional course (not as general education). It includes the training of nurses, doctors, ambulance drivers and dental nurses, along with postgraduate medical training and salaries of trainee health inspectors while they are attending courses. For the research component, expenditure relates to biomedical and health services research, including research on social aspects of medicine.

4 Health Expenditure Trends in New Zealand 1990–2002
Chapter 3: Methods and Conventions
3.1 Report coverage As noted in Section 2.1, the analysis in this report is based on a WHO model that defines which categories of expenditure should be included or excluded when comparing health expenditures internationally. This report provides information and comment on health and disability expenditure within the WHO definition of ‘health services’, and also covers expenditure outside this definition by including services that the WHO defines as ‘non-health’ items. In instances where the narrower WHO focus is taken, the excluded items of expenditure relate largely to disability support services. Appendices 5A and 5B cover expenditure that includes the ‘non-health’ components (rest home, home help and provider subsidies, expenditure on community funding agencies, the Intellectually Disabled subsidy and Salvation Army subsidies). Appendices 6A and 6B cover expenditure that excludes these ‘non-health’ categories.
3.2 Structure of the New Zealand health and disability sector
In 2000, the Government initiated changes in the health and disability sector that amalgamated the purchase and provision of some services in the same organisations and decentralised decision-making to community-focused District Health Boards (DHBs). Figure 3.1 shows the structure of the New Zealand health and disability sector in 2001 under the New Zealand Public Health and Disability Act 2000.

Health Expenditure Trends in New Zealand 1990–2002 5
Figure 3.1: Structure of the New Zealand health and disability sector
District Health Board provider arms
CENTRALGOVERNMENT
Minister of Health
MINISTRY OF HEALTH• Advise on policy
• Provide health information and processpayments
• Facilitate collaboration and co-ordination
Acting on behalf of the Minister to:• Implement, administer, and enforce
legislation and regulations
• Plan and fund some services
• Plan and maintain nationwide serviceframeworks
• Monitor
21 DISTRICT HEALTH BOARDS
Private & NGO providersPredominantly hospital services, and
some community services, public healthservices, and assessment, treatment
and rehabilitation services
Serviceagreements
Reporting formonitoring
Negotiation ofaccountability documents
Reporting formonitoring
Annual PurchaseAgreement Reporting
Serviceagreements
Serviceagreements forsome services
Reporting formonitoring
New Zealand health and disability support services consumers
Tax payments
Services
• Pharmacists, laboratories,radiology clinics
• IPAs, GPs, midwives,independent nursing practices
• Voluntary providers
• Community trusts
• Private hospitals
• Mäori and Pacific providers
• Disability support services
New Zealand population and business enterprises
Some fees /co-payments
ACC levies and premiums
ACCIDENTCOMPENSATIONCORPORATION
(ACC)Contracts
PRIVATEHEALTH
INSURANCE
Formal accountability
Reporting formonitoring
Services
MINISTERIALADVISORY
COMMITTEES
Funding

6 Health Expenditure Trends in New Zealand 1990–2002
The Minister of Health has overall responsibility for the health system. The Minister of Health works through the Ministry of Health to enter into accountability arrangements with DHBs, determines the health and disability strategies, and agrees how much public money will be spent on the public health system with government colleagues. The Ministry of Health is responsible for ensuring the health and disability system works for New Zealanders. It is the Government’s primary advisor on health policy and disability support services and is responsible for:
• providing policy advice on improving health outcomes, reducing inequalities, and increasing participation
• acting as the Minister of Health’s agent
• monitoring the performance of DHBs and other health sector Crown entities
• implementing, administering and enforcing relevant legislation
• providing health information and processing payments
• facilitating collaboration and co-ordination within and across sectors
• planning and maintaining service frameworks nationally
• planning and funding public health, disability support services and other service areas that are retained centrally.
DHBs are Crown entities whose boards are responsible to the Minister of Health (administration is through the Ministry of Health). The majority of board members (seven) are elected by the community. A minority of members (up to four) are appointed by the Minister of Health. In recognition of the Crown’s partnership with Mäori, each board must have at least two Mäori members or more if Mäori make up a higher proportion of the DHB’s population. There are 21 DHBs in New Zealand. DHBs are responsible for both funding health care services to a geographically defined population and running acute hospital services. This reflects a move away from the purchaser/provider split in secondary care. DHBs are responsible for improving, promoting and protecting the health and independence of their populations. DHBs must assess the health and disability support needs of the people in their regions and manage their resources appropriately. Central government provides broad guidelines on the services the DHBs must provide, and national priorities have been identified in the New Zealand Health Strategy. Service agreements may be entered into with a range of providers, including public hospitals, not-for-profit health agencies, iwi groups and private organisations.

Health Expenditure Trends in New Zealand 1990–2002 7
3.3 Crown Health Enterprise/health service provider deficit financing and deficit switch
Deficits of Crown Health Enterprises (CHEs), which became Hospital and Health Services (HHSs), have been included in Health Expenditure Trends in New Zealand since 1996/97 as part of publicly funded health expenditure. On 1 January 2001 hospitals were incorporated in the DHB structure. During 2000/01 the Ministry of Health retained responsibility for funding health and disability services, although for the first six months the Health Funding Authority held the funding function until its dissolution on 31 December 2000. DHBs were established and prepared to take on the funding function for personal health, mental health and Mäori health services. The operating deficits incurred by CHEs reflected the difference between operating income and operating expenses. These deficits were incorporated into the government accounts as a part of Vote Crown Health Enterprises/Health Service Providers (Vote CHE/HSP). Refer to Section 3.7 for Vote Health conventions and definitions. The inclusion of Vote CHE/HSP is necessary to provide an accurate picture of the expenditure on health-related activities in New Zealand in a given year. A share of these deficits was attributed to the underpricing of services and provision of more services than CHEs/HSPs were contracted to provide. Nevertheless, as these are publicly owned entities and the Government is ultimately responsible for their financing, deficits incurred in providing services are treated as public expenditure in this report. The deficits for 1993/94 to 1997/98 were funded predominantly through Vote CHE/HSP in 1998/99 and 1999/2000, while the part of deficits previously attributed to underpricing and overprovision has been switched to being funded through Vote Health at the beginning of each financial year since 1998/99. Hence the total operational deficit of HSPs reported at the end of 1998/99 was substantially lower than in previous years. Table 3.1 gives details of the deficits for 1994/95 to 2001/02. Table 3.1: CHE/HSP annual deficits, 1994/95–2001/02
1994/95 1995/96 1996/97 1997/98 1998/99 1999/2000 2000/01 2001/02
CHE/HSP deficit funding $ million*
216.7 178.9 226.4 193.5 39.6 6.4 76.8 244.1
Source: Statistics New Zealand 2002
Note: * These totals exclude non-operating items. Publicly funded health expenditure including CHE/DHB deficit financing amounted to 77.9% of total expenditure in 2001/02; excluding CHE/DHB deficit financing, the proportion was 75.6% of total expenditure. In GDP terms, deficit financing in 2001/02 was equivalent to 0.2% of GDP.

8 Health Expenditure Trends in New Zealand 1990–2002
3.4 Transfers Table 3.2 provides details of interdepartmental transfers of funds (transfers). Transfers include both inward (positive) and outward (negative) flows in Vote Health. The continuing impact of transfers from Vote Social Welfare is approximately equivalent to the expenditure on ‘non-health’ items outlined in Section 2.1. Table 3.2: Net interdepartmental transfers ($000), 1994/95–2001/02
Departmental funding 1994/95 ($000)
1995/96 ($000)
1996/97($000)
1997/98($000)
1998/99($000)
1999/2000 ($000)
2000/01 ($000)
2001/02($000)
Vote Social Welfare 275,873 394,690 423,898 433,637 438,974 447,490 456,887 465,367 Vote Education (3,712) (7,146) (6,864) (6,810) (7,157) (7,262) (7,351) (7,433) Vote ACC – – (15,015) (22,770) (23,000) (65,890) (65,890) (65,890) Vote RST – – – (26,551) (26,551) (26,551) (26,551) (26,852) Vote HSP – – – – 145,688 254,488 254,488 256,140 Other departments 1,575 1,575 1,622 1,012 1,575 (1,651) (1,631) (1,613)
Total net interdepartmental transfers
273,736 389,119 403,641 378,518 529,529 600,624 609,952 619,719
Source: Ministry of Health Of the transfers relevant to health expenditure, the largest group is for funding progressively transferred from Vote Social Welfare to Vote Health between 1993/94 and 1996/97. The major components of the Social Welfare transfers in 1996/97 were made up of rest home and Intellectually Handicapped (IHC) subsidies and home support services. Outward transfers from Vote Health in 2001/02 consisted of $7.4 million to Vote Education to fund clinical training and school of medicine occupancy costs, $65.9 million to Vote ACC to fund elective surgery purchases by the Accident Compensation Corporation (ACC), and $26.9 million to Vote Research Science and Technology (RST) to fund health-related research. When comparing changes to health expenditure (or to Vote Health) over time, it is necessary to take account of these transferred funds. For example, in the years before 1993/94 a sum corresponding to the $252 million transferred to Vote Health existed within Vote Social Welfare. Its size, however, is not known.1 Consequently, to compare Vote Health, or total health expenditure, on a consistent basis over time, it is necessary to exclude transfers for the period or time series being compared (see Appendix 9).
1 Before 1993/94 these funds were aggregated with other funds. Consequently, there is no easy way to
take account of this funding when comparing funding flows before 1993/94.
Health Expenditure Trends in New Zealand 1990–2002 9
3.5 Categories of health expenditure Four broad health expenditure categories are examined in this report: • institutional care • community care • public health services • teaching and research. To enable a more detailed examination of expenditure, each of these categories has been disaggregated where possible. Caution, however, should be exercised when interpreting the disaggregated information, as definitions change.2 There have been difficulties in maintaining consistent classifications of some disability support expenditure in recent years. In particular, the categorisation into public, private or community for intellectual and psychiatric disabilities may not have been consistent. Therefore, expenditure data in these categories should be interpreted with care.
3.6 Items of health expenditure by main expenditure category
The components of expenditure included within specific health expenditure categories are listed below.
• General health services include the salaries, wages and other incomes received by service providers (such as doctors, nurses and other medical professionals), the costs of accommodation and supplies (such as pharmaceuticals and other consumables), and administrative overheads, depreciation and interest.
• Expenditure on education is confined to the cost of providing formal education and training to doctors, nurses and dentists at medical schools or polytechnics. It includes teachers’ salaries, the maintenance costs of buildings and the material costs associated with formal training. Also included are the costs of training ambulance personnel, first aid providers and service personnel who may be deployed to transport people in emergencies.
• Research covers direct expenditure on biomedical and health services research, including research on the social implications of medicines. The research costs of pharmaceutical development are also included when they are not incorporated within the price of pharmaceutical products.
• Out-of-pocket expenditure consists of expenditure on pharmaceuticals, medical goods, other health services costs, hospital and nursing care costs, and fees paid to doctors, specialists, dentists and other professionals. It also encompasses the net amounts (less reimbursements) paid to health insurance companies in insurance premiums, as reflected in Statistics New Zealand’s Household Economic Survey.
2 The size of funds appearing in residual or ‘other’ categories also needs to be considered when
interpreting apparent changes in categories of expenditure.

10 Health Expenditure Trends in New Zealand 1990–2002
3.7 Vote Health conventions and definitions The term Vote Health is used in this report in several ways. It is used to mean funding both inclusive and exclusive of ‘non-health’ items and both with and without current transfers and the continuing impact of previous transfers (see Section 3.4), and including and excluding ACC reimbursements (see Section 6.2). Table 3.3 reconciles the different uses and locates each one in the report. Table 3.3: Reconciliation of 2001/02 Vote Health expenditure ($ million)
Vote Health base (excluding capital, transfers and ACC payments)
($ million)
HSP deficits
($ million)
Transfers($ million)
‘Non-health’ items *
($ million)
ACC payments to the Crown
($ million)
6,381 244 620 515 293
Definitions Amount ($ million)
Reference in report
Vote Health base + HSP deficits + ACC payments 6,918 Table 5.1
Vote Health base + ACC payments + transfers 7,418 Table 5.2
Vote Health base + transfers 7,001 Appendix 5A
Vote Health base + transfers – ‘non-health’ items 6,487 Appendix 6A
Source: Ministry of Health
Note: * ‘Non-health’ items account for the majority of transfers.
3.8 Deflating health expenditure New Zealand has no index specific to health expenditure that may be used to remove the effect of price inflation from nominal expenditure on health and disability support services. As with previous reports in this series, the consumer price index (CPI) has been used to deflate nominal to real expenditure. The CPI series used is given in Appendix 3. The series is based on the Statistics New Zealand long-term linked series for ‘all groups’. Annual changes are based on the change from the previous June quarter.
3.9 Goods and services tax and overhead charges The health and disability expenditures presented in this report include goods and services tax (GST) at its prevailing rate. The GST rate is 12.5%. However, the GST rate for all rest home providers is 10.25% (10.75% for all hospitals). The rate is lower because the residential care accommodation element of rest home services is GST exempt. In 2001/02 the Government provided GST-inclusive amounts of $5,647 million to cover personal health care and $1,373 million to cover disability support services. In 2001/02, the Government provided $7,418 million for health and disability funding.

Health Expenditure Trends in New Zealand 1990–2002 11
Table 3.4: Breakdown of 2001/02 Vote Health expenditure ($000)
Expenditure category $ million As a % of Vote Health
Personal health 5,647 76.2
Disability Support Services 1,373 18.5
Public health purchasing 142 1.9
Independent service providers 77 1.0
Other payments 85 1.1
Ministry of Health 94 1.3
Total 7,418 100.0
Source: Ministry of Health
3.10 Populations The data in this report are based on a definition of population that was revised by Statistics New Zealand in 1996. The revisions cause some difficulty in comparing per capita expenditure over time, as they break the long-term time series. Consequently, two per capita comparisons are given in this report: • for 1991/92 to 2001/02 based on the ‘resident’ definition of population • for 1989/90 to 1996/97 based on the now-superseded ‘usually resident’ definition of
population.3
3 Refer to Statistics New Zealand for more information, www.stats.govt.nz.

12 Health Expenditure Trends in New Zealand 1990–2002
Chapter 4: Trends in Health Expenditure by Funding Source
4.1 Introduction Trends in New Zealand health expenditure by public and private sources are examined in this chapter, focusing on the aggregate level. The components of both public and private expenditure in 2001/02 are examined in detail in the next three chapters. Public sector health funding includes the Government’s direct health expenditure through Vote Health and Vote HSP. Other public sector funding includes health-related expenditure by the ACC, other government agencies (Agriculture and Forestry, Defence, Education, Internal Affairs, Corrections, Labour, Mäori Development, Youth Affairs, Women’s Affairs, Pacific Island Affairs, Research Science and Technology, and Work and Income New Zealand) and local authorities (city councils and district councils). Most private sector funding for health-related activities comes from out-of-pocket expenditure by private households (excluding private expenditure by people in long-term care institutions), expenditure by health insurance companies on behalf of their policy holders, and health-related expenditure by not-for-profit organisations met by funds from non-governmental sources.
4.2 Aggregate health expenditure Long-term trends (from 1925 to 2002) in health expenditure in New Zealand are shown below in relation to funding source (Figure 4.1) and public and private shares (Figure 4.2). Total health care expenditure in New Zealand has risen from around $7 million in 1925 to around $10.7 billion4 in 2002 in nominal terms. In real terms total health expenditure rose during this period at an annual average rate of 5.3% (see Figure 4.1). Publicly funded expenditure grew at an annual average rate of 6.1% and privately funded expenditure, starting from a higher base, grew at the slower rate, of 4.0% per year, during the period. Figure 4.2 shows that before World War II private funding of health care dominated in New Zealand and accounted for around 57% of total funding in 1925. By 1945, however, the public share had grown to 74% of total expenditure and steadily increased to peak at 88% in the early 1980s.
4 This figure increases to $11.25 billion when ‘non-health’ items are included.

Health Expenditure Trends in New Zealand 1990–2002 13
Figure 4.1: Aggregate real ($ million 2001/02) health expenditure, 1925–2002
0
2,000
4,000
6,000
8,000
10,000
12,000
1925 1930 1935 1940 1945 1950 1955 1960 1965 1970 1975 1980 1985 1990 1995 2000
$ million
Total health
Publicly funded
Privately funded
Source: Ministry of Health Figure 4.2 Publicly and privately funded expenditure shares, 1925–2002
0%
20%
40%
60%
80%
100%
1925 1930 1935 1940 1945 1950 1955 1960 1965 1970 1975 1980 1985 1990 1995 2000
Percentage100
80
60
40
20
0
Privately funded
Publicly funded
Source: Ministry of Health
14 Health Expenditure Trends in New Zealand 1990–2002
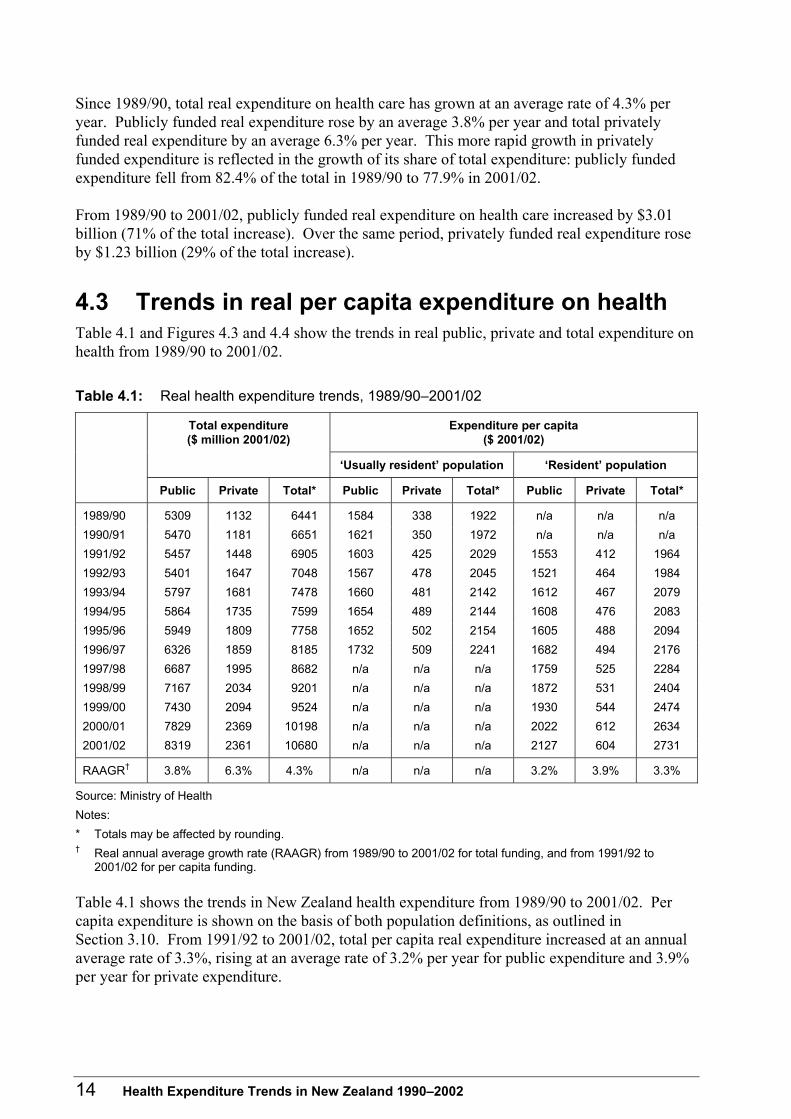
Since 1989/90, total real expenditure on health care has grown at an average rate of 4.3% per year. Publicly funded real expenditure rose by an average 3.8% per year and total privately funded real expenditure by an average 6.3% per year. This more rapid growth in privately funded expenditure is reflected in the growth of its share of total expenditure: publicly funded expenditure fell from 82.4% of the total in 1989/90 to 77.9% in 2001/02. From 1989/90 to 2001/02, publicly funded real expenditure on health care increased by $3.01 billion (71% of the total increase). Over the same period, privately funded real expenditure rose by $1.23 billion (29% of the total increase).
4.3 Trends in real per capita expenditure on health Table 4.1 and Figures 4.3 and 4.4 show the trends in real public, private and total expenditure on health from 1989/90 to 2001/02. Table 4.1: Real health expenditure trends, 1989/90–2001/02
Expenditure per capita ($ 2001/02)
Total expenditure ($ million 2001/02)
‘Usually resident’ population ‘Resident’ population
Public Private Total* Public Private Total* Public Private Total*
1989/90 5309 1132 6441 1584 338 1922 n/a n/a n/a
1990/91 5470 1181 6651 1621 350 1972 n/a n/a n/a
1991/92 5457 1448 6905 1603 425 2029 1553 412 1964
1992/93 5401 1647 7048 1567 478 2045 1521 464 1984
1993/94 5797 1681 7478 1660 481 2142 1612 467 2079
1994/95 5864 1735 7599 1654 489 2144 1608 476 2083
1995/96 5949 1809 7758 1652 502 2154 1605 488 2094
1996/97 6326 1859 8185 1732 509 2241 1682 494 2176
1997/98 6687 1995 8682 n/a n/a n/a 1759 525 2284
1998/99 7167 2034 9201 n/a n/a n/a 1872 531 2404
1999/00 7430 2094 9524 n/a n/a n/a 1930 544 2474
2000/01 7829 2369 10198 n/a n/a n/a 2022 612 2634
2001/02 8319 2361 10680 n/a n/a n/a 2127 604 2731
RAAGR† 3.8% 6.3% 4.3% n/a n/a n/a 3.2% 3.9% 3.3%
Source: Ministry of Health
Notes:
* Totals may be affected by rounding. † Real annual average growth rate (RAAGR) from 1989/90 to 2001/02 for total funding, and from 1991/92 to
2001/02 for per capita funding.
Table 4.1 shows the trends in New Zealand health expenditure from 1989/90 to 2001/02. Per capita expenditure is shown on the basis of both population definitions, as outlined in Section 3.10. From 1991/92 to 2001/02, total per capita real expenditure increased at an annual average rate of 3.3%, rising at an average rate of 3.2% per year for public expenditure and 3.9% per year for private expenditure.

Health Expenditure Trends in New Zealand 1990–2002 15
In 2001/02 aggregate expenditure per capita amounted to $2,731. Of this total, publicly funded expenditure amounted to $2,127 per capita and privately funded expenditure $604 per capita. Figure 4.3: Trends in real total expenditure on health ($ million 2001/02), 1989/90–2000/01
0
2,000
4,000
6,000
8,000
10,000
12,000
1989/90 1990/91 1991/92 1992/93 1993/94 1994/95 1995/96 1996/97 1997/98 1998/99 1999/00 2000/01
$ million
Source: Ministry of Health

16 Health Expenditure Trends in New Zealand 1990–2002
Figure 4.4: Trends in real per capita expenditure on health ($ million 2001/02), 1989/90–2000/01
0
500
1,000
1,500
2,000
2,500
3,000
1989/90 1990/91 1991/92 1992/93 1993/94 1994/95 1995/96 1996/97 1997/98 1998/99 1999/00 2000/01
$ million
Usually resident population
Resident population
Source: Ministry of Health
4.4 Pattern of health care funding by source of funds Table 4.2 shows the trend in health expenditure by source of funds for 1989/90 to 2001/02. Figure 4.5 compares 1989/90 and 2001/02 in particular for their breakdown of funding by source. Table 4.2: Health expenditure by source of funds (%), 1989/90–2001/02
Vote Health
CHE/HSP deficit
financing
ACC Other government
agencies
Local authority
Total public
funding*
Private household
Health insurance
Not-for-profit organisations
Total private
funding*
1989/90 72.7 n/a 4.4 4.8 0.5 82.4 14.5 2.8 0.3 17.6
1990/91 73.9 n/a 3.5 4.3 0.5 82.2 13.9 3.5 0.3 17.8
1991/92 67.9 n/a 6.6 4.0 0.5 79.0 15.9 4.8 0.3 21.0
1992/93 66.3 n/a 6.0 3.9 0.5 76.6 17.9 5.2 0.3 23.4
1993/94 64.9 3.1 6.0 3.0 0.5 77.5 16.1 6.1 0.3 22.5
1994/95 65.0 3.2 5.4 2.9 0.6 77.2 16.2 6.4 0.3 22.8
1995/96 65.2 2.6 5.4 2.9 0.7 76.7 16.3 6.7 0.3 23.3
1996/97 66.1 3.0 4.9 2.7 0.6 77.3 15.6 6.8 0.3 22.7
1997/98 65.8 2.4 5.2 3.0 0.6 77.0 16.3 6.4 0.3 23.0
1998/99 68.1 0.5 5.7 2.9 0.7 77.9 15.5 6.2 0.4 22.1
1999/00 68.0 0.1 6.5 2.8 0.7 78.0 15.4 6.3 0.4 22.0
2000/01 65.3 0.8 7.2 2.9 0.6 76.8 16.7 6.2 0.3 23.2
2001/02 64.6 2.3 7.5 2.8 0.6 77.9 16.1 5.7 0.3 22.1
Source: Ministry of Health
Notes: * Totals may be affected by rounding.

Health Expenditure Trends in New Zealand 1990–2002 17
Total private funding as a percentage of total funding has remained, between 17.6% and 23.4%. Note, however, that data is provided only once every three years from Statistics New Zealand and estimates are used based on the actual data in years that it is produced. Figure 4.5: Total health funding (%) in 1989/90 and 2001/2002
1989/90 2001/02
Publicly funded Privately funded
82.4 77.9 17.6 22.1
VoteHealth
82.4 77.9
HSP deficit financing
n/a 2.3
ACC
4.4 7.5
Other government
4.8 2.8
Local authorities
0.5 0.6
Health insurance
2.8 5.7
Private household
14.5 16.1
Not-for-profit organisations
0.3 0.3 Source: Ministry of Health

18 Health Expenditure Trends in New Zealand 1990–2002
4.5 Trends in uses of aggregate health and disability funds
The trends in total expenditure on personal health and disability support, provided in private and public institutions and community care services, are presented in Table 4.3.5 These figures exclude expenditure on capital and ‘non-health’ items. Table 4.3: Destinations of total health funding, 1999/00–2001/02 (‘non-health’ items
excluded)
1999/00 2000/01 2001/02
$ million % of total $ million % of total $ million % of total
Public institutions
Personal health 2,973.0 33.2 3,172.1 32.0 3,653.6 34.2 Disability support 404.1 4.5 444.8 4.5 327.7 3.1 Total public institutions* 3,377.0 37.7 3,617.0 36.5 3,981.2 37.3
Private institutions
Personal health 836.0 9.3 875.6 8.8 938.2 8.8 Disability support 558.5 6.2 591.0 6.0 433.3 4.1 Total private institutions* 1,394.5 15.6 1,466.5 14.8 1,371.4 12.8
Total institutional care* 4,771.5 53.3 5,083.5 51.3 5,352.7 50.1
Community care
Personal health 3,233.9 36.1 3,858.1 39.0 4,402.6 41.2 Disability support 345.6 3.9 412.8 4.2 307.3 2.9 Total community care* 3,579.5 40.0 4,270.9 43.1 4,710.0 44.1
Public health 209.6 2.3 216.8 2.2 263.5 2.5 Teaching and research 224.4 2.5 258.8 2.6 277.1 2.6 Ministry of Health expenditure 167.2 1.9 72.3 0.7 76.6 0.7
Total expenditure 8,952.3 100.0 9,902.3 100.0 10,679.9 100.0
Source: Ministry of Health
Note: * Totals may be affected by rounding. The figures for 2001/02 indicate an increase in personal health community care, due mainly to an increase in household out-of-pocket expenditure. Caution, however, should be exercised when interpreting trends because of difficulties in ensuring consistent classification of expenditure in recent years. In 2001/02 DSS funding as a portion of Vote Health decreased as psychiatric disability was devolved to the DHBs and reflected in personal health funding. The DSS funding was reflected in personal health funding in the general ledger due to coding problems with the general ledger such that personal health funding was determined as the best fit.
5 Separate tables for destinations of public and private sector funding are given in later chapters.

Health Expenditure Trends in New Zealand 1990–2002 19
Chapter 5: Public Sector Funding Sources I – Vote Health and Vote Health Service Providers
5.1 Introduction Public sector funding is the major source of health funding in New Zealand. Within this source, the Government’s direct health funding through Vote Health is the largest contributor to the total health and disability funding. This direct health funding also includes a small amount through Vote HSP to cover the operational deficits of the HHSs, now the DHBs. In addition, other government agencies provide a significant amount of funding for activities directly and indirectly related to health. The trends in aggregate Vote Health and Vote HSP are discussed in this chapter. Expenditure trends by the other government agencies are presented in Chapter 6.
5.2 Vote Health and Health Service Provider deficit financing
To conform with WHO conventions, Vote Health expenditure excludes capital, on the basis that this expenditure does not directly influence service provision in the year it is incurred. Historically, CHE/HSP deficit financing was also excluded from public health expenditure. However, as noted in Section 3.3, it is now included as part of publicly funded health expenditure and, in this analysis, is included along with Vote Health funding from the time that CHE/HSP deficit financing began in 1993/94.6 As also previously noted, the Vote Health annual appropriations are analysed both inclusive and exclusive of ‘non-health’ items in order to provide a full picture of actual Vote Health expenditure (see Appendices 5A and 6A). The difference between the two categories amounted to $856 million in 2001/02. The long-term time series (Appendices 3, 4A and 4B) follow the WHO definition, thereby excluding ‘non-health’ items (but including CHE/HSP deficit financing), to preserve a consistent format for international comparison. Expenditure growth under Vote Health has accelerated in recent years, particularly following the transfer of disability services and funding from other government departments, most notably from the Department of Social Welfare. To give readers the opportunity to gauge the movements in Vote Health excluding these transfer payments, Table 5.1 gives details of Vote Health (exclusive of both transfers7
and capital) in aggregate and per capita terms (nominal and real) and as a percentage of both GDP and government expenses for 1989/90 to 2001/02. Note that this dataset differs from that presented in Appendix 4.8
6 From 1 August 2000 all capital funding was transferred from Vote HSP to Vote Health. 7 The purpose of this exclusion is to ensure a consistent dataset for the period examined. 8 Following convention, in Appendices 4A–6B, where Vote Health funding relates to the ACC liability for
health care costs incurred in the treatment of accident victims, it is treated as an ACC expenditure item rather than as a Vote Health item.

20 Health Expenditure Trends in New Zealand 1990–2002
Table 5.1: Vote Health expenditure (excluding capital and transfers) plus CHE/HSP deficit financing, 1989/90–2001/02*
1989/90 1990/91 1991/92 1992/93 1993/94 1994/95 1995/96 1996/97 1997/98 1998/99 1999/00 2000/01 2001/02
Total ($ million nominal)
3,702 4,015 4,006 4,053 4,425 4,688 4,855 5,263 5,641 5,836 6,114 6,593 6,918
Total real ($ million 2000/01)
4,698 4,951 4,885 4,877 5,268 5,327 5,406 5,790 6,105 6,337 6,504 6,790 6,918
Per capita – usually resident population basis Per capita ($ nominal)
1,104 1,190 1,177 1,176 1,267 1,322 1,348 1,441 n/a n/a n/a n/a n/a
Per capita real ($ 2000/01)
1,402 1,468 1,435 1,415 1,509 1,503 1,501 1,585 n/a n/a n/a n/a n/a
Per capita – resident population basis Per capita ($ nominal)
n/a n/a 1,145 1,147 1,236 1,292 1,317 1,407 1,493 1,534 1,599 1,708 1,769
Per capita real ($ 2000/01)
n/a n/a 1,390 1,373 1,465 1,460 1,459 1,540 1,606 1,655 1,690 1,753 1,769
Total as % of GDP 5.2 5.5 5.5 5.4 5.4 5.4 5.2 5.4 5.6 5.7 5.7 5.8 5.7
Total as % of Government outlays
12.6 13.5 14.0 14.1 15.5 15.9 15.9 16.1 16.8 16.9 17.0 17.9 18.1
Source: Ministry of Health
Note: * Government expenditure has been revised.
Table 5.1 shows the following trends.
• Nominal Vote Health expenditure (including CHE/HSP deficit financing) grew steadily throughout the review period, except from 1990/91 to 1991/92. Expenditure in 2001/02 was 86.9% higher than in 1989/90 (up an average 5.3% per year).
• Reflecting the trend in total Vote Health expenditure, nominal per capita spending increased throughout the period. Estimated 2001/02 per capita spending was 54.5% higher than in 1991/92 (up an average 4.4% per year).9
• During the review period, real (CPI adjusted) spending decreased from 1990/91 to 1992/93 before beginning a sustained increase. Real expenditure growth averaged 3.5% per year from 1991/92.
• Real per capita growth followed a similar pattern to growth in real spending, averaging 2.4% per year from 1991/92.
• In the review period, Vote Health (including CHE/HSP deficit financing) as a percentage of GDP was at its lowest at 5.2% in 1989/90 and 1995/96. It was 5.7% during 2001/02.
• Health spending as a percentage of total government expenditure was 12.6% in 1989/90. It has increased steadily since then, to 18.1% in 2001/02.
9 Because of the changes in the definition of population, data under the new definition are available only
from 1991/92; discussion on per capita trends is restricted to the period since then.

Health Expenditure Trends in New Zealand 1990–2002 21
5.3 Vote Health by major expenditure category Details of the major expenditure categories in Vote Health for recent years are given in Table 5.2. This table represents Vote Health as appropriated. It excludes CHE/HSP deficit financing and capital but includes transfers. Table 5.2: Components of Vote Health expenditure (excluding capital and including
transfers), 1998/99–2001/02 (‘non-health’ items included)
1999/00 2000/01 2001/02 Expenditure categories
$000 As a % of Vote Health
$000 As a % of Vote Health
$000 As a % of Vote Health
Personal health 4,637,947 69.1 5,022,533 70.5 5,646,848 76.1 DSS 1,645,384 24.5 1,758,700 24.7 1,373,078 18.5 Public health purchasing 117,273 1.7 124,755 1.8 141,966 1.9 Independent service providers 34,386 0.5 46,926 0.7 77,123 1.0 Other payments* 213,724 3.2 47,989 0.7 85,209 1.1 Ministry of Health 59,220 0.9 126,370 1.8 93,854 1.3
Total** 6,707,934 100.0 7,127,273 100.0 7,418,078 100.0
Source: Ministry of Health
Note: * Other payments made up of teaching and research costs. ** Totals may be affected by rounding.
Table 5.2 shows that the total Vote Health over the three years ended June 2002 grew to $7,418 million.10 This figure translates to an annual nominal rate of growth of 8.3% for this period. Discussion of trends in the main expenditure categories outlined in Table 5.2 follows.
5.3.1 Personal health Funding related to health services provided to individuals for the purpose of improving or protecting their health is identified as personal health expenditure. Personal health funding grew from $5,023 million to $5,650 million from 2000/01 to 2001/02, a growth rate of 12.5%. Its share of Vote Health was 70.5% in 2000/01, compared with 76.2% in 2001/02. Table 5.3 gives a breakdown of Vote Health and Vote HSP funding in personal health expenditure by main expenditure category during 2001/02. Medical and surgical expenditure, which accounted for 41.9% of total personal health expenditure, is the largest category, followed by medicaments (mainly pharmaceuticals) at 15.6%.
10 This amount differs from Vote Health expenditure as it is set out in Appendices 4A, 4B, 5A and 5B.
The difference stems from the exclusion of ‘non-health’ expenditure and of that component of Vote Health used to fund accident-related expenditure reported by the ACC (see Section 6.2 and footnote 12).

22 Health Expenditure Trends in New Zealand 1990–2002
Table 5.3: Personal health expenditure by main service category, 2001/02 (‘non-health’ items included)
Institutional* $ million % of total Community* $ million % of total
Medical and surgical** 2,367.1 41.9% GP 337.4 6.0%
Mental health 373.8 6.6% Maternity 152.3 2.7%
Dental 87.0 1.5% Specialist 0.0 0.0%
Maternity 322.4 5.7% Referrals 326.3 5.8%
Other 284.2 5.0% Dental 25.1 0.4%
Mental health 416.2 7.4%
Medicaments 879.2 15.6%
Other 79.5 1.4%
Total institutional† 3,434.5 60.8% Total community† 2215.9 39.2%
Total personal health† 5650.4 100.0%
Source: Ministry of Health
Notes: * For definitions of institutional and community, see Appendix 1. ** Includes clinical training. † Totals may be affected by rounding.
5.3.2 Disability support services Individuals are eligible for disability support services funded by Vote Health if they have a physical, a psychiatric, an intellectual, a sensory or an age-related disability (or a combination of these) that is likely to continue for a minimum of six months and reduces independent functioning to the extent that ongoing support is required. DSSs purchased by Vote Health cover personal care services including assistance with daily activities (including dressing, personal hygiene and eating), and household management services (including assistance with meal preparation, cooking, cleaning and shopping). Care may be provided in a rest home or hospital, a community residential home, or a person’s home. A full explanation of DSSs is in Appendix 2. From 1997/98 to 2000/01, DSS funding increased an average 6.6% per year, from $1,453 million to $1,759 million, while its share of Vote Health decreased from 25.1% to 24.7%. As noted in Section 3.4, part of this change is due to the progressive transfer of services from Vote Social Welfare to Vote Health, from 1993/94 to 1995/96 (refer to Section 6.3.10). In 2001/02 DSS funding as a portion of Vote Health decreased to $1,373 million as psychiatric disability was devolved to the DHBs and reflected in personal health funding. The DSS funding was reflected in personal health funding in the general ledger due to coding problems with the general ledger such that personal health funding was determined as the best fit.

Health Expenditure Trends in New Zealand 1990–2002 23
Since the last major tranche from Vote Social Welfare was transferred in 1995/96, funding has grown at least the rate of the DSS demographic adjuster11 and will continue to do so unless there are further funding level adjustments. Table 5.4: Continuing impact of Vote Social Welfare transfers to Vote Health ($000)
1997/98–2001/02
1997/98 1998/99 1999/00 2000/01 2001/02
433,637 438,974 447,490 456,887 465,367
Source: Ministry of Health Table 5.5 gives a breakdown of DSS funding for 2001/02 by disability type. It shows that age-related disability receives the largest amount (63.9%) of funding. Table 5.5: Disability support expenditure by disability category, 2001/02
Disability category $ million % of total
Age-related disability 877 63.9 Psychiatric disability 11 0.8 Intellectual disability 302 22.0 Physical/sensory disability 183 13.3
Total* 1,373 100.0
Source: Ministry of Health
Note: * Totals may be affected by rounding.
5.3.3 Public health Public health funding is for services concerned with the whole population or population groups; this broad focus distinguishes it from funding for individual personal health services. Public health services are primarily concerned with health protection, improvement and/or promotion. Specific objectives include:
• ensuring that health and disability services meet population needs, and that health gains are maximised and services are provided efficiently
• improving regulatory frameworks so that they better protect the health and safety of New Zealanders while minimising industry compliance costs
• improving the health status of at-risk groups, especially Mäori, by greater responsiveness to their needs.
11 This adjuster increases funding in line with age, gender and other characteristics of the population.

24 Health Expenditure Trends in New Zealand 1990–2002
From their inception, regional health authorities (RHAs) were charged with the responsibility of purchasing public health community services. At the end of 1994/95, RHAs, and later the Health Funding Authority (HFA), assumed responsibility for purchasing some national operations programmes. The Ministry of Health retained responsibility for the purchase of some public health service programmes that had a national focus; the categories of such programmes are shown in Table 5.6. From 1 January 2001 the Ministry of Health became responsible for funding public health services. Table 5.6: Categories of public health expenditure by the Ministry of Health,
1999/00–2001/02
1999/00 2000/01 2001/02 Expenditure categories
$ million % of total $ million % of total $ million % of total
Science services to support field work
11.7 62.2 11.9 46.9 13.3 45.2
Surveillance and surveys of health status and outcomes
2.4 12.8 1.4 5.5 6.2 20.9
Health education and promotion 0.4 2.1 0.4 1.6 1.4 4.7
Other national programmes 4.3 22.9 11.7 46.0 8.6 29.1
Total* 18.8 100.0 25.4 100.0 29.45 100.0
Source: Ministry of Health
Note: * Totals may be affected by rounding.
5.3.4 Independent service providers Independent service providers represent a residual category of health funding outside personal health, DSSs and public health. As Table 5.7 shows, the main expenditure categories are provider development at $15.6 million and legal expenses at $13.1 million. Independent service providers accounted for around 1.0% of Vote Health in 2001/02, having increased at a rate of around 2.3% per year since 1998/99. Table 5.7: Independent service provider expenditure, 2001/02
Service category $ million % of total
International health organisations 1.9 3.1
Legal expenses 13.1 22.0
National advisory and support services 12.6 21.3
Residual health management 1.8 3.1
Health and disability services 12.3 20.7
Advice on food standards 2.1 3.5
Provider development 15.6 26.3
Total* 59.5 100.0
Source: Ministry of Health
Note: * Totals may be affected by rounding.

Health Expenditure Trends in New Zealand 1990–2002 25
5.3.5 Ministry of Health Table 5.8 provides a breakdown of funding by output class for the Ministry of Health in 2001/02, it reflects the Ministry of Health’s head office costs. It shows that information services costs are the largest, accounting for $35.9 million (or 24.3% of total operational expenses). Funding for public health is the next largest output class at 20.9% of operational expenses. Table 5.8: Ministry of Health expenditure by output class, 2001/02
Output class $ million % of total
Health and disability policy advice 8.3 5.6
Performance management 9.4 6.4
Ministerial support services 4.7 3.2
Mäori Health 4.3 2.9
Public health 30.9 20.9
Disability issues 12.5 8.5
Health sector development 5.2 3.5
Mental health 5.8 3.9
Personal and family services 22.5 15.2
Screening programmes 8.1 5.5
Information services 35.9 24.3
Total 147.6 100.0
Source: Ministry of Health
Note: * Totals may be affected by rounding.

26 Health Expenditure Trends in New Zealand 1990–2002
5.4 Trends in uses of Vote Health funding The trends in Vote Health funding from 1999/00 to 2001/02, in relation to private and public institutions and community care services by category, are presented in Table 5.9. These figures exclude expenditure on capital and ‘non-health’ items. Table 5.9: Destinations of Vote Health funding (excluding capital and ‘non-health’ items),
1999/00–2001/02
1999/00 2000/01 2001/02
$000 % of total $000 % of total $000 % of total
Public institutions
Personal health 2,739,226 42.6 2,829,713 43.7 3,130,774 45.4 Disability support 402,604 6.4 436,666 6.7 297,200 4.3 Total public institutions* 3,141,830 49.0 3,266,379 50.5 3,427,975 49.7
Private institutions
Personal health 212,508 2.5 265,504 4.1 300,188 4.3 Disability support 536,815 8.7 562,653 8.7 402,836 5.8 Total private institutions* 749,323 11.2 828,157 12.8 703,024 10.2
Total institutional care * 3,891,153 60.2 4,094,536 63.3 4,130,999 59.8
Community care
Personal health 1,615,562 30.4 1,852,316 28.6 2,310,215 33.5 Disability support 248,387 4.5 275,898 4.3 158,522 2.3 Total community care* 1,863,949 34.8 2,128,214 32.9 2,468,737 35.8
Public health 93,229 1.9 99,385 1.5 141,966 2.1 Teaching and research 70,650 1.3 75,000 1.2 85,209 1.2 Ministry of Health expenditure 167,219 1.8 72,296 1.1 76,647 1.1
Total expenditure* 6,086,199 100.0 6,469,431 100.0 6,903,558 100.0
Source: Ministry of Health
Note: * Totals may be affected by rounding.
Health Expenditure Trends in New Zealand 1990–2002 27
Chapter 6: Public Sector Funding Sources II – Other Government Agencies
6.1 Introduction As discussed in Chapter 5, the main contribution to public sector funding of health comes from the Government through Vote Health. In addition to Vote Health, a significant amount of health expenditure comes from the ACC. The ACC is a statutory insurance organisation, owned by the state that provides compulsory, comprehensive, no-fault insurance cover for accident-related injuries to all New Zealanders. Some other government agencies and local authorities also incur expenditure that directly or indirectly affects the health status of New Zealand residents. Funding from the ACC accounted for 7.5% of total expenditure, excluding ‘non-health’ items, in 2001/02. Other government agencies accounted for 3.1% and local authorities 0.6%. In this chapter, trends in expenditure by the ACC, other government agencies and the local authorities are discussed in more detail.
6.2 Accident Compensation Corporation 6.2.1 Background The ACC was established in 1974 following the recommendations of the 1967 Royal Commission on Personal Injury. It provides a range of services to reduce the impact of injury on individuals and the community. These include: • injury prevention initiatives • case management and rehabilitation services • health professional relationship management services throughout New Zealand. The ACC has responsibility for establishing and operating an insurance-based scheme to rehabilitate and compensate people who suffer personal injury.12 To meet this responsibility, the ACC purchases primary health care, emergency transport, community and referred services, and non-urgent (‘elective’) medical treatment for clients directly from hospital and health services and private providers, and ancillary services for people with injuries from accidents. The Ministry of Health purchases acute care, certificates and laboratory services for injured people on behalf of the ACC. The ACC annually pays a bulk fund to the Crown to cover the cost of the acute services provided by public hospitals. Table 6.1 gives details of the ACC’s total health-related expenditure, along with its reimbursement and net addition to total expenditure in the health sector, from 1998/99 to 2001/02.
12 Personal injury covers accident, medical misadventure, employment-related conditions and treatment for
personal injury.

28 Health Expenditure Trends in New Zealand 1990–2002
Table 6.1: ACC health-related expenditure ($ million), 1998/99–2001/02
ACC health-related expenditure 1998/99 1999/00 2000/01 2001/02
Total expenditure 487.0 581.1 709.6 801.3
Less reimbursement 120.5 201.6 272.6 292.5
Net addition to total health expenditure* 366.6 379.5 437.0 508.8
Source: Ministry of Health
Note: * Totals may be affected by rounding.
6.2.2 Expenditure trends The trends in ACC health-related expenditure from 1989/90 to 2001/02 are given in Appendices 4A (nominal) and 4B (real 2000/01). Those figures show that, in nominal terms, ACC health expenditure grew from $222.6 million in 1989/90 to $801.3 million in 2001/02. A detailed breakdown of ACC health expenditure by category for 2001/02 is provided in Appendices 5A and 6A.
6.3 Other government agencies 6.3.1 Background The other government agencies whose health-related expenditure is included in this report are the Ministries, Departments or services of Agriculture and Forestry, Defence, Education, Corrections, Labour, Mäori Development (Te Puni Kökiri), Internal Affairs, Research Science and Technology, Women’s Affairs, Youth Affairs, Pacific Island Affairs and Work and Income New Zealand (WINZ). Estimates of health expenditure for this group of agencies were derived from either direct responses13 from the Ministries or Departments of Education, Defence, Corrections, Internal Affairs, Women’s Affairs, Youth Affairs, Pacific Island Affairs, Veterans’ Affairs from Mäori Development, MAF, and the state-owned enterprises Asure New Zealand and Agriquality New Zealand, Ministry of Labour and Research Science and Technology. Destinations of health-related expenditure by other government agencies for the period from 1999/00 to 2001/02 are shown in Table 6.2. Most of the expenditure was in teaching and research, which has increased by $8.11 million from 2000/01, mainly in relation to the Ministry of Education. As in 2000/01, expenditure on direct health and disability services accounts for a small proportion of the total, incurred mainly by the Department of Corrections in relation to prisoners and WINZ in relation to war pensioners.
13 Annual reports or estimates on prior years’ data.

Health Expenditure Trends in New Zealand 1990–2002 29
Table 6.2: Health-related expenditure by other government agencies, 1999/00–2001/02
1999/00 2000/01 2001/02
$000 % of total $000 % of total $000 % of total
Institutional care
Personal health 4,182 1.7 3,783 1.3 3,763 1.1
Disability support 3,193 1.3 2,044 0.7 2,285 0.7
Community care
Personal health 19,634 7.8 25,353 9.0 38,973 11.1
Disability support 19,439 7.8 20,555 7.3 18,480 5.3
Public health 51,049 20.4 48,018 17.0 95,945 27.4
Teaching and research 152,734 61.0 182,474 64.7 190,584 54.4
Total expenditure* 250,230 100.0 282,226 100.0 350,029 100.0
Source: Relevant government agencies (as named in Section 6.3.1)
Note: * Totals may be affected by rounding.
6.3.2 Biosecurity Vote Biosecurity brings together the biosecurity activities of the ministries or departments of Agriculture and Forestry, Fisheries, Health and Conservation. One of the strategic result areas to which a large proportion of the appropriations in Vote Biosecurity will be devoted is protecting and enhancing the environment, with particular emphasis on:
• monitoring the effectiveness of policy and legislative frameworks for managing risks posed by pests, weeds and diseases to the economy, biological diversity and people’s health
• developing and implementing strategies to manage the risks posed by pests, weeds and diseases to the economy, biological diversity and people’s health.
Health-related expenditure in Vote Biosecurity covers the costs of the following services and activities.
• Border inspection and quarantine services control quarantine risks at the border and undertake post-entry quarantine in line with the provisions of the Biosecurity Act 1993. Health-related activities include border clearance procedures for aircraft and vessels, including for passengers, the investigation of suspected illegal imports and the identification of intercepted organisms. In 2001/02, expenditure in this area amounted to $38.0 million by the Ministry of Agriculture and Forestry (MAF 2002).
• Pest and disease surveillance services maintain the health of domestic animal and plant populations, report internationally on the health status of domestic animals and plants, and detect unwanted organisms. Pest and disease emergency response services maintain a capability (personnel and diagnostic capacity) to respond to the introduction of unwanted organisms that are harmful to animals and plants. In 2001/02 combined expenditure was $18.0 million by the Ministry of Agriculture and Forestry (MAF 2002).

30 Health Expenditure Trends in New Zealand 1990–2002
• Control of tuberculosis vectors requires expenditure to purchase services to control populations of wild animals, particularly possums, in locations where infected members of the population transmit tuberculosis to cattle and deer. Expenditure on this activity in 2001/02 amounted to $29.1 million by the Ministry of Agriculture and Forestry.
• Policy advice involves expenditure by the Ministry of Health to purchase policy advice to support the Government on biosecurity issues as they affect public health. In 2001/02 expenditure was $0.34 million (Ministry of Health 2002).
• Scientific advice to support pest management strategies as they affect public health. This involves such things as the purchase of taxonomic services to support surveillance programmes for exotic mosquitoes. Expenditure by the Ministry of Health in this area was an estimated $0.06 million (Ministry of Health 2002) in 2001/02.
In addition to administering Vote Biosecurity appropriations, the ministries and departments covered in the following sections independently purchased the health-related services described below.
6.3.3 Ministry of Agriculture and Forestry • Administration of food assurance standards covers the regulation of food safety, composition
and labelling through the development, promulgation and maintenance of standards designed to give effect to New Zealand law and policies covering food assurance arrangements. In 2001/02, expenditure in this area was $22.1 million.
• Verification services cover the delivery of services associated with the delivery of sanitary and phytosanitary and related official assurances as required by the Ministry of Agriculture and Forestry Food Assurance Authority technical and operational standards, which include the importing country’s own biosecurity requirements. Expenditure on this output in 2001/02 was $30.9 million (MAF 2002).
• Meat assurance quality services are services to sectors involved in the production, processing and retail of meat products and by-products. The delivery of these services is contracted to the state-owned enterprise Asure Ltd. Expenditure on provision of these services is estimated to be $36.3 million in 2001/02, based on figures provided in 2000/01.
• Other health-related expenditure by the Ministry of Agriculture and Forestry, such as contestable quality management services and enforcement of legislation, amounted to $2.3 million in 2001/02.
Expenditure on Ministry of Agriculture and Forestry programme outputs amounted to $179.2 million during 2001/02. This expenditure is aimed at protecting the meat, dairy and horticultural industries in New Zealand from pests and diseases that would eventually affect the health of consumers.

Health Expenditure Trends in New Zealand 1990–2002 31
6.3.4 Ministry of Defence The Ministry of Defence provides funding for health care services to army, navy and air force personnel. The estimates of expenditure include the cost of medical and dental treatments carried out within the defence service branches as well as payments for services obtained from external professionals and organisations; they exclude expenditure related to medical examinations. These estimates assume that the change in health expenditure from 1999/00 to 2001/02 was in line with the rate of change in total Vote Defence between those years. The estimated expenditure relating to health care for 2001/02 was $22.4 million.
6.3.5 Ministry of Education Ministry of Education spending on health-related activities includes the cost of providing tertiary training and education for doctors, nurses, dentists, dieticians, physiotherapists, clinical psychologists, audiologists, pharmacists, midwives and occupational and speech therapists. Expenditure includes tuition subsidies but excludes student loans and allowances. The total estimated expenditure in 2001/02 was $149.8 million, $119.8 million on teaching and $30.0 million on research.
6.3.6 Department of Internal Affairs The Lottery Grants Board, which is administered by the Department of Internal Affairs, funded health-related projects amounting to $8.6 million during 2001/02. This total includes grants made on the recommendation of the Lottery Health Research Committee to fund: • research that will lead to improvement in the health status of New Zealanders • activities to enhance the quality of life of individuals with disabilities • capital investment in ambulance services and hospices. In addition, direct grants were made to individuals with disabilities to purchase disability support equipment not funded by other sources to increase and maintain their participation, fulfilment, enjoyment and achievement in the community.
6.3.7 Department of Corrections The Department of Corrections incurs costs relating to the provision of health care services to prison inmates and those held in judicial custody. The total estimated cost of $16.0 million in 2001/02 includes expenditure on general medical treatment ($7.9 million) and psychiatric treatment ($8.1 million).
6.3.8 Department of Labour Health expenditure by the Department of Labour is focused on reducing the overall workplace injury rate by targeting initiatives aimed at hazards in industry sectors and workplaces with the highest level of risk. The expenditure on occupational health and safety hazards during 2001/02 was $26.4 million.
32 Health Expenditure Trends in New Zealand 1990–2002
6.3.9 Te Puni Kökiri (Ministry of Mäori Development) Health-related expenditure under Vote Mäori Affairs contributes to the Government’s objective of reducing inequalities between Mäori and non-Mäori in health and disability services. Expenditure in 2001/02 for policy advice that aimed to improve Mäori health outcomes amounted to an estimated $2.8 million. The policy advice has focused on three main areas:
• making progress towards reducing inequalities in health status between Mäori and non-Mäori
• improving Mäori health outcomes by increasing Mäori participation in the purchase and provision of health services
• developing Mäori health initiatives for the wellbeing of Mäori, including developing strategies to increase Mäori access to health services and the adoption of healthy lifestyle choices.
6.3.10 Work and Income New Zealand (WINZ) As mentioned in Section 3.4, the bulk of health-related expenditure (mainly disability support services) previously administered by the Department of Social Welfare was transferred to Vote Health between 1993/94 and 1995/96.14 However, a provision remains within Vote Veterans’ Affairs from 2001/02, currently administered by WINZ, to fund assistance to war pension recipients by meeting the costs of medical treatment or equipment required as a result of a disability caused or aggravated by war service. The estimated total expenditure in 2001/02 was $10.6 million. WINZ is a service of the Ministry of Social Development.
6.3.11 Ministry of Research Science and Technology In July 1997 the public investment in health research was transferred from Vote Health to Vote Research Science and Technology. Health research is now included in the priority setting and management process applied to other public-good science and technology investments. In 2001/02 expenditure on health research was $38.4 million.
6.3.12 Ministry of Women’s Affairs Health-related expenditure under Vote Women’s Affairs involves the provision of policy advice on health structures and services aimed at improving the health of women. In particular, the advice in 2001/02 focused on:
• the national cervical screening programme and the Gisborne Cervical Screening Commission of Inquiry
• health sector restructuring
• sexual and reproductive health, particularly of young Mäori women. Total health-related expenditure by the Ministry of Women’s Affairs in 2001/02 is estimated at $251,000 (Ministry of Women’s Affairs).
14 WINZ, however, retains a significant disability funding capacity.

Health Expenditure Trends in New Zealand 1990–2002 33
6.3.13 Ministry of Youth Affairs and Ministry of Pacific Island Affairs Health-related expenditure incurred by the Ministry of Youth Affairs and the Ministry of Pacific Island Affairs is included in this report. During 2001/02 the Ministry of Youth Affairs spent $496,500 on youth suicide prevention and sexual and reproductive health issues. The Ministry of Pacific Island Affairs did not make any expenditure on health-related policy development during 2001/02 (Ministry of Pacific Island Affairs).
6.3.14 Expenditure trends Total health expenditure by all the other government agencies in 2001/02 was $302.2 million, up 7.0% from 2000/01.
6.4 Local authorities The following information on local authority health expenditure is drawn from a sample of local authorities that included the city councils and district councils listed in Appendix 10. The sample represents local authorities covering approximately 65% of the total New Zealand population. From the survey of major local authorities, it appears that health-related expenditure in this area continues to be significantly under-reported. This trend stems largely from the narrow WHO definition of public health used in this report. For example, health-related expenditure in areas such as the control of foul water drainage, sewer overflow prevention, stagnation of flood water and water purification costs is excluded from the WHO definition, even though these activities are clearly related to health protection. However, the original definition has been retained in order to maintain the consistency required for international comparisons.
6.4.1 Expenditure trends As Table 6.3 shows, total health-related expenditure by local authorities was $68.4 million in 2001/02, up by an estimated $4.2 million on the previous year. From 1998/99 to 2001/02, health-related expenditure by local authorities grew by an average of 12.2% per year (or 8.6% in real terms). Table 6.3: Health-related expenditure by local authorities ($ million), 1998/99–2001/02
1998/99 1999/2000 2000/01 2001/02
59.3 60.4 64.2 68.4
Source: Ministry of Health
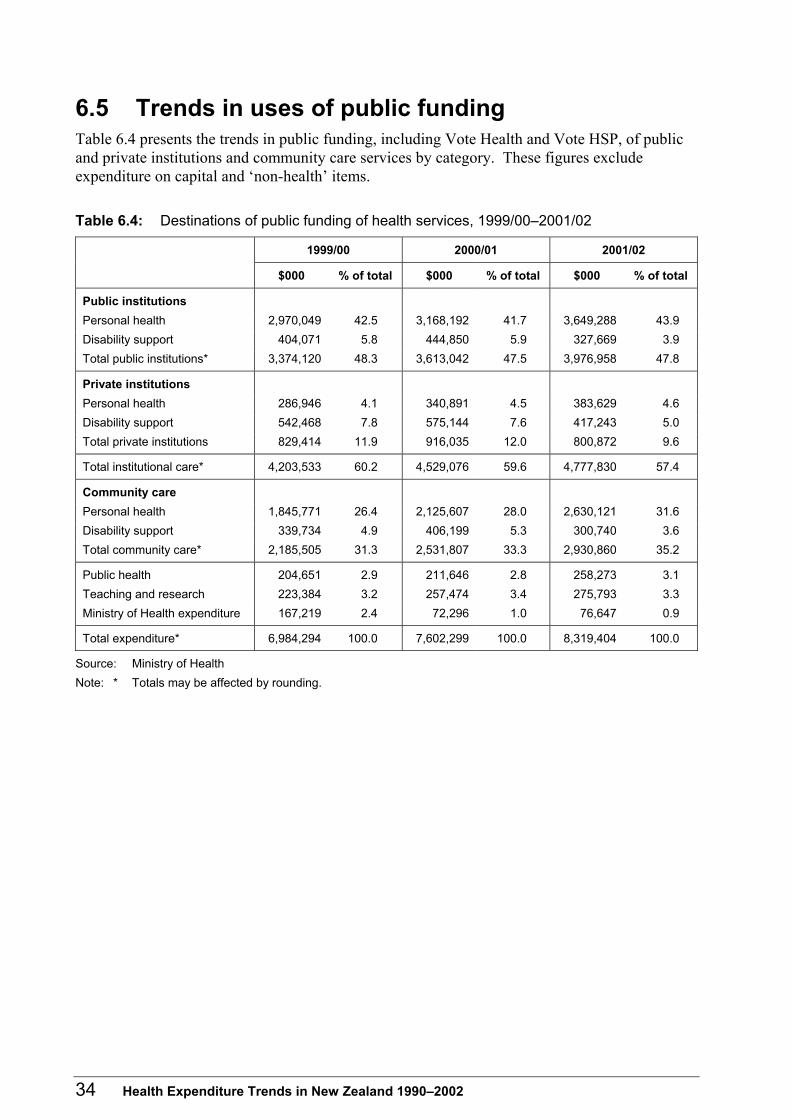
34 Health Expenditure Trends in New Zealand 1990–2002
6.5 Trends in uses of public funding Table 6.4 presents the trends in public funding, including Vote Health and Vote HSP, of public and private institutions and community care services by category. These figures exclude expenditure on capital and ‘non-health’ items. Table 6.4: Destinations of public funding of health services, 1999/00–2001/02
1999/00 2000/01 2001/02
$000 % of total $000 % of total $000 % of total
Public institutions
Personal health 2,970,049 42.5 3,168,192 41.7 3,649,288 43.9
Disability support 404,071 5.8 444,850 5.9 327,669 3.9
Total public institutions* 3,374,120 48.3 3,613,042 47.5 3,976,958 47.8
Private institutions
Personal health 286,946 4.1 340,891 4.5 383,629 4.6
Disability support 542,468 7.8 575,144 7.6 417,243 5.0
Total private institutions 829,414 11.9 916,035 12.0 800,872 9.6
Total institutional care* 4,203,533 60.2 4,529,076 59.6 4,777,830 57.4
Community care
Personal health 1,845,771 26.4 2,125,607 28.0 2,630,121 31.6
Disability support 339,734 4.9 406,199 5.3 300,740 3.6
Total community care* 2,185,505 31.3 2,531,807 33.3 2,930,860 35.2
Public health 204,651 2.9 211,646 2.8 258,273 3.1
Teaching and research 223,384 3.2 257,474 3.4 275,793 3.3
Ministry of Health expenditure 167,219 2.4 72,296 1.0 76,647 0.9
Total expenditure* 6,984,294 100.0 7,602,299 100.0 8,319,404 100.0
Source: Ministry of Health
Note: * Totals may be affected by rounding.

Health Expenditure Trends in New Zealand 1990–2002 35
Chapter 7: Private Sector Funding Sources
7.1 Introduction Private sector funding sources were the major contributors to total health funding in the early years of the New Zealand health services. However, after World War II, public sector funding has pushed the private sector contribution into second place. Private sources of funding are household out-of-pocket expenditure, health insurance and not-for-profit organisations. Together, they accounted for around 22.1% of total health expenditure in 2001/02, down from 22.4% in 1992/93, but higher than the low of 12% in 1979/80. Out-of-pocket expenditure by private households is the largest component of private sector funding, contributing around 16.1% of total health expenditure in 2001/02, while health insurance and not-for-profit organisations contributed 5.7% and 0.3% respectively. Private sector funding in 2001/02 accounted for approximately 72% of private hospital surgical and medical expenditure (and 15.6% of total medical and surgical expenditure), 49% of general practitioner payments, 33% of medicaments (largely pharmaceuticals) expenditure, 30% of referral services and 75% of expenditure on dental services.
7.2 Out-of-pocket expenditure Data relating to out-of-pocket expenditure for 2001/02 are derived from the Household Economic Survey (HES), which is produced by Statistics New Zealand every three years. Actual data was last collected in 2000/01, so the figures for 2001/02 have been estimated based on the CPI. Certain features of the HES are relevant to the analysis of the reported and estimated trends. The survey includes expenditure on some ‘non-health’ goods and services15 that are excluded from this and previous reports as they fall outside the WHO definition of health-related expenditure. By taking into account only the net cost of health insurance subscriptions (to avoid double counting), Health Expenditure Trends in New Zealand also recognises that a part of the expenditure on health insurance premiums is reimbursed to subscribers. Other expenditure excluded from the estimates in this and previous reports includes expenditure by non-private householders living in hotels, hospitals, retirement homes, boarding houses, army camps and prisons; people in judicial custody; businesses, clubs, trusts and others outside the household sector; and overseas residents visiting New Zealand. Also excluded is expenditure on household goods and services less than $200 while householders were away from home for more than four days. Consequently, out-of-pocket expenditure will be understated, but trends should not be affected significantly.
15 These include slimming preparations, soothing preparations, suntan preparations, cotton wool, dental
floss, cotton balls, insect repellents, rest home and convalescent home fees, and welfare fund contributions.

36 Health Expenditure Trends in New Zealand 1990–2002
7.2.1 Expenditure trends The trends in out-of-pocket expenditure from 1989/90 to 2001/02 are reported in detail in Appendix 4A, while the breakdown of this expenditure during 2001/02 is provided in Appendices 5A and 6A. During the review year, the major components of household out-of-pocket expenditure on health were medicaments including pharmaceuticals (23%), dental care (20%), general practitioner care (19%), and surgical and medical care (10%); most of these services were provided by the private sector. Total out-of-pocket expenditure on health increased from $733.6 million in 1989/90 to $1,715 million in 2001/02. In nominal terms the rate of this increase was approximately 8.0% per year (5.7% in real terms).
7.3 Health insurance Estimates of health insurers’ total expenditure on health care during the review year are based on data provided by the executive director of the Health Funds Association of New Zealand Inc. The estimates show that expenditure by the insurance industry on health increased by 0.3% in 2001/02, compared with 8.8% a year earlier. In 2001/02, health insurance accounted for around 5.7% of all spending on health, compared with 6.2% in 2000/01 and 2.8% in 1989/90. Table 7.1 gives details of insurance coverage by age group across the population for 2000/01 and 2001/02. Table 7.1: Proportion of the New Zealand population covered by medical insurance (by age
group), 2000/01 and 2001/02
Age group (in years; males and females combined) (%)
0–4 5–14 15–24 25–39 40–59 60 or over All ages
2000/01 18 31 32 33 49 32 35
2001/02 19 31 30 32 47 31 34
Source: Health Funds Association (2002)
7.3.1 Expenditure trends Aggregate health insurance expenditure grew from $141.7 million in 1989/90 to $612.3 million in 2001/02. The average annual growth in nominal insurance expenditure during the period was 14.2% (11.8% in real terms). A breakdown of trends in health insurance expenditure by category since 1989/90 is given in Appendices 7A and 7B.
Health Expenditure Trends in New Zealand 1990–2002 37
7.4 Voluntary and not-for-profit organisations Major not-for-profit organisations, including the Royal New Zealand Plunket Society, the New Zealand Family Planning Association, Barnardos, the New Zealand Cancer Society, Diabetes New Zealand, Presbyterian Support Services, the Arthritis Foundation and the Asthma Foundation, provide voluntary health-related services. The funding for these comes from government agencies as well as the organisations’ fund-raising efforts. Funding reported here is derived from non-government sources.16 A sample of these organisations was surveyed and the health expenditure data they provided were applied to the estimates of health expenditure for this subsector in 2000/01 to arrive at the 2001/02 expenditure estimate.17
7.4.1 Expenditure trends Expenditure by the not-for-profit sector grew from $17 million in 1989/90 to $33.4 million in 2001/02. This represents an average growth during the review period of 6.3% per year (4.2% in real terms).
16 Many of these organisations received income from the HFA or Ministry of Health in 2001/02 to provide
a variety of services. To avoid double counting, their expenditure from this source is not recorded here.
17 All organisations who provided information are listed in Appendix 10.

38 Health Expenditure Trends in New Zealand 1990–2002
7.5 Trends in uses of private source funding The trends in private source funding from 1999/00 to 2001/02, in private and public institutions and community care services by category, are presented in Table 7.2. Table 7.2: Destinations of private health funding, 1999/00–2001/02
1999/00 2000/01 2001/02
$000 % of total $000 % of total $000 % of total
Public institutions
Personal health 2,906 0.1 3,952 0.2 4,269 0.2
Disability support 0 0.0 0 0.0 0 0.0
Total public institutions* 2,906 0.1 3,952 0.2 4,269 0.2
Private institutions
Personal health 549,031 27.9 534,690 23.2 554,564 23.5
Disability support 16,064 0.8 15,815 0.7 16,011 0.7
Total private institutions* 565,095 28.7 550,505 23.9 570,575 24.2
Total institutional care* 568,000 28.9 554,457 24.1 574,844 24.4
Community care
Personal health 1,388,128 70.5 1,732,516 75.3 1,772,517 75.1
Disability support 5,903 0.3 6,555 0.3 6,605 0.3
Total community care* 1,394,030 70.8 1,739,071 75.6 1,779,122 75.4
Public health 4,946 0.3 5,134 0.2 5,198 0.2
Teaching and research 982 0.0 1,332 0.1 1,349 0.1
Ministry of Health expenditure 0 0.0 0 0.0 0 0.0
Total expenditure* 1,967,958 100.0 2,299,994 100.0 2,360,513 100.0
Source: Ministry of Health
Note: * Totals may be affected by rounding. Community care personal health expenditure in 2001/02 has increased by 2.2% from the previous year, and now comprises 75.4% of total private health funding. Most of the increase relates to out-of-pocket expenditure. Note that community care personal health expenditure includes general practitioners and pharmaceuticals.

Health Expenditure Trends in New Zealand 1990–2002 39
Chapter 8: International Comparisons
8.1 Data comparison issues Health expenditure is the result of a mix of social, political and economic factors; no single figure represents the ‘right’ amount to spend on health. Therefore, care should be exercised when comparing data on international health expenditure, as these comparisons do not indicate whether: • a country should spend more or less on health • the mix of health care services is appropriate • the production of health care services is technically efficient • quality of care, equity and access considerations are appropriate • the right quantity of health care reaches the right consumers. Technical issues mean that these data should be interpreted cautiously. The most important limitation is the lack of consistent and reliable time series information on health expenditure for some countries. Some of the factors contributing to such technical limitations are:
• no clear definition of the variables being included in categories of health expenditure, leaving open the possibility of differing interpretations between countries
• countries not having formal requirements to report health expenditure
• the difficulty in measuring and controlling for social, medical, cultural, demographic and economic differences between countries
• problems in measuring health outcomes. The following comparisons of health expenditure in OECD countries should be viewed with these limitations in mind.
8.2 Per capita health expenditure in US dollar purchasing power parities
The concept of purchasing power parities (PPPs) provides a mechanism to compare the health spending of different countries on a common basis. PPPs are the rates of currency conversion that equalise the purchasing power of different currencies. In 2001 the United States had the highest per capita health expenditure of the OECD countries; it was followed by Switzerland, then Norway. New Zealand ranked 20th, after Finland but before Portugal, as indicated in Table 8.1.18 New Zealand ranked 20th in 2000 also. New Zealand experienced an average growth rate of 6.3% per year from 1990 to 2001, above the unweighted OECD average growth rate of 5.7% per year.
18 These figures may differ slightly from other figures in this report due to the definition of ‘health
expenditure’ used by the OECD.

40 Health Expenditure Trends in New Zealand 1990–2002
Table 8.1: Per capita health expenditure (US$ PPP) for OECD countries, 1990–2001
1990 1991 1992 1993 1994 1995 1996 1997 1998 1999 2000 2001 Rank 2000
Australia 1,318 1,397 1,460 1,542 1,629 1,792 1,869 1,932 2,085 2,100 2,205 2,289 12
Austria 1,205 1,269 1,427 1,544 1,615 1,834 1,945 1,820 1,894 2,014 2,162 2,137 15
Belgium 1,247 1,368 1,519 1,605 1,643 1,906 2,002 1,972 2,050 2,181 2,269 2,306 11
Canada 1,678 1,814 1,903 1,960 2,000 2,128 2,108 2,180 2,360 2,463 2,535 2,792 5
Czech Republic 576 501 530 748 805 901 918 929 937 983 1,031 1,106 24
Denmark 1,453 1,520 1,586 1,728 1,818 1,882 2,004 2,031 2,132 2,275 2,420 2,503 9
Finland 1,292 1,412 1,386 1,332 1,295 1,421 1,486 1,495 1,510 1,547 1,664 1,841 19
France 1,520 1,647 1,767 1,819 1,854 1,991 1,994 1,977 2,043 2,125 2,349 2,561 8
Germany 1,602 1,600 1,829 1,839 1,973 2,178 2,288 2,335 2,361 2,476 2,528 2,808 4
Greece 707 776 781 902 1,055 1,139 1,184 1,181 1,198 1,274 1,399 1,511 23
Hungary – 539 601 623 686 678 663 672 717 735 841 911 26
Iceland 1,376 1,453 1,502 1,554 1,579 1,823 1,912 1,923 2,113 2,287 2,350 2,463 10
Ireland 796 897 1,061 1,103 1,225 1,319 1,332 1,473 1,534 1,562 1,953 1,935 18
Italy 1,321 1,448 1,541 1,515 1,562 1,589 1,672 1,735 1,824 1,905 2,032 2,212 14
Japan 1,082 1,164 1,274 1,364 1,462 1,632 1,703 1,808 1,795 1,977 2,018 2,096 16
Korea 371 380 454 503 548 635 723 771 740 868 892 941 25
Luxembourg 1,486 1,563 1,735 1,877 1,921 2,114 2,182 2,134 2,246 2,543 2,520 2,613 7
Mexico 260 293 367 423 475 388 381 402 419 393 411 586 29
Netherlands 1,403 1,484 1,608 1,676 1,731 1,891 1,928 2,009 2,150 2,259 2,246 2,626 6
New Zealand 937 994 1,067 1,091 1,163 1,244 1,267 1,346 1,440 1,505 1,623 1,733 20
Norway 1,363 1,513 1,680 1,724 1,746 1,864 2,042 2,149 2,452 2,612 2,796 3,012 3
Poland 258 296 331 339 349 420 469 448 524 535 565 593 28
Portugal 614 731 807 875 941 1,050 1,086 1,149 1,203 1,316 1,441 1,613 21
Slovak Republic n/a n/a n/a n/a n/a n/a n/a n/a n/a n/a 690 682 27
Spain 815 899 975 1,010 1,015 1,068 1,122 1,155 1,194 1,257 1,556 1,600 22
Sweden 1,492 1,460 1,501 1,508 1,507 1,622 1,716 1,712 1,732 1,777 1,809 2,270 13
Switzerland 1,782 1,958 2,136 2,214 2,294 2,477 2,549 2,697 2,853 2,944 3,075 3,248 2
Turkey 171 185 193 206 191 190 234 268 316 355 396 437 30
United Kingdom 968 1,016 1,169 1,191 1,247 1,301 1,410 1,407 1,510 1,569 1,763 1,992 17
United States 2,738 2,965 3,183 3,383 3,536 3,691 3,846 4,015 4,165 4,358 4,631 4,887 1
Weighted average 1,401 1,483 1,595 1,660 1,722 1,856 1,930 1,979 2,080 2,192 2,287 2,441
Source: OECD 2003

Health Expenditure Trends in New Zealand 1990–2002 41
8.3 Health expenditure as a percentage of GDP New Zealand spent 8.2% of GDP on health in 2001, just below the weighted OECD average of 8.5%. Table 8.2 shows that New Zealand’s health expenditure as a percentage of GDP was the 17th highest of the 30 OECD member countries. The United States had the highest proportion of health expenditure to GDP at 13.9%; Turkey, at 5.4%, had the lowest proportion. For New Zealand, health expenditure as a percentage of GDP has increased from 7.0% in 1990 to 8.2% in 2001. In comparison, the OECD weighted average over the same period increased from 7.6% to 8.5%. Health expenditure as a proportion of GDP is often used in international comparisons. However, as expenditure contains both price and volume components, high ratios of health expenditure to GDP could reflect a higher price rather than a higher volume of health care services, so this measure should be used with caution. Partly for this reason, there is no ‘right’ or ‘correct’ proportion of a country’s GDP that should be spent on health.

42 Health Expenditure Trends in New Zealand 1990–2002
Table 8.2: Health expenditure as a percentage of GDP, 1990–2001
1990 1991 1992 1993 1994 1995 1996 1997 1998 1999 2000 2001
Australia 7.9 8.1 8.2 8.2 8.2 8.2 8.3 8.3 8.6 8.7 8.4 8.4
Austria 7.1 7.1 7.5 7.9 7.9 8.5 8.7 7.9 8.0 8.2 8.0 7.8
Belgium 7.4 7.8 7.9 8.1 7.9 8.7 9.0 8.6 8.6 8.8 8.7 8.7
Canada 9.0 9.8 10.1 9.9 9.6 9.3 9.1 9.0 9.3 9.3 9.1 9.7
Czech Republic 5.0 5.2 5.4 7.2 7.3 7.3 7.1 7.1 7.1 7.4 7.2 7.3
Denmark 8.5 8.4 8.5 8.8 8.5 8.2 8.3 8.2 8.3 8.4 8.3 8.6
Finland 7.9 9.0 9.1 8.3 7.8 7.5 7.7 7.3 6.9 6.8 6.6 7.0
France 8.6 8.9 9.1 9.5 9.4 9.6 9.6 9.4 9.4 9.4 9.5 9.5
Germany 8.7 9.1 9.7 9.7 9.8 10.2 10.6 10.5 10.3 11.2 11.1 10.7
Greece 7.5 7.8 7.2 8.1 8.9 8.9 8.9 8.7 8.4 8.5 8.3 9.4
Hungary – 7.2 7.7 7.7 8.2 7.5 7.1 6.8 6.8 6.4 6.8 6.8
Iceland 7.9 8.1 8.1 8.3 8.0 8.2 8.2 8.0 8.4 8.7 8.7 8.8
Ireland 6.7 7.1 7.6 7.6 7.7 7.3 7.1 6.9 6.8 5.7 6.7 6.5
Italy 8.1 8.3 8.4 8.5 8.3 7.9 8.0 8.3 8.2 8.2 8.1 8.4
Japan 6.1 6.1 6.3 6.6 6.9 7.2 7.1 7.4 7.4 8.1 8.1 8.3
Korea 4.8 4.5 4.7 4.7 4.7 4.7 4.9 5.0 5.1 5.4 5.5 5.7
Luxembourg 6.1 5.9 6.1 6.3 6.0 6.3 6.4 5.9 6.0 6.1 5.9 5.8
Mexico 4.4 4.9 5.6 6.2 6.7 5.6 5.3 5.3 5.3 5.0 4.9 6.6
Netherlands 8.5 8.7 8.9 9.0 8.8 8.9 8.8 8.7 8.7 8.7 8.1 8.9
New Zealand 7.0 7.5 7.6 7.2 7.3 7.3 7.3 7.6 8.1 8.1 8.0 8.2
Norway 7.8 8.1 8.2 8.1 8.0 8.0 8.0 8.0 9.4 9.3 9.7 8.3
Poland 5.3 6.6 6.6 6.4 6.0 6.0 6.4 6.1 6.4 6.2 6.3 6.4
Portugal 6.2 6.8 7.0 7.3 7.3 7.6 7.6 7.5 7.7 7.7 8.2 9.2
Slovak Republic n/a n/a n/a n/a n/a n/a n/a n/a n/a n/a 5.9 3.9
Spain 6.6 6.7 7.1 7.3 7.1 7.0 7.1 7.0 7.0 6.9 6.9 7.5
Sweden 8.5 8.4 8.5 8.6 8.2 8.1 8.4 8.1 7.9 7.8 7.7 8.7
Switzerland 8.3 8.9 9.3 9.4 9.5 9.6 10.1 10.2 10.4 10.6 10.9 10.9
Turkey 3.6 3.8 3.8 3.7 3.6 3.4 3.9 4.2 4.8 4.5 5.1 5.4
United Kingdom 6.0 6.4 6.9 6.9 7.0 6.9 7.0 6.7 6.8 6.9 7.3 7.6
United States 11.9 12.6 13.0 13.2 13.2 13.2 13.2 13.0 12.9 12.9 13.0 13.9
Weighted average 7.6 7.9 8.1 8.3 8.2 8.2 8.3 8.2 8.3 8.3 8.3 8.5
Source: OECD 2003
8.4 Publicly funded health expenditure as a proportion of total health expenditure
Table 8.3 shows the trends in publicly funded health expenditure as a proportion of total health expenditure. Overall, in the OECD, public health expenditure accounts for about three-quarters of total health expenditure. In 2001 Luxembourg had the highest public expenditure as a proportion of total health expenditure (93.3%), and the United States had the lowest (44.7%). New Zealand ranked ninth, with public funding for 77.7% of total health spending.

Health Expenditure Trends in New Zealand 1990–2002 43
During the 1960s there was a shift among OECD countries towards more public funding of health care. This pattern stabilised during the late 1970s and early 1980s, then reversed slightly in more recent years. New Zealand has followed this trend. Table 8.3: Publicly funded health expenditure as a proportion of total health expenditure,
1990–2001
1990 1991 1992 1993 1994 1995 1996 1997 1998 1999 2000 2001
Australia 67.4 67.2 66.9 66.5 66.5 66.5 67.4 68.3 70.0 70.5 71.7 72.8 Austria 73.5 73.4 73.5 74.2 74.4 74.4 72.3 71.4 71.8 72.1 69.7 69.6 Belgium 0.0 0.0 0.0 0.0 0.0 0.0 69.9 71.0 71.2 71.3 71.2 71.8 Canada 74.6 74.6 74.2 72.8 72.1 72.1 71.2 69.9 70.1 70.6 72.0 70.0 Czech Republic 96.2 96.7 95.4 94.8 93.9 93.9 92.7 91.7 91.9 91.5 91.4 91.0 Denmark 82.7 83.5 83.2 82.7 82.2 82.2 82.5 82.3 81.9 82.2 82.1 81.9 Finland 80.9 81.1 79.6 76.1 75.5 75.5 75.5 76.1 76.3 75.7 75.1 74.7 France 78.2 77.5 78.0 78.0 77.4 77.4 77.7 77.7 77.7 78.1 76.0 75.5 Germany 76.2 78.1 78.4 77.5 77.5 77.5 78.1 76.6 75.8 75.1 74.4 74.3 Greece 62.7 61.1 58.1 57.9 52.8 52.8 54.5 55.2 56.3 56.7 55.5 57.3 Hungary 0.0 80.8 79.1 79.4 80.0 80.0 76.2 75.3 76.5 76.1 75.7 74.4 Iceland 86.6 86.9 85.1 83.8 84.0 84.0 84.5 83.7 83.9 84.8 84.5 0.0 Ireland 71.7 73.1 71.7 72.8 71.7 71.7 72.5 75.6 76.8 78.4 75.8 77.5 Italy 78.1 78.4 76.3 73.1 70.6 70.6 67.4 67.5 67.3 67.4 73.7 77.5 Japan 77.6 78.3 78.1 79.2 78.6 78.6 78.2 79.5 78.5 79.2 79.3 79.4 Korea 36.6 33.3 33.6 33.4 33.5 33.5 36.5 41.0 46.2 43.9 49.4 52.4 Luxembourg 93.1 93.0 92.8 92.9 91.7 91.7 92.4 92.5 92.4 92.9 93.1 93.3 Mexico 40.8 45.3 46.3 41.0 38.9 38.9 41.5 43.3 48.0 48.9 52.1 45.5 Netherlands 67.7 69.9 73.3 74.2 73.5 73.5 72.0 68.9 68.6 68.5 67.5 66.5
New Zealand 82.4 82.2 79.0 76.6 77.5 77.5 77.2 77.3 77.0 77.5 78.0 77.7
Norway 82.8 83.1 83.2 83.3 83.2 83.2 83.2 83.0 75.8 75.8 73.5 84.9 Poland 91.7 75.6 76.4 73.8 72.8 72.8 72.9 72.0 65.4 75.1 70.8 70.5 Portugal 65.5 62.8 59.6 63.0 63.4 63.4 65.3 67.1 66.9 67.8 71.2 68.0 Slovak Republic 89.6 89.1 Spain 78.7 78.6 78.6 75.8 78.5 78.5 78.0 77.2 76.4 76.0 69.9 70.9 Sweden 89.9 88.2 87.2 85.7 85.2 85.2 85.2 84.3 83.8 83.4 82.8 85.9 Switzerland 68.4 68.6 70.1 71.8 72.1 72.1 72.3 74.1 73.2 74.1 74.6 75.1 Turkey 61.0 62.9 67.0 66.4 68.9 68.9 70.3 71.6 71.9 72.6 73.7 74.6 United Kingdom 84.3 84.1 85.3 85.9 84.9 84.9 84.9 83.7 83.3 83.3 81.0 83.3 United States 39.6 41.2 42.4 43.1 44.8 44.8 45.6 45.5 44.8 44.5 44.3 44.7
Weighted average 76.8 76.4 76.0 75.4 75.1 75.1 74.8 74.7 74.2 74.7 75.0 75.3
Source: OECD 2003

44 Health Expenditure Trends in New Zealand 1990–2002
8.5 Health expenditure and GDP per capita Figure 8.1 and Table 8.4 show the positive relationship between health expenditure and GDP for 30 OECD countries. As Figure 8.1 shows, New Zealand expenditure on health care is similar to that which could be expected for another OECD country with a similar level of GDP. Again, it is emphasised that there is no optimal level of health care spending relative to GDP. Figure 8.1 Relationship between health expenditure and GDP in OECD countries, 2001
0
500
1,000
1,500
2,000
2,500
3,000
3,500
4,000
4,500
5,000
0 5,000 10,000 15,000 20,000 25,000 30,000 35,000 40,000 45,000 50,000
GDP (US$ PPP per capita)
Health expenditure(US$ PPP per capita)
TurkeyMexico
PolandSlovak Republic
HungaryKorea
Czech Republic
GreecePortugal
New Zealand
Spain
United States
Luxembourg
Switzerland
Norway
Iceland
Ireland
Finland
SwedenUnited Kingdom
Denmark
CanadaGermany
France
Australia
AustriaJapan
ItalyBelgium Netherlands
Source: Ministry of Health There is a well-established relationship between GDP per capita and health expenditure per capita. Figure 8.1 indicates that the higher a country’s GDP per capita, the greater its health expenditure per capita is likely to be, compared with other countries. As New Zealand’s economy continues to grow, it is expected that health expenditure per capita will increase proportionately. Reasons for differences in international health spending and performance are outlined below.
• Some differences result from health service cost (and price) variations. Richer countries pay a higher price per unit of medical care consumed, given higher labour costs and higher prices for services.
• The intensity of treatment differs among countries.
• The rates at which various invasive procedures are performed differ widely among countries.
• The rapid and extensive introduction of new medical technologies in the United States, in particular, explains a significant part of the difference in growth of expenditure outlays between the United States and elsewhere.

Health Expenditure Trends in New Zealand 1990–2002 45
• As major determinants of health expenditure, demographic characteristics also vary significantly among countries. Some countries have high life expectancies and relatively old populations, so need to spend more on older people, whose health care costs are the highest per capita. (The converse is true of countries with younger populations.)
• Cultural and religious factors cause differences not only in the perception of morbidity, but in the choice of therapeutic response.
• Variations in welfare philosophies and private insurance coverage affect public provision and the level of health care assistance provided in different countries.
• Differences among countries in the origin of funding can also significantly affect the demand for health care and expenditure.
• Incidence of litigation against health providers varies among countries. In countries with a higher incidence (as in the United States, in particular) providers of health care are more likely to take out expensive insurance cover.

46 Health Expenditure Trends in New Zealand 1990–2002
Table 8.4: Per capita GDP and per capita health expenditure (US$ PPP) for OECD countries, 2001
GDP per capita Health expenditure per capita
Australia 27,408 2,289
Austria 28,324 2,137
Belgium 27,775 2,306
Canada 28,811 2,792
Czech Republic 15,143 1,106
Denmark 29,216 2,503
Finland 26,438 1,841
France 26,879 2,561
Germany 26,199 2,808
Greece 16,137 1,511
Hungary 13,431 911
Iceland 28,879 2,463
Ireland 30,002 1,935
Italy 26,345 2,212
Japan 26,652 2,096
Korea 15,905 941
Luxembourg 48,687 2,613
Mexico 8,903 586
Netherlands 29,391 2,626
New Zealand 21,077 1,733
Norway 36,462 3,012
Poland 9,934 593
Portugal 17,560 1,613
Slovak Republic 12,010 682
Spain 21,294 1,600
Sweden 26,052 2,270
Switzerland 29,876 3,248
Turkey 5,734 437
United Kingdom 26,315 1,992
United States 35,182 4,887
Source: OECD 2003

Health Expenditure Trends in New Zealand 1990–2002 47
Appendix 1: Categories of health expenditure – definitions
1 Institutional care Institutional care includes both privately and publicly owned institutions.
Public institutions This category corresponds to publicly owned hospitals, such as those managed by Health Service Providers (HSPs) in New Zealand, which are defined as ‘establishments which offer accommodation and provide medical and nursing care to persons who are sick or injured or are suspected of being sick or injured, or to women during childbirth’. The term also includes appropriate parts of hospices or inpatient community treatment centres, but not rest homes. In New Zealand, public institutions are managed by HSPs or operate as community trusts. Once the institution has been defined, all its operational costs – for example, for laboratories, medicines, home nursing, ambulance services and administration – are included in the category.
Private institutions This category includes all private hospitals, rest homes and community homes providing disability services.
2 Community care Personal health care services provided under the category of community care correspond to ambulatory and domiciliary services provided other than through public and private institutions. They include the services of general practitioners, medical specialists, nurses, midwives, dentists and various other health care practitioners. Note that some services provided by public hospital and health services are given in people’s homes but are included under institutional services (eg, community nursing services, occupational therapy and domiciliary physiotherapy). Transport and administration costs associated with the provision of these services are also included. Disability support services include needs assessment and service co-ordination, personal care services, home support, environment support and household management services.
General practice This category includes all personal health services provided in general primary care settings, whether by doctors or nurses. Among such settings are solo and group practices, health centres (eg, union health centres and marae-based centres), accident and medical centres, student health centres, family planning centres and health services provided in prisons, barracks and factories.

48 Health Expenditure Trends in New Zealand 1990–2002
Specialist medical services This category covers services provided by private medical and allied health care specialists outside the hospital setting. It includes services provided by medical and surgical specialists, psychologists, chiropractors, osteopaths, optometrists, podiatrists and dietitians. Note that it does not include services provided by DHBs.
Referred services This category covers the range of diagnostic and treatment services outside the hospital setting that can be obtained only following referral by a relevant health care practitioner. It includes laboratory services, other diagnostic services (eg, x-ray and other imaging and electrocardiograms), physiotherapy and other referred services (eg, occupational therapy and speech therapy).
Medicaments This category includes medicines, dressings, syringes and other therapeutic devices, along with associated dispensing costs. It covers prescription medicaments as well as those available over the counter from doctors, pharmacists or other outlets. Items such as sanitary towels, sunglasses and cotton wool for ordinary purposes of daily living are excluded.
Dental services This category covers all dental care services provided outside the hospital setting. It includes the school dental care scheme.
3 Public health The term ‘public health’ refers to the specific measures taken to improve the health of the community. It involves protecting people against ill health and promoting good health. Public health programmes aim to improve people’s health and minimise the risk of disease. They are targeted at whole populations or groups, such as children, rather than at individuals, although all individuals can benefit. Although some benefits are immediate, many public health programmes have a longer-term focus so do not produce instant results. Some examples of everyday public health services are: • checking the drinking water supply for giardia • improving dental health • issuing hygiene certificates to restaurants • immunising children • planting trees for shade at beaches and parks • testing shellfish for toxins caused by algal blooms • promoting healthy lifestyles, such as smokefree living, a healthy, low-fat diet and regular
physical activity • reducing road injuries and deaths • monitoring the use of pesticides and insecticides

Health Expenditure Trends in New Zealand 1990–2002 49
• reducing food poisoning • reducing injuries at work and in the home • reducing the consumption of alcohol • promoting screening for cervical cancer • promoting the checking of children for glue ear • running needle swap programmes to prevent the spread of HIV/AIDS.
4 Teaching and research Teaching costs relate to the expenditure on formal education as part of professional courses (not as general education), including the training of nurses, doctors, ambulance drivers and dental nurses and postgraduate medical training. The research component of this category covers the costs of biomedical and health services research, including research on social aspects of medicine.
5 Total health care expenditure Total health expenditure is the sum of all expenditures under the categories described in sections 1 to 4 above.
Note: Overhead expenses
The overhead expenses of each organisation surveyed (depreciation and interest on loans) should be allocated to each category (apportioned according to a reasonable ratio of expenditure between categories, if no other more appropriate method is possible).
Abel-Smith’s (1963) definition of health expenditure excludes capital expenditure because it does not make a clear-cut distinction between outlays whose benefits are immediately obtained and those whose benefits continue to accrue after the end of the accounting period.

50 Health Expenditure Trends in New Zealand 1990–2002
Appendix 2: Definition of disability and examples of disability support services The following definition has been adopted to identify those individuals who are eligible for disability support services funded by Vote Health.
‘A person with a disability is a person who has been identified as having a physical, a psychiatric, an intellectual, a sensory or an age-related disability (or a combination of these) that is likely to continue for a minimum of six months and result in a reduction of independent functioning to the extent that ongoing support is required.
‘When a person has a disability that is the result of an accident that took place on or after 1 April 1974, their eligibility for entitlements from the Accident Compensation Corporation should be determined.
‘When a person has both a disability and a personal health need, the services provided to address those needs are disability support services and personal health services respectively.’
Disability support services include:
• services that provide in a suitable form information on disability support services to people with disabilities and their caregivers
• needs assessment services and service co-ordination services
• personal care services, including assistance with daily activities such as dressing, personal hygiene, eating, taking medication, seating, positioning and toileting
• household management services for people with disabilities, including assistance with domestic functions such as meal preparation, cooking, cleaning, laundering and shopping
• caregiver support services that provide relief to primary informal caregivers
• rehabilitation and habilitation services including (age-related) multidisciplinary assessment treatment and rehabilitation services
• residential care services that provide short- and long-term care
• environmental support services that supply people with disabilities with: – equipment and aids to meet a range of needs, including mobility, incontinence, household
management, communication and personal care needs – housing modifications – vehicles and vehicle modifications.

Health Expenditure Trends in New Zealand 1990–2002 51
Appendix 3: Health expenditure nominal and real (‘non-health’ related items excluded), 1989/90–2001/02 1989/90 1990/91 1991/92 1992/93 1993/94 1994/95 1995/96 1996/97 1997/98 1998/99 1999/00 2000/01 2001/02
Nominal expenditure ($ million)
Public 4,183 4,436 4,475 4,488 4,870 5,160 5,342 5,750 6,178 6,601 6,984 7,602 8,319
Private 892 958 1,187 1,368 1,412 1,527 1,625 1,689 1,843 1,873 1,968 2,300 2,361
Total 5,076 5,394 5,662 5,857 6,282 6,687 6,966 7,440 8,022 8,474 8,952 9,902 10,680
Percentage change 9.0% 6.3% 5.0% 3.4% 7.3% 6.5% 4.2% 6.8% 7.8% 5.6% 5.6% 10.6% 7.9%
Real expenditure (2001/02 $ million)
Public 5,309 5,470 5,457 5,401 5,797 5,864 5,949 6,326 6,687 7,167 7,430 7,829 8,319
Private 1,132 1,181 1,448 1,647 1,681 1,735 1,809 1,859 1,995 2,034 2,094 2,369 2,361
Total 6,441 6,651 6,905 7,048 7,478 7,599 7,758 8,185 8,682 9,201 9,524 10,198 10,680
Percentage change 5.1% 3.3% 3.8% 2.1% 6.1% 1.6% 2.1% 5.5% 6.1% 6.0% 3.5% 7.1% 4.7%
Real per capita expenditure (2001/02 $ million) – usually resident population
Public 1,584 1,621 1,603 1,567 1,660 1,654 1,652 1,732 – – – – –
Percentage change 0.3% 2.4% -1.1% -2.2% 5.9% -0.4% -0.1% 4.9% – – – – –
Private 338 350 425 478 481 489 502 509 – – – – –
Percentage change 29.6% 3.6% 21.5% 12.3% 0.7% 1.7% 2.7% 1.3% – – – – –
Total 1,922 1,972 2,029 2,045 2,142 2,144 2,154 2,241 – – – – –
Percentage change 4.4% 2.6% 2.9% 0.8% 4.7% 0.1% 0.5% 4.0% – – – – –
Real per capita expenditure (2001/02 $ million) – resident population
Public 1,553 1,521 1,612 1,608 1,605 1,682 1,759 1,872 1,930 2,022 2,127
Percentage change 6.0% -0.3% -0.1% 4.8% 4.6% 6.4% 3.1% 4.8% 5.2%
Private 412 464 467 476 488 494 525 531 544 612 604
Percentage change 0.8% 1.8% 2.6% 1.2% 6.2% 1.2% 2.4% 12.5% -1.3%
Total 1,964 1,984 2,079 2,083 2,094 2,176 2,284 2,404 2,474 2,634 2,731
Percentage change 4.8% 0.2% 0.5% 4.0% 4.9% 5.3% 2.9% 6.5% 3.7%
Notes: 1 Totals may be affected by rounding. 2 GST inclusive. 3 CPI for June quarter.

52
H
ealth
Exp
endi
ture
Tre
nds
in N
ew Z
eala
nd 1
990–
2002
App
endi
x 4A
: Hea
lth e
xpen
ditu
re tr
ends
in N
ew Z
eala
nd (‘
non-
heal
th’ i
tem
s ex
clud
ed),
1989
/90–
2001
/02
1989
/90
1990
/91
1991
/92
1992
/93
1993
/94
1994
/95
1995
/96
1996
/97
1997
/98
1998
/99
1999
/00
2000
/01
2001
/02
Sourc
es
of
funds
($00
0)
% o
f to
tal
($00
0)
% o
f to
tal
($00
0)
% o
f to
tal
($00
0)
% o
f to
tal
($00
0)
% o
f to
tal
($00
0)
% o
f to
tal
($00
0)
% o
f to
tal
($00
0)
% o
f to
tal
($00
0)
% o
f to
tal
($00
0)
% o
f to
tal
($00
0)
% o
f to
tal
($00
0)
% o
f to
tal
($00
0)
% o
f to
tal
Vote
Health
3,6
90,4
67
72.7
%
3,9
88,5
56
73.9
%
3,8
45,5
13
67.9
%
3,8
82,4
70
66.3
%
4,0
75,3
00
64.9
%
4,3
45,4
59
65.0
%
4,5
43,5
46
65.2
%
4,9
15,9
61
66.1
%
5,2
76,2
77
65.8
%
5,7
68,8
05
68.1
%
6,0
86,1
99
68.0
%
6,4
69,4
31
65.3
%
6,9
03,5
58
64.6
%
CH
E/H
SP
defic
it fin
anci
ng
195,5
99
3.1
%
216,6
95
3.2
%
178,8
82
2.6
%
226,3
50
3.0
%
193,5
00
2.4
%
39,6
00
0.5
%
6,4
13
0.1
%
76,8
37
0.8
%
244,1
25
2.3
%
AC
C
222,5
72
4.4
%
190,5
99
3.5
%
374,5
25
6.6
%
349,4
66
6.0
%
376,4
06
6.0
%
362,8
41
5.4
%
373,3
74
5.4
%
364,2
06
4.9
%
419,7
41
5.2
%
487,0
44
5.7
%
581,0
78
6.5
%
709,5
61
7.2
%
801,3
30
7.5
%
Oth
er
gove
rnm
ent
ag
enci
es
243,6
92
4.8
%
229,3
30
4.3
%
226,3
51
4.0
%
226,2
74
3.9
%
188,4
91
3.0
%
194,5
74
2.9
%
200,1
11
2.9
%
197,7
12
2.7
%
242,0
50
3.0
%
245,9
48
2.9
%
250,2
30
2.8
%
282,2
26
2.9
%
302,0
11
2.8
%
Loca
l auth
ori
ties
26,4
26
0.5
%
27,7
51
0.5
%
28,5
21
0.5
%
30,2
61
0.5
%
33,8
91
0.5
%
40,6
69
0.6
%
45,9
56
0.7
%
46,1
86
0.6
%
46,9
00
0.6
%
59,2
92
0.7
%
60,3
74
0.7
%
64,2
43
0.6
%
68,3
81
0.6
%
Publ
ic to
tal
4,18
3,15
782
.4%
4,43
6,23
6 82
.2%
4,
474,
910
79.0
%4,
488,
471
76.6
%4,
869,
687
77.5
%5,
160,
238
77.2
%5,
341,
869
76.7
% 5
,750
,415
77.3
%6,
178,
468
77.0
%6,
600,
689
77.9
%6,
984,
294
78.0
%7,
602,
299
76.8
%8,
319,
404
77.9
%
Out-
of-
pock
et
733,5
75
14.5
%
750,4
53
13.9
%
901,2
41
15.9
%
1,0
47,8
98
17.9
%
1,0
10,5
31
16.1
%
1,0
79,9
82
16.2
%
1,1
35,0
99
16.3
%
1,1
62,8
07
15.6
%
1,3
05,4
04
16.3
%
1,3
16,0
21
15.5
%
1,3
75,1
65
15.4
%
1,6
56,8
53
16.7
%
1,7
14,8
43
16.1
%
Hea
lth
insu
rance
141,7
38
2.8
%
190,4
94
3.5
%
269,1
68
4.8
%
301,8
08
5.2
%
382,1
79
6.1
%
426,0
27
6.4
%
467,7
00
6.7
%
503,4
96
6.8
%
510,8
71
6.4
%
527,1
14
6.2
%
560,8
57
6.3
%
610,1
98
6.2
%
612,3
15
5.7
%
Not-
for-
pro
fit
org
anis
atio
ns
17,0
46
0.3
%
17,0
46
0.3
%
17,0
46
0.3
%
18,5
68
0.3
%
19,3
10
0.3
%
20,6
97
0.3
%
21,7
21
0.3
%
23,1
20
0.3
%
27,0
55
0.3
%
29,9
54
0.4
%
31,9
36
0.4
%
32,9
43
0.3
%
33,3
55
0.3
%
Priv
ate
tota
l 89
2,35
917
.6%
957,
993
17.8
%
1,18
7,45
5 21
.0%
1,36
8,27
423
.4%
1,41
2,01
922
.5%
1,52
6,70
622
.8%
1,62
4,52
023
.3%
1,6
89,4
2322
.7%
1,84
3,33
023
.0%
1,87
3,09
022
.1%
1,96
7,95
822
.0%
2,29
9,99
423
.2%
2,36
0,51
3 22
.1%
Tota
l fro
m a
ll so
urce
s 5,
075,
516
100%
5,39
4,22
9 10
0%
5,66
2,36
5 10
0%5,
856,
745
100%
6,28
1,70
710
0%6,
686,
944
100%
6,96
6,38
910
0% 7
,439
,838
100%
8,02
1,79
910
0%8,
473,
778
100%
8,95
2,25
210
0%9,
902,
293
100%
10,6
79,9
17
100%
% o
f G
DP
7.1
7.4
7.8
7.8
7.7
7.7
7.5
7.7
8.0
8.4
8.5
8.7
8.7

H
ealth
Exp
endi
ture
Tre
nds
in N
ew Z
eala
nd 1
990–
2002
5
3
App
endi
x 4B
: Hea
lth e
xpen
ditu
re tr
ends
in N
ew Z
eala
nd (‘
non-
heal
th’ i
tem
s ex
clud
ed),
1989
/90–
2001
/02
(rea
l 200
1/02
) 19
89/9
0 19
90/9
1 19
91/9
2 19
92/9
3 19
93/9
4 19
94/9
5 19
95/9
6 19
96/9
7 19
97/9
8 19
98/9
9 19
99/0
0 20
00/0
1 20
01/0
2 S
ourc
es
of
funds
($00
0)
% o
f to
tal
($00
0)
% o
f to
tal
($00
0)
% o
f to
tal
($00
0)
% o
f to
tal
($00
0)
% o
f to
tal
($00
0)
% o
f to
tal
($00
0)
% o
f to
tal
($00
0)
% o
f to
tal
($00
0)
% o
f to
tal
($00
0)
% o
f to
tal
($00
0)
% o
f to
tal
($00
0)
% o
f to
tal
($00
0)
% o
f to
tal
Vote
Health
4,6
83,3
34
72.7
%
4,9
18,0
72
73.9
%
4,7
41,6
93
67.9
%
4,7
87,2
63
66.3
%
5,0
25,0
31
64.9
%
4,9
38,0
22
65.1
%
5,0
59,6
28
65.3
%
5,4
08,0
98
66.1
%
5,7
10,2
56
65.8
%
6,2
63,6
32
68.1
%
6,4
74,6
80
68.0
%
6,6
62,6
48
65.3
%
6,9
03,5
58
64.6
%
CH
E/H
SP
defic
it fin
anci
ng
232,8
56
3.0
%
238,3
89
3.1
%
192,9
68
2.5
%
241,3
11
3.0
%
203,0
43
2.3
%
41,6
84
0.5
%
6,8
22
0.1
%
79,1
32
0.8
%
244,1
25
2.3
%
AC
C
282,4
52
4.4
%
235,0
17
3.5
%
461,8
06
6.6
%
430,9
08
6.0
%
464,1
26
6.0
%
412,3
19
5.4
%
415,7
84
5.4
%
400,6
67
4.9
%
454,2
65
5.2
%
528,8
21
5.7
%
618,1
68
6.5
%
730,7
53
7.2
%
801,3
30
7.5
%
Oth
er
gove
rnm
ent
ag
enci
es
309,2
54
4.8
%
282,7
74
4.3
%
279,1
01
4.0
%
279,0
06
3.9
%
232,4
18
3.0
%
221,1
07
2.9
%
222,8
41
2.9
%
217,5
05
2.7
%
261,9
59
3.0
%
267,0
44
2.9
%
266,2
03
2.8
%
290,6
55
2.9
%
302,0
11
2.8
%
Loca
l auth
ori
ties
33,5
36
0.5
%
34,2
18
0.5
%
35,1
68
0.5
%
37,3
13
0.5
%
41,7
89
0.5
%
46,2
15
0.6
%
51,1
76
0.7
%
50,8
10
0.6
%
50,7
58
0.6
%
64,3
78
0.7
%
64,2
27
0.7
%
66,1
62
0.6
%
68,3
81
0.6
%
Publ
ic to
tal
5,30
8,57
582
.4%
5,47
0,08
1 82
.2%
5,
517,
768
79.0
%5,
534,
490
76.6
%5,
996,
220
77.5
%5,
856,
051
77.1
%5,
942,
397
76.7
% 6
,318
,391
77.3
%6,
680,
281
77.0
%7,
165,
559
77.9
%7,
430,
100
78.0
%7,
829,
350
76.8
%8,
319,
404
77.9
%
Out-
of-
pock
et
930,9
33
14.5
%
925,3
43
13.9
%
1,1
11,2
71
15.9
%
1,2
92,1
06
17.9
%
1,2
46,0
31
16.1
%
1,2
27,2
52
16.2
%
1,2
64,0
30
16.3
%
1,2
79,2
16
15.6
%
1,4
12,7
75
16.3
%
1,4
28,9
04
15.5
%
1,4
62,9
41
15.4
%
1,7
06,3
37
16.7
%
1,7
14,8
43
16.1
%
Hea
lth
insu
rance
179,8
71
2.8
%
234,8
88
3.5
%
331,8
96
4.8
%
372,1
43
5.2
%
471,2
44
6.1
%
484,1
22
6.4
%
520,8
24
6.7
%
553,9
01
6.8
%
552,8
91
6.4
%
572,3
28
6.2
%
596,6
57
6.3
%
628,4
22
6.2
%
612,3
15
5.7
%
Not-
for-
pro
fit
org
anis
atio
ns
21,6
32
0.3
%
21,0
18
0.3
%
21,0
18
0.3
%
22,8
95
0.3
%
23,8
10
0.3
%
23,5
19
0.3
%
24,1
88
0.3
%
25,4
35
0.3
%
29,2
81
0.3
%
32,5
24
0.4
%
33,9
74
0.4
%
33,9
27
0.3
%
33,3
55
0.3
%
Priv
ate
tota
l 1,
132,
435
17.6
%1,
181,
249
17.8
%
1,46
4,18
6 21
.0%
1,68
7,14
423
.4%
1,74
1,08
422
.5%
1,73
4,89
322
.9%
1,80
9,04
223
.3%
1,8
58,5
5122
.7%
1,99
4,94
623
.0%
2,03
3,75
622
.1%
2,09
3,57
322
.0%
2,36
8,68
623
.2%
2,36
0,51
3 22
.1%
Tota
l fro
m a
ll so
urce
s 6,
441,
010
100%
6,65
1,33
0 10
0%
6,98
1,95
4 10
0%7,
221,
634
100%
7,73
7,30
410
0%7,
590,
944
100%
7,75
1,43
910
0% 8
,176
,942
100%
8,67
5,22
810
0%9,
199,
315
100%
9,52
3,67
210
0%10
,198
,036
100%
10,6
79,9
17
100%
% o
f G
DP
7.1
7.4
7.9
8.0
8.0
7.6
7.5
7.6
8.0
8.3
8.4
8.7
8.7
No
tes
1
To
tals
ma
y b
e a
ffe
cte
d b
y ro
un
din
g.
2
GS
T in
clu
sive
. 3
C
PI
for
Jun
e q
ua
rte
r.

54
H
ealth
Exp
endi
ture
Tre
nds
in N
ew Z
eala
nd 1
990–
2002
App
endi
x 5A
: Hea
lth e
xpen
ditu
re b
y fu
ndin
g so
urce
and
exp
endi
ture
ca
tego
ry, 2
001/
02 (‘
non-
heal
th’ i
tem
s in
clud
ed, $
000)
Ex
pend
iture
cat
egor
y Vo
te H
ealth
C
HE/
HSP
de
ficit
finan
cing
ACC
O
ther
go
vern
men
t ag
enci
es
Loca
l au
thor
ities
To
tal p
ublic
fu
ndin
g O
ut-o
f-po
cket
H
ealth
in
sura
nce
Not
-for-
prof
it or
gani
satio
ns
Tota
l priv
ate
fund
ing
Tota
l fun
ding
al
l sou
rces
Inst
itutio
nal c
are
– pu
blic
inst
itutio
ns
Pers
onal
hea
lth
Su
rgic
al a
nd
me
dic
al
2,2
33
,02
1
24
4,1
25
2
73
,80
8
58
1
2
,75
1,5
35
3
,72
2
–
13
3
3,8
54
2
,75
5,3
89
Menta
l health
342,8
07
–
–
342,8
07
–
–
–
–
342,8
07
Denta
l 81,0
20
–
–
81,0
20
–
–
–
–
81,0
20
Mate
rnity
310,5
85
–
–
310,5
85
–
–
–
–
310,5
85
Oth
er
163,3
41
–
–
163,3
41
–
415
–
415
163,7
56
Subt
otal
– p
ublic
inst
itutio
ns p
erso
nal h
ealth
3
,13
0,7
74
2
44
,12
5
27
3,8
08
5
81
–
3
,64
9,2
88
3
,72
2
41
5
13
3
4,2
69
3
,65
3,5
58
Dis
abilit
y su
ppor
t
Ag
e-r
ela
ted
dis
ab
ility
2
15
,81
6
17,3
88
–
233,2
04
–
–
–
–
233,2
04
Psy
chia
tric
dis
ab
ility
6
29
–
–
6
29
–
–
–
–
6
29
Inte
llect
ua
l dis
ab
ility
4
4,2
96
–
–
44,2
96
–
–
–
–
44,2
96
Ph
ysic
al/s
en
sory
dis
ab
ility
3
6,4
59
13,0
81
–
49,5
40
–
–
–
–
49,5
40
Subt
otal
– p
ublic
inst
itutio
ns d
isab
ility
sup
port
297,2
00
–
30,4
69
–
–
327,6
69
–
–
–
–
327,6
69
Subt
otal
– p
ublic
inst
itutio
ns
3,4
27
,97
5
24
4,1
25
3
04
,27
7
58
1
–
3,9
76
,95
8
3,7
22
4
15
1
33
4
,26
9
3,9
81
,22
7
Inst
itutio
nal c
are
– pr
ivat
e in
stitu
tions
Pers
onal
hea
lth
Su
rgic
al a
nd
me
dic
al
13
0,4
90
77
,75
9
3,1
82
21
1,4
31
1
66
,98
7
376,3
84
710
544,0
81
755,5
12
Me
nta
l he
alth
3
1,0
08
–
–
3
1,0
08
–
6
4
–
64
3
1,0
72
De
nta
l 5
,98
2
2
,50
0
–
8
,48
2
–
8,9
09
–
8
,90
9
17
,39
1
Mate
rnity
11,8
50
–
–
11,8
50
–
–
–
–
11,8
50
Oth
er
120,8
58
–
–
120,8
58
–
195
1,3
14
1,5
09
122,3
68
Subt
otal
– p
rivat
e in
stitu
tion
pers
onal
hea
lth
30
0,1
88
–
8
0,2
59
3
,18
2
–
38
3,6
29
166,9
87
385,5
52
2,0
25
554,5
64
938,1
93
Dis
abilit
y su
ppor
t
Ag
e-r
ela
ted
dis
ab
ility
5
10
,97
4
–
–
510,9
74
–
–
15,8
59
15,8
59
526,8
33
Psy
chia
tric
dis
ab
ility
2
,96
9
–
538
3,5
07
–
–
–
–
3,5
07
Inte
llect
ua
l dis
ab
ility
3
0,2
26
–
–
30,2
26
–
–
5
5
30,2
31
Ph
ysic
al/s
en
sory
dis
ab
ility
5
4,5
27
12
,12
3
1,7
46
68,3
96
–
–
147
147
68,5
44
Subt
otal
– p
rivat
e in
stitu
tion
disa
bilit
y su
ppor
t 598,6
96
–
12,1
23
2,2
85
–
613,1
03
–
–
16,0
11
16,0
11
629,1
15
Subt
otal
– p
rivat
e in
stitu
tions
898,8
84
–
92,3
82
5,4
66
–
996,7
32
166,9
87
385,5
52
18,0
36
57
0,5
75
1
,56
7,3
07
Subt
otal
– to
tal i
nstit
utio
nal c
are
4,3
26
,85
9
24
4,1
25
3
96
,65
9
6,0
47
–
4,9
73,6
90
170,7
09
385,9
67
1
8,1
69
5
74
,84
4
5,5
48
,53
4
Com
mun
ity c
are
Pers
onal
hea
lth
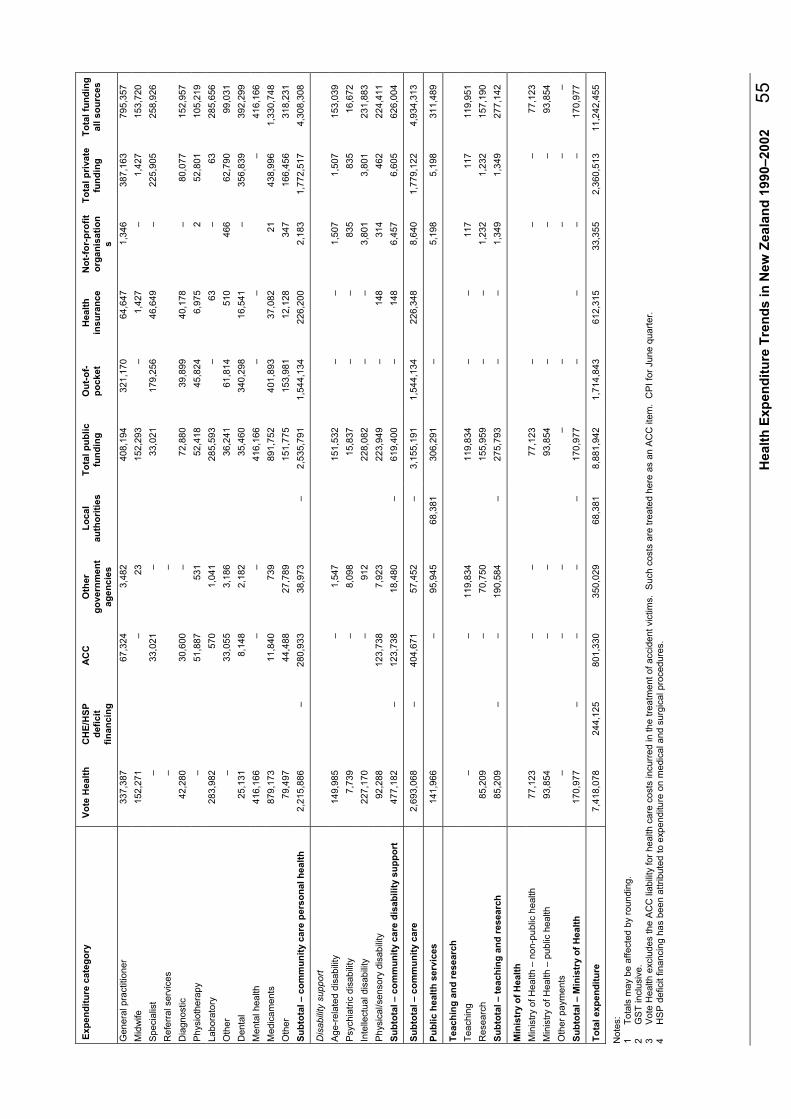
H
ealth
Exp
endi
ture
Tre
nds
in N
ew Z
eala
nd 1
990–
2002
5
5
Expe
nditu
re c
ateg
ory
Vote
Hea
lth
CH
E/H
SP
defic
it fin
anci
ng
ACC
O
ther
go
vern
men
t ag
enci
es
Loca
l au
thor
ities
To
tal p
ublic
fu
ndin
g O
ut-o
f-po
cket
H
ealth
in
sura
nce
Not
-for-
prof
it or
gani
satio
ns
Tota
l priv
ate
fund
ing
Tota
l fun
ding
al
l sou
rces
Ge
ne
ral p
ract
itio
ne
r 3
37
,38
7
6
7,3
24
3
,48
2
4
08
,19
4
32
1,1
70
6
4,6
47
1
,34
6
38
7,1
63
7
95
,35
7
Mid
wife
152,2
71
–
23
1
52
,29
3
–
1,4
27
–
1
,42
7
15
3,7
20
Sp
eci
alis
t –
33
,02
1
–
3
3,0
21
1
79
,25
6
46
,64
9
–
225,9
05
258,9
26
Re
ferr
al s
erv
ice
s –
–
Dia
gn
ost
ic
42
,28
0
3
0,6
00
–
72
,88
0
39
,89
9
40
,17
8
–
80
,07
7
15
2,9
57
Phys
ioth
era
py
–
51,8
87
531
5
2,4
18
4
5,8
24
6
,975
2
52,8
01
105,2
19
La
bo
rato
ry
28
3,9
82
57
0
1,0
41
285,5
93
–
63
–
63
285,6
56
Oth
er
–
3
3,0
55
3
,18
6
36,2
41
61,8
14
510
466
62,7
90
99,0
31
De
nta
l 2
5,1
31
8,1
48
2
,18
2
3
5,4
60
3
40
,29
8
16
,54
1
–
356,8
39
392,2
99
Me
nta
l he
alth
4
16
,16
6
–
–
41
6,1
66
–
–
–
41
6,1
66
Me
dic
am
en
ts
87
9,1
73
11
,84
0
73
9
8
91
,75
2
40
1,8
93
3
7,0
82
2
1
43
8,9
96
1
,33
0,7
48
Oth
er
79
,49
7
4
4,4
88
2
7,7
89
15
1,7
75
1
53
,98
1
12
,12
8
347
166,4
56
318,2
31
Subt
otal
– c
omm
unity
car
e pe
rson
al h
ealth
2
,21
5,8
86
–
2
80
,93
3
38
,97
3
–
2,5
35
,79
1
1,5
44
,13
4
22
6,2
00
2
,18
3
1,7
72
,51
7
4,3
08
,30
8
Dis
abilit
y su
ppor
t
Ag
e-r
ela
ted
dis
ab
ility
1
49
,98
5
–
1,5
47
151,5
32
–
–
1,5
07
1
,50
7
15
3,0
39
Psy
chia
tric
dis
ab
ility
7
,73
9
–
8,0
98
15,8
37
–
–
835
835
16,6
72
Inte
llect
ua
l dis
ab
ility
2
27
,17
0
–
912
228,0
82
–
–
3,8
01
3,8
01
231,8
83
Ph
ysic
al/s
en
sory
dis
ab
ility
9
2,2
88
12
3,7
38
7
,92
3
223,9
49
–
148
314
462
224,4
11
Subt
otal
– c
omm
unity
car
e di
sabi
lity
supp
ort
477,1
82
–
123,7
38
18,4
80
–
619,4
00
–
148
6,4
57
6,6
05
626,0
04
Subt
otal
– c
omm
unity
car
e 2
,69
3,0
68
–
4
04
,67
1
57
,45
2
–
3,1
55
,19
1
1,5
44
,13
4
22
6,3
48
8
,64
0
1,7
79
,12
2
4,9
34
,31
3
Publ
ic h
ealth
ser
vice
s 141,9
66
–
95,9
45
68,3
81
306,2
91
–
5,1
98
5
,19
8
31
1,4
89
Teac
hing
and
rese
arch
Teach
ing
–
–
119,8
34
119,8
34
–
–
117
117
119,9
51
Re
sea
rch
8
5,2
09
–
70
,75
0
1
55
,95
9
–
–
1,2
32
1
,23
2
15
7,1
90
Subt
otal
– te
achi
ng a
nd re
sear
ch
85,2
09
–
–
190,5
84
–
275,7
93
–
–
1,3
49
1
,34
9
27
7,1
42
Min
istr
y of
Hea
lth
Min
istr
y o
f H
ea
lth –
no
n-p
ub
lic h
ea
lth
77
,12
3
–
–
77
,12
3
–
–
–
7
7,1
23
Min
istr
y o
f H
ea
lth –
pu
blic
he
alth
9
3,8
54
–
–
9
3,8
54
–
–
–
93
,85
4
Oth
er
pa
yme
nts
–
–
–
–
–
–
–
–
Subt
otal
– M
inis
try
of H
ealth
170,9
77
–
–
–
–
170,9
77
–
–
–
–
170,9
77
Tota
l exp
endi
ture
7
,41
8,0
78
2
44
,12
5
80
1,3
30
3
50
,02
9
68
,38
1
8,8
81
,94
2
1,7
14
,84
3
61
2,3
15
3
3,3
55
2
,36
0,5
13
1
1,2
42
,45
5
Note
s:
1
To
tals
ma
y b
e a
ffe
cte
d b
y ro
un
din
g.
2
GS
T in
clu
sive
. 3
V
ote
He
alth
exc
lud
es
the
AC
C li
ab
ility
fo
r h
ea
lth c
are
co
sts
incu
rre
d in
th
e t
rea
tme
nt
of
acc
ide
nt
vict
ims.
S
uch
co
sts
are
tre
ate
d h
ere
as
an
AC
C it
em
. C
PI
for
Jun
e q
ua
rte
r.
4
HS
P d
efic
it fin
an
cin
g h
as
be
en
att
rib
ute
d t
o e
xpe
nd
iture
on
me
dic
al a
nd
su
rgic
al p
roce
du
res.

56
H
ealth
Exp
endi
ture
Tre
nds
in N
ew Z
eala
nd 1
990–
2002
App
endi
x 5B
: Hea
lth e
xpen
ditu
re b
y fu
ndin
g so
urce
and
exp
endi
ture
ca
tego
ry, 2
000/
01 (‘
non-
heal
th’ i
tem
s in
clud
ed, $
000)
Ex
pend
iture
cat
egor
y Vo
te H
ealth
C
HE/
HSP
de
ficit
finan
cing
ACC
O
ther
go
vern
men
t ag
enci
es
Loca
l au
thor
ities
To
tal p
ublic
fu
ndin
g O
ut-o
f-po
cket
H
ealth
in
sura
nce
Not
-for-
prof
it or
gani
satio
ns
Tota
l priv
ate
fund
ing
Tota
l fun
ding
al
l sou
rces
Inst
itutio
nal c
are
– pu
blic
inst
itutio
ns
Pers
onal
hea
lth
Su
rgic
al a
nd
me
dic
al
2,1
69
,76
5
76
,83
7
26
1,4
05
2
36
2,5
08
,24
4
3,5
96
–
1
29
3
,72
5
2,5
11
,96
9
Menta
l health
169,1
21
–
–
169,1
21
–
11
–
11
169,1
32
Denta
l 71,6
59
–
–
71,6
59
–
–
–
–
71,6
59
Mate
rnity
274,7
00
–
–
274,7
00
–
–
–
–
274,7
00
Oth
er
144,4
68
–
–
144,4
68
–
216
–
216
144,6
84
Subt
otal
– p
ublic
inst
itutio
ns p
erso
nal h
ealth
2
,82
9,7
13
7
6,8
37
2
61
,40
5
23
6
–
3,1
68
,19
2
3,5
96
2
27
1
29
3
,95
2
3,1
72
,14
4
Dis
abilit
y su
ppor
t
Ag
e-r
ela
ted
dis
ab
ility
1
81
,54
9
64
–
181,6
13
–
–
–
–
181,6
13
Psy
chia
tric
dis
ab
ility
1
81
,22
2
–
–
181,2
22
–
–
–
–
181,2
22
Inte
llect
ua
l dis
ab
ility
5
5,3
05
–
–
55,3
05
–
–
–
–
55,3
05
Ph
ysic
al/s
en
sory
dis
ab
ility
1
8,5
90
8,1
20
–
26,7
10
–
–
–
–
26,7
10
Subt
otal
– p
ublic
inst
itutio
ns d
isab
ility
sup
port
436,6
66
–
8,1
84
–
–
444,8
50
–
–
–
–
444,8
50
Subt
otal
– p
ublic
inst
itutio
ns
3,2
66
,37
9
76
,83
7
26
9,5
89
2
36
–
3
,61
3,0
42
3
,59
6
22
7
12
9
3,9
52
3
,61
6,9
94
Inst
itutio
nal c
are
– pr
ivat
e in
stitu
tions
Pers
onal
hea
lth
Su
rgic
al a
nd
me
dic
al
11
5,4
13
69
,46
9
3,5
47
18
8,4
29
1
61
,34
0
362,1
83
702
524,2
25
712,6
53
Me
nta
l he
alth
2
7,4
25
–
–
2
7,4
25
–
6
5
–
65
2
7,4
90
De
nta
l 5
,29
1
2
,37
1
–
7
,66
2
–
9,0
52
–
9
,05
2
16
,71
4
Mate
rnity
10,4
81
–
–
10,4
81
–
–
–
–
10,4
81
Oth
er
106,8
94
–
–
106,8
94
–
50
1,2
98
1,3
48
108,2
42
Subt
otal
– p
rivat
e in
stitu
tion
pers
onal
hea
lth
26
5,5
04
–
7
1,8
40
3
,54
7
–
34
0,8
91
161,3
40
371,3
50
2,0
00
534,6
90
875,5
81
Dis
abilit
y su
ppor
t
Ag
e-r
ela
ted
dis
ab
ility
5
18
,56
9
–
–
518,5
69
–
–
15,6
65
15,6
65
534,2
34
Psy
chia
tric
dis
ab
ility
1
05
,40
2
–
384
105,7
86
–
–
–
–
105,7
86
Inte
llect
ua
l dis
ab
ility
1
94
,39
0
–
–
194,3
90
–
–
5
5
194,3
95
Ph
ysic
al/s
en
sory
dis
ab
ility
2
0,4
27
10
,44
7
1,6
59
32,5
34
–
–
145
145
32,6
79
Subt
otal
– p
rivat
e in
stitu
tion
disa
bilit
y su
ppor
t 838,7
89
–
10,4
47
2,0
44
–
851,2
80
–
–
15,8
15
15,8
15
867,0
94
Subt
otal
– p
rivat
e in
stitu
tions
1
,10
4,2
93
–
8
2,2
87
5
,59
0
–
1,1
92
,17
0
16
1,3
40
3
71
,35
0
17
,81
5
55
0,5
05
1
,74
2,6
75
Subt
otal
– to
tal i
nstit
utio
nal c
are
4,3
70
,67
2
76
,83
7
35
1,8
76
5
,827
–
4,8
05,2
12
164,9
36
371,5
77
1
7,9
44
5
54
,45
7
5,3
59
,66
9

H
ealth
Exp
endi
ture
Tre
nds
in N
ew Z
eala
nd 1
990–
2002
5
7
Expe
nditu
re c
ateg
ory
Vote
Hea
lth
CH
E/H
SP
defic
it fin
anci
ng
ACC
O
ther
go
vern
men
t ag
enci
es
Loca
l au
thor
ities
To
tal p
ublic
fu
ndin
g O
ut-o
f-po
cket
H
ealth
in
sura
nce
Not
-for-
prof
it or
gani
satio
ns
Tota
l priv
ate
fund
ing
Tota
l fun
ding
al
l sou
rces
Com
mun
ity c
are
Pers
onal
hea
lth
Ge
ne
ral p
ract
itio
ne
r 2
98
,40
5
6
4,5
37
2
,64
3
3
65
,58
5
31
0,3
09
6
9,3
79
1
,33
0
38
1,0
18
7
46
,60
2
Mid
wife
134,6
77
–
–
1
34
,67
7
–
1,5
01
–
1
,50
1
13
6,1
78
Sp
eci
alis
t –
25
,32
6
–
2
5,3
26
1
73
,19
4
44
,13
4
–
217,3
28
242,6
54
Re
ferr
al s
erv
ice
s
–
–
–
Dia
gn
ost
ic
37
,39
5
2
6,1
27
–
63
,52
2
38
,55
0
40
,76
3
–
79
,31
3
14
2,8
35
Phys
ioth
era
py
–
45,4
33
216
4
5,6
49
4
4,2
74
7
,315
2
51,5
91
97,2
40
Labora
tory
251,1
70
563
424
252,1
57
–
59
–
59
252,2
16
Oth
er
–
25,2
38
62
25,3
00
59,7
24
714
460
60,8
98
86,1
98
De
nta
l 2
2,2
27
7,7
17
1
,17
5
3
1,1
19
3
28
,79
0
18
,27
7
–
347,0
67
378,1
86
Menta
l health
260,5
38
–
–
260,5
38
–
–
–
–
260,5
38
Me
dic
am
en
ts
77
7,5
92
10
,53
7
67
7
7
88
,80
6
38
8,3
02
4
1,1
42
2
1
42
9,4
65
1
,21
8,2
71
Oth
er
70
,31
2
4
2,4
60
2
0,1
57
13
2,9
29
1
48
,77
4
15
,15
9
343
164,2
76
297,2
05
Subt
otal
– c
omm
unity
car
e pe
rson
al h
ealth
1
,85
2,3
16
–
2
47
,93
8
25
,35
3
–
2,1
25
,60
7
1,4
91
,91
7
23
8,4
43
2
,15
6
1,7
32
,51
6
3,8
58
,12
3
Dis
abilit
y su
ppor
t
Ag
e-r
ela
ted
dis
ab
ility
1
48
,82
0
–
1,0
69
149,8
88
–
–
1,4
88
1
,48
8
15
1,3
77
Psy
chia
tric
dis
ab
ility
1
58
,33
1
–
8,0
74
166,4
05
–
–
824
824
167,2
30
Inte
llect
ua
l dis
ab
ility
2
4,8
91
–
6,6
36
31
,52
7
–
–
3,7
54
3
,75
4
35
,28
1
Ph
ysic
al/s
en
sory
dis
ab
ility
1
51
,20
4
1
09
,74
7
4,7
76
265,7
27
–
178
310
488
266,2
15
Subt
otal
– c
omm
unity
car
e di
sabi
lity
supp
ort
483,2
45
–
109,7
47
20,5
55
–
613,5
47
–
178
6,3
77
6,5
55
620,1
02
Subt
otal
– c
omm
unity
car
e 2
,33
5,5
61
–
3
57
,68
5
45
,90
8
–
2,7
39
,15
4
1,4
91
,91
7
23
8,6
21
8
,53
3
1,7
39
,07
1
4,4
78
,22
6
Publ
ic h
ealth
ser
vice
s 99,3
85
–
48,0
18
64,2
43
211,6
46
–
–
5,1
34
5,1
34
216,7
80
Teac
hing
and
rese
arch
Teach
ing
–
–
115,8
92
115,8
92
–
–
116
116
116,0
08
Re
sea
rch
7
5,0
00
–
66
,58
2
1
41
,58
2
–
–
1,2
17
1
,21
7
14
2,7
99
Subt
otal
– te
achi
ng a
nd re
sear
ch
75,0
00
–
–
182,4
74
–
257,4
74
–
–
1,3
32
1
,33
2
25
8,8
06
Min
istr
y of
Hea
lth
Min
istr
y o
f H
ea
lth –
no
n-p
ub
lic h
ea
lth
46,9
26
–
–
46,9
26
–
–
–
–
46,9
26
Min
istr
y o
f H
ea
lth –
pu
blic
he
alth
25,3
70
–
–
25,3
70
–
–
–
–
25,3
70
Oth
er
pa
yme
nts
–
–
–
–
–
–
–
–
–
Subt
otal
– M
inis
try
of H
ealth
72,2
96
–
–
–
–
72,2
96
–
–
–
–
72,2
96
Tota
l exp
endi
ture
6
,95
2,9
14
7
6,8
37
7
09
,56
1
28
2,2
26
6
4,2
43
8
,08
5,7
82
1
,65
6,8
53
6
10
,19
8
32
,94
3
2,2
99
,99
4
10
,38
5,7
76
Note
s:
1
To
tals
ma
y b
e a
ffe
cte
d b
y ro
un
din
g.
2
GS
T in
clu
sive
. 3
V
ote
He
alth
exc
lud
es
the
AC
C li
ab
ility
fo
r h
ea
lth c
are
co
sts
incu
rre
d in
th
e t
rea
tme
nt
of
acc
ide
nt
vict
ims.
S
uch
co
sts
are
tre
ate
d h
ere
as
an
AC
C it
em
. C
PI
for
Jun
e q
ua
rte
r.
4
HS
P d
efic
it fin
an
cin
g h
as
be
en
att
rib
ute
d t
o e
xpe
nd
iture
on
me
dic
al a
nd
su
rgic
al p
roce
du
res.

58
H
ealth
Exp
endi
ture
Tre
nds
in N
ew Z
eala
nd 1
990–
2002
App
endi
x 6A
: Hea
lth e
xpen
ditu
re b
y fu
ndin
g so
urce
and
exp
endi
ture
ca
tego
ry, 2
001/
02 (‘
non-
heal
th’ i
tem
s ex
clud
ed, $
000)
Ex
pend
iture
cat
egor
y Vo
te H
ealth
C
HE/
HSP
de
ficit
finan
cing
ACC
O
ther
go
vern
men
t ag
enci
es
Loca
l au
thor
ities
To
tal p
ublic
fu
ndin
g O
ut-o
f-po
cket
H
ealth
in
sura
nce
Not
-for-
prof
it or
gani
satio
ns
Tota
l priv
ate
fund
ing
Tota
l fun
ding
al
l sou
rces
Inst
itutio
nal c
are
– pu
blic
inst
itutio
ns
Pers
onal
hea
lth
Su
rgic
al a
nd
me
dic
al
2,2
33
,02
1
24
4,1
25
2
73
,80
8
58
1
2
,75
1,5
35
3
,72
2
–
13
3
3,8
54
2
,75
5,3
89
Menta
l health
342,8
07
–
–
342,8
07
–
–
–
–
342,8
07
Denta
l 81,0
20
–
–
81,0
20
–
–
–
–
81,0
20
Mate
rnity
310,5
85
–
–
310,5
85
–
–
–
–
310,5
85
Oth
er
163,3
41
–
–
163,3
41
–
415
–
415
163,7
56
Subt
otal
– p
ublic
inst
itutio
ns p
erso
nal h
ealth
3
,13
0,7
74
2
44
,12
5
27
3,8
08
5
81
–
3
,64
9,2
88
3
,72
2
41
5
13
3
4,2
69
3
,65
3,5
58
Dis
abilit
y su
ppor
t
Ag
e-r
ela
ted
dis
ab
ility
2
15
,81
6
17,3
88
–
233,2
04
–
–
–
–
233,2
04
Psy
chia
tric
dis
ab
ility
6
29
–
–
6
29
–
–
–
–
6
29
Inte
llect
ua
l dis
ab
ility
4
4,2
96
–
–
44,2
96
–
–
–
–
44,2
96
Ph
ysic
al/s
en
sory
dis
ab
ility
3
6,4
59
13,0
81
–
49,5
40
–
–
–
–
49,5
40
Subt
otal
– p
ublic
inst
itutio
ns d
isab
ility
sup
port
297,2
00
–
30,4
69
–
–
327,6
69
–
–
–
–
327,6
69
Subt
otal
– p
ublic
inst
itutio
ns
3,4
27
,97
5
24
4,1
25
3
04
,27
7
58
1
–
3,9
76
,95
8
3,7
22
4
15
1
33
4
,26
9
3,9
81
,22
7
Inst
itutio
nal c
are
– pr
ivat
e in
stitu
tions
Pers
onal
hea
lth
Su
rgic
al a
nd
me
dic
al
13
0,4
90
77
,75
9
3,1
82
21
1,4
31
1
66
,98
7
376,3
84
710
544,0
81
755,5
12
Me
nta
l he
alth
3
1,0
08
–
–
3
1,0
08
–
6
4
–
64
3
1,0
72
De
nta
l 5
,98
2
2
,50
0
–
8
,48
2
–
8,9
09
–
8
,90
9
17
,39
1
Mate
rnity
11,8
50
–
–
11,8
50
–
–
–
–
11,8
50
Oth
er
120,8
58
–
–
120,8
58
–
195
1,3
14
1,5
09
122,3
68
Subt
otal
– p
rivat
e in
stitu
tion
pers
onal
hea
lth
30
0,1
88
–
8
0,2
59
3
,18
2
–
38
3,6
29
166,9
87
385,5
52
2,0
25
554,5
64
938,1
93
Dis
abilit
y su
ppor
t
Ag
e-r
ela
ted
dis
ab
ility
3
31
,66
4
–
–
331,6
64
–
–
15,8
59
15,8
59
347,5
24
Psy
chia
tric
dis
ab
ility
2
,36
4
–
538
2,9
02
–
–
–
–
2,9
02
Inte
llect
ua
l dis
ab
ility
1
9,2
10
–
–
19,2
10
–
–
5
5
19,2
15
Ph
ysic
al/s
en
sory
dis
ab
ility
4
9,5
97
12
,12
3
1,7
46
63,4
66
–
–
147
147
63,6
14
Subt
otal
– p
rivat
e in
stitu
tion
disa
bilit
y su
ppor
t 402,8
36
–
12,1
23
2,2
85
–
417,2
43
–
–
16,0
11
16,0
11
433,2
54
Subt
otal
– p
rivat
e in
stitu
tions
703,0
24
–
92,3
82
5,4
66
–
800,8
72
166,9
87
385,5
52
18,0
36
57
0,5
75
1
,37
1,4
47
Subt
otal
– to
tal i
nstit
utio
nal c
are
4,1
30
,99
9
24
4,1
25
3
96
,65
9
6,0
47
–
4,7
77,8
30
170,7
09
385,9
67
1
8,1
69
5
74
,84
4
5,3
52
,67
4

H
ealth
Exp
endi
ture
Tre
nds
in N
ew Z
eala
nd 1
990–
2002
5
9
Expe
nditu
re c
ateg
ory
Vote
Hea
lth
CH
E/H
SP
defic
it fin
anci
ng
ACC
O
ther
go
vern
men
t ag
enci
es
Loca
l au
thor
ities
To
tal p
ublic
fu
ndin
g O
ut-o
f-po
cket
H
ealth
in
sura
nce
Not
-for-
prof
it or
gani
satio
ns
Tota
l priv
ate
fund
ing
Tota
l fun
ding
al
l sou
rces
Com
mun
ity c
are
Pers
onal
hea
lth
Ge
ne
ral p
ract
itio
ne
r 3
37
,38
7
6
7,3
24
3
,48
2
4
08
,19
4
32
1,1
70
6
4,6
47
1
,34
6
38
7,1
63
7
95
,35
7
Mid
wife
152,2
71
–
23
1
52
,29
3
–
1,4
27
–
1
,42
7
15
3,7
20
Sp
eci
alis
t –
33
,02
1
–
3
3,0
21
1
79
,25
6
46
,64
9
–
225,9
05
258,9
26
Re
ferr
al s
erv
ice
s –
–
–
–
–
–
Dia
gn
ost
ic
42
,28
0
3
0,6
00
–
72
,88
0
39
,89
9
40
,17
8
–
80
,07
7
15
2,9
57
Phys
ioth
era
py
–
51,8
87
531
5
2,4
18
4
5,8
24
6
,975
2
52,8
01
105,2
19
La
bo
rato
ry
28
3,9
82
57
0
1,0
41
285,5
93
–
63
–
63
285,6
56
Oth
er
–
3
3,0
55
3
,18
6
36,2
41
61,8
14
510
466
62,7
90
99,0
31
De
nta
l 2
5,1
31
8,1
48
2
,18
2
3
5,4
60
3
40
,29
8
16
,54
1
–
356,8
39
392,2
99
Me
nta
l he
alth
5
10
,49
5
–
–
51
0,4
95
–
–
–
51
0,4
95
Me
dic
am
en
ts
87
9,1
73
11
,84
0
73
9
8
91
,75
2
40
1,8
93
3
7,0
82
2
1
43
8,9
96
1
,33
0,7
48
Oth
er
79
,49
7
4
4,4
88
2
7,7
89
15
1,7
75
1
53
,98
1
12
,12
8
347
166,4
56
318,2
31
Subt
otal
– c
omm
unity
car
e pe
rson
al h
ealth
2
,31
0,2
15
–
2
80
,93
3
38
,97
3
–
2,6
30
,12
1
1,5
44
,13
4
22
6,2
00
2
,18
3
1,7
72
,51
7
4,4
02
,63
8
Dis
abilit
y su
ppor
t
Ag
e-r
ela
ted
dis
ab
ility
6
8,6
58
–
1,5
47
70
,20
6
–
–
1,5
07
1
,50
7
71
,71
2
Psy
chia
tric
dis
ab
ility
4
,84
8
–
8,0
98
12,9
46
–
–
835
835
13,7
80
Inte
llect
ua
l dis
ab
ility
2
0,0
76
–
912
20,9
89
–
–
3,8
01
3,8
01
24,7
90
Ph
ysic
al/s
en
sory
dis
ab
ility
6
4,9
39
12
3,7
38
7
,92
3
196,6
00
–
148
314
462
197,0
62
Subt
otal
– c
omm
unity
car
e di
sabi
lity
supp
ort
158,5
22
–
123,7
38
18,4
80
–
300,7
40
–
148
6,4
57
6,6
05
307,3
44
Subt
otal
– c
omm
unity
car
e 2
,46
8,7
37
–
4
04
,67
1
57
,45
2
–
2,9
30
,86
0
1,5
44
,13
4
22
6,3
48
8
,64
0
1,7
79
,12
2
4,7
09
,98
2
Publ
ic h
ealth
ser
vice
s 102,3
67
–
47,9
27
68,3
81
218,6
74
–
5,1
98
5
,19
8
22
3,8
72
Te
ach
ing
an
d r
ese
arc
h
Teach
ing
–
–
119,8
34
119,8
34
–
–
117
117
119,9
51
Re
sea
rch
8
5,2
09
–
70
,75
0
1
55
,95
9
–
–
1,2
32
1
,23
2
15
7,1
90
Subt
otal
– te
achi
ng a
nd re
sear
ch
85,2
09
–
–
190,5
84
–
275,7
93
–
–
1,3
49
1
,34
9
27
7,1
42
Min
istr
y of
Hea
lth
Min
istr
y o
f H
ea
lth –
no
n-p
ub
lic h
ea
lth
77,1
23
–
–
77,1
23
–
–
–
–
77,1
23
Min
istr
y o
f H
ea
lth –
pu
blic
he
alth
(4
76
)
–
–
(4
76
) –
–
–
–
(4
76
)
Oth
er
pa
yme
nts
–
–
–
–
–
–
–
–
–
Subt
otal
– M
inis
try
of H
ealth
76,6
47
–
–
–
–
76,6
47
–
–
–
–
76,6
47
Tota
l exp
endi
ture
6
,90
3,5
58
2
44
,12
5
80
1,3
30
3
02
,01
1
68
,38
1
8,3
19
,40
4
1,7
14
,84
3
61
2,3
15
3
3,3
55
2
,36
0,5
13
1
0,6
79
,91
7
Note
s:
1
To
tals
ma
y b
e a
ffe
cte
d b
y ro
un
din
g.
2
GS
T in
clu
sive
. 3
V
ote
He
alth
exc
lud
es
the
AC
C li
ab
ility
fo
r h
ea
lth c
are
co
sts
incu
rre
d in
th
e t
rea
tme
nt
of
acc
ide
nt
vict
ims.
S
uch
co
sts
are
tre
ate
d h
ere
as
an
AC
C it
em
. C
PI
for
Jun
e q
ua
rte
r.
4
HS
P d
efic
it fin
an
cin
g h
as
be
en
att
rib
ute
d t
o e
xpe
nd
iture
on
me
dic
al a
nd
su
rgic
al p
roce
du
res.

60
H
ealth
Exp
endi
ture
Tre
nds
in N
ew Z
eala
nd 1
990–
2002
App
endi
x 6B
: Hea
lth e
xpen
ditu
re b
y fu
ndin
g so
urce
and
exp
endi
ture
ca
tego
ry, 2
000/
01 (‘
non-
heal
th’ i
tem
s ex
clud
ed, $
000)
Ex
pend
iture
cat
egor
y Vo
te H
ealth
C
HE/
HSP
de
ficit
finan
cing
ACC
O
ther
go
vern
men
t ag
enci
es
Loca
l au
thor
ities
To
tal p
ublic
fu
ndin
g O
ut-o
f-po
cket
H
ealth
in
sura
nce
Not
-for-
prof
it or
gani
satio
ns
Tota
l priv
ate
fund
ing
Tota
l fun
ding
al
l sou
rces
Inst
itutio
nal c
are
– pu
blic
inst
itutio
ns
Pers
onal
hea
lth
Su
rgic
al a
nd
me
dic
al
2,1
69
,76
5
76
,83
7
26
1,4
05
2
36
2,5
08
,24
4
3,5
96
–
1
29
3
,72
5
2,5
11
,96
9
Menta
l health
169,1
21
–
–
169,1
21
–
11
–
11
169,1
32
Denta
l 71,6
59
–
–
71,6
59
–
–
–
–
71,6
59
Mate
rnity
274,7
00
–
–
274,7
00
–
–
–
–
274,7
00
Oth
er
144,4
68
–
–
144,4
68
–
216
–
216
144,6
84
Subt
otal
– p
ublic
inst
itutio
ns p
erso
nal h
ealth
2
,82
9,7
13
7
6,8
37
2
61
,40
5
23
6
–
3,1
68
,19
2
3,5
96
2
27
1
29
3
,95
2
3,1
72
,14
4
Dis
abilit
y su
ppor
t
Ag
e-r
ela
ted
dis
ab
ility
1
81
,54
9
64
–
181,6
13
–
–
–
–
181,6
13
Psy
chia
tric
dis
ab
ility
1
81
,22
2
–
–
181,2
22
–
–
–
–
181,2
22
Inte
llect
ua
l dis
ab
ility
5
5,3
05
–
–
55,3
05
–
–
–
–
55,3
05
Ph
ysic
al/s
en
sory
dis
ab
ility
1
8,5
90
8,1
20
–
26,7
10
–
–
–
–
26,7
10
Subt
otal
– p
ublic
inst
itutio
ns d
isab
ility
sup
port
436,6
66
–
8,1
84
–
–
444,8
50
–
–
–
–
444,8
50
Subt
otal
– p
ublic
inst
itutio
ns
3,2
66
,37
9
76
,83
7
26
9,5
89
2
36
–
3
,61
3,0
42
3
,59
6
22
7
12
9
3,9
52
3
,61
6,9
94
Inst
itutio
nal c
are
– pr
ivat
e in
stitu
tions
Pers
onal
hea
lth
Su
rgic
al a
nd
me
dic
al
11
5,4
13
69
,46
9
3,5
47
18
8,4
29
1
61
,34
0
362,1
83
702
524,2
25
712,6
53
Me
nta
l he
alth
2
7,4
25
–
–
2
7,4
25
–
6
5
–
65
2
7,4
90
De
nta
l 5
,29
1
2
,37
1
–
7
,66
2
–
9,0
52
–
9
,05
2
16
,71
4
Mate
rnity
10,4
81
–
–
10,4
81
–
–
–
–
10,4
81
Oth
er
106,8
94
–
–
106,8
94
–
50
1,2
98
1,3
48
108,2
42
Subt
otal
– p
rivat
e in
stitu
tion
pers
onal
hea
lth
26
5,5
04
–
7
1,8
40
3
,54
7
–
34
0,8
91
161,3
40
371,3
50
2,0
00
534,6
90
875,5
81
Dis
abilit
y su
ppor
t
Ag
e-r
ela
ted
dis
ab
ility
3
36
,59
5
–
–
336,5
95
–
–
15,6
65
15,6
65
352,2
59
Psy
chia
tric
dis
ab
ility
8
3,9
34
–
384
84,3
18
–
–
–
–
84,3
18
Inte
llect
ua
l dis
ab
ility
1
23
,54
4
–
–
123,5
44
–
–
5
5
123,5
49
Ph
ysic
al/s
en
sory
dis
ab
ility
1
8,5
80
10
,44
7
1,6
59
30,6
87
–
–
145
145
30,8
32
Subt
otal
– p
rivat
e in
stitu
tion
disa
bilit
y su
ppor
t 562,6
53
–
10,4
47
2,0
44
–
575,1
44
–
–
15,8
15
15,8
15
590,9
59
Subt
otal
– p
rivat
e in
stitu
tions
828,1
57
–
82,2
87
5,5
90
–
916,0
35
161,3
40
371,3
50
17,8
15
55
0,5
05
1
,46
6,5
39
Subt
otal
– to
tal i
nstit
utio
nal c
are
4,0
94
,53
6
76
,83
7
35
1,8
76
5
,827
–
4,5
29,0
76
164,9
36
371,5
77
1
7,9
44
5
54
,45
7
5,0
83
,53
3

H
ealth
Exp
endi
ture
Tre
nds
in N
ew Z
eala
nd 1
990–
2002
6
1
Expe
nditu
re c
ateg
ory
Vote
Hea
lth
CH
E/H
SP
defic
it fin
anci
ng
ACC
O
ther
go
vern
men
t ag
enci
es
Loca
l au
thor
ities
To
tal p
ublic
fu
ndin
g O
ut-o
f-po
cket
H
ealth
in
sura
nce
Not
-for-
prof
it or
gani
satio
ns
Tota
l priv
ate
fund
ing
Tota
l fun
ding
al
l sou
rces
Com
mun
ity c
are
Pers
onal
hea
lth
Ge
ne
ral p
ract
itio
ne
r 2
98
,40
5
6
4,5
37
2
,64
3
3
65
,58
5
31
0,3
09
6
9,3
79
1
,33
0
38
1,0
18
7
46
,60
2
Mid
wife
134,6
77
–
–
1
34
,67
7
–
1,5
01
–
1
,50
1
13
6,1
78
Sp
eci
alis
t –
25
,32
6
–
2
5,3
26
1
73
,19
4
44
,13
4
–
217,3
28
242,6
54
Re
ferr
al s
erv
ice
s
–
–
–
–
–
Dia
gn
ost
ic
37
,39
5
2
6,1
27
–
63
,52
2
38
,55
0
40
,76
3
–
79
,31
3
14
2,8
35
Phys
ioth
era
py
–
45,4
33
216
4
5,6
49
4
4,2
74
7
,31
5
2
51
,59
1
97
,24
0
Labora
tory
251,1
70
563
424
252,1
57
–
59
–
59
252,2
16
Oth
er
–
2
5,2
38
6
2
2
5,3
00
5
9,7
24
7
14
4
60
6
0,8
98
8
6,1
98
De
nta
l 2
2,2
27
7,7
17
1
,17
5
3
1,1
19
3
28
,79
0
18
,27
7
–
34
7,0
67
3
78
,18
6
Me
nta
l he
alth
2
60
,53
8
–
–
26
0,5
38
–
–
–
–
2
60
,53
8
Me
dic
am
en
ts
77
7,5
92
10
,53
7
67
7
7
88
,806
388,3
02
41,1
42
21
429,4
65
1
,21
8,2
71
Oth
er
70
,31
2
4
2,4
60
2
0,1
57
13
2,9
29
1
48
,77
4
15
,15
9
34
3
16
4,2
76
2
97
,20
5
Subt
otal
– c
omm
unity
car
e pe
rson
al h
ealth
1
,85
2,3
16
–
2
47
,93
8
25
,35
3
–
2,1
25
,60
7
1,4
91
,91
7
23
8,4
43
2
,15
6
1,7
32
,51
6
3,8
58
,12
3
Dis
abilit
y su
ppor
t
Ag
e-r
ela
ted
dis
ab
ility
–
–
115,8
92
115,8
92
–
–
116
116
116,0
08
Psy
chia
tric
dis
ab
ility
7
5,0
00
–
66,5
82
141,5
82
–
–
1,2
17
1
,21
7
14
2,7
99
Inte
llect
ua
l dis
ab
ility
7
5,0
00
–
–
182,4
74
–
257,4
74
–
–
1,3
32
1
,33
2
25
8,8
06
Ph
ysic
al/s
en
sory
dis
ab
ility
Subt
otal
– c
omm
unity
car
e di
sabi
lity
supp
ort
46
,92
6
–
–
46
,92
6
–
–
–
–
46
,92
6
Subt
otal
– c
omm
unity
car
e 2
5,3
70
–
–
2
5,3
70
–
–
–
–
2
5,3
70
Publ
ic h
ealth
ser
vice
s –
–
–
–
–
–
–
–
–
Teac
hing
and
rese
arch
72,2
96
–
–
–
–
72,2
96
–
–
–
–
72,2
96
Te
ach
ing
6
,46
9,4
31
7
6,8
37
7
09
,56
1
28
2,2
26
6
4,2
43
7
,60
2,2
99
1
,65
6,8
53
6
10
,19
8
32
,94
3
2,2
99
,99
4
9,9
02
,29
3
Rese
arc
h
–
–
115,8
92
115,8
92
–
–
116
116
116,0
08
Subt
otal
– te
achi
ng a
nd re
sear
ch
75
,00
0
–
6
6,5
82
14
1,5
82
–
–
1
,21
7
1,2
17
1
42
,79
9
Min
istr
y of
Hea
lth
75,0
00
–
–
182,4
74
–
257,4
74
–
–
1,3
32
1
,33
2
25
8,8
06
Min
istr
y o
f H
ea
lth –
no
n-p
ub
lic h
ea
lth
Min
istr
y o
f H
ea
lth –
pu
blic
he
alth
46,9
26
–
–
46,9
26
–
–
–
–
46,9
26
Oth
er
pa
yme
nts
2
5,3
70
–
–
25,3
70
–
–
–
–
25,3
70
Subt
otal
– M
inis
try
of H
ealth
–
–
–
–
–
–
–
–
–
Tota
l exp
endi
ture
72,2
96
–
–
–
–
72,2
96
–
–
–
–
72,2
96
Note
s:
1
To
tals
ma
y b
e a
ffe
cte
d b
y ro
un
din
g.
2
GS
T in
clu
sive
. 3
V
ote
He
alth
exc
lud
es
the
AC
C li
ab
ility
fo
r h
ea
lth c
are
co
sts
incu
rre
d in
th
e t
rea
tme
nt
of
acc
ide
nt
vict
ims.
S
uch
co
sts
are
tre
ate
d h
ere
as
an
AC
C it
em
. C
PI
for
Jun
e q
ua
rte
r.
4
HS
P d
efic
it fin
an
cin
g h
as
be
en
att
rib
ute
d t
o e
xpe
nd
iture
on
me
dic
al a
nd
su
rgic
al p
roce
du
res.

62
H
ealth
Exp
endi
ture
Tre
nds
in N
ew Z
eala
nd 1
990–
2002
App
endi
x 7A
: Priv
ate
heal
th in
sura
nce
tren
ds, 1
989/
90–2
001/
02 ($
000)
1989
/90
1990
/91
1991
/92
1992
/93
1993
/94
1994
/95
1995
/96
1996
/97
1997
/98
1998
/99
1999
/00
2000
/01
2001
/02
Inst
itutio
nal c
are
Pu
blic
3
23
3
84
2
,69
2
3,6
42
5
,22
9
2,9
67
2
,97
4
3,2
02
3
89
6
24
6
43
2
27
4
15
Priva
te
38
,86
8
48
,15
5
12
4,4
38
1
39
,79
1
18
0,6
33
2
10
,98
9
23
4,7
76
2
52
,74
5
30
0,0
91
3
07
,09
3
33
9,6
16
3
71
,35
0
38
5,5
52
Su
bto
tal –
inst
itutio
na
l ca
re
39
,19
1
48
,53
9
12
7,1
30
1
43
,43
3
18
5,8
62
2
13
,95
6
23
7,7
50
2
55
,94
7
30
0,4
80
3
07
,71
7
34
0,2
59
3
71
,57
7
38
5,9
67
Com
mun
ity c
are
Ge
ne
ral p
ract
itio
ne
rs
47
,50
1
62
,56
2
53
,58
1
52
,67
4
70
,54
8
70
,41
9
72
,24
7
77
,77
6
73
,73
2
67
,76
7
69
,02
5
70
,88
0
66
,07
4
Sp
eci
alis
t se
rvic
es
42
,42
6
54
,95
9
44
,75
9
57
,98
0
62
,12
8
72
,56
3
84
,46
7
90
,93
2
88
,23
3
87
,09
9
88
,97
1
10
8,3
22
1
06
,65
1
De
nta
l se
rvic
es
3,6
47
5
,18
5
12
,69
5
15
,59
9
23
,17
0
26
,92
3
28
,20
1
30
,35
9
3,8
09
2
2,3
11
2
1,1
64
1
8,2
77
1
6,5
41
Me
dic
am
en
ts
8,9
73
2
0,8
51
3
0,9
38
3
2,0
54
4
0,4
37
4
2,1
66
4
5,0
35
4
8,4
82
4
4,6
17
4
2,2
11
4
1,4
24
4
1,1
42
3
7,0
82
Su
bto
tal –
co
mm
un
ity c
are
1
02
,54
7
14
3,5
57
1
41
,97
3
15
8,3
07
1
96
,28
3
21
2,0
71
2
29
,95
0
24
7,5
49
2
10
,39
0
21
9,3
87
2
20
,58
4
23
8,6
21
2
26
,34
8
Pu
blic
he
alth
3
2
34
3
4
Te
ach
ing
an
d r
ese
arc
h
33
3
4
Tota
l 1
41
,73
8
19
2,0
96
2
69
,16
8
30
1,8
08
3
82
,17
9
42
6,0
27
4
67
,70
0
50
3,4
96
5
10
,87
1
52
7,1
04
5
60
,84
2
61
0,1
98
6
12
,31
5
No
tes:
1
T
ota
ls m
ay
be
aff
ect
ed
by
rou
nd
ing
. 2
G
ST
incl
usi
ve.

H
ealth
Exp
endi
ture
Tre
nds
in N
ew Z
eala
nd 1
990–
2002
6
3
App
endi
x 7B
: Priv
ate
heal
th in
sura
nce
tren
ds, 1
989/
90–2
001/
02 (r
eal
2001
/02,
$00
0)
19
89/9
0 19
90/9
1 19
91/9
2 19
92/9
3 19
93/9
4 19
94/9
5 19
95/9
6 19
96/9
7 19
97/9
8 19
98/9
9 19
99/0
0 20
00/0
1 20
01/0
2
Inst
itutio
na
l ca
re
Pu
blic
3
95
4
57
3
,17
1
4,2
35
6
,01
7
3,2
64
3
,20
8
3,4
14
4
08
6
57
6
63
2
27
4
15
Priva
te
47
,57
4
57
,32
7
14
6,5
70
1
62
,54
8
20
7,8
63
2
32
,11
1
25
3,2
64
2
69
,45
1
31
4,8
91
3
23
,25
6
35
0,4
81
3
71
,35
0
38
5,5
52
Su
bto
tal –
inst
itutio
na
l ca
re
47
,96
9
57
,78
5
14
9,7
41
1
66
,78
3
21
3,8
80
2
35
,37
5
25
6,4
72
2
72
,86
5
31
5,3
00
3
23
,91
3
35
1,1
44
3
71
,57
7
38
5,9
67
Co
mm
un
ity c
are
Ge
ne
ral p
ract
itio
ne
rs
58
,14
1
74
,47
9
63
,11
1
61
,24
9
81
,18
3
77
,46
9
77
,93
6
82
,91
7
77
,36
8
71
,33
3
71
,23
3
70
,88
0
66
,07
4
Sp
eci
alis
t se
rvic
es
51
,92
9
65
,42
7
52
,72
0
67
,41
9
71
,49
4
79
,82
7
91
,11
9
96
,94
2
92
,58
4
91
,68
4
91
,81
7
10
8,3
22
1
06
,65
1
De
nta
l se
rvic
es
4,4
64
6
,17
3
14
,95
3
18
,13
8
26
,66
3
29
,61
8
30
,42
2
32
,36
6
3,9
97
2
3,4
85
2
1,8
41
1
8,2
77
1
6,5
41
Me
dic
am
en
ts
10
,98
3
24
,82
3
36
,44
1
37
,27
2
46
,53
3
46
,38
7
48
,58
1
51
,68
7
46
,81
7
44
,43
2
42
,74
9
41
,14
2
37
,08
2
Su
bto
tal –
co
mm
un
ity c
are
1
25
,51
7
17
0,9
01
1
67
,22
4
18
4,0
78
2
25
,87
2
23
3,3
01
2
48
,05
8
26
3,9
12
2
20
,76
6
23
0,9
34
2
27
,64
1
23
8,6
21
2
26
,34
8
Pu
blic
he
alth
3
2
34
3
4
Te
ach
ing
an
d r
ese
arc
h
33
3
4
To
tal
17
3,4
86
2
28
,68
6
31
7,0
30
3
50
,92
8
43
9,7
87
4
68
,67
7
50
4,5
31
5
36
,77
6
53
6,0
66
5
54
,84
7
57
8,7
85
6
10
,19
8
61
2,3
15
No
tes:
1
T
ota
ls m
ay
be
aff
ect
ed
by
rou
nd
ing
. 2
G
ST
incl
usi
ve.

64
H
ealth
Exp
endi
ture
Tre
nds
in N
ew Z
eala
nd 1
990–
2002
App
endi
x 8A
: Tre
nds
in e
xpen
ditu
re o
n m
ajor
hea
lth b
enef
its, 1
989/
90–
2001
/02
($00
0)
19
89/9
0 19
90/9
1 19
91/9
2 19
92/9
3 19
93/9
4 19
94/9
5 19
95/9
6 19
96/9
7 19
97/9
8 19
98/9
9 19
99/0
0 20
00/0
1 20
01/0
2
Prim
ary
serv
ices
Ge
ne
ral m
ed
ica
l se
rvic
es
(GM
S)
13
6,2
80
1
71
,43
2
16
6,5
86
1
68
,87
3
17
0,9
28
1
70
,27
5
17
3,3
82
1
92
,17
4
19
0,3
69
1
94
,48
5
14
0,0
72
1
33
,57
2
13
0,0
24
Pra
ctic
e n
urs
e a
nd
he
alth
ce
ntr
e
29
,91
6
32
,76
6
29
,36
8
28
,75
5
30
,33
0
31
,02
0
32
,64
6
35
,46
1
32
,30
9
23
,73
0
30
,74
0
19
,79
3
19
,12
2
Ru
ral p
ract
ice
bo
nu
s 2
,86
6
3,6
90
3
,18
8
3,2
90
3
,07
8
3,2
47
3
,23
8
2,9
98
3
,54
3
2,3
14
7
90
2
,88
5
3,5
88
Imm
un
isa
tion
3
,60
0
4,9
99
3
,31
7
2,7
12
3
,76
4
2,9
80
2
,96
4
8,0
07
6
,34
3
6,7
27
1
3,0
44
7
,79
9
8,5
12
Ma
tern
ity
47
,45
7
58
,93
6
67
,24
8
78
,22
2
89
,61
8
89
,47
8
94
,22
8
10
5,4
23
1
09
,21
4
11
7,1
79
1
45
,15
8
11
2,5
25
9
7,2
44
De
nta
l be
ne
fits
15
,30
0
18
,11
4
17
,67
0
17
,11
8
16
,61
6
16
,04
2
15
,78
0
16
,53
8
17
,10
2
16
,05
3
43
,93
8
17
,31
3
23
,63
6
Ca
pita
tion
4
3,5
35
3
7,2
18
1
04
,23
1
59
,31
1
10
2,8
60
Su
bto
tal –
prim
ary
se
rvic
es
23
5,4
19
2
89
,93
7
28
7,3
77
2
98
,97
0
31
4,3
34
3
13
,04
2
32
2,2
37
3
60
,60
1
40
2,4
15
3
97
,70
6
47
7,9
73
3
53
,19
8
38
4,9
86
Ref
erra
l ser
vice
s
Sp
eci
alis
ts
5,3
00
5
,72
1
3,9
82
3
,01
5
2,3
96
2
,56
2
2,7
21
2
,68
3
2,6
27
2
,55
6
2,4
01
2
,81
1
1,4
01
La
bo
rato
ry
89
,34
0
10
0,2
31
1
03
,52
8
11
4,0
06
1
30
,65
7
14
1,0
82
1
58
,13
7
15
9,6
68
1
75
,19
2
19
1,0
31
2
06
,75
3
20
5,3
38
2
06
,64
8
Dia
gn
ost
ic im
ag
ing
4
,67
1
4,8
95
2
,70
0
2,2
02
2
,36
6
2,5
08
2
,80
8
3,1
15
2
,86
8
2,8
36
2
,54
6
3,1
51
5
,54
4
Su
bto
tal –
re
ferr
al s
erv
ice
s 9
9,3
11
1
10
,84
7
11
0,2
10
1
19
,22
3
13
5,4
19
1
46
,15
2
16
3,6
65
1
65
,46
6
18
0,6
87
1
96
,42
3
21
1,7
00
2
11
,30
1
21
3,5
93
Ph
arm
ace
utic
als
5
22
,60
0
54
5,3
31
5
56
,37
3
58
2,9
31
6
40
,69
7
67
4,7
98
6
95
,93
9
74
7,4
26
7
72
,73
4
71
0,5
20
7
25
,16
2
71
3,2
59
7
92
,95
0
Tota
l 8
57
,33
0
94
6,1
15
9
53
,96
0
1,0
01
,12
4
1,0
90
,45
0
1,1
33
,99
2
1,1
81
,84
1
1,2
73
,49
3
1,3
55
,83
6
1,3
04
,64
9
1,4
14
,83
5
1,2
77
,75
8
1,3
91
,52
9
So
urc
e:
He
alth
PA
C,
Min
istr
y o
f H
ea
lth
No
tes:
1
Ju
ne
ye
ars
fo
r th
e p
erio
d 1
98
9/9
0 o
nw
ard
s.
2
To
tals
ma
y b
e a
ffe
cte
d b
y ro
un
din
g.
3
Th
e in
form
atio
n in
th
is t
ab
le is
no
t o
bta
ina
ble
in t
he
sa
me
fo
rm a
fte
r 1
99
6/9
7,
be
cau
se o
f ch
an
ge
s in
th
e p
aym
en
t m
eth
od
s a
fte
r th
e in
tro
du
ctio
n o
f ca
pita
tion
. 4
G
ST
incl
usi
ve.

H
ealth
Exp
endi
ture
Tre
nds
in N
ew Z
eala
nd 1
990–
2002
6
5
App
endi
x 8B
: Tre
nds
in e
xpen
ditu
re o
n m
ajor
hea
lth b
enef
its, 1
989/
90–
2001
/02
(rea
l 200
1/02
, $00
0)
19
89/9
0 19
90/9
1 19
91/9
2 19
92/9
3 19
93/9
4 19
94/9
5 19
95/9
6 19
96/9
7 19
97/9
8 19
98/9
9 19
99/0
0 20
00/0
1 20
01/0
2
Prim
ary
serv
ices
Ge
ne
ral m
ed
ica
l se
rvic
es
(GM
S)
incl
ud
ing
mo
tor
veh
icle
allo
wa
nce
1
66
,80
5
20
4,0
86
1
96
,21
4
19
6,3
64
1
96
,69
5
18
7,3
21
1
87
,03
6
20
4,8
76
1
99
,75
8
20
4,7
21
1
44
,55
3
13
3,5
72
1
30
,02
4
Pra
ctic
e n
urs
e a
nd
he
alth
ce
ntr
e
36
,61
7
39
,00
7
34
,59
1
33
,43
6
34
,90
2
34
,12
5
35
,21
6
37
,80
5
33
,90
2
24
,97
9
31
,72
3
19
,79
3
19
,12
2
Ru
ral p
ract
ice
bo
nu
s 3
,50
8
4,3
93
3
,75
5
3,8
26
3
,54
2
3,5
72
3
,49
3
3,1
96
3
,71
8
2,4
36
8
15
2
,88
5
3,5
88
Imm
un
isa
tion
4
,40
6
5,9
51
3
,90
7
3,1
53
4
,33
1
3,2
78
3
,19
7
8,5
36
6
,65
6
7,0
81
1
3,4
61
7
,79
9
8,5
12
Ma
tern
ity
58
,08
7
70
,16
2
79
,20
8
90
,95
6
10
3,1
28
9
8,4
36
1
01
,64
8
11
2,3
91
1
14
,60
0
12
3,3
46
1
49
,80
2
11
2,5
25
9
7,2
44
De
nta
l be
ne
fits
18
,72
7
21
,56
4
20
,81
3
19
,90
5
19
,12
1
17
,64
8
17
,02
2
17
,63
1
17
,94
5
16
,89
8
45
,34
4
17
,31
3
23
,63
6
Ca
pita
tion
4
5,6
82
3
9,1
77
1
07
,56
6
59
,31
1
10
2,8
60
Su
bto
tal –
prim
ary
se
rvic
es
28
8,1
51
3
45
,16
3
33
8,4
89
3
47
,64
0
36
1,7
19
3
44
,38
1
34
7,6
13
3
84
,43
6
42
2,2
61
4
18
,63
8
49
3,2
64
3
53
,19
8
38
4,9
86
Ref
erra
l ser
vice
s
Sp
eci
alis
ts
6,4
87
6
,81
1
4,6
90
3
,50
6
2,7
57
2
,81
9
2,8
42
2
,86
0
2,7
57
2
,69
1
2,4
78
2
,81
1
1,4
01
La
bo
rato
ry
10
9,3
51
1
19
,32
3
12
1,9
41
1
32
,56
5
15
0,3
53
1
55
,20
6
16
5,2
15
1
70
,22
2
18
3,8
32
2
01
,08
5
21
3,3
67
2
05
,33
8
20
6,6
48
Dia
gn
ost
ic im
ag
ing
5
,71
7
5,8
27
3
,18
0
2,5
60
2
,72
3
2,7
59
2
,93
3
3,3
21
3
,00
9
2,9
85
2
,62
7
3,1
51
5
,54
4
Su
bto
tal –
re
ferr
al s
erv
ice
s 1
21
,55
6
13
1,9
61
1
29
,81
2
13
8,6
31
1
55
,83
3
16
0,7
83
1
70
,99
1
17
6,4
03
1
89
,59
8
20
6,7
61
2
18
,47
3
21
1,3
00
2
13
,59
3
Ph
arm
ace
utic
als
6
39
,65
7
64
9,2
04
6
55
,32
7
67
7,8
27
7
37
,28
1
74
2,3
52
7
50
,74
3
79
6,8
29
8
10
,84
4
74
7,9
16
7
48
,36
1
71
3,2
59
7
92
,95
0
Tota
l 1
,04
9,3
64
1
,12
6,3
27
1
,12
3,6
28
1
,16
4,0
98
1
,25
4,8
33
1
,24
7,5
16
1
,26
9,3
47
1
,35
7,6
68
1
,42
2,7
03
1
,37
3,3
14
1
,46
0,0
98
1
,27
7,7
57
1
,39
1,5
29
So
urc
e:
He
alth
PA
C,
Min
istr
y o
f H
ea
lth
No
tes:
1
Ju
ne
ye
ars
fo
r th
e p
erio
d 1
98
9/9
0 o
nw
ard
s.
2
To
tals
ma
y b
e a
ffe
cte
d b
y ro
un
din
g.
3
Th
e in
form
atio
n in
th
is t
ab
le is
no
t o
bta
ina
ble
in t
he
sa
me
fo
rm a
fte
r 1
99
6/9
7,
be
cau
se o
f ch
an
ge
s in
th
e p
aym
en
t m
eth
od
s a
fte
r th
e in
tro
du
ctio
n o
f ca
pita
tion
. 4
G
ST
incl
usi
ve.

66 Health Expenditure Trends in New Zealand 1990–2002
Appendix 9: A note on transfers and capital expenditure Table A9.1: Net interdepartmental transfers, 1993/94–2001/02 ($000)
1993/94 1994/95 1995/96 1996/97 1997/98 1998/99 1999/00 2000/01 2001/02
Vote Social Welfare 251,719 275,873 394,690 423,898 433,637 438,974 447,490 456,887 465,367
Vote Education – (3,712) (7,146) (6,864) (6,810) (7,157) (7,262) (7,351) (7,433)
Vote ACC – – – (15,015) (22,770) (23,000) (65,890) (65,890) (65,890)
Vote MORST – – – – (26,551) (26,551) (26,551) (26,551) (26,852)
Vote HSP – – – – – 145,688 254,488 254,488 256,140
Other departments – 1,575 1,575 1,622 1,012 1,575 (1,651) (1,631) (1,613)
Total net interdepartmental transfers
251,719 273,736 389,119 403,641 378,518 529,529 600,624 609,952 619,719
Source: Ministry of Health
Table A9.2: Vote Health including, and excluding, capital and transfers, 1993/94–2001/02
($000)
1993/94 1994/95 1995/96 1996/97 1997/98 1998/99 1999/00 2000/01 2001/02
Vote Health (including capital and transfers)
4,485,018 4,745,194 5,094,154 5,455,513 5,861,410 6,328,287 6,720,924 7,190,019 7,543,629
Total net transfers 251,719 273,736 389,119 403,641 378,518 529,529 600,624 609,952 619,719
Capital contributions to Vote Health
3,652 394 29,238 14,946 35,459 2,340 13,000 62,689 250,007
Vote Health (excluding capital and transfers)
4,229,647 4,471,064 4,675,797 5,036,926 5,447,433 5,796,418 6,107,300 6,517,378 6,673,903
Source: Ministry of Health
Notes: 1 Totals may be affected by rounding. 2 GST inclusive.

Health Expenditure Trends in New Zealand 1990–2002 67
Appendix 10: Contributors The following individuals and organisations contributed information used in the compilation of Health Expenditure Trends in New Zealand.
Other government agencies Name Organisation Location
Grant Bremner ACC Wellington
Madeleine Waters Department of Corrections Wellington
Zarleen Blakeley Department of Internal Affairs Wellington
Kevin Lenihan Ministry of Agriculture and Forestry Wellington
Peter Hay Ministry of Education Wellington
Ross Bucklar Ministry of Youth Affairs Wellington
Mark Kennan New Zealand Defence Force Wellington
Jean Clarke Office of Veterans’ Affairs Hamilton
Jeff Sheerin Statistics New Zealand Wellington
Stephen Shand Statistics New Zealand Christchurch
Local government authorities Name Organisation Location
Jane Bentley Auckland City Council Auckland
John Mackey Christchurch City Council Christchurch
Judy Austin Dunedin City Council Dunedin
Brett Brinkworth Hamilton City Council Hamilton
Claire Falck Hutt City Council Lower Hutt
Gordan Cameron Kapiti Coast District Council Kapiti
Dave Fellows Napier City Council Napier
Chris Fitchett Nelson City Council Nelson
Frank Versteeg New Plymouth District Council New Plymouth
Steve Patterson Palmerston North City Council Palmerston North
Melanie Martin Porirua City Council Porirua City
Karen Allison Rodney District Council Orewa
T Buckeridge Taupo District Council Taupo
Peter Allsop Tauranga District Council Tauranga
Gavin Anderson Timaru District Council Timaru
Paul Christensen Waimakariri District Council Rangiora
E Sim Wanganui District Council Wanganui
Matthew Murfitt Wellington City Council Wellington
Irina Itskovich Wellington Regional Council Wellington
Sayan Paranthaman Whangarei District Council Whangarei

68 Health Expenditure Trends in New Zealand 1990–2002
Health insurance industry Andrea Pettett and Faye Pulley of the Health Funds Association of New Zealand Inc undertook the difficult task of collating data from 15 member organisation health insurers and provided estimates of total expenditure by the health insurance industry. The health insurers who are member institutions of the Health Funds Association of New Zealand are:
AA GIO Insurance Ltd Aetna Health (NZ) Ltd American International Assurance AXA New Zealand EBS Health Care Friendly Society Ltd Health Service Welfare Society IOOF Friendly Society Manchester Unity Police Health Plan Ltd PSIS Health Care Southern Cross Healthcare Sovereign Assurance Company Ltd State Insurance Ltd Tower Health Union Medical Benefits Society Ltd
Not-for-profit organisations Name Organisation Location
Susan Sutcliffe Arthritis Foundation of NZ Wellington
Andrew Hayes Diabetes NZ Inc Nelson
Barney Cooper Dunedin Community Care Trust Dunedin
Raquel Martinez Hawksbury Trust Dunedin
Donald Crawford New Zealand Family Planning Association Inc Wellington
Kevin Jones Presbyterian Support (Central) Wellington
Fred Ebbeling Presbyterian Support (East Coast) Havelock North
Margaret Wilkinson Presbyterian Support (Otago) Dunedin
B Oram Presbyterian Support (South Canterbury) Timaru
Shane McDermott Presbyterian Support (Southland) Invercargill
Peter Murison Presbyterian Support (Upper South Island) Christchurch
Leauga Tapasu Royal NZ Plunket Society Inc Wellington
Kim Casey Spectrum Care Auckland

Health Expenditure Trends in New Zealand 1990–2002 69
References Abel-Smith B. 1963. Paying for Health Services: A study of the costs and sources of finance in six countries. Geneva: World Health Organization.
Ministry of Health. 2002. Ministry of Health Annual Report for the Year Ended 30 June 2002. Wellington: Ministry of Health.
OECD. 2003. OECD Health Data. Paris: OECD.