health financing for the poor in the philippines: final …€¦ · the revised sin tax law. ......
TRANSCRIPT

For comments, suggestions or further inquiries please contact:
Philippine Institute for Development Studies Surian sa mga Pag-aaral Pangkaunlaran ng Pilipinas
The PIDS Discussion Paper Series constitutes studies that are preliminary and subject to further revisions. They are being circulated in a limited number of copies only for purposes of soliciting comments and suggestions for further refinements. The studies under the Series are unedited and unreviewed.
The views and opinions expressed are those of the author(s) and do not necessarily reflect those of the Institute.
Not for quotation without permission from the author(s) and the Institute.
The Research Information Staff, Philippine Institute for Development Studies 18th Floor, Three Cyberpod Centris – North Tower, EDSA corner Quezon Avenue, 1100 Quezon City, Philippines Tel Numbers: (63-2) 3721291 and 3721292; E-mail: [email protected] visit our website at http://www.pids.gov.ph
December 2016
Health Financing for the Poor in the Philippines: Final Report
DISCUSSION PAPER SERIES NO. 2016-37
Michael R. Cabalfin

Health Financing for the Poor in the Philippines:
Final Report
Michael R. Cabalfin
Abstract
Indigent membership in PhilHealth has surged in recent years, driven by the nation-wide
identification of the poor. However, the massive identification has led to the enrolment of more
members than official poverty estimates, resulting in leakages in the government’s social health
insurance subsidy. The massive enrolment has been facilitated by the incremental revenues from
the revised sin tax law. Subsidy for the poor now comprises over a third of the national health
insurance fund, effectively subsidizing health care service for other members especially the
informal sector. Hospitals also enroll the poor as well as the near poor in PhilHealth at point-of-
care and may over-subscribe the poor given the higher reimbursement relative to the premium
subsidy. The poor are covered by a No Balance Billing policy in which they are not liable to pay
hospital fees over the case rate. Despite this, close to half of the poor still incur out-of-pocket
expenses especially for medication. Close to three-fourths of the poor are also covered by the
Primary Care Benefit 2 Package which pays for out-patient medicines for certain illnesses to
prevent catastrophic conditions. Finally, close to 1 percent of the benefits for the poor is
estimated to fall under the Z Benefit Package which subsidizes catastrophic illnesses.
Keywords: health insurance, poverty, social protection
This is an output for the PIDS research project “Rapid Review of PhilHealth’s Initiatives and Programs for the
Indigents”. This report was approved by Dr. Aniceto C. Orbeta, Project Director of said research project.
Principal Investigator for the Philippine Institute for Development Studies
2
I. Research Design
This paper has ten parts including this section. This section discusses the research
objectives and methodology. The next three sections provide a general context for the
PhilHealth programs for indigents. Section II analyzes the institutions (i.e. laws, policies
and programs) governing the provision of social health insurance for the poor. Section
III looks at PhilHealth coverage and the indigent and sponsored members program. Section
IV looks at the fiscal context, sources and distribution of public spending on health.
A. Research Objectives
The Terms of Reference for the study has the following objectives pertaining to
specific PhilHealth initiatives for indigents. The relevant sections addressing the
objectives are identified in parentheses.
1. Review and provide updates on the available literature on and progress of the various initiatives for the Indigent and Sponsored Programs of PhilHealth in terms of operations and finances.
a) Point-of-Care (POC) Enrollment (Section VI)
b) No Balance Billing (NBB) (Section VII)
c) Senior Citizens (also covered in Section VII)
d) Z Benefit Package (Section VIII)
e) Primary Care Benefit (PCB) 2 Package (Section IX)
f) Others
2. Identify gaps in the implementation and program design of the above initiatives. The study looks into the gaps in indigent automatic enrolment (Section VI.D ) - whether they are aware of the their entitlements or not and their health- seeking behaviour (section VI.B)
3. Compare PhilHealth benefit utilization between paying and sponsored/indigent members using PhilHealth claims data (section V.B).
4. Provide recommendations for the improvement of the initiatives and for the advancement of the health service delivery (section X). This is done by looking at how PhilHealth work can be improved in the following areas: enrolment (section X.A), accreditation of facilities and personnel, claims processing (section X.B), support value (benefit structure) (section X.C) and provider payment systems (section X.D).
Section X also provides a summary and conclusion.
B. Scope of Work
The scope of work for the research is as follows (with the relevant sections identified):

3
1. A desk research and literature review of the available literature on recent PhilHealth initiatives particularly for the poor.
2. A comprehensive review of the various PhilHealth initiatives for the poor based on the initiatives identified in the literature review. The review includes the following (with corresponding section numbers):
3. Consult with PhilHealth officers, hospital directors and municipal/city health officers as well as experts in the field.
C. Methodology
The study is essentially an operational evaluation which determines whether the
programs are being implemented as planned by comparing program status with
objectives and targets. The operational evaluation will be helpful for prospective impact
evaluation of PhilHealth initiatives and programs on access to health services, financial
protection, and health status of the poor. The operational evaluation was
conducted using institutional analysis, public expenditure analysis, benefit incidence
analysis and beneficiary assessment.
Institutional analysis was conducted by reviewing the policies, programs,
objectives and strategies governing the implementation of social health insurance in
the country including the National Health Insurance Act, the Universal Health Care
program, the National Objectives for Health, and the National Health Financing
Strategy. It also includes an analysis of the PhilHealth policies on Point-of-Care
enrolment, No Balance Billing, Z Benefit Package, and Primary Care Benefit package.
Implementation of the programs is then assessed against these policies through case
studies involving in-depth interviews of key informants from PhilHealth-CAR, the
Baguio City social welfare office and the Baguio General Hospital and Medical Center
(BGHMC) to determine implementation processes, status and constraints.
1. Public expenditure analysis was conducted by analyzing the fiscal context in
terms of general government spending and revenues, national health spending,
government health spending, the sources of national health insurance financing
and the distribution of benefits.
2. Benefit incidence analysis was conducted to estimate the size of benefits received
by different groups especially the poor. This was undertaken using
administrative data on the number of beneficiaries by type and actual spending for
different types of beneficiaries.
3. Beneficiary assessment was undertaken by interviewing PhilHealth beneficiary
patients of BGHMC regarding their knowledge about their entitlements, their

4
health condition, the health benefits they received, their health spending and their
health- seeking behavior.
II. Introduction
The World Health Organization (2014a) defines universal health coverage as the
goal of “ensur(ing) that all people obtain the health services they need without suffering
financial hardship when paying for them.” It requires a well-managed health system
that responds to people’s priority health needs, a financial system that prevents
financial hardship of people availing health services, access to essential diagnostic and
treatment medicines and facilities, and skilled health workers.
Universal health coverage pertains to two aspects of health system performance:
health service and financial protection (World Health Organization, 2014b). Health
service includes health promotion and prevention; and treatment, rehabilitation and
palliation. Financial protection includes assistance in times of catastrophic health
spending and prevention of impoverishment due to health spending. Health spending
is catastrophic when household out-of-pocket health spending is greater than or equal
to capacity to pay (Xu, 2005).
Universal health coverage entails three specific policy goals: equitable health care
utilization, quality health care, and financial protection (McIntyre and Kuzin, 2016).
Equity pertains to the consistency between health care need and actual utilization.
Quality refers to the improvement of health status or the achievement of desired health
outcomes. Financial protection refers to health service financing to prevent
impoverishment as a result of health service payments.
Towards achieving these goals are three intermediate objectives: efficiency,
transparency and accountability. Efficiency refers to the production of as much quality
health services as possible given the resources available. Transparency refers to
people’s awareness of their rights and benefits and their ability to exercise and avail of
these. Accountability refers to the health system’s openness to public examination of
its performance against the goals and objectives set.
In view of these intermediate objectives, the health system undertakes the
following functions: revenue raising, pooling and purchasing. Revenue raising pertains
to the sources of funds, the organization of payments or modes of contributions for
financing health services and system of collection. Pooling refers to combining
revenues for the health purposes intended. Purchasing refers to the allocation of the
resources to the provision of health services. This is closely related to the design and
rationing of benefits. Rationing entails private or out-of-pocket payments for benefits
not fully supported by pooled resources or waiting time to avail of health services.

5
A. National Health Insurance Program
In 1995, the Philippine government instituted the National Health Insurance
Program aimed at providing compulsory universal health coverage to Filipinos, that is,
to provide all citizens access to financial resources for health care services. Guided by
principles of equity and solidarity, it aims to give priority and facilitate the delivery of
health care to the economically disadvantaged segment of society. Notwithstanding the
compulsory coverage, benefit entitlement is limited to enrolled members with
contributions for at least three months in the last six months.
Members are classified into five main categories: formal economy, informal
economy, indigents, sponsored members, and lifetime members (RA 10606). Formal
economy members include government and private employees, enterprise owners,
household help and family drivers; informal economy members include migrant
workers, informal sector workers, self-earning individuals, Filipinos with dual
citizenship, naturalized Filipinos, and foreign citizens (IRR RA 10606). Indigents are
defined as those with no or inadequate income for subsistence as identified by the
Department of Social Welfare and Development. Sponsored members are those whose
contributions are paid by another individual, government agency or private entity.
Lifetime members are retirees with at least 120 monthly premium contributions.
The implementing rules and regulations of the National Health Insurance Act, as
amended (National Health Insurance Corporation, 2013), identify enrolled indigents
among the members of the National Health Insurance Program. The NHIC coordinates
and enters into agreements with LGUs for the implementation program for indigents
in their areas. Indigent members are identified through social survey together with the
Community Based Information System, and evaluated annually. In 2010, the
government adopted a National Household Targeting System to identify poor
households which will be the beneficiaries of social protection programs (Office of the
President of the Philippines, 2010). PhilHealth adopted the NHTS-PR Indigents for
enrollment to the Sponsored Program (Philippine Health Insurance Corporation,
2012e).
The National Household Targeting System for Poverty Reduction (NHTS-PR) has
three main phases: preparatory phase, data collection and analysis, and validation and
finalization (Department of Social Welfare and Development, n.d.). The preparatory
phase involves the identification of areas: all provinces, municipalities, and cities are
covered; and the identification of strategy: complete enumeration (saturation) is done
for all rural barangays and in pockets of poverty in urban barangays. The data collection
and analysis phase involves a family assessment (based on FIES, LFS, and Census
indicators). A Proxy Means Test (PMT) statistical modeling is done to estimate family

6
income based on housing, access to basic services and facilities, ownership of assets,
etc.. A household is considered poor if estimated income is below the provincial poverty
threshold. Validation is done by posting the list of poor families at the barangay to
gather community feedback. A municipal level validation committee acts on any
complaints before the list is finalized.
Apart from indigents, there are sponsored members. These include members of the
informal economy not qualified for full subsidy sponsored by the LGUs and/or Congress
and other sponsors including the National Government. It also includes DSWD-
sponsored orphans, abandoned and abused minors, out-of-school youths, street
children, persons with disability (PWD), senior citizens and battered women. The local
government units may also sponsor barangay health workers, nutrition scholars,
barangay tanods, and other barangay workers and volunteers. Un-enrolled indigent
women who are about to give birth are also sponsored by the national government
and/or LGUs, legislative sponsors, and the DSWD. Non-members who are assessed and
classified as poor or near poor and members not covered due to lack of qualifying
contributions assessed and classified as poor or near poor are also sponsored by hospitals
at point-of-care.
B. Universal Health Care Program
In 2010, the Department of Health embarked on the Aquino Health Agenda for
Achieving Universal Health Care for All Filipinos (Department of Health, 2010a). It
aims to improve financial risk protection through the expansion of NHIP enrolment
and benefit delivery, improve access to quality hospitals and health care facilities, and
attain the health-related Millennium Development Goals. To achieve these objectives,
the agenda employs six instruments: health financing, service delivery, policy
standards and regulation, governance, human resources, and health information.
The overall goal of the Universal Health Care program of the government is better
health outcomes through equitable access to affordable health care. The universal
health care program has three final outcome indicators.
1. Financial risk protection - the poor are to be protected from the financial impacts of health care use as measured in terms of the benefit delivery ratio.
2. Improved access to quality hospitals and health care facilities
3. Attainment of the health-related Millennium Development Goals the government aims to reduce maternal and child mortality, morbidity and mortality from TB and malaria, and the prevalence of HIV/AIDS, in addition to being prepared for emerging disease trends, and prevention and control of non-communicable diseases.

7
C. Financial Risk Protection
In view of the foregoing overall outcomes, the government endeavors to provide
sustained health financing and responsive health system. Specific indicators and
targets are identified in the National Objectives for Health 2011-2016 (Department of
Health, 2011):
4. Toward financial risk protection, the government aims to
a) expand enrollment to the National Health Insurance Program from 62 percent in 2010 to more than 90 percent by 2016;
b) augment and effectively use resources to protect the poor and vulnerable. The government aims to reduce out-of-pocket health expenditures from 54.3 in 2007 to less than 50 percent by 2016;
c) increase PhilHealth spending from 9 percent in 2007 to 19 percent of Total Health Expenditure by 2016;
d) promote quality health services at accredited facilities through no balance billing arrangements for sponsored members. It hopes to make all government hospitals have no balance billing for poor households by 2016.
5. PhilHealth is also implementing various initiatives in view of the overall goals
including:
e) Point of Care Enrolment Program: the Point of Care Enrolment Program provides coverage and considers as sponsored members at the time of admission to a government health facility patients and their families whose incomes are less than or are not over 40 percent higher than the regional poverty threshold, or those with special circumstances or members of particular sectors as defined by law (Philippine Health Insurance Corporation, 2013).
f) No Balance Billing Policy: Under the no balance billing policy, members shall not pay for fees in excess of the prescribed case rates for common medical and surgical services (Philippine Health Insurance Corporation, 2011a).
g) Z Benefit Package: the Z Benefit Package “aims to increase financial risk protection for PhilHealth members” by reimbursing payments for “catastrophic” illnesses at prescribed rates (Philippine Health Insurance Corporation, 2012b).
h) Primary Care Benefit 2 package: the Primary Care Benefit 2 Package pays for “out-patient medicines for PhilHealth qualified members or dependents with hypertension, diabetes and dyslipidemia, long before their conditions become catastrophic” (Philippine Health Insurance Corporation, 2014b)
i) Senior Citizen coverage: in 2014, Republic Act 10645 established “mandatory PhilHealth coverage for all senior citizens” (Republic of the Philippines, 2014).

8
III. Enrolment and coverage
PhilHealth initially catered to formal economy members, particularly
government and private employees covered by the erstwhile Medicare program. In
1995, their enrolment rate was estimated at less than half (roughly 47%). Various
programs were launched over time to cover other sectors including the sponsored
program in 1996, the individually-paying program (IPP) in 1999, the non-paying
program in 2002, and the program for overseas workers in 2005 (Romualdez, et al.,
2011). In 1997, 14,520 indigents were enrolled under the sponsored program and in
1999, 32,944 informal economy members including overseas workers were enrolled
under the IPP (PhilHealth, 2003).
Figure 1 shows PhilHealth enrolment1 and coverage2 for 2006-2015. The growth
of PhilHealth enrolment has been slow in 2006-2010, averaging only 3.5 percent per
annum. 2011 saw a breakthrough in PhilHealth enrolment, growing by 54 percent. This
is due to the massive enrolment of indigents. 2014 again saw a huge jump in enrolment,
by 36 percent, due to the surge in indigent enrolment. With the progress in enrolment,
the target of >90% enrolment has been achieved (even surpassed) in 2014. Moreover,
the estimated beneficiaries based on enrolment in 2015 are 5 percent higher than the
projected population! This is because dependents are estimated by sector using
multipliers (Department of Health, 2010) rather than counted from member records.
In 2013, PhilHealth started monitoring coverage rate, instead of enrolment rate.
Coverage rate increased from 67 percent in 2013 to 92 percent in 2015.
PhilHealth membership increased from 16.4 million in 2007 to 22.4 million
members in 2010 (Manasan, 2011). Membership increased in all categories with
sponsored indigents showing the most substantial increase, from 2.7 million in 2007
to 6 million in 2010. Consequently, the share of indigents to total membership
increased from 17 percent to 27 percent. On the other hand, the share of private
employees dropped from 43 percent to 35 percent while that for government employees
decreased from 11 to 9 percent. The shares of non-paying members, individually paying
members and overseas workers are not much changed. In 2010, their shares were as
follows: individually paying members (16.7%), overseas workers (10.4%), and non-
paying members (2.2%). Coverage rate for all members increased from 40 percent in
2007 to 43 percent in 2010. Coverage rates have increased especially for indigents
1 The National Health Insurance Act of 1995 defines enrollment as “the process... (of) enlist(ing) individuals as
members or dependents covered by the Program.”
2 Coverage is defined as “the entitlement of an individual, as a member or as a dependent, to the benefits of the
Program.”

9
(73%-154%) and individually-paying members (25%-33%). Coverage rates decreased
for government employees (68%-65%) and private employees (55%-54%).
Figure 1: PhilHealth Enrolment and Coverage, 2006-2015
Source: PhilHealth Corporate Planning Department
The excessive enrolment of indigents in 2009-2010 is attributed to poor targeting
(Manasan, 2011). In fact, only 21 percent of those identified as poor by NHTS were
sponsored and only 15 percent of those sponsored were considered poor. With the
targeting undertaken by barangay officials, it was prone to political patronage. On the
other hand, the significant under-enrolment in the employed program is attributed to
the difference in definition of formal employment between PhilHealth and NSO’s Labor
Force Survey and non-compliance of employers in enrolling their employees to
PhilHealth.
In 2011, most provinces had moderate to excessive leakage rates for indigents but
some also experience moderate to severe under-enrolment (Silfverberg R. R., 2014).
The growth in enrolment is attributed to the introduction of the outpatient benefit
package and capitation program in 2000, new benefit packages (e.g. TB-DOTS, MCP)
in 2003, increasing engagement of local government units, and the Plan 5M/Plan
2.5M. Leakages were more likely in provinces with medium human development, in
16.3 15.9 16.5
20.218.1
27.9 28.531.3
42.5
47.3
68.4
64.5
68.7
53.4
47.1
78.480.9
76.9
98.9
106.3
79%
73%76%
58%
74%
82%84%
79%
99%
105%
67%
87%
92%
0%
20%
40%
60%
80%
100%
120%
-
20
40
60
80
100
120
2006 2007 2008 2009 2010 2011 2012 2013 2014 2015
Mill
ion
s
Enrolled Members Estimated Beneficiaries Enrollment Rate Coverage Rate

10
first-class provinces, and less likely in provinces with high severity of poverty and in
provinces with high administrative governance ranking. Under-enrolment is less likely
but leakages more likely among local governments with greater resource generation
capability. Under-enrolment and leakages are both more likely among more
participatory local governments. The presence of accredited health facilities also tends
to increase leakages.
As of 2012, the employed program had enrolment rates of 76 percent (moderate
enrollment) for the government sector and 104% (full enrolment) for the private sector
(Silfverberg, 2013). Enrolment rate in the private sector was found to be higher for
larger enterprises. For the government sector, enrolment rate was found to be
positively related to local GDP per capita. Enrolment rate for individually paying
members was 80 percent. Enrolment rate was found to be positively related to the
number of private hospitals, the availability of health services proxied by the ratios of
hospital beds and health professionals to the population, and membership in certain
sectors like mining considered hazardous.
A. Membership, 2010-2015
PhilHealth membership increased from over 22.4 million in 2010 to almost 40.6
million in 2015. Figure 2 shows the composition of membership over time.
Membership increased by 5.5 million in 2011 due mainly to the massive enrolment of
indigents numbering 4.2 million. There was minimal growth in 2012, with the growth
in private, migrant worker, individually paying and indigent membership mostly offset
by the decrease in sponsored members. Enrolment decreased in 2013 due to reductions
in individually paying and migrant worker membership. There was a resurgence in
membership in 2014 with indigent enrolment almost tripling and the mandatory
enrolment of senior citizens, although the latter is largely offset by the decrease in
sponsored members. The number of indigent members surged as more families within
the same household have been identified as poor. The rise in membership in 2015 is
due mainly to increases in private employee, indigent and senior citizen memberships.
The further rise in the number of indigents is due to the inclusion of members of the
4Ps and Modified Cash Transfer Program of DSWD.

11
Figure 2: PhilHealth Membership by Category, 2010-2015
Source: PhilHealth Corporate Planning Department
7.9 8.8 9.6 10.3 11.0 11.8
1.92.0 2.0 2.1 2.0 2.0
2.32.6
2.8 1.0 1.0 0.93.74.3
5.1
2.1 2.42.5
4.24.6
5.2
14.715.3
6.0
5.33.7
4.5
0.81.0
0.5
0.6 0.7
0.8
0.91.03.5
5.9
22.4
27.9 28.4
25.8
36.5
40.6
0
5
10
15
20
25
30
35
40
45
2010 2011 2012 2013 2014 2015
Mill
ion
s
PRIVATE GOVERNMENT MIGRANT WORKER
INDIVIDUALLY PAYING INDIGENT SPONSORED
LIFETIME SENIOR CITIZENS TOTAL

12
Figure 3: Distribution of PhilHealth Members, 2015
Source: PhilHealth Corporate Planning Department shows the trend in the
distribution of members by category. With their enrolment starting in 2011, the share
of indigents was 15 percent. With the continued increase in their membership in 2012-
2013 and the surge in enrolment in 2014, the share of indigents grew to 40 percent in
2014. This share slightly decreased in 2015 with the relative increase in the share of
senior citizens. While the share of lifetime members increased only slightly particularly
in 2013, the mandatory coverage of non-paying senior citizens starting in 2014 yielded
a share of 10 percent, increasing to 14 percent in 2015. While the share of indigents
generally increased, the share of sponsored members decreased from 27 percent in
2010 to 3 percent in 2015. The shares of informal sector members and migrant workers
also generally decreased, from 17 percent to 5 percent for the former and from 10
percent to 2 percent for the latter. Although the shares of sponsored, informal sector
and migrant worker members decreased, former members, especially of the two former
categories, would have been absorbed into the indigent program. While the number of
private employee members increased at a relatively constant rate, their share to total
membership fluctuated but generally decreased from 35 percent in 2010 to 29 percent
in 2015. Finally, although the number of government employee members was relatively
unchanged, their share decreased from 9 percent to 5 percent.
35 32 3440
30 29
97
7
8
5 5
10
910
4
3 2
17
1617
8
65
15
16
20
4038
2719
1317
2
3
2 2 2 3
3
2
1014
0
10
20
30
40
50
60
70
80
90
100
2010 2011 2012 2013 2014 2015
PRIVATE GOVERNMENT MIGRANT WORKER INFORMAL SECTOR
INDIGENT SPONSORED LIFETIME SENIOR CITIZENS

13
Figure 3: Distribution of PhilHealth Members, 2015
Source: PhilHealth Corporate Planning Department
In 2011, there were 5.26 million identified poor families out of 10.9 million
assessed. This translates to 48.2 percent of households assessed considered poor. In
contrast, there are 4.7 million poor households based on the 2012 Family Income and
Expenditures Survey, or 22.3 percent poverty incidence among families. This translates
to 12 percent more NHTS-poor families than FIES-poor families. This confirms
leakages in the indigent program. The indigent PhilHealth members numbering 4.2
million comprise 80 percent of the NHTS-poor households and 89 percent of the FIES
poor households. The indigent PhilHealth members are 3.7 times the poor labor force
in 2011 (labor force multiplied by the poverty incidence among the population. In the
2015 round, out of 15.1 million households assessed, 5.1 million (34%) were considered
poor.
B. Coverage
Table 1 shows the enrolment rates by membership category for 2015. The
enrolment rates are analyzed with reference to the 2010 figures (Manasan, 2011).
Coverage rate for indigents over the poor labor force (138%) continues to be the highest
and in excess of complete coverage. However, it is less than in 2010 calculated over
35 32 3440
30 29
97
7
8
5 5
10
910
4
3 2
17
1617
8
65
15
16
20
4038
2719
1317
2
3
2 2 2 3
3
2
1014
0
10
20
30
40
50
60
70
80
90
100
2010 2011 2012 2013 2014 2015
PRIVATE GOVERNMENT MIGRANT WORKER INFORMAL SECTOR
INDIGENT SPONSORED LIFETIME SENIOR CITIZENS

14
poor households. With indigent enrolment (sponsored program in 2010) quadrupling
between 2010 and 2015, coverage rate over poor households would rise to 338 percent.
A separate coverage rate is computed for sponsored members (36%) over the near poor
population.3 Coverage rate for the informal sector4 over the self-employed workers is
at 22 percent. This is lower than the combined coverage rate for individually paying
members and overseas workers of 33 percent in 2010 over the members of the informal
sector. The current estimates include a separate coverage rate for overseas workers of
39 percent.
Table 1: PhilHealth Enrolment Rates by Membership Category, 2015
Category Population (thousands)
Members (thousands) Enrolment Rate
Private 18,185 a 11,770 65%
Government 3,308 b 2,035 62%
Informal Sector 11,087 c 2,481 22%
Migrant Worker 2,377 d 930 39%
Indigents 11,101 e 15,289 138%
Sponsored Members 2,911 f 1,050 36%
Senior Citizens 7,844 g 5,868 75%
Lifetime Members 1,002
Total 56,812 40,425 71% Labor Force Survey, October 2015: Employed who
a/ Worked for Private Establishment,
b/ Worked for Government/Government Corporation
c/ Self-employed without any paid employee
d/ Number of Overseas Contract Workers, 2015 Survey on Overseas Filipinos
e/ Labor Force * Poverty Incidence among Population (%)
f/ Near Poor Households as of 2012 (Paqueo, Orbeta, Cortes, & Cruz, n.d.) * Poverty
Incidence among Population / Poverty Incidence among Families
g/ Population aged 60 and above, 2015 Projection, 2000 Census
Lifetime members and senior citizens combined have the second highest coverage
rate at 75 percent. This is mainly due to the mandatory coverage of senior citizens
starting in 2014. Under-coverage continues for private employees (although coverage
rate rose to 65 percent) as well as for government employees (with coverage rate further
decreasing to 62 percent). This may be due to persistent contractualization of
3 The hospital-sponsored program covers the poor (not captured in the indigent program) and the near poor whose
income is no more than 40 percent greater than the poverty threshold. Paqueo, Orbeta, Cortes, & Cruz (n.d.) estimate
a near poor household population of 2.99 million in 2012. This is adjusted by the ratio of poverty incidence among
the population to the poverty incidence among families.
4 This excludes workers in private households, paid workers in family-owned enterprises as formal workers, and
enterprise owners as PhilHealth considers these as part of the formal economy.

15
employees in private businesses and even in government, a practice which the new
administration seeks to stop.
C. Regional coverage
Figure 4 shows the distribution of members by region in 2015. The regions of
Luzon account for almost six out of ten members. Visayas regions account for less than
one fifth of the members while the regions of Mindanao constitute less than one fourth.
The national capital has the largest share at 16 percent followed by CaLaBaRZon (14%)
and Central Luzon (10%). Cordillera has the lowest share at 1.7 percent, followed by
Caraga (2.5%) and MiMaRoPa (2.8%). Coverage rates across regions relative to the
labor force are given in Figure 5. Under-coverage ranges from 6 percent in Davao to 24
percent in Cagayan Valley. Over-coverage ranges from 15 percent in ARMM, 19 percent
in Zamboanga, and 23 percent in NCR to 40 percent in Eastern Visayas. Calabarzon
has complete coverage.
Figure 4: Distribution of Members by Region, 2015
Source: PhilHealth Corporate Planning Department
Cordillera1.7%
lIocos4.8%
Cagayan Valley3.0%
Central Luzon9.7%
National Capital15.8%
CaLaBaRZon13.9%
MiMaRoPa2.8%
Bicol5.3%
Western Visayas
7.6%
Central Visayas7.4%
Eastern Visayas4.0%
Zamboanga Peninsula4.2%
Northern Mindanao4.7%
Davao4.7%
SoCCSKSarGen4.1%
Caraga2.5%
ARMM3.8%

16
Figure 5: PhilHealth coverage rate by region, 2015
Source of basic data: PhilHealth, Labor Force Survey 2015
Figure 6 shows the distribution of members for each region in 2015. In most
regions, indigent members have the largest share. This is true for the entire Visayas
and Mindanao where indigent members’ share ranges from 37 percent in Davao to 86
percent in ARMM. For most regions in Luzon, indigents also have the largest share,
ranging from 37 percent in Ilocos to 61 percent in Bicol. On the other hand, the share
of indigents is second only to those of private employees in the national capital and
adjoining regions Central Luzon and CaLaBaRZon, and in Central Visayas. There are
generally less indigents in the regions of Luzon but there are more sponsored
beneficiaries. On the other hand, there are more indigents in Visayas and Mindanao and
less sponsored beneficiaries. This is said to be because local governments in Luzon
have more income.
85%89%
76%
87%
123%
101%
85% 83%89%
85%
140%
119%
89%94%
90% 90%
115%
0%
20%
40%
60%
80%
100%
120%
140%
160%

17
Figure 6: Distribution of Membership by Region, 2015
Source of basic data: PhilHealth Corporate Planning Department
Table 2 shows the comparative poverty incidences by region. In Metro Manila,
the NHTS poverty incidence is almost 12 times the FIES poverty incidence. Across
other regions, NHTS poverty incidence ranges from 1.3 to 3.8 times more than the FIES
poverty incidence. However, the shares of poor show a different picture. Luzon has a
bigger share of NHTS poor (41%) compared to its share of the FIES poor (37%). This is
true for most regions, especially the National Capital Region whose share of NHTS poor
is (6%) is almost three times its FIES share of poor (2.2%), except Cordillera and
Cagayan Valley. On the other hand, Visayas has a smaller share of NHTS poor (20%)
compared to its share of FIES poor (25%) and this is true across its three regions.
Mindanao has a slightly higher share of NHTS poor (39%) compared to its share of
FIES poor (37%). This is mainly due to the much larger share of NHTS poor in ARMM
(10.1%) compared to the FIES poor (5.6%). While the shares of NHTS poor are also
larger than the shares of FIES poor in Zamboanga Peninsula and Caraga, these are
offset by the lower NHTS shares of poor in Northern Mindanao, Davao and
Soccsksargen.
39%37%
42%
23%
12%
19%
58%61% 47%
38%
62%68% 51%
37%
49%56%
86%
7%
4%4%
3%3%
2%
2%2%
3%2%
2%
4%2% 4% 5%
1%
3%
3%
2%2%
3%2%
1%2%
3%2% 2%
2%
3%3%
2%3%
0%13%
21%16%
21%15%
19%15%
10%15% 12% 13%
6%11% 14% 12% 9%
3%
0%
10%
20%
30%
40%
50%
60%
70%
80%
90%
100%
PRIVATE GOVERNMENT MIGRANT WORKER INFORMAL SECTOR SELF-EARNINGINDIVIDUAL
INDIGENT SPONSORED LIFETIME SENIOR CITIZENS

18
Table 2: NHTS Poverty 2011 and FIES Poverty 2012
Region NHTS 2011 FIES 2012 NHTS Poor / FIES Poor
NHTS Poverty / FIES Poverty Households
Assessed Poor Households
Poor / Assessed (%)
Share of Poor
Families (thousands)
Poor Families (thousands)
Poverty Incidence
Share of Poor
National Capital 697,443 316,823 45.4 6.0 2917 111 3.8 2.4 2.9 11.9
Cordillera 234,233 79,816 34.1 1.5 375 85 22.6 1.8 0.9 1.5
I Ilocos 543,948 247,882 45.6 4.7 1105 184 16.7 3.9 1.3 2.7
II Cagayan Valley 408,233 118,118 28.9 2.2 771 153 19.8 3.3 0.8 1.5
III Central Luzon 712,255 322,622 45.3 6.1 2386 292 12.2 6.2 1.1 3.7
IV-A CALABARZON 912,988 389,811 42.7 7.4 3082 345 11.2 7.4 1.1 3.8
IV-B MIMAROPA 513,759 242,633 47.2 4.6 638 181 28.4 3.9 1.3 1.7
V Bicol 775,014 461,242 59.5 8.8 1165 398 34.1 8.5 1.2 1.7
VI Western Visayas 957,128 385,518 40.3 7.3 1604 396 24.7 8.5 1.0 1.6
VII Central Visayas 781,572 314,654 40.3 6.0 1577 454 28.8 9.7 0.7 1.4
VIII Eastern Visayas 719,273 335,208 46.6 6.4 902 335 37.2 7.1 1.0 1.3
IX Zamboanga Peninsula 599,951 369,239 61.5 7.0 772 285 36.9 6.1 1.3 1.7
X Northern Mindanao 691,689 338,749 49.0 6.4 976 348 35.6 7.4 1.0 1.4
XI Davao 547,775 272,933 49.8 5.2 1078 308 28.6 6.6 0.9 1.7
XII Soccsksargen 581,853 296,043 50.9 5.6 988 371 37.5 7.9 0.8 1.4
XIII Caraga 405,310 232,301 57.3 4.4 532 182 34.1 3.9 1.3 1.7
ARMM 827,032 531,526 64.3 10.1 557 261 46.9 5.6 2.0 1.4
TOTAL 10,909,456 5,255,118 48.2 100.0 21425 4688 21.9 100.0 1.12 2.2
Source of data: data.gov.ph; Philippine Statistical Association

19
D. LGU-Sponsored Members: Baguio City
In the Cordillera, out of 232,228 households assessed, 77,811 (33.5%) were
indigents. In Benguet, 17,947 poor households were identified which is 31.4% of 57,118
assessed. In Baguio City, 15,083 households were assessed, of which 3,595 (23.8%)
were indigents, 77.5% of whom are covered by 4Ps. Out of 128 barangays, 15 were
considered pockets of poverty. Together with the NHTS Indigents, there were 833
LGU-sponsored members, for a total of 4,428 poor households. Most of the poor are
said to be transients / immigrants. Out of 4,223 poor families identified in the CBMIS,
3,806 were confirmed poor by the NHTS. Of these, the health insurance of 2,920 was
covered by the 4Ps. The rest was sponsored by the local government.
To obtain a picture of local government sponsorship of PhilHealth members, a
case study of Baguio City was conducted. As with other LGUs, the indigent program
started in 2001 as “Medicare para sa Masa” (Medicare for the masses). The poor were
identified using the Community-Based Management Information System (CBMIS)
under the government’s Minimum Basic Needs (MBN) approach. In 2009, the poor
were identified using the Local Poverty Indicators Monitoring System (LPIMS) with
the assistance of the National Statistical Coordination Board (NSCB). In 2011 and 2014,
the poor were identified using the NHTS under the government’s Bottom-up
Budgeting.
Figure 7 shows the number of LGU-sponsored members from 2001 to 2014
against the premium contribution. From 2001 to 2013, the local government budget
for PhilHealth sponsorship of the poor was P1Million per year. The number of
sponsored families decreased from 3,000 in 2001 to 1,600 in 2007 as the premium
increased from P400 to P800. The sponsorship decreased further to 800 in 2011-12 as
the premium increased further to P1,200. In 2014, while the local government budget
increased to P2 Million with additional funding from the congressman's PDAF, the
premium also increased to P2,400 restricting the number of beneficiaries. Out of 2,900
poor (based on the poverty threshold), only 833 were sponsored (based on the food
threshold) due to the limited budget. These include community volunteers, street
sweepers, barangay health workers, barangay nutrition scholars, and barangay tanods.
The rest were referred to the hospital point-of-care program. Based on this experience
the CSWO believes that the local government needs more funds to sponsor the poor.
Also, premium payments should be lower for self-employed, youth, women, and those
with irregular employment.

20
Figure 7: LGU-sponsored members and premium contributions, Baguio City
Source of data: City Social Welfare Office
Of the identified poor, 60 percent are estimated to have availed of their
PhilHealth benefits. Prior to the PhilHealth program, the poor would line up for
financial assistance at the CSWO for medication, laboratory tests to operation.
Each of the city’s 15 social workers would have 25 clients with health related concerns.
With the PhilHealth program, the cases decreased to 10-12 clients per social worker per
day and these relate more to chronic cases where their PhilHealth benefits have been used
up.
IV. Fiscal Context
The fiscal environment is important to the performance of the health system,
particularly to the health financing activities it can undertake and the universal health
coverage goals it can achieve (McIntyre and Kuzin, 2016). Fiscal capacity or the ability
and willingness of the government to marshal public resources is important as it
enables the government to allocate resources for health programs and services. The
greater the public resources for health, the less dependent the system is on out-of-
pocket health spending and the lower the risk of catastrophic health condition.
3000
1600
800 800
Php400
Php800
Php1,200
Php2,400
0
500
1000
1500
2000
2500
3000
3500
2001 2007 2011 2014
LGU-sponsored Premium (Pesos)

21
Important fiscal indicators include government spending to GDP ratio, government
revenue to GDP ratio, budget surplus or deficit and government debt to GDP ratio.
Figure 8 shows the fiscal position of the Philippines. The fiscal capacity of the
Philippines is low. While government spending rose from 18 percent of GDP in 2011 to
19.7 percent in 2015, it remains low. The “rule of thumb” for medium government
spending to GDP is at least 25 percent. Government revenue is similarly low. While it
has been increasing from 16.5 percent in 2010, it remains below 20 percent as of 2015.
The government budget is generally on balance, although it turned negative in 2009-
2010 and somewhat positive in 2014. This means that there is no scope for increasing
government spending on health. The Philippines has achieved a “prudent” government
debt-to-GDP ratio of 35.9 percent in 2015, down from 51.6 percent in 2006. For
developing countries, a government debt-to- GDP ratio of no more than 40 percent is
considered “prudent”. Debt-servicing is therefore sustainable and does not threaten
government spending on health.
Figure 8: Fiscal Position
Source of data: IMF Fiscal Monitor
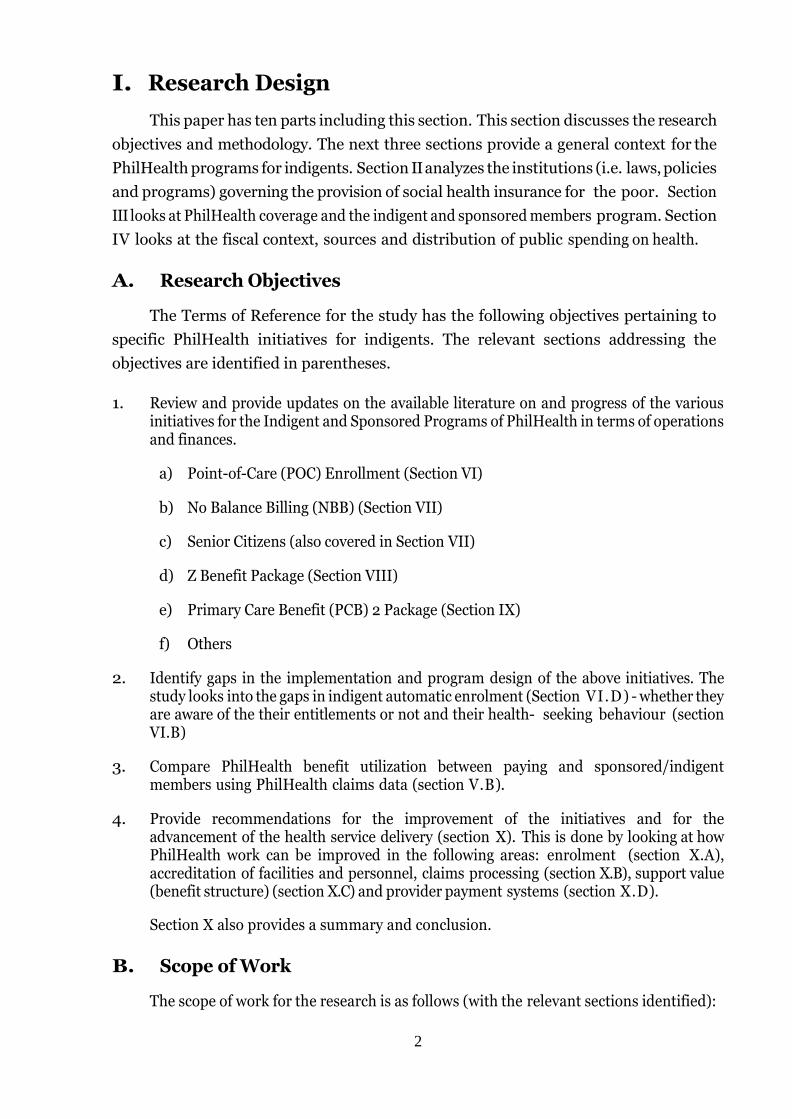
Figure 9 shows the sectoral distribution of public spending for 2004-2016. Social
spending only changed slightly between 2004 and 2010, averaging about 28 percent of
-10
0
10
20
30
40
50
60
2006 2007 2008 2009 2010 2011 2012 2013 2014 2015
Government Expenditure to GDP Government Revenue to GDP
Government Balance Debt to GDP

22
total government spending. Social spending jumped in 2011-2013, averaging around
34 percent. However, it declined in recent years, averaging around 30 percent in 2014-
2016.
23
Figure 10 shows the distribution of public spending on social services. The jump in
social spending in 2011-2013 is mainly due to the increase in the share of social security
and labor welfare to 8 percent from an average of 4.8 percent in 2004-2010. The jump
in social spending also reflects the movements in education and health spending, each
contributing around 1 percentage point in the increase in 2011-2013. However, while
the share of health spending jumped from 2.8 percent 2013 to 6.9 percent 2015, the
share of total social spending actually decreased following the decrease in the shares of
education spending and social security and labor welfare.
Figure 9: Sectoral Distribution of Public Expenditures, 2004-2016
Source: DBM Fiscal Statistics Handbook (2004-2013), BESF (2016)
0
5
10
15
20
25
30
35
40
2004 2005 2006 2007 2008 2009 2010 2011 2012 2013 2014 2015 2016
ECONOMIC SERVICES SOCIAL SERVICES DEFENSE
GENERAL PUBLIC SERVICES DEBT SERVICE

24
Figure 10: Distribution of Public Expenditures on Social Services
Source: DBM Fiscal Statistics Handbook (2004-2013), BESF (2016)
In examining the health financial system, it is important to look at the level, trend
and composition of health spending (McIntyre and Kuzin, 2016). Important indicators
include the total health expenditure as a proportion of GDP (THE/GDP), the general
government health expenditure as a proportion of GDP (GGHE/GDP), per capita
government health expenditure, general government health expenditure as a
proportion of total health expenditure (GGHE/THE), private health expenditure as a
proportion of total health expenditure (PHE/THE), out-of-pocket spending as a
proportion of total health expenditure (OOPS/THE), and voluntary health insurance
as a proportion of total expenditure on health (VHI/THE).
Figure 11 shows the total and government health expenditures in US and PPP
Dollars. Total health spending per capita (PPP) rose from $167 in 2005 to $329 in 2014.
In 2013, per capita health spending in the Philippines was $300, lower than the
averages for South Asia ($321), East Asia and the Pacific ($589), and even for low
middle income countries ($310). Nevertheless, health spending per capita increased as
a percentage of GDP per capita from 3.9% in 2005 to 4.7% in 2014 (Figure 12),
achieving the target of 4-4.5% before 2016. The share of government in health
expenditure generally decreased between 2005 and 2014. From 38.4% in 2005, the
share of government spending decreased to 34.3% in 2014. Corollary to this, the share
0.0
2.0
4.0
6.0
8.0
10.0
12.0
14.0
16.0
18.0
20.0
2004 2005 2006 2007 2008 2009 2010 2011 2012 2013 2014 2015 2016
Education, Culture, and Manpower Development Health
Social Security and Labor Welfare Subsidy to Local Government Units

25
of private health spending increased from 61.6% to 65.7%. Government spending on
health as a percentage of total government spending fluctuated between 2005 and 2014
but rose from 8.1% in 2011 to 10% in 2014, achieving the target of 6%. In 2013, this
share was 8.9 percent, higher than the average for South Asia (8.3%) but lower than
the average for East Asia and the Pacific (11.5%) and even for low income countries
(10.8%). Of the total government spending on health, the share of social security
increased from 21% in 2006 to 41% in 2014. Of the total private expenditure on health,
the share of out-of-pocket expenses decreased from 85.3% in 2006 to 81.7% in 2014
while that of voluntary health insurance increased from 9.6% to 13.1%. In 2013, out-of-
pocket spending as a share of total health spending was 56.3%. This is still far from the
target of 45% and higher than the averages for South Asia (50.3%), East Asia and the
Pacific (27.5%) and low income countries (42.3%). In 2014, the proportion of social
insurance to total health spending (share of social insurance to government health
spending times share of government health spending to total health spending) was 14
percent.
Figure 11: Health Expenditures in US$ and PPP Int’l $
Source: WHO Global Health Expenditure Database
0
50
100
150
200
250
300
350
2005 2006 2007 2008 2009 2010 2011 2012 2013 2014
Per capita total expenditure on health at average exchange rate (US$)
Per capita total expenditure on health (PPP int.$)
Per capita government expenditure on health at average exchange rate (US$)
Per capita government expenditure on health (PPP int.$)

26
Figure 12: Relative Health Expenditures
Source: WHO Global Health Expenditure Database
The sources of revenue can be classified into mandatory prepayment, voluntary
prepayment, out-of-pocket spending and foreign sources (McIntyre and Kuzin, 2016).
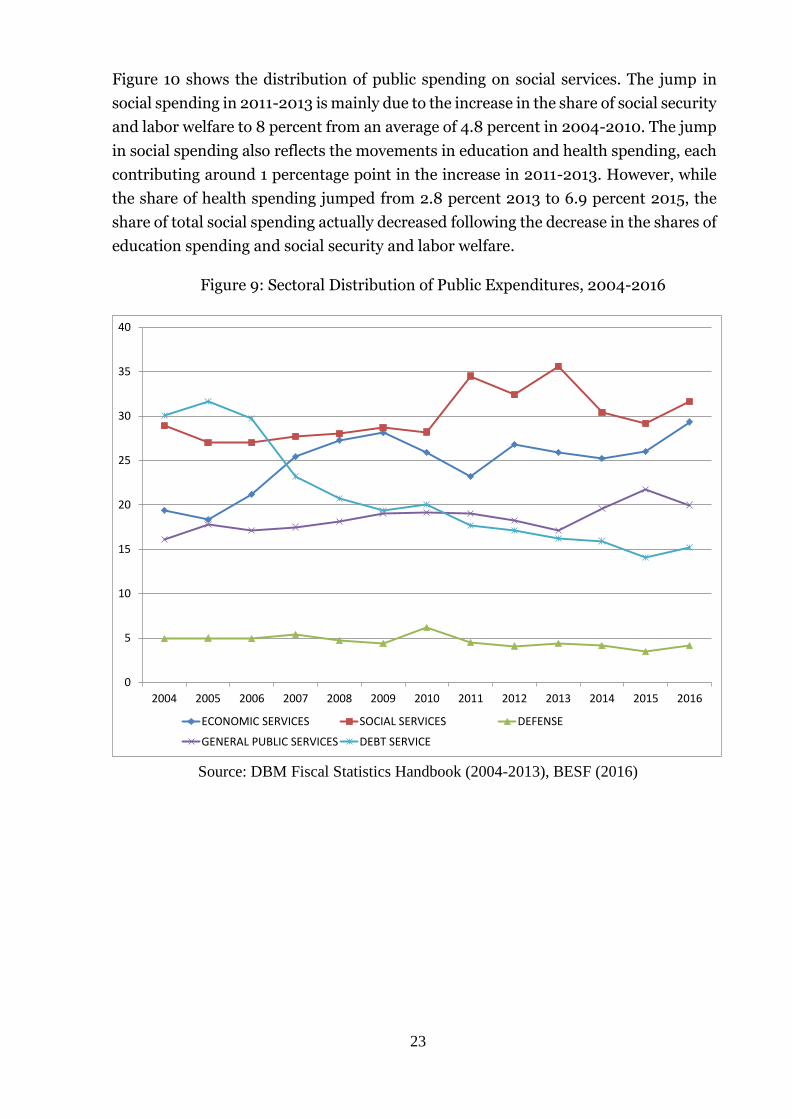
In 2013, the Philippines’ total health expenditure was over 526 Billion Pesos. Figure 13
shows the distribution of national health spending in 2013.
Mandatory pre-payment constitutes 30.4 percent of total health spending. This
includes general spending by the national government (11.9%) and local governments
(7%), social health insurance (11.5%) from earmarked revenues (3.5%) and member
contributions (8%). National government spending includes spending by the
Department of Health (6.8%), other national agencies with health-related activities
(4.8%) and loans and government counterpart for foreign-assisted projects (0.3%).
Social insurance is financed almost entirely by the National Health Insurance Program,
partly by a subsidy for indigents (3.5%) from earmarked revenues.
Voluntary prepayment schemes constitute 8.7% of total health spending while
private sources constitute 4 percent, and foreign sources constitute 1.4 percent. The
existence of prepayment schemes apart from the national health insurance program
indicates fragmentation in pooling arrangements. Independent health spending by
0
10
20
30
40
50
60
70
80
90
2005 2006 2007 2008 2009 2010 2011 2012 2013 2014
Total expenditure on health as % of Gross domestic product
General government expenditure on health as % of total health expenditure
General government expenditure on health as % of total government expenditure
Social Security expenditure on health as % General government expenditure on health
Out-of-Pocket expenditure as % of private expenditure on health

27
local governments, given the devolution of health services, also contributes to the
fragmentation (Department of Health, 2010). The higher share of compulsory
prepayment over voluntary prepayment is good progress toward universal health care.
Private out-of-pocket expenditure constitutes the bulk (56.3%) of health spending
and remains a financial barrier to access to health services. Ulep & Dela Cruz (2013)
studied the distribution of out-of-pocket expenditures. They found that in 2012, half of
out-of-pocket spending went to medical products, of which almost two-thirds went to
pharmaceutical products and almost three-tenths went to supplements. The share of
medical products to out-of-pocket spending was higher among the poor (59% for the
1st quintile) than among the rich (46% for the 5th quintile). On the other hand, the
shares of inpatient and outpatient services were higher among the rich (37% and 17%)
than among the poor (28% and 13%). For inpatient services, the share of spending for
public hospitals decreased with income while the share of spending for private
hospitals increased with income. The burden of health payments, which is share of out-
of-pocket spending to income over subsistence level, increased from 2.8 percent in
2000 to 4.8 percent in 2012 and increased with income. The share of households
incurring catastrophic health payments (out-of-pocket health spending over 40% of
their income) has increased from 0.5% in 2000 to 1.5% in 2012. The proportion would
be higher if the 10% threshold of the World Bank is used instead of the 40% threshold
of WHO. In 2012, the average out-of-pocket spending of the poorest quintile was 11.5%
of its disposable income.
28
Figure 13: Distribution of National Health Spending, 2013
Source of data: NSCB National Health Accounts
In 2014, the national government earned almost Pesos 1.95 Trillion in revenues
89 percent of which are from tax revenues (Commission on Audit, 2014). Almost four-
fifths of tax revenues come from business taxes (almost 45%) and income taxes (33%).
The rest of the tax revenues come from excise tax (12.3%), documentary stamp tax
(4.2%), import duties (3.3%), motor vehicle user charge (1.4%), estate taxes (0.7%) and
other taxes (0.4%).
Business income is taxed at 30 percent since 2009; before that, the tax rate was
35 percent. Individual income tax is progressive. Individual income tax is composed of
a fixed tax and a percentage tax that both increase across seven income ranges. The
percentage tax starts at 5% for annual incomes not exceeding 10,000 pesos up to 32
percent for incomes exceeding 500 thousand pesos. The fixed tax ranges from 500
pesos for incomes more than 10 thousand pesos but not more than 30 thousand pesos
to 125 thousand pesos for annual incomes greater than 500 thousand pesos. The
combined fixed and percentage taxes yield an effective tax rate of at least 5 percent to
over 25 percent.
DOH7%
Other National Government Agencies 2/
5%Loans0%
GOP counterpart
funding 0%
Local Government
7%
National Health Insurance Program
12%
Employees' Compensation
0%
Private Out-of-Pocket
56%
Life & Non-life Insurance
Companies2%
Other Private Insurance
0%HMOs
7%
Private Establishments
2%
Private Schools
1%
Rest of the World1%

29
Total revenues account for 38 percent of cash inflows of Pesos 4.9 Trillion. The
national government had a total appropriation of almost Pesos 3.1 Trillion, 93 percent
of which are current appropriations and 7 percent are continuing appropriations from
previous years. General appropriations make up 56 percent of current appropriations,
while automatic appropriations constitute 43 percent; supplemental appropriations
make 1 percent. Appropriations for health amounted to Pesos 56.8 Billion, accounting
for 1.8 percent of the total appropriations.
In 2016, the Department of Health has a general appropriation of Pesos 122.6
Billion of which 99 percent goes to programs and 1 percent goes to projects. Almost 93
percent of the budget for programs goes to operations. The bulk (82%) of operations
budget goes to technical support services, of which 47 percent goes to the health
insurance subsidy of indigents. The subsidy for the premium contributions of indigents
constitutes 36 percent of the entire appropriation for the health department.
With almost half (45%) of government revenues financed by corporate tax and
almost two-thirds (64%) of the health department’s spending financed from the
general fund, roughly one-third of health spending would be financed by corporate
taxes. If we assume business taxes are predominantly incurred by the rich, the burden
of health spending financed by corporate taxes would be considered progressive. With
a third of government revenues financed by individual income tax, roughly two-ninths
of health spending would be progressive, that is, borne more by higher income groups.
So, health spending in general is a form of cross-subsidy from the rich to the poor. On
the other hand, with the subsidy for premium contributions of the poor financed by
excise taxes, the burden of over a third of national health spending would be regressive,
borne more by lower income groups.
The national health insurance subsidy for the premium contributions of indigents
is financed by excise taxes. The ad valorem tax on alcohol (15% in 2013, 20% since
2015) is theoretically neutral (the same proportion is paid as income increases) but the
specific tax (P15 per liter in 2013, P20 since 2015) is theoretically regressive (the tax
decreases in proportion as income increases). The fixed tax on wines (apart from the
excise and value added taxes) is two-tiered, amounting to P250 for wines costing no
more than 500 pesos and P700 for wines costing more than P700. In each tier, the tax
is theoretically regressive (the tax decreases in proportion as income increases). Cigars
have 20% ad valorem tax and a P5 specific tax per cigar. Hand-packed cigarettes have
a fixed tax of P12 in 2013 rising to P30 in 2017 and by 4% each year thereafter. Machine-
packed cigarettes costing P11.50 or less are taxed P12 while those costing more are
taxed P25 per pack. The fixed tax in each tier is regressive. The predominance of fixed
taxes indicates that the “sin” tax system is theoretically generally regressive, assuming

30
that consumption of “sin” products are similar across income groups. In effect, the poor
are financing their own health insurance through “sin” taxes.
There is another form of cross-subsidy though, “from the healthy to the sick”,
assuming that consumers of “sin” products are still healthy or at least healthier than
social insurance beneficiaries. Out-of-pocket payments are independent of income and
are theoretically regressive as any amount decreases in proportion as income increases.
However, the No Balance Billing policy exempts the poor from out-of-pocket payments.
V. PhilHealth Financing
A. Revenue Raising
The National Health Insurance Fund consists of member contributions, the social
security health insurance funds under the Philippine Medical Care Act, earmarked
appropriations, subsequent appropriations, and donations and grants-in-aid. Member
contributions initially included “payroll taxes” from formal sector employees and
voluntary contributions from self-employed members of up to 3 percent of their
incomes, and government subsidy for premium contributions of indigents (RA 7875).
In 2013, the cap on formal sector member contributions has been increased to 5
percent. Premium contributions of low-income informal sector members not
considered as indigents shall now be partly or fully subsidized by local governments,
legislators and / or other sponsors.
The subsidy for indigents was initially supposed to be equally shared between
PhilHealth and local governments. However PhilHealth shall subsidize up to 90
percent for 4th-6th class municipalities initially for up to five years (RA 7875), then
until they become 1st-3rd class municipalities (RA 9241) with the share of the local
government increasing until it equals that of PhilHealth. Now, the national government
fully subsidizes the premium contributions for indigents (RA 10606).
In lieu of the local government subsidy for indigents, local governments now
sponsor low income individuals not qualified for full subsidy by the national
government including barangay workers and volunteers. The DSWD also sponsors
members of special sectors including “orphans, abandoned and abused minors, out-of-
school youths, street children, PWDs, senior citizens and battered women”. House
helpers are sponsored by their employers. Women about to give birth are also
sponsored by the national government, local governments and/or legislators.
Subsequent appropriations come from twenty five percent of the increase in
revenue from the revised excise tax on cigarettes (Republic of the Philippines, 1993b)
and twenty five percent of the increase in revenue from the revised tax on documentary

31
stamp (Republic of the Philippines, 1993a). With the revision of the excise tax on
alcohol and tobacco in 2012 (Republic of the Philippines, 2012), eighty percent of the
increase in revenue is allotted to the National Health Insurance Program. Additional
appropriations may also be requested from Congress.
In 2015, premium contributions amounted to over Pesos 99.6 Billion. Figure 14
shows the distribution of premium contributions. Earmarked revenues constitute over
52 percent of contributions, comprised mainly of premium subsidies for indigents
(36%), senior citizens (13%) and sponsored members (3%). Payroll taxes constitute 41
percent of contributions including 11 percent mandatory contributions for government
employees, 30 percent for private employees. Voluntary contributions constitute 7
percent including those from the informal economy (5%) and overseas workers (2%).
Figure 14: PhilHealth Premium Contributions, 2010-2015
Source: PhilHealth Financial Statements, 2010-2015
Figure 15 shows the PhilHealth subsidy for indigents from 2011 to 2016. In 2011,
the subsidy for health insurance premium of indigent families was Pesos 3.5 Billion
(including P500 Million for informal sector workers). At the premium of P1,200, this
would have covered over 2.9 Million households. With the increase in the premium
56 5647 45
33 30
22 22
1817
1211
2 2
22
3
2
5 6
56
6
5
622
22
40
36
158 5 8 3
3
2
13
0
10
20
30
40
50
60
70
80
90
100
2010 2011 2012 2013 2014 2015
Private Government
Migrant Worker Informal Sector / Self Earning Individual
Indigent – NHTS Sponsored
Senior Citizens

32
contribution to P2,400 in 2012 (Philippine Health Insurance Corporation, 2011b), the
budget was increased to P12 Billion in 2012 to cover the NHTS poor including the
beneficiaries of the 4Ps program (Philippine Health Insurance Corporation, 2012a).
The budget was supposed to be released subject to LGUs’ payment of their share but
was released on condition that LGU payments will be paid to the national treasury’s
general fund. This budget represents the national government’s full subsidy of the
premium contribution of indigents, contrary to the provision in the National Health
Insurance Act for sharing of payment with LGUs. The budget rose to over P12.6 Billion
in 2013 covering the over 5.25 Million NHTS poor. This again rose substantially in
2014, by 1.8 times to P35.3 Billion covering over 14.7 Million members. This is 9.4
Million more than the NHTS-identified poor. PhilHealth attributes this increase to the
enrollment of several families within the same household. The subsidy rose by 5
percent to P37 Billion in 2015. The subsidy covers the poor identified by DSWD, local
social workers and medical social workers, non-salaried barangay officials, and
unregistered senior citizens. It further rose by 18 percent to P43.9 Billion in 2016, P37
Billion for the poor and P6.8 Billion for unregistered senior citizens. No more than 7
percent of the budget can be used for program administration. The Department of
Health has a separate appropriation for hospitalization assistance of indigents
amounting to P3.2 Billion in 2014, P1.8 Billion in 2015, and P2.8 Billion in 2016.

33
Figure 15: PhilHealth Subsidy for Indigents, 2011-2016
Sources of data: General Appropriations Act, various years; PhilHealth
B. Fund Pooling Arrangements
The national health insurance program is based on the principles of equity and
solidarity. Health care access is supposed to be based on need rather than capacity to
pay. Risk is shared among members of different incomes, ages and health conditions
as well as geographical location. In view of this, the DOH financing strategy aims to
enhance cross-subsidy from the rich to the poor.
3.5
12.0 12.6
35.337.1
43.9
4.2 4.65.2
14.715.3
0
2
4
6
8
10
12
14
16
18
0
5
10
15
20
25
30
35
40
45
50
2011 2012 2013 2014 2015 2016
Mill
ion
s
Bill
ion
Pe
sos
Subsidy Indigents
B
illi
on
Pes
o
s
M
illi
on
s

34
A comparison of the share of premium contribution (Figure 14) and the share of
membership (Figure 3) shows the degree of subsidization. An index of cross-
subsidization may be constructed as the ratio of the share to premium contribution to
the share to total membership (contribution-membership ratio, CMR). Members with
a higher share of contribution relative to their share of membership (CMR>1) are
subsidizing other members while the opposite is true (CMR<1) for those being
subsidized. Table 3 shows the contribution-membership ratio by member category for
2010-2015. With the huge share to contributions of private employees especially in
earlier years, it seems that this group subsidizes the poorer sectors. This is true in 2010-
2012. For instance, in 2011, private employees’ share to contributions stood at 56 while
their share to membership was only 32 percent. This means that private employees
were contributing 77 percent more than the average member to the social insurance
fund. While their shares to contributions and membership decreased over time, their
contributions declined faster than their membership, the former to 30 percent, the
latter to 29%, so that in 2015, they were practically paying nothing more than (4 percent
that of) the average member. While cross-subsidy from government employees also
decreased, they continue to subsidize the poorer segment of society. Government
employees paid a little over 3 times more than the average member in 2011 and a little
over 2 times more in 2015. So why is there a decline in the cross-subsidies, especially
from the private sector. It may be that employers are under-reporting their employees’
salaries so they can decrease their share / counterpart to the contribution. This may
also be related to the contractualization of employees which is undertaken to avoid
health insurance contributions altogether.
Table 3: Contribution-Membership Ratio, 2010-2015
Member Category 2010 2011 2012 2013 2014 2015
Private 1.60 1.77 1.39 1.14 1.09 1.04
Government 2.53 3.03 2.54 2.11 2.25 2.11
Migrant Worker 0.24 0.25 0.23 0.59 1.11 0.72
Informal Sector / Self Earning Individual 0.29 0.36 0.30 0.67 1.05 0.99
Indigent – NHTS 0.40 1.37 1.09 1.00 0.97
Sponsored 0.55 0.42 0.36 0.48 1.37 1.12
Senior Citizens 0.25 0.91 Source: Author’s estimates based on PhilHealth data on membership and contributions
If the formal sector is now paying less for health insurance, the informal sector
and the poor must now be paying more. While sponsored members paid only 55
percent of what the average member paid in 2010, in 2014 they were paying 37 percent
more than the average member. Similarly, indigent members paid only 40 percent of

35
what the average member paid in 2011 but paid 37 percent more than the average
member in 2013, although this has since decreased. In 2014-2015, there is practically
no cross-subsidy to the indigents from the richer members apart from the premium
subsidy from the government. The same is true for the informal sector and migrant
workers. Informal sector members who only paid 29 percent of what the average
member paid in 2010, now pay practically the same as the average member. Migrant
workers paid only 24 percent that paid by the average member in 2010 but paid 11
percent more than the average member in 2014.
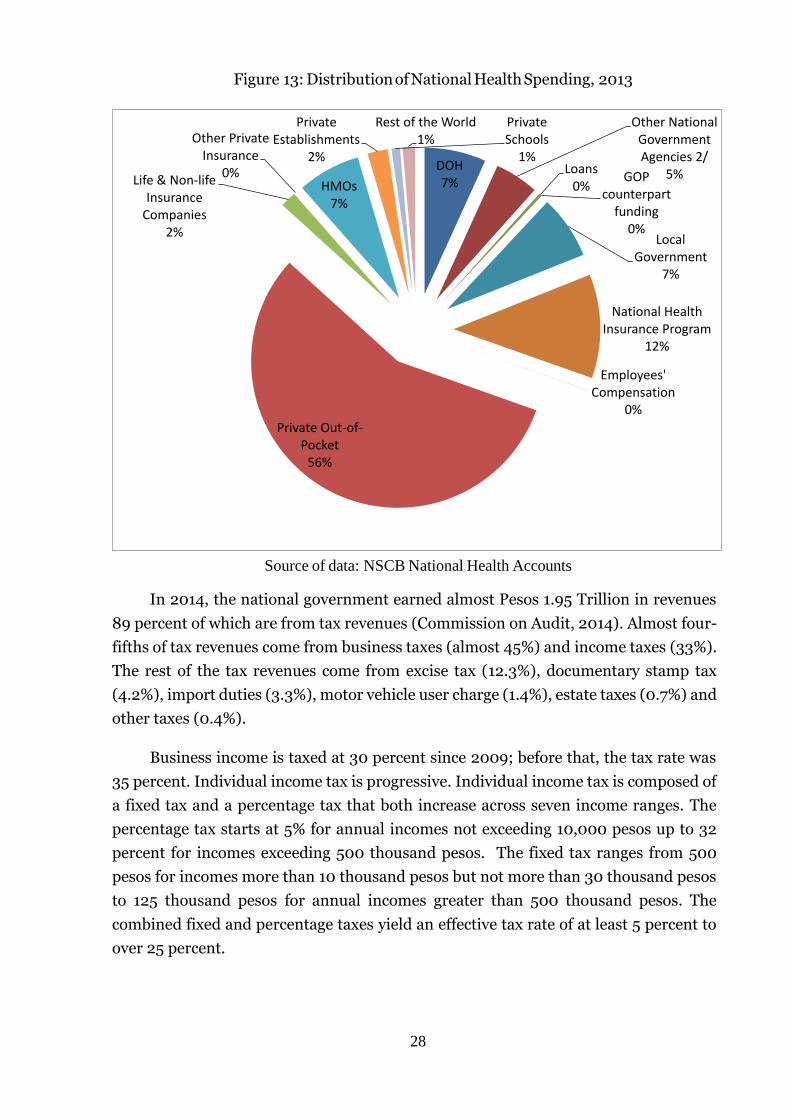
Figure 16 shows the trend in the distribution of benefit claims in 2010-2015. In
2010, private employees had the largest share of claims, accounting for one third of all
claims. However, this share decreased over time to less than one fifth in 2015. The
combined share of indigents and sponsored members was the second largest in 2010
and although it decreased in 2011, it grew in recent years to reach one third, the largest
share in 2015. The share of the informal sector grew from less than one fifth in 2010 to
over one fourth in 2014 but decreased to over one fifth in 2015. The government share
decreased from one sixth in 2010 to 8 percent in 2015. From 6 percent in 2010, the
share of lifetime members only slightly changed for the most part but jumped to one
sixth in 2015. The share of migrant workers remained at 3 percent for most years but
decreased to 2 percent in 2015.
36
Figure 16: Distribution of Benefit Claims, 2010-2015
Source: PhilHealth Stats and Charts, 2010-2015
33 32 30 27 25 19
17 17 15
13 11
8
19 21 24
22 26
21
3 3 3
3 3
2
21 19 19 27 28
33
6 8 8 7 7
17
-
10
20
30
40
50
60
70
80
90
100
2010 2011 2012 2013 2014 2015
Private Government Informal Sector
Migrant Workers Indigent and Sponsored Lifetime & Senior Citizen
37
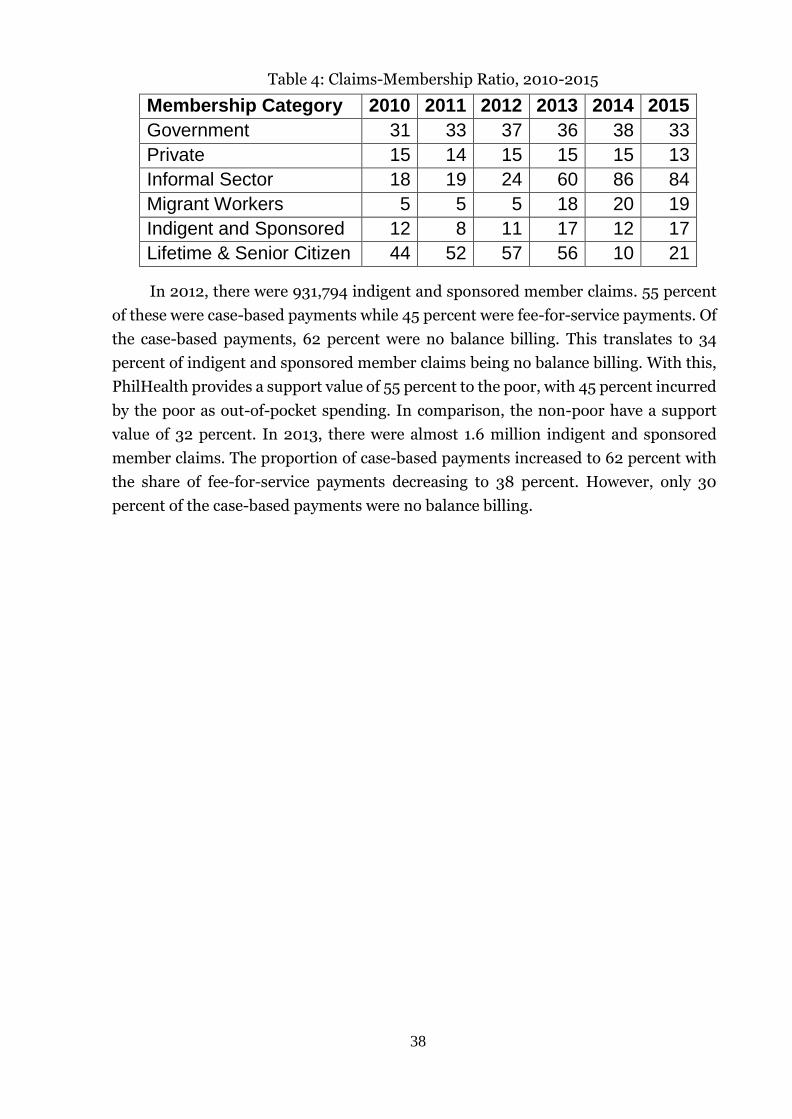
Table 4 shows the proportion of benefit claims to membership by sector for 2010-2015.
In 2010, lifetime members had the highest number of claims at 44 percent of
membership. This means that on average, 44 percent of lifetime members benefitted
from the social insurance. This proportion rose to 57 percent in 2012, but decreased to
10 percent in 2014 due to the huge additional membership particularly of the non-
paying senior citizens. Government employees had the largest number of claims in
2010 at 31 percent, increasing to 38 percent in 2014 but decreasing to 33 percent in
2015. Informal sector member claims rose from 18 percent to a staggering 85 percent
average in 2014-2015. Claims of private employees were relatively constant at 15
percent but decreased slightly in 2015. Indigent and sponsored member claims
fluctuated from 12 percent of sector membership in 2010 to 17 percent in 2015. Claims
of migrant workers were the lowest in 2010 at 5 percent of membership but increased
to one fifth in 2014-2015.
38
Table 4: Claims-Membership Ratio, 2010-2015
Membership Category 2010 2011 2012 2013 2014 2015
Government 31 33 37 36 38 33
Private 15 14 15 15 15 13
Informal Sector 18 19 24 60 86 84
Migrant Workers 5 5 5 18 20 19
Indigent and Sponsored 12 8 11 17 12 17
Lifetime & Senior Citizen 44 52 57 56 10 21
In 2012, there were 931,794 indigent and sponsored member claims. 55 percent
of these were case-based payments while 45 percent were fee-for-service payments. Of
the case-based payments, 62 percent were no balance billing. This translates to 34
percent of indigent and sponsored member claims being no balance billing. With this,
PhilHealth provides a support value of 55 percent to the poor, with 45 percent incurred
by the poor as out-of-pocket spending. In comparison, the non-poor have a support
value of 32 percent. In 2013, there were almost 1.6 million indigent and sponsored
member claims. The proportion of case-based payments increased to 62 percent with
the share of fee-for-service payments decreasing to 38 percent. However, only 30
percent of the case-based payments were no balance billing.
39
Figure 17 shows the distribution of benefit payments across sectors in 2010-2015. In
2010, private employees enjoyed the largest share of benefits at 36 percent. However,
this share decreased over time (with their decreasing share of claims) to half the
original share by 2015. Indigents and sponsored members had the second largest share
of benefit payments in 2010, and even increased reaching over a third in 2015. The
share of government employees and their dependents to benefits was 18 percent in
2010 but decreased over time to 8 percent in 2015. One-seventh of the benefits in 2010
accrued to the informal sector and self-earning individuals and their share rose to one-
fourth in 2014 but declined to less than one-fifth in 2015. The share of lifetime
members was relatively stable at around 7 percent in 2010-2014, then jumped to one-
fifth in 2015 following the mandatory coverage of non-paying senior citizens.

40
Figure 17: Distribution of Benefit Payments, 2010-2015
Table 5: Benefit-Contribution Ratio by Member, 2010-2015
Membership Category 2010 2011 2012 2013 2014 2015
Government 0.73 0.74 0.79 0.74 0.81 0.74
Private 0.58 0.59 0.60 0.55 0.63 0.57
Informal Sector 2.66 2.83 3.90 3.32 3.81 3.64
Migrant Workers 1.13 1.47 1.44 1.33 0.49 1.02
Indigent and Sponsored 1.33 1.41 0.94 1.05 0.68 0.83
Lifetime & Senior Citizen 2.65 1.48
Table 5 shows the ratios of benefits to contributions by membership category in
2010-2015. The table shows that there is considerable cross-subsidization “from the
healthy to the sick”, particularly from the formal to the informal sector and elderly.
Informal sector members had the largest benefits relative to contributions in 2010,
receiving benefits 2.7 times their contributions. Their benefits increased further
reaching almost 4 times their contribution in 2012 remaining close to this level in 2015.
The larger benefits of the informal sector relative to its contributions considering the
voluntary nature of its participation indicates adverse selection, the sick tend to join
36 3528 26 23
18
18 17
1513
11
8
34
33
2
2
14 17
20
1925
19
22 2126
32 33
34
6 7 8 7 7
20
0
10
20
30
40
50
60
70
80
90
100
2010 2011 2012 2013 2014 2015
Private Government
Migrant Worker Informal Sector & Self Earning
Indigents & Sponsored Lifetime Members & Senior Citizens
41
more than the healthy. Lifetime members and senior citizens had the second largest
benefits in 2014 at 2.7 times their contributions. Although this decreased in 2015, they
still benefit almost 50 percent more than they contributed. Indigent and sponsored
members had the second largest benefit to contribution ratio in 2010, receiving one
third more than their contribution, increasing further in 2011. However, benefit
payments to indigent and sponsored members decreased to 68 percent of their
contributions in 2014 and 83 percent in 2015. Migrant workers had 13 more benefits
than they paid in contribution in 2010 increasing further in succeeding years. However,
their benefits decreased to less than half their contribution in 2o14, and enjoyed
benefits no more than 2 percent of their contributions in 2015. Government employees
enjoyed relatively stable benefits of between three-fourths and four-fifths of their
contribution. Private employees have the smallest benefit-contribution ratios of
between 55 and 60 percent.
It must be noted that benefit-utilization does not only depend on the availability
of social insurance. It depends on the frequency and types of illnesses suffered by
different categories of members. It also depends on the availability of health facilities
and the particular services covered by the insurance. For instance, point-of-care
enrolment is only available in DOH-retained hospitals and PhilHealth-approved local
and other government hospitals. Similarly, No Balance Billing is only done in public
health facilities. Z Benefit Package is only provided by PhilHealth-contracted level 3
and 4 hospitals. Primary Care Benefit 1 was provided only by government health
facilities and PCB2 was initially implemented in a few “innovation sites”.
C. Purchasing
1. Benefit Entitlement
Philhealth benefit package includes inpatient hospital care, outpatient care,
emergency and transfer services, and other appropriate cost-effective services.
Excluded health services “a) non-prescription drugs and devices; b) out-patient
psychotherapy and counselling for mental disorders; c) drug and alcohol abuse or
dependency treatment; d) cosmetic surgery; e) home and rehabilitation services; f)
optometric services; g) normal obstetrical delivery; and h) cost-ineffective procedures
which shall be defined by the Corporation.”
Members with contributions for at least 3 months in the past 6 months are
entitled to the program benefits. However, GSIS and SSS retirees prior to the act,
lifetime members (retirees with at least 120 monthly contributions), and enrolled
indigents are exempted from this requirement. Benefits are portable across PhilHealth
offices.

42
2. Provider payment mechanisms
The National Health Insurance Act (1995) allows fee-for-service and capitation as
provider payment mechanisms, subject to the global budget. Fee-for-service is a
“payment system under which physicians and other health care providers receive a
payment that does not exceed their billed charge for each unit of service provided”
(RA9241). Capitation is “a payment mechanism where a fixed rate, whether per person,
family, household or group, is negotiated with a health care provider who shall be
responsible in delivering or arranging for the delivery of health services required by the
covered person under the conditions of a health care provider contract.”
The Implementing Rules and Regulations of the amended National Health
Insurance Act (2004) allow PhilHealth to develop new provider payment systems
considering the corresponding roles and comparative advantages of the public and the
private sectors. The amended National Health Insurance Act (2013) allows case-based
payment defined as “Hospital payment method that reimburses to hospitals a
predetermined fixed rate for each treated case or disease”.
DOH (2010b) identifies the existing and prospective provider payment
mechanisms in the Philippines. As of 2010, capitation was used for outpatient benefits
for sponsored members. DOH aims to use capitation as a main payment scheme for
primary health care services for the entire population. As of 2010, inpatient services
were paid through fee-for-service. The objective is to shift to diagnosis-related group
(DRG) payment for inpatient services by 2016. As of 2010, case-based payment was
used for maternity care and select medical and surgical procedures. The objective is to
use case-based payment for case-mix system by 2016 but initially for preferred
providers. This should be adopted for all providers by 2020. Outpatient drugs are also
hoped to be included in the benefits.
In 2000, PhilHealth established the Outpatient Consultation and Diagnostic
Package for indigents. The package was administered through the capitation of
government health centers and rural health units (RHUs). These health facilities are
paid for services provided for a particular period. If the payment exceeds the actual cost
of services, savings accrue to the health facility, but costs in excess of the payment are
shouldered by the facility. The benefit package includes primary consultations with
general physicians and laboratory fees for chest X-ray, complete blood count, fecalysis,
urinalysis, and sputum microscopy. The capitation amount is P300 per indigent
member in the local government unit.
Fee-for-service payment creates an incentive for providers to increase the number
of services beyond what is necessary while reducing the service input to improve

43
efficiency, which may reduce the quality (Cashin, et al., 2015). These could include
“prolonged hospital stays, overutilization of diagnostic procedures, and provision of
unnecessary and inefficient health care services that insurances paid for without
offering any additional value to members” (PhilHealth c31,s2013). In the Philippines,
fee-for-service created inequity as PhilHealth beneficiaries who avail of health services
in private hospitals receive higher reimbursements than those in public hospitals. On
the other hand, case-based payments and diagnosis-related group payments are said
to be beneficial to both members and hospitals, and promotes equity in access to basic
standard benefit. It also improves efficiency in the processing of hospital claims.
In 2012, PhilHealth shifted from fee-for-service to case-based payment. It also
allows the implementation of the No Balance Billing policy for indigents and sponsored
members. Case-based payment is defined as a "payment method that reimburses to
health care providers a predetermined fixed rate for each treated case or disease”
covering professional fees and hospital charges for room and board; diagnostic and
laboratory procedures; drugs, medicines and supplies; and operating room and other
fees. Case-based payment was piloted on 11 medical and 12 surgical cases in 2011
(c11,2011). In 2012, PhilHealth adopted the “All Case Rate Policy” in which case-based
payment has been applied to all medical conditions and procedures, all surgical
conditions for select procedures for all members in accredited health care institutions,
except for Z type cases (see section VIII). Medical cases are identified based on the
International Classification of Diseases and Related Health Problems, 10th Revision
(ICD 10). A list of medical cases covered by PhilHealth is given in the policy circular’s
Annex 1. Surgical procedures are identified based on the Relative Value Scale (RVS). A
list of procedures covered by PhilHealth is given in the policy’s Annex 2. Based on the
case rate policy, the program covers the prescribed rate for a particular case. For
medical cases, 70 percent of the case rate is for hospital charges and 30 percent is for
professional fees. The health facility deducts the case rate from the member patient’s
hospital. No balance billing applies to indigents and sponsored members, meaning they
are not liable to pay any amount in excess of those covered by the program. PhilHealth
also pays for multiple medical conditions with multiple procedures. In this case, the
case payment for the mostly costly condition is referred to as the First Case Rate.
However, only certain medical cases and procedures are allowed as a second case
(Annex 3). Moreover, only half of the second case rate is paid by PhilHealth except for
a few cases. For medical cases, 30 percent goes to professional fee and 20 percent goes
to hospital charges. For surgical procedures, 40 percent goes to professional fee and 10
percent goes to hospital charges. The policy provides for a single period of confinement
(SPC) rule wherein a patient cannot avail of benefits for the same illness or procedure
within 90 days from the first availment, with a few exemptions. The policy also provides
for a 45-day benefit limit which covers for up to 45 days of hospital confinement per

44
year for a member and another 45 days for all his/her beneficiaries, except for a few
cases.
Case-based payment is useful when the management capability of the purchaser
and the provider are moderate to advanced, when hospital capacity is large and when
efficiency improvement is the primary objective (Cashin, et al., 2015). However, case-
based payment creates certain incentives for providers, to raise admissions, decrease
inputs, unbundle services, and reduce confinement period.
So far, the implementation of case-based payment is said to have shortened the
turn-around time for reimbursements with no need to review claims for individual
medicines, supplies and tests (Dalmacion, Juban, & Zordilla, 2014). However, the
administrative burden is said to have been shifted to hospitals. Also, there is said to be
lack of transparency in the determination of case rates. Perhaps as a result, some
doctors practice upcoding, recording tests under cases which pay higher rates.
In 2015, BGHMC had 33,167 PhilHealth claims. 1% of all these claims were
denied due to the several reasons. The number one reason for denial is violation of
single period confinement, accounting for 46 percent of all denied claims. This seems to
confirm the incentive of increasing admission and reducing the confinement period as
patients are discharged and readmitted within 90 days when they should be
undergoing uninterrupted medical care and confinement. The second most common
reason for denial of claims is exhaustion of the 45 compensable days (17%), followed
by un-accredited doctor (11%), and case not compensable (10%). Other reasons include
inconsistent data (8%), non-compliance (7%), lack of qualifying contribution (1%), and
filed beyond 60 days (0.6%).
The local health insurance office conducts post-audit of claims and also identified
several reasons for denial of claims including violation of single period of confinement,
incomplete claim documentation, un-accredited doctors, and filing beyond 60 days.
Hospitals have 60 days to appeal denied claims to the local health insurance office and
another 15 days to appeal to the central office. Other claims are returned to hospital for
correction or referred to PhilHealth’s legal section. Hospitals have another 60 days to
correct or complete returned claims.
While case-based payments allow for efficiency gains for hospitals, it is being
questioned by the Commission on Audit. One suggestion to address the issue is
payment of the case rate or the actual charge, whichever is smaller.
Apart from the study of case-based payment system conducted by Dalmacion,
Juban, & Zordilla (2014), there are no known comprehensive analyses of the
PhilHealth programs particularly the Point-of-Care Enrolment program, the No

45
Balance Billing policy, and Z Benefit Package. This paper provides a first attempt at
documenting what is happening to these programs.

46
VI. Point-of-Care enrolment
A. Background and Rationale
The National Health Insurance Act of 1995 mandates the universal and
compulsory coverage of health insurance coverage of Filipinos. It also aims to
“prioritize and accelerate the provision of health services to all Filipinos, especially the
segment of the population who cannot afford such services”. Moreover, “all indigents
not enrolled in the Program shall have priority in the use and availment of the services
and facilities of government hospitals, health care personnel, and other health
organizations: Provided, however, That such government health care providers shall
ensure that said indigents shall subsequently be enrolled in the Program.” As amended
in 2013, the Act mandates compulsory coverage across provinces, cities and
municipalities. Under the Universal Health Care program, PhilHealth aims to provide
health insurance coverage to all Filipinos, especially those at risk. However, many of
the poor were not yet covered by PhilHealth. It is in this light that PhilHealth
established the Point-of-Care Enrolment Program in 2013 as a means of enrolling the
poor in need of health services.
The Point-of-Care Enrolment Program provides health insurance coverage to poor
non-member / uncovered patients or those with special circumstances or members of
particular sectors upon admission to a government health facility. Patients availing of
outpatient health care are not covered but hospital-sponsored members are entitled to
subsequent outpatient care. The providers of point-of-care enrollment include all DOH-
retained hospitals and PhilHealth-approved local and other government hospitals. Non-
member and uncovered patients are assessed by the hospital medical social worker using
an intake questionnaire upon admission. Table 6 shows the classification of patients
based on ability to pay or income and the corresponding hospital subsidy. Classes A and
B fully pay the hospital charges and professional fees. Classes C and D do not pay for
hospital room and board and professional services and get corresponding subsidies for
medicines and ancillary services. Class C3 patients are those whose household monthly
income per capita (MIPC) is not more than 40 percent higher than the regional per
capita poverty threshold (PCPT). Strictly speaking, C3 patients are not poor but near-poor
as their incomes are higher than the poverty threshold. However, for the purpose of the
Point-of-Care program, they are considered “poor”. Class D patients are those with
incomes less than the poverty threshold. Patients classified as C3 and D are eligible for
hospital sponsorship. The hospital pays the full PhilHealth premium contribution of
the patient, with the patient not required to share any amount. On top of the hospital
subsidy for medicines and ancillary services in Table 6, the Point-of-Care program
provides no balance billing for hospital-sponsored patients.

47
Table 6: Classification of Patients in Government Hospitals
Class Ward / Income Subsidy
A Pay
B Pay Ward
C Ward or Phil health Service Bed
C1 180%, MIPC ≤ 220% PCPT 25%
C2 140%< MIPC ≤180% PCPT 50%
C3 MPIC ≤ 140% PCPT >50%
D MPIC < PCPT 100% Source: Department of Health (2000)
Patients identified as poor (classes C3 and D) are then enrolled and sponsored by
the hospital; the hospital pays for membership premium of the poor patients, originally
set at P2,400 per year. The hospital-sponsored members are eligible to PhilHealth
benefits from the date of admission up to the end of the year including inpatient and
outpatient benefits, except Primary Care Benefit 1, and No Balance Billing. PhilHealth
shall process the reimbursement of the hospital within a month from the submission
of claims and has the right to return or deny questionable claims.
B. Implementation and Operationalization: BGHMC
To gain insight into the implementation of the Point-of-Care program, a case
study of Baguio General Hospital and Medical Center (BGHMC) was conducted.
BGHMC is a government-owned (DOH-retained) hospital. As a general hospital, it
“provides services for all kinds of illnesses, diseases, injuries or deformities” including
clinical (family medicine, pediatrics, internal medicine, obstetrics and gynecology, and
surgery), emergency, outpatient, ancillary and support services. BGHMC has all the
capacities of level 1 hospitals including isolation, surgical, maternal and dental
facilities; and level 2 hospitals including departmentalized clinical services, respiratory
unit, general ICU and high risk pregnancy unit. Moreover, as a level 3 hospital, it has a
residency training program in medicine, pediatrics, obstetrics and gynecology, and
surgery; a physical medical and rehabilitation unit; ambulatory surgical clinic; dialysis
clinic; tertiary laboratory with histopathology; blood bank and third level X-ray.
Consistent with the Point-of-Care enrolment program and in view of delivering
quality healthcare to its clients, the Baguio General Hospital and Medical Center aims
to enroll 75% of its patients classified as C3 and D to PhilHealth at Point-of-Care with the
hospital sponsoring their membership. To achieve this, the admitting clerk or PCARES5
5 In 2012, PhilHealth established the Customer Assistance, Relations and Empowerment Staff (CARES) projects
which aims to deploy nurses in all accredited level 3 and 4 hospitals and level 1 and 2 government hospitals to
provide PhilHealth members with information on membership and benefits, among others (PhilHealth, 2012).

48
personnel verify the patient’s PhilHealth membership; then the Medical Social Worker
on duty identifies eligible patients through an assessment interview. She then facilitates
the accomplishment of the PhilHealth Membership Registration Form. The Point-of-Care
Medical Social Worker in charge then enrolls the patient to PhilHealth online. She also
follows up on patients not enrolled upon admission. In the first four months of 2016,
the hospital has achieved its objective with an average of 82.5 percent of patients
classified as C3 and D being enrolled to PhilHealth at Point-of-Care.
For the assessment, the hospital uses an interview tool to assess the eligibility of the
point-of-care patients to hospital sponsorship. The tool collects information on the
patient’s demographic characteristics; household size and composition; house- hold
expenditures on housing, food, medical, lighting, clothing, education, water,
transportation, fuel, and others; health insurance; sector; medical data; social
functioning; and environmental problems including basic needs and emotional support
system. The tool also includes patient modifier which pertain to beneficial or adverse
findings towards the eligibility of patients. Table 7 shows the income classification of
patients and the corresponding discount on hospital services. The regional monthly per
capita poverty threshold is P1,624.
Table 7: Point-of-Care Classification System, BGHMC
Class Income Bracket Discount
C1 ≥P3,507 25%
C2 P2,728 - 3,507 50%
C3 P1,624 - P2,727 75%
D ≤P1,624 100%
Two cases of hospital-sponsored members were interviewed, one psychiatric case
and one ENT case. The first has a case rate of P5,460 for hospital charges and P2,340
for professional fees. The ENT case has a case rate of P2,800 for hospital charges and
P1,200 for professional fees. In both cases, the actual hospital charges are higher than
the case rate, 50 percent higher for the first and 2.7 times more in the ENT case. In this
case, the hospital is said to cover the excess as the patients are covered by no balance
billing policy. The actual professional fees are exactly equal to the case rates.
C. Latest Statistics
The number of hospitals participating in the Point of Care Enrolment Program
has increased from 88 in 2013 to 264 in 2014. This is 11.4 percent of the total of 2,323
hospitals in the country. The number of beneficiaries increased from 73,107 to 157,022
for the same period. Figure 18 shows the number (in bar) and percentage distribution
(Y axis) of BGHMC patients by income class. The figure shows that most point-of-care
patients are indigents. 63 percent of all patients are poor (classes C3 and D), with 64

49
percent of In Patients considered poor. It is particularly striking that 84 percent of
emergency patients are poor. This could mean that the poor are more prone to
hazardous living and working conditions.
Figure 18: Point-of-Care Patients by Income Class, BGHMC
17
5
44
17
47
43
40
46
26
29
14
26
10
22
2
12
0
10
20
30
40
50
60
70
80
90
100
In Patient (78%) Out Patient (16%) ER Patient (6%) Total (21,410)
C1
C2
C3
D
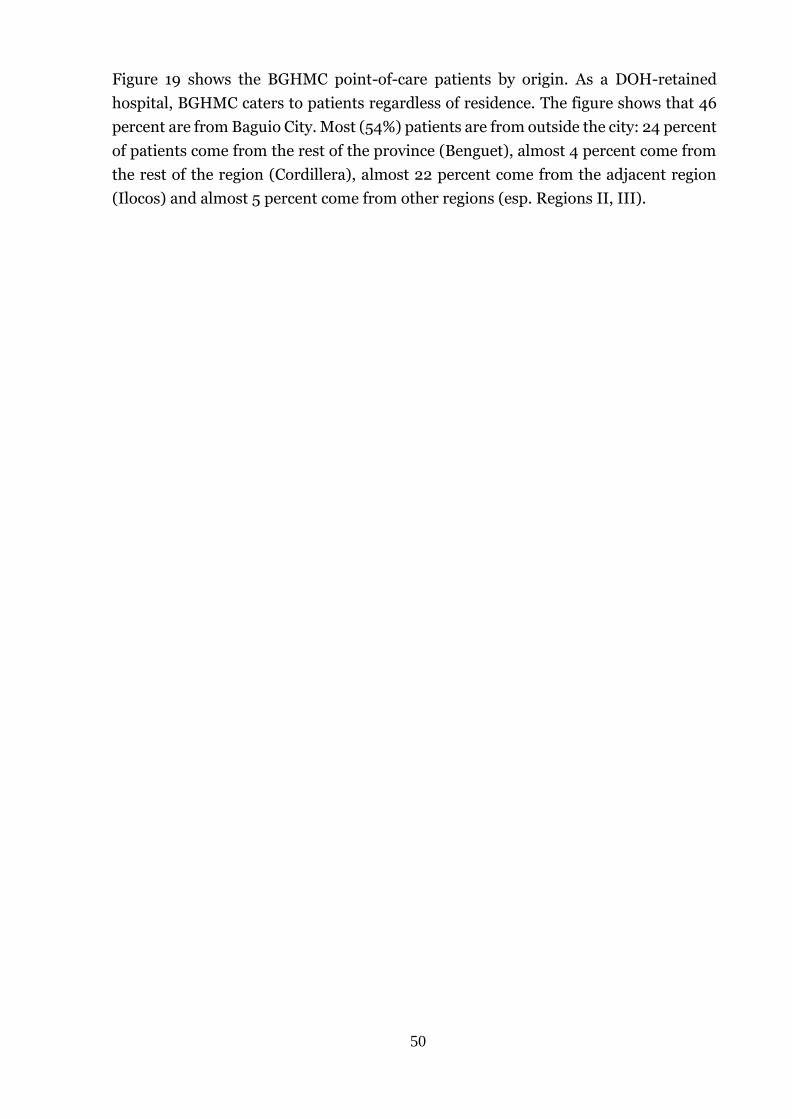
50
Figure 19 shows the BGHMC point-of-care patients by origin. As a DOH-retained
hospital, BGHMC caters to patients regardless of residence. The figure shows that 46
percent are from Baguio City. Most (54%) patients are from outside the city: 24 percent
of patients come from the rest of the province (Benguet), almost 4 percent come from
the rest of the region (Cordillera), almost 22 percent come from the adjacent region
(Ilocos) and almost 5 percent come from other regions (esp. Regions II, III).
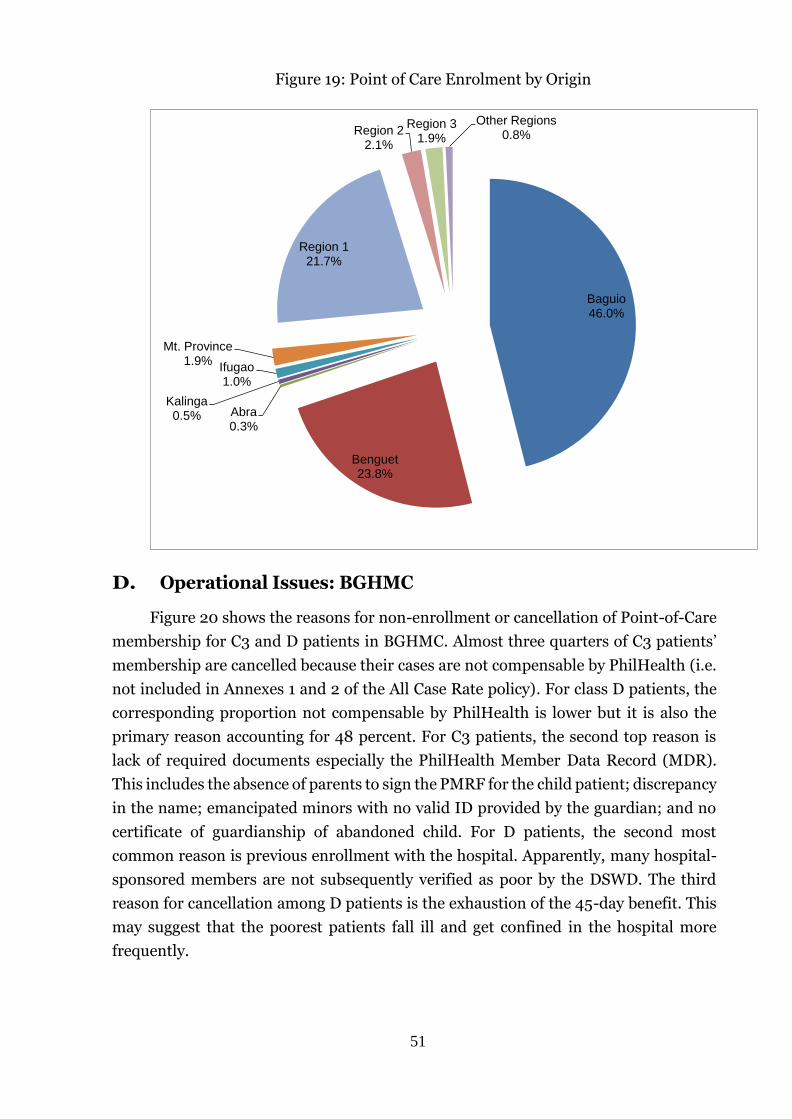
51
Figure 19: Point of Care Enrolment by Origin
D. Operational Issues: BGHMC
Figure 20 shows the reasons for non-enrollment or cancellation of Point-of-Care
membership for C3 and D patients in BGHMC. Almost three quarters of C3 patients’
membership are cancelled because their cases are not compensable by PhilHealth (i.e.
not included in Annexes 1 and 2 of the All Case Rate policy). For class D patients, the
corresponding proportion not compensable by PhilHealth is lower but it is also the
primary reason accounting for 48 percent. For C3 patients, the second top reason is
lack of required documents especially the PhilHealth Member Data Record (MDR).
This includes the absence of parents to sign the PMRF for the child patient; discrepancy
in the name; emancipated minors with no valid ID provided by the guardian; and no
certificate of guardianship of abandoned child. For D patients, the second most
common reason is previous enrollment with the hospital. Apparently, many hospital-
sponsored members are not subsequently verified as poor by the DSWD. The third
reason for cancellation among D patients is the exhaustion of the 45-day benefit. This
may suggest that the poorest patients fall ill and get confined in the hospital more
frequently.
Baguio46.0%
Benguet23.8%
Abra0.3%
Kalinga0.5%
Ifugao1.0%
Mt. Province1.9%
Region 121.7%
Region 22.1%
Region 31.9%
Other Regions0.8%

52
Figure 20: Reasons for Cancelled POC Enrolment, BGHMC
The implementors also faced a few problems. They failed to meet the target point-
of-care enrollment previously for lack of staff for processing documents and ward
follow-ups and the absence of full time social worker to follow-up on patients eligible
for point-of-care enrollment. The PhilHealth Onsite Rapid Enrollment (ORE) System
also experiences technical difficulties with erratic (“99% unreliable”) availability in
July-December 2015. Related to this, there are inconsistencies in the system with active
PhilHealth members not detected by system or inactive detected.
The point-of-care enrolment program creates certain incentives to health service
providers. In particular, it tends to increase admission because while a hospital incurs
P2,400 per sponsored member, it would be able to reimburse up to the case rate. As a
result, more beneficiaries may be enrolled as poor than the actual number of poor,
resulting in leakages.
74
48
4
17
7
21
13 12
2 2
0
10
20
30
40
50
60
70
80
90
100
C3 D
Cases not compensable by PHIC Exhausted 45 Days
Previously enrolled by hospital Lack of required documents
Others

53
VII. No Balance Billing
A. Background and Rationale
In view of universal health coverage by 2013 and consistent with its authority to
develop and implement policies for the management of the social health insurance
program, PhilHealth instituted a case rate system in 2011. The case rate system is an
internationally accepted means of packaging health care payments which is said to
benefit PhilHealth members, health care providers and PhilHealth itself. It is expected
to improve the transparency of health care payments, the predictability of health
insurance coverage, and the reimbursement of health provider claims. The case rates
were “determined through a process where tariff rates, contracting rates for public and
private hospitals, and average value per claim for preceding years were considered and
percentage weights were given to each. The highest computed rates were identified and
used. The top conditions and procedures that make up 49% of total claims from
preceding years were prioritized to be packaged into case rates.” Of the case rates
prescribed, professional fees constitute 30 percent for medical cases and 40 percent for
surgical cases.
Consistent with the universal health care objective of providing financial risk
protection to its members especially the poor, PhilHealth adopted a No Balance Billing
policy for the most common medical and surgical cases in the country, effective
September 2011. The No Balance Billing policy applies to sponsored members and their
dependents for the said cases and when admitted to public health facilities,
reimbursing for certain procedures in accredited public facilities, availing of TB-DOTS,
Malaria, HIV-AIDS outpatient services; and maternity and newborn care packages. No
Balance Billing means that sponsored beneficiaries shall not pay for fees in excess of
the prescribed case rates for common medical and surgical services. Supplies and
services unavailable in the hospital must be bought by the same in behalf of the patient.
Drugs bought and used by the hospitals should be based on the Philippine National
Formulary. Out-of-pocket expenses for hospital charges and professional fees shall be
reimbursed to the member and deducted from the case payment to the health facility.
Reimbursements for hospital services are made directly to the hospital including the
professional fees of accredited doctors. “Cases attended by non-accredited
professionals shall be denied.” PhilHealth beneficiaries not covered by the No Balance
Billing policy are liable to pay hospital charges in excess of the case rate. The days of
confinement are deductible from member’s total of 45-days entitlement per year,
subject to the “rule on single period of confinement”. Hospital claims should be filed
within sixty days from the patient’s discharge. Claims with incomplete requirements
are returned and re-filed within another sixty days. Claims should separate case
payment and service fee claims.

54
There are a few targets on no balance billing. One is 100 percent of Hospitals have
NBB for Conditional Cash Transfer / NHTS families by 2016. Another is the increase
in the proportion of NBB to Sponsored Member Claims in Government Facilities from
7% in 2012 to 40% in 2014 and ≥70% in 2015. The target for 2014 has been
accomplished at 40.5%, but the 2015 accomplishment of 51% failed to meet the target.
B. Latest Statistics
Figure 21 shows the NBB Cases by Region for 2011-2013. There were over 12
thousand NBB cases in 2011. Region VI had the highest number of cases at one- sixth
of all the cases followed by Region V (one-seventh), X (one-ninth) and XII (one-tenth).
The total number of NBB cases grew by over 29 times in 2012 to over 358 thousand.
The largest growth of cases in 2012 was experienced in ARMM, with the cases growing
at 437 times, followed by Region IX (254 times), Region III-A (191 times) and Region I
(187 times). The total number of cases grew by 80 percent in 2013 to almost 633
thousand, with ARMM again experiencing the highest growth at 3.8 times, followed by
Region IX (3.2) and NCR North (2.7 times).
Figure 21: No Balance Billing cases by Region, 2011-2013
Source of Data: PhilHealth Corporate Planning Department
-
10,000
20,000
30,000
40,000
50,000
60,000
70,000
80,000
2011
2012
2013

55
In 2014, No Balance Billing claims constituted 40.5 percent of Sponsored Pro-
gram claims, over the 15 percent target.
In 2014, there were 6,459 NBB cases in BGHMC; 73 percent were Family Health
Card6 holders comprising NHTS Indigents and LGU-sponsored beneficiaries and 27
percent were hospital-sponsored members. In 2015, the NBB cases grew by almost 2.3
times to 14,685. The largest share (48%) of NBB cases are Family Health Card holders.
This is followed by hospital-sponsored members at 37 percent. The remaining 15
percent comprised senior citizens with the implementation of the mandatory
PhilHealth coverage for Senior Citizens.
C. Implementation and Operationalization: BGHMC
As implemented by the hospital, no balance billing means no out-of-pocket
payment in excess of the case rate. Hospital charges in excess of the case rate were
shouldered by the hospital. On the other hand, any excess of the case rate over the actual
hospital charges was income for hospital. The NBB implementation covered hospital-
sponsored, NHTS-PR Indigent, and LGU-sponsored beneficiaries as well as Senior
Citizens and household help (Kasambahay). However, they have to stay at the charity
ward and cannot choose the attending physician. If they stay in a pay ward / private
room or choose a doctor, they will not be eligible to no balance billing. Paying
PhilHealth members pay charges in excess of the case rate. NBB policy covers all
services available in hospital as well as procedures not available in the hospital and
referred to hospitals where BGHMC has a memorandum of agreement (such as Notre
Dame for CT scan, MRI and ultrasound). If drugs, medicines and supplies are not
available in the hospital, the hospital undertakes an emergency purchase. PhilHealth
claims are usually filed within 30 days from patient discharge, within the prescribed
maximum of 60 days.
From the patient perspective, the NBB is a welcome development. For some
patients, if they had no PhilHealth benefits, they would only go to the barangay health
clinic or borrow from neighbors to be able to go to the hospital. For the brain tumor
case, they would only buy medicine to the stop head ache. However, PhilHealth
members are not yet fully aware of their entitlements. For instance, some patients expected
minimal payment for being a PhilHealth beneficiary, but did not expect no balance
billing. Notwithstanding the NBB policy, there remain out-of- pocket spending for
patients. For instance, those who come from other provinces pay for the
6 This a proof of PhilHealth membership provided to indigent and sponsored members (PhilHealth, 2004). This has
been replaced by the PhilHealth Identification Card (ID) (PhilHealth, 2010).

56
provincial/municipal ambulance fuel and driver in traveling to Baguio and return fare
back to their province. Patients also spend for their regular medication.
There are four cases of indigents interviewed: two surgery cases and 2 IDB cases.
In three of the four cases, the actual hospital charges are 18 percent to 2.7 times more
than the case rate. For the other case, hospital charges are 85 percent of the case rate.
In three of the cases, the professional fee is exactly equal to the case rate; the other
could not be determined.
D. Operational Issues
One issue on the NBB is the prescribed purchase and use of drugs based on the
Philippine National Drug Formulary (PNDF). Violation of this policy is considered
fraud. However, some drugs such as those used in chemotherapy for breast cancer are
not in the PNDF or in government hospital pharmacies. So, to avoid denial of claims or
even legal sanctions, hospitals have an incentive to let the patient buy non-PNDF drugs
out-of-pocket.

57
VIII. Z Benefit Package
A. Background and Rationale
Certain diseases are considered ‘economically and medically “catastrophic”’ as
they can drive those suffering into poverty, notwithstanding existing support for
financial risk protection on common health conditions. In this light, PhilHealth aims
to enhance and widen the benefits for catastrophic conditions to further protect
members from financial risk and improve their health (Philippine Health Insurance
Corporation, 2012c). In view of financially catastrophic illnesses, PhilHealth aims to
“1) identify and support cost-efficient interventions; 2) employ rational cost-
containment measures; 3) ensure quality of care for members; 4) incentivize and
enable facility improvement.”
For this purpose, PhilHealth created a case type Z defined as “any illness as a
primary condition that is life or limb-threatening and requires prolonged
hospitalization, extremely expensive therapies or other care that would deplete one’s
financial resources, unless covered by special health insurance policies.” It developed
the Z Benefit Package covering all PhilHealth members and dependents with full
support value for sponsored members and at least half for non-sponsored members.
Only PhilHealth-contracted level 3 and 4 hospitals can provide the package. The
services covered include hospitalization, drugs and medicines, and professional fees.
The case rates are determined using previous average claims, current rates, stakeholder
consultations and input prices. The packages cover complete treatment from the early
stages for early detection and treatment. A fixed number of days is deducted from the
45-day annual benefit. For indigent, LGU- and hospital-sponsored beneficiaries, no
balance billing is applied. For non-sponsored beneficiaries, a fi co-payment scheme is
applied where the beneficiary pays an amount depending on their ability to pay but no
more than the case rate.
The phase 1 of the Z Benefit Package covers Acute Lymphocytic Leukemia (ALL),
Breast Cancer, Prostate Cancer, and Kidney Transplant Philippine Health Insurance
Corporation (2012d). These cases are subject to the general policies stated in the
foregoing as well as the following. The professional fee should not exceed 15% of
package. Patients are deducted 5 days from the 45 days annual benefit irrespective of
the actual duration of confinement. The package rate for ALL is P210,000 paid in three
tranches, P140,000 after the first cycle, and P35,000 each after the third and eighth
maintenance cycles. For Breast Cancer, the package rate is P100,000 payable in two

58
tranches, P75,000 after the surgery and P25,000 after the last chemotherapy. The
package rate for Prostate Cancer is P100,000 paid in full upon discharge. The package
rate for Kidney Transplant is P600,000 payable in two tranches, P550,000 within sixty
days upon discharge after the transplant, P50,000 90 days after the transplant. New
cases are covered by other PhilHealth policies.
B. Latest Statistics
For the Z Benefit Package: there were a total of 2,031 unique claims paid as of
2015. The distribution of claims by package is given in Figure 22. Breast cancer has the
highest share at 26 percent, followed by coronary artery bypass graft (23 percent).
Kidney transplant has the third highest share at 19 percent, followed by Tetralogy of
Fallot (14 percent) and ventricular septal defect (13 percent). Claims for Acute
Lymphoblastic Leukemia comprise 3 percent while the rest each have 1 percent share
or less.
Figure 22: Distribution of Unique Claims Paid under the Z-Benefit Package
Source: PhilHealth Stats and Charts 2015
C. Financing
Coronary Artery Bypass Graft
23%
Kidney Transplantation
19%
Tetralogy of
Fallot14%
Ventricular Septal Defect13%
Breast Cancer26%
Acute Lymphoblastic
Leukemia3%
PD First1%
Prostate Cancer
1%
Selected Orthopedic Implants
0.2%
Cervical Cancer0.05%

59
As of 2015, over Pesos 697 Million was paid for the Z-Benefit Package. The distribution
of this amount is shown in Figure 23. Coronary Artery Bypass Graft has the highest
share (36 percent) followed by Kidney Transplantation (32 percent). Tetralogy of Fallot
has the third largest share (13 percent), followed by Ventricular Septal Defect (10
percent), and Breast Cancer (7 percent). Acute Lymphoblastic Leukemia has a 2 percent
share while the rest each have negligible shares.
Figure 23: Distribution of Amount of Claims Paid under the Z-Benefit Package
Source: PhilHealth Stats and Charts 2015
A. Implementation and Operationalization: BGHMC
As implemented by the hospital, the eligible beneficiaries of the Z Benefit Package
are all PhilHealth beneficiaries including indigents, LGU- and Hospital-Sponsored
beneficiaries. Only Acute Lymphocytic Leukemia and Breast Cancer are covered. No
prostate cancer case has been covered as the only prospective case was in its late stage
and therefore ineligible. The hospital has no experience in Kidney Transplant so it is
ineligible to provide this service. For the Z Benefit cases, only newly diagnosed cases
are eligible. While recurring cases are ineligible, they can still be covered under the
Case Rate system. Only 5 days deducted from 45 days annual benefit regardless of
Coronary Artery Bypass Graft
36%
Kidney Transplantation
32%
Tetralogy of Fallot13%
Ventricular Septal Defect
10%
Breast Cancer
7%
Acute Lymphoblastic
Leukemia2%
PD First0%
Prostate Cancer0.003
Selected Orthopedic Implants
0.001
Cervical Cancer
0%

60
length of stay. The hospital has experience with denied claims with a few notable cases.
One Z Benefit case wrongly filed under Case Rate was denied. Another was filed on
new forms after the prescribed period; the delay is attributed to the delay in the
communication of PhilHealth guidelines. However, according to PhilHealth, the
guidelines are already available on the PhilHealth website. OOPS / hospital charges up
to P60K allowed by PhilHealth (usually goes to PF, > prescribed 15% of package rate).
From the perspective of patients, the Z Benefit package is significant. According
to one patient, if they did not have PhilHealth benefits, they would approach DSWD,
the Barangay Captain, and their Mayor. A Breast Cancer patient enjoyed the Z Benefit
package as a contributing member from the Informal Economy, being a household help
(Kasambahay). She and her husband (a driver) complain that had she not paid her
premium for the past year, she would not be eligible for the benefit package because
although they consider themselves poor, they complain that indigent members are
chosen subjectively by their barangay officials, even including the well-off, couples, and
OFWs. Also, notwithstanding the benefit package, patients still have out-of-pocket
expenses including for transportation to and from Baguio, initial check-up (OPD), and
supplies such blood platelet for an ALL case.
Two sample cases of breast cancer are analyzed, one NBB case and one fixed co-
pay case. The case rate for breast cancer is P100,000, 75 percent of which is payable in
the first tranche and the remaining 25 percent payable in the second tranche. Up to 15
percent of the case rate goes to professional fees. In both cases, the actual charges are
higher than the case rate, 36 percent more for the NBB case and 16 percent more for
the fixed co-pay case. For the NBB case, the actual payment is 25 percent for the first
tranche and 75 percent for the second tranche. For the fixed co-pay case, the actual
payment is 77 percent for the first tranche and 23 percent for the second tranche. There
are no professional fees for the NBB case. The fixed co-pay case includes a professional
fee of P60,000 paid in the first tranche, or 60 percent of the case rate and 52 percent
of the actual charges, much higher than the 15 percent prescribed by policy. This is said
to be allowed in the contract with PhilHealth. There is a suggestion to change fixed co-
payment to maximum co-payment where the patient only pays the excess of the
hospital charges over the case-rate.
IX. Primary Care Benefit
A. Background and Rationale
In 2014, the PhilHealth has developed the Primary Care Benefit 2 Package which
pays for “out-patient medicines for PhilHealth qualified (indigent and sponsored)
members or dependents with hypertension, diabetes and dyslipidemia, long before

61
their conditions become catastrophic” (Philippine Health Insurance Corporation,
2014b). This is based on the fact that much of Filipino families’ spending on health goes
to medicines, reaching more than half among the poorest. Mortality from non-
communicable diseases (NCD) is significant with over a third of deaths in 2009 due to
cardio-vascular diseases and diabetes, and their prevalence has increased in 2003-
2008. PhilHealth pays a substantial amount for non-communicable diseases, mostly
for essential hypertension, hypertensive heart disease and chronic renal failure. The
benefit package aims to improve access to out-patient medicines for indigent and
sponsored beneficiaries, reduce hospitalization due to NCDs, improve the health of
NCD patients, and promote rational drug use among NCD patient members. Only one
family member with over 30 percent cardio-vascular risk for ten years can avail of the
package. In 2014, the package has been piloted in Pateros, Capiz, and in some
municipalities in Palawan.
B. Latest Statistics
One indicator being monitored is the proportion of LGUs with PCB providers. The
target is to increase this from 83% in 2012 to 85% in 2013 and 90% in 2014. These targets
have been accomplished at 93.7% in 2013 and 93% in 2014. Another indicator is the
proportion of NHTS-PR members assigned to PCB provider. The targets for this
indicator are 50% for 2013 and 65% for 2014. The accomplishment in 2013 is 31%,
less the target, but the accomplishment in 2014 is 72%, over the target. Number of
hospitals participating in the program has increased from 88 in 2013 to 264 in 2014 while
the Beneficiaries increased from 73,107 to 157,022.
C. Implementation and Operationalization: BGHMC
Out-patient services in BGHMC are not covered by PhilHealth as these mainly
involve consultation. New patients only pay a minimal registration fee of P20. Minor
procedures are covered by PhilHealth. However, procedures relating to hypertension,
diabetes and dyslipidemia are not covered by PhilHealth even for indigents. These
include basic procedures such as blood pressure taking, ECG, blood chemistry,
urinalysis, lipid profiling, fasting blood sugar, and chest X-ray. Other procedures
carried out as necessary include liver enzymes, ultrasound of the abdomen, CT scan
and electrolyte. All these procedures are paid for by the patient unless he is admitted.
BGHMC implemented PCB1 but is not implementing PCB2, not having expressed
interest. Nevertheless, existing cases of hypertension, diabetes and dyslipidemia are
covered under the case rate system which serves as the counterfactual for the PCB2.
For diabetes, the case rate is P12,600 of which 70 percent is allotted to hospital charges
and 30 percent is allotted to professional fees. Four sample cases were analyzed, two

62
PhilHealth and two Non-PhilHealth members. For the first PhilHealth case, hospital
charges are 42 percent higher than the case rate al- though the professional fee is
exactly the case rate. (P3,840 for room and board and P4,980 for X-ray, lab, and
others) and 30 goes to professional fees. The second case is a self-employed PhilHealth
member; hospital charges are 61 percent higher than the case rate and professional fees
are 3 times the case rate. These may be due to other confounding diagnoses. There is
one other similar case with Non-PhilHealth membership paying hospital charges
equivalent to 44 percent of the case rate; no information on the professional fee was
provided. For essential hypertension / malignant hypertension, the case rate is P9,000
of which 6,300 is allotted to hospital charges and P2,700 is allotted to professional fees.
There are two sample cases, one non-paying PhilHealth member and the other a non-
PhilHealth member. The Phil- health member was charged hospital charges almost
twice as much as the case rate and professional fees 2.45 times the case rate but there
are other diagnoses. The non-PhilHealth member paid hospital charges equivalent to
68 percent of the case rate, no information on the professional fee was provided.
D. Implementation Issues
There are several questions relative to the implementation of the case rate system
for the NCD cases. What accounts for the difference in hospital charges between
Phil- Health and Non-PhilHealth members? Why are hospital charges generally higher
for PhilHealth members? Why are hospital charges for PhilHealth members generally
higher than the case rate? Some of these questions may be answered by closer analysis
of patients’ statement of account. However, this researcher was only pro- vided a
summary table. There is a need to enhance transparency of information in the interest
of accountability in the use of public funds notwithstanding the confidentiality of
patient information. There is also a need to make hospital technical and financial
statistics more accessible to the public as sample cases do not show the complete
picture as to the implementation of the program.

63
X. Summary, conclusion and recommendations
In its earlier years, social health insurance in the Philippines has catered only to
the formal sector composed of government and private employees. With the
establishment of the National Health Insurance Program, the social health insurance
coverage of indigents has become mandatory. From a membership of less than 15
thousand in 1997, indigents now have a membership of over 15 million and are now the
largest group of PhilHealth members comprising close to 4 out of 10 members. This
growth in membership has been driven by the nation-wide identification of the poor by
the National Household Targeting System - Poverty Reduction (NHTS-PR) program of
the DSWD. This massive identification has led to the enrolment of more members /
households than the poor population / families estimated by Philippine Statistical
Authority. This means that the government’s social health insurance subsidy is leaking
out to the non-poor. Notwithstanding the guidelines in the identification of the poor,
there seems to be subjectivity in the selection of beneficiaries. One patient complains
that despite their poverty, they are not selected as beneficiaries and that their barangay
officials choose even the well-off, couples, and OFWs. However, the evidence is
anecdotal and the size of the problem cannot be determined in this study. Nevertheless,
there is a need to ensure integrity of identification of poor.
The fiscal capacity of the Philippines is relatively low with the government budget
just on balance. However, the sustainable debt-servicing does not threaten government
spending on health. Moreover, there is scope for increasing government spending on
health, especially with the incremental revenues from the revised sin tax law earmarked
for the subsidy of premium contributions for the poor.
While health spending per capita for the country is lower than the averages for
South Asia, East Asia and the Pacific and low-middle income countries, it has reached
4.7 percent in relation to per capita income, higher than the target of 4.5%. The share
of government to health spending has decreased to 34 percent while the share of private
health spending has increased to 66 percent. Nevertheless, the share of health to
government spending has risen to 10 percent, surpassing the target of 6 percent.
Moreover, the share of social security to government health spending has increased to
41 percent. The share of social health insurance to total health spending stood at 14
percent. As a share of private health spending, out-of-pocket spending has decreased
while voluntary health insurance has increased. However, out-of-pocket spending
remains to be the main source of national health spending, is far from target and higher
than those of neighboring countries. Half of out-of-pocket spending goes to medical
products, mostly to pharmaceutical products and supplements (Ulep & Dela Cruz,
2013).

64
Government subsidy for the social health insurance of the poor is financed by the
incremental revenues from revised sin tax law. This subsidy has increased from 3.5
Billion Pesos in 2011 to 43.9 Billion Pesos in 2016. It now comprises over a third of the
national health insurance fund surpassing the share of payroll contributions from
private employees. With its huge share, the premium subsidy for indigents is
effectively subsidizing health care service for other members as well particularly the
informal sector while cross-subsidies from the formal sector has decreased. While
benefit claims in proportion to membership have increased for indigents in recent
years, these are lower than those for other sectors except private employees. Relative
to contributions, benefits for indigents are also lower than those for the informal sector
and the elderly.
Until recently, PhilHealth predominantly used fee-for-service for inpatient
services and capitation for outpatient benefits for sponsored members. Fee-for-service
payments are said to have resulted in inequity with private hospitals receiving higher
reimbursements than public hospitals. Aimed at promoting equity as well as efficiency
in benefit payments, PhilHealth has recently adopted case-based payments, initially for
select medical and surgical cases and now for most cases. PhilHealth reimburses health
care providers a fixed rate for a particular case covering both hospital charges and
professional fees. This is said to have facilitated hospital reimbursements but shifted
administrative burden to hospitals. Given the fixed case rates, the payment scheme is
also said to have induced some doctors to upcode tests under cases which pay higher
rates. Evidence also suggests the tendency to increase admission and reduce
confinement period with the violation of the single period confinement being the
number one reason for denial of claims of the studied hospital. Moreover, the provision
for multiple medical conditions in the case rate system may induce unnecessary second
cases because while second cases are reimbursable at only half the case rate, the share
of professional fee remains intact. Finally, while case-based payments allow for
efficiency gains for hospitals, it is being questioned by the Commission on Audit. One
suggestion to address the issue is payment of the case rate or the actual charge,
whichever is smaller.
Apart from the sponsorship of the poor by the national government and
disadvantaged sectors by local governments, poor and near poor who have no coverage
are also sponsored by hospitals at point-of-care. These are assessed and enrolled by the
hospital medical social welfare office. While the purpose of the program is noble, it is
said to induce increased enrolment because while hospitals pay for the poor patients’
premium contributions, they reimburse much higher case rates. However, point-of-
care enrolment can be cancelled for various reasons such as cases excluded from the
“All Case Rate” policy, previous hospital sponsorship, insufficient documentary

65
requirements, and exhaustion of the allowable period of confinement. Moreover,
hospital-sponsored members may not be verified as poor by the DSWD in the
succeeding year and lose their benefits.
There has been significant progress in the PhilHealth initiatives and programs for
indigents. The Point-of-Care enrollment program has seen an increase in the number
of participating hospitals. The share of No Balance Billing claims to all sponsored
program claims has surpassed the target in 2014. However, NBB patients still incur
out-of-pocket spending for transportation and medication. The proportion of LGUs
with Primary Care Benefit providers has exceeded the target. PhilHealth has also
developed new Z Benefit Packages for catastrophic health conditions, although less
than the number targeted.
Benefit claims of indigents, sponsored members (including hospital-sponsored
members), and senior citizens have been increasing and constituted half of all claims
in 2015. Majority (51%) of these claims were administered under the No Balance Billing
policy. However, while the policy has taken strides in just 5 years of implementation,
close to half of claims still involve out-of-pocket spending for the poor.
Claims for catastrophic illnesses under the Z Benefit Package constituted 1 in over
4 thousand claims. While the number of claims is small, the value of the payment is
bigger at 0.7 percent of all claims. While the average value per claim is only P10,388,
the average value of Z Benefit claims is P343,259. If we assume the same proportion of
Z Benefit claims for indigents and sponsored members (including hospital-sponsored
and senior citizens) as with the total claims, the poor would be enjoying over 348
million pesos in benefits for catastrophic illnesses. This would be 0.7 percent of the
total benefits for these beneficiaries.
The following are some recommendations on the point-of-care enrolment
program, claims processing under the case-rate system, the benefit structure, and
provider payment system.
A. Enrollment
The main reason for the cancellation of PhilHealth membership at point-of-care
is that the cases are not compensable by PhilHealth. There is a need to review the cases
that are compensable by PhilHealth to include cases that the poor commonly suffer
from. Documentary requirements should not hinder the poor from accessing free
health care. Hospitals should provide sponsorship and the necessary health care at no
cost to the poor pending the verification of their PhilHealth membership. The hospital
intake assessment should be able to determine the true eligibility of patients. The

66
second reason for cancellation of PhilHealth membership among the poor is the
exhaustion of the 45 day annual benefit. The review of the cases suffered by the poor
should consider the length of hospitalization required. Cases requiring long
hospitalization should be included in the Z Benefit package to address this limit.
Hospital sponsorship of the poor is also cancelled due to previous sponsorship. There
should be a clear guideline allowing hospitals to renew their sponsorship pending
verification of the poor by the DSWD. This will prevent the denial of hospital claims by
PhilHealth. Hospitals cannot just renew sponsorship as denial of their claims means
they shoulder not just the premium contribution but the cost of the services. However,
public hospitals should have allowances for such costs considering the subsidy to
hospitals and a separate budget for medical assistance for indigents.
B. Claims Processing
The number one reason for the denial of PhilHealth claims is the violation of the
single period confinement rule. However, certain illnesses like Pneumonia may recur
in less than 90 days prescribed for benefit availment. For this reason, there is a need to
review the single period confinement rule or consider the exemption of certain
illnesses. The second reason for denial of claims is the exhaustion of 45 days annual
benefit. As in the previous section, there is a need to review the 45-day limit or exempt
certain cases requiring long periods of hospitalization. The third reason for denial is
attendance by non-accredited doctors. There is a need to further analyze attendance by
non-accredited doctors. Is there a lack of accredited doctors? If so, is the non-
accreditation due to shortcomings of the doctor or hospital or the rigidity in the
accreditation procedure. The fourth reason for denial is the case is not compensable by
PhilHealth. As in the previous section, there is a need to review compensable cases to
include justifiable ones. In this regard, PhilHealth should consult hospitals on the cases
that can be considered for inclusion among the compensable cases.
C. Benefit Structure
In almost all of the cases, the actual hospital charges are higher than the case rate.
Does this mean that the case rate does not reflect the real market value of the services
or are the hospital charges exorbitant? In some cases, the actual charges include
diagnostic procedures for confounding illnesses. So while total charges may be higher
than the case rates, the specific charges relating to the particular cases may be lower.
There may be a need for separate billing / statements for different cases to determine
the appropriateness of existing case rates. While the analysis of certain cases provides
a glimpse on some of the issues relating to the benefit structure, it does not allow a
thorough evaluation of existing case rates. To do this, PhilHealth and hospitals must
be open to providing access to financial data not currently accessible.

67
D. Provider Payment Systems
The allocation for DOH in the General Appropriations Act includes a budget for
Assistance to Indigents and Poor Patients for the payment of PhilHealth premium
under the Point-of-Care program, hospitalization, and grant assistance. The budget of
DOH also includes provisions for hospital services including personnel services,
maintenance and other operating expenses, and capital outlay. It also has a budget for
the purchase of drugs, medicines and vaccines as well as for vaccines for indigent senior
citizens. For the hospital studied, premium payments for hospital-sponsored members
are initially funded from “employees’ share of PhilHealth” (presumably from the
appropriations for personnel benefit fund). Hospital services are funded by the DOH
subsidy and hospital income. The services provided to PhilHealth beneficiaries are then
reimbursed from PhilHealth. The issues and recommendations for service payment are
the same as those in section 10.2.
XI. References
Baguio General Hospital and Medical Center (2015). Medical social work office
assessment tool.
Cashin, C., Ankhbayar, B., Phuong, H. T., Jamsran, G., Nanzad, O., Phuong, N. K., et al. (2015). Assessing Health Provider Payment Systems: A Practical Guide for Countries Moving Toward Universal Health Coverage. Joint Learning Network for Universal Health Coverage.
Commission on Audit. (2014). 2014 Annual Financial Report. Quezon City: Commission on Audit.
Commission on Audit. (2015). Annual Audit Report on the Philippine Health Insurance Corporation. Quezon City: Commission on Audit.
Dalmacion, G., Juban, N., & Zordilla, Z. (2014). Reconnaissance Study on the Implementation of Case-Based Payment. Makati City: Philippine Institute for Development Studies.
Department of Health (2000). Administrative order no. 51: Implementing guide- lines
on classification of patients and on availment of medical social services in
government hospitals.
Department of Health. (2010). PhilHealth Benefit Delivery Review: A Consolidated Report on a Review of PhilHealth Performance in Implementing the National Health Insurance Program. Health Sector Reform Agenda - Technical Reports.

68
Department of Health (2010a). The Aquino health agenda: Achieving universal health
care for all Filipinos. Administrative Order No. 2010-036.
Department of Health (2010b). Toward Financial Risk Protection: Health Care
Financing Strategy for the Philippines 2010-2020. Health Sector Reform Agenda
Monograph, (10).
Department of Health (2011). 2011-2016 National Objectives for Health. Health Sector
Reform Agenda Monograph, (12).
Department of Social Welfare and Development (n.d.). Listahanan: Talaan ng
pamilyang nangangailangan.
Manasan, R. G. (2011). Expanding Social Health Insurance Coverage: New Issues and Challenges. Makati City: Philippine Institute for Development Studies.
McIntyre, D. and Kuzin, J. (2016). Health financing country diagnostic: a foundation for
national strategy development. World Health Organization.
National Health Insurance Corporation (2013). The Revised Implementing Rules and
Regulations of the National Health Insurance Act of 2013.
Obermann, K., Jowett, M. R., Alcantara, M. O., Banzon, E. P., & Claude, B. (2006). Social health insurance in a developing country: the case of the Philippines. Social Science and Medicine, 62(12), 3177–3185.
Office of the President of the Philippines (2010). Providing for the adoption of the
national household targeting system for poverty reduction as the mechanism for
identifying poor households who shall be recipients of social protection program
nationwide. Executive Order No. 867.
Paqueo, V. B., Orbeta, E. M., Cortes, S. F., & Cruz, A. C. (n.d.). Analysis of the Near Poor: Challenges and Strategy Development Ideas.
PhilHealth. (2003). Annual Report 2003. Philippine Health Insurance Corporation.
PhilHealth. (2004). PhilHealth Circular No. 4: PhilHealth Family Cards for Indigents. PhilHealth.
PhilHealth. (2010). PhilHealth Circular No. 26: New PhilHealth Identification Card for Sponsored Members.
PhilHealth. (2012). Guidelines for Hospitals Covered by PhilHealth CARES Project. PhilHealth Circular No.12.

69
Philippine Health Insurance Corporation (2009). PhilHealth Circular No. 09, s.2009: 2009
Revised Inpatient Benefit Schedule.
Philippine Health Insurance Corporation (2011a). New PhilHealth Case Rates for
Selected Medical Case and Surgical Procedures and the No Balance Billing Pol-
icy. PhilHealth Circular, (11).
Philippine Health Insurance Corporation (2011b). New Premium Contributions to the
National Health Insurance Program (NHIP) in Support for the Attainment of
Universal Health Care and Millennium Development Goals (MDGs). PhilHealth
Circular, (22).
Philippine Health Insurance Corporation (2012a). Entitlement to NHIP Benefits of all
Pantawid Pamilyang Filipino Program Beneficiaries of the DSWD. PhilHealth
Circular, (24).
Philippine Health Insurance Corporation (2012b). Governing Policies on PhilHealth
Benefit Package for Case Type Z. PhilHealth Circular, (29).
Philippine Health Insurance Corporation (2012c). PhilHealth circular no. 29, s.2012:
Governing policies on PhilHealth benefit package for case type z.
Philippine Health Insurance Corporation (2012d). PhilHealth circular no. 30, s.2012: Case
type z benefit package for acute lymphocytic (lymphoblastic) leukemia (all), breast
cancer, prostate cancer and kidney transplant.
Philippine Health Insurance Corporation (2012e). PhilHealth Circular No. 51, s. 2012:
Revisions on PhilHealth Records of NHTS-PR Sponsored Program Members.
Philippine Health Insurance Corporation (2013). Implementation of the Point of Care
Enrollment Program. PhilHealth Circular, (32).
Philippine Health Insurance Corporation (2014a). 2014 Stats and Charts.
Philippine Health Insurance Corporation (2014b). Implementing Guidelines for the
Primary Care Benefit 2 (PCB2) Package (Out-Patient Medicines for
Hypertension, Diabetes, and Dyslipidemia) at Selected Innovation Sties.
PhilHealth Circular, (17).
Republic of the Philippines (1993a). An Act Rationalizing Further the Structure and
Administration of the Documentary Stamp Tax, Amending for the Purpose

70
Certain Provisions of the National Internal Revenue Code, as Amended,
Allocating Funds for Specific Programs, and for Other Purposes. Republic Act,
(7660).
Republic of the Philippines (1993b). An Act Revising the Excise Tax Base, Allocating a
Portion of the Incremental Revenue Collected for the Emergency Employment
Program For Certain Workers, Amending for the Purpose Sec. 142 of the
National Internal Revenue Code, as Amended, and for Other Purposes. Republic
Act, (7654).
Republic of the Philippines (1995). An Act Instituting a National Health Insurance
Program for all Filipinos and Establishing the Philippine Health Insurance
Corporation for the Purpose. Republic Act, (7875).
Republic of the Philippines (2012). An Act Restructuring the Excise Tax on Alcohol and
Tobacco Products by Amending Sections 141, 142, 143, 144, 145, 8, 131 and
288 of Republic Act No. 8424. Otherwise Known As The National Internal
Revenue Code Of 1997, As Amended By Republic Act No. 9334, And For Other
Purposes. Republic Act, (10351).
Republic of the Philippines (2013). An Act Amending Republic Act No. 7875,
Otherwise Known as the ”National Health Insurance Act of 1995”, as Amended,
and for other purposes.
Republic of the Philippines (2014). An Act Providing for the Mandatory PhilHealth
Coverage for all Senior Citizens, Amending for the Purpose Republic Act No. 7432,
as amended by Republic Act No. 9994, otherwise known as the ”Expanded Senior
Citizens Act of 2010”. Republic Act, (10645).
Romualdez, A. J., dela Rosa, J. F., Flavier, J. D., Quimbo, S. L., Hartigan-Go, K. Y., Lagrada, L. P., et al. (2011). The Philippines Health System Review. World Health Organization.
Silfverberg. (2013). Analysis of the Philippine Health Insurance Corporation’s Individually Paying Program and Employed Program. Philippine Journal of Development, XL(1 & 2), 1-33.
Silfverberg, R. R. (2014). The Sponsored Program of the Philippine National Health Insurance - Analyis of the Actual Coverage and Variations Across Regions and Provinces . Makati City: Philippine Institute for Development Studies.
Ulep, V. G., & Dela Cruz, N. A. (2013). Analysis of Out-of-Pocket Expenditures in the Philippines. Philippine Journal of Development, 93-123.

71
World Health Organization (2014a). Monitoring progress towards universal health
coverage at country and global levels: framework, measures and targets. World
Health Organization.
World Health Organization (2014b). What is universal health coverage?
Xu, K. (2005). Distribution of Health Expenditures and Catastrophic Spending: Methodology. Geneva: World Health Organization.