health financing in thailand issues for discussion nesdb workshop 11 september 2009 toomas palu,...
TRANSCRIPT

Health financing in ThailandIssues for discussion
Health financing in ThailandIssues for discussion
NESDB Workshop11 September 2009
Toomas Palu, Lead Health Specialist
Health and health financing in Thailand — an international success story
Good health outcomes Broad population coverage Broad benefit package Increased and more equitable utilization of services Reduced financial risk – universal health insurance
effective safety net against catastrophic out-of-pocket cost
Efficient – low level of spending as % of GDP

3
Good Health Outcomes Relative to Good Health Outcomes Relative to Level of Economic DevelopmentLevel of Economic Development and Health Spending
Hong Kong, China
Indonesia
Japan
Malay siaThailand
Taiwan, China
SamoaChina
Cambodia
Korea, Rep.
Lao PDR
Mongolia
Philippines
Singapore
Vietnam
525
100
250
Infa
nt m
orta
lity
rate
250 1000 5000 25000GNI per capita, US$
Source: WDINote: log scale
Infant mortality vs income, 2005
Hong Kong, China
Indonesia
Japan
Malay siaThailand
Taiwan, China
SamoaChina
Cambodia
Korea, Rep.
Lao PDR
Mongolia
Philippines
Singapore
Vietnam
525
100
250
Infa
nt m
orta
lity
rate
5 25 250 1000 5000Health expenditure per capita, US$
Source: WDINote: log scale
Infant mortality rate vs health spending, 2005
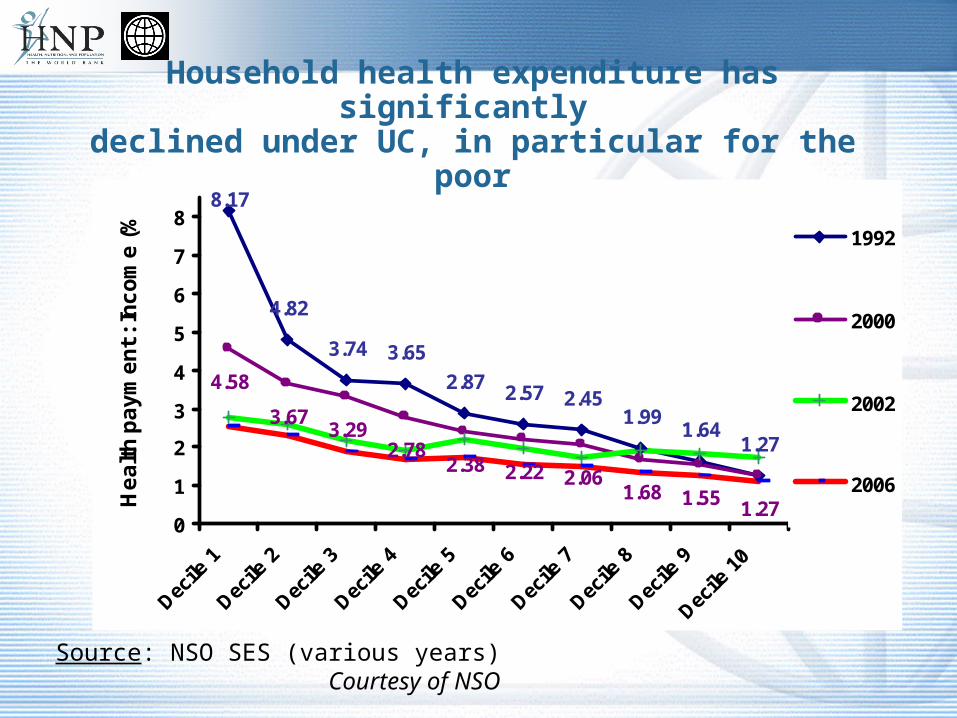
8.17
4.82
3.74 3.65
2.87 2.57 2.451.99
1.641.27
4.58
3.673.29
2.782.38 2.22 2.06
1.68 1.55 1.270
1
2
3
4
5
6
7
8
Decile
1
Decile
2
Decile
3
Decile
4
Decile
5
Decile
6
Decile
7
Decile
8
Decile
9
Decile
10
He
alt
h p
ay
me
nt
: In
co
me
(%
)
1992
2000
2002
2006
Household health expenditure has significantly declined under UC, in particular for the poor
Source: NSO SES (various years)Courtesy of NSO

Challenges Ahead
Cost pressures and financial sustainability• Demographics and rise of chronic disease
• Technology and drugs
• Cost of other inputs, e.g. human resources
• Expectations, social values
• Income growth and high income elasticity of health care
• Vulnerability to economic and financial crises
Health Financing Architecture• Fragmentation of risk pools and management
• Universality vs. multi-tiered benefits
Filling gaps in coverage• International Migrant Population
• Internal Economic Migration

Ageing Impacts Health Expenditures Life-cycle health expenditures: actual (2003) and two projections for an
increase of 10 years in life expectancy
0
1,000
2,000
3,000
4,000
5,000
6,000
EUR
Actual costs (2003) Age-based projection Const. death-related costs projection
Proximity to death maindeterminant of health
expenditures; additional
years are spent in relative
good health
Health expenditures increase with age; additional years are spent in increasingly bad health Actual (2003)

Crisis15
30
He
alth
sp
en
din
g p
er
cap
ita,
ave
rag
e e
xch
an
ge
ra
te (
US
$)
1995 2000 2005year
Total Public
Out-of-pocket
Indonesia
Crisis
60
12
0
He
alth
sp
en
din
g p
er
cap
ita,
ave
rag
e e
xch
an
ge
ra
te (
US
$)
1995 2000 2005year
Total Public
Out-of-pocket
Thailand
Crisis
35
07
00
He
alth
sp
en
din
g p
er
cap
ita,
ave
rag
e e
xch
an
ge
ra
te (
US
$)
1995 2000 2005year
Total Public
Out-of-pocket
Argentina
Crisis
15
03
00
He
alth
sp
en
din
g p
er
cap
ita,
ave
rag
e e
xch
an
ge
ra
te (
US
$)
1995 2000 2005year
Total Public
Out-of-pocket
Russian Federation
Source: World Health Organization and World Bank
Real Health Spending per Capita in US$, 1996 - 2006
Vulnerability of Health Sector to Crisis
Social sector expenditures tend to be pro-cyclical
Social health insurance coverage depending on employment and wages
• In Thailand about 1 million expected to migrate to Universal Scheme
Often health is a low priority

Cost Driver: Role of Technology
Technology is: pharmaceuticals, medical devices, diagnostic techniques, surgical procedures, etc.
Technological change?• Innovation—arrival of new products and techniques• Utilization—how new and old technologies are used in the health system
What determines the availability, utilization, and price of technologies?
• Needs and expectations (create incentives for development and promotion)
• Scientific capabilities (in recent decades, advances in genetics, account for fundamental change)
• Features of the health system• Total cost = unit cost X utilization
Technology accounts for 1% annual real increase in cost of health care other factors constant (NZ Sustainable Health Financing Path analysis)
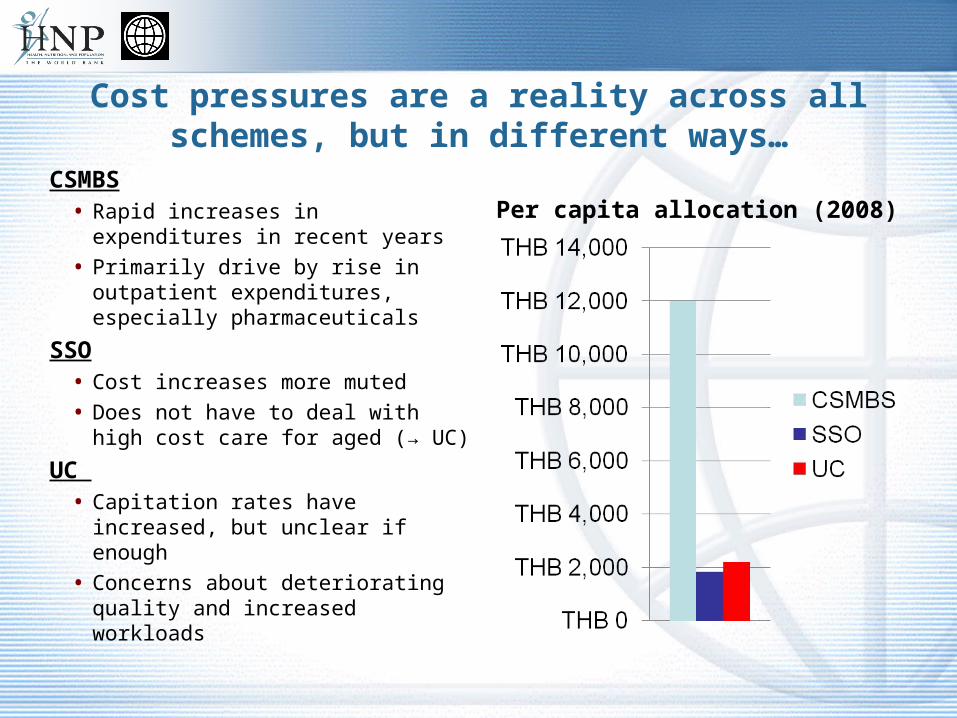
Cost pressures are a reality across all schemes, but in different ways…
CSMBS• Rapid increases in expenditures in
recent years
• Primarily drive by rise in outpatient expenditures, especially pharmaceuticals
SSO• Cost increases more muted
• Does not have to deal with high cost care for aged (→ UC)
UC • Capitation rates have increased,
but unclear if enough
• Concerns about deteriorating quality and increased workloads
Per capita allocation (2008)

Actual cost pressures at facility level
Can happen if health care providers are inadequately funded and/or health insurance passes too much cost risk to health care providers
• capitation, DRGs, cost-volume global budgets pass significant risk to providers
• expressed by arrears to suppliers, waiting lists, deterioration of quality
Preliminary findings from a study in Thailand supported by the WB – no significant acute financial pressures were identified in a sample of district health systems and provincial hospitals
• Evidence that until now the pricing of capitation and DRGs have been adequate
• Although coping mechanisms were often applied and staff reported significant workload
10
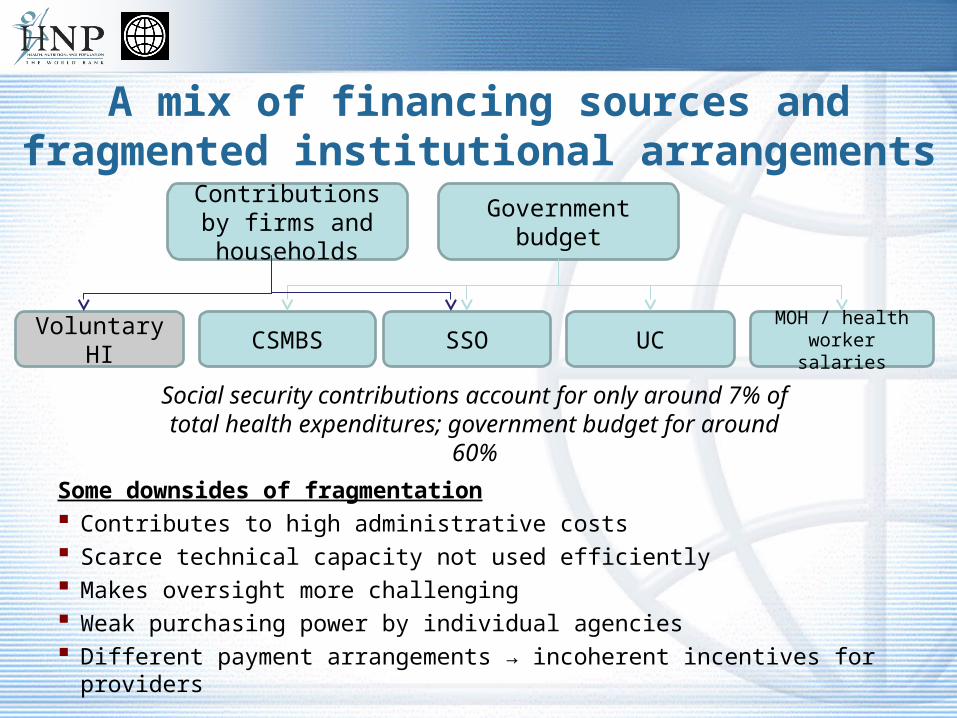
A mix of financing sources and fragmented institutional arrangements
Some downsides of fragmentation Contributes to high administrative costs Scarce technical capacity not used efficiently Makes oversight more challenging Weak purchasing power by individual agencies Different payment arrangements → incoherent incentives for providers
Government budgetContributions by
firms and households
SSOCSMBS UC MOH / health worker salaries
Social security contributions account for only around 7% of total health expenditures; government budget for around 60%
Voluntary HI

Runaway Costs of CSMBSTrends in CSMBS expenditures CSMBS exp. by age groups
Courtesy of MOF

So what can we do?
13

How can cost pressures be managed
Ensure value for money• Reducing provision of “unnecessary care”
• Purchasing and appropriate incentives to health providers (CSMBS!)
• Technology Assessment
Increase financing for health—how much is needed?• In Thailand currently the case is maintaining the Government commitment
• Prepare for costly chronic disease (invest in prevention, financing options for Lon Term Care)
• Effective prioritization / rationing
Some budget expenditures could be moved to contributory schemes (compulsory and voluntary)
• e.g. internationally, in most social health insurance schemes dependents are covered

Impact of provider payment reforms and considerations for Thailand
Some key lessons from international experiences to date• In many cases, reforms have resulted in savings due to shorter length of
stay and/or reduction of intensity of care (diagnostic procedures, drug use, etc.)
• Evidence on impact of quality often limited—represents important risk• Case-based payment for hospital services has often resulted in rapid
increases in volume Provider payment reform has come a long way in Thailand, but…
• CSMBS has just moved away from FFS for inpatient care, but outpatient fee-for-service payments (and drugs) remain important cost driver
• Lack of coordination across schemes creates mixed incentives for providers—cost shifting, patient preference, etc.
• Too much cost risk shifted to providers under UC/SSO scheme?• Adequate incentives for quality and prevention?

Cost-sharing
Cost-sharing with dual objective to moderate demand and raise additional revenues introduced or increased in many OECD countries during 1980s and 1990s
• Co-payment for services
• Treatment restrictions through negative or positive lists, in particular pharmaceuticals and dental care (e.g. moving drugs to OTC status)
• Some countries—e.g. Singapore, China, South Africa, US—have experimented with Medical Savings Accounts
Best practice co-payment options• Not on public goods and primary health care
• Flat charges and/or capped per episode and annually
• Administratively simple
• Implication on poor need to be carefully considered
Thailand• 30 B co-payment may have moderated demand but was not a significant financial barrier
16
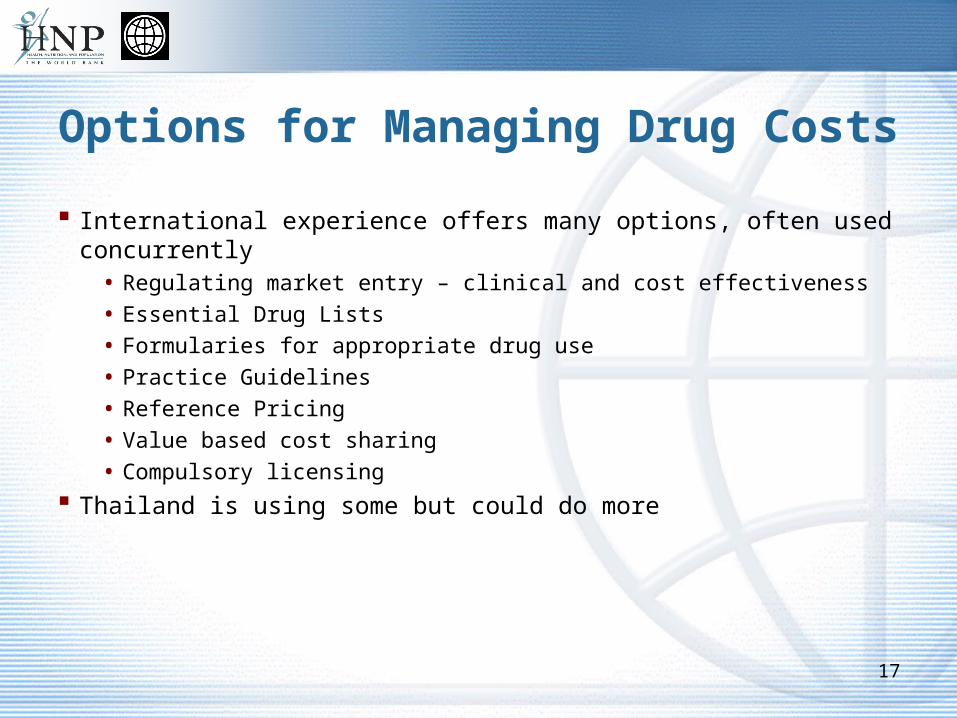
Options for Managing Drug Costs
International experience offers many options, often used concurrently• Regulating market entry – clinical and cost effectiveness
• Essential Drug Lists
• Formularies for appropriate drug use
• Practice Guidelines
• Reference Pricing
• Value based cost sharing
• Compulsory licensing
Thailand is using some but could do more
17

Managing introduction and use of technology
Many countries regulate investment in technology• E.g. permission—certificate of need—required for large investments in US in 1970s/80s• Mixed evidence—decisions about what services and procedures will be covered may be more
effective Growing trend toward ‘Health Technology Assessments’
• Use of clinical evidence and economic evaluation to approve use / cover—does technology represent ‘value for money’?
• Economic evaluation is often difficult—reliable evidence on effectiveness may take years to emerge
• Yes/no decisions on technology often contested—effectiveness / efficiency often conditional on patient or circumstance
Managing use of technology equally important• Different approaches: clinical guidelines, utilization reviews, second opinions, profiling of clinical
practice, etc.• Scope for both improving quality and controlling costs, but evidence on impact still limited
Thailand plans to institutionalize health technology assessment modeled after UK NICE • exact institutional mandate and capacity will matter
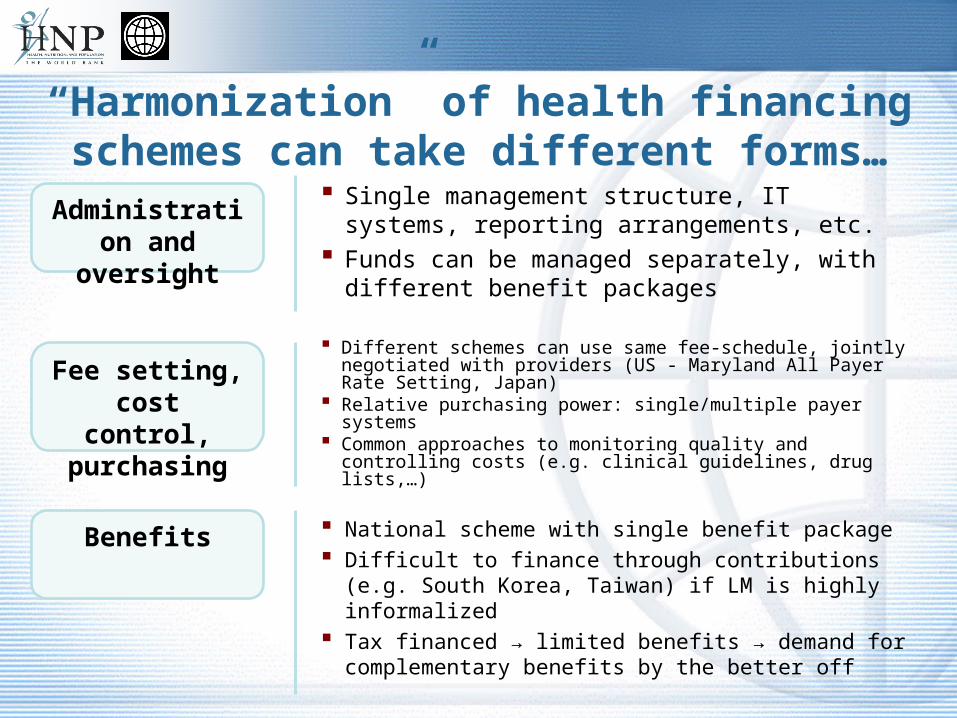
“Harmonization” of health financing schemes can take different forms…
Single management structure, IT systems, reporting arrangements, etc.
Funds can be managed separately, with different benefit packages
Administration and oversight
Fee setting, cost control, purchasing
Benefits
Different schemes can use same fee-schedule, jointly negotiated with providers (US - Maryland All Payer Rate Setting, Japan)
Relative purchasing power: single/multiple payer systems Common approaches to monitoring quality and controlling
costs (e.g. clinical guidelines, drug lists,…)
National scheme with single benefit package Difficult to finance through contributions (e.g. South Korea,
Taiwan) if LM is highly informalized Tax financed → limited benefits → demand for
complementary benefits by the better off
20
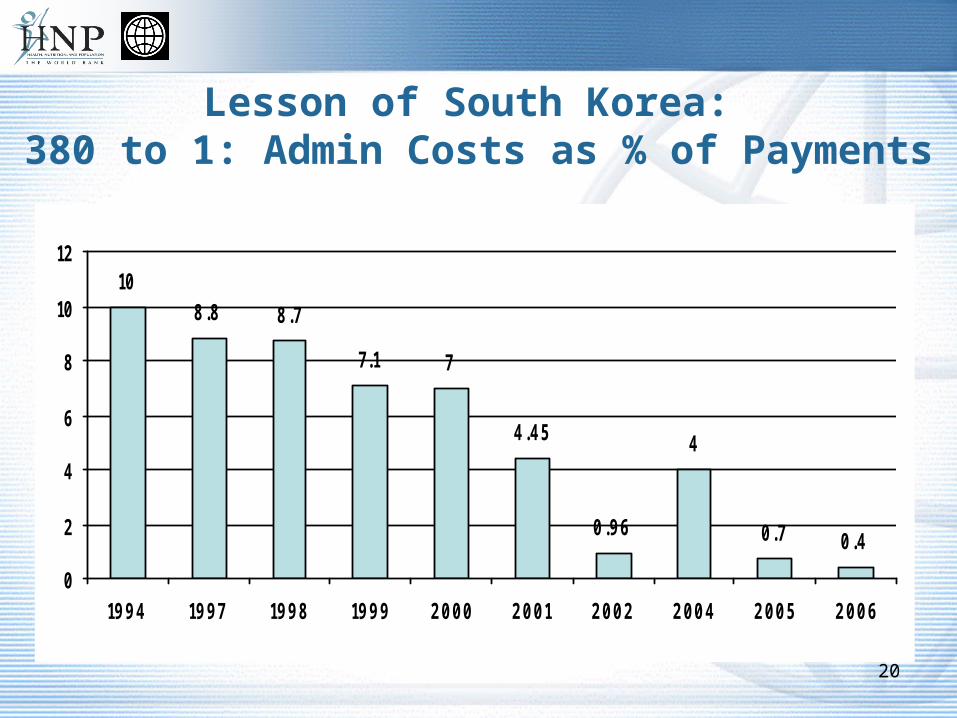
Lesson of South Korea: 380 to 1: Admin Costs as % of Payments
108.8 8.7
7.1 7
4.45
0.96
4
0.7 0.4
0
2
4
6
8
10
12
1994 1997 1998 1999 2000 2001 2002 2004 2005 2006

Managing Health Sector Reform
Health is a complex sector of intersected interests and complex ethical and technical issues
No perfect technical solutions exist• “… one can only choose the problems one is willing to live with ….”
Implementable reform is a negotiated outcome of• Social values and public policy objectives (e.g. Universal Coverage has already become a
core social value in Thailand)
• Stakeholder interests
• Technically sound interventions
To help with informed decision making• Thailand has already significant technical policy analysis/evaluation capacity
• World Bank and other international partners have significant international exposure and experience in strengthening health systems and cross-sectoral policies impacting health
21