health inequalities in primary care: effect of spearhead
TRANSCRIPT
Health Inequalities in Primary Care: Effect of Spearhead Primary Care
Trusts 2002-2009
Report to the National Audit Office
Professor Julia Hippisley-Cox University of Nottingham
October 2009

2
Contents
1 Executive summary________________________________________________________4 Key findings___________________________________________________________________ 4 Discussion of findings ___________________________________________________________ 5
2 Purpose of document ______________________________________________________6
3 Aim_____________________________________________________________________6
4 Objectives________________________________________________________________6
5 Outcome Measures ________________________________________________________6
6 Study population __________________________________________________________7 Age distribution of patients in the analysis__________________________________________ 8 Distribution of patients by Deprivation Quintile _____________________________________ 8 Distribution by ethnicity_________________________________________________________ 9 Trends in prevalence of smoking and obesity_______________________________________ 10 Trends in patients at high risk CVD ______________________________________________ 11 Trends in uncontrolled hypertension _____________________________________________ 12 Trends in prevalence of cardiovascular disease and diabetes__________________________ 13 Trends in use of statins and aspirin in CVD________________________________________ 14 Health inequalities by deprivation: spearheads _____________________________________ 15 Health inequalities by deprivation: non spearheads _________________________________ 16 Health inequalities by ethnicity __________________________________________________ 17 Variations in indicators by geographical area ______________________________________ 17
Acknowledgements __________________________________________________________________ 17 Scientific approval ___________________________________________________________________ 17 Declarations ________________________________________________________________________ 17
7 Appendix _______________________________________________________________19
3
Figures Table 1: Number of patients 35‐74 years in practices from spearhead areas........................................................7 Table 2: Number of patients 35‐74 years in practices from non spearhead areas ................................................7 Table 3: Age distribution of patients in spearhead compared with non spearhead for 2002................................8 Table 4: Distribution of patients by quintile of deprivation in 2002 ......................................................................8 Table 5: Distribution of patients by ethnicity in 2002 ............................................................................................9 Table 6: trends in smoking and obesity ................................................................................................................10 Table 7: Trends in patients at high risk of cardiovascular disease........................................................................11 Table 8: Trends in use of medication in patients with uncontrolled hypertension..............................................12 Table 9: Trends in prevalence of cardiovascular disease and diabetes................................................................13 Table 10: Trends in use of statins and aspirin in patients with established CVD .................................................14 Table 11: % achievement of indicators in deprived verses affluent patients in spearhead practices..................15 Table 12: % achievement of indicators in deprived verses affluent patients in non spearhead practices ..........16 Table 13: Achievement of indicators and disease prevalence by ethnic group in spearheads and non spearheads in 2002 and 2009...............................................................................................................................19 Table 14: Variations in achievement of indicators within spearheads 2002‐2009...............................................21
4
1 Executive summary
This is an analysis of key indicators from primary care based on the QResearch database between 2002 and 2009 for the National Audit Office as part of its review on Health Inequalities. Comparisons are made between general practices in spearhead areas compared with those in non spearhead practices to examine trends over time as well as compare levels of achievement of the indicators in deprived and affluent population.
Key findings
The key findings among patients in the spearhead areas are:
• Smoking: In 2002, 37% of patients in the most deprived group smoked compared with 16% in the most affluent group. The ratio of this difference was 2.32 indicating that smoking 132% higher in deprived compared with affluent groups at baseline. By 2009, smoking rates had fallen in both affluent and deprived groups but the ratio was 2.69 indicating smoking rates were 169% higher in deprived compared with affluent groups. This suggests that the gap has not narrowed. A similar pattern was found in the non spearhead areas.
• Obesity: In contrast, levels of obesity rose over the 7 years in both affluent and deprived groups in the spearheads. In 2002, it affected 17% of affluent and 22% of deprived patients compared with 24% and 29% in 2009. Levels of obesity were 33% higher among deprived patients compared with affluent patients in 2002 and 22% higher in 2009 showing a small improvement in the gap. A similar pattern was found in the non spearhead areas.
• Type 2 diabetes. After smoking, the most marked difference between affluent and deprived patients was prevalence of diabetes which was 101% higher in deprived verses affluent in 2002 compared with 77% higher in deprived verses affluent by 2009. A similar pattern was found in the non spearhead areas.
• Uncontrolled blood pressure not on medication: Although there was a rise in the percentage of patients with this indicator between 2002 and 2009, the levels were similar among deprived and affluent patients at both time points i.e. there was no significant health equality gap for this indicator.
• Patients at high risk of cardiovascular disease (CVD): in 2002, 14% of patients from deprived areas were at high risk of CVD compared with 10% in affluent areas. By 2009, the corresponding figures were 12% and 9%. The ratio between deprived and affluent was 44% in 2002 and 22% in 2009 showing some improvement in the health inequality gap over time. A similar pattern was found in the non spearhead areas.
• Statin usage in patients with established cardiovascular disease: There was an improvement in the percentage of patients with cardiovascular disease not on statins over the study period in both groups. At baseline, 40% of affluent patients and 48% of deprived patients with CVD were not prescribed statins. By 2009, the corresponding figures were 21% and 19%.
A similar trend was found for each of these indicators in patients from non‐spearhead areas over time. The extent of the differences between deprived and affluent patients for each indicator were similar to those found in the spearhead areas in 2002 and also in 2009.
5
Discussion of findings
This is a descriptive study which estimates achievement in simple measures over a 7 year period. It is part of a larger investigation by the National Audit Office which examines other aspects of health inequalities and policy so this report needs to be understood within that context.
The present report, by its very nature, is unable to capture information on the specific policies either within the practice or the associated primary care trust (PCT). There have also been national policy changes and initiatives which have spanned this study period such as the introduction of 'pay for performance' for GPs as part of the new GMS contract Quality and Outcomes Framework (QOF). Inevitably, this will have affected both the recording of information on the computer as well as screening and prescribing activity. It is therefore difficult to attribute change, or lack of change, in the indicators presented in this study to the implementation of the policy of spearhead PCTs.
What is apparent is that there are persisting health inequalities despite the Quality and Outcomes Framework and despite the introduction of spearheads. There are areas of affluence within the spearheads and also areas of deprivation within the non spearheads. Hence the categorisation of spearheads is likely to miss some patients from deprived areas. Use of a postcode linked deprivation score (such as the Townsend score which is present in GP computer systems) offers an alternative and practical mechanism for identifying patients in deprived areas for targeting of interventions and monitoring their success. Such an approach is already in use as part of the Department of Health's Vascular Screening Programme. It could be extended to other conditions and may help minimise heath inequalities over time especially if health inequality indicators could be developed, tested and then incorporated into the Quality and Outcomes Framework.

6
2 Purpose of document
This is a report to the National Audit Office for an analysis to support the review of Health Inequalities currently being undertaken.
3 Aim
The aim of the analysis is to estimate the effect of spearhead primary care trusts (PCTs) on differences in health inequalities by examining changes in key indicators between 2002 and 2009.
4 Objectives
Our objectives were to compare trends in health inequalities for 4 key domains by ethnicity and deprivation between 2002 and 2009, comparing a sample of practices contributing to the QResearch database in spearhead areas with a sample from non Spearhead areas. 2002 was chosen as it is the year prior to the start of the Spearhead policy.
The four domains were chosen by the NAO as they relate to interventions which the Department of Health consider to be significant.
5 Outcome Measures
The analysis focuses on the following outcome measures, measured at yearly intervals ‐ 2002 and 2009 comparing achievement in practices in Spearhead and non Spearhead areas.
1. Rates of smoking and obesity (defined as a body mass index >=30 kg/m2).
2. User of statins and aspirin in patients at high risk of cardiovascular disease.
3. Use of antihypertensives in patients with uncontrolled hypertension (i.e. systolic blood pressure > 150/90 mm Hg). Antihypertensives included current prescription with ACE inhibitors, beta blockers, calcium channel blockers or thiazide diuretics.
4. Use of statins and aspirin in patients with established cardiovascular disease for secondary prevention.
7
6 Study population
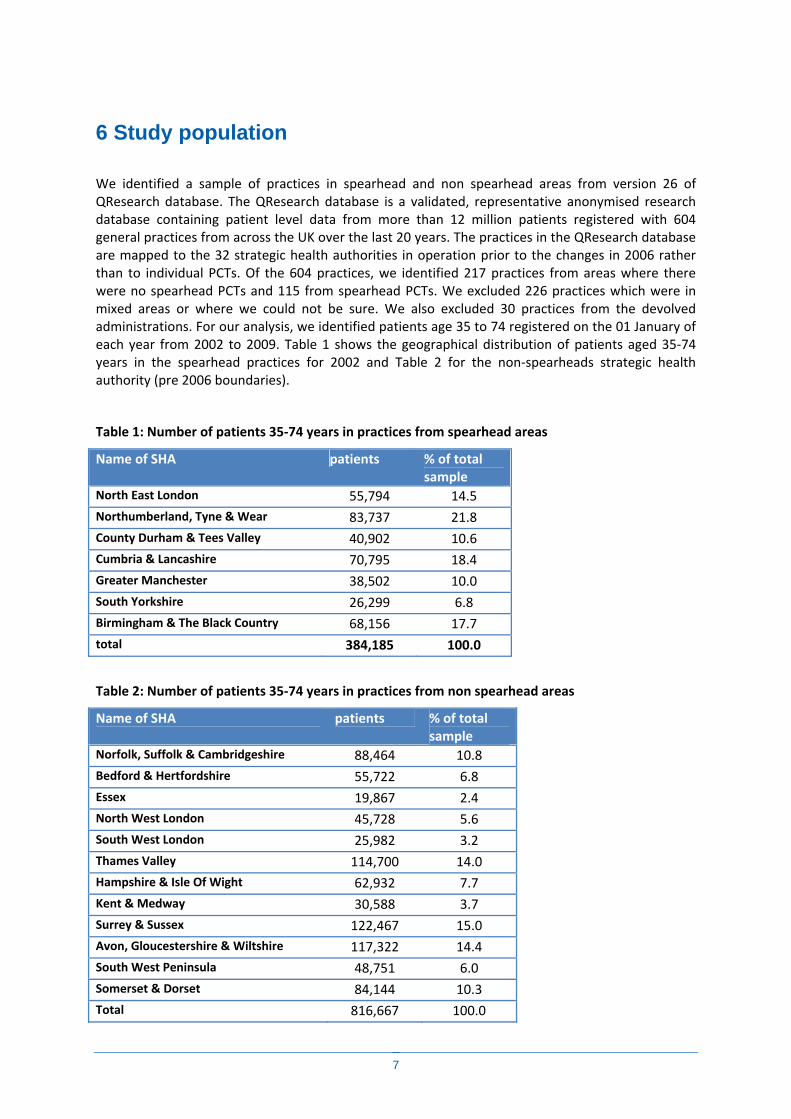
We identified a sample of practices in spearhead and non spearhead areas from version 26 of QResearch database. The QResearch database is a validated, representative anonymised research database containing patient level data from more than 12 million patients registered with 604 general practices from across the UK over the last 20 years. The practices in the QResearch database are mapped to the 32 strategic health authorities in operation prior to the changes in 2006 rather than to individual PCTs. Of the 604 practices, we identified 217 practices from areas where there were no spearhead PCTs and 115 from spearhead PCTs. We excluded 226 practices which were in mixed areas or where we could not be sure. We also excluded 30 practices from the devolved administrations. For our analysis, we identified patients age 35 to 74 registered on the 01 January of each year from 2002 to 2009. Table 1 shows the geographical distribution of patients aged 35‐74 years in the spearhead practices for 2002 and Table 2 for the non‐spearheads strategic health authority (pre 2006 boundaries).
Table 1: Number of patients 35‐74 years in practices from spearhead areas
Name of SHA patients % of total sample
North East London 55,794 14.5 Northumberland, Tyne & Wear 83,737 21.8 County Durham & Tees Valley 40,902 10.6 Cumbria & Lancashire 70,795 18.4 Greater Manchester 38,502 10.0 South Yorkshire 26,299 6.8 Birmingham & The Black Country 68,156 17.7 total 384,185 100.0
Table 2: Number of patients 35‐74 years in practices from non spearhead areas
Name of SHA patients % of total sample
Norfolk, Suffolk & Cambridgeshire 88,464 10.8 Bedford & Hertfordshire 55,722 6.8 Essex 19,867 2.4 North West London 45,728 5.6 South West London 25,982 3.2 Thames Valley 114,700 14.0 Hampshire & Isle Of Wight 62,932 7.7 Kent & Medway 30,588 3.7 Surrey & Sussex 122,467 15.0 Avon, Gloucestershire & Wiltshire 117,322 14.4 South West Peninsula 48,751 6.0 Somerset & Dorset 84,144 10.3 Total 816,667 100.0
8
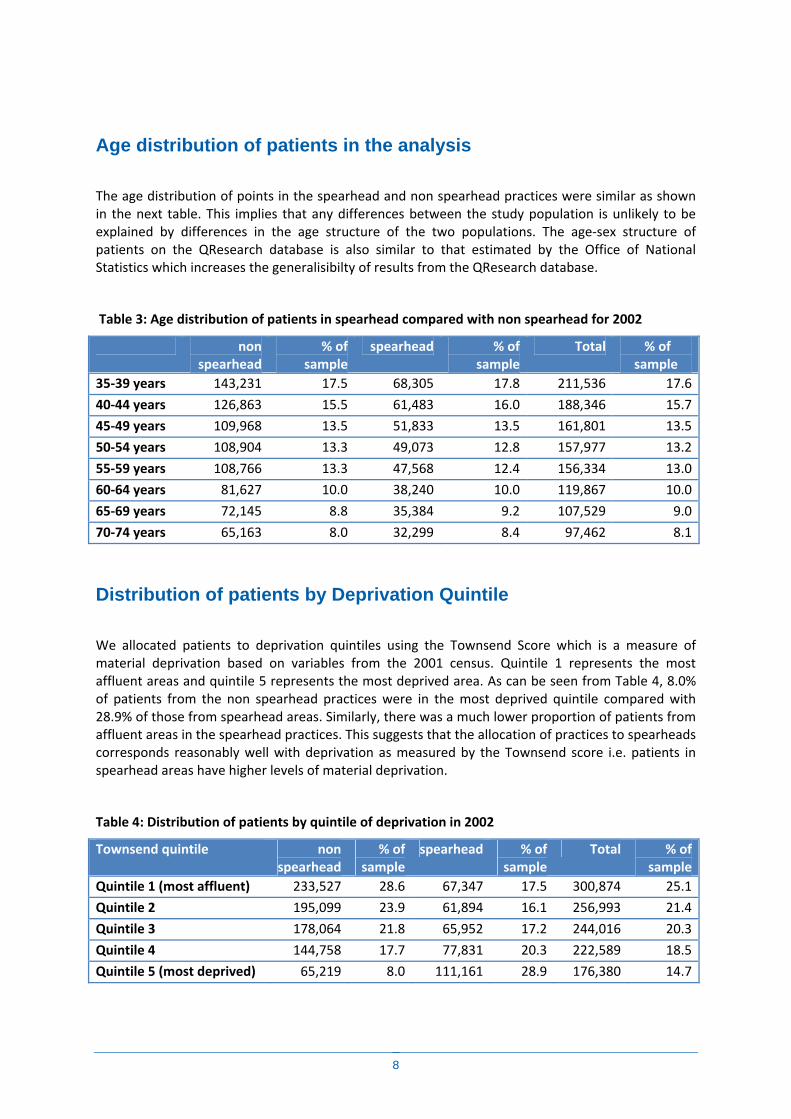
Age distribution of patients in the analysis
The age distribution of points in the spearhead and non spearhead practices were similar as shown in the next table. This implies that any differences between the study population is unlikely to be explained by differences in the age structure of the two populations. The age‐sex structure of patients on the QResearch database is also similar to that estimated by the Office of National Statistics which increases the generalisibilty of results from the QResearch database.
Table 3: Age distribution of patients in spearhead compared with non spearhead for 2002
non spearhead
% of sample
spearhead % of sample
Total % of sample
35‐39 years 143,231 17.5 68,305 17.8 211,536 17.6
40‐44 years 126,863 15.5 61,483 16.0 188,346 15.7
45‐49 years 109,968 13.5 51,833 13.5 161,801 13.5
50‐54 years 108,904 13.3 49,073 12.8 157,977 13.2
55‐59 years 108,766 13.3 47,568 12.4 156,334 13.0
60‐64 years 81,627 10.0 38,240 10.0 119,867 10.0
65‐69 years 72,145 8.8 35,384 9.2 107,529 9.0
70‐74 years 65,163 8.0 32,299 8.4 97,462 8.1
Distribution of patients by Deprivation Quintile
We allocated patients to deprivation quintiles using the Townsend Score which is a measure of material deprivation based on variables from the 2001 census. Quintile 1 represents the most affluent areas and quintile 5 represents the most deprived area. As can be seen from Table 4, 8.0% of patients from the non spearhead practices were in the most deprived quintile compared with 28.9% of those from spearhead areas. Similarly, there was a much lower proportion of patients from affluent areas in the spearhead practices. This suggests that the allocation of practices to spearheads corresponds reasonably well with deprivation as measured by the Townsend score i.e. patients in spearhead areas have higher levels of material deprivation.
Table 4: Distribution of patients by quintile of deprivation in 2002
Townsend quintile non spearhead
% of sample
spearhead % of sample
Total % of sample
Quintile 1 (most affluent) 233,527 28.6 67,347 17.5 300,874 25.1
Quintile 2 195,099 23.9 61,894 16.1 256,993 21.4
Quintile 3 178,064 21.8 65,952 17.2 244,016 20.3
Quintile 4 144,758 17.7 77,831 20.3 222,589 18.5
Quintile 5 (most deprived) 65,219 8.0 111,161 28.9 176,380 14.7

9
Distribution by ethnicity
We allocated each patient on the database according to self assigned ethnicity using 9 categories which have been used for other analyses using QResearch.
The categories were white, Indian, Bangladeshi, Pakistani, Other Asian, Black Caribbean, Black African, Chinese, Other. If ethnicity was not recorded, patients were included in the white group. The distribution of patient by ethnic group is shown in the next table
Table 5: Distribution of patients by ethnicity in 2002
spearhead non spearhead
Total
No. patients
% of sample
No. patients
% of sample
No. patients
% of sample
White/not recorded 368,582 95.9 796,766 97.6 1,165,348 97.0
Indian 2,147 0.56 6,344 0.78 8,491 0.71
Pakistani 2,391 0.62 2,010 0.25 4,401 0.37
Bangladeshi 2,475 0.64 351 0.04 2,826 0.24
Other Asian 681 0.18 1,992 0.24 2,673 0.22
Caribbean 3,067 0.80 3,470 0.42 6,537 0.54
Black African 2,116 0.55 1,521 0.19 3,637 0.30
Chinese 642 0.17 815 0.10 1,457 0.12
Other 2,084 0.54 3,398 0.42 5,482 0.46
Total 384,185 100.0 816,667 100.0 1,200,852 100.0
10
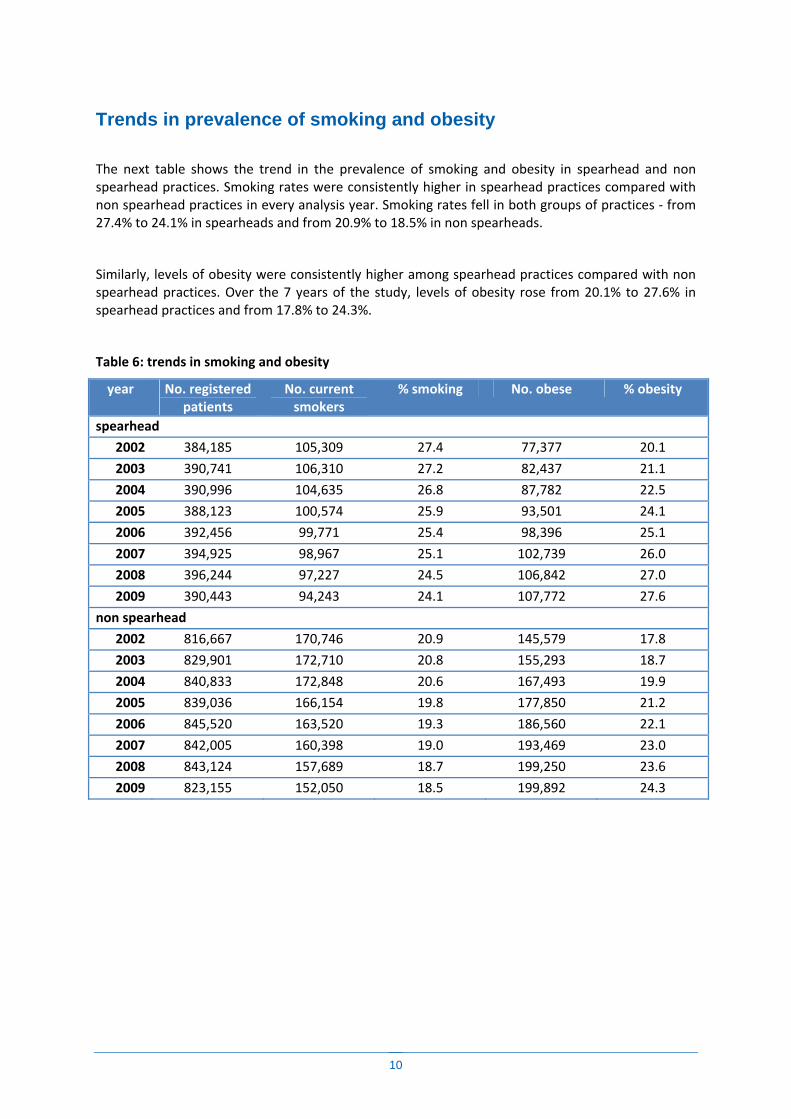
Trends in prevalence of smoking and obesity
The next table shows the trend in the prevalence of smoking and obesity in spearhead and non spearhead practices. Smoking rates were consistently higher in spearhead practices compared with non spearhead practices in every analysis year. Smoking rates fell in both groups of practices ‐ from 27.4% to 24.1% in spearheads and from 20.9% to 18.5% in non spearheads.
Similarly, levels of obesity were consistently higher among spearhead practices compared with non spearhead practices. Over the 7 years of the study, levels of obesity rose from 20.1% to 27.6% in spearhead practices and from 17.8% to 24.3%.
Table 6: trends in smoking and obesity
year No. registered patients
No. current smokers
% smoking No. obese % obesity
spearhead
2002 384,185 105,309 27.4 77,377 20.1
2003 390,741 106,310 27.2 82,437 21.1
2004 390,996 104,635 26.8 87,782 22.5
2005 388,123 100,574 25.9 93,501 24.1
2006 392,456 99,771 25.4 98,396 25.1
2007 394,925 98,967 25.1 102,739 26.0
2008 396,244 97,227 24.5 106,842 27.0
2009 390,443 94,243 24.1 107,772 27.6
non spearhead
2002 816,667 170,746 20.9 145,579 17.8
2003 829,901 172,710 20.8 155,293 18.7
2004 840,833 172,848 20.6 167,493 19.9
2005 839,036 166,154 19.8 177,850 21.2
2006 845,520 163,520 19.3 186,560 22.1
2007 842,005 160,398 19.0 193,469 23.0
2008 843,124 157,689 18.7 199,250 23.6
2009 823,155 152,050 18.5 199,892 24.3

11
Trends in patients at high risk CVD
The next table shows the percentage of patients at high risk of CVD in each year. For this study, high risk was defined a 10 year cardiovascular risk score of 20% using the QRISK2 score (www.qrisk.org). Whilst the percentage of patients at high risk tended to be higher in spearheads compared to non spearheads, the levels tended to fall in both groups over the 7 year study period. There were large changes in the proportion of high risk patients not prescribed aspirin in both groups of practices. This fall from 89.8% to 57.6% in spearheads compared with 90.5% to 64.8% in non spearheads. It is of interest that a higher percentage of patients in spearhead practices were prescribed statins compared with non spearhead practices. It should also be noted that not all patients at high risk of cardiovascular disease require statins since other interventions such as weight loss, blood pressure control, smoking cessation might be more suitable.
A similar pattern was found for aspirin though it should be noted that there is no clear consensus regarding the appropriate use of aspirin among patients at high risk of cardiovascular disease.
Table 7: Trends in patients at high risk of cardiovascular disease
year Total registered patients
High risk patients
i.e. QRISK2>2
0%
% at high risk
High risk patients not on statins
% high risk not on statins
high risk patients not on aspirin
% of high risk not on aspirin
Spearhead
2002 384,185 46,963 12.2 42,184 89.8 40,856 87.0
2003 390,741 46,160 11.8 39,527 85.6 39,133 84.8
2004 390,996 45,684 11.7 36,532 80.0 37,522 82.1
2005 388,123 43,897 11.3 32,046 73.0 34,556 78.7
2006 392,456 43,208 11.0 29,391 68.0 33,094 76.6
2007 394,925 42,906 10.9 26,756 62.4 32,014 74.6
2008 396,244 43,395 11.0 25,497 58.8 31,935 73.6
2009 390,443 43,461 11.1 25,049 57.6 32,237 74.2
Non spearhead
2002 816,667 86,847 10.6 78,580 90.5 76,630 88.2
2003 829,901 85,880 10.3 74,124 86.3 73,579 85.7
2004 840,833 85,569 10.2 69,822 81.6 71,278 83.3
2005 839,036 82,452 9.8 62,227 75.5 66,471 80.6
2006 845,520 81,217 9.6 57,986 71.4 64,575 79.5
2007 842,005 80,356 9.5 53,773 66.9 63,058 78.5
2008 843,124 81,766 9.7 53,002 64.8 63,744 78.0
2009 823,155 81,352 9.9 52,251 64.2 63,957 78.6
12
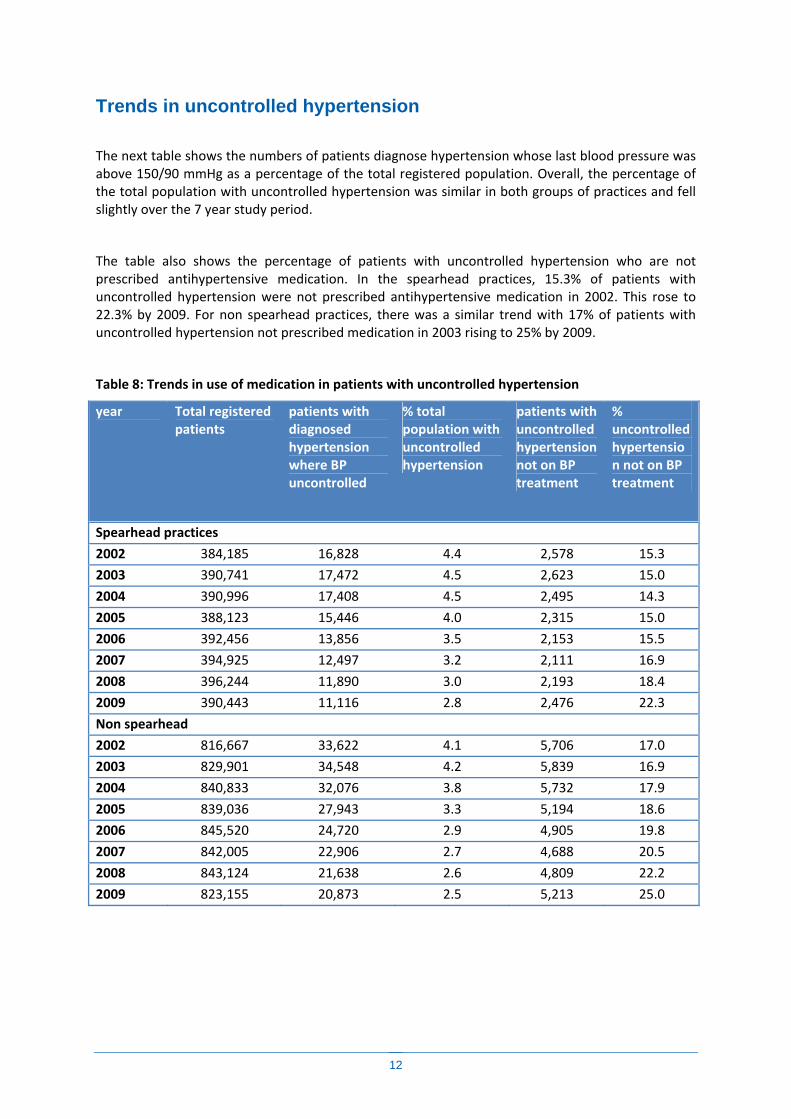
Trends in uncontrolled hypertension
The next table shows the numbers of patients diagnose hypertension whose last blood pressure was above 150/90 mmHg as a percentage of the total registered population. Overall, the percentage of the total population with uncontrolled hypertension was similar in both groups of practices and fell slightly over the 7 year study period.
The table also shows the percentage of patients with uncontrolled hypertension who are not prescribed antihypertensive medication. In the spearhead practices, 15.3% of patients with uncontrolled hypertension were not prescribed antihypertensive medication in 2002. This rose to 22.3% by 2009. For non spearhead practices, there was a similar trend with 17% of patients with uncontrolled hypertension not prescribed medication in 2003 rising to 25% by 2009.
Table 8: Trends in use of medication in patients with uncontrolled hypertension
year Total registered patients
patients with diagnosed hypertension where BP uncontrolled
% total population with uncontrolled hypertension
patients with uncontrolled hypertension not on BP treatment
% uncontrolled hypertension not on BP treatment
Spearhead practices
2002 384,185 16,828 4.4 2,578 15.3
2003 390,741 17,472 4.5 2,623 15.0
2004 390,996 17,408 4.5 2,495 14.3
2005 388,123 15,446 4.0 2,315 15.0
2006 392,456 13,856 3.5 2,153 15.5
2007 394,925 12,497 3.2 2,111 16.9
2008 396,244 11,890 3.0 2,193 18.4
2009 390,443 11,116 2.8 2,476 22.3
Non spearhead
2002 816,667 33,622 4.1 5,706 17.0
2003 829,901 34,548 4.2 5,839 16.9
2004 840,833 32,076 3.8 5,732 17.9
2005 839,036 27,943 3.3 5,194 18.6
2006 845,520 24,720 2.9 4,905 19.8
2007 842,005 22,906 2.7 4,688 20.5
2008 843,124 21,638 2.6 4,809 22.2
2009 823,155 20,873 2.5 5,213 25.0
13
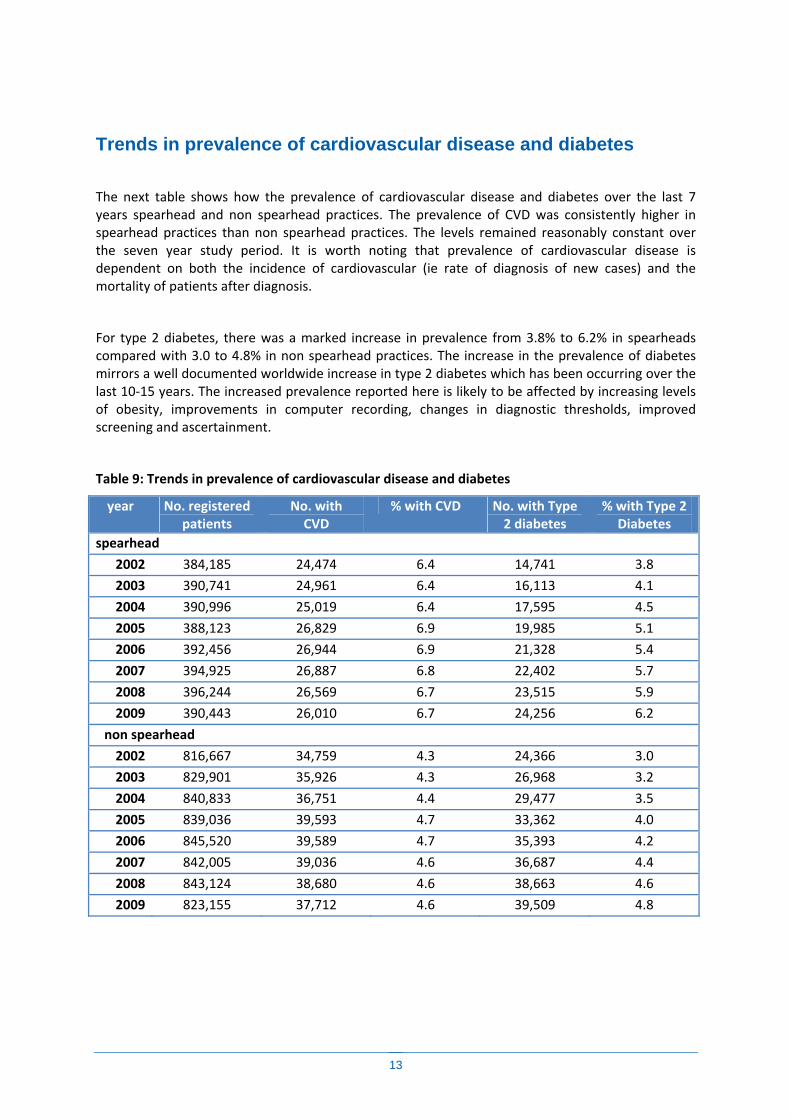
Trends in prevalence of cardiovascular disease and diabetes
The next table shows how the prevalence of cardiovascular disease and diabetes over the last 7 years spearhead and non spearhead practices. The prevalence of CVD was consistently higher in spearhead practices than non spearhead practices. The levels remained reasonably constant over the seven year study period. It is worth noting that prevalence of cardiovascular disease is dependent on both the incidence of cardiovascular (ie rate of diagnosis of new cases) and the mortality of patients after diagnosis.
For type 2 diabetes, there was a marked increase in prevalence from 3.8% to 6.2% in spearheads compared with 3.0 to 4.8% in non spearhead practices. The increase in the prevalence of diabetes mirrors a well documented worldwide increase in type 2 diabetes which has been occurring over the last 10‐15 years. The increased prevalence reported here is likely to be affected by increasing levels of obesity, improvements in computer recording, changes in diagnostic thresholds, improved screening and ascertainment.
Table 9: Trends in prevalence of cardiovascular disease and diabetes
year No. registered patients
No. with CVD
% with CVD No. with Type 2 diabetes
% with Type 2 Diabetes
spearhead
2002 384,185 24,474 6.4 14,741 3.8
2003 390,741 24,961 6.4 16,113 4.1
2004 390,996 25,019 6.4 17,595 4.5
2005 388,123 26,829 6.9 19,985 5.1
2006 392,456 26,944 6.9 21,328 5.4
2007 394,925 26,887 6.8 22,402 5.7
2008 396,244 26,569 6.7 23,515 5.9
2009 390,443 26,010 6.7 24,256 6.2
non spearhead
2002 816,667 34,759 4.3 24,366 3.0
2003 829,901 35,926 4.3 26,968 3.2
2004 840,833 36,751 4.4 29,477 3.5
2005 839,036 39,593 4.7 33,362 4.0
2006 845,520 39,589 4.7 35,393 4.2
2007 842,005 39,036 4.6 36,687 4.4
2008 843,124 38,680 4.6 38,663 4.6
2009 823,155 37,712 4.6 39,509 4.8

14
Trends in use of statins and aspirin in CVD
The next table shows trends in the use of statins and aspirin among patients with established cardiovascular disease. In the spearhead practices, 44% of patients with CVD were not prescribed statins compared with 43.9% in the non spearhead practices. The percentage decreased over the 7 years such that by 2009, 19.8% of CVD patients in spearhead practices were not prescribed statins compared with 21.9% of those in non spearhead areas. It is worth noting that some patients may have been offered statins but have declined statins. Alternatively some patients may have contraindications to their use. Also it is worth noting that the study period included the start of the GP Quality and Outcomes framework in 2004 and this is likely to have affected prescribing for patients with established cardiovascular disease and partly account for the increased use of statins for example.
The percentage of CVD patients not prescribed aspirin was similar between the two groups of practices and showed similar levels in 2002 and 2009. It is however worth noting that this indicator is based on a record of a prescription of aspirin being issued and that some patients buy aspirin over the counter or have contra‐indications which mean they can't take it.
Table 10: Trends in use of statins and aspirin in patients with established CVD
year patients with established
CVD
Patients with CVD not prescribed statins
% with CVD not prescribed statins
patients with CVD not prescribed aspirin
% patients with CVD not prescribed aspirin
Spearhead
2002 24,474 10,804 44.1 7,887 32.2
2003 24,961 8,868 35.5 7,648 30.6
2004 25,019 6,797 27.2 7,341 29.3
2005 26,829 5,765 21.5 7,702 28.7
2006 26,944 5,078 18.8 7,679 28.5
2007 26,887 4,593 17.1 7,709 28.7
2008 26,569 4,501 16.9 7,835 29.5
2009 26,010 5,148 19.8 8,449 32.5
Non spearhead
2002 34,759 15,244 43.9 12,337 35.5
2003 35,926 12,685 35.3 12,217 34.0
2004 36,751 10,686 29.1 12,138 33.0
2005 39,593 9,505 24.0 12,723 32.1
2006 39,589 8,610 21.7 12,789 32.3
2007 39,036 7,884 20.2 12,677 32.5
2008 38,680 7,764 20.1 12,743 32.9
2009 37,712 8,242 21.9 13,388 35.5

15
Health inequalities by deprivation: spearheads The next table compares each indicator for patients in the spearhead practices in 2002 and 2009, comparing those in the most deprived quintile the that for patients in the most affluent quintile.
Smoking: In 2002, 37.4% of patients in the most deprived group smoked compared with 16.1% in the most affluent group. The ratio of this difference was 2.32 indicating that smoking 132% higher in deprived compared with affluent groups at baseline. By 2009, smoking had fallen in both affluent and deprived groups but the ratio was 2.69 indicating smoking rates were 169% higher in deprived compared with affluent groups. This suggests that the gap has not narrowed and may well have widened.
Obesity: In contrast, levels of obesity rose over the 7 years in both affluent and deprived groups. In 2002, it affected 16.7% of affluent and 22.3% of deprived patients compared with 24.2 and 28.9% in 2009. Levels of obesity were 33% higher among deprived patients compared with affluent patients in 2002 and 22% higher in 2009 showing a small improvement in the gap
Uncontrolled blood pressure not on medication: although there was a rise in the percentage of patients with this indicator between 2002 and 2009, the levels were similar among deprived and affluent patients at both time points.
Patients at high risk of CVD: in2002, 14.4% of patients from deprived areas were at high risk of CVD compared with 10% in affluent areas. By 2009, the corresponding figures were 12.2 and 9.1. The ratio between deprived and affluent was 44% in 2002 and 22% in 2009.
Statin usage in patients with established CVD: There was an improvement in the percentage of patients with cardiovascular disease not on statins over the study period in both group. At baseline, 39.9% of affluent patients and 47.7% of deprived patients with CVD were not prescribed statins. By 2009, the corresponding figures were 20.6% and 18.8%.
Type 2 diabetes: After smoking, the most marked difference between affluent and deprived patients was prevalence of diabetes which was 101% higher in deprived verses affluent in 2002 compared with 77% higher in deprived verses affluent by 2009.
Table 11: % achievement of indicators in deprived verses affluent patients in spearhead practices
Quintile 1
affluent
Quintile 5
deprived
ratio of deprived
to affluent
Quintile 1
affluent
Quintile 5
deprived
ratio of deprived
to affluent
2002 2002 2002 2009 2009 2009 % of smokers 16.1 37.4 2.32 12.8 34.5 2.69
% obese 16.7 22.3 1.33 24.2 28.9 1.20
% with type 2 diabetes 2.6 5.2 2.01 4.5 8.0 1.77
Uncontrolled BP not on medication
15.9 16.3 1.02 23.0 22.6 0.98
% High risk of CVD 10.0 14.4 1.44 9.9 12.1 1.22
% High risk CVD not on statins 90.7 89.0 0.98 61.6 55.2 0.90
% High risk CVD not on aspirin 87.0 86.2 0.99 75.3 74.0 0.98
% with CVD not on statins 39.9 47.7 1.19 18.8 20.6 1.09
% with CVD not on aspirin 33.5 30.5 0.91 33.2 31.2 0.94
% with established CVD 5.1 7.1 1.39 5.7 7.2 1.27 Similar results were obtained when adjustments were made for age and presence of diabetes.

16
Health inequalities by deprivation: non spearheads
The next table shows each indicator for patients in the non‐ spearhead practices in 2002 and 2009, comparing those in the most deprived quintile with that for patients in the most affluent quintile.
Smoking: In 2002, 33.3% of patients in the most deprived group smoked compared with 14.7% in the most affluent group. The ratio of this difference was 2.27 indicating that smoking 127% higher in deprived compared with affluent groups at baseline. By 2009, smoking had fallen in both affluent and deprived groups but the ratio was 2.50 indicating smoking rates were 150% higher in deprived compared with affluent groups. This suggests that the gap has not narrowed over time.
Obesity: In contrast, levels of obesity rose over the 7 years in both affluent and deprived groups. In 2002, it affected 16.0% of affluent and 19.5% of deprived patients compared with 22.4 and 24.8% in 2009. Levels of obesity were 22% higher among deprived patients compared with affluent patients in 2002 and 11% higher in 2009 showing a small improvement.
Uncontrolled blood pressure not on medication: although there was a rise in the percentage of patients with this indicator between 2002 and 2009, the levels were similar among deprived and affluent patients at both time points.
Patients at high risk of CVD: in2002, 12.8% of patients from deprived areas were at high risk of CVD compared with 9.4% in affluent areas. By 2009, the corresponding figures were 10.3 and 9.3. The ratio between deprived and affluent was 35% in 2002 and 11% in 2009. The use of statins in patients at high risk of CVD was similar among deprived and affluent groups.
Statin usage in patients with established CVD: There was an improvement in the percentage of patients with cardiovascular disease not on statins over the study period. At baseline, 42.2% of affluent patients and 47.4% of deprived patients with CVD were not prescribed statins. By 2009, the corresponding figures were 21.4% and 23.4%.
Table 12: % achievement of indicators in deprived verses affluent patients in non spearhead practices
Quintile 1
affluent
Quintile 5
deprived
ratio of deprived
to affluent
Quintile 1
affluent
Quintile 5
deprived
ratio of deprived
to affluent
2002 2002 2002 2009 2009 2009 % of smokers 14.7 33.3 2.27 12.3 30.6 2.50
% obese 16.0 19.5 1.22 22.4 24.8 1.11
% with type 2 diabetes 2.40 4.00 1.68 4.00 5.90 1.48
% Uncontrolled BP not on medication
16.7 18.2 1.09 23.5 26.7 1.13
% High risk of CVD 9.4 12.8 1.35 9.3 10.3 1.11
% High risk CVD not on statins 90.7 90.2 0.99 66.5 62.6 0.94
% High risk CVD not on aspirin 88.6 88.0 0.99 79.4 78.6 0.99
% with CVD not on statins 42.2 47.4 1.12 21.4 23.4 1.10
% with CVD not on aspirin 37.0 34.6 0.93 35.5 36.6 1.03
% with established CVD 4.00 4.70 1.18 4.40 4.60 1.05
17
Health inequalities by ethnicity
The appendix shows the % of each indicator by ethnic group in patients from spearhead and non spearheads in 2002 and 2009.
There are a great number of comparisons which can be made from the table in the Appendix. However, overall there are marked variations between the ethnic groups for most measures which are consistent with the published literature. The pattern was similar for patients in spearheads compared with non spearhead PCTs. The overall trends over time were similar to those observed for the whole population.
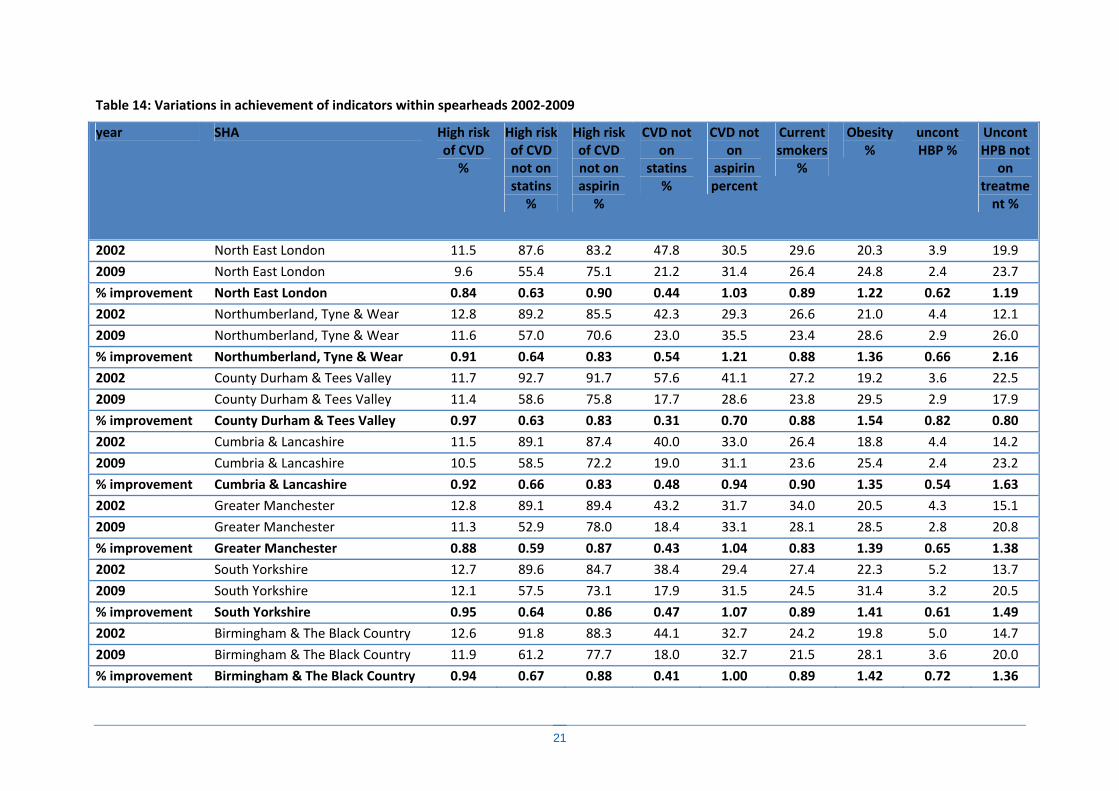
Variations in indicators by geographical area
The associated Supplement “Health Inequalities Results by SHA (1.0).xlsx” shows trends in indicators by Strategic Health Authority area for each year 2002‐2009. The appendix has a summary of this with a comparison for 2002‐2009 for the spearheads only. However, it is apparent from the summary table 14, there are substantial geographical variations not only in the baseline levels for the indicators but also in the changes over the last 7 years. For example, baseline smoking rates were highest in Manchester with 34% current smokers and Manchester also showed the greatest percentage reduction in smoking with 28% current smokers by 2009. Whilst obesity levels were highest in South Yorkshire in 2002, the greatest increases over the 7 year study period were found in County Durham and Tees Valley. The reader should note, however, that these analyses are based on a sample of practices in each area derived from the QResearch database and is therefore only an estimate so should be treated with caution.
Acknowledgements
We acknowledge the contribution of EMIS and EMIS practice who contribute data for medical research. This report can be freely reproduced and copied so long as the source of the document is acknowledged and the source of the data as the QResearch database.
Scientific approval
This proposal was approved by the QResearch scientific committee in accordance with the approval from Trent MREC.
Declarations
JHC is director of QResearch which is a not‐for‐profit partnership between the University of Nottingham and EMIS, commercial supplier of GP computer systems to 56% of UK GPs. She is also director of ClinRisk Ltd which supplies software designed to ensure the correct implement risk prediction algorithms, such as QRISK, into clinical practice. She is also professor of clinical

18
epidemiology and general practice at the University of Nottingham and a GP at a local Nottingham practice.

7 Appendix
Table 13: Achievement of indicators and disease prevalence by ethnic group in spearheads and non spearheads in 2002 and 2009
spearhead 2002 % smoker
% obese
% type 2
uncontrolled BP
high risk CVD
high risk not
on statins
high risk not
on aspirin
CVD not on
statins
CVD not on
aspirin
CVD
White/Not recorded
27.7 20.0 3.4 15.3 12.1 90.1 87.2 44.0 32.5 6.4
Indian 12.2 17.9 13.5 13.9 15.6 85.4 80.7 36.0 18.6 7.5
Pakistani 19.0 23.3 17.5 9.2 24.0 86.4 85.2 38.8 21.9 8.2
Bangladeshi 29.2 16.8 21.6 15.9 21.3 86.4 86.9 51.5 27.0 9.4
Other Asian 18.1 16.2 12.0 23.5 13.2 87.8 91.1 50.0 29.4 5.0
Caribbean 26.2 30.1 13.7 12.6 15.1 80.1 73.2 61.5 28.7 5.7
Black African 11.8 27.9 6.4 19.2 2.1 86.4 72.7 65.6 31.3 1.5
Chinese 13.2 7.8 6.4 29.6 2.5 93.8 75.0 30.8 46.2 2.0
Other 31.8 22.7 7.1 13.8 8.1 86.3 80.4 60.9 31.9 3.3
spearhead 2009
White/Not recorded
24.6 27.8 5.6 22.1 11.1 58.4 74.5 19.8 32.8 6.8
Indian 10.3 20.5 15.7 24.1 15.9 52.9 67.8 17.0 26.9 7.4
Pakistani 17.4 28.7 20.5 25.9 21.7 47.8 71.2 16.1 26.1 9.5
Bangladeshi 25.3 17.7 22.2 16.0 16.7 45.0 73.6 12.4 20.2 8.0
Other Asian 15.4 17.2 10.2 41.5 11.1 51.4 73.4 9.7 33.9 3.2
Caribbean 24.4 33.7 14.6 17.2 11.0 43.3 64.3 27.8 38.2 5.4
Black African 9.4 33.8 8.7 27.3 1.9 35.4 50.5 32.6 31.6 1.9
Chinese 11.5 8.1 7.8 28.6 1.6 15.0 40.0 26.3 52.6 1.5
Other 27.7 25.6 8.3 27.2 5.5 51.4 71.4 28.7 29.3 3.4

20
non spearhead 2002
White/Not recorded
21.0 17.8 2.8 17.0 10.6 90.7 88.5 43.9 35.8 4.2
Indian 10.4 16.0 14.5 14.5 19.5 83.7 78.1 34.9 21.4 7.6
Pakistani 15.8 22.0 13.9 14.5 22.7 88.6 87.3 47.5 19.8 8.1
Bangladeshi 23.1 15.7 19.1 23.8 17.7 83.9 93.5 51.4 24.3 10.5
Other Asian 16.9 15.0 9.4 19.2 13.9 83.8 83.8 37.4 27.5 4.6
Caribbean 21.4 25.9 10.8 14.8 10.4 81.2 76.8 54.0 31.4 3.9
Black African 13.7 24.9 5.6 27.1 1.6 70.8 79.2 56.1 19.5 2.7
Chinese 12.3 7.7 4.7 19.0 1.7 78.6 78.6 52.4 47.6 2.6
Other 23.6 19.7 9.2 13.4 9.5 83.5 81.7 39.5 35.8 4.8
non spearhead 2009
White/Not recorded
18.7 24.4 4.4 24.9 9.8 65.0 79.2 21.9 35.8 4.6
Indian 8.9 18.6 17.4 24.5 17.5 49.2 66.0 16.4 26.8 7.4
Pakistani 15.1 28.5 16.6 20.5 21.3 60.7 77.4 18.8 23.6 7.9
Bangladeshi 22.3 17.1 21.4 22.7 14.3 52.9 77.2 21.7 34.8 7.3
Other Asian 13.1 17.0 11.1 28.6 9.7 48.9 74.7 20.7 32.9 4.2
Caribbean 20.7 33.0 12.5 18.5 9.0 44.0 60.7 26.4 31.5 4.0
Black African 10.4 30.7 7.7 39.4 1.6 50.6 62.3 36.0 41.0 2.1
Chinese 10.8 8.6 5.9 29.6 0.8 50.0 78.6 39.4 45.5 1.8
Other 20.2 23.7 9.3 29.1 6.7 48.6 66.0 28.3 37.2 3.3
21
Table 14: Variations in achievement of indicators within spearheads 2002‐2009
year SHA High risk of CVD
%
High risk of CVD not on statins
%
High risk of CVD not on aspirin
%
CVD not on
statins %
CVD not on
aspirin percent
Current smokers
%
Obesity %
uncont HBP %
Uncont HPB not
on treatment %
2002 North East London 11.5 87.6 83.2 47.8 30.5 29.6 20.3 3.9 19.9
2009 North East London 9.6 55.4 75.1 21.2 31.4 26.4 24.8 2.4 23.7
% improvement North East London 0.84 0.63 0.90 0.44 1.03 0.89 1.22 0.62 1.19
2002 Northumberland, Tyne & Wear 12.8 89.2 85.5 42.3 29.3 26.6 21.0 4.4 12.1
2009 Northumberland, Tyne & Wear 11.6 57.0 70.6 23.0 35.5 23.4 28.6 2.9 26.0
% improvement Northumberland, Tyne & Wear 0.91 0.64 0.83 0.54 1.21 0.88 1.36 0.66 2.16
2002 County Durham & Tees Valley 11.7 92.7 91.7 57.6 41.1 27.2 19.2 3.6 22.5
2009 County Durham & Tees Valley 11.4 58.6 75.8 17.7 28.6 23.8 29.5 2.9 17.9
% improvement County Durham & Tees Valley 0.97 0.63 0.83 0.31 0.70 0.88 1.54 0.82 0.80
2002 Cumbria & Lancashire 11.5 89.1 87.4 40.0 33.0 26.4 18.8 4.4 14.2
2009 Cumbria & Lancashire 10.5 58.5 72.2 19.0 31.1 23.6 25.4 2.4 23.2
% improvement Cumbria & Lancashire 0.92 0.66 0.83 0.48 0.94 0.90 1.35 0.54 1.63
2002 Greater Manchester 12.8 89.1 89.4 43.2 31.7 34.0 20.5 4.3 15.1
2009 Greater Manchester 11.3 52.9 78.0 18.4 33.1 28.1 28.5 2.8 20.8
% improvement Greater Manchester 0.88 0.59 0.87 0.43 1.04 0.83 1.39 0.65 1.38
2002 South Yorkshire 12.7 89.6 84.7 38.4 29.4 27.4 22.3 5.2 13.7
2009 South Yorkshire 12.1 57.5 73.1 17.9 31.5 24.5 31.4 3.2 20.5
% improvement South Yorkshire 0.95 0.64 0.86 0.47 1.07 0.89 1.41 0.61 1.49
2002 Birmingham & The Black Country 12.6 91.8 88.3 44.1 32.7 24.2 19.8 5.0 14.7
2009 Birmingham & The Black Country 11.9 61.2 77.7 18.0 32.7 21.5 28.1 3.6 20.0
% improvement Birmingham & The Black Country 0.94 0.67 0.88 0.41 1.00 0.89 1.42 0.72 1.36

22