health inequalities policy review for the scottish ... · pdf filebeeston c, mccartney g, ford...
TRANSCRIPT

NHS Health Scotland: Health Inequalities Policy Review
XX
June 2013
Health Inequalities Policy Review for the Scottish Ministerial Task Force on Health Inequalities
NHS Health Scotland June 2013
June 2013We are happy to consider requests for other languages or formats. Please contact 0131 314 5300 or email [email protected]
Published by NHS Health Scotland
1 South Gyle CrescentEdinburgh EH12 9EB
© NHS Health Scotland 2014
ISBN: 978-1-84485-573-5
All rights reserved. Material contained in this publication may not be reproduced in whole or part without prior permission of NHS Health Scotland (or other copyright owners). While every effort is made to ensure that the information given here is accurate, no legal responsibility is accepted for any errors, omissions or misleading statements.
NHS Health Scotland is a WHO Collaborating Centre for Health Promotion and Public Health Development.
This report should be cited as:
Beeston C, McCartney G, Ford J, Wimbush E, Beck S, MacDonald W, and Fraser A. Health Inequalities Policy Review for the Scottish Ministerial Task Force on Health Inequalities. NHS Health Scotland. Edinburgh. 2014
Acknowledgements The following members of the NHS Health Scotland project team also provided invaluable contributions to the analysis and writing of this report:
Neil Craig, who provided advice on cost-effectiveness and general comment Debbie McLaren, who provided administrative support Fiona Myers, who contributed to the analysis of Equally Well Eileen Scott, who provided evidence related to children and young people Sonya Scott, who undertook much of the epidemiological analysis and interpretation
We are very grateful to the time, support and advice provided by the Review Panel for this policy review:
Professor Dame Sally Macintyre (Chair), Director of the Institute of Health and Wellbeing and Director of the MRC/CSO Social & Public Health Sciences Unit, University of Glasgow Professor Carol Tannahill, Director, Glasgow Centre for Population Health Janice Hewitt, Assistant Chief Executive, Stirling Council Dr Fergus Millan, Public Health Division, Scottish Government
This report is the second submission from NHS Health Scotland to the 2013 Ministerial Task Force on Health Inequalities. It builds on the analysis in the first, What would be sufficient to reduce Health Inequalities in Scotland? by Dr Gerry McCartney.

NHS Health Scotland: Health Inequalities Policy Review June 2013
i
ForewordInequalities in health, between the most and least privileged people and communities, are clearly apparent in Scotland. In 2009/10, for example, life expectancy at birth for men was 69 years for the most deprived 10th of the population compared to 82 years for the least deprived 10th, a difference of 13 years. The difference in healthy life expectancy was even more stark, at 47 years for men in the most deprived 10th compared to 70 years for those in the least deprived 10th, a difference of 23 years. This demonstrates how social inequalities in a range of life chances (early life experiences, education, employment, family life, income and wealth, housing, environmental hazards, etc.) can become literally ‘embodied’ and shape people’s health and longevity. Such differences are clearly unacceptable by any standards of social justice.
This Review by NHS Health Scotland was set up to provide information to the 2013 Scottish Ministerial Task Force on Health Inequalities. It describes the factors generating health inequalities, Scotland’s health inequalities position compared to other countries, and recent trends in health inequalities in Scotland; reviews the 2008 Equally Well strategy and its implementation; and summarises the best available evidence about measures likely to be effective and ineffective in reducing inequalities in health. An important conclusion is that relying on individual efforts (‘downstream’ interventions) is likely to be relatively ineffective in reducing inequalities compared to improving the life circumstances and environments of more deprived people and communities (‘upstream’ policies). This Review commends the policy principle of proportionate universalism (the whole population having access as of right to benefits and opportunities, but greater investment for those in more disadvantaged circumstances), and notes that policies to reduce inequalities in health need to extend beyond health care to cover numerous other sectors such as environmental regulation, and education, housing, employment, welfare and transport policies.
The report was produced by a professional team at NHS Health Scotland, supported by an external advisory group. On behalf of the advisory group I would like to commend this report and its conclusions to the Scottish Ministerial Task Force.
Professor Dame Sally Macintyre CBE, PhD, DSc Chair, External Policy Review Panel

NHS Health Scotland: Health Inequalities Policy Review June 2013
ii
Contents Page No.
Key messages 1
1. Introduction 81.1 Purpose 81.2 The context for the policy review 8
2. Review of Equally Well 102.1 The Equally Well strategy 112.2 Trends in health inequalities in Scotland –
are there signs of change? 222.3 Summary 25
3. Understanding and addressing health inequalities 263.1 What are health inequalities? 263.2 Theory of causation – how do inequalities arise? 293.3 The manifestations of health inequalities change over time 323.4 Explaining trends in health inequalities 343.5 Addressing health inequalities: some guiding principles 383.6 The potential for improvement 453.7 Summary 47
4. What works to address health inequalities? 494.1 Income, employment and work 504.2 The physical environment and local opportunities 544.3 Education and learning 584.4 Access to services 604.5 Social, cultural and interpersonal 674.6 Summary 70
5. The challenges ahead 715.1 Policy – national level actions 725.2 Practice – local level actions 735.3 Advocacy and evidence – national–local intermediary roles 79
6. Summary and recommendations 82
References 84
NHS Health Scotland: Health Inequalities Policy Review June 2013
iii
List of tables and figures
Figures
1. Health inequalities: theory of causation (summary version)
2. Trends in all-cause mortality rates (for men and women combined) for the most and least deprived deciles (by Carstairs 1981–2001 (all ages) and SIMD 1997–2010 (aged <75y and 15–44y))
3. Trends in absolute all-cause mortality inequality (1981–2001 using Carstairs index (all ages); 1996 onwards using SIMD (<75y and 15–44y); men and women combined)
4. Trends in relative all-cause mortality inequality (1981–2001 using Carstairs index; 1996 onwards using SIMD; men and women combined)
5. Life expectancy at birth for men and women in Scotland compared with other Western European countries from 1950
6. Mortality inequalities between the most and least educated men in selected European countries c.2001
7. Mortality inequalities between the most and least educated women in selected European countries c.2001
8. Trends in health inequalities in Great Britain 1921–2007
9. Health inequalities: theory of causation
10. Schematic representation of the changing causes of health inequalities over time
11. Ischaemic heart disease mortality trends for the most and least deprived deciles (men and women combined, <75y, by SIMD deciles, 1997–2010)
12. Trends in absolute and relative all-cause mortality inequalities and trends in income inequalities (mortality for men and women combined, for various age groups, using Carstairs and SIMD indices)
13. Example of proportionate universalism as applied to services of young children
14. Life expectancy at birth in Scotland, and in Scotland with Glasgow and without West Central Scotland*, 2011 (Source: National Records for Scotland)**
15. Comparison of all-cause death rates in selected European countries, Scotland and local council areas of Scotland. Men aged 0–64 during 2001
16. Female life expectancy at birth in the most and least deprived quintiles within each Scottish local authority area (2006–2010)
17. Male life expectancy at birth in the most and least deprived quintiles within each Scottish local authority area (2006–2010)
NHS Health Scotland: Health Inequalities Policy Review June 2013
iv
Tables
1. What works to address health inequalities across the three levels of determinants
2. Equally Well – Reducing inequalities in Scotland’s health
3. Key components of a health inequalities strategy
4. What works to address health inequalities across the three levels of determinants
Boxes
1. Equally Well test sites
2. Principles for effective policies to reduce inequalities in health
3. Characteristics of policies more likely to be effective in reducing inequalities in health
4. Characteristics of policies that are less likely to be effective in reducing inequalities in health
5. Recurring evaluation challenges

NHS Health Scotland: Health Inequalities Policy Review June 2013
1
Key messages Review of Equally Well
Equally Well was launched in 2008 with the aim of addressing health inequalities in Scotland. The strategy was bold, grounded in good evidence and has made progress in some areas. The improvements in the overall health of the population and the decrease in average mortality rates have continued. However, the gap between those with the best and the worst health outcomes persists and too many Scots still die prematurely.
Key messages:
1. Absolute health inequalities, (the outcome gap between the most deprived and least deprived) remain high. Relative inequalities, (the ratio between the two) have increased steadily since 1981. This is because the health of the least deprived groups has improved at a faster rate than the most deprived.
2. Equally Well actions have been more focused on mitigating the consequences of social inequalities, like smoking and alcohol misuse, than on addressing the long- term underlying causes, such as poverty and income. Learning from the test sites has, so far, achieved a limited amount.
3. Despite its ambitions, Equally Well has primarily been delivered as a health and wellbeing initiative with limited spread into policy areas other than early years. Genuine cross-government linkage around Equally Well has been limited. Many of the underlying causes of health inequalities require a broader understanding of the need for social and economic, rather than mainly health-based, solutions. There is a continuing need to ensure that policies across national and local government address the underlying causes of health inequalities.
Understanding and addressing health inequalities
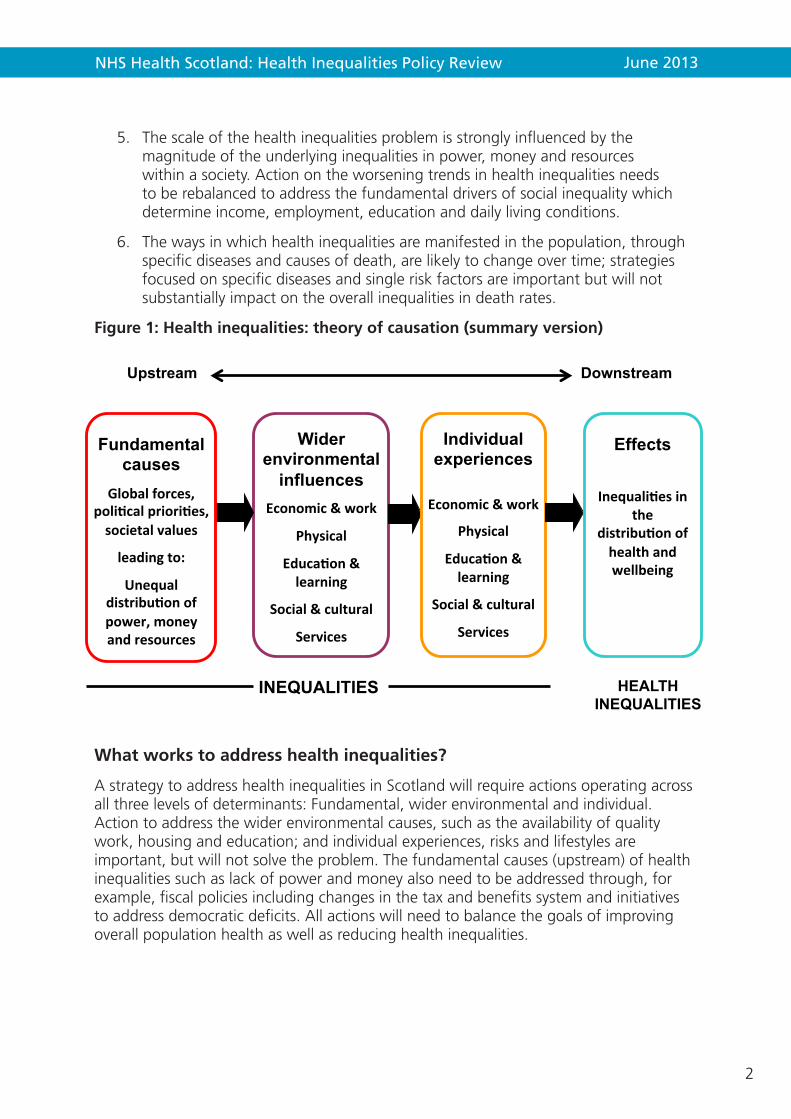
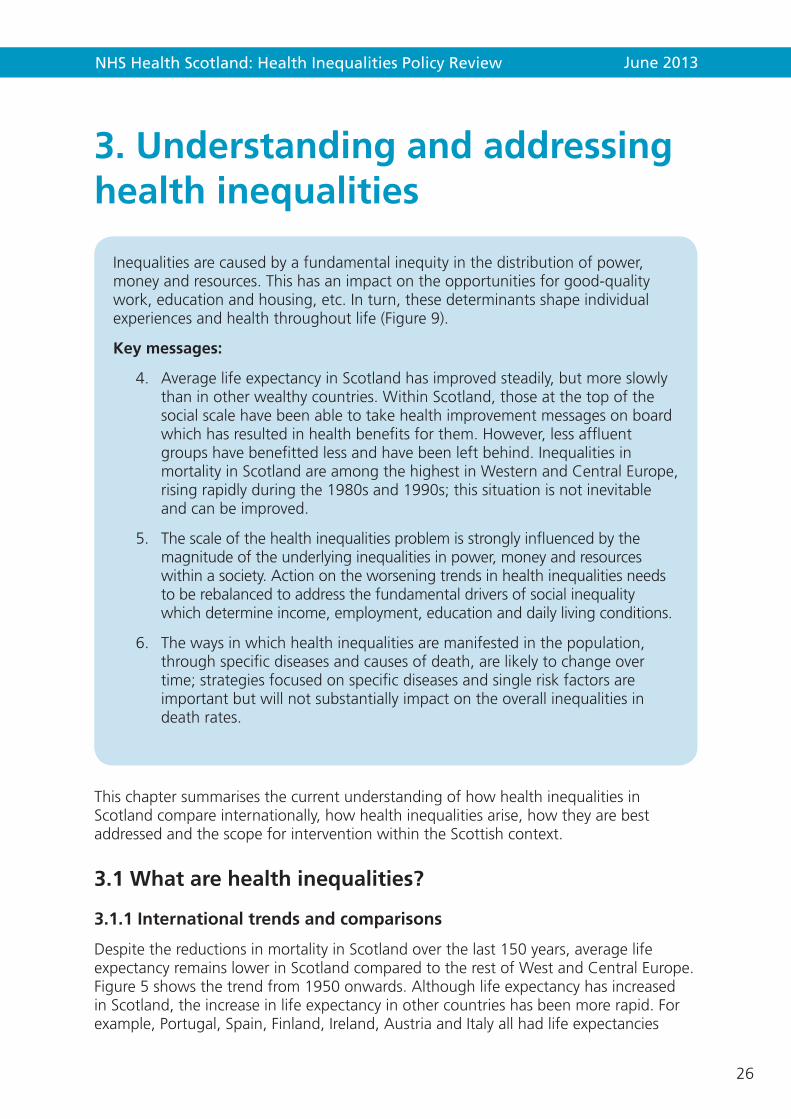
Inequalities are caused by a fundamental inequity in the distribution of power, money and resources. This has an impact on the opportunities for good-quality work, education and housing, etc. In turn, these determinants shape individual experiences and health throughout life (Figure 1 below).
Key messages:
4. Average life expectancy in Scotland has improved steadily, but more slowly than in other wealthy countries. Within Scotland, those at the top of the social scale have been able to take health improvement messages on board which has resulted in health benefits for them. However, less affluent groups have benefited less and have been left behind. Inequalities in mortality in Scotland are among the highest in Western and Central Europe, rising rapidly during the 1980s and 1990s; this situation is not inevitable and can be improved.
NHS Health Scotland: Health Inequalities Policy Review June 2013
2
5. The scale of the health inequalities problem is strongly influenced by the magnitude of the underlying inequalities in power, money and resources within a society. Action on the worsening trends in health inequalities needs to be rebalanced to address the fundamental drivers of social inequality which determine income, employment, education and daily living conditions.
6. The ways in which health inequalities are manifested in the population, through specific diseases and causes of death, are likely to change over time; strategies focused on specific diseases and single risk factors are important but will not substantially impact on the overall inequalities in death rates.
Figure 1: Health inequalities: theory of causation (summary version)
What works to address health inequalities?
A strategy to address health inequalities in Scotland will require actions operating across all three levels of determinants: Fundamental, wider environmental and individual. Action to address the wider environmental causes, such as the availability of quality work, housing and education; and individual experiences, risks and lifestyles are important, but will not solve the problem. The fundamental causes (upstream) of health inequalities such as lack of power and money also need to be addressed through, for example, fiscal policies including changes in the tax and benefits system and initiatives to address democratic deficits. All actions will need to balance the goals of improving overall population health as well as reducing health inequalities.
Wider environmental
influences Economic & work
Physical
Educa4on & learning
Social & cultural
Services
Individual experiences
Economic & work
Physical
Educa4on & learning
Social & cultural
Services
Fundamental causes
Global forces, poli4cal priori4es, societal values
leading to:
Unequal distribu4on of power, money and resources
INEQUALITIES
Effects
Inequali4es in the
distribu4on of health and wellbeing
HEALTH INEQUALITIES
Upstream Downstream

NHS Health Scotland: Health Inequalities Policy Review June 2013
3
Key messages:
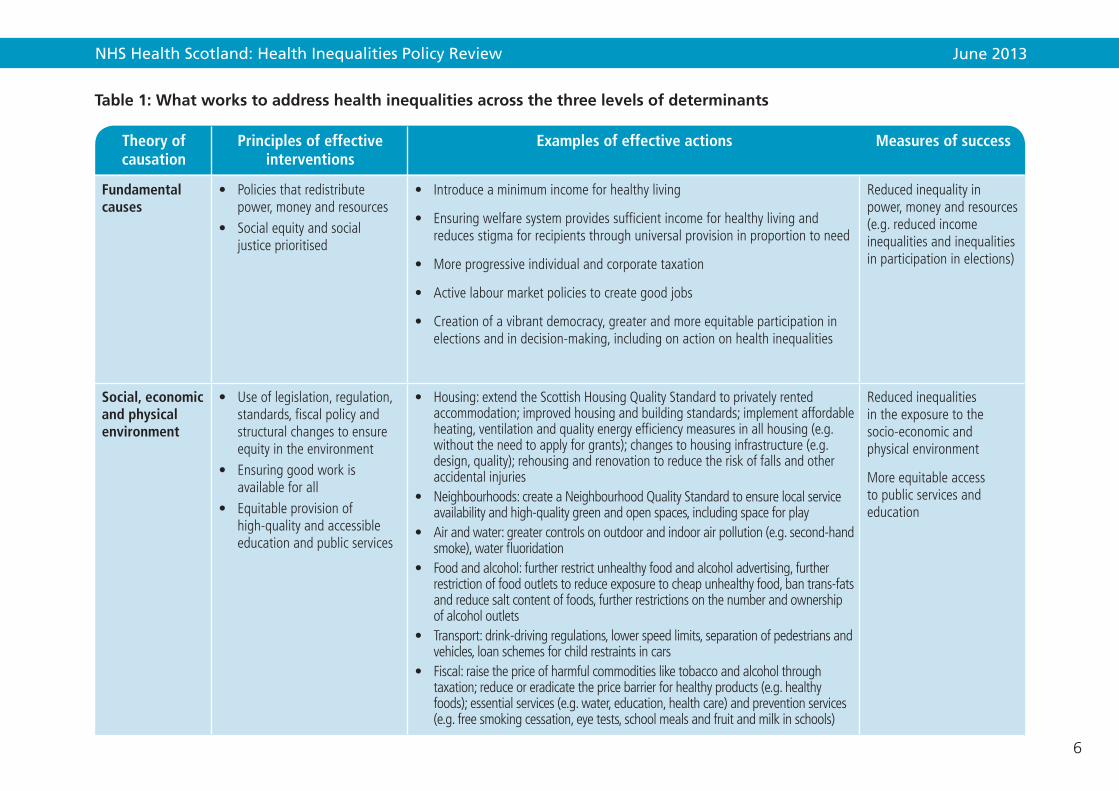
7. Actions that are more likely to be effective in addressing wider environmental causes include: structural changes in the environment, for instance on roads; speed-reducing measures in deprived areas; legislative and regulatory controls, for example the smoking ban; and housing regulations. What is known to date about the range of specific actions that are effective in reducing health inequalities are summarised in Table 1.
8. Actions that are more likely to be effective in mitigating the effects of health inequalities at an individual level may require redesign of public services. They include targeting high-risk individuals, intensive tailored support for those with greatest need, and a focus on early child development. Where possible, for individuals, it is best to use a direct measure of need (e.g. individual income, disability, housing status or long-term health condition) rather than a proxy (e.g. area deprivation).
9. Inequalities account for a significant element of the increasing demands on our public services because of a persisting cycle of deprivation and low aspiration. Around 40 per cent of our spending is currently accounted for by interventions that could have been avoided by prioritising a preventative approach. The focus needs to shift away from meeting the cost of dealing with health or social problems after they have developed to prevention and early intervention.
The challenges ahead
Given the complexity of the challenge, concerted action across all three levels of the social determinants of health requires political commitment and leadership at both national and local levels and effective actions led by Community Planning Partnerships (CPPs). Action must be based on evidence of need and what is most likely to work, and delivered through partnerships and ways of working that are based on sound principles. Resources and actions need to be reallocated from interventions that are not effective to those focused on reducing health inequalities.
Key messages:
10. Policy – national level, preventative actions that protect and benefit the whole population are likely to be more effective and cost-effective if they focus on legislative and regulatory controls, and fiscal policies. Political commitment and leadership is required to ensure public resources are distributed in a way that brings universal benefit, but with a scale and intensity that is proportionate to the level of need.
11. Practice – Community Planning Partnerships (CPPs) are the main vehicle for the cross-sectoral work that is necessary at local level to address inequalities and ensure, for example, the delivery of linked services that support those in greatest need and offer intensive tailored support. Services should be co-designed with citizens to ensure they meet the needs and aspirations of the population rather than being imposed. All CPPs need to address inequalities. However, to ensure

NHS Health Scotland: Health Inequalities Policy Review June 2013
4
a significant impact on national health inequalities there needs to be particular focus on those CPP areas that contribute most to the overall health inequalities in Scotland. The relationships between communities and services matter, and working with people rather than targeting initiatives at people is important. Scaling up initiatives, and the use of improvement methodology, is commendable when it ensures and can demonstrate the reach of services to those in greatest need.
12. Advocacy and evidence – there is an important role for national agencies to support local delivery through advocacy and evidence-building. This includes building the will among leaders and influencers, expanding and making accessible the evidence base about what works to address health inequalities, spreading effective practice through a workforce that understands the fundamental and wider environmental determinants of health inequalities, raising public awareness and support for effective actions and ensuring that the voices and experiences of the least advantaged communities are taken into account in the planning and delivery processes.
Recommendations
1. Health inequalities policy should be at the heart of the Scottish Government’s drive for social justice, a key plank of the Single Outcome Agreements and central to the preventative spend agenda. Priority must be given to addressing the upstream fundamental causes of health inequalities which include poverty and income, as well as the wider environmental factors such as housing and education over the downstream consequences like smoking and alcohol abuse.
2. The Scottish Government and COSLA should regularly review the balance of policy and resources directed to actions aimed at tackling the fundamental causes of health inequalities rather than individual lifestyle interventions, which do not, on their own, deliver the changes required.
a) A future inequalities strategy should consider actions at all levels of the social determinants of health – the economic and social conditions in our society and how they are distributed.
b) A life course approach is helpful, particularly if actions and resources are targeted at early years which offers the best opportunity of preventing future health inequalities.
c) Central and local government need to focus on the implementation of the measures which are most likely to be effective and to discontinue those which widen inequalities. Examples of effective interventions are given in Table 1.
3. While action will be taken at a national level, a significant contribution needs to take place locally, connecting with communities and building the hopes of people that face the greatest challenges. The National Community Planning Group should advocate that those CPP areas which contribute most to health inequalities in Scotland should prioritise their actions in a drive to narrow health inequalities. The focus for spending needs to shift away from meeting the cost of dealing with health and social problems after they have developed, to prevention and early intervention.

NHS Health Scotland: Health Inequalities Policy Review June 2013
5
4. There is a continuing role for national and local government, meeting regularly, to ensure the political focus on cross-government and cross-agency work to address the fundamental causes and social determinants of health inequalities, with linkage to equality. There is also a key role for a national agency, such as NHS Health Scotland, with a remit to drive forward the necessary changes in policy, practice and, ultimately, outcomes.
NHS Health Scotland: Health Inequalities Policy Review June 2013
6
Table 1: What works to address health inequalities across the three levels of determinants
Theory of causation
Principles of effective interventions
Examples of effective actions Measures of success
Fundamental causes
• Policiesthatredistributepower,moneyandresources
• Socialequityandsocialjusticeprioritised
• Introduceaminimumincomeforhealthyliving
• Ensuringwelfaresystemprovidessufficientincomeforhealthylivingandreducesstigmaforrecipientsthroughuniversalprovisioninproportiontoneed
• Moreprogressiveindividualandcorporatetaxation
• Activelabourmarketpoliciestocreategoodjobs
• Creationofavibrantdemocracy,greaterandmoreequitableparticipationinelectionsandindecision-making,includingonactiononhealthinequalities
Reducedinequalityinpower,moneyandresources(e.g.reducedincomeinequalitiesandinequalitiesinparticipationinelections)
Social, economic and physical environment
• Useoflegislation,regulation,standards,fiscalpolicyandstructuralchangestoensureequityintheenvironment
• Ensuringgoodworkisavailableforall
• Equitableprovisionofhigh-qualityandaccessibleeducationandpublicservices
• Housing:extendtheScottishHousingQualityStandardtoprivatelyrentedaccommodation;improvedhousingandbuildingstandards;implementaffordableheating,ventilationandqualityenergyefficiencymeasuresinallhousing(e.g.withouttheneedtoapplyforgrants);changestohousinginfrastructure(e.g.design,quality);rehousingandrenovationtoreducetheriskoffallsandotheraccidentalinjuries
• Neighbourhoods:createaNeighbourhoodQualityStandardtoensurelocalserviceavailabilityandhigh-qualitygreenandopenspaces,includingspaceforplay
• Airandwater:greatercontrolsonoutdoorandindoorairpollution(e.g.second-handsmoke),waterfluoridation
• Foodandalcohol:furtherrestrictunhealthyfoodandalcoholadvertising,furtherrestrictionoffoodoutletstoreduceexposuretocheapunhealthyfood,bantrans-fatsandreducesaltcontentoffoods,furtherrestrictionsonthenumberandownershipofalcoholoutlets
• Transport:drink-drivingregulations,lowerspeedlimits,separationofpedestriansandvehicles,loanschemesforchildrestraintsincars
• Fiscal:raisethepriceofharmfulcommoditiesliketobaccoandalcoholthroughtaxation;reduceoreradicatethepricebarrierforhealthyproducts(e.g.healthyfoods);essentialservices(e.g.water,education,healthcare)andpreventionservices(e.g.freesmokingcessation,eyetests,schoolmealsandfruitandmilkinschools)
Reducedinequalitiesintheexposuretothesocio-economicandphysicalenvironment
Moreequitableaccesstopublicservicesandeducation

NHS Health Scotland: Health Inequalities Policy Review June 2013
7
Theory of causation
Principles of effective interventions
Examples of effective actions Measures of success
• Environmental:area-widetrafficcalmingschemes,separationofpedestriansandvehicles,installhard-wiredsmokealarms,implementationofthemeasuresandprinciplesof‘DesigningStreets’,changestophysicalenvironmenttomeetanewNeighbourhoodQualityStandard
• Protectionfromadverseworkconditions,greaterjobflexibility,enhancedjobcontrolandin-workdevelopment,participationinworkplacedecision-making,increasedjobsecurity,supportforthosereturningtoworkandtoenhancejobretention
• Provisionofhigh-qualityearlychildhoodeducationandadultlearning;accessiblesupportandadviceforyoungpeopleonlifeskills,trainingandemploymentopportunities;providingwork-basedlearning,includingapprenticeships,foryoungpeopleandthosechangingcareers;increasedavailabilityofnon-vocationallifelonglearning
• Ensurethatpublicservicesareprovidedinproportiontoneedaspartofauniversalsystem(i.e.proportionateuniversalism)
Individual experiences
• Equitableexperienceofsocio-economicandwiderenvironmentalexposures
• Equitableexperienceofpublicservices
• Targetinghigh-riskindividuals• Intensivetailoredindividual
support• Focusonyoungchildren
andtheearlyyears
• Trainingtoensurethatthepublicsectorworkforceissensitivetoallsocialandculturalgroups,tobuildonthepersonalassetsofserviceusers
• Linkingofservicesforvulnerableorhigh-riskindividuals(e.g.incomemaximisationwelfareadviceforlow-incomefamilieslinkedtohealthcare)
• Provisionofspecialistoutreachandtargetedservicesforparticularlyhigh-riskindividuals(e.g.lookedafterchildrenandhomeless)
• Ensurethatservicesareprovidedinlocationsandwayswhicharelikelytoreduceinequalitiesinaccess(i.e.linkedtopublictransportroutesandavoidingdiscriminationbylanguageandinternetaccess)
• Cultureofservicesiscollaborativeandseekstoco-producebenefits,includinghealthandwellbeing,throughworkwithserviceusers
Reducedinequalityintheexperienceofthesocio-economicandphysicalenvironments
Reducedinequalityinpublicserviceaccess

NHS Health Scotland: Health Inequalities Policy Review June 2013
8
1. Introduction
1.1 PurposeThis is a report to the Scottish Ministerial Task Force on Health Inequalities from NHS Health Scotland, with advice from a Review Panel chaired by Professor Sally Macintyre. The purpose of the Review is to inform the Task Force deliberations on what can be done to address health inequalities in Scotland. The aim of the report is to assess whether the current strategy – as set out in Equally Well and associated policies – is effective and what else might be needed. The report learns lessons from the implementation of Equally Well and other polices, summarises the latest understanding of the problem and recommends next steps based on the current evidence. The Review aimed to address the following key questions:
1. Outcomes. To what extent are the policy outcomes being achieved? Are there signs of inequalities narrowing?
2. Strategy. Is the current strategy about right? Are we focusing on the right things? What else is needed?
3. Implementation. What are we doing in Scotland that has been successful? What has been less successful? Are there problems with how the strategy is being implemented?
4. Learning. What can we learn from experience so far? How might we improve data gathering, evaluation and sharing learning to inform the change process?
1.2 The context for the policy reviewThe Scottish Government has a commitment to social justice and narrowing health inequalities.1 The Scottish Ministerial Task Force on Health Inequalities was established in autumn 2007 by the Minister for Public Health to agree priorities for cross-government policy and action, and to foster commitment and support among the key delivery partners to build the evidence base and address the most significant health inequalities in Scotland. The resulting strategy in 2008, Equally Well, contained 78 recommendations.2
The policy is one of a trio of social policy frameworks introduced by the Scottish Government. The other two focus on poverty and the early years.3 4 Their preparation also coincided with the onset of a sharp and prolonged economic downturn.
Progress towards implementing the Equally Well recommendations was reported in 2010. As proposed, the current Minister for Public Health reconvened the Task Force in November 2012 to review progress. The Task Force Review took place after the Community Planning Review that aimed to provide much clearer guidance and support for Community Planning Partnerships (CPPs), the local mechanism for coordinating local cross-sector action on health inequalities.5 Addressing health inequalities has been identified as a priority area for all CPPs in the coming years.6

NHS Health Scotland: Health Inequalities Policy Review June 2013
9
Soon after the meeting of the Task Force in November 2012, Audit Scotland published its report on health inequalities.7 This review focused on NHS endeavours and, within this scope, it found that national policies and strategies have so far shown limited evidence of impact and there was an unclear picture of progress. At meetings of the Scottish Parliament Public Audit and Health & Sport Committees, the Chief Medical Officer and NHSScotland Chief Executive expressed the view that the problem and solutions were far more complex than suggested in the Audit Scotland report. This prompted the decision by the Health and Sport Committee to hold an inquiry on health inequalities.8
There is, therefore, political interest in health inequalities within and beyond the Ministerial Task Force, amid the continuing backdrop of a harsh economic climate. This report, and the evidence-based review contained within it, should be used to inform the evidence gathering efforts currently underway, to complement the stakeholder engagement process undertaken by the Task Force and to inform the emerging programme of the Health & Sport Committee.

NHS Health Scotland: Health Inequalities Policy Review June 2013
10
2. Review of Equally Well
This chapter appraises Scotland’s health inequalities strategy, centred on Equally Well, and considers progress in terms of the population trends in health inequalities in Scotland.
Health inequalities have been defined as ‘the unjust differences in health which occur between groups occupying different positions in society’.9 Health inequalities can also occur by gender, income, social class, deprivation, educational status, ethnicity and geography.10 Health inequalities are the result of systematic and socially modifiable difference, not random variation. Health inequalities are an issue of social justice for societies that value equity and fairness.11 12 Furthermore, the loss of economic activity and health service costs associated with premature, preventable illness and death damages the economy. Health inequalities occur across the social gradient, not just among the poorest groups. Reducing health inequalities therefore benefits everyone.
Equally Well was launched in 2008 with the aim of addressing health inequalities in Scotland. The strategy was bold, grounded in good evidence and has made progress in some areas. The improvements in the overall health of the population and the decrease in average mortality rates have continued. However, the gap between those with the best and the worst health outcomes persists and too many Scots still die prematurely.
Key messages:
1. Absolute health inequalities, (the outcome gap between the most deprived and least deprived) remain high. Relative inequalities, (the ratio between the two) have increased steadily since 1981. This is because the health of the least deprived groups has improved at a faster rate than the most deprived.
2. Equally Well actions have been more focused on mitigating the consequences of social inequalities, like smoking and alcohol misuse, than on addressing the long-term underlying causes, such as poverty and income. Learning from the test sites has, so far, achieved a limited amount.
3. Despite its ambitions, Equally Well has primarily been delivered as a health and wellbeing initiative with limited spread into policy areas other than early years. Genuine cross-government linkage around Equally Well has been limited. Many of the underlying causes of health inequalities require a broader understanding of the need for social and economic, rather than mainly health-based, solutions. There is a continuing need to ensure that policies across national and local government address the underlying causes of health inequalities.
NHS Health Scotland: Health Inequalities Policy Review June 2013
11
2.1 The Equally Well strategyThe Equally Well report was published by the Ministerial Task Force on Health Inequalities in June 2008 and is jointly owned by the Scottish Government and Convention of Scottish Local Authorities (COSLA), reflecting the Concordat between central and local government agreed seven months earlier. Equally Well was the first government strategy in Scotland specifically to address the issue of health inequalities distinct from the broader challenge of population health improvement, and to develop this as a cross-government strategy rather than one led by the NHS in Scotland. The report describes the nature and extent of health inequalities in Scotland, and sets out a series of principles and priorities for action to address both the causes and consequences of these ‘unfair and unjust’ inequalities. To effect change and achieve the desired short-, medium- and long-term outcomes, the report made 78 recommendations. To support delivery of these recommendations, an Implementation Plan was published in December 2008.
A progress review was undertaken in 2010, with a further 18 ‘recommendations/key statements’ proposed, including the recommendation to undertake a further progress review in two years’ time.13 To this end, the Ministerial Task Force was reconvened in Nov 2012.
The following sections provide a brief overview of the approach that the Task Force adopted to understanding health inequalities, the strategy for addressing the causes and consequences of these inequalities, and the funding and delivery arrangements for putting the strategy into effect.
2.1.1 Understanding health inequalities
‘There are inequalities in the health of people in Scotland which are unfair and unjust because they are based on social structure and factors such as how much money people have. These inequalities mean that some people are more likely to be ill or have low levels of wellbeing and to die younger than others.’2
The Equally Well report and subsequent review made explicit the drivers behind the focus on addressing health inequalities in Scotland: firstly, the fundamental injustice that some people have shorter lives and poorer health and wellbeing due to social structural factors beyond their control; secondly, the negative impacts that health inequalities have on achieving sustainable economic growth – the effects of health inequalities are ‘bad for Scotland’. Redressing health inequalities was seen as a value in itself and a means to an economic end:
‘Creating a skilled resilient population with the sense of wellbeing and control over their own lives, keen to look after their own health and able to participate in the economy and employment opportunities for the future.’2
In the Equally Well report the Task Force set out its understanding of why and how health inequalities are generated. This included recognition of the structural determinants of health inequalities and the need to address both the absolute

NHS Health Scotland: Health Inequalities Policy Review June 2013
12
differences in health outcomes (the gap) and the relative differences (the ratio). The Scottish Government monitors progress using absolute and relative measures applied to a set of eight headline indicators.a
Equally Well also acknowledged that area-based measures of deprivation are limited because not everyone living in areas of deprivation is deprived, nor, conversely that all people who are deprived live in areas of deprivation. Furthermore, the report recognised that health inequalities can occur between other population sub-groups (such as ethnicity or gender).
Drawing on the Dahlgren and Whitehead model of health,14 the Equally Well strategy recognised the influences of both ‘upstream’ economic, social and physical environments as well as the influences of ‘downstream’ individual factors such as the accessibility of services, behaviours/lifestyles, and personal strengths, vulnerabilities and social networks. Chronic stress, a sense of hopelessness and lack of control were seen as important mechanisms linking socio-economic deprivation with an increased risk of poor health and early death. Children’s exposure to the various manifestations of socio-economic deprivation in their early years influences their future adult capacities and the perpetuation of inequalities.
This focus on early years and strengthening individual capacities is given much greater emphasis in the 2010 Review.13 Importance is placed on fostering a ‘sense of coherence’,b and recognising individual assets to enable the development of personal internal resources so that the world is perceived as manageable and that efforts to invest in health appear worthwhile. By the 2010 Review, less emphasis is given to the upstream determinants of health inequalities and the fundamental causes, and more to the early years and strengthening individual capacities and assets. This shift in emphasis is illustrated by the focus given by the Early Years Collaborative (launched in late 2012) to mitigate the downstream consequences of inequalities by strengthening parenting skills in young mothers.15
2.1.2 Addressing health inequalities
‘The Task Force’s new and ambitious approach has been to take our emerging understanding of the underlying causes of health inequalities and turn it into practical and linked action across all of national and local government’s key responsibilities: for making Scotland Smarter, Wealthier and Fairer, Greener, Safer and Stronger and, ultimately Healthier.’2
To address the underlying causes of health inequalities and the consequences, Equally Well proposed a cross-government approach, both locally and nationally, given the understanding that reducing health inequalities ‘cannot be achieved through health policies and healthcare systems alone’.2 Indeed, Equally Well was the first of a set of three linked social policy frameworks for tackling inequality, positioned alongside the Early Years Framework and Achieving our Potential (both launched later in 2008). This linkage is based on a recognition that children’s start in life (addressed in the Early Years Framework), breaking the cycles of poverty (the focus of Achieving our Potential), and
a These are: healthy life expectancy, all-cause premature mortality (for two age bands), mental wellbeing, first admissions to hospital for coronary heart disease, coronary heart disease mortality, cancer incidence, cancer mortality, first admissions to hospital for alcohol-related conditions, and alcohol-related mortality
b Defined as ‘an individual’s inherent understanding of the world as a comprehensible place’

NHS Health Scotland: Health Inequalities Policy Review June 2013
13
inequality and poor health (Equally Well) are interlinked and work across generations to hold back Scotland’s progress. This trio of linked policies on inequality was reinforced in the 2010 review of Equally Well. The linkage did not explicitly extend to Good Places Better Health, the Scottish Government’s strategy on physical environments and health, which was launched on the same day as Equally Well and included many relevant actions with a potential inequalities impact. Similarly, Equally Well did not include subsequent legislative or regulatory actions with the potential to impact on health inequalities, such as the introduction of the smoking ban in public places and the proposed pricing controls for cheap alcohol.
Equally Well was intended to serve as an ‘umbrella’ strategy that drew together the inequalities-relevant aspects of pre-existing policy initiatives and programmes under the Scottish Government’s new strategic objectives to form a coherent and complete set.2 The 2010 Review included some new areas for action.
• SmarterScotland:Earlyyearsandyoungpeople(2010:specifiedlookedafterchildren).
• WealthierandFairerScotland:Tacklingpovertyandincreasingemployment(2010: included addressing the impact of the recession on persistent poverty and long-term unemployment).
• GreenerScotland:Physicalenvironmentsandtransport(2010:includedaddressing the impacts of climate change).
• SaferandStrongerScotland:Harmstohealthandwellbeing:alcohol,drugsandviolence (2010: included tackling offenders’ alcohol problems).
• HealthierScotland:Healthandwellbeing(includingchildrenandyoungpeople,primary care; mental health and wellbeing; smoking; vulnerable groups, access to services).
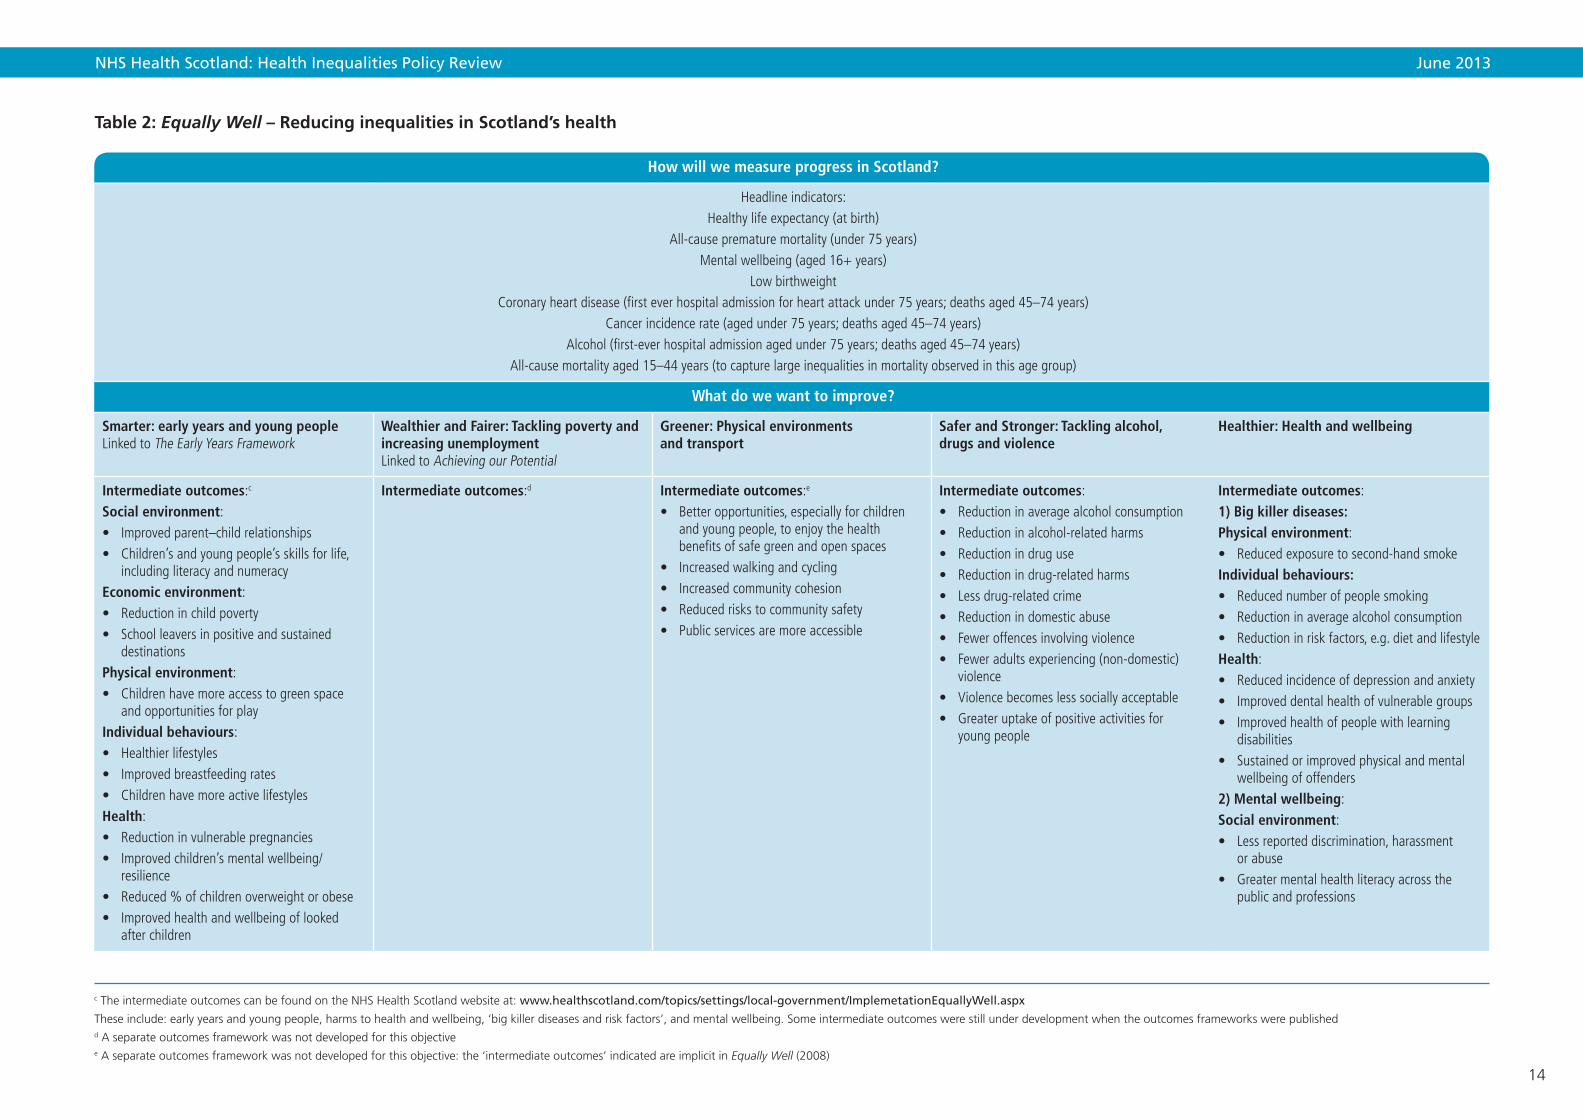
Table 2 summarises the Equally Well recommendations under these five strategic objectives, together with the explicit or implicit anticipated outcomes (where possible).
For each of the five strategic objectives, the 2008 strategy draws on evidence to indicate why the particular objective matters for addressing health inequalities, the evidence of what works and gives examples of activities already happening in Scotland. However, the mechanism by which these interlinked objectives would be monitored and their impacts on inequalities assessed was not directly addressed. The remit of the Ministerial Task Force on Health Inequalities was focused primarily on Equally Well, and the 2010 Review almost entirely focused on the Equally Well test sites, rather than monitoring progress across the broader cross-government portfolio of interlinked policies.
NHS Health Scotland: Health Inequalities Policy Review June 2013
14
Table 2: Equally Well – Reducing inequalities in Scotland’s health
How will we measure progress in Scotland?
Headline indicators: Healthy life expectancy (at birth)
All-cause premature mortality (under 75 years)Mental wellbeing (aged 16+ years)
Low birthweightCoronary heart disease (first ever hospital admission for heart attack under 75 years; deaths aged 45–74 years)
Cancer incidence rate (aged under 75 years; deaths aged 45–74 years) Alcohol (first-ever hospital admission aged under 75 years; deaths aged 45–74 years)
All-cause mortality aged 15–44 years (to capture large inequalities in mortality observed in this age group)
What do we want to improve?
Smarter: early years and young people Linked to The Early Years Framework
Wealthier and Fairer: Tackling poverty and increasing unemployment Linked to Achieving our Potential
Greener: Physical environments and transport
Safer and Stronger: Tackling alcohol, drugs and violence
Healthier: Health and wellbeing
Intermediate outcomes:c Social environment:• Improvedparent–childrelationships• Children’sandyoungpeople’sskillsforlife,
including literacy and numeracyEconomic environment:• Reductioninchildpoverty• Schoolleaversinpositiveandsustained
destinationsPhysical environment:• Childrenhavemoreaccesstogreenspace
and opportunities for playIndividual behaviours:• Healthierlifestyles• Improvedbreastfeedingrates• ChildrenhavemoreactivelifestylesHealth:• Reductioninvulnerablepregnancies• Improvedchildren’smentalwellbeing/
resilience• Reduced%ofchildrenoverweightorobese• Improvedhealthandwellbeingoflooked
after children
Intermediate outcomes:d Intermediate outcomes:e
• Betteropportunities,especiallyforchildrenandyoungpeople,toenjoythehealth benefits of safe green and open spaces
• Increasedwalkingandcycling• Increasedcommunitycohesion• Reducedriskstocommunitysafety• Publicservicesaremoreaccessible
Intermediate outcomes:• Reductioninaveragealcoholconsumption• Reductioninalcohol-relatedharms• Reductionindruguse• Reductionindrug-relatedharms• Lessdrug-relatedcrime• Reductionindomesticabuse• Feweroffencesinvolvingviolence• Feweradultsexperiencing(non-domestic)
violence• Violencebecomeslesssociallyacceptable• Greateruptakeofpositiveactivitiesfor
young people
Intermediate outcomes:1) Big killer diseases:Physical environment:• Reducedexposuretosecond-handsmokeIndividual behaviours:• Reducednumberofpeoplesmoking• Reductioninaveragealcoholconsumption• Reductioninriskfactors,e.g.dietandlifestyleHealth:• Reducedincidenceofdepressionandanxiety• Improveddentalhealthofvulnerablegroups• Improvedhealthofpeoplewithlearning
disabilities• Sustainedorimprovedphysicalandmental
wellbeing of offenders2) Mental wellbeing:Social environment:• Lessreporteddiscrimination,harassment
or abuse• Greatermentalhealthliteracyacrossthe
public and professions
c The intermediate outcomes can be found on the NHS Health Scotland website at: www.healthscotland.com/topics/settings/local-government/ImplemetationEquallyWell.aspx
These include: early years and young people, harms to health and wellbeing, ‘big killer diseases and risk factors’, and mental wellbeing. Some intermediate outcomes were still under development when the outcomes frameworks were publishedd A separate outcomes framework was not developed for this objectivee A separate outcomes framework was not developed for this objective: the ‘intermediate outcomes’ indicated are implicit in Equally Well (2008)

NHS Health Scotland: Health Inequalities Policy Review June 2013
15
Economic environment:• Reducedproportionofpeoplelivinginpoverty• Reductioninfuelpovertylevels• Greaterfinancialinclusionandbetterfinancial
management by individuals• Betterprospectsofmovingintogoodand
sustained employmentPhysical environment:• Healthierworkplaces• Increaseduseofgreenspaceandmore
physical activity• Greatersatisfactionwithpublicservicesand
local neighbourhoodsIndividual behaviours:• Greaterfinancialinclusionandbetterfinancial
management by individuals• Morevolunteering
How will improvement be achieved?
Recommended actions 2008:• Antenatalservicestoreachhigher-risk
groups and identify and manage risks during pregnancy
• Developsupportservicesforfamilieswith very young children at risk of poor health and other poor outcomes
• Developacommunity-basedintegrated schoolhealthteamapproach,increasingthe nursing staff and other professionals supporting schools
• Continueastrongfocusonliteracyandnumeracy and health and wellbeing in school curriculum (Curriculum for Excellence)
• Keepyoungpeopleinlearningafterthe age of 16 – continuity and progression through school to post-school (Curriculum for Excellence)
• Createthephysicalenvironmentsandopportunitiesforchildrenforplay,physicalactivity and healthy eating (local authorities and other public services)
Recommended actions 2008:• UseofFairerScotlandFundbyCPPsto
improve health and healthy life expectancy• Incomemaximisationschemes• Localleadershipinactivatingbusiness
participation in community planning • NHSBoardsplayanactivepartin
employabilitypartnerships.• Businessandenterprisecontributetolocal
community action • Improvinghealththroughworkshouldbepart
of remit of economic development agencies atnational,sectoralandlocalauthoritylevelsincluding urban regeneration
• NHSBoardsandpublicsectoremployersshould act as exemplars in increasing and supporting healthy employment for vulnerable groups
• Publicsectorleadersshouldpromotethe evidence on the health benefits of employmentwithstaff,patientsandclients
Recommended actions 2008:• Improvementstohealthyweightandtothe
quality of local neighbourhoods • Stepstoencouragetheuseandenjoymentof
green space by all• TheNationalTransportStrategy–specific
actions to improve health and reduce health inequalities(e.g.localprojectsthatimproveactive travel within deprived communities)
• Measuretheimpactofwhole-communityinitiatives on health and health inequalities
Recommended actions 2008:• Programmesdesignedtosupportandengage
with young people who have started on the cycle of offending
• Moresupportfor:parentswhosechildrenbegin to display violent behaviour; for victims of violence; for young people at risk of damaging,violentorantisocialbehaviour
• Morepositiveactivitiesforyoungpeople,including improved access to existing facilities
• NHSdrugtreatmentandrecoveryservices,linktootherformsofsupportthataddressclients’wider problems and life circumstances
• Moreeffectivelocaldeliveryofjoined-upservices for problem drug and alcohol users viare-formedADPs
• Moretargetedlocalresourcesfordeprivedgroups and communities
Recommended actions 2008:• KeepWellhealthchecksindeprivedareas
should identify people with depression and anxiety and make sure they get treatment and support
• Createandfundnewevidence-basedanticipatory care programmes for other high-risk groups
• Reformthefundingofprimarycareservicesto meet the needs of groups and communities most at risk of health inequalities
• Developaframeworkforregularhealthassessments for people with learning disabilitiesinallNHSBoards
• Offenderswhowanttotackletheirdrugproblems should be able to get access to addiction and health services within six weeks of release from prison
• Developanaccessiblecommunication,translation and interpreting strategy for theNHS

NHS Health Scotland: Health Inequalities Policy Review June 2013
16
Additional actions (2010)• Anearlyyearspathfinderapproachto
promote the integration of frontline services• Importanceofensuringtheprovisionofhealth
care and health improvement services to looked after children
• EndorsethenewprogrammeforLookedAfterChildrenandYoungPeopleStrategicImplementationGroup
• EndorseCurriculumforExcellenceasakeyvehicle for improving the life changes of children and young people and contributing to reducing health inequalities
• Developanewapproachtopartnershipworkingbetweeneducationpractitioners,health and other professions as a key focus for delivering health and wellbeing outcomes within Curriculum for Excellence
Additional actions (2010)• Prioritiseandsustainpublicserviceswhich
directly support the most vulnerable people• InitiateearlydiscussionswiththeUK
government on welfare benefits and tax credits
• NHSboardsandotherpublicsectororganisations should look to mainstream successful approaches to income maximisation and financial inclusion
Additional actions (2010)• Climateandhealthbenefitscanberealised
intheSGapproachtoclimatechangemitigationandadaptation.Actionstoincludemeasures to protect the most vulnerable groupsofpeople,andavoidwideninghealthand other inequalities
Additional actions (2010)• Continueworkunderwayincontextofthe
ReducingReoffendingprogramme,settingoffenders’healthinawidercontext
• Supportcross-agencypartnershiptodevelopnew‘communityreintegration’unitsforwomen offenders nearing their sentences in AberdeenandInvernessprisons
• Supportthedevelopmentofcommunitypaybackorderstailoredtowomen’sneeds
• Supportarangeofworkaddressingalcoholmisuse among offenders
• ADPstocontinuetodeveloplocallyappropriate services
• SupporttheproposedreviewoftheThroughcareAddictionsService
• SGtogetherwithnationalpartners,includingtheViolenceReductionUnittosupportlocalpartnerships in developing and implementing programmes to prevent and tackle violence
Funding allocated
Early years and young people Poverty and unemployment Physical environments and transport Alcohol, drugs and violence Health and wellbeing
2008/9 to 2010/11f
£26.80millionforinitiativestoimprove diet and levels of physical activity for pregnant women and children
2008/9 to 2010/11g £667.62millionforinitiativesto address fuel poverty and improve employment opportunities
2008/9 to 2010/11h £67.80millionforarangeof environmental initiatives
2008/9 to 2010/11£309.40millionfortacklingalcohol and drugs misuse2011/12i LocalNHSBoards:• Alcoholmisuse£42m• Drugtreatmentandrehabilitation
£29m
2008/9 to 2010/11£721.68millionforpromotinghealthy weightthroughdietandphysicalactivity,healthchecks,smokingcessationservices,andperformance-relatedpaymentsforGPs2011/12j LocalNHSBoards–total£11.7billion: £134 million allocated to Quality and OutcomesFramework(QOF)(GPs) £170millionallocatedtogeneralhealthimprovement programmes (of which £15 million on targeted programmes)
f Figures from Equally Well, Scottish Government 2008 g Figures from Equally Well, Scottish Government 2008h Figures from Equally Well, Scottish Government 2008i Figures from Audit Scotland (2012) Health Inequalities in Scotland. j Figures from Audit Scotland (2012) Health Inequalities in Scotland.

NHS Health Scotland: Health Inequalities Policy Review June 2013
17
The extensive set of recommended actions that were included in Equally Well, and extended in the 2010 Review, did not systematically apply the set of principles and list of effective/ineffective policies in reducing inequalities set out by Macintyre for the Task Force in 2008.16 Examples of recommended actions included in Equally Well that, according to these principles, were likely to be effective include:
• Theclearfocusonearlyyears–including,forexample,improvingthecapacityofantenatal services to support higher-risk groups, and identifying and managing risks during pregnancy (Recommendation 4).
• Prioritisingdisadvantagedgroups(includingoffenders,lookedafterchildren,vulnerable children and families, deprived communities, unemployed people).
• Improvingtheaccessibilityofservices(e.g.Recommendations55–58).
There are also a number of Equally Well recommendations that have merit to improve population health, but are unlikely to reduce health inequalities, and may even risk increasing them:
• Whole-populationcampaignstoencouragetheuseandenjoymentofgreenspace by all (Recommendation 29).
• Providinginformationtoyoungpeopleinawholerangeofsettings,includingeasily accessible drop-in services, staffed by health professionals and youth workers (Recommendation 44).
• Healthchecksforallattheageof40,buildingontheKeepWellprogramme(Recommendation 46).
At the same time, actions identified by Macintyre as likely to be effective in reducing inequalities that are not included in Equally Well’s recommendations are:
• Structuralchangesintheenvironment:(e.g.area-widetrafficcalmingschemes,separation of pedestrians and vehicles, child-resistant containers, installation of smoke alarms, installing appropriate ventilation, insulation and affordable heating in damp, cold houses).
• Legislativeandregulatorycontrols(e.g.drink-drivinglegislation,lowerspeedlimits,seat belt legislation, smoking bans, child restraint loan schemes and legislation, house building standards, vitamin and folate supplementation of foods).
• Fiscalpolicies(e.g.increasepriceofharmfulproducts).
• Incomesupport(e.g.taxandbenefitsystems).k
• Reducingpricebarriers(e.g.freeprescriptions,freeschoolmeals,fruitandmilk,free eye tests).
Nonetheless, several of these measures came into effect through other policies and legislation. For instance, the Good Places, Better Health strategy made a number of
k Further opportunities are available from the Scotland Act 2012 which devolves to the Scottish Parliament powers to set a rate of income tax for Scottish taxpayers to raise stamp duty land tax and landfill tax and making provision for new devolved taxes.

NHS Health Scotland: Health Inequalities Policy Review June 2013
18
recommendations on structural changes to the environment some of which mirror structural changes in the environment examples listed above.17 For example, social landlords have been obliged to bring all housing stock up to a minimum standard (the Scottish Housing Quality Standard) which is likely to be a highly effective means of reducing health inequalities. However, the link into the Equally Well portfolio and outcomes is not explicit.
In short, in the move to considering how to address health inequalities, the balance of attention in Equally Well shifted towards the more downstream consequences of inequalities (such as alcohol misuse, drug treatment and rehabilitation, smoking cessation, healthy weight, depression and anxiety), focusing less on the policy areas which are more likely to be effective in narrowing inequalities. Experience from other countries suggests that this ‘lifestyle drift’ is not unusual when implementing a health inequalities strategy and may occur for a number of reasons. The drift downstream suggests, however, that although the set of recommended actions may contribute to improving the population health, Equally Well’s impact on health inequalities may be limited on its own. Its stated ambition to address the underlying causes of inequalities could be strengthened through better linkage with other relevant policies that have an inequalities impact, but the coherence of policy across government and the oversight of all domains was lacking.
2.1.3 Shifting resources to address health inequalities – recent developments
Changing the way resources are allocated from dealing with the health effects of inequalities to more upstream intervention was recognised by Equally Well (and other strategies) as essential to tackling health inequalities.2 13 18 More recently, making a shift towards preventative spend has become a priority challenge for the public sector in the current financial climate.19–22
‘The government should protect current resources targeted at reducing health inequalities and consider the need for further investment in its longer-term spending plans, based on the Task Force’s learning networks, about any further resources required for public services to address health inequalities and their underlying causes more effectively.’ (Recommendation 68)
Using the figures contained in the 2008 Equally Well report, of the nearly £70 billion ‘global’ funds allocated by the Scottish Government to NHS Boards and local government for health and wellbeing over the three financial years (2008–2011), only 2.5% was identified as supporting actions directly tackling health inequalities and the underlying causes, of which:
• 40%wasallocatedonhealthandwellbeing,includingpromotinghealthyweightthrough diet and physical activity, health checks, smoking cessation services, and performance-related payments for GPsl
• 37%onpovertyandemployment,includinginitiativestoaddressfuelpoverty,and improve employment opportunities
l These figures are not comprehensive. For example, they do not include the Family Nurse Partnership initiative or the Quality and Outcomes Framework (QOF) payments which are both aimed at addressing health inequalities.

NHS Health Scotland: Health Inequalities Policy Review June 2013
19
• 17%onharmstohealthandwellbeing,includingtacklingviolence,alcoholanddrugs misuse
• 4%onphysicalenvironmentsandtransport,includingarangeofenvironmentalinitiatives
• 1%onearlyyearsandyoungpeople,includinginitiativestoimprovedietandlevels of physical activity for pregnant women and children
• Inaddition,£15mofnewfundingwasmadeavailableoverthisthree-yearperiod to help support Equally Well recommendations, including the local test sites (£4 m), support services for families with very young children, children’s play, and school healthcare capacity (£11 m).
The extent to which public sector resources have actually shifted towards addressing health inequalities was investigated by Audit Scotland’s performance audit in 2012.7 It attempted to estimate how much the public sector spends on reducing health inequalities. However, their analysis was limited because the government’s available expenditure information only covered special initiatives and mainstream NHS spending. Wider government inequalities-related expenditure could not be captured and tracked. Policymakers recognised that as influences on health inequalities include, but extend well beyond, health and health care (e.g. transport, physical environment, poverty and employment, etc.), the inability to track related expenditure and thus cost-effectiveness poses particular challenges.
On the basis of its own analysis, Audit Scotland concluded there was little evidence to show a long-term shift in government spending to address health inequalities despite the significant commitment to this by successive governments since devolution. Recorded spend on health and wellbeing was more likely to be allocated to general health improvement rather than specifically to addressing health inequalities, and the effects of general health improvement are not always compatible with the goal of reducing inequalities (see section 3.5.3). Resources allocated to addressing health inequalities were mainly to area-targeted initiatives and services in areas of high deprivation. Substantial numbers of individuals in need who do not live in deprived areas would be missed by this approach. This reliance on area targeting, together with the small scale of the resource allocation, suggests these actions are unlikely to have resulted in a reduction in the overall problem of inequalities in health on their own.
2.1.4 Delivering Equally Well
‘Our recommendations for action run across Government and local services and that is what makes them new and different. They will involve public services working together more than they have in the past, in order to make a difference to the complex underlying reasons for inequalities in health.’(p. 3)2
In terms of delivery, the emphasis of Equally Well is on ‘refocusing and redesigning’ public services with a view to improving their accessibility for clients with multiple and complex needs and smoothing pathways through services – summarised as ‘getting in, getting through, getting on’. Achieving better joint working across agencies and services as well as involving local communities and target groups are seen as the cornerstones
NHS Health Scotland: Health Inequalities Policy Review June 2013
20
for successful delivery on health inequalities. Equally Well reiterated the need for a ‘step change’ improvement in partnership working, a challenge laid clearly at the door of Community Planning Partnerships (CPPs). These elements of Equally Well were given added weight by the Christie Commission recommendations20 and subsequently by the Review of Community Planning in 2012 whose statement of ambition is:
‘Effective community planning arrangements will be at the core of public service reform. They will drive the pace of service integration, increase the focus on prevention and secure continuous improvement in public service delivery, in order to achieve better outcomes for communities. Community Planning and SOAs [Single Outcome Agreements] will provide the foundation for effective partnership working within which wider reform initiatives, such as the integration of health and adult social care and the establishment of single police and fire services, will happen.’23
Both the 2008 Equally Well report and the 2010 Review recognised that achieving the desired changes posed both an opportunity for CPPs in terms of helping them to meet outcome targets, as well as a delivery challenge to local authorities and their community planning partners. The role of the third sector was seen as ‘planning and delivering innovative ways of supporting people’. To explore and support the necessary changes in culture and ways of working, in 2008 the Scottish Government established a series of Equally Well test sites in local areas. Following the 2010 Review, the Local Government Improvement Service was tasked with developing a capacity building resource for CPPs (which is still under development).
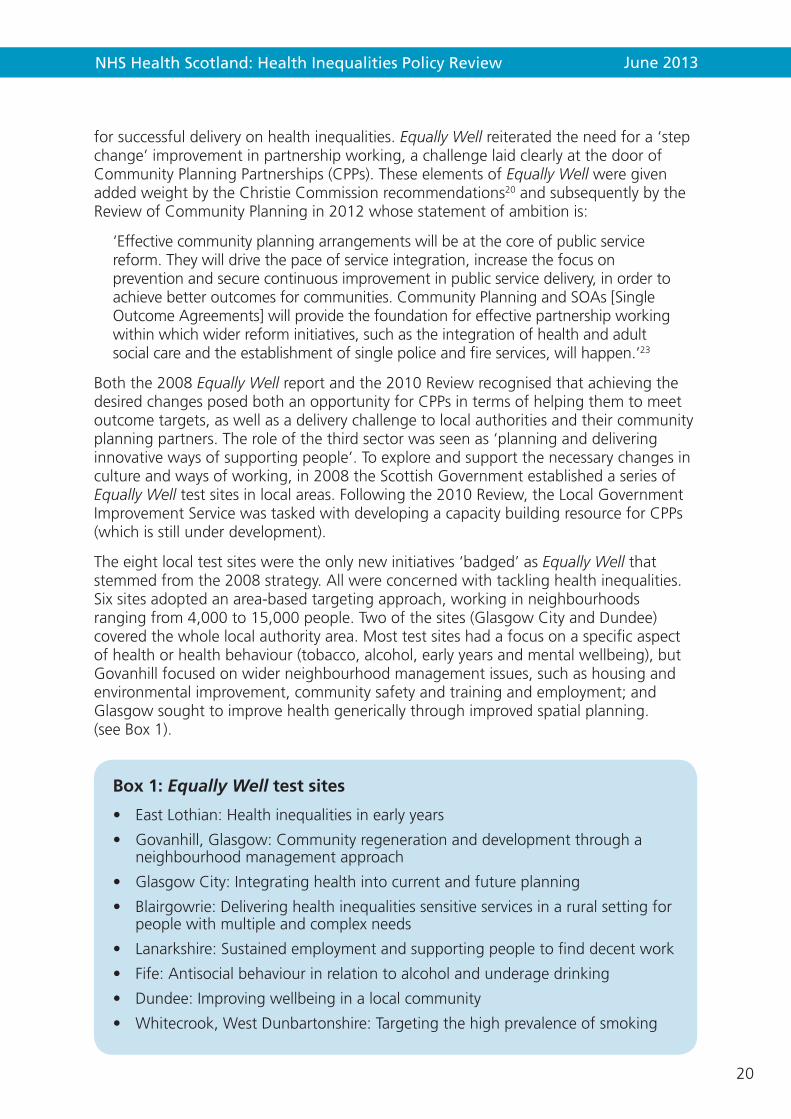
The eight local test sites were the only new initiatives ‘badged’ as Equally Well that stemmed from the 2008 strategy. All were concerned with tackling health inequalities. Six sites adopted an area-based targeting approach, working in neighbourhoods ranging from 4,000 to 15,000 people. Two of the sites (Glasgow City and Dundee) covered the whole local authority area. Most test sites had a focus on a specific aspect of health or health behaviour (tobacco, alcohol, early years and mental wellbeing), but Govanhill focused on wider neighbourhood management issues, such as housing and environmental improvement, community safety and training and employment; and Glasgow sought to improve health generically through improved spatial planning. (see Box 1).
Box 1: Equally Well test sites
• EastLothian:Healthinequalitiesinearlyyears
• Govanhill,Glasgow:Communityregenerationanddevelopmentthroughaneighbourhood management approach
• GlasgowCity:Integratinghealthintocurrentandfutureplanning
• Blairgowrie:Deliveringhealthinequalitiessensitiveservicesinaruralsettingforpeople with multiple and complex needs
• Lanarkshire:Sustainedemploymentandsupportingpeopletofinddecentwork
• Fife:Antisocialbehaviourinrelationtoalcoholandunderagedrinking
• Dundee:Improvingwellbeinginalocalcommunity
• Whitecrook,WestDunbartonshire:Targetingthehighprevalenceofsmoking
NHS Health Scotland: Health Inequalities Policy Review June 2013
21
The test sites were set up as vehicles for learning about innovative practice in redesigning and refocusing local public services to address health inequalities.23 The focus of interest was on service redesign and improving interactions and relationships between services and with local communities. A health inequalities learning network was established to share experiences across the test sites and to stimulate a wider community of practice. The local test site areas were expected to operate within existing resources.
Overall, learning from the test sites has reiterated the necessary pre-conditions for successful joint working: effective coordination; senior commitment; clear and shared outcomes; creating a space for learning; engagement of service users or communities; and a shared understanding of partner roles and contributions. When evaluated after two years of implementation, the Equally Well test sites were still, understandably, ‘at an early stage in a long journey towards reducing health inequalities’. Most of the test sites’ learning has been about the implementation process and partnership working. When asked what was the most significant change achieved by the test sites, the most common response was improved joint working (40% n=96). The national evaluation concluded that there had been progress towards some short-term outcomes, such as joint working, but it was not possible at that time to assess the overall effectiveness. National–local collaboration on the test sites aimed to spread and scale up the service redesign practice to other areas in Scotland, but this has not yet occurred on the expected scale.24
Over the same period as the Equally Well test sites, the Scottish Government also sponsored local pilots in the policy areas of obesity (Healthy Weight Communities) and healthy environments (Good Places, Better Health). The common lessons from the full set of pilot and test sites include strengthening the complementary roles of national and local level interventions in addressing inequalities. From the findings of these evaluations, the Scottish Government concluded that national level (Scottish Government and COSLA) should lead cross-government collaborative actions on the social determinants of health and focus on population measures such as setting laws and regulating industry and prices, (e.g. minimum pricing on alcohol, regulation to reverse the obesogenic environment, prioritising early years). In local areas, the main role was seen as direct service delivery which is coordinated and delivers universal services proportionate and tailored for specific high-risk or vulnerable individuals, families or groups in need.25
In summary, Equally Well has developed over five years as the centrepiece of health inequalities policy in Scotland. Its creation marked a bold break with past endeavours, focusing on the social determinants of health, ranging further outside the health sector, and attracting the joint ownership of local authorities. Equally Well was positioned alongside a portfolio of policy developments also designed to promote social equity, most notably the anti-poverty and early years strategies. However, in the process of moving to implementation, Equally Well gave greater attention to downstream actions and the intended cross-government policy linkage has not been optimised. These factors, coupled with a deep and sustained economic recession, have limited Scotland’s prospects for narrowing health inequalities.

NHS Health Scotland: Health Inequalities Policy Review June 2013
22
2.2 Trends in health inequalities in Scotland – are there signs of change? The Scottish Government created a long-term monitoring framework for measuring Equally Well’s impact on health inequalities and publishes annual updates.26 The 2012 update concluded that health inequalities are still a major issue with several indicators showing signs of deterioration.26 The Equally Well headline indicators use data based on the Scottish Index of Multiple Deprivation (SIMD) for data zone areas (which were created in 1996 and are therefore only available for a relatively short time frame). A longer time series is available from 1981 to 2001 using the Census-based Carstairs deprivation index (this is currently only available to 2001 as the full 2011 Census dataset has not yet been released). The two deprivation measures are not directly comparable because they include slightly different age groups and differently sized geographies. However, taken together, they allow the overall trends in health inequalities in Scotland to be assessed.
The trends in all-cause mortality for the most and least deprived tenths of the population are shown in Figure 2. All-cause mortality declined for both the most and least deprived deciles between 1981 and 2001 for the whole population, and for those under 75 years old between 1997 and 2010. However, there was little evidence of a decline among young adults (aged 15–44 years). Between 1981 and 2001, inequalities increased in both absolute (from a gap of 472 to 492 deaths per 100,000 per year) and relative terms (from a ratio of 0.5 to 0.8). Relative and absolute inequalities also increased for those aged 15–44 years between 1998 and 2010, although the changes in mortality rates were only slight. For all those aged under 75 years, there was a slight decrease in absolute inequalities (from a gap of 491 to 466 deaths per 100,000 per year) and an increase in relative inequalities (from a ratio of 1.7 to 2.4).
The data contained in Figure 2 is shown in a more statistically advanced way in Figures 3 and 4. These show the trends in the absolutem and relativen gradients across all deprivation groups over the longest time period available. Figure 3 shows that absolute health inequalities have remained high over the entire time period from 1981 to 2010, with a large degree of year-on-year variation. The apparent dip towards the end of the time series should not therefore be interpreted as a measure of the success or otherwise of the Equally Well policy approach, as more data are required in order to demonstrate a sustained and consistent trend.
In contrast, relative inequalities have consistently increased from 1981 onwards (Figure 4)o with less year-on-year variation (again the small dip at the end of the time series should not be interpreted as a turning point). This consistent increase in relative inequality is partly due to the success in reducing the average mortality in the population. To reduce relative inequalities, there therefore needs to be a more rapid reduction in mortality in the deprived groups than the average for Scotland.
m Absolute inequalities (or the gap between groups), taking account of the proportion of the population in each group, is most appropriately measured using the Slope Index of Inequality (SII), where larger numbers indicate a larger absolute difference across the population.
n Relative inequalities (or the ratio between groups), taking account of the proportion of the population in each group, is most appropriately measured using the Relative Index of Inequality (RII), where larger numbers indicate a larger relative difference across the population.
o Note that the measures using SIMD rather than Carstairs are more sensitive to detecting inequalities because of the smaller populations used as the unit of analysis. Furthermore, any single measure taken alone, particularly area-based measures such as these, underestimate true inequalities.

NHS Health Scotland: Health Inequalities Policy Review June 2013
23
Figure 2: Trends in all-cause mortality rates (for men and women combined) for the most and least deprived deciles (by Carstairs 1981–2001 (all ages) and SIMD 1997–2010 (aged <75y and 15–44y)) (Source: National Records for Scotland)
Note: data are not available separately from the Scottish Government monitoring report for those 45–75y.

NHS Health Scotland: Health Inequalities Policy Review June 2013
24
Figure 4: Trends in relative all-cause mortality inequality (1981–2001 using Carstairs index (all ages); 1996 onwards using SIMD (<75y and 15–44y); men and women combined) (Source: National Records for Scotland)
Figure 3: Trends in absolute all-cause mortality inequality (1981–2001 using Carstairs index (all ages); 1996 onwards using SIMD (<75y and 15–44y); men and women combined) (Source: National Records for Scotland)

NHS Health Scotland: Health Inequalities Policy Review June 2013
25
2.3 SummaryThe Scottish Government’s strategy to tackle health inequalities, Equally Well, has been in place for five years. This is the second review of its progress toward implementation. An annual monitoring programme is in place to assess progress against defined indicators, and a series of test sites have been created, some with evaluations of outcomes relevant to specific aspects of health inequalities. Other policies which were not included in the scope of Equally Well are likely to have a positive effect on health inequalities: in particular the implementation of the Scottish Housing Quality Standard, the introduction of the ban in smoking in public places and the proposed introduction of minimum unit pricing for alcohol. There is an apparent mismatch between the understanding of the health inequalities problem that underlies the Equally Well strategy and which focuses on the determinants of health, and the Equally Well recommendations which focus more on influencing the resulting behaviours and their health effects. Public service reform and renewed vigour to ensure the delivery of policy locally through Community Planning Partnerships (CPPs) should work in favour of the health inequalities strategy, although monitoring and evaluation research is needed to ensure effective implementation.
Monitoring data on health inequalities shows no worsening of absolute health inequalities (i.e. the gap) over recent years, although this remains high compared to the rest of Western Europe. However, relative health inequalities have risen consistently from 1981 to the present day, partly because of the reduction in the average mortality rate. In order to reduce both absolute and relative inequalities, a more rapid reduction in mortality in the most deprived groups, compared to the average, is required.
The following chapters consider evidence and experience that the Task Force should consider in developing the Scottish Government’s and local authorities’ future response to the challenge of narrowing inequalities.
NHS Health Scotland: Health Inequalities Policy Review June 2013
26
3. Understanding and addressing health inequalities
This chapter summarises the current understanding of how health inequalities in Scotland compare internationally, how health inequalities arise, how they are best addressed and the scope for intervention within the Scottish context.
3.1 What are health inequalities?
3.1.1 International trends and comparisons
Despite the reductions in mortality in Scotland over the last 150 years, average life expectancy remains lower in Scotland compared to the rest of West and Central Europe. Figure 5 shows the trend from 1950 onwards. Although life expectancy has increased in Scotland, the increase in life expectancy in other countries has been more rapid. For example, Portugal, Spain, Finland, Ireland, Austria and Italy all had life expectancies
Inequalities are caused by a fundamental inequity in the distribution of power, money and resources. This has an impact on the opportunities for good-quality work, education and housing, etc. In turn, these determinants shape individual experiences and health throughout life (Figure 9).
Key messages:
4. Average life expectancy in Scotland has improved steadily, but more slowly than in other wealthy countries. Within Scotland, those at the top of the social scale have been able to take health improvement messages on board which has resulted in health benefits for them. However, less affluent groups have benefitted less and have been left behind. Inequalities in mortality in Scotland are among the highest in Western and Central Europe, rising rapidly during the 1980s and 1990s; this situation is not inevitable and can be improved.
5. The scale of the health inequalities problem is strongly influenced by the magnitude of the underlying inequalities in power, money and resources within a society. Action on the worsening trends in health inequalities needs to be rebalanced to address the fundamental drivers of social inequality which determine income, employment, education and daily living conditions.
6. The ways in which health inequalities are manifested in the population, through specific diseases and causes of death, are likely to change over time; strategies focused on specific diseases and single risk factors are important but will not substantially impact on the overall inequalities in death rates.

NHS Health Scotland: Health Inequalities Policy Review June 2013
27
lower than Scotland in 1950, but have improved more rapidly such that they now have higher life expectancies.27–29 Even within Eastern Europe, deprived deindustrialised regions are improving more rapidly than the similarly deindustrialised area around Glasgow.30 31 For young adults in Scotland (aged 15–44 years), there has not been any improvement in mortality rates over the last 30 years.27
Figure 5: Life expectancy at birth for men and women in Scotland compared with other Western European countries from 1950 28
Figure 6 below shows that inequalities in mortality among men in Scotland in recent years are higher (i.e. the gap between groups is wider) than in all other countries in Western and Central Europe who have data available. The only countries with bigger health inequalities are Hungary, the Czech Republic, Poland and Lithuania. Figure 7 shows the same pattern for women.
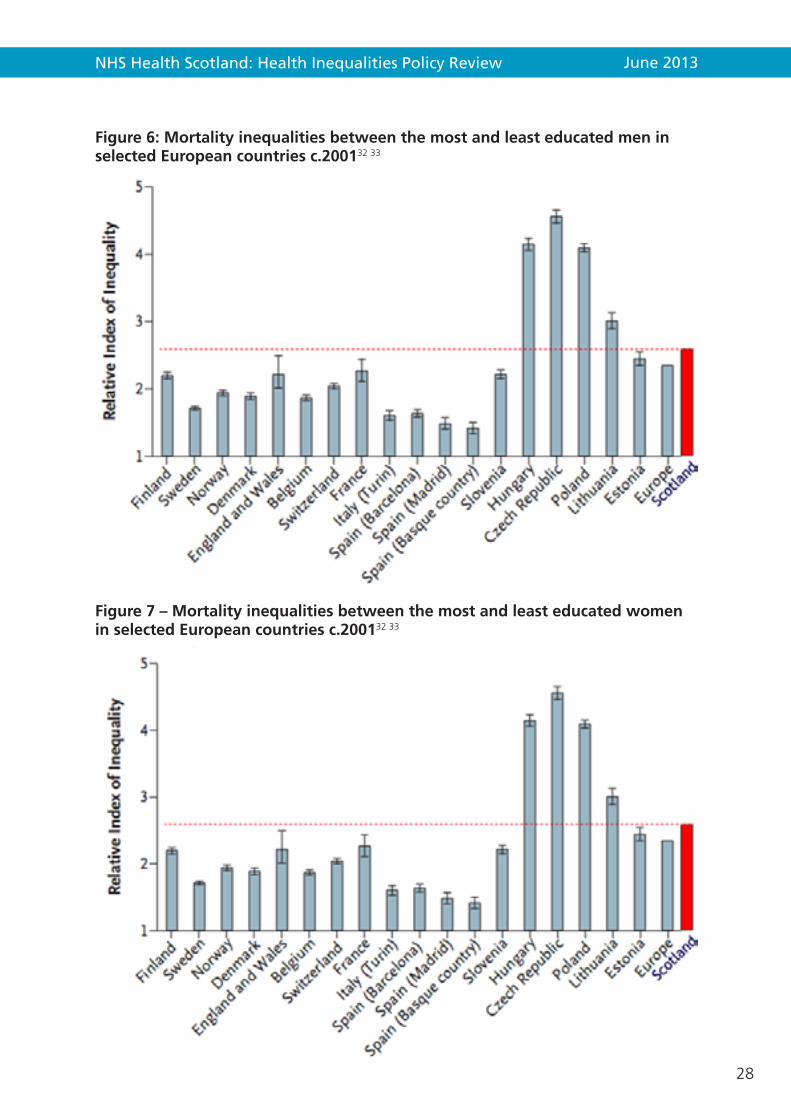
NHS Health Scotland: Health Inequalities Policy Review June 2013
28
Figure 6: Mortality inequalities between the most and least educated men in selected European countries c.200132 33
Figure 7 – Mortality inequalities between the most and least educated women in selected European countries c.200132 33
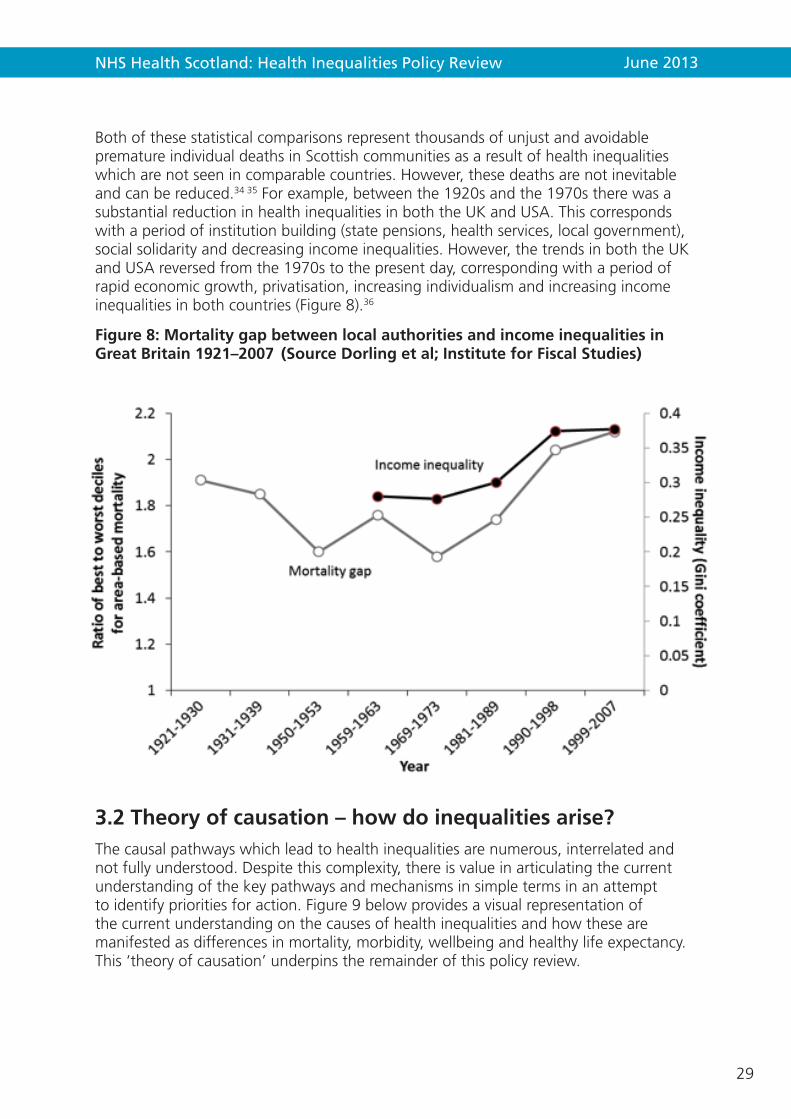
NHS Health Scotland: Health Inequalities Policy Review June 2013
29
Both of these statistical comparisons represent thousands of unjust and avoidable premature individual deaths in Scottish communities as a result of health inequalities which are not seen in comparable countries. However, these deaths are not inevitable and can be reduced.34 35 For example, between the 1920s and the 1970s there was a substantial reduction in health inequalities in both the UK and USA. This corresponds with a period of institution building (state pensions, health services, local government), social solidarity and decreasing income inequalities. However, the trends in both the UK and USA reversed from the 1970s to the present day, corresponding with a period of rapid economic growth, privatisation, increasing individualism and increasing income inequalities in both countries (Figure 8).36
Figure 8: Mortality gap between local authorities and income inequalities in Great Britain 1921–2007 (Source Dorling et al; Institute for Fiscal Studies)
3.2 Theory of causation – how do inequalities arise?The causal pathways which lead to health inequalities are numerous, interrelated and not fully understood. Despite this complexity, there is value in articulating the current understanding of the key pathways and mechanisms in simple terms in an attempt to identify priorities for action. Figure 9 below provides a visual representation of the current understanding on the causes of health inequalities and how these are manifested as differences in mortality, morbidity, wellbeing and healthy life expectancy. This ‘theory of causation’ underpins the remainder of this policy review.

NHS Health Scotland: Health Inequalities Policy Review June 2013
30
Figure 9: Health inequalities: theory of causation
INEQUALITIES
HEALTH INEQUALITIES
Inequalities In: Wellbeing Healthy Life Expectancy Morbidity Mortality
Individual Experience
Effects
Economic and work e.g. Employment status; working conditions; job security and control, family or individual income; wealth; receipt of financial and other benefits Physical e.g. Neighbourhood conditions, housing tenure and conditions, exposure to pollutants, noise, damp or mould; access to transport , fuel poverty; diet; act ivity levels; tobacco consumption Learning e.g. Early cognitive development, readiness for school, literacy and numeracy, qualif ications Services e.g. Quality of service received; ability to access and navigate, affordability Social and interpersonal e.g. Connectedness, support, and community involvement, resilience and coping mechanisms; exposure to crime and vio lence
Economic and work e.g. Availability of jobs; Price of basic commodit ies (rent, fuel etc.) Physical e.g. Air and housing quality; safety of neighbourhoods; availability of af fordable transport, food, leisure opportunit ies etc. Learning e.g. Availability and quality of schools; availability and affordability of further education and lifelong learning Services e.g. Accessibility, availability and quality of public, third sector and private services ; activity of commercial sector Social and cultural e.g. community social capital, community engagement; social norms and attitudes; democratisation, democratic engagement and representation
Wider Environmental Influences
Unequal distribution of power, money and resources
Poverty, marginalisation and discrimination
Global economic forces Macro socio-political environment Political priorities and decisions Societal values to equity and fairness
Fundamental Causes
Downstream Upstream
Multiple causal pathw
ays
NHS Health Scotland: Health Inequalities Policy Review June 2013
31
3.2.1 Fundamental causes
There is increasing recognition that health inequalities have their roots in the major sociopolitical forces which drive decisions and priorities and which, depending on the social and economic principles underpinning these decisions, result in an unequal distribution of power, money and resources.37 This leads to poverty and marginalisation in certain social groups, with discrimination compounding the effects. This unequal distribution of power, money and resources are considered the ‘fundamental causes’ of inequalities in health outcomes. Inequalities in all-cause mortality persist, despite the rise and fall of inequalities in particular specific causes of mortality such as heart disease. This is taken as evidence that the ‘fundamental causes’ of inequalities are the most important, and the only sufficient, explanation of how health inequalities arise and persist.38 Resources such as power, money, social connections, knowledge and language are protective to health, no matter what mechanisms are relevant at any time.12 Recently, international evidence has been gathered that demonstrates the importance of income inequalities in driving health and social problems.39
3.2.2 Wider environmental influences
Power, money and resources determine the physical, economic and social environments in which people live and work. Inequitable distribution of wider environmental resources and constraints occurs in all aspects of the environment including: economic and work; physical; learning; services; social; and cultural. The distribution of these wider environments are all shaped by the fundamental causes; hence wider environmental constraints (such as low availability of jobs, transport, quality schools and public services, low levels of social capital and democratic engagement) tend to coexist, compounding the effects.40
3.2.3 Individual experiences
It is well documented that individuals have different levels of exposure to harms in the physical/built environment (e.g. polluted air, traffic, damp housing), to healthy products and environments (e.g. green space, healthy food) and to supportive social networks and relationships, and this fuels health inequalities.12 16 The level and balance of enabling resources versus constraints in an individual’s or family’s environment determine the balance of exposure to health-promoting or health-damaging factors. However, the influence goes much deeper. Physical and social environments shape the options available to individuals and choices they take, meaning that even ‘lifestyle’ factors have to be interpreted on the basis of the contexts in which they arise.41 For example, an unhealthy individual diet is often the result of interactions between wider environmental factors, such as low availability of affordable, healthy food and access to adequate cooking facilities, and individual experiences such as low disposable income alongside the socially influenced individual decisions and behaviours.
Thus, the ability of individuals and families to live in ways that create and sustain health is influenced by factors largely beyond their control. The consequences for children conceived and growing up in such environments become apparent early on, often accumulating, interacting and persisting over the life course.42 For example, low birthweight babies who have a poor early environment have more coronary health

NHS Health Scotland: Health Inequalities Policy Review June 2013
32
disease in adulthood. Exposure to harm in the wider environment at critical periods of development, such as early childhood and adolescence, can have a cumulative effect and shape health outcomes in later life. It is now also understood that the physical and psychological environment in which we live can switch genes on or off, thus changing how they function,43 44 although evidence that certain epigenetic changes (i.e. those caused by wider environmental exposures) can be inherited and passed between generations remains very tentative.45 46
3.2.4 The effects
These fundamental causes, wider environmental influences and individual experiences throughout life bring about an unequal and unfair distribution of wellbeing, ill health and mortality in the population. Health inequalities are therefore the manifestation of social inequalities.
3.3 The manifestations of health inequalities change over timeMortality outcome measures which report only specific causes of death without reference to the all-cause trends can be misleading. Improvements in specific cause mortality may reduce average mortality, but the contribution of specific causes rises and fades over time and may not reduce inequalities in mortality (Figure 10).38 For example, 150 years ago in Scotland, the most important causes of mortality, and of inequalities in mortality, were infectious diseases such as cholera and tuberculosis. Before it was understood what caused these conditions and what worked to treat them, infectious diseases affected rich and poor at similar rates. However, as knowledge increased over time, the more affluent groups were able to protect themselves by moving to less overcrowded areas and by accessing treatment. In time, these benefits spread across the population and average health improved. As people started to live longer, other causes of death started to become more important. Heart disease, for example, was initially thought to be a ‘rich man’s’ disease, but as knowledge increased and lifestyles changed in response, and treatments improved, inequalities rapidly emerged which again reinforced the overall mortality inequality. During the 1980s and 1990s, other causes of deaths (which had previously been relatively rare in Scotland) such as alcohol-related and drug-related deaths become more prominent, filling the inequality gap left by heart disease.
Coordinated and radical cross-government action through economic, social and housing measures as well as treatments has succeeded in the past to tackle the inequalities in mortality associated with infectious disease. Action across all sectors to tackle modern diseases through reductions in poverty and inequalities is still possible and needed now.

NHS Health Scotland: Health Inequalities Policy Review June 2013
33
Figure 10: Schematic representation of the changing causes of health inequalities over time
3.3.1 Trends in coronary heart disease inequalities
Ischaemic heart disease mortality trends are an example of the relationship between the measures of inequalities and how a reduction in absolute inequality can lead to an increase in relative inequality. A dramatic decline in mortality has been witnessed (Figure 11). The decline in Scotland has occurred across all deprivation quintiles, leading to a decline in the gap in mortality between the most and least deprived areas. However, as premature mortality among populations in the least deprived areas is now relatively uncommon and, in many deprived areas remains common, relative inequality widens. (Relative inequalities are how much worse mortality in the most deprived is compared to the least deprived. If the least deprived are improving faster than the most deprived, relative inequality will, by definition, be getting worse.)p Moreover, this rapid decline in ischaemic heart disease mortality did not result in a decline in inequality, because other cause-specific mortalities intervened.
p It has been estimated that around 44% of the decline in coronary heart disease mortality has been due to improvements in medical treatment and around 39% due to other factors (e.g. diet and smoking), although the decline in more deprived groups was more likely to be due to non-treatment factors than in the least deprived groups. (Hotchkiss et al, forthcoming).
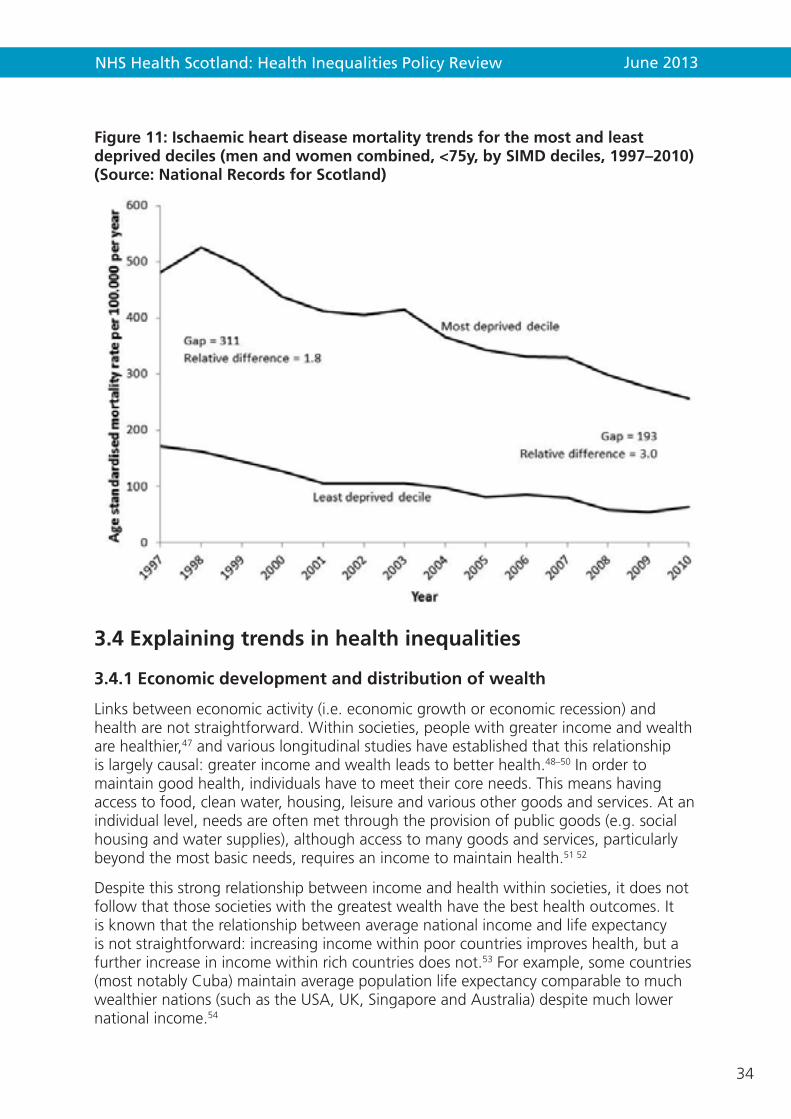
NHS Health Scotland: Health Inequalities Policy Review June 2013
34
Figure 11: Ischaemic heart disease mortality trends for the most and least deprived deciles (men and women combined, <75y, by SIMD deciles, 1997–2010) (Source: National Records for Scotland)
3.4 Explaining trends in health inequalities
3.4.1 Economic development and distribution of wealth
Links between economic activity (i.e. economic growth or economic recession) and health are not straightforward. Within societies, people with greater income and wealth are healthier,47 and various longitudinal studies have established that this relationship is largely causal: greater income and wealth leads to better health.48–50 In order to maintain good health, individuals have to meet their core needs. This means having access to food, clean water, housing, leisure and various other goods and services. At an individual level, needs are often met through the provision of public goods (e.g. social housing and water supplies), although access to many goods and services, particularly beyond the most basic needs, requires an income to maintain health.51 52
Despite this strong relationship between income and health within societies, it does not follow that those societies with the greatest wealth have the best health outcomes. It is known that the relationship between average national income and life expectancy is not straightforward: increasing income within poor countries improves health, but a further increase in income within rich countries does not.53 For example, some countries (most notably Cuba) maintain average population life expectancy comparable to much wealthier nations (such as the USA, UK, Singapore and Australia) despite much lower national income.54

NHS Health Scotland: Health Inequalities Policy Review June 2013
35
Although the reductions in mortality seen across high-income countries in the last 150 years28 have coincided with a prolonged period of long-run economic growth, the evidence that economic growth has caused improved health is actually quite weak. It is more likely that improvements in nutrition, social infrastructure, education or scientific progress (all of which have unclear relations to economic growth) are more important explanations for improved average population health.55–58 Furthermore, improving life expectancy has continued in countries like Japan and Cuba, where economic growth has been virtually non-existent since 1990.59
In their book The Spirit Level, Wilkinson and Pickett have suggested that income inequality rather than income per capita (mean income) is a more important determinant of mean population health. There is substantial evidence for this since, among high-income nations, the most unequal countries (e.g. USA, UK, New Zealand) have worse health and social outcomes than the more egalitarian countries (e.g. Sweden, Norway, Finland and Japan).39
Economic growth can arise from different process, and it may be that the health impact of the growth might be different depending on the mechanism. For example, economic growth arising from the exploitation of natural resources within a country, particularly when the wealth generated from the extraction is not shared among the local population, may be less likely to generate positive health outcomes.60 For example, many of the Middle Eastern states such as Saudi Arabia have experienced rapid increases in national income without corresponding increases in social and economic development. As such, health improvements are less than might be expected of a country with such a high national income.
Countries which pursue economic policies, such as neoliberalism,q which widen income and wealth inequalities are likely to have increased health inequalities in their population.36 In the Scottish context, the rise in health inequalities from the 1980s onwards has actually been associated with a decline in life expectancy in the poorest communities,61 despite rapid economic growth. Even considering mean population life expectancy rather than health inequalities, those countries which have pursued a more neoliberal economic policy agenda have been found to have worse health outcomes.28
62 63This is supported by the finding that countries which neglect social protection and active labour market policies at times of recession have worse health outcomes.59 64
3.4.2 Employment, economic activity and health
The evidence on the links between unemployment and health is stark: a recent systematic review summarised that, on average, mortality rates in the unemployed increased by 63% compared to those in continuing employment.65 Negative health impacts are also seen where employment changes to become less secure or rewarding.66 In Scotland, the proportion of the working-age population claiming unemployment benefit declined from 1992 to 2008 for both men and women before increasing rapidly during 2009 and 2010. However, it is well recognised that the proportion of the working-age population registered unemployed is an underestimate of the actual
q Neoliberalism is an economic ideology characterised by privatisation, low taxation and non-universal public services.

NHS Health Scotland: Health Inequalities Policy Review June 2013
36
proportion that are unemployed.67 An alternative measure of the population who are not in work, and which may be less sensitive to bias, is the proportion of the working-age population who are economically inactive (although this includes those involved in unpaid labour such as caring for children and relatives). These data for Scotland suggest a mixed and changing picture between genders; the proportion of the female working-age population who are economically inactive has declined steadily from 1992 to 2010 before increasing, while the proportion of the male working-age population who are economically inactive rose slightly from 1992 to 2000, declined slightly to 2010 before rising again in 2011.
3.4.3 Poverty and health
Although being able to obtain a minimum quantity of goods and services is clearly important for health, in high-income countries poverty is better conceptualised as a relative phenomenon. In this way, income to maintain a level of consumption which allows individuals to participate in the norms of society is what is important for health. Aside from the need for income to obtain material goods and services in either absolute or relative terms, individual income and wealth is also likely to be linked to health outcomes through other mechanisms. Perceived security and personal assets, in the sense of being more certain about how things will be paid for in the future, job satisfaction, self-worth, sense of identity, access to social networks and connectedness to community life, may all be mechanisms linking income to health outcomes. 47 65 68 69 Beyond absolute poverty of homelessness and hunger, it is the width of, and place within, the social hierarchy which is more important than any particular mechanism in determining individual health.38 18
3.4.4 Putting it all together: what explains the health inequality trends?
As noted earlier, the health inequalities gradient in Scotland is steeper than in the rest of Western and Central Europe and has risen rapidly during the 1980s and 1990s. The most important influences on health inequalities are differences in power, money and resources across the population. Mortality statistics are the most robust and accessible indicators of the effects of inequality. It is also recognised that the specific causes of health inequalities can change over time without impacting on the overall all-cause mortality inequalities, and that there is an inevitable delay in changes in the determinants of inequalities and their effects as they appear in mortality figures.
For all-cause mortality, Figure 12 shows the trends in absolute and relative mortality health inequalities, alongside the trends in income inequalities for the period 1981 to 2012. Absolute mortality inequalities in all-cause mortality were high with some year-to-year variation, while relative inequalities rose rapidly, with a 41% increase in relative inequalities using the Carstairs index for all adults between 1981 and 2001. More recently for younger adults, between 1996 and 2011 there was a 23% increase in relative inequalities and for the population aged <75y there was a 28% increase. These rises correspond to the rapid increase in income inequalities and relative poverty witnessed during the 1980s for Great Britain overall, and the rises in income inequalities seen in Scotland between 2005 and 2010, although the relationship is not straightforward. Apparently encouraging signs, such as the downward blips in the data for income inequalities and health inequalities in 2009 and 2010, should not be over-interpreted as there are insufficient data available to assess whether there is a sustained

NHS Health Scotland: Health Inequalities Policy Review June 2013
37
Figure 12: Trends in absolute and relative all-cause mortality inequalities and trends in income inequalities (men and women combined, for various age groups, using Carstairs and SIMD indices) (Source: National Records for Scotland; Institute for Fiscal Studies)

NHS Health Scotland: Health Inequalities Policy Review June 2013
38
trend rather than simply year-to-year variation. It is likely that some of the differences in the income and health inequality trends are due to delays between the exposure to rising income inequality and unemployment in the 1980s and subsequent mortality.28
Recent changes to welfare benefits and the economic recession are likely to impact on income levels, employment and consequently health inequalities. Further work to monitor and disentangle these impacts is currently underway.
Unfortunately, data are not available for a long enough time series for many of the intermediate outcomes of interest such as educational attainment inequalities and smoking inequalities.
3.5 Addressing health inequalities: some guiding principles
3.5.1 Policy design and impact – three scenarios
A key challenge when designing a health inequalities strategy or interventions is addressing the twin and sometimes conflicting goals of reducing health inequalities and improving population health. Policies and interventions can have different impacts on inequalities and overall population health.70 71 Three different policy scenarios have been described in relation to how interventions may impact on the twin goals of improving population health and reducing health inequalities.70
1. Ideal scenario: mean (overall) population health improves at the same time as inequalities reduce. In this scenario, the risk for all people in the population reduces, but reduces most for the most disadvantaged individuals who are also at the highest risk. Because these policies benefit the whole population, they have the effect of reducing the inequalities gradient.71 Examples of policies that fit this scenario are the establishment of a national health service or a ban on smoking in public places. It could also be the scenario associated with a service which achieves ‘proportionate universalism’ whereby universal services are resourced and delivered proportionate to need,18 or ‘progressive universalism’ where universal services provide access to increasingly intensive support responsive to need, e.g. providing universal services to support families with young children but redistributing resources to invest more in providing intensive support for those families with greatest need. (see Figure 13 below).72
2. Mean population health improves but inequalities in health widen. This scenario is associated with interventions which require individuals to opt in (e.g. health education programmes). Once something is recognised as being beneficial (for health, success, wellbeing, etc.), it will become more rapidly adopted and more common within the more advantaged groups and communities that have access to the personal, social and financial resources to enable change, compared to the less advantaged groups of the same culture. Therefore, interventions that rely on individual opt-in are likely to exacerbate health inequalities, while interventions that are more structural in nature are more likely to improve population health and reduce inequalities (or at least not increase them).16

NHS Health Scotland: Health Inequalities Policy Review June 2013
39
3. Targeting: locate and support the population in greatest need. This is the scenario most commonly adopted for reducing health inequalities and would have the effect of reducing inequalities and also (marginally) improving mean population health. There are several difficulties with this approach in practice. In Scotland, the most commonly used means for identifying the population at greatest risk of mortality and morbidity is to use an area-based measure of deprivation such as the Scottish Index of Multiple Deprivation (SIMD). This is problematic because not all deprived people live in deprived areas, and not all people living in deprived areas are deprived. For example, using data from 1991, it was found that only 41% of unemployed people and 34% of low-income households lived in the 20% most deprived areas.73 Furthermore, even where a targeted approach is implemented, it is often the case that the least needy individuals within a target population take up the service which means that the impact on inequalities can be mixed.

NHS Health Scotland: Health Inequalities Policy Review June 2013
40
Figure 13: Example of proportionate universalism as applied to services of young children72

NHS Health Scotland: Health Inequalities Policy Review June 2013
41
3.5.2 Macintyre’s guiding principles
Professor Sally Macintyre articulated a set of guiding principles for effective policies and interventions to address health inequalities in society for the 2008 Ministerial Task Force (Box 2).16 She also presented the characteristics of interventions that are likely to be more effective (Box 3) and less effective (Box 4). Interventions that address the fundamental causes are considered to be the most effective in addressing inequalities in health.16 18
Box 2: Principles for effective policies to reduce inequalities in health16
• Maintainandextendequityinhealthandwelfaresystems
• Address‘upstream’and‘downstream’causes
• Levelup,notdown
• Reduceinequalitiesinlifecircumstances(especiallyeducation,employment and income)
• Prioritiseearlyyearsinterventions,andfamilieswithchildren
• Addressbothhealthcareandnon-healthcaresolutions
• Target,anddiscriminateinfavourof,bothdeprivedplacesanddeprivedpeople
• Removebarriersinaccesstohealthandnon-healthcaregoodsandservices
• Prioritisestructuralandregulatorypolicies
• Recogniseneedformoreintensivesupportamongmoresociallydisadvantagedgroups
• Monitortheoutcomeofpoliciesandinterventions,bothintermsofoverallcost-effectiveness and differential cost-effectiveness
• Ensureprogrammesaresuitableforthelocalcontext
• Encouragepartnershipworkingacrossagencies,andinvolvementoflocalcommunities and target groups

NHS Health Scotland: Health Inequalities Policy Review June 2013
42
Box 3: Characteristics of policies more likely to be effective in reducing inequalities in health16
• Structural changes in the environment: (e.g. area-wide traffic-calming schemes, separation of pedestrians and vehicles, child-resistant containers, installation of smoke alarms, installing affordable heating in damp, cold houses)
• Legislative and regulatory controls (e.g. drink-driving legislation, lower speed limits, seat belt legislation, child restraint loan schemes and legislation, house-building standards, vitamin and folate supplementation of foods)
• Fiscal policies (e.g. increase price of tobacco and alcohol products)
• Income support (e.g. tax and benefit systems, professional welfare rights advice in healthcare settings)
• Reducing price barriers (e.g. free prescriptions, school meals, fruit and milk, smoking cessation therapies, eye tests)
• Improving accessibility of services (e.g. location and accessibility of primary health care and other core services, improving transport links, affordable healthy food)
• Prioritising disadvantaged groups (e.g. multiply deprived families and communities, the unemployed, fuel poor, rough sleepers and the homeless)
• Offering intensive support (e.g. systematic, tailored and intensive approaches involving face-to-face or group work, home visiting, good quality preschool day care)
• Starting young (e.g. pre- and postnatal support and interventions, home visiting in infancy, preschool day care)
Box 4: Characteristics of interventions that are less likely to be effective in reducing inequalities in health16
• Information-based campaigns (mass-media information campaigns)
• Written materials (pamphlets, food labelling)
• Campaigns reliant on people taking the initiative to opt in
• Campaigns/messages designed for the whole population
• Whole-school health education approaches (e.g. school-based anti-smoking and alcohol programmes)
• Approacheswhichinvolvesignificant price or other barriers
• Housingorregenerationprogrammesthatraise housing costs
NHS Health Scotland: Health Inequalities Policy Review June 2013
43
Much of the current public health action on health inequalities is ameliorative in nature and focuses either on mitigating against the impact of broader economic and social inequalities, or helps individuals and communities to resist these impacts. Ameliorative actions on their own have been insufficient to halt the increase in health inequalities over the last 30 years but may yet have a positive impact, and continued implementation and refinements of these approaches are needed to stop health inequalities widening uncontrollably.74 However, in order to undo or eliminate inequalities in health, action must simultaneously be taken to address the fundamental causes of health inequalities.74
Review of the available literature on principles and interventions in this field in recent years continue to support Macintyre’s assertions. Guiding principles of effective/ineffective actions are valuable when planning and designing Scotland’s health inequalities strategy and related interventions. Where actions are planned that fall into the ‘less effective’ category, alternative approaches should be used where possible. If less effective actions are adopted, their potential to increase health inequality needs to be minimised and carefully monitored.
Research suggests that there is a potential for differential impacts on different groups at each stage of an intervention, or series of interventions, aimed at improving health.75 Using cardiovascular disease as an example, a number of steps were identified in both prevention and clinical services and responses to such services, which could result in increasing inequalities. Recent research with patients with lung cancer found that those living in more socio-economically deprived circumstances are less likely to receive any kind of treatment, surgery or chemotherapy.76
Not only can inequalities be generated at any point during a series of interventions, but they can also be generated during the prolonged adoption of an intervention. Recent evidence that an intervention which originally lessened inequalities can subsequently increase inequalities if there is a differential pattern of uptake and maintenance. For example, bicycle helmet use in Canada became popular across all groups, although use was sustained in the more affluent population.77
As a result, policymakers and service planners should take account of a number of factors, including: the socio-economic gradients of those who respond to consultations or lobby for change; targeting interventions to the needs of groups within the population; and that multi-modal interventions, while complex to implement and evaluate, will be more likely to reduce inequalities or at least not increase them.
3.5.3 Cost-effectiveness and health inequalities
An important consideration in designing a strategy to reduce health inequalities is its cost-effectiveness. Inequalities account for a significant element of the increasing demands on our public services. It has been estimated that around 40 per cent of our spending is currently accounted for by interventions that could have been avoided by prioritising a preventative approach.20 The Christie Commission report,20 the Scottish Parliament Finance Committee Report on Preventative Spend19 and the recent Audit Scotland report on health inequalities7 emphasised the importance of preventative spend both as a means of reducing the potential future demands on health and social care and as a means of tackling health inequalities. They also highlighted the lack
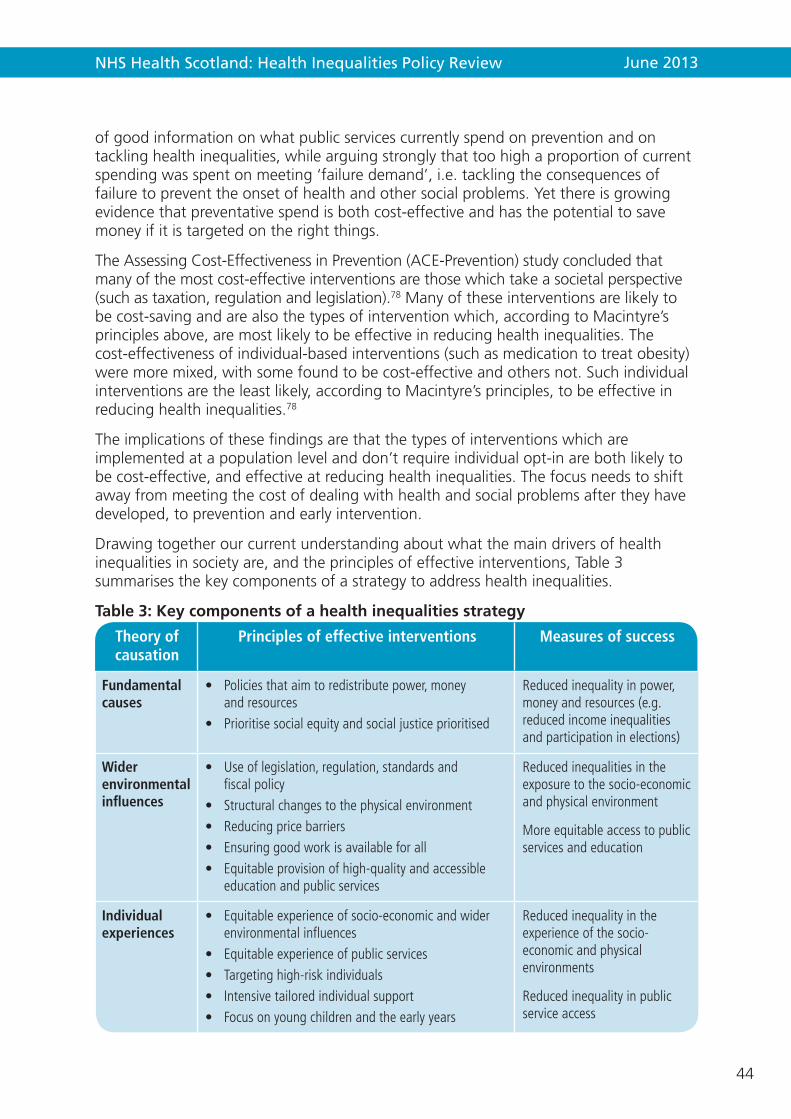
NHS Health Scotland: Health Inequalities Policy Review June 2013
44
of good information on what public services currently spend on prevention and on tackling health inequalities, while arguing strongly that too high a proportion of current spending was spent on meeting ‘failure demand’, i.e. tackling the consequences of failure to prevent the onset of health and other social problems. Yet there is growing evidence that preventative spend is both cost-effective and has the potential to save money if it is targeted on the right things.
The Assessing Cost-Effectiveness in Prevention (ACE-Prevention) study concluded that many of the most cost-effective interventions are those which take a societal perspective (such as taxation, regulation and legislation).78 Many of these interventions are likely to be cost-saving and are also the types of intervention which, according to Macintyre’s principles above, are most likely to be effective in reducing health inequalities. The cost-effectiveness of individual-based interventions (such as medication to treat obesity) were more mixed, with some found to be cost-effective and others not. Such individual interventions are the least likely, according to Macintyre’s principles, to be effective in reducing health inequalities.78
The implications of these findings are that the types of interventions which are implemented at a population level and don’t require individual opt-in are both likely to be cost-effective, and effective at reducing health inequalities. The focus needs to shift away from meeting the cost of dealing with health and social problems after they have developed, to prevention and early intervention.
Drawing together our current understanding about what the main drivers of health inequalities in society are, and the principles of effective interventions, Table 3 summarises the key components of a strategy to address health inequalities.
Table 3: Key components of a health inequalities strategy
Theory of causation
Principles of effective interventions Measures of success
Fundamental causes
• Policiesthataimtoredistributepower,moneyandresources
• Prioritisesocialequityandsocialjusticeprioritised
Reducedinequalityinpower,moneyandresources(e.g.reducedincomeinequalitiesandparticipationinelections)
Wider environmental influences
• Useoflegislation,regulation,standardsandfiscalpolicy
• Structuralchangestothephysicalenvironment• Reducingpricebarriers• Ensuringgoodworkisavailableforall• Equitableprovisionofhigh-qualityandaccessible
educationandpublicservices
Reducedinequalitiesintheexposuretothesocio-economicandphysicalenvironment
Moreequitableaccesstopublicservicesandeducation
Individual experiences
• Equitableexperienceofsocio-economicandwiderenvironmentalinfluences
• Equitableexperienceofpublicservices• Targetinghigh-riskindividuals• Intensivetailoredindividualsupport• Focusonyoungchildrenandtheearlyyears
Reducedinequalityintheexperienceofthesocio-economicandphysicalenvironments
Reducedinequalityinpublicserviceaccess
NHS Health Scotland: Health Inequalities Policy Review June 2013
45
3.6 The potential for improvementInequalities would be much wider, were it not for existing protective mechanisms (e.g. universal health care and education free at the point of use, progressive taxation, income support, neighbourhood regeneration, housing improvements, and control of the environment via clean air acts and health and safety at work legislation).16 It is important to protect and value these foundation stones of a fairer, more equitable society. For example, social protection policy (including welfare benefits) is a crucial means of countering individuals’ different susceptibilities to disadvantage, their exposure to risk, and their different capacities to mitigate the consequences of adverse life events.12 At any level of economic development, the coverage of welfare benefits has a positive impact on life expectancy for those most at risk.16 In light of the current changes in welfare benefits, developing a clear response to protect individuals from the potential negative impact is a matter of urgency. However, focusing solely on the most disadvantaged will not reduce health inequalities sufficiently or reduce the steepness in the social gradient in health. Actions must be universal, but with a scale and intensity that is proportionate to the level of disadvantage. This is called proportionate universalism.18
Responsibility for a number of key policy areas including health and social services, education and training, housing, environment, local government, and transport are devolved to the Scottish Parliament. These powers provide opportunities to introduce policies in areas that may have a significant impact on reducing health inequalities such as early years79–81 environment and health82 and regeneration.83 Other recent legislation and strategy highlights the rights of patients in terms of access, communication and participation.84 The Scotland Act 201285 transferred further powers to raise taxes and develop the devolved institutions, offering the potential for greater control over public spending, taxation and other fiscal measures, and regulatory powers, giving the Scottish Parliament more potential to reduce poverty and income inequality.
Public service reforms being driven by the Christie Commission, the Review of Community Planning and the Statement of Ambition provide further opportunities to address health inequalities. They are important drivers for policy and budget reallocation in Community Planning Partnerships to encourage transformational change, shape preventative spend and, through priority-setting, tackle the causes of inequalities in Scotland. Current public service reform in Scotland requires public services to work together, with the communities they serve and with private and third sector partners, to deliver a more holistic and context-specific response to the needs of, and assets within, communities.12 The backdrop of cuts in public finance presents obvious challenges but some opportunities, with the cuts requiring a revaluation of public service values, priorities and approaches with a greater emphasis on prevention, collaboration, equality and diversity, and person-centred approaches.
Nonetheless, the extent to which Scotland can successfully reduce health inequalities will be heavily influenced by policy decisions taken by the UK and European governments and by the international economic context.

NHS Health Scotland: Health Inequalities Policy Review June 2013
46
3.6.1 UK policy
The UK government retains a range of relevant powers that influence Scotland’s ability to tackle health inequalities. One recent positive measure is the Equality Act.86 This provides an important lever for action by placing a legal duty on public bodies to meet a new integrated Equality Duty to ensure equality across people sharing the protected characteristics (e.g. age, disability, race, sex). These are the same characteristics that can make people vulnerable to discrimination and experiencing worse health.86
The recent changes to welfare benefits are likely to have the deepest adverse impact on the poorest and most vulnerable groups.87 The move to applying for benefits online has the potential to further isolate vulnerable groups with limited access to, and ability to use, the internet. Changes to the welfare and tax systems currently being undertaken are likely to widen the socio-economic differences across society even more87 and impact negatively on the most vulnerable.88
3.6.2 European Union, Commission and Council of Europe
Scotland operates within the boundaries of European Law, providing a range of legislation and directives that cover employment law, particular industries and environmental legislation. However, the true impact of these laws and regulations on helping to reduce inequalities is dependent on the response and adherence to them within Scotland.
The EU framework also sets out human rights requirements of its members, underpinned by the European Convention on Human Rights89 90 with a series of EU directives setting out guidance on ensuring equalities between different groups and in policy areas, such as employment.
3.6.3 The wider macro-economic climate
Like the rest of the UK, Scotland is in the midst of a deep and prolonged economic downturn, influenced by domestic, European and global conditions. Rates of unemployment remain well above trend even though the Scottish and UK labour markets have held up better than expected at the start of the crisis.91 The link between insecure employment, unemployment and worklessness, and poor health is well evidenced92 93 and therefore continuing high levels of unemployment could have a significant impact on health inequalities in Scotland. The unemployment and health impacts of previous recessions have been widely presented and reviewed recently in light of the most recent recession as an important area to monitor.94 95
3.6.4 The role of global corporations
Global corporations with premises in Scotland provide employment and thus have the potential to contribute to reducing health inequalities through their recruitment and employment policies. Furthermore, food producers and retailers ensure food is available all year round and in all communities, and mass production helps reduce price, making food more affordable. On the other hand, some global corporations use targeted and well-financed marketing and branding strategies designed to encourage consumption of some products that may be harmful to health and/or wealth.96 Two prominent examples,
NHS Health Scotland: Health Inequalities Policy Review June 2013
47
the tobacco and alcohol industries, use their power to resist government attempts to introduce regulation to reduce availability, affordability, advertising and consumption of health-damaging products.
3.6.5 Broader challenges
When global oil output starts to diminish, any subsequent shortfall in energy supply is likely to result in high energy prices,97 increasing the proportion of individuals living in fuel poverty and potentially impacting negatively on the economy. There may also be some potential positive health impacts such as reduced pollution-driven respiratory illness.97
Climate change has the potential to affect physical and mental health, quality of life and people’s access to basic goods (such as affordable food, flood-free homes).97 The poorest people are often more exposed to climate change impacts, they are more vulnerable to these impacts, and they find it harder to recover.98
The population of Scotland is changing. The ageing population presents a challenge to public service finances. The health inequalities established by early exposure persist into later life.
A sizable minority of the Scottish population does not have home internet access, with many not using the internet at all.99 Those on lower incomes, not in work, with a disability or long-term illness and/or living in the most deprived areas are the least likely to have access or to use the internet.100 The potential exclusion of such groups through new interventions that use digital media to deliver information, advice, services and benefits may increase health inequalities rather than reduce them.101
3.7 SummaryInequalities in Scotland are deep, wide and have persisted over 30 years, in absolute terms, in relative terms within the country, and between Scotland compared to other countries. Although very recent data may suggest an apparent turn in this tide, it is too early to be confident that a sea change in inequality may be taking hold. We must acknowledge that the effects measured in mortality take time to show change. The gradient of inequalities remains steep.
There are many determinants and influences on health inequalities. Health inequalities are rooted in economic forces, macro sociopolitical environment, political priorities and decisions, and societal values of equity and fairness, which together contribute to an unequal distribution of power and resources, leading to poverty, marginalisation and discrimination. These fundamental causes shape the social, economic, physical and service environment (life circumstances). The environment in which individuals and families live influences their response or experiences, which may lead to inequalities in health outcomes.
A strategy to address health inequalities in Scotland is likely to require actions operating across all three levels – fundamental causes, wider environmental causes and individual experiences. Actions at each level needs to balance improving overall population health as well as reducing health inequalities.

NHS Health Scotland: Health Inequalities Policy Review June 2013
48
There are other broader phenomena which are likely to have profound impacts on health inequalities. They are largely influenced by policy or circumstances outside Scotland’s control (e.g. the economic recession and welfare reform). Health inequality trends therefore need to be considered in the context of policy, not only within the scope of Equally Well, but also by events and policy determined outside Scotland.
Ameliorative approaches to tackling health inequalities may help stop health inequalities widening uncontrollably, but they have been insufficient to halt the increase in health inequalities over the last 30 years. In order to undo or eliminate inequalities in health, action must be simultaneously taken to address the fundamental causes of health inequalities.

NHS Health Scotland: Health Inequalities Policy Review June 2013
49
4. What works to address health inequalities?
This chapter summarises what works to address health inequalities, combining highly synthesised review-level evidence of effective interventions with illustrative examples (shaded sections) from Scotland and the UK, drawing on single evaluation studies or linked studies. The quality of the evidence presented is thus very variable. The examples from the review-level evidence are listed in Table 4 (pages 56–57).
A strategy to address health inequalities in Scotland will require actions operating across all three levels of determinants: Fundamental, wider environmental and individual. Action to address the wider environmental causes, such as the availability of quality work, housing and education; and individual experiences, risks and lifestyles are important, but will not solve the problem. The fundamental causes (upstream) of health inequalities such as lack of power and money also need to be addressed through, for example, fiscal policies including changes in the tax and benefits system and initiatives to address democratic deficits. All actions will need to balance the goals of improving overall population health as well as reducing health inequalities.
Key messages:
7. Actions that are more likely to be effective in addressing wider environmental causes include: structural changes in the environment, for instance on roads; speed-reducing measures in deprived areas; legislative and regulatory controls, for example, the smoking ban; and housing regulations. What is known to date about the range of specific actions that are effective in reducing health inequalities are summarised in Table 1.
8. Actions that are more likely to be effective in mitigating the effects of health inequalities at an individual level may require redesign of public services. They include targeting high-risk individuals, intensive tailored support for those with greatest need and a focus on early child development. Where possible, for individuals, it is best to use a direct measure of need (e.g. individual income, disability, housing status or long-term health condition) rather than a proxy (e.g. area deprivation).
9. Inequalities account for a significant element of the increasing demands on our public services because of a persisting cycle of deprivation and low aspiration. Around 40 per cent of our spending is currently accounted for by interventions that could have been avoided by prioritising a preventative approach. The focus needs to shift away from meeting the cost of dealing with health or social problems after they have developed to prevention and early intervention.
NHS Health Scotland: Health Inequalities Policy Review June 2013
50
The sources of evidence used include papers written for the Ministerial Task Force on Health Inequalities in 2007,16 (which outlines the principles for effective action on health inequalities developed by Macintyre described in the previous chapter) and the Strategic Review of Health Inequalities in England post-201018 (both of which are informed by a mix of research evidence, theory and expert input). The latter sets out actions around six principles, namely: give every child the best start in life; enable all children, young people and adults to maximise their capabilities and have control over their lives; create fair employment and good work for all; ensure a healthy standard of living for all; create and develop healthy and sustainable places and communities; and strengthen the role and impact of ill health prevention. Evidence is also drawn from systematic reviews that focus on the health inequality impact of interventions, and reviews of such reviews. For the illustrative examples of UK and Scottish actions (presented in the shaded boxes), some have well-designed evaluations with good data available (e.g. Childsmile, Scottish Housing Quality Standard) while others have preliminary findings about their impact on wider environmental and individual influences and more limited evidence of inequalities impact. In some cases (e.g. Healthier, Wealthier Children, GoWell), there are good monitoring data combined with plausible theory about the potential contribution of interventions to addressing inequalities in health.
As described in the previous chapter, theory and current evidence suggest that interventions which act on the fundamental causes or the wider environmental causes will be most effective in addressing health inequality. Much of the research evidence, however, describes effects on individuals.
4.1 Income, employment and work
4.1.1 Income
Reducing inequalities in life circumstances, including income, is one of the guiding principles of effective policies to reduce health inequalities (Box 2).16 This includes income both from employment and income arising from the tax and benefits systems. Ensuring a healthy standard of living for all is one of the six primary policy objectives outlined in the Marmot Review in 2010.18 The Marmot Review argues that there is a minimum level of income needed to lead a physically and mentally healthy life, and core minimum income definitions do not include health needs.18 The review concluded that tax and benefit structures should be adapted to be fairer, with greater work incentives.
There is review-level evidence that professional welfare rights advice that seeks to maximise income and social changes, such as rent assistance to allow low-income families the choice of where to live, impacts on depression levels and social outcomes, and overall health and levels of health behaviours.102 (See also Section 4.4.3 about Healthier, Wealthier Children, a Glasgow welfare advice and income maximisation service.)
NHS Health Scotland: Health Inequalities Policy Review June 2013
51
4.1.2 Costs/price controls
There is review-level evidence that using fiscal powers of raising taxation to increase the price of harmful commodities like tobacco are an effective measure to reduce inequalities in health behaviours. 16 77 105–107
There is systematic review-level evidence that privatisation of retail alcohol sales is associated with a substantial increase in per capita sales in the USA and Canada, a well-established proxy for excessive alcohol consumption, and that remonopolisation by some states and provinces is associated with a decrease in alcohol-related harms. 108
Legislation and regulatory controls: Taxation and welfare benefits (UK)
Rationale: tax and welfare benefit systems are potentially powerful mechanisms for redressing income inequalities and can serve as a financial buffer for low-income households, thereby influencing health inequalities.18
The intervention: a suite of changes to tax and welfare benefits were introduced by the UK government in the late 1990s including the National Minimum Wage, Child and Working Families Tax Credits, National Childcare Strategy, improved maternity and family leave provision, welfare to work programmes and benefit increases for families with children.
Monitoring and evaluation: studies have examined the impacts of changes in tax and welfare benefits on employment rates, income and expenditure, but there is little robust evidence of a direct impact on health, or the pathways by which taxation and welfare benefits impact on health inequalities. There is a dearth of research exploring interactions between ill health and the experience of receiving welfare benefits, or how the experiences of different welfare benefits might impact upon the health, wellbeing and engagement with the formal economy.103
Impacts: the effects of these changes on the material wellbeing of low-income households with children were analysed.104 Household income increased and the numbers of children in poverty in absolute and relative terms began to fall. Comparing expenditure patterns and ownership of durable goods among low- and high-income families before (1995–1998) and after (2000–2003) the reforms, they found a shift in spending toward items such as motoring, clothing, leisure goods and services. Expenditures on child-related items increased more quickly than expenditure on other items. The low-income families with younger children showed a marked increase in spending on children’s footwear and clothing, books and fruit and vegetables, compared to low-income families with older children. Overall the improved material circumstances and the ways in which the extra money was spent were likely to help ‘narrow the gap between low-income children and their more affluent peers’ (p723).104 The changes to the welfare benefits system currently being introduced by the UK government underline the urgent need for evaluative evidence to understand the impacts on health inequalities as part of the ongoing Equally Well policy framework.
NHS Health Scotland: Health Inequalities Policy Review June 2013
52
There is also evidence to suggest that addressing price barriers can be effective in addressing health inequalities, for example by improving availability of affordable healthy food.16 75 Evidence from one systematic review found that price reductions in low-fat snacks in vending machines, farmers’ market coupons for fruit and vegetables, and free food provision can all impact positively on diet.102 Similarly, there is evidence to suggest that free fruit provision and free folic acid supplements can positively impact on health inequalities.75 Conversely, approaches to health improvement which involves significant costs to the individual or other barriers would be less effective in reducing inequalities.16
4.1.3 Employment
Action on employment is a key entry point for addressing health inequalities.16 18 The creation of ‘fair employment and good work for all’ is one of the six primary policy objectives of the health inequalities strategy outlined by the Marmot Review. Specifically this includes access to good jobs and a reduction in long-term unemployment across the social gradient. It is also an important factor that contributes to enhancing mental and social wellbeing and social inclusion.
Employment provides income which in turn allows access to health improving resources such as good housing, affordable heating and healthy food.16 Conversely, unemployment (particularly long-term unemployment) impacts negatively on both physical and mental health. Getting people into good work is an important strategy in improving health.18
4.1.4 The work environment
‘Good work’ is characterised by: a living wage; having control over work; in-work development; flexibility; protection from adverse working conditions; ill health prevention and stress management strategies; and support for sick and disabled people that facilitates a return to work.18
There is a strong body of review-level evidence that identifies changes to the work environment as an effective way to address health inequalities. Effective interventions include: structural changes to the work environment; initiatives to increase job control and autonomy; psychosocial interventions at the individual level, specifically those which change the level of job control; and organisational level psychosocial workplace interventions.109–111
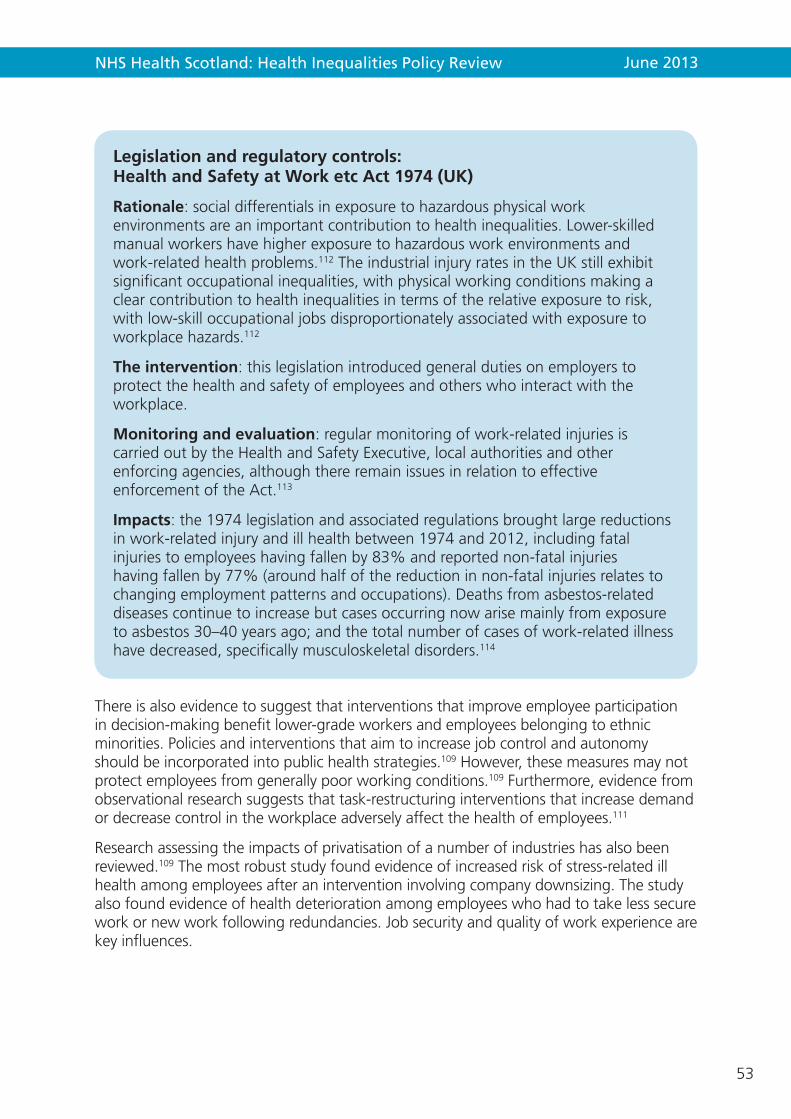
NHS Health Scotland: Health Inequalities Policy Review June 2013
53
There is also evidence to suggest that interventions that improve employee participation in decision-making benefit lower-grade workers and employees belonging to ethnic minorities. Policies and interventions that aim to increase job control and autonomy should be incorporated into public health strategies.109 However, these measures may not protect employees from generally poor working conditions.109 Furthermore, evidence from observational research suggests that task-restructuring interventions that increase demand or decrease control in the workplace adversely affect the health of employees.111
Research assessing the impacts of privatisation of a number of industries has also been reviewed.109 The most robust study found evidence of increased risk of stress-related ill health among employees after an intervention involving company downsizing. The study also found evidence of health deterioration among employees who had to take less secure work or new work following redundancies. Job security and quality of work experience are key influences.
Legislation and regulatory controls: Health and Safety at Work etc Act 1974 (UK)
Rationale: social differentials in exposure to hazardous physical work environments are an important contribution to health inequalities. Lower-skilled manual workers have higher exposure to hazardous work environments and work-related health problems.112 The industrial injury rates in the UK still exhibit significant occupational inequalities, with physical working conditions making a clear contribution to health inequalities in terms of the relative exposure to risk, with low-skill occupational jobs disproportionately associated with exposure to workplace hazards.112
The intervention: this legislation introduced general duties on employers to protect the health and safety of employees and others who interact with the workplace.
Monitoring and evaluation: regular monitoring of work-related injuries is carried out by the Health and Safety Executive, local authorities and other enforcing agencies, although there remain issues in relation to effective enforcement of the Act.113
Impacts: the 1974 legislation and associated regulations brought large reductions in work-related injury and ill health between 1974 and 2012, including fatal injuries to employees having fallen by 83% and reported non-fatal injuries having fallen by 77% (around half of the reduction in non-fatal injuries relates to changing employment patterns and occupations). Deaths from asbestos-related diseases continue to increase but cases occurring now arise mainly from exposure to asbestos 30–40 years ago; and the total number of cases of work-related illness have decreased, specifically musculoskeletal disorders.114

NHS Health Scotland: Health Inequalities Policy Review June 2013
54
4.2 The physical environment and local opportunitiesThe physical environment includes the built and outdoor environment. The interactions between people and the environment include biological responses to agents in the environment (such as air pollutants, allergens, infectious agents, radiation) as well as psychosocial responses to perceptions of places. Thus health impacts include both direct physical impacts (e.g. asthma, unintentional injuries) and behavioural and wellbeing responses to places (e.g. perceptions of safety, stigmatisation) and access to amenities. There are close two-way links and interactions between the physical structure of neighbourhoods and the people who live in or use the neighbourhoods (communities).
4.2.1 Housing and homelessness
Table 3 (section 3.5.2) identifies the characteristics of policies more likely to reduce inequalities related to housing such as: targeting people who struggle to afford fuel, and the homeless; improving housing and building standards; installing affordable heating in cold and damp housing; and installing mains-powered smoke alarms.16 Evidence from systematic reviews identifies a number of housing interventions for which there is evidence of impact on inequalities: changes to housing infrastructure (e.g. design and quality) to reduce the risk of falls, rehousing and renovation.18
Regulatory controls: Scottish Housing Quality Standards (SHQS)
Rationale: evidence shows that regulatory controls that set standards for housing and buildings can impact on inequalities.16
The intervention: national standards of minimum quality requirements applicable to homes in the public and private sectors were introduced in 2011. There is currently no requirement for private owners and landlords to meet the SHQS.115
Monitoring and evaluation: the SHQS is the subject of regular monitoring through the Scottish House Condition Survey which provides clear evidence of impact on housing standards and data suggests that by 2015 all dwelling owned by social landlords will meet the SHQS.
Impacts: the improvements in housing quality brought about by the introduction of the SHQS are seen across both the private rented and social housing sector, although the social housing sector is improving much faster overall.115 This measure has provided the impetus for a significant step forward in the quality of social housing in Scotland. The private rented sector has grown in terms of absolute numbers and as a proportion of the Scottish housing stock. This sector is reported to play a key role in providing affordable housing to those on low incomes and is expected to play an increasing role for this group in future.116 It is important to note that affordability has been recognised as a problem for lower-income households in the private rented sector and that current changes to housing benefit are likely to be felt more acutely among this group.116 In addition to this, standards and levels of satisfaction are lower within the sector. Opportunities to reduce inequalities using this effective measure to improve housing standards could be maximised if it were extended to the private rented sector.

NHS Health Scotland: Health Inequalities Policy Review June 2013
55
Marmot noted that fuel poverty was a significant problem and likely to grow as the cost of fuel increases. It called for improvements to the energy efficiency of housing across the social gradient.18 There is systematic review evidence that warmth and energy efficiency interventions can result in improvements in general health, respiratory health and mental health (particularly where the targets were those with inadequate warmth or existing respiratory disease). Such interventions are associated with increased usable space, privacy, improved social relationships and a reduction in sickness absence from work or school.117
A recent systematic review found that housing as a single intervention benefits health, particularly for the most vulnerable groups, that is, homeless people with mental health problems or substance misuse problems.118
4.2.2 Air quality
Review-level evidence shows that legislation banning smoking in public places can reduce the differential exposure of those living in more deprived circumstances to environmental tobacco smoke (also known as second-hand smoke) and can remove the inequitable coverage observed when bans are voluntary.106 119 Clean Air Acts are an example of a regulatory control which is likely to impact on inequalities.16
4.2.3 Water quality and additives
Potable water is commonly chlorinated to kill bacteria and render it safe for drinking. Certain other chemical additives and treatments are necessary to ensure water safety and quality, and are widely accepted universal measures. Fluoridation of the water
Legislation and regulatory controls: Smoking, Health and Social Care (Scotland) Act 2005
Rationale: evidence shows that legislation banning smoking in public places can reduce inequalities in exposure to second-hand smoke (SHS).106 119
The intervention: this Act of the Scottish Parliament banned smoking in most wholly or substantially enclosed public places.120
Monitoring and evaluation: the evaluation of the smoking ban generated a wealth of studies. However, little attention has been given to the analysis of its differential impacts on sub-populations.
Impacts: compliance with the ban on smoking in enclosed public places has been high in Scotland (minor differences between areas) and this resulted in an immediate and sustained reduction in SHS exposure for everyone with large and measurable population health improvements (respiratory, cardiovascular, perinatal). The benefits of reduced SHS exposure were found to be greatest for workers in the hospitality sector121 while among children the greatest absolute reduction is in the lowest socio-economic group, although cotinine levels remain highest in this group.122

NHS Health Scotland: Health Inequalities Policy Review June 2013
56
supply reduces dental caries in the population and would differentially impact on the dental health of children living in more deprived circumstances and thus address health inequalities.77 However, in Scotland, other than natural fluoridation in parts of Moray, mass fluoridation was rejected in a public consultation and resisted in court on the basis of perceived but unquantified harm over established benefit, lack of benefit to people without teeth, and the principle of autonomy.
4.2.4 Neighbourhood amenity
Improving the accessibility of primary health care and other core public services including the location of services, has been identified as being likely to reduce inequalities.16 The siting of services within active travel distance of homes is also a factor that increases levels of walking and cycling within neighbourhoods.
Marmot argues that good quality green and open spaces improve physical and mental health, and will have more of an impact on health inequalities if they are sited close to where people live.18 Improving the availability of good quality open and green space across the social gradient will have the joint outcome of impacting on health inequalities and mitigating climate change.
4.2.5 Access to healthy food
Improving the food environment across the social gradient is an element of the Marmot Review policy objective of creating healthy and sustainable places and communities.18 A recent systematic review specifically identified banning trans-fats and halving daily salt intake as two population-level interventions which were generally effective and cost-saving ways to lower cardiovascular disease levels and reducing inequalities.119
See also section 4.4 for studies on food in schools
4.2.6 Transport
Transport is a dimension of neighbourhood environments with implications for air quality, safety and perceptions of safety and active travel. In addition, reducing emissions is also linked with tackling climate change.
Transport-related policies more likely to reduce inequalities (Table 3) include legislative and regulatory controls such as drink-driving regulation, lower speed limits and loan schemes for child restraint equipment in cars.16 In terms of accessibility to services, improved transport links to core public services would also be likely to reduce inequalities. In terms of structural changes to the environment, area-wide traffic calming schemes and separation of pedestrians and vehicles are examples which would be more likely to reduce health inequalities.16 There is review-level evidence that area-wide traffic calming schemes have the potential to reduce traffic injuries and deaths.102

NHS Health Scotland: Health Inequalities Policy Review June 2013
57
Improving active travel across the social gradient is recommended as a priority objective by the Marmot Review. There is little evidence to date for population level interventions as being effective in promoting a shift from car use to walking and cycling (but there is also not evidence of no effect)102 and there is mixed evidence on the effectiveness of engineering interventions. However, the use of financial incentives and the provision of alternative transport services (e.g. car share schemes, telecommuting, and opening new public transport services) have had some success in changing journey type.128
4.2.7 Regeneration
Area-based regeneration in Scotland brings together economic, housing, neighbourhood and social regeneration. Marmot argues that in order to address the social determinants of health in each locality, planning, transport, housing, environmental and health systems should be fully integrated.18 Indeed, to address the policy objective of creating
Structural change in the environment: 20 mph zones (Edinburgh and London)
Rationale: road traffic casualties show some of the widest socio-economic differentials of any cause of morbidity or mortality,123 and child pedestrian injuries remain the leading cause of death and injury to 5- to 14-year-olds in the UK.124 There is clear evidence available to show the introduction of mandatory 20 mph zones are effective in reducing vehicular speed and road casualties.125 126
The intervention: in London, 20 mph zones have been concentrated in deprived areas. In Edinburgh a pilot scheme has seen the introduction of 20 mph zones in residential and school areas.
Monitoring and evaluation: the impact in London has been evaluated over a number of years and impact information is available. This level of data is not available in Edinburgh although early indications of positive impact have been presented.
Impacts: research shows that the implementation of 20 mph zones in deprived areas in London have, to some degree, narrowed inequalities in road injury.123 In addition, the number of casualties prevented by zones was substantially larger in areas of greater socio-economic deprivation.123 However, authors highlighted that the underlying decline in road casualties on all roads was greater in less deprived areas meaning that despite the targeting of 20 mph zones, socio-economic inequalities in road injuries in London have widened over time. They concluded that extending 20 mph schemes has only limited potential to reduce differentials further.125 Early findings from the introduction of 20mph zones in Edinburgh indicate positive impacts on the rates of accidents and severity of injuries in residential areas and on the rates of accidents in school areas. In Edinburgh, evidence relating to differential impacts is not available.127 Although there is evidence that numbers of road traffic accidents are decreasing over time anyway, the reduction observed in the Edinburgh study is much greater than the average national reduction over the past ten years.

NHS Health Scotland: Health Inequalities Policy Review June 2013
58
healthy and sustainable places and communities, the Marmot Review includes supporting locally developed, evidence-based community regeneration programmes.
There is some research evidence to support this view. Positive area effects result from interventions designed to improve high-poverty areas, although adverse impacts can also occur.129 Such programmes can result in improvements to average employment rates, educational achievements, household income and housing quality and all of these may contribute to a reduction in health inequalities.16 130 However, such interventions can also result in rent rises which may leave the residents poorer or cause them to leave the area completely.
4.3 Education and learningEducation is a key area for intervention to address health inequalities.16 18 Good-quality education provides literacy, numeracy, analytical and communication skills which in turn will increase employability, enhance ability to cope, improve mental and social wellbeing, and promote social inclusion.16 The acquisition of skills (both cognitive and non-cognitive) is strongly associated with educational achievement and is associated with better employment, income and health.18 Improving educational outcomes across
Housing and urban regeneration: GoWell in Glasgow
Rationale: the Marmot Review supported locally developed, evidence-based community regeneration programmes,18 but other evidence also cautions about potential negative impacts in terms of increases in rent.16
The intervention: GoWell is a research and learning programme that aims to investigate the impact of investment in housing, regeneration and neighbourhood renewal in Glasgow on the health and wellbeing of individuals, families and communities over a ten-year period. This programme aims to establish the nature and extent of these impacts, to learn about the relative effectiveness of different approaches, and to inform policy and practice in Scotland and beyond.
Monitoring and evaluation: the GoWell research programme is ongoing, but has already generated a wealth of high-quality research studies.131
Key learning: overall, the research suggests that physical regeneration and the experience of moving to a new house and area is not sufficient to transform people’s lives, although improved internal housing conditions are beneficial. Prior attitudes to moving and aspects of the process of relocation (the degree of choice and distance involved) are important moderators of the outcomes.132 Recent evidence demonstrates that improvements in wellbeing are taking place in regeneration areas, health behaviours have improved slightly overall, and use of primary care services is increasing.133 However, the evidence also currently suggests a worsening of self-reported general health over time. The data will be further analysed to understand any potential impacts changing population composition may be having, and of signs of health benefits in regeneration.
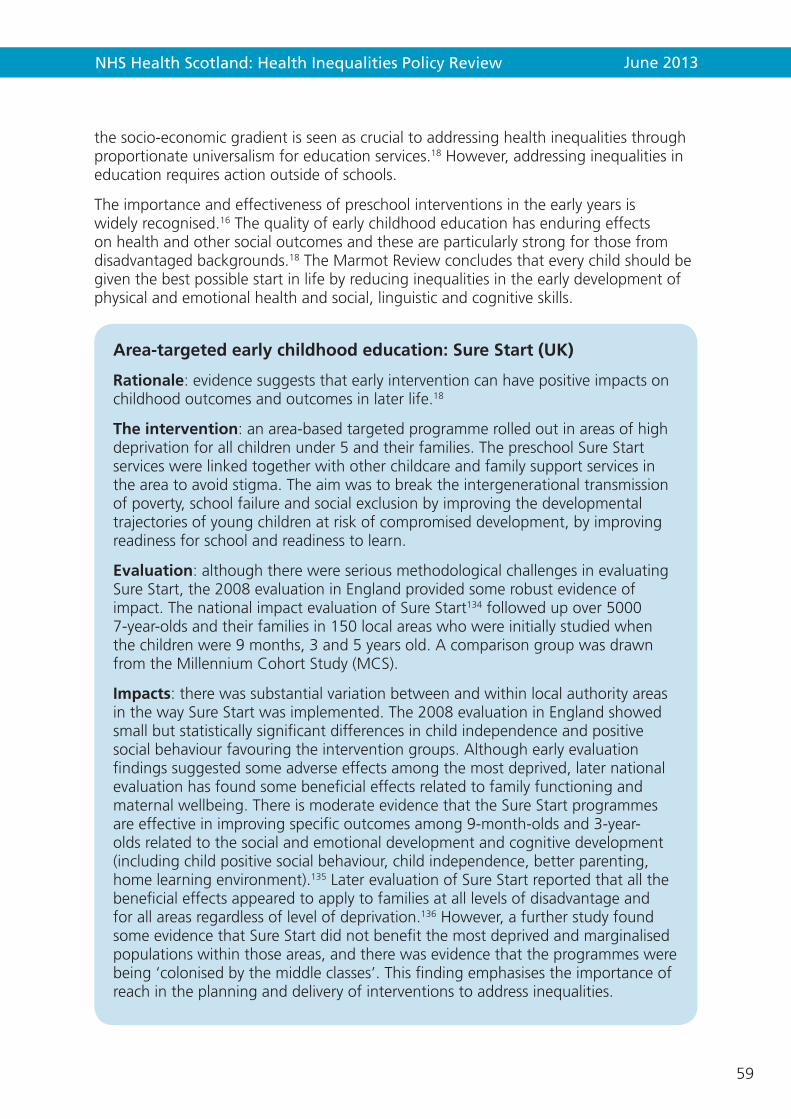
NHS Health Scotland: Health Inequalities Policy Review June 2013
59
the socio-economic gradient is seen as crucial to addressing health inequalities through proportionate universalism for education services.18 However, addressing inequalities in education requires action outside of schools.
The importance and effectiveness of preschool interventions in the early years is widely recognised.16 The quality of early childhood education has enduring effects on health and other social outcomes and these are particularly strong for those from disadvantaged backgrounds.18 The Marmot Review concludes that every child should be given the best possible start in life by reducing inequalities in the early development of physical and emotional health and social, linguistic and cognitive skills.
Area-targeted early childhood education: Sure Start (UK)
Rationale: evidence suggests that early intervention can have positive impacts on childhood outcomes and outcomes in later life.18
The intervention: an area-based targeted programme rolled out in areas of high deprivation for all children under 5 and their families. The preschool Sure Start services were linked together with other childcare and family support services in the area to avoid stigma. The aim was to break the intergenerational transmission of poverty, school failure and social exclusion by improving the developmental trajectories of young children at risk of compromised development, by improving readiness for school and readiness to learn.
Evaluation: although there were serious methodological challenges in evaluating Sure Start, the 2008 evaluation in England provided some robust evidence of impact. The national impact evaluation of Sure Start134 followed up over 5000 7-year-olds and their families in 150 local areas who were initially studied when the children were 9 months, 3 and 5 years old. A comparison group was drawn from the Millennium Cohort Study (MCS).
Impacts: there was substantial variation between and within local authority areas in the way Sure Start was implemented. The 2008 evaluation in England showed small but statistically significant differences in child independence and positive social behaviour favouring the intervention groups. Although early evaluation findings suggested some adverse effects among the most deprived, later national evaluation has found some beneficial effects related to family functioning and maternal wellbeing. There is moderate evidence that the Sure Start programmes are effective in improving specific outcomes among 9-month-olds and 3-year-olds related to the social and emotional development and cognitive development (including child positive social behaviour, child independence, better parenting, home learning environment).135 Later evaluation of Sure Start reported that all the beneficial effects appeared to apply to families at all levels of disadvantage and for all areas regardless of level of deprivation.136 However, a further study found some evidence that Sure Start did not benefit the most deprived and marginalised populations within those areas, and there was evidence that the programmes were being ‘colonised by the middle classes’. This finding emphasises the importance of reach in the planning and delivery of interventions to address inequalities.
NHS Health Scotland: Health Inequalities Policy Review June 2013
60
4.3.1 Schools, further education, and lifelong learning
Marmot argues that all children, young people and adults should be able to maximise their capabilities and have control over their lives.18 He identified actions to reduce the social gradient in skills and qualifications by improving access to, and the quality of, lifelong learning, and providing work-based learning and skill development for young adults. This could be achieved through: accessible support and advice for young people on life skills, training and employment opportunities; providing work-based learning, including apprenticeships, for young people and those changing careers; and increased availability of non-vocational lifelong learning.
4.4 Access to services
4.4.1 Interventions to improve reduce barriers/improve access to services
Improving the accessibility of services through the siting/location of services, providing transport and ensuring affordability is likely to reduce inequalities.16 There is review-level evidence to support the view that speciality outreach services could improve access and self-reported health.102
Evidence indicates that culturally competent health care (language and culture training for health professionals and use of interpreters, etc.) increases healthcare use and access. Similarly, lay health workers who support people to promote health or manage illness in ways appropriate to their culture, have shown promising benefits with respect to uptake of immunisation, and promoting the uptake of breastfeeding.102
Applying Mcintyre’s principles of interventions effective at reducing health inequalities suggests the need to maintain and improve equity in the system, removal of barriers to access of goods and services, and prioritising more intensive support among more disadvantaged groups. Several NICE reviews on specific setting or population groups (e.g. pregnant women, cancer and coronary heart disease) point to the importance of the timing of service resource, and suggest that the more complex the population need, the more important that the needs are met when they arise (not just within business hours).137–139 Wider holistic needs are also met at the same time, through a ‘one-stop-shop’ style approach. NICE also advocates greater flexibility in service design relevant to local population need. Cultural and attitudinal issues also come into play, as well as issues of disability, giving rise to cultural and communication barriers underlining the need for a range of communication media to address, visual/audio/verbal impairment and interpreting/translation needs.
Addressing price barriers through providing free services (e.g. free prescriptions;16 free smoking cessation therapies;16 free eye tests;16 and free folic acid supplements)75 105 is an effective intervention for addressing inequalities within the healthcare sector. In schools, the providing free school meals, free fruit and free milk have been identified as having potential to reduce health inequalities.16 75 105
NHS Health Scotland: Health Inequalities Policy Review June 2013
61
4.4.2 Targeted and tailored services
The need to prioritise and target tailored support services for high-risk or vulnerable individuals or families has been discussed by a number of authors.16 77 18 For example, there is evidence that smoking cessation services that are tailored for and specifically target disadvantaged smokers can impact positively on inequalities in smoking rates.105 Similarly, the use of financial incentives for general practitioners to target childhood immunisation and cervical screening can help to decrease socio-economic inequalities.77
Use of financial incentives: quit4u smoking cessation services in Dundee
Rationale: smoking cessation services that are specifically targeted and designed for disadvantaged smokers can positively impact on smoking inequalities.106
The intervention: quit4u is a smoking cessation service in Dundee that was specifically designed to help smokers who live in deprived areas (DEPCATs 5, 6 or 7) through the use of financial incentives to increase take-up of cessation support and quit rates in these areas. The context was set by the Scottish Government HEAT target for the period 2008–2011. The service offers the standard smoking cessation service of pharmacotherapy plus structured behavioural support supplemented by financial incentives provided weekly (up to a maximum of 12 payments, spread over a potential 20 weeks) to those who remain quit, verified by a carbon monoxide (CO) breath test.
Evaluation: because of the combination of intervention supports, it was not possible to undertake a Randomised Control Trial comparing impacts of quit4u with other smoking cessation services. A matched sample of quit attempts was identified from the Scottish National Smoking Cessation database. The matching of the samples was based on key demographic characteristics, including deprivation. Although demonstrating the impact on the targeted population, it is not possible to assess the impact on health inequalities. This suggests that future evaluation should consider measures of relative as well as absolute impacts on health and health inequalities.
Impacts: the evaluation140 found higher quit rates at 1, 3 and 12 months compared with the average quit rates of other NHS cessation services in the rest of Scotland. The service was successful in attracting smokers and recruited 2,042 smokers over two years. However due to the NHS performance target at this time, the take-up of smoking cessation services in deprived areas also increased in other parts of Tayside and in other Health Board areas.140
NHS Health Scotland: Health Inequalities Policy Review June 2013
62
Targeted primary healthcare service: Keep Well health checks (Scotland)
Evidence: recent review-level evidence on cardiovascular health checks suggest that multiple-risk-factor interventions like Keep Well result in small reductions in risk factors including blood pressure, cholesterol and smoking. However, this evidence shows little or no impact on the risk of cardiovascular disease outcomes including mortality and thus unlikely to reduce health inequalities at a population level.141
The intervention: the Keep Well Programme was established in 2006 with the aim of reducing health inequalities by providing health checks for those living in areas of greatest deprivation and between the ages of 45 and 64 at high risk of preventable serious ill health, including heart disease. The programme has been rolled out in waves by NHS Boards.
Monitoring and evaluation: a number of evaluations of the Keep Well programme have taken place nationally and locally but none to date have captured the impact of the programme. The Wave 1 evaluation provided learning in relation to targeting and engagement. Local Health Board evaluations of Keep Well have largely focused on the implementation process and certain short-term outcomes.142
The current impact evaluation (due to report in 2014) is assessing population trends and looking at other potential intermediate outcomes that Keep Well might be expected to improve.
Impacts: local variability in implementation of the programme, together with data-sharing and access issues have made it difficult to assess the impact of the programme on health, or on health inequalities so far.

NHS Health Scotland: Health Inequalities Policy Review June 2013
63
Targeted, tailored support: Childsmile
Rationale: dental disease is most prevalent in children from low socio-economic status families and infants living in areas of high deprivation.
The intervention: Childsmile is a national programme designed to improve the oral health of all children aged 3 to 11 years old in Scotland and is delivered via nurseries, primary schools and dental practices. It combines a universal daily supervised toothbrushing programme with tailored support for the most vulnerable families who receive 1:1 home support visits to encourage use of dental services. In 2010/11 an inequalities HEAT target was introduced so that those children at greatest risk of dental disease and living in the 20% most deprived areas of Scotland receive a twice-yearly application of fluoride varnish.r
Monitoring and evaluation: a robust independent evaluation143 is ongoing to assess whether the programme can improve health and oral health; whether it can reduce health-related inequalities and if so, which components of the intervention are responsible for the biggest sustained improvements. The multi-faceted, multi-level approach documents and supports development and implementation, and assesses impact across Scotland. An economic evaluation is also underway.
Impacts: there is evidence of overall improvement in dental caries (decayed, missing and filled teeth – DMFT) in 3-year-olds across the socio-economic spectrum over the four years from 2006–2010, with improvements greatest in children in the most deprived areas. A 9% absolute improvement in obvious decay experience has been found for the poorest areas and 8% for the most affluent areas. In terms of mean DMFT scores, it appears that the poorest children have benefited the most with an absolute improvement of 1.0 compared to only 0.2 for children in the most affluent areas.144
r The HEAT target requires ‘at least 60% of 3- and 4-year-olds in each SIMD quintile to have fluoride varnishing twice a year by March 2014’. Fluoride varnishing is delivered via primary care and dental services to all children enrolled in a Childsmile Practice and in targeted nurseries
NHS Health Scotland: Health Inequalities Policy Review June 2013
64
Targeted, tailored support: Family Nurse Partnership (FNP)
Rationale: in relation to young children, intensive, structured support to vulnerable mothers during the first 18 months of a child’s life and delivered by specialist nurses has been found to be highly effective, and cost-effective, in terms of the social and emotional development of vulnerable children.136 Evaluations of the Nurse–Family Partnership in the US demonstrated that home visitation offered to vulnerable mothers between mid-pregnancy and the age of 2 resulted in significant improvements in cognitive/language development and behavioural adaptation in children, and 48% fewer officially verified incidents of child abuse and neglect.145 Economic analysis suggests future cost savings from reductions in government spending (e.g. reduced use of special education services, reduced welfare and dependency costs and reduced criminal justice costs).146
The intervention: in Scotland, the FNP programme is a targeted service that operates alongside NHS antenatal and child health services. It provides intensive tailored support to young first-time mothers at high risk (e.g. have difficulty in establishing relationships, unstable housing arrangements, contacts with police, bullied at school, poor school attendance, school exclusion, learning difficulties, and who feel excluded and marginalised). The support is provided by highly trained public health nurses/health visitors (‘family nurse’) who have limited caseload (25 clients) and begins in early pregnancy (before 28 weeks) and lasts through until the child reaches 2 years. Antenatal maternity care is provided by midwives. The family nurse takes on the role of the named person in the care of the child, and brings together all additional support services for the family.
Evaluation: a process evaluation focused on the implementation of the FNP in Lothian is underway.147 A randomised controlled trial (RCT) to assess the impact of FNP on pregnancy outcomes and both child development and parental outcomes is currently underway in England (reporting April 2014).148
Key learning: based on perceptions of the family nurses and clients, the Lothian evaluators report early indications of the potential to strengthen a range of personal assets, practical skills of young mothers as well as supporting emotional health and wellbeing.147 However, as the focus in the Scottish evaluation is on implementation, it will provide limited understanding of how the intervention may contribute to addressing health inequalities.

NHS Health Scotland: Health Inequalities Policy Review June 2013
65
4.4.3. Integrated services and multi-component interventions
The combination of interventions or integration of services for disadvantaged groups who often have multiple problems is a characteristic of effective interventions identified in a number of reviews. For example, for homeless people with mental illness or substance abuse problems, one recent review found evidence that housing provision should optimally be combined with the provision of other support services.118 For disadvantaged smokers, the combination of behavioural and pharmacological interventions is found to impact positively on smoking inequalities.106 A coordinated approach to cardiovascular disease prevention which integrates population level and high-risk approaches is found to have a differential benefit to socio-economically less privileged people. However, a high-risk approach by itself typically widens health inequalities.119
Linked services: Healthier, Wealthier Children, Glasgow (HWC)
Rationale: individuals experiencing the consequences of inequalities are likely to experience multiple health and social problems. Systematic review evidence confirms that welfare rights advice delivered within healthcare settings results in financial benefits, although evidence of further health or social benefits is still weak.149 Acting as an advocate for individual patients is helpful and professionals can help patients access services both within and outside of the health service.
The intervention: an income maximisation and welfare advice service in Glasgow was linked to NHS antenatal and community child health services and targeted pregnant women and families with young children experiencing poverty.
The evaluation: robust evaluation150 was carried out to assess the impact of the intervention on clients and on practice, policy and strategy, and to understand factors associated with effective delivery. Quantitative analysis of client monitoring records provided clear financial gains, although there was some differential recording of HWC outcomes. Qualitative data provided client and staff perceptions of the impact of the intervention.
Impacts: the evaluation150 provided good evidence of progress in reaching vulnerable families and some evidence of early impacts in that the service achieved a total financial gain of £3 million over an 18-month period for pregnant women and families accessing the advice services. Over this period, 2,516 women were referred by health visitors and midwives to the HWC advice services, 54% of these accessed some type of advice, and 49% of these were entitled to some type of financial gain (on average £3,404 annually). The additional income helped with the purchase of food, housing bills, and contributed to a better quality of life (e.g. some reported reduced stress, improved self-worth, and improved relationships). Further benefits reported were that families who used the service had a more empathetic relationship with their health visitor and that there was reconnection with ‘hard-to-reach’ groups. The effectiveness of such income supplementation schemes and wider social prescribing initiatives requires more robust evaluation.
NHS Health Scotland: Health Inequalities Policy Review June 2013
66
Multi-modal intervention: Community Initiative to Reduce Violence (CIRV, Glasgow)
Rationale: evidence suggests that focused deterrence strategies are increasingly used to prevent and control gang and group-involved violence, overt drug markets, and individual repeat offenders. These strategies are associated with an overall statistically significant, medium-sized crime reduction effect.151 However, a more rigorous body of research is needed.151 In Glasgow, the CIRV initiative is testing the concept of a focused deterrence strategy modelled on the Boston Ceasefire project and the Cincinnati Initiative to Reduce Violence.152
The intervention: this is a community-based police intervention to reduce gang-related violence in Glasgow and to improve outcomes for disadvantaged individuals and communities. The intervention combines three components: law enforcement (disrupting the dynamics within gangs whose members are frequently involved in violent activity); 1:1 intensive support for those gang members causing a disproportionate amount of crime within spec geographical locations and a personal development programme offered to members who agree to change behaviour; social marketing used to mobilise the moral voice of the community to receive/deliver messages (the violence must stop).152
The evaluation: available analysis from the independent evaluation152 was incomplete at the time of the Review’s publication. It provides important preliminary findings but recognises the need for further analysis of post-intervention behaviours over a sufficient period to enable judgement about the true impact of the intervention.
Impacts: early emergent findings show greater reductions in violent offending in the CIRV area compared to non-CIRV areas, although some improvements were also seen elsewhere due to existing services and wider policing strategy.152 Although the primary aim of the project is not to reduce health inequalities, it is plausible to suggest that it will have an impact in future through direct reductions in violence-related injuries, but also in terms of the impact on the future life prospects of individuals via the personal development and employability aspects of the initiative that have seen some members go on to secure employment.152

NHS Health Scotland: Health Inequalities Policy Review June 2013
67
The high-level evidence base for integrated services/multi-component interventions is mixed. Lorenc et al. cited two reviews which found that multi-component, settings based interventions were inequality neutral (school-based physical activity and/or healthy eating behaviours intervention, and community-based interventions on physical activity), and one other review that reported that such interventions (school-based physical activity and/or healthy eating behaviours intervention) increased inequalities.75 It has also been suggested that whole-school health education approaches could be less effective in reducing health inequalities.18 These types of findings are worth bearing mind for well-conceived initiatives such as the forthcoming National Physical Activity Implementation Plan and associated walking and cycling strategies.
4.5 Social, cultural and interpersonalMarmot argues that the evidence about the relationship between social and community capital and health is growing stronger.18 Communities living with multiple deprivations can often have higher than average levels of stress, isolation and depression. Social isolation can lead to increased risk of premature death, while reconnection through social networks and participation can improve mental health inequalities. Some area-based initiatives have demonstrated limited success and they argue that including communities and individuals in designing interventions drawing on community strengths and using co-production to address social isolation would help improve their effectiveness.
Interventions to address alcohol cultures can impact on health inequalities; for example there is review-level evidence to suggest that lowering the minimum legal drinking age is associated with an increase in road injuries, while raising the minimum legal drinking age is associated with a fall in road traffic injuries.102
While not concerned with health inequalities, there is evidence that supporting the social, emotional and cognitive development of children can improve long-term outcomes.153 154 Current evidence suggests a number of interventions can promote social and emotional development among children most at risk of, or already experiencing, problems.153 155–157 These reduce the risk of poor outcomes in both the short and long term and include:
• homevisitinginterventionsledbysuitablyskilledprofessionals
• earlyyearseducation/childcare(includingthequalityofthehomelearningenvironment)
• enhancedspecialistearlyinterventionprogrammes(forexample,parentingprogrammes).

NHS Health Scotland: Health Inequalities Policy Review June 2013
68
Table 4: What works to address health inequalities across the three levels of determinants
Theory of causation
Principles of effective interventions
Examples of effective actions Measures of success
Fundamental causes
• Policiesthatredistributepower,moneyandresources
• Socialequityandsocialjusticeprioritised
• Introduceaminimumincomeforhealthyliving
• Ensuringwelfaresystemprovidessufficientincomeforhealthylivingandreducesstigmaforrecipientsthroughuniversalprovisioninproportiontoneed
• Moreprogressiveindividualandcorporatetaxation
• Activelabourmarketpoliciestocreategoodjobs
• Creationofavibrantdemocracy,greaterandmoreequitableparticipationinelectionsandindecision-making,includingonactiononhealthinequalities
Reducedinequalityinpower,moneyandresources(e.g.reducedincomeinequalitiesandinequalitiesinparticipationinelections)
Social, economic and physical environment
• Useoflegislation,regulation,standards,fiscalpolicyandstructuralchangestoensureequityintheenvironment
• Ensuringgoodworkisavailableforall
• Equitableprovisionofhigh-qualityandaccessibleeducationandpublicservices
• Housing:extendtheScottishHousingQualityStandardtoprivatelyrentedaccommodation;improvedhousingandbuildingstandards;implementaffordableheating,ventilationandqualityenergyefficiencymeasuresinallhousing(e.g.withouttheneedtoapplyforgrants);changestohousinginfrastructure(e.g.design,quality);rehousingandrenovationtoreducetheriskoffallsandotheraccidentalinjuries
• Neighbourhoods:createaNeighbourhoodQualityStandardtoensurelocalserviceavailabilityandhigh-qualitygreenandopenspaces,includingspaceforplay
• Airandwater:greatercontrolsonoutdoorandindoorairpollution(e.g.second-handsmoke),waterfluoridation
• Foodandalcohol:furtherrestrictunhealthyfoodandalcoholadvertising,furtherrestrictionoffoodoutletstoreduceexposuretocheapunhealthyfood,bantrans-fatsandreducesaltcontentoffoods,furtherrestrictionsonthenumberandownershipofalcoholoutlets
• Transport:drink-drivingregulations,lowerspeedlimits,separationofpedestriansandvehicles,loanschemesforchildrestraintsincars
• Fiscal:raisethepriceofharmfulcommoditiesliketobaccoandalcoholthroughtaxation;reduceoreradicatethepricebarrierforhealthyproducts(e.g.healthyfoods);essentialservices(e.g.water,education,healthcare)andpreventionservices(e.g.freesmokingcessation,eyetests,schoolmealsandfruitandmilkinschools)
Reducedinequalitiesintheexposuretothesocio-economicandphysicalenvironment
Moreequitableaccesstopublicservicesandeducation
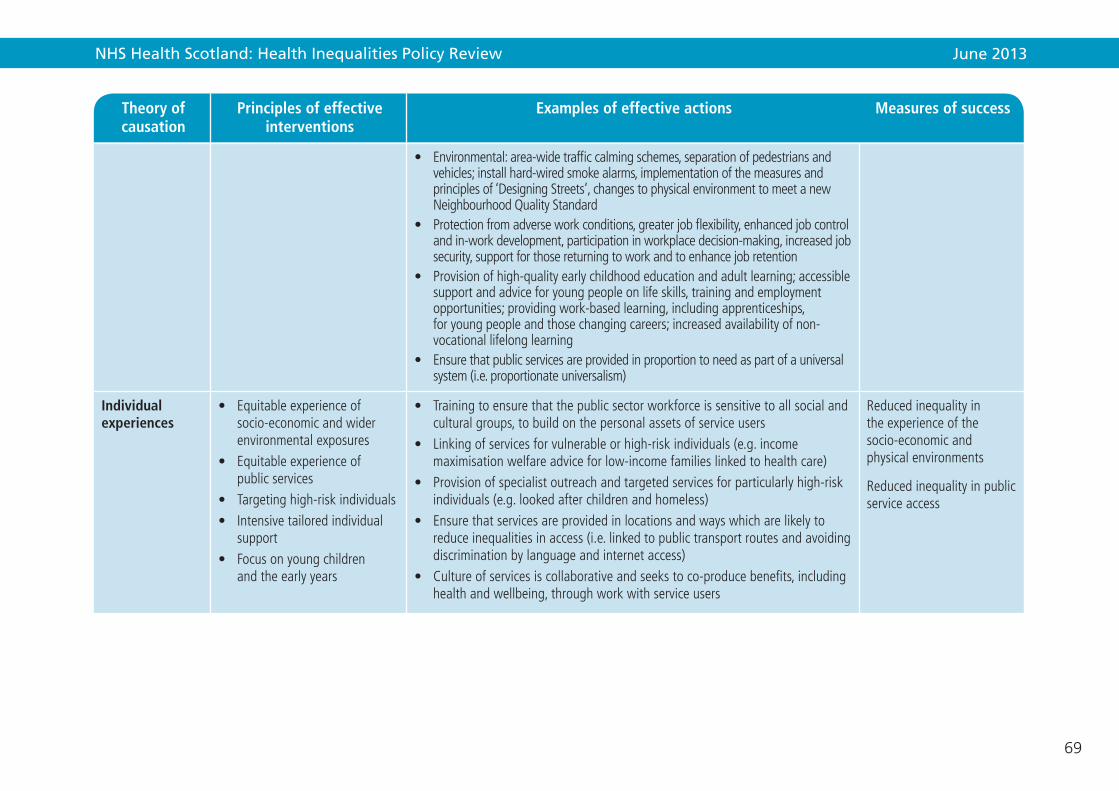
NHS Health Scotland: Health Inequalities Policy Review June 2013
69
Theory of causation
Principles of effective interventions
Examples of effective actions Measures of success
• Environmental:area-widetrafficcalmingschemes,separationofpedestriansandvehicles;installhard-wiredsmokealarms,implementationofthemeasuresandprinciplesof‘DesigningStreets’,changestophysicalenvironmenttomeetanewNeighbourhoodQualityStandard
• Protectionfromadverseworkconditions,greaterjobflexibility,enhancedjobcontrolandin-workdevelopment,participationinworkplacedecision-making,increasedjobsecurity,supportforthosereturningtoworkandtoenhancejobretention
• Provisionofhigh-qualityearlychildhoodeducationandadultlearning;accessiblesupportandadviceforyoungpeopleonlifeskills,trainingandemploymentopportunities;providingwork-basedlearning,includingapprenticeships,foryoungpeopleandthosechangingcareers;increasedavailabilityofnon-vocationallifelonglearning
• Ensurethatpublicservicesareprovidedinproportiontoneedaspartofauniversalsystem(i.e.proportionateuniversalism)
Individual experiences
• Equitableexperienceofsocio-economicandwiderenvironmentalexposures
• Equitableexperienceofpublicservices
• Targetinghigh-riskindividuals• Intensivetailoredindividual
support• Focusonyoungchildren
andtheearlyyears
• Trainingtoensurethatthepublicsectorworkforceissensitivetoallsocialandculturalgroups,tobuildonthepersonalassetsofserviceusers
• Linkingofservicesforvulnerableorhigh-riskindividuals(e.g.incomemaximisationwelfareadviceforlow-incomefamilieslinkedtohealthcare)
• Provisionofspecialistoutreachandtargetedservicesforparticularlyhigh-riskindividuals(e.g.lookedafterchildrenandhomeless)
• Ensurethatservicesareprovidedinlocationsandwayswhicharelikelytoreduceinequalitiesinaccess(i.e.linkedtopublictransportroutesandavoidingdiscriminationbylanguageandinternetaccess)
• Cultureofservicesiscollaborativeandseekstoco-producebenefits,includinghealthandwellbeing,throughworkwithserviceusers
Reducedinequalityintheexperienceofthesocio-economicandphysicalenvironments
Reducedinequalityinpublicserviceaccess

NHS Health Scotland: Health Inequalities Policy Review June 2013
70
4.6 SummaryThis chapter illustrates the range and types of interventions that are more likely to be effective in addressing health inequalities and gives examples of both effective and promising policy and practice initiatives at both national (UK and Scotland) and local level. It covers income, employment and work; the physical environment and local opportunities; education and learning; access to services; social, cultural and interpersonal matters. Examples and learning on interventions feature from Equally Well, across Scotland and UK. Where well-designed research or evaluation is available, this enables us to learn about the differential impact of interventions on the outcomes and populations of interest. Several matters are worthy of more detailed consideration. Where good data are not available or only limited evidence of inequalities impact we can, in some cases, develop plausible theory about the potential contribution of interventions to addressing inequalities in health. Learning points are twofold: current research and evaluation approaches do not enable us to learn about the differential impact of interventions on health inequalities within Scotland and wider UK, or the key features of processes, connections or resources including personal assets, that have greatest impact. Above all, the blend and balance of effective measures described in this chapter and their successful implementation requires leadership, shared resources, and a sustained and integrated approach at several levels in order to make a difference.

NHS Health Scotland: Health Inequalities Policy Review June 2013
71
Given the complexity of the challenge, concerted action across all three levels of the social determinants of health requires political commitment and leadership at both national and local levels and effective actions led by Community Planning Partnerships (CPPs). Action must be based on evidence of need and what is most likely to work, and delivered through partnerships and ways of working that are based on sound principles. Resources and actions need to be reallocated from interventions that are not effective, to those focused on reducing health inequalities.
Key messages:
10. Policy – national level, preventative actions that protect and benefit the whole population are likely to be more effective and cost-effective if they focus on legislative and regulatory controls, and fiscal policies. Political commitment and leadership is required to ensure public resources are distributed in a way that brings universal benefit, but with a scale and intensity that is proportionate to the level of need.
11. Practice – Community Planning Partnerships (CPPs) are the main vehicle for the cross-sectoral work that is necessary at local level to address inequalities and ensure, for example, the delivery of linked services that support those in greatest need and offer intensive tailored support. Services should be co-designed with citizens to ensure they meet the needs and aspirations of the population, rather than being imposed. All CPPs need to address inequalities. However, to ensure a significant impact on national health inequalities there needs to be particular focus on those CPP areas that contribute most to the overall health inequalities in Scotland. The relationships between communities and services matter, and working with people rather than targeting initiatives at people is important. Scaling up initiatives, and the use of improvement methodology, is commendable when it ensures and can demonstrate the reach of services to those in greatest need.
12. Advocacy and evidence – there is an important role for national agencies to support local delivery through advocacy and evidence-building. This includes: building the will among leaders and influencers, expanding and making accessible the evidence base about what works to address health inequalities, spreading effective practice through a workforce that understands the fundamental and wider environmental determinants of health inequalities, raising public awareness and support for effective actions, and ensuring that the voices and experiences of the least advantaged communities are taken into account in the planning and delivery processes.
5. The challenges ahead

NHS Health Scotland: Health Inequalities Policy Review June 2013
72
This chapter brings together the Review’s assessment of the current evidence of Scotland’s position in respect of health inequalities, draws on past lessons and presents future challenges for action. It distinguishes between actions appropriate at national level (policy), at local level (practice) and by national-local intermediaries (advocacy and evidence). A summary of effective actions appears in Table 4 towards the end of the previous chapter.
5.1 Policy – national level actionsNational level actions that protect and benefit the whole population are likely to be more effective and cost-effective if they focus on legislative, regulatory controls and fiscal policies. In the next phase of implementing Scotland’s health inequalities strategy, there needs to be a balance between national and local-level actions, with actions based on evidence of what works or sound principles and delivered through effective partnerships.
Given the current emphasis on public service preventative spending, there are strong reasons for redressing this balance towards upstream and preventative spend. For example, although measurement of high blood pressure and knowledge of individual progress toward better blood pressure control is important for individuals and communities in the prevention of strokes, vascular and cardiac disease, tackling the determinants of high blood pressure – the stress that accompanies poverty, smoking and diet, overweight, lack of fitness, and high salt intake for the whole population – would bring greater dividends and will be more cost-effective. Similarly, the fortification of basic foods with key nutritional supplements, such as folic acid to prevent serious birth defects, is a more cost-effective measure than issuing folate supplements to women who are already pregnant, and will help address inequalities in uptake.
The following areas are supported by the strongest evidence of potential benefit in reducing inequalities:
• Earlyyears–continuingtoseekwaysofincreasingtheproportionofgovernmentexpenditure allocated to the early years and ensure the resources are focused progressively across the social gradient.
• Working-agepopulation–fair,relativelysecure,fulfillingemployment;supportfor vulnerable groups, including homeless people, people with enduring mental illness; parents who face the greatest challenges in early upbringing of children.
• Communitiesthatfacethemostchallenges–increasedprimaryhealthcareresources, robust referral pathways to welfare benefits for families with young children, stop smoking services; housing standards applied to private rented sector, investing a new neighbourhood quality standard.
• Low-incomegroups–establishandimplementalevelofminimumincomeforhealthy living; take steps to reduce long-term unemployment through active labour market programmes; added protection arrangements, including those moving frequently in and out of work; progressive and effective systems of tax and benefits, pensions and tax credits.

NHS Health Scotland: Health Inequalities Policy Review June 2013
73
5.2 Practice – local level actionsThere are a corresponding set of actions at local level needed to ensure implementation of national-level action. Additional local action that reflects local needs and context, including in the involvement of agencies and third sector organisations in delivery of services, and ensures access to those most in need is required.
5.2.1 The role of Community Planning Partnerships is key to this level of work.
The necessity of cross-sectorial partnership working to address inequalities is a recurrent challenge. Community Planning Partnerships (CPPs) are expected to achieve transformational change in reducing health inequalities over the next ten years.6 This expectation is challenging and requires the support from national agencies and intermediary organisations. There are a number of challenges to consider when developing local action through CPPs:
1) CPP maturity and performance record. The most recent Audit Scotland report, prepared for the Accounts Commission and the Auditor General for Scotland, concluded that there is a long way to go to equip CPPs to deliver on such an ambitious agenda of reform and improvement.158 There is a pressing need to ensure a common vision of the challenge that health inequalities and social equity present, and the set of actions that are necessary to achieve change. The National Community Planning Group is mobilising considerable effort and resource to address the support needs of CPPs as outlined in the Statement of Ambition.6 Lessons from the Equally Well test sites and pilot sites provide indications about what the nature and level of support required to improve joint working.
CPPs are not organisations in their own right. The opportunities for CPPs to reduce health inequalities lie within the framework of the Scottish Government and local government rather than with CPPs themselves. The CPP role is to bring together partners to agree priorities and shared outcomes, and to pool resources around these shared outcomes, although outcomes budgeting is not yet a reality. There is a need for CPPs to be explicit about the roles and contributions of the partnerships that sit within the umbrella context of community planning, for example Health and Social Care Partnerships, Alcohol and Drug Partnerships, Integrated Children’s Services Partnerships. There are opportunities for CPPs to take on board the following:
• Clearleadership,understandingandsharedvaluesforchangingpower,moneyand resources inequalities in their area through a thorough understanding of need and allocating budgets and resources proportionately to that need.
• Creatingthesocialcultureforcommunitiestore-engage;acivicsocietyinwhichthere is increased democratic engagement.
• Ensuringtheapproachesthatworktoreducehealthinequalitiesbecomerealityintheir CPP area.
• Ensuringmeasurementofindicatorsandevaluationisinplacetounderstandimpact and demonstrate progress over time to ensure that approaches are not inadvertently widening health inequalities.
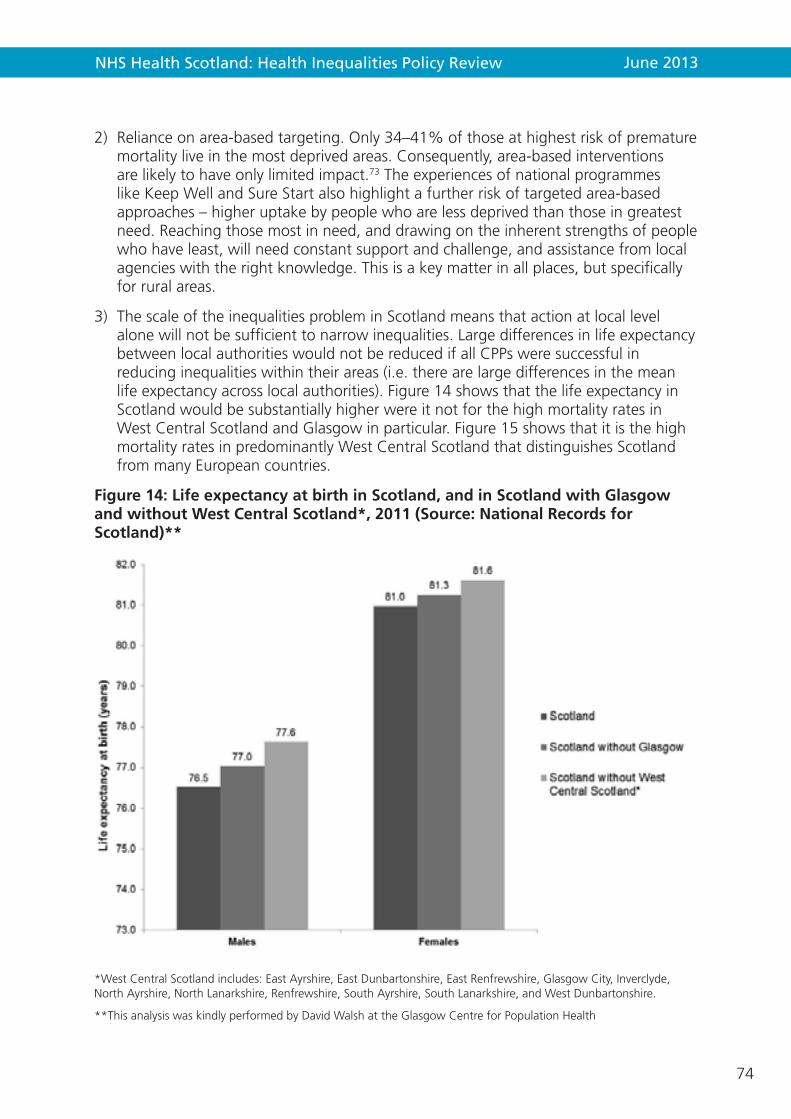
NHS Health Scotland: Health Inequalities Policy Review June 2013
74
2) Reliance on area-based targeting. Only 34–41% of those at highest risk of premature mortality live in the most deprived areas. Consequently, area-based interventions are likely to have only limited impact.73 The experiences of national programmes like Keep Well and Sure Start also highlight a further risk of targeted area-based approaches – higher uptake by people who are less deprived than those in greatest need. Reaching those most in need, and drawing on the inherent strengths of people who have least, will need constant support and challenge, and assistance from local agencies with the right knowledge. This is a key matter in all places, but specifically for rural areas.
3) The scale of the inequalities problem in Scotland means that action at local level alone will not be sufficient to narrow inequalities. Large differences in life expectancy between local authorities would not be reduced if all CPPs were successful in reducing inequalities within their areas (i.e. there are large differences in the mean life expectancy across local authorities). Figure 14 shows that the life expectancy in Scotland would be substantially higher were it not for the high mortality rates in West Central Scotland and Glasgow in particular. Figure 15 shows that it is the high mortality rates in predominantly West Central Scotland that distinguishes Scotland from many European countries.
Figure 14: Life expectancy at birth in Scotland, and in Scotland with Glasgow and without West Central Scotland*, 2011 (Source: National Records for Scotland)**
*West Central Scotland includes: East Ayrshire, East Dunbartonshire, East Renfrewshire, Glasgow City, Inverclyde, North Ayrshire, North Lanarkshire, Renfrewshire, South Ayrshire, South Lanarkshire, and West Dunbartonshire.
**This analysis was kindly performed by David Walsh at the Glasgow Centre for Population Health
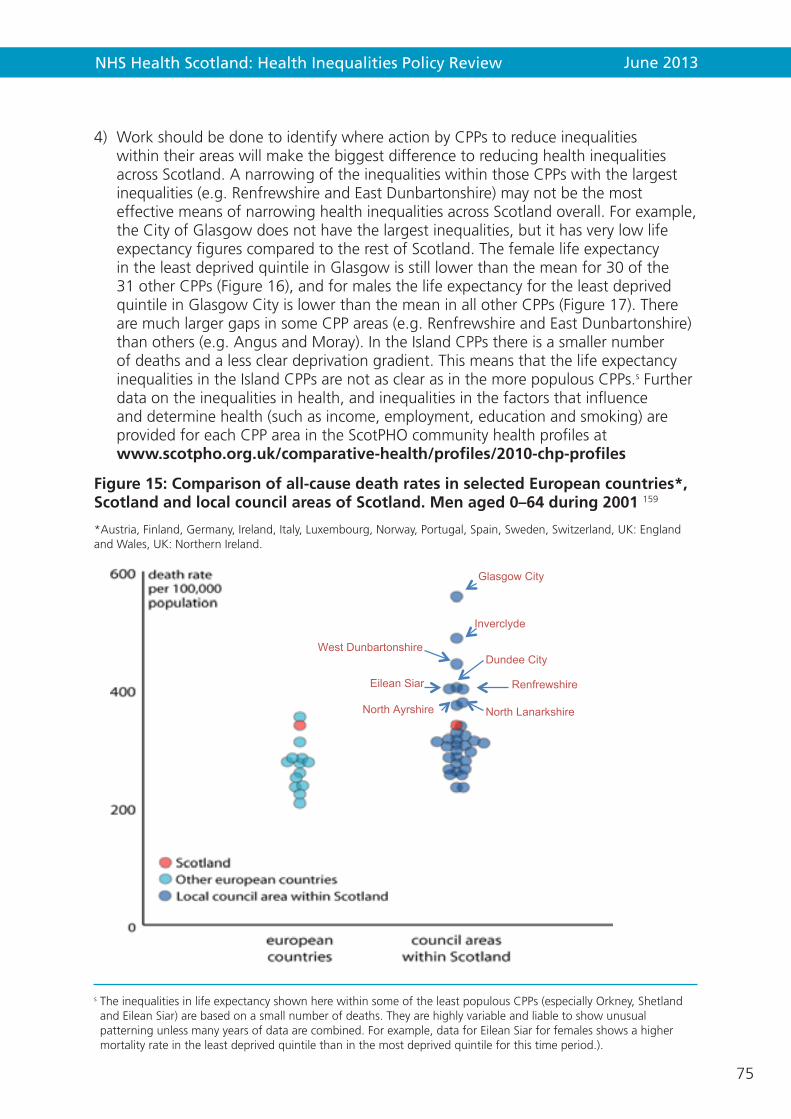
NHS Health Scotland: Health Inequalities Policy Review June 2013
75
4) Work should be done to identify where action by CPPs to reduce inequalities within their areas will make the biggest difference to reducing health inequalities across Scotland. A narrowing of the inequalities within those CPPs with the largest inequalities (e.g. Renfrewshire and East Dunbartonshire) may not be the most effective means of narrowing health inequalities across Scotland overall. For example, the City of Glasgow does not have the largest inequalities, but it has very low life expectancy figures compared to the rest of Scotland. The female life expectancy in the least deprived quintile in Glasgow is still lower than the mean for 30 of the 31 other CPPs (Figure 16), and for males the life expectancy for the least deprived quintile in Glasgow City is lower than the mean in all other CPPs (Figure 17). There are much larger gaps in some CPP areas (e.g. Renfrewshire and East Dunbartonshire) than others (e.g. Angus and Moray). In the Island CPPs there is a smaller number of deaths and a less clear deprivation gradient. This means that the life expectancy inequalities in the Island CPPs are not as clear as in the more populous CPPs.s Further data on the inequalities in health, and inequalities in the factors that influence and determine health (such as income, employment, education and smoking) are provided for each CPP area in the ScotPHO community health profiles at www.scotpho.org.uk/comparative-health/profiles/2010-chp-profiles
Figure 15: Comparison of all-cause death rates in selected European countries*, Scotland and local council areas of Scotland. Men aged 0–64 during 2001 159
*Austria, Finland, Germany, Ireland, Italy, Luxembourg, Norway, Portugal, Spain, Sweden, Switzerland, UK: England and Wales, UK: Northern Ireland.
s The inequalities in life expectancy shown here within some of the least populous CPPs (especially Orkney, Shetland and Eilean Siar) are based on a small number of deaths. They are highly variable and liable to show unusual patterning unless many years of data are combined. For example, data for Eilean Siar for females shows a higher mortality rate in the least deprived quintile than in the most deprived quintile for this time period.).
Glasgow City
Inverclyde
West Dunbartonshire Dundee City
Renfrewshire Eilean Siar
North Lanarkshire North Ayrshire
NHS Health Scotland: Health Inequalities Policy Review June 2013
76
5.2.2 Local service delivery – connecting and reconnecting with people
The experience of GoWell, the test/pilot sites, the PATH project, the Multiple & Complex Needs initiative, the Inequalities Sensitive Practice Initiative in Glasgow and the Deep End Practices and many other initiatives reinforce the view that the process of service delivery, connection between communities and services, and face-to-face relationships matters. Approaches which seek to mobilise the assets, capacities and resources available in individuals and communities to enable them to gain more control over their lives and circumstances are valuable.160 The principles of identifying and building on the existing ‘assets’ or strengths of vulnerable and disadvantaged individuals and deprived communities (as opposed to emphasising the problems and deficits) and working with people rather than targeting initiatives at people, have long been the principles of community-led development and are now enshrined in the language of ‘assets-based’ approaches and ‘co-production’. For example, in the NHS the principles of mutuality and trust are seen to apply not only to long-term relationships between patients and healthcare practitioners, but also to relationships between NHS and other services, and between leaders across the NHS.
These approaches merit continued attention, especially to ensure that groups and individuals within the priorities we have outlined reconnect with available help, receive the support they need, and that there are means to measure inputs and outcomes from this work. Improvement methodology and scaled-up initiatives, such as the Early Years Collaborative, have great potential if they focus on inequalities impact, and show that they succeed in reaching the most vulnerable groups.
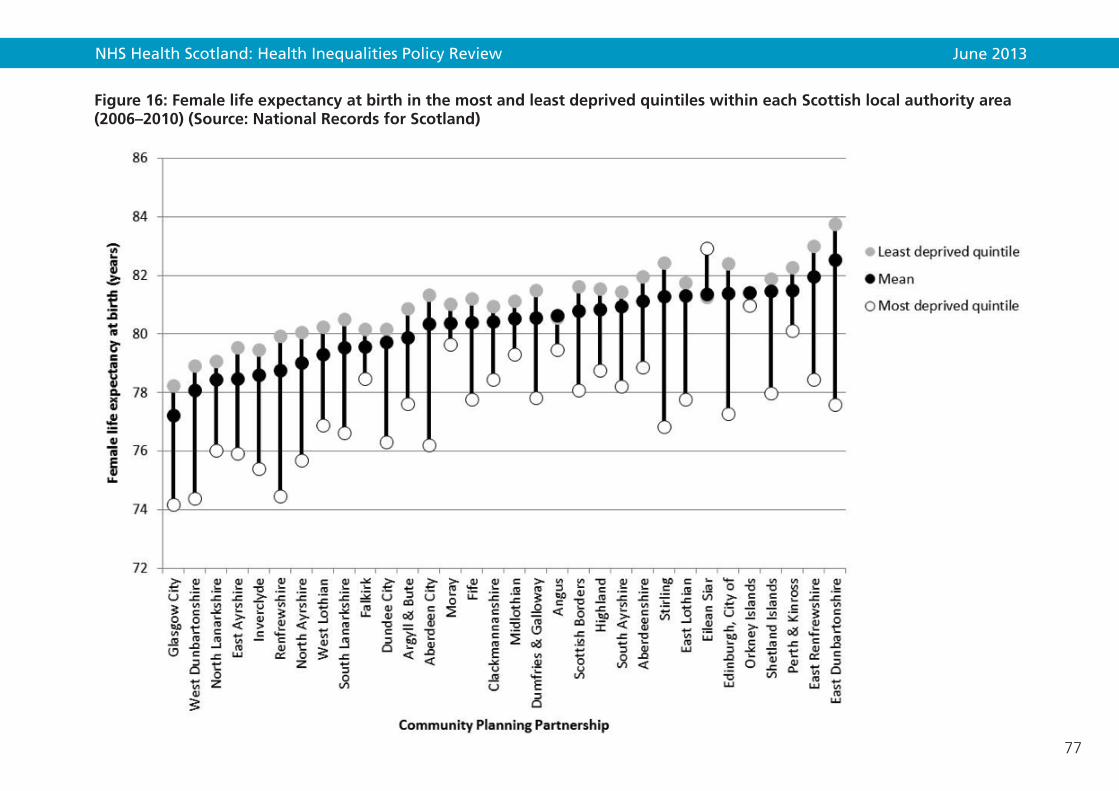
NHS Health Scotland: Health Inequalities Policy Review June 2013
77
Figure 16: Female life expectancy at birth in the most and least deprived quintiles within each Scottish local authority area (2006–2010) (Source: National Records for Scotland)

NHS Health Scotland: Health Inequalities Policy Review June 2013
78
Figure 17: Male life expectancy at birth in the most and least deprived quintiles within each Scottish local authority area (2006–2010) (Source: National Records for Scotland)

NHS Health Scotland: Health Inequalities Policy Review June 2013
79
5.3 Advocacy and evidence – national–local intermediary rolesAs already argued, effective, joined-up national–local collaboration will be an important element in the change process. This is happening to some extent already. There is a wide range of organisations working between national and local level that play a potentially important role in ‘building the will’ (advocacy) and the evidence base on effective practice and spreading this across local areas. Likewise, national third sector organisations play an important role in advocacy and evidence-building on the social determinants of health inequalities. The Task Force has heard about their concerns that their roles are not effectively harnessed to ensure that the voices and experiences of the communities and users they serve are fully taken into account in shaping and implementing Equally Well.161
5.3.1 Spreading effective practice – the role of improvement collaboratives
The Equally Well test sites were an example of national–local collaboration that aimed to spread learning about effective local practice to address health inequalities. The key learning from these have already been detailed in section 2.1.4. It is now generally accepted that the test sites, local pilots and the demonstration projects have had limited success in generating transferable knowledge that can be scaled up. Improvement collaboratives are now seen as the best way to spread effective practice across Scotland and to scale up improvements to achieve population level impacts. The focus of improvement collaboratives is on the ‘spread’ of better results and shifts attention from sharing learning about process. The improvement methodology has been developed in the US and has been fostered in Scotland within the context of the healthcare system. This model is now being proposed for Scotland’s early years work which operates within an inter-sectorial, multi-agency delivery context which may present greater challenges and slow down what is meant to be a rapid improvement process.
As improvement science suggests, transferring effective interventions from one context to another needs careful thought and piloting. For example, as the Starting Well health demonstration project showed, applying effective early years interventions from the US (where there are no health visitors or NHS) to Scotland (where these are standard) has significant implications for the expected impact it will make. Similarly, what works to improve general population health can sometimes exacerbate inequalities, for example brief advice and interventions for health behaviour change.
5.3.2 Building the evidence base
Improvement collaboratives need to bear in mind the lessons of local test/pilot sites. Helping to generate the evidence base for health inequalities is not an automatic by-product of local or national implementation. The lessons of evaluation which have recurred across a number of national programmes that are rolled out locally are shown in Box 5 below.
Notable high-quality evaluations of policy initiatives and local practice-based interventions have taken place successfully. They include evaluations of the smoking ban and the alcohol strategy, the GoWell research and learning programme associated with Glasgow’s regeneration programme, and some of the practice-based intervention
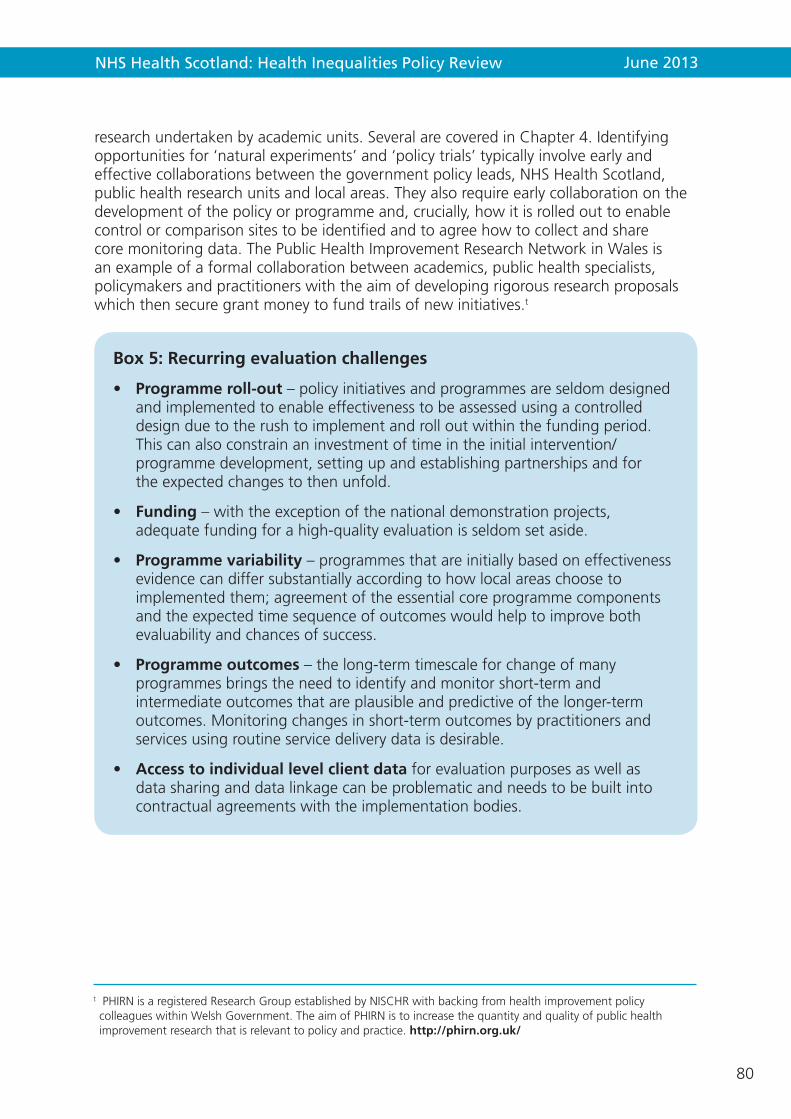
NHS Health Scotland: Health Inequalities Policy Review June 2013
80
research undertaken by academic units. Several are covered in Chapter 4. Identifying opportunities for ‘natural experiments’ and ‘policy trials’ typically involve early and effective collaborations between the government policy leads, NHS Health Scotland, public health research units and local areas. They also require early collaboration on the development of the policy or programme and, crucially, how it is rolled out to enable control or comparison sites to be identified and to agree how to collect and share core monitoring data. The Public Health Improvement Research Network in Wales is an example of a formal collaboration between academics, public health specialists, policymakers and practitioners with the aim of developing rigorous research proposals which then secure grant money to fund trails of new initiatives.t
t PHIRN is a registered Research Group established by NISCHR with backing from health improvement policy colleagues within Welsh Government. The aim of PHIRN is to increase the quantity and quality of public health improvement research that is relevant to policy and practice. http://phirn.org.uk/
Box 5: Recurring evaluation challenges
• Programme roll-out – policy initiatives and programmes are seldom designed and implemented to enable effectiveness to be assessed using a controlled design due to the rush to implement and roll out within the funding period. This can also constrain an investment of time in the initial intervention/programme development, setting up and establishing partnerships and for the expected changes to then unfold.
• Funding – with the exception of the national demonstration projects, adequate funding for a high-quality evaluation is seldom set aside.
• Programme variability – programmes that are initially based on effectiveness evidence can differ substantially according to how local areas choose to implemented them; agreement of the essential core programme components and the expected time sequence of outcomes would help to improve both evaluability and chances of success.
• Programme outcomes – the long-term timescale for change of many programmes brings the need to identify and monitor short-term and intermediate outcomes that are plausible and predictive of the longer-term outcomes. Monitoring changes in short-term outcomes by practitioners and services using routine service delivery data is desirable.
• Access to individual level client data for evaluation purposes as well as data sharing and data linkage can be problematic and needs to be built into contractual agreements with the implementation bodies.

NHS Health Scotland: Health Inequalities Policy Review June 2013
81
To improve Scotland’s strategy on health inequalities, a systematic approach to intervention development and evaluation is essential. Robust, controlled evaluation designs may not always be possible, but the principle of assessing policy effectiveness and differential impacts should be integral to any future strategy, using the established infrastructure for collaboration between relevant partners.
Further attention needs to be devoted to the contribution of the third sector to evaluating grass-roots initiatives and community-led projects that build social capital and help prevent and reduce inequalities, and how to bring together and use this evidence as part of an inequalities evidence base. In addition, establishing a What Works evidence centre in Scotland that brings together the evidence in a systematic and accessible form would be a valuable extension of the new UK network of What Works centres being set up by Nesta, the Economic and Social Research Council and the Big Lottery.

NHS Health Scotland: Health Inequalities Policy Review June 2013
82
6. Summary and recommendations Scotland has embarked on a sustained pathway towards greater social justice, and has developed policies that aim to narrow the differences between those with the best and worst health and life expectancy; to reduce the differentials, recognising that people matter at all points on the inequalities gradient and not only its extremes.
Evidence shows that people do not achieve better health by their own individual efforts of will – taking such an approach would only increase inequalities and divisions in society.
For those in the best circumstances, they and their communities need least support and intervention from public services. For those in the poorest circumstances, experience of poor health and its determinants is pervasive and leads to low-quality and reduced length of life. People in these circumstances, and in varying degrees, on the inequalities gradient, need support according to their need – an approach termed proportionate universalism.
Equally Well, the Scottish Government and COSLA strategy introduced in 2008 aimed to reduce health inequalities. It is an ambitious, cross-government plan which set out to tackle the root causes of the problem. However, Scotland’s health inequalities are currently among the widest in Western and Central Europe and they will continue to grow unless, as the government has already acknowledged, we start to do things differently. Although health inequalities are complex and persistent, they are not inevitable. This Review has brought together evidence about the current position in Scotland with respect to inequalities, and draws on [mainly] scientific studies that help to inform us about the way ahead. Nonetheless, evidence on its own will not meet Scotland’s challenge on health inequalities; nor will individual endeavours on their own have sufficient impact. National and local action that accepts and goes beyond the evidence is required. There is a need to bring vision and leadership with common purpose, join forces and pool resources to derive best value from the country’s wealth and reconnect with people and communities in the most difficult circumstances to achieve their potential. Closing the inequalities gap and lessening the inequalities gradient would bring greater cohesion, economic progress and better health in Scotland, lowering the burden on individuals, communities and public services, and contributing to social equity.
In order to make a real impact on health inequalities, the following key issues will have to be addressed:
• Thecasefortacklinghealthinequalitieswillhavetobewidelyunderstoodand be given the highest priority across government.
• Ashiftofemphasistowardsuitableuseofregulatoryandfiscalmeasures–whichdo not rely on individual take up – and away from addressing individual lifestyle issues and the targeting of specific areas.
• Effectivecoordinatedandfocusedactionatbothanationalandlocallevel.
The last ten years have seen an improvement in the health of the general population. This is a major achievement. After five years of implementing Equally Well, it is too early to detect a sustained change in the trend of relative health inequalities. However,

NHS Health Scotland: Health Inequalities Policy Review June 2013
83
some measures aimed at improving population health either make no impact on health inequalities or may even exacerbate them. This Review therefore suggests four recommendations for the Scottish Government to consider as it further develops its strategy to tackle health inequalities.
1. Health inequalities policy should be at the heart of the Scottish Government’s drive for social justice, a key plank of the Single Outcome Agreements and central to the preventive spend agenda. Priority must be given to addressing the upstream fundamental causes of health inequalities which include poverty and income, as well as the wider environmental factors such as housing and education, over the downstream consequences like smoking and alcohol abuse.
2. The Scottish Government and COSLA should regularly review the balance of policy and resources directed to actions aimed at tackling the fundamental causes of health inequalities rather than individual lifestyle interventions, which do not, on their own, deliver the changes required.
a) A future inequalities strategy should consider actions at all levels of the social determinants of health – the economic and social conditions in our society and how they are distributed.
b) A life course approach is helpful particularly if actions and resources are targeted at early years which offers the best opportunity of preventing future health inequalities.
c) Central and local government need to focus on the implementation of the measures which are most likely to be effective and to discontinue those which widen inequalities. Examples of effective interventions are given in Table 4.
3. While action will be taken at a national level, a significant contribution needs to take place locally, connecting with communities and building the hopes of people that face the greatest challenges. The National Community Planning Group should advocate that those CPP areas that contribute most to health inequalities in Scotland should prioritise their actions in a drive to narrow health inequalities. The focus for spending needs to shift away from meeting the cost of dealing with health and social problems after they have developed, to prevention and early intervention.
4. There is a continuing role for national and local government, meeting regularly, to ensure the political focus on cross-government and cross-agency work to address the fundamental causes and social determinants of health inequalities, with linkage to equality. There is also a key role for a national agency, such as NHS Health Scotland, with a remit to drive forward the necessary changes in policy, practice and, ultimately, outcomes.

NHS Health Scotland: Health Inequalities Policy Review June 2013
84
References 1 Scottish Government. Scottish Budget Spending Review. Edinburgh:
Scottish Government; 2007. Available from: www.scotland.gov.uk/Publications/2007/11/13092240/0
2 Scottish Government. Equally Well. Report of the ministerial taskforce on health inequalities. Edinburgh: Scottish Government; 2008.
3 Scottish Government. Achieving our potential: A framework to tackle poverty and income inequality in Scotland. Edinburgh: Scottish Government; 2008.
4 Scottish Government. The Early Years Framework. Edinburgh: Scottish Government; 2009.
5 Scottish Government. Community Planning Review. [online]. 2012. Available from: www.scotland.gov.uk/News/Releases/2012/01/Planning27012012
6 Scottish Government and COSLA. Single Outcome Agreements: Guidance to Community Planning Partnerships. Edinburgh: Scottish Government and COSLA; 2012.
7 Audit Scotland. Health Inequalities in Scotland. Report prepared for the Auditor General for Scotland and the Accounts Commission. Edinburgh: Audit Scotland; 2012.
8 Scottish Parliament. Health Inequalities [online]. 2013. Available from www.scottish.parliament.uk/parliamentarybusiness/CurrentCommittees/58660.aspx
9 Dahlgren G, Whitehead M. Levelling Up: Social inequalities in health concern systematic differences in health status between different socio-economic groups. Copenhagen: World Health Organization; 2007.
10 McCartney G, Collins C, Mackenzie M. What (or Who) causes health inequalities: theories, evidence and implications? Health Policy; 2013 ISSN 0168-8510 (in press).
11 Oliver A, Exworthy M (eds). Health Inequalities. Evidence, policy and implementation. Proceedings from a meeting of the health equity network. London: The Nuffield Trust; 2003.
12 Tannahill C. Addressing Scotland’s health inequalities. Some propositions for consideration by the Ministerial Task Force. Glasgow Centre for Population Health paper to the Ministerial Task Force on Health Inequalities; Paper 4 29 November 2012.
13 Scottish Government. Equally Well Review 2010. Report by the Ministerial Task Force on implementing Equally Well, The Early Years Framework and Achieving our Potential. Edinburgh: Scottish Government; 2010.
14 Dahlgren G, Whitehead M. Policies and strategies to promote social equity in health. Copenhagen: World Health Organization; 2008.
NHS Health Scotland: Health Inequalities Policy Review June 2013
85
15 Burns H. In Scottish Parliament. Public Audit Committee, Session 4. Wednesday 19 December 2012, p1078.
16 Macintyre S. Inequalities in health in Scotland: what are they and what can we do about them? Glasgow: MRC Social & Public Health Sciences Unit; 2007.
17 Scottish Government. Good places, better health. A new approach to environment and health in Scotland. Edinburgh: Scottish Government; 2008.
18 Marmot M . Fair Society, Healthy Lives. The Marmot Review. Strategic Review of Health Inequalities post-2010. The Marmot Review; 2010.
19 Scottish Parliament Finance Committee. Report on Preventative Spending. Edinburgh; 2011. Available from: archive.scottish.parliament.uk/s3/committees/finance/reports-11/ fir11-01.htm
20 Christie Commission. The Future Delivery of Public Services. Public Services Commission [online]. 2011. Available from: www.publicservicescommission.org
21 Audit Scotland. Review of Community Health Partnerships. Prepared for the Auditor General for Scotland and the Accounts Commission. 2011. Available from: www.audit-scotland.gov.uk/docs/health/2011/nr_110602_chp.pdf
22 Audit Scotland. Commissioning Social Care. Prepared for the Auditor General for Scotland and the Accounts Commission. 2012. Available from: www.audit-scotland.gov.uk/docs/health/2012/nr_120301_social_care.pdf
23 Community Planning Review Group. Community Planning Review Statement of Ambition. 2012. Available from: www.scotland.gov.uk/Topics/Government/local-government/CP/soa
24 Fyfe A, MacMillan K, McGregor T, Hewitt E, Callaghan M. Equally Well Test Sites: Evaluation. ODS Consulting. Edinburgh: NHS Health Scotland 2011.
25 Scottish Government Public Health and Sport Team. ‘Creating Health’: Insights from evaluation evidence from Equally Well Test sites, Healthy Weight communities, Good Places, Better Health. Edinburgh. Scottish Government 2012.
26 Ministerial Task Force on Health Inequalities. Long-term Monitoring of Health Inequalities: Headline Indicators. 2012 Update. Edinburgh, Scottish Government; 2012.
27 Whyte B, Ajetunmobi T. Still ‘the sick man of Europe’? Scottish Mortality in a European Context 1950–2010. An analysis of comparative mortality trends. Glasgow: Glasgow Centre for Population Health; 2012.
28 McCartney G, Walsh D, Whyte B, Collins C. Has Scotland always been the ‘sick man’ of Europe? An observational study from 1855 to 2006. European Journal of Public Health. 2011: 1–5 (doi:10.1093/eurpub/ckr136).

NHS Health Scotland: Health Inequalities Policy Review June 2013
86
29 Leon D, Morton S, Cannegieter S, McKee M. Understanding the health of Scotland’s population in an International context: a review of current approaches, knowledge and recommendations for new research directions. London: London School of Hygiene and Tropical Medicine & Public Health Institute for Scotland; 2003. Available from: www.scotpho.org.uk/home/Comparativehealth/InternationalComparisons/int_mortality_comparisons.asp
30 Walsh D, Taulbut M, Hanlon P. The aftershock of deindustrialization—trends in mortality in Scotland and other parts of post-industrial Europe. The European Journal of Public Health. 2010; 20(1): 58–64. (doi:10.1093/eurpub/ckp063).
31 Walsh D, Taulbut M, Hanlon P. The Aftershock of Deindustrialisation: Trends in mortality in Scotland and other parts of post-industrial Europe. Glasgow: Glasgow Centre for Population Health; 2008.
32 Mackenbach JP, Stirbu I, Roskam A-JR, et al. Socio-economic inequalities in health in 22 European countries. New England Journal of Medicine. 2008; 358: 2468–81.
33 Popham F, Boyle P. Assessing socio-economic inequalities in mortality and other health outcomes at the Scottish national level. Edinburgh: Scottish Collaboration for Public Health Research and Policy; 2010.
34 Krieger N, Rehkopf DH, Chen JT, Waterman PD, Marcelli E, Kennedy M. The Fall and Rise of US Inequities in Premature Mortality: 1960–2002. PLoS Medicine 5(2): e46. doi:10.1371/journal.pmed.0050046.
35 Thomas B, Dorling D, Davey Smith G. Inequalities in premature mortality in Britain: observational study from 1921 to 2007. British Medical Journal. 2010; 341: c3639.
36 Beckfield J, Krieger N. Epi+demos+cracy: Linking Political Systems and Priorities to the Magnitude of Health Inequities-Evidence, Gaps, and a Research Agenda. Epidemiologic Reviews. 2009; 31: 152–177.
37 WHO Commission on the Social Determinants of Health. Closing the gap in a generation: Health equity through action on the social determinants of health. Geneva: World Health Organization; 2010.
38 Link BG, Phelan JC. McKeown and the Idea That Social Conditions Are Fundamental Causes of Disease. American Journal of Public Health. 2002; 92: 730–732.
39 Wilkinson R, Pickett K. The Spirit Level: why more equal societies almost always do better. London: Allen Lane; 2009.
40 Adler N, Stewart J. Health disparities across the lifespan: meaning, methods and mechanisms. Annals of the New York Academy of Sciences. 2010: 1186: 5–23.
41 Bourdieu P. Distinction. A Social Critique of the Judgement of Taste. Cambridge, MA: Harvard University Press; 1984.
NHS Health Scotland: Health Inequalities Policy Review June 2013
87
42 Stegeman I, Costongs C. (Eds.). The Right Start to a Healthy Life. Levelling-up the Health Gradient Among Children, Young People and Families in the European Union – What Works? EuroHealthNet [online] Available from: www.sante.public.lu/publications/sante-fil-vie/petite-enfance/right-start-healthy-life-levelling-up-health-gradient-children/right-start-healthy-life-levelling-up-health-gradient-children.pdf
43 Scottish Government. Chief Medical Officer Annual Report 2011 – Transforming Scotland’s Health. Edinburgh: Scottish Government; 2012.
44 ScotPHO. Assets [online]; 2013. Available from: www.scotpho.org.uk/life-circumstances/assets
45 Heijmansa BT, Tobia EW, Stein AD et al. Persistant epigenetic differences associated with prenatal exposure to famine in humans. Proceedings of the National Academy of Sciences. 2008; 105(44): 17406–17049.
46 McGowan PO, Szyf M. The epigenetics of social adversity in early life: Implications for mental health outcomes. Neurobiology of Disease. 2010; 39: 66–72.
47 Commission on Social Determinants of Health. Closing the gap in a generation: Health equity through action on the social determinants of health. Final Report of the Commission on Social Determinants of Health. Geneva: World Health Organization; 2008.
48 Davey-Smith G, Hart C, Watt G, Hole D, Hawthorne V. (1998). Individual social class, area-based deprivation, cardiovascular disease risk factors, and mortality: the Renfrew and Paisley study. Journal of Epidemiology and Community Health.1998; 52: 399–402.
49 Power C, Matthews S. Origins of health inequalities in a national population sample. The Lancet. 1997; 350(9091): 1584–1589.
50 Macintyre S. The Black report and beyond what are the issues? Social Science and Medicine. 1997; 44(6): 723–745.
51 Morris JN, Wilkinson P, Dangour A. Proposal to the Marmot Commission: Minimum Income for Healthy Living. Marmot Review. London: University College London; 2010.
52 Morris JN, Donkin A, Wonderling D, Wilkinson P, Dowler E. A minimum income for healthy living. Journal of Epidemiology and Community Health. 2000; 54: 885–889.
53 Preston SH. The changing relation between mortality and level of economic development. International Journal of Epidemiology. 2007; 36: 484–490.
54 World Bank. World Development Report. Washington DC: World Bank; 1993.
55 McKeown T. The Modern Rise of Population. London: Edward Arnold; 1976.
56 Fogel RW. The Escape from Hunger and Premature Death, 1700–2100: Europe, America, and the Third World. Cambridge: Cambridge University Press; 2004.

NHS Health Scotland: Health Inequalities Policy Review June 2013
88
57 Deaton A. Global patterns of income and health: facts, interpretations, and policies. Princeton NJ: Princeton University; 2005.
58 Cutler D, Deaton A, Lleras-Muney A. The Determinants of Mortality. Cambridge MA: Harvard University; 2005.
59 Borowy I. Similar but different: Health and economic crisis in 1990s Cuba and Russia. Social Science & Medicine. 2011; 72: 1489e1498.
60 Brownlea A. From public health to political epidemiology. Social Science & Medicine. 1981; 15(D): 57–67.
61 Norman P, Boyle P, Exeter, D, Feng Z, Popham F. Rising premature mortality in the UK’s persistently deprived areas: Only a Scottish phenomenon? Social Science & Medicine. 2011; 73(11): 1575–84.
62 Navarro V, Muntaner C, Borrell C, Benach J, Quiroga A, Rodriguez-Sanz M, Verges N, Pasarin MI. Politics and health outcomes. The Lancet. 2006; 368: 1033–1037.
63 Taulbut M, Walsh D, Parcell S, Hanlon P, Hartmann A, Poirier G, Strniskova D. Health and its determinants in Scotland and other parts of post-industrial Europe: the ‘Aftershock of Deindustrialisation’ study – phase two. Glasgow: Glasgow Centre for Population Health; 2011.
64 Stuckler D, Basu S, Suhrcke M, Coutts A, McKee M. The public health effect of economic crises and alternative policy responses in Europe: an empirical analysis. The Lancet. 2009; 374: 315–323.
65 Roelfs DJ, Shor E, Davidson KW, Schwartz JE. (2011). Losing life and livelihood: A systematic review and meta-analysis of unemployment and all-cause mortality. Social Science & Medicine. 2011; 72: 840–854.
66 Egan M, Petticrew M, Ogilvie D, Hamilton V, Drever F. “Profits before people”? A systematic review of the health and safety impacts of privatising public utilities and industries in developed countries. Journal of Epidemiology and Community Health. 2007; 61: 862–870.
67 Fothergill S. The True Scale of the Regional Problem in the UK. Regional Studies. 2001; 35: 241–256.
68 Marmot MG, Bosma H, Hemingway H, Brunner E, Stansfeld S. Contribution of job control and other risk factors to social variations in coronary heart disease incidence. The Lancet. 1997; 350: 235–239.
69 Griffin J. OHE briefing: the impact of unemployment on health. London: Office of Health Economics; 1993.
70 Benach J, Malmusi D, Yasui Y, Martinez JM, Muntaner C. Beyond Rose’s strategies: a typology of scenarios of policy impact on population health and health inequalities. International Journal of Health Services. 2011; 41(1): 1–9.
71 Craig P. The development of a framework for monitoring and reviewing health and social inequalities. Glasgow, Glasgow Centre for Population Health; 2010.
NHS Health Scotland: Health Inequalities Policy Review June 2013
89
72 Geddes R, Haw S, Frank J. Interventions for promoting early childhood development for health. An environmental scan with special reference to Scotland. Edinburgh: A report for the Early Life Working Group of the Scottish Collaboration for Public Health Research and Policy; 2010. Available from: www.scphrp.ac.uk/node/4
73 McLoone P. Targeting deprived areas within small areas in Scotland: population study. British Medical Journal. 2001; 323: 374–375.
74 Geronimus AT. To Mitigate, Resist, or Undo: Addressing Structural Influences on the Health of Urban Populations. American Journal of Public Health. 2000; 90( 6): 867–72.
75 Lorenc T, Petticrew M, Welch V, Tugwell P. What types of interventions generate inequalities? Evidence from systematic reviews. Journal of Epidemiology & Community Health. 2013; 67(2).
76 Forrest L, Adams J, Wareham H, Rubin G, White M. Socio-economic inequalities in lung cancer treatment: systematic review and meta-analysis. PLoS Medicine. 2013: 10(2): e1001376. Available from: www.plosmedicine.org/article/info%3Adoi%2F10.1371%2Fjournal.pmed.1001376
77 White M, Adams J, Heywood P. How and why do interventions that increase health overall widen inequalities within populations? In Babones S (ed.). Social inequality and public health. Bristol: Policy Press; 2009. Available from: policypress.universitypressscholarship.com/view/10.1332/policypress/9781847423207.001.0001/upso-9781847423207-chapter-5
78 Vos T. Carter R, Barendregt J et al. for the ACE Prevention team. Assessing Cost-Effectiveness in Prevention. Final Report; 2010.
79 Scottish Government. Child Poverty Strategy for Scotland. Edinburgh: Scottish Government; 2011.
80 Scottish Government. Getting it right for every child. Edinburgh: Scottish Government; 2012
81 Scottish Government. Children and Young People Bill. (Consultation completed in 2012); forthcoming.
82 Scottish Government. Good Places, Better Health. A new approach to environment and health in Scotland. An Implementation Plan. Edinburgh: The Scottish Government; 2008.
83 Scottish Government. Regeneration Strategy. Achieving a Sustainable Future. Edinburgh: The Scottish Government; 2011.
84 Scottish Government. Charter of patients rights and responsibilities. 2012. Available from: www.scotland.gov.uk/Publications/2012/04/6273
85 UK Parliament. Scotland Act 2012. The Stationery Office. London: UK Parliament; 2012.

NHS Health Scotland: Health Inequalities Policy Review June 2013
90
86 UK Parliament. Equality Act 2010. The Stationery Office. London: UK Parliament; 2010.
87 McCartney G. What would be sufficient to reduce inequalities in Scotland. NHS Health Scotland paper to the Ministerial Task Force on Health Inequalities; Paper 3a 29 November 2012.
88 Scottish Government and COSLA. Joint Statement with CoSLA and Scottish Government on welfare reform in Scotland [online]. 2012. Available from www.scotland.gov.uk/Topics/People/welfarereform/jointstatementonwelfarereform
89 European Union. Human Rights [online] Accessed February 2013. Available from: europa.eu/pol/rights/index_en.htm
90 European Commission. Fundamental Rights [online] Accessed February 2013. Available from: ec.europa.eu/justice/fundamental-rights/index_en.htm
91 Scottish Government. Report of Chief Economist. State of the Economy March 2013 [online]. Available from: www.scotland.gov.uk/Topics/Economy/state-economy/latestSofE
92 Marmot M, Wilkinson RG. Social determinants of health (2nd edition). Oxford: Oxford University Press; 2006.
93 McLean C, Carmona C, Francis S, Wohlgemuth C, Mulvihill C. Worklessness and health – what do we know about the causal relationship? Evidence review (1st edition). London: Health Development Agency; 2005.
94 Bambra C. Yesterday once more? Unemployment and health in the 21st century. Journal of Epidemiology and Community Health. 2010; 64: 213–215.
95 Bartley M, Ferrie J. Do we need to worry about the health effects of unemployment? Journal of Epidemiology and Community Health. 2010; 64: 5–6.
96 Hastings G. Why corporate power is a public health priority. British Medical Journal. 2012; 345: e5124.
97 Hanlon P, McCartney G. Peak oil: Will it be public health’s greatest challenge? Public Health. 2008; 122: 647–652.
98 SNIFFER. Differential Social Impacts of Climate Change in the UK.SNIFFER [online] 2009. Available from: www.sniffer.org.uk/files/7713/4183/7998/UKCC22_FinalReport_web.pdf
99 Scottish Government. Scottish Household Survey Annual Report – Scotland’s People. Edinburgh: Scottish Government; 2011.
100 Scottish Government. Scotland’s Digital Future. A Strategy for Scotland. Edinburgh: Scottish Government; 2011.

NHS Health Scotland: Health Inequalities Policy Review June 2013
91
101 McAuley A. Computer based alcohol interventions. NHS Health Scotland; 2012.
102 C Bambra, M Gibson, A Sowden, K Wright, M Whitehead, M Petticrew (2010). Tackling the wider social determinants of health and health inequalities: evidence from systematic reviews. Journal of Epidemiology & Community Health 2010; 64: 284–291.
103 Bambra C, Gibson M, Wright K, Whitehead M, Petticrew M. Tackling the wider social determinants of health and health inequalities: evidence from systematic reviews. Journal of Epidemiology & Community Health. 2010; 64: 284–291.
104 Gregg P, Waldfogel J, Washbrook E. family expenditures post-welfare reform in the UK: Are low-income families starting to catch up? Labour Economics. 2006; 13: 721–746.
105 Lorenc T, Petticrew M, Welch V, Tugwell P. What types of interventions generate inequalities? Evidence from systematic reviews. Journal of Epidemiology & Community Health. 2012; 67: 190–193.
106 Amos A, Bauld L, Clifford D et al. J (2011). Tobacco control, inequalities in health, and action at a local level in England [online]. 2011. Available from: phrc.lshtm.ac.uk/papers/PHRC_A9-10R_Final_Report.pdf
107 Fayter D, Main C, Misso K et al. Population tobacco control interventions and their effects on social inequalities in smoking. CRD Report 39 [online]. 2008. Available from: www.york.ac.uk/inst/crd/CRD_Reports/crdreport39.pdf
108 Hahn RA, Middleton JC, Elder R, et al. Effects of alcohol retail privatization on excessive alcohol consumption and related harms. American Journal of Preventative Medicine. 2012:42(4);418–427.
109 Bambra C, Gibson M, Sowden A, Wright K, Whitehead M, Petticrew M. Working for health? Evidence from systematic reviews on the effects on health and health inequalities of organisational changes to the psychosocial work environment. Preventative Medicine. 2009; 48: 454–461.
110 Egan M, Bambra C, Thomas S, Petticrew M, Whitehead M, Thomson H. The psychosocial and health effects of workplace reorganisation. 1. A systematic review of organisational-level interventions that aim to increase employee control. Journal of Epidemiology & Community Health. 2007; 61(11): 945–54.
111 Bambra C, Egan M, Thomas S, Petticrew M, Whitehead M. The psychosocial and health effects of workplace reorganisation. 2. A systematic review of task restructuring interventions. Journal of Epidemiology & Community Health. 2007; 61(12): 1028–37.
112 Bambra C. Work, Worklessness and the Political Economy of Health. Oxford: Oxford University Press; 2011.
113 Lofstedt RE. Reclaiming health and safety for all: An independent review of health and safety legislation [online]. 2011. Available from: www.kcl.ac.uk/sspp/departments/geography/people/academic/lofstedt/review/lofstedt-reportfinal.pdf

NHS Health Scotland: Health Inequalities Policy Review June 2013
92
114 Health and Safety Executive. Health and Safety statistics for 2011/12 [online]. 2012. Available from: www.hse.gov.uk/statistics/history/index.htm
115 Scottish Government. Scottish House Condition Survey. Key findings 2011 [online]. 2011. Available from: www.scotland.gov.uk/Topics/Statistics/SHCS/Downloads
116 Scottish Government. Evidence Review of the Private Rented Sector in Scotland. Communities Analytical Services. Edinburgh: Scottish Government; 2012.
117 Thomson H, Thomas S, Sellstrom E, Petticrew M. Housing improvements for health and associated socio-economic outcomes (review). Cochrane Database of Systematic Reviews. 2013; Issue 2: Art. No: CD008657. DOI: 10.1002/14651858.CD008657.pub2.
118 Fitzpatrick-Lewis D, Gannan R, Krishnatatne S, Ciliska D, Kouyoumdjian F, Hwang SW. Effectiveness of interventions to improve the health and housing status of homeless people: a rapid systematic review. BMC Public Health. 2011; 11 683: 1–14.
119 Capewell S, Graham H. Will cardiovascular disease prevention widen health inequalities? PloS Medicine. 2011; 7(8): e1000320. doi:10.1371/journal.pmed.1000320.
120 Scottish Parliament. Smoking, Health and Social Care (Scotland) Act 2005. Edinburgh: Scottish Parliament; 2005.
121 Ayres JG, Semple S, MacCalman L, et al. Bar workers’ Health and Environmental Tobacco Smoke Exposure (BHETSE): Symptomatic improvement in bar staff following smoke-free legislation in Scotland. Occupational and Environmental Medicine. 2009; 66: 339–46.
122 Akhtar P, Haw S, Levin K, Currie D, Zachary R, Currie C. Socio-economic differences in second-hand smoke exposure among children in Scotland after introduction of the smoke-free legislation. Journal of Epidemiology & Community Health. 2010; 64: 341-346. doi:10.1136/jech.2008.084178.
123 Steinbach R, Grundy C, Edwards P, Wilkinson P, Green J. The impact of 20 mph traffic speed zones on inequalities in road casualties in London. Journal of Epidemiology & Community Health. 2011; 65(10): 921–6. doi: 10.1136/jech.2010.112193. Epub 2010 Nov 15.
124 Jones R, MacKinven D, Crawford F, Whyte B; Glasgow’s Proposal for Mandatory 20 mph Zones. Glasgow Centre for Population Health; 2009.
125 Grundy C, Steinbach R, Edwards P, Green J, and Wilkinson P. The Effect of 20 mph Zones on Inequalities in Road Casualties in London: A report to the London Road Safety Unit. London: London School of Hygiene and Tropical Medicine; 2008.
126 Grundy C, Steinbach R, Edwards P, Green J, Wilkinson P. Effect of 20 mph traffic speed zones on road injuries in London, 1986–2006: controlled interrupted time series analysis. British Medical Journal. 2009; 339: b4469.

NHS Health Scotland: Health Inequalities Policy Review June 2013
93
127 Macdonald M, Mackenzie G. A study into the effectiveness of traffic-calming measures in residential and school zones in Edinburgh. Presentation [online]. 2012. Available from: www.fphscotconf.co.uk/uploads/FPH%202012/C3/martin_macdonald_and_gmackenzie_c3_3.pdf
128 Ogilvie D, Egan M, Hamilton V. Promoting walking and cycling as an alternative to using cars: systematic review. British Medical Journal. 2004; 329: 763.
129 Gibson M, Petticrew M, Bambra C, Sowden AJ, Wright KE, Whitehead M. Housing and health inequalities: A synthesis of systematic reviews of interventions aimed at different pathways linking housing and health. Health & Place. 2011; 17(1): 175–184.
130 Thomson H, Atkinson R, Petticrew M, Kearns A. Do urban regeneration programmes improve public health and reduce health inequalities? A synthesis of the evidence from UK policy and practice (1980–2004). Journal of Epidemiology & Community Health. 2006; 60(2):108–15.
131 GoWell. Glasgow Community Health and Wellbeing Research and Learning Programme [online]. Available from: www.gowellonline.com
132 Kearns A, Mason P. Defining and Measuring Displacement: Is Relocation from Restructured Neighbourhoods Always Unwelcome and Disruptive? Housing Studies. 2013; 28(2): 177–204.
133 Egan M, Tannahill C, Bond L, Kearns A, Mason P. Health outcomes over time A comparison across the 2006, 2008 and 2011 GoWell community surveys [online]. 2013. Available from: www.gowellonline.com/index.php?option=com_docman&task=doc_details&gid=254&Itemid=218
134 The National Evaluation of Sure Start (NESS) Team. The impact of Sure Start Local Programmes on seven year olds and their families. Birkbeck: University of London; 2012. Available from: www.ness.bbk.ac.uk/
135 Belsky et al. 2006, Melhuish et al. 2008, Melhuish et al. (2005). In NHS Health Scotland. Evidence summary: Interventions to support parents, their infants and children in the early years (pregnancy to 5 years). NHS Health Scotland; 2012. Available from: www.healthscotland.com/uploads/documents/19955-ParentingInterventionsPregnancyTo5Years%20amended%20151112.pdf
136 NHS Health Scotland. Evidence summary: Interventions to support parents, their infants and children in the early years (pregnancy to 5 years). NHS Health Scotland; 2012. Available from: www.healthscotland.com/uploads/documents/19955-ParentingInterventionsPregnancyTo5Years%20amended%20151112.pdf
137 NICE clinical guideline. Pregnancy and complex social factors. London, September 2010.

NHS Health Scotland: Health Inequalities Policy Review June 2013
94
138 NICE Guidance on cancer services. Improving Supportive and Palliative Care for Adults with Cancer. London, 2004.
139 NICE public health guidance. Identifying and supporting people most at risk of dying prematurely. London, September 2008.
140 Rachel Ormston, Susan McConville, Marjon van der Pol, Anne Ludbrook , Amanda Amos (2012) Evaluation of Quit4u. NHS Health Scotland, May 2012.
141 Ebrahim S, Taylor F, Ward K, Beswick A, Burke M, Davey Smith G. Multiple risk factor interventions for primary prevention of coronary heart disease. London: Wiley; 2011.
142 NHS Health Scotland. What do we know about patient outcomes as a result of Keep Well? A narrative synthesis approach to Keep Well evaluations: Summary. Edinburgh, NHS Health Scotland; 2013.
143 NHS Health Scotland. Keep Well Evaluation strategy. Edinburgh, 2013 [accessed at www.healthscotland.com/scotlands-health/evaluation/index.aspx on 21st may 2013].
144 McMahon A, Blair Y, McCall DR, Macpherson MD L. Reductions in dental decay in 3-year old children in Greater Glasgow and Clyde: repeated population inspection studies over four years. BMC Oral Health. 2011: 11:29.
145 Olds DL, Henderson Jr CR, Cole R, et al. Long-term effects of nurse home visitation on children’s criminal and antisocial behaviour: 15-year follow-up of a randomized controlled trial. Journal of the American Medical Accociation. 1998; 280(14): 1238–1244.
146 Olds DL, Henderson Jr. CR, Phelps C et al. Effect of prenatal and infancy nurse home visitation on government spending. Medical Care. 1993; 31(2): 155–174.
147 Ormston R, McConville S. Evaluation of the Family Nurse Partnership Programme in NHS Lothian, Scotland: 3rd Report – Infancy. ScotCen Social Research; 2012.
148 Sanders J, Owen-Jones E, Robling M. Evaluating the family nurse partnership in England: the Building Blocks trial. The practising midwife. 2011; 14(7): 13–5.
149 Adams J, White M, Moffat S, Howel D, Mackintosh J. A systematic review of the health, social and financial impacts of welfare rights advice delivered in healthcare settings. BMC Public Health. 2006; 6: 81.
150 Naven L, Withington R, Egan E. Maximising Opportunities: final evaluation report of the Healthier, Wealthier Children project. NHS Greater Glasgow & Clyde. Glasgow: Glasgow Centre for Population Health; 2012.
151 Braga AA, Weisburd DL. The Effects of Focused Deterrence Strategies on Crime: A Systematic Review and Meta-Analysis of the Empirical Evidence. Journal of Research in Crime and Delinquency. 2011; 000(00): 1–36.
152 Violence Reduction Unit. The violence must stop. Glasgow’s Community Initiative to Reduce Violence. Second Year Report. Glasgow: Violence Reduction Unit; 2010.

NHS Health Scotland: Health Inequalities Policy Review June 2013
95
153 BMA Board of Science. Growing up in the UK. Ensuring a healthy future for our children. London: BMA; 2013. Available from http://bma.org.uk/working-for-change/improving-and-protecting-health/child-health/growing-up-in-the-uk
154 NICE (2009). NICE public health guidance 40 Social and emotional wellbeing: early years. London: NICE; 2012. Available from: http://guidance.nice.org.uk/PH40/Guidance/pdf/English
155 Blank L, Baxter S, Messina J, Fairbrother H, Goyder L, Chilcott J. Promoting the social and emotional wellbeing of vulnerable pre-school children (0–5 years): UK evidence review. Sheffield: School of Health and Related Research (ScHARR), University of Sheffield on behalf of the National Institute for Clinical Excellence; 2012. Available from: www.nice.org.uk/nicemedia/live/13941/61162/61162.pdf
156 Baxter S, Blank L, Messina J, Fairbrother H, Goyder L, Chilcott J. (2012). Promoting the social and emotional wellbeing of vulnerable pre-school children (0–5 years): Systematic review-level evidence. Sheffield: School of Health and Related Research (ScHARR), University of Sheffield on behalf of the National Institute for Clinical Excellence; 2012. Available from: www.nice.org.uk/nicemedia/live/13634/58882/58882.pdf
157 Scott E, Woodman K. (2012) Evidence summary: Interventions to support parents, their infants and children in the early years (pregnancy to 5 years). Edinburgh: NHS Health Scotland; 2012. Available from: www.healthscotland.com/uploads/documents/19953parentingInte-ParentingInterventionsPregnancyTo5Years%20amended%20151112.pdf
158 Audit Scotland. Improving Community Planning in Scotland. Prepared for the Auditor General for Scotland and the Accounts Commission. 2012. Available from: www.audit-scotland.gov.uk/docs/central/2013/nr_130320_improving_cpp.pdf
159 Alastair H Leyland, Ruth Dundas, Philip McLoone & F Andrew Boddy. Inequalities in mortality in Scotland 1981–2001. Glasgow: MRC SPHSU; 2007
160 Glasgow Centre for Population Health. Briefing paper 10, concepts series. Putting Assets-based approaches into practice: Identification, mobilisation and measurement of assets. July 2012
161 Ministerial Task Force (2013) Health Inequalities – Third Sector Briefing Paper. Edinburgh: Scottish Government; April 2013.

4667
3/2
014
www.healthscotland.com