health, safety and environment in biomass gasification health, safety and environment in biomass...
TRANSCRIPT

Health, Safety and Environment of Biomass Gasification
of theInternational Workshop
September 28, 2005
Hilton Hotel InnsbruckSalurnerstraße 15
A-6010, Innsbruck, Austria
Gaseous Emissions
Waste Water
Risk Assessment
Permission Procedure
IEA Bioenergy
Stefan Fürnsinn
Ruedi Bühler
Hermann HofbauerEditors:
Topics:
Supported by

________________________________________________________________________________
________________________________________________________________________________
2
Edited by:
Stefan Fürnsinn, Vienna University of Technology, Austria
Ruedi Bühler, Umwelt & Energie Bühler Ruedi, Switzerland
Hermann Hofbauer, Vienna University of Technology, Austria
Vienna, April 2006
© ThermalNet- the new European Network for biomass pyrolysis, gasification and combustion
IEA, Task 33 / Thermal Gasification of Biomass

________________________________________________________________________________
________________________________________________________________________________
3

________________________________________________________________________________
________________________________________________________________________________
4
Introductory note
Biomass gasification is one of the most promising technologies, allowing for the production of electricity and heat in a renewable energy system at high efficiencies. Due to CO2 accumulation in the atmosphere and ever increasing anthropogenic greenhouse gases, biomass gasification has the potential to significantly contribute to more environmentally friendly energy services.
However, environmental concerns of new technologies must not only consider carbon cycles and renewability issues, but also need to be operated safely and thus must not harm their immediate environment: fauna and flora, as well as, of course, residents and workers.
Even though some success stories can be reported on biomass gasification plants which operate at demonstration scale and sustainably produce district heat and electricity, many issues concerning health, safety and environment of biomass gasification have not yet been answered satisfactorily, thus not only perishing people involved, but also hindering technology development and complicating permission procedures. For this reason, an international workshop was co-organized by ThermalNet and IEA, aiming at finding solutions for known problems and identifying tomorrow’s challenges in biomass gasification HSE respects. Expert speakers from all over Europe were invited, and much knowledge was gained from presentations and discussions.
This book may serve as a compilation of papers summarizing the presentations, supplemented by two resumes of panel discussions held after the two core sessions of the workshop. Reports include the following topics:
- gaseous emissions
- waste water
- risk assessment and risk management
- permission procedure
Due to the complexity of the issue, not all answers may be presented in one workshop. Nevertheless, much valuable information was obtained in relation to current problems, but also giving guidance for further research in the field.
Finally, we would like to thank the authors for their cooperation in the preparation of their manuscripts and apologize for any mistakes that have not been found in the course of proof reading. Of course, any suggestions and comments are welcome.
Stefan Fürnsinn
Ruedi Bühler
Hermann Hofbauer

________________________________________________________________________________
________________________________________________________________________________
5
Contents
List of Participants __________________________________________________ 8
Health, Safety and Environment in Biomass Gasification Introduction to the Workshop
Ruedi Bühler __________________________________________________________ 10
Session 1: Gaseous Emissions
Gaseous emissions and emission regulations
Harrie Knoef __________________________________________________________ 20
Gaseous Emissions Experience of GE Jenbacher with Wood Gas
G. Herdin, R. Robitschko, J. Klausner ______________________________________ 30
Gaseous emission in the view of an expert of the permitting authority
B. Schaffernak
A presentation summary by S. Fürnsinn_____________________________________ 48
Permission of Biomass Gasification Plants – The Vision of German Manufacturers
E. Oettel, D. Bräkow
A presentation summary by S. Fürnsinn_____________________________________ 52
Panel discussion I Gaseous emissions in biomass gasification
Chairman: S. Babu A summary by Stefan Fürnsinn____________________________________________ 56
Session 2: Waste Water
Formation, Treatment and Avoiding of Waste Water
Reinhard Rauch _______________________________________________________ 60
Composition and Treatment of Wastewater from Gasifiers – Danish Experience with Toxicity Evaluation and Reduction
Karin Jönsson and Jes la Cour Jansen _____________________________________ 68

________________________________________________________________________________
________________________________________________________________________________
6
Session 3: Risk assessment and permission procedure
Legal basis for placing gasifiers on the market
Friedrich Lettner, Helmut Timmerer ________________________________________ 90
Standards, Good Practice and Goal-setting – the UK Regulatory Perspective
Dr Laurence Cusco_____________________________________________________ 98
Overview on Risk assessment of biomass gasification plants
Helmut Timmerer, Friedrich Lettner _______________________________________ 106
Explosion parameters and Explosion Protection in Biomass Gasification plants
Helmut Timmerer, Friedrich Lettner _______________________________________ 114
Required Documentation for the Permitting Procedure – the Austrian Situation as an Example
Friedrich Lettner, Helmut Timmerer _______________________________________ 128
Experiences of a plant supplier
T. Koch
A summary by Stefan Fürnsinn___________________________________________ 134
Measures to meet the H+S Regulations of the Pyroforce® wood gas system
Martin Schaub, Angela Hofmann, Willy Gemperle, Herbert Gemperle
Panel discussion II Risk assessment and permission procedure – Lessons learnt
Chairman: Prof. H. Hofbauer
A summary by Stefan Fürnsinn___________________________________________ 150

________________________________________________________________________________
________________________________________________________________________________
7

________________________________________________________________________________
________________________________________________________________________________
8
List of Participants
Email address
Buehler Ruedi [email protected] Hermann [email protected]ürnsinn Stefan [email protected] Friedrich [email protected] Erik [email protected] Nader [email protected] Harrie [email protected] Thomas [email protected] Mads [email protected] Helmut [email protected] Sebastian [email protected] Tobias [email protected] Eberhard [email protected] Reinhard [email protected] Serge [email protected] Martin [email protected] Henrik [email protected] Chris [email protected] Suresh [email protected] Reinhard [email protected] der Drift Bram [email protected] Scoditti Emanuele [email protected] P [email protected] Nick [email protected] Bernhard [email protected] Karin [email protected] L [email protected] M [email protected] A [email protected] Günther [email protected] Herbert [email protected]
Name

________________________________________________________________________________
________________________________________________________________________________
9

Introduction to the workshop ________________________________________________________________________________
________________________________________________________________________________
10
Health, Safety and Environment in Biomass Gasification
Introduction to the Workshop
Ruedi Bühler
Sagiweg 4, CH-8933 Maschwanden, Switzerland
1 Importance of Health, Safety and Environment in Biomass Gasification
Biomass gasification is a promising technology, which can contribute to develop future en-ergy systems which are efficient, safe in design and operation as well as environmental friendly in order to increase the share of renewable energy for heating, electricity, transport fuels and higher applications. Biomass gasification is ready for commercialisation but today large-scale introduction is hampered by various reasons. Health, Safety and Environmental (HSE) issues are recognised as a major barrier in the deployment of this technology. Awareness on HSE is a barrier because several key market actors for the implementation of these technologies are either not familiar with the technology or cannot judge the HSE risks.
During the processing of biomass in gasification plants and the production of gases, also several unwanted by-products will be produced which can have an impact on environment and health as well as they can be dangerous for human life and plants safety. Therefore it is inalienable to know about
the substances,
their behaviour and concentration in the plant as well as
their effects on fauna/flora and human live,
procedures for their reduction in environment,
procedures & design for obliging safety and
procedures in case of an accident
and their behaviour with regard to health issues
environmental issues
safety aspects.
To get an overview about the different risks the perpetrators, their consequences as well as the right measures to avoid risks, to design in a safe way, to limit risks by operational measures and instructions for the operation personnel, a technology description and clas-sification has to be done followed by a systematic risk assessment based on this descrip-

Introduction to the workshop ________________________________________________________________________________
________________________________________________________________________________
11
tion and classification combined with the creation of a measure catalogue for the risk re-duction or even switch off.
The EU machinery guideline defines under annex 1 that the manufacturer is under an ob-ligation to assess the hazards in order to identify all of those, which apply to his machine; he must design and construct the machine taking this assessment into account.
Machinery must be so constructed that it is fitted for its function, and can be adjusted and maintained without putting persons at risk when these operations are carried out under the conditions foreseen by the manufacturer. The aim of measures taken must be to eliminate any risk of accident throughout the foreseeable lifetime of the machinery, including the phases of assembly and dismantling, even where risks of accident arise from foreseeable abnormal situations.
2 HSE activities in GasNet and IEA Bioenergy
2.1 IEA Bioenergy
The subject of task 33 of IEA Bioenergy is «Thermal Gasification of Biomass». The objec-tives of Task 33 are to review and exchange information on biomass gasification research, development, demonstration, and commercialization, seek continuing involvement with bioenergy industries and to promote cooperation among the participating countries to eliminate technological impediments to advance the state-of-the-art of thermal gasification of biomass. The ultimate objective is to promote commercialization of efficient, economical, and environmentally preferable biomass gasification processes, for the production of electricity, heat, and steam, for the production of synthesis gas for subsequent conversion to chemicals, fertilizers, hydrogen and transportation fuels, and also for co-production of these products.
For further information about IEA Bioenergy task 33 see http://www.gastechnology.org/iea.
2.2 GasNet
GasNet is part of the European network ThermalNet. It is sponsored by the Intelligent En-ergy for Europe programme of the European Commission. The objective of GasNet is to examine, consider, review and advance recommendations on the technical and non-tech-nical barriers that will lead to more rapid and more successful implementation of thermal biomass gasification processes.
For further information about ThermalNet and GasNet see http://www.thermalnet.co.uk/.
2.3 HSE as a Joint Effort
In both networks HSE issues were recognised as a major barrier in the deployment of the technology. In a joint effort, ThermalNet and IEA Bioenergy Task 33 «Thermal Gasification of Biomass» aim to create and improve awareness of HSE issues as an important com-mercialisation of biomass gasification. The ultimate goal is to establish a «state of the art

Introduction to the workshop ________________________________________________________________________________
________________________________________________________________________________
12
procedure» to assess and improve operational safety and reliability of biomass gasification plants. The scope will be limited to biomass gasification plants up to 5 MWth capacity.
To verify if HS&E-issues are known and taken into account during engineering and con-struction a questionnaire of HS&E-aspects was designed and sent to manufacturers and technology developers. The answers to this questionnaire showed that most of the manu-facturers have only little knowledge in the assessment of safety risks.
To find out which problems the manufacturers during the authorisation process have, a second questionnaire was sent out with questions in the HS&E-area, which should be validated. The results of the questionnaire showed that the HS&E topic is a very important theme, which should be addressed in the future:
75% would like to have a checklist/guideline for manufacturers to obtain EU declaration of conformity
74% would like to have information on possible measures to avoid health and safety risks and reduce environmental burden, which can be used to ease the permitting procedure, i.e. procedures which are accepted by the permitting authorities
69% expressed the need for a checklist or guideline to customers and how to prepare an explosion protection document
69% also like to have support in order to get a CE mark on their installation
57% expressed the need for determination of explosion parameters
54% expressed the need for information on toxicity of waste water, residuals from treatment, also to the communities.
Most manufacturers and operators showed interest to work in a common EU-project to develop a guideline for safe biomass plants, which will be accepted by the public authori-ties.
3 Setup of a European Project for a Guideline
Based on work done in the joint task of GasNet and IEA Bioenergy, a European project was prepared to develop a guideline. The main objective is to accelerate the process of commercialisation and market introduction of gasification by an accepted guideline on HSE aspects for all target groups and key actors (Figure 1).
For the realisation of the guideline four work packages are defined:
Development of the guideline
Validation of the guideline by case studies
Dissemination of the guideline
Project management.

Introduction to the workshop ________________________________________________________________________________
________________________________________________________________________________
13
AcceptedGuideline for safe and eco- friendly Biomass Gasification
Market
ManufacturersInvestors,CustomersTechnology developer
Market
ManufacturersInvestors,CustomersTechnology developer
Authorities
EU, National, Regional, LocalLegislationAuthoritiesPermittingAuthorities
Authorities
EU, National, Regional, LocalLegislationAuthoritiesPermittingAuthorities
Public opinion
PoliticsCommunitiesEnvironmentalorganisationsProtest parties
Public opinion
PoliticsCommunitiesEnvironmentalorganisationsProtest parties
Health Safety Environment
Figure 1: Recipients and Beneficiaries of the Project
As shown in figure 2 most of the work will be conducted in parallel. Case studies from several existing plants and those under planning will provide the basic information to the project in an interactive process. Cases from existing plants will give a realistic understanding of the HSE problems in practice and how HSE issues are integrated in the engineering phase. Projects in the planning stage will use the guideline and test whether it’s beneficial for their project. Several key actors showed big interest to act as a case, which is essential to get such a guideline accepted. An assessment will be made of the economic implications of the guideline. Changes on relevant legislation will be proposed to remove this barrier. Dissemination of the guideline is essential because key actors like end-users, manufacturers, authorities and communities should use the guideline in practice.
The proposal was rejected in 2004. The main objection was: “Biomass gasification and pyrolysis are still in the development phase and the provisions of the proposed guidelines are thought to be premature currently.”
This is hard to understand. Several gasification plants are in construction and some are in operation. If one follows the arguments given in the rejection of the proposal, this would mean that
in a first step one should built commercial gasifier plants without considering HSE aspects.
in the second step one should build safe plants, which meet the EU directives.
The necessity of a guideline still remains. Therefore we have to continue our efforts to create a guideline.

Introduction to the workshop ________________________________________________________________________________
________________________________________________________________________________
14
Figure 2: Interaction between the work packages
4 Workshop on Health and Safety, September 2005 Innsbruck
It was decided by GasNet and Task 33 «Gasification» of IEA Bioenergy to organise a joint workshop. The scope of the workshop will be limited to biomass gasification plants up to 5 MWth capacity.
4.1 Objectives
The objectives of this workshop are to review the status and define the next steps to achieve the objectives of the joint HSE task of ThermalNet and IEA Task 33. The workshop should:
Review status of HSE in biomass gasification; What do we know? What should we – manufacturers, experts, authorities – know?
Show the permitting procedure in selected countries
Present the views of manufacturers, permitting authorities, engineers and scientists on the various aspects of HSE
Collect existing information to prepare the necessary documents for obtaining HSE permits
Conclude the gap of knowledge and identify the necessary further steps toward an international applicable «guideline-compendium»

Introduction to the workshop ________________________________________________________________________________
________________________________________________________________________________
15
Outline the necessary next steps to achieve the objectives of the HSE task of ThermalNet/IEA.
4.2 Expected Content
The workshop concentrates on the HSE aspects of:
Gaseous emissions
Liquid waste
Safety and health risks for the operators
Permitting procedures
The pertinent keywords for gaseous emissions include:
Identification of important emissions from biomass gasification
Emission regulations
Comparison of emissions with other power producing systems
Identification of RD&D needs
Essential steps to achieve appropriate emission limits.
The pertinent keywords of liquid waste include:
Chemical composition of waste water from different types of gasifiers
Toxicity of waste water components
Health risks to operators and measures to improve operational safety
Methods to reduce waste water problems
Methods to clean waste water below allowable concentration limits
Identification of R&D needs.
The pertinent keywords of safety and health risks and permitting procedure include:
List of Health and safety risk factors (explosion, fire, danger of inhaling or coming in contact with toxic or carcinogenic vapours, liquids and solids)
Situations, in which these risk may occur, during normal operation, start-up, shut-down and maintenance
Solutions to avoid or minimise these risks: Costs, practical aspects, and usefulness of these solutions
Procedure for risk assessment methods to implement measures to avoid or minimise HSE risks.
Legal and regulatory aspects
Declare conformity to EU standards (CE marking) - liabilities of manufacturer and operator

Introduction to the workshop ________________________________________________________________________________
________________________________________________________________________________
16
Required permitting documents for planning, construction, and operation of biomass gasification plants
Reports from permitting authorities, manufacturers and suppliers of gasification plants
Measures to facilitate and reduce work and costs of the permitting procedure
The presentations of the speakers will show, how much of the expected content will be covered.

Introduction to the workshop ________________________________________________________________________________
________________________________________________________________________________
17

________________________________________________________________________________
18
Session 1 _____________________________________________________________________________________________________
Gaseous Emissions
Chairman: S. Babu
Contributions:
H. Knoef: Biomass gas engines: gaseous emissions and emission regulations
G. Herdin: Gaseous emissions: Experience of GE Jenbacher engines with wood gas
B. Schaffernak: Gaseous emission in the view of an expert of the permitting authority
E. Oettel: Emission regulations for gas engines in Germany
Panel Discussion

________________________________________________________________________________
19

Session 1 – Gaseous emissions ________________________________________________________________________________
________________________________________________________________________________
20
Gaseous emissions and emission regulations
Harrie Knoef
BTG biomass technology group BV, Email: [email protected]
1 Introduction
Thermal processing of biomass has the potential to offer a major contribution to meeting the increasing demands of the bio-energy and renewable energy sectors and to meet the targets set by the EC and member countries for CO2 mitigation. Biomass gasification is considered one of the most promising routes for syngas or combined heat and power production because of the potential for higher efficiency cycles. Figure 1 shows a schematic presentation of processes involved in biomass gasification.
char
tars
Gasification
Pyrolysis
CatalystH2O (steam)O2 (air)
CO CO2H2
HeatBiomass permanent gases
tars
ash
tars
Heat
CO2H2O
Combustion
O2 (air)
Figure 1: Schematic presentation of gasification as one of the thermal conversion processes
Good technical progress has been made in the field of biomass gasification, but at a commercial level good achievements still have to be attained. One important aspect in commercialisation is to reduce the gaseous emissions to acceptable levels, meaning that they comply with current legislation.

Session 1 – Gaseous emissions ________________________________________________________________________________
________________________________________________________________________________
21
2 Emission regime for gasification
As Figure 1 shows, during combustion also gasification takes place; gasification at reducing atmosphere and combustion at oxydizing atmosphere. This results in different products and emissions. In most European countries emission limits do either not exist or they are assumed to be the same as for combustion. Looking more closely to the combustion and gasification process there are good arguments to differentiate the emission limits between these technologies.
2.1 Combustion
During combustion a solid inhomogeneous feedstock is converted into CO2 and H2O using oxygen as carrier. By-products like CO, dust and PAH - dependent on the fuel quality - are released at the same time. CO and PAH are the result of incomplete combustion which is inherent to the inhomogenity of the solid feed. CO may oxydise to CO2 but most of the PAH’s are carcinogenic. Measuring PAH’s is not only difficult but for all very costly. Since CO and PAH are both caused by incomplete combustion these compounds are related, i.e. the CO concentration is a measure for PAH emissions. Measuring CO is simple, cheap and can be monitored continuously. This is the main reason why the CO limit is very low for combustion plants, because low CO means also low PAH.
2.2 Gasification
The situation is different for gasification. Like combustion the starting point is a solid feedstock, but this is converted into a gaseous combustible homogeneous fuel. When this gas is used in engines or turbines, the gas needs to be cleaned and cooled down. Also tar – containing PAH – have to be removed or converted. So, before the engine or turbine there must be a clean fuel, which is homogeneous containing up to 20 vol% CO. Gas engines tend to have a slip (blow-by) of 1 %, meaning that there will be about 2000 ppm CO in the exhaust gas. This CO can not be considered as harmful since it will oxydise easily and this CO is not a measure for PAH emission because there will be hardly any PAH due to the very good combustion process (combustion of two gases, oxygen and producer gas). Producer gas is a clean fuel (engine/turbine) and a very strict CO limit like for combustion is not necessary and hampers the development and more rapid implementation of the technology. Technology developers and scientists are unnecessarily forced to develop CO reduction measures which are costly and therefore detrimental to the economics.
Within international networks like the IEA and GasNet this problem has been addressed several times and the question is how new legislation – different from combustion – for CO emission can be realised.
The differences in emission regulations are nicely shown in Figure 2 and 3, valid for Austria.

Session 1 – Gaseous emissions ________________________________________________________________________________
________________________________________________________________________________
22
0
50
100
150
200
250
300
350
400
450
500
550
600
650
700
Dust CO NOx: natural biomass HC
Emis
sion
s lim
its [m
g/m
³st.c
.]
existing emission limits inaustria for gasification drivenIC-engines (calculated fromlimit at 5%O2)
According to AustrianFeuerungsanlagen-VO, relatedto 13%O2
According to AustrianFeuerungsanlagen-VO butrecalculated to 5%O2
Fuel Power: >1 MW and <= 2 MW Electrical Power: >250 kW and <= 500 kWel
Figure 2: Emission limits in mg/Nm3
0
500
1000
1500
2000
2500
3000
3500
4000
4500
5000
5500
6000
Dust CO NOx: natural biomass HC
Emissions limits [mg/kWh_el]
existing emission limits inAustria for gasificationdriven IC-engines(calculated to mg/kWhel;25% electrical efficiency)
From Austrian FAVrecalculated energyspecific emissions(Combustion relatedefficiency 13%; mg/kWhel)
(Fuel Power: >1 MW and <= 2 MW)
Electrical Power: >250 kW and <= 500 kWel
Figure 3: Emission limits in mg/kWe
Strange enough the limits for gasification and combustion are referring to a different O2 percentage. The figures also indicate that the overall picture is different when another unit is used. There is a preference to relate the emission level to the produced electrical power, but authorities are more used to the relation with gas volume. Another option is to use the yearly emission load related to the electrical power produced in the same period.
3 Emission limts and permitting
In general the technical knowledge at permitting authorities is poor; combustion they know – pyrolysis and gasification is a mystery. Therefore, permitting procedures for gasification are usually very long. Another consequence is that they request for strict limits like the WID to be on the safe side. It also depends on whether you have to deal with national or local

Session 1 – Gaseous emissions ________________________________________________________________________________
________________________________________________________________________________
23
authorities. For large scale plants usually national authorities are responsible for the permitting. Another conflicting issue is the general negative public opinion on thermal processing of biomass; many projects initiated – particularly large scale plants – face problems while communities have objections against such installation in their neighbourhood. Education and training of the relevant agencies is necessary – but is costly. Different regions in one country also may interpret the regulations in different ways, meaning that the location is vital in some cases for approval – or not. One area may require authorisation for a 150 kWe installation, another area not.
Emission limits in different countries are shown in the table 1. It shows a large variation between countries. Limits depend on: (1) type of engine, (2) fuel, (3) capacity. Different units are used (mg/Nm3 or mg/MJ) and different oxygen concentration (5, 6 or 11%). In some cases exceptions are made, or there is no concern at all or limits do not exist, like France, USA. With forthcoming legislation this will change in the near future. In particularly, Denmark introduced new limits for gasification which are very favourable.
Country CO (mg/Nm3) NOx (mg/Nm3) Ref. %O2
Denmark 3000 (1900) 550 5 (11)
Germany 250 (155) 400 5 (11)
Netherlands 50 130 11
Switzerland 650 (405) 400 5 (11)
Italy 350 500 11
United Kingdom 50 400 11
Austria 650 (405) 400 5 (11)
Sweden 250 (166) 6 (11)
Belgium 250 400 11
4 Emissions
4.1 Influencing factors for emissions from gas engines
As producer gas contains about 20 vol% CO, there will be normally about 2000 ppm CO in the exhaust gas due to the slip. The slip depends on the gas composition (H2 and CO) and lambda value. Hydrogen has a high flame speed, which means that the slip increases with declining hydrogen content.

Session 1 – Gaseous emissions ________________________________________________________________________________
________________________________________________________________________________
24
At high lambda values – meaning lean conditions – the flame is quenched and the flame speed decreases. The flame should combust completely before the exhaust valves opens. At lean conditions the emissions will increase, usually at lambda > 1.6. The Technical University of Denmark has made several investigations on emissions as function of the lambda. Figure 4, 5, 6 and 7 show some of these results.
0
200
400
600
800
1000
1200
1400
1600
1800
2000
1.00 1.10 1.20 1.30 1.40 1.50 1.60 1.70 1.80 1.90 2.00
λ
NO
x [m
g/N
m3
@ 5
% O
2]
NOx min MBT Limit
Figure 4: CO emission as function of lambda
0
500
1000
1500
2000
2500
3000
1.00 1.10 1.20 1.30 1.40 1.50 1.60 1.70 1.80 1.90 2.00
λ
CO
[mg/
Nm
3 @
5%
O2]
NOx min MBT Limit Suggested limit
Figure 5: NOx emission as function of lambda

Session 1 – Gaseous emissions ________________________________________________________________________________
________________________________________________________________________________
25
0
1000
2000
3000
4000
5000
6000
7000
8000
9000
10000
0.8 1 1.2 1.4 1.6 1.8 2 2.2 2.4 2.6λ / [-]
CO
/ [m
g/m
3 n @ 5
% O
2]
PGNG
Figure 6: Slip as function of lambda
0.0%
0.5%
1.0%
1.5%
2.0%
2.5%
1.00 1.10 1.20 1.30 1.40 1.50 1.60 1.70 1.80 1.90λ
Emis
sion
slip
[% o
f fue
l in]
CO slip CH4 slip
Figure 7: CO emission as function of lambda (for producer gas and natural gas)

Session 1 – Gaseous emissions ________________________________________________________________________________
________________________________________________________________________________
26
0
100
200
300
400
500
600
700
800
900
1000
1100
1200
4-10-0314:38
4-10-0319:26
4-11-030:14
4-11-035:02
4-11-039:50
4-11-0314:38
Emis
sion
[mg/
Nm
3 @ 5
% O
2]
COUHC
4.2 Emissions in practice
Emissions from different existing plants have been measured in the past. Jenbacher is the most applied gas engine and their results are given in a separate paper.
Figure 8 and 9 show results of DTU, Denmark, indicating the CO and unburned hydrocarbons (UHC) emission and the engine slip for CH4 and CO.
Figure 8: CO and UHC emission (DTU)
Figure 9: CH4 and CO slip (DTU)
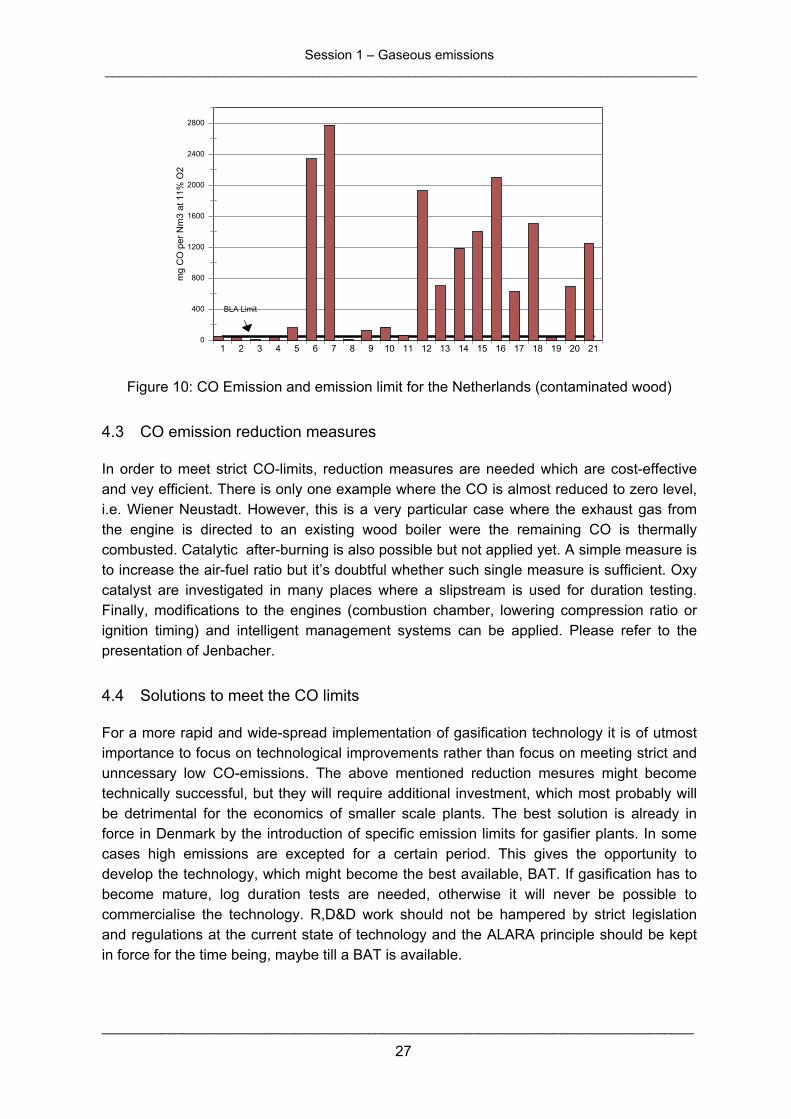
In 2001, the gaseous, liquid and solid emissions of 21 gasifiers of different size using different feedstock were investigated by BTG. Figure 10 show the results for CO emission compared to the emission limit valid for the Netherlands of contaminated wood. The figure shows that only a few could meet the limit but these were large scale plants having extensive flue gas cleaning.
0.0
0.2
0.4
0.6
0.8
1.0
1.2
1.4
17:02 17:16 17:31 17:45 18:00 18:14
Time
Emis
sion
slip
[% o
f fue
l in]
CH4 CO
Session 1 – Gaseous emissions ________________________________________________________________________________
________________________________________________________________________________
27
0
400
800
1200
1600
2000
2400
2800
mg
CO
per
Nm
3 at
11%
O2
1 2 3 4 5 6 7 8 9 10 11 12 13 14 15 16 17 18 19 20 21
BLA Limit
Figure 10: CO Emission and emission limit for the Netherlands (contaminated wood)
4.3 CO emission reduction measures
In order to meet strict CO-limits, reduction measures are needed which are cost-effective and vey efficient. There is only one example where the CO is almost reduced to zero level, i.e. Wiener Neustadt. However, this is a very particular case where the exhaust gas from the engine is directed to an existing wood boiler were the remaining CO is thermally combusted. Catalytic after-burning is also possible but not applied yet. A simple measure is to increase the air-fuel ratio but it’s doubtful whether such single measure is sufficient. Oxy catalyst are investigated in many places where a slipstream is used for duration testing. Finally, modifications to the engines (combustion chamber, lowering compression ratio or ignition timing) and intelligent management systems can be applied. Please refer to the presentation of Jenbacher.
4.4 Solutions to meet the CO limits
For a more rapid and wide-spread implementation of gasification technology it is of utmost importance to focus on technological improvements rather than focus on meeting strict and unncessary low CO-emissions. The above mentioned reduction mesures might become technically successful, but they will require additional investment, which most probably will be detrimental for the economics of smaller scale plants. The best solution is already in force in Denmark by the introduction of specific emission limits for gasifier plants. In some cases high emissions are excepted for a certain period. This gives the opportunity to develop the technology, which might become the best available, BAT. If gasification has to become mature, log duration tests are needed, otherwise it will never be possible to commercialise the technology. R,D&D work should not be hampered by strict legislation and regulations at the current state of technology and the ALARA principle should be kept in force for the time being, maybe till a BAT is available.

Session 1 – Gaseous emissions ________________________________________________________________________________
________________________________________________________________________________
28
5 References
DTU (2004); presentation from Jesper Ahrenfeldt at the Copenhagen meeting, October 2003 within the ThermoNet project
BTG (2001); Gaseous, liquid and solid emissions of biomass gasifiers, report no. 2EWABB01.27, can be ordered at [email protected]

Session 1 – Gaseous emissions ________________________________________________________________________________
________________________________________________________________________________
29

Session 1 – Gaseous emissions ________________________________________________________________________________
________________________________________________________________________________
30
Gaseous Emissions Experience of GE Jenbacher with Wood Gas
G. Herdin, R. Robitschko, J. Klausner
GE Jenbacher
Abstract
Due to the great number of wood gas plants presently monitored by GEJ it is possible to make significant assertions regarding the emissions of such plants [1, 2]. Through the amount of H2 in the wood gas there are no essential problems complying with the TA-Luft limit value of 500 mg/sm³ (@ 5% O2) for NOx emissions. Values well under the ½ TA-Luft value are possible as well, but these must be “paid for” by lower degrees of efficiency and lower power densities. A special case involves the presence of NH3: besides the formation of thermal NOx there is also the formation of NOx bonded in the fuel. Depending on the amount of NH3 it is also possible that the TA-Luft limit is exceeded. As before, one problem is the CO emissions, since the gas engine has a fuel slippage of about 1 to 2 %. This effect must be reduced by secondary treatment of the exhaust gas. Positive results with the utilization of oxidation catalysts allow the conclusion that it is possible to optimize the quality of gas cleaning to these requirements. The “favorite” amongst the various gas cleaning concepts that will probably establish it self is dry gas cleaning (pre-coat filter) in combination with a gas scrubber. In the case of tests carried out at the Güssing plant the approximate 11,000 operating hours of the oxi-cat have demonstrated its effectiveness.
1 Origination of emissions in the engine
In the combustion of various fuels in a combustion engine small amounts of pollutants originate naturally alongside CO2 and H2O. The most important components are NOx, CO and the unburned amounts of fuel. The global interrelationships in the combustion of natural gas are shown in Figure 1.
In the case of gas engines the characteristic curves can be plotted over the Lambda; the quantitative emission minimum is reached with so-called “lean” operation. The lean limit is designated as the misfiring limit and it is at this limit that the NOx emissions are the least. The reason for this effect is the lowering of the mean combustion chamber temperature. However, the CO and the portion of unburned fuel increase in this area. The minimum of unburned fuel lies at a value of 1.5 to 2 % (dependent of combustion concept).

Session 1 – Gaseous emissions ________________________________________________________________________________
________________________________________________________________________________
31
Figure 1: NOx, CO and the portion of unburned gas over Lambda
NOx generation depends primarily on the flame temperature and with the same Lambda these temperatures vary greatly with different fuels. Figure 2 shows the NOx emissions of different fuels; the highest temperatures occur with hydrogen. Hydrogen thus has the highest NOx emissions also with the same Lambda (in comparison with gasoline and methane); but due to its high ignition limit hydrogen has the best lean limits. This characteristic can be utilized to allow combustion with a high amount of excess air (high Lambda values) and thus with low flame temperatures (lowest NOx emissions values). In the case of high amounts of both H2 and inert gas it is also possible to sink the flame temperature; in this regard Figure 2 shows the extreme case of a gas mixture of 15 % H2 and a remaining portion of N2. Under stoichiometric conditions the generation of NOx is very small as well.
Figure 2: NOx emissions over the Lambda of various fuels

Session 1 – Gaseous emissions ________________________________________________________________________________
________________________________________________________________________________
32
2 Efficiency, BMEP and NOx emissions
To attain the best possible degrees of engine efficiency, the BMEP should be as high as possible. With fuel mixtures having high portions of H2, however, the occurrence of knocking combustion hinders the attainment of a high BMEP. Through the portion of H2 shifting to leaner mixtures can reduce the knocking tendency. Figure 3 provides an example showing the interrelationships with a specific gas quality and a specified turbocharger unit. With the given quality of wood gas a NOx value of 800 mg (TA-Luft limit = 500 mg NOx/sm³) this means a somewhat better efficiency curve over the load of the engine. With the already critical “overload” value of 120 % regarding knocking combustion the engine has an efficiency of 39.5 % (mechanical). At the value conforming to TA-Luft and the nominal load 38 % are attained; in the case of minimal NOx operation only a power output of 75 % is reached and the efficiency at maximally possible load then lies at only 35.5 %. For the electrification of wood gas we should therefore not necessarily be looking at the smallest possible NOx values, but at a compromise between efficiency, BMEP and NOx. Depending on the possible turbocharger and the combustion concept somewhat smaller NOx values with higher BMEPs can also lead to an improvement of efficiency.
Figure 3: Relationship between NOx emissions and efficiency
3 Examples of wood gas plant emissions
As an example, Figures 4 and 5 show the NOx and CO emissions of the Boizenburg and Harboøre plants [3]. In the case of the Boizenburg plant TA Luft ½ values had to be reached; the very high CO emissions were to be reduced to the limit value with the aid of an oxi-cat. Through the high portion of inert gas in the wood gas the Lambda -- with an equally high NOx emission value -- was at lower values compared with the pre-chamber version of the natural gas engine. However, the CO emissions rose markedly as a result of the colder combustion temperatures in comparison with the Harboøre plant. Here the CO emissions

Session 1 – Gaseous emissions ________________________________________________________________________________
________________________________________________________________________________
33
are lower due to the higher combustion chamber temperatures (but higher NOx values) despite a higher amount of CO in the wood gas (Harboøre 26 %, Boizenburg 16 %).
Figure 4: NOx, CO emissions -- Boizenburg
Figure 5: NOx, CO emissions -- Harboøre
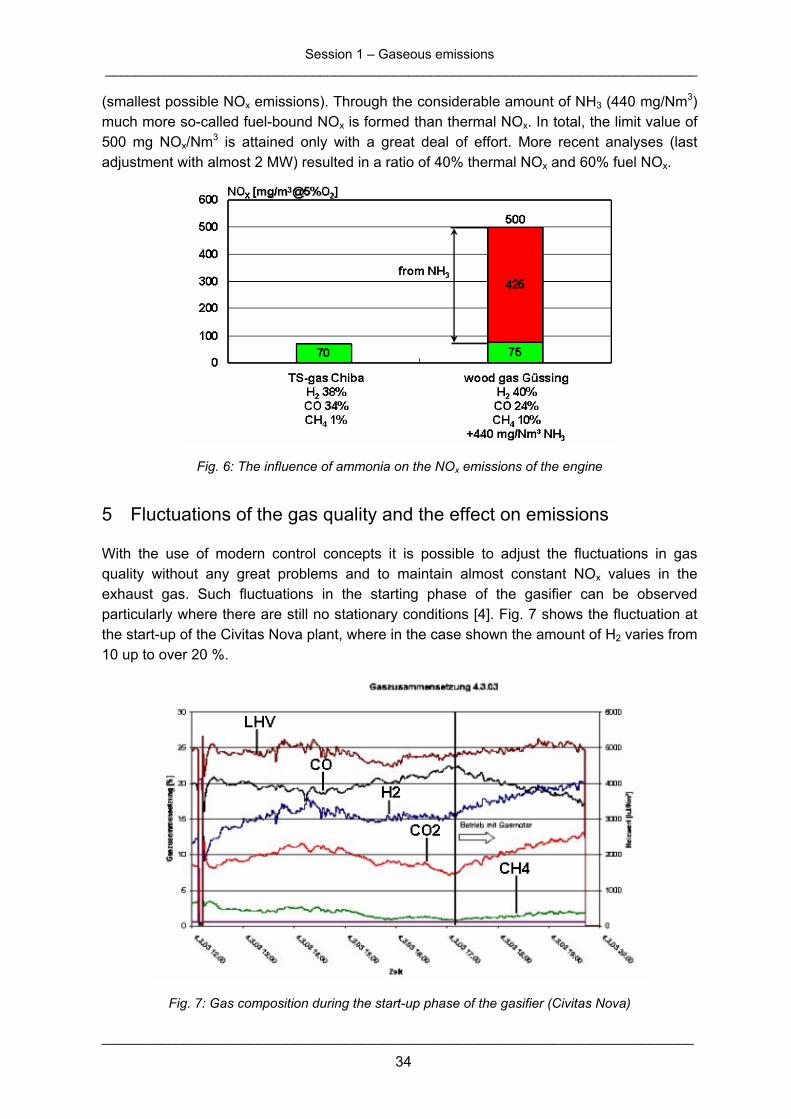
4 Impact of NH3 on the quantity of NOx emission
When wood gas is used as fuel in a gas engine, trace elements such as ammonia must be taken into consideration. Ammonia has a direct influence on the NOx emission of the engine, since it forms so-called fuel-bound NOx during combustion. This effect can be observed very well in the Güssing plant in comparison to the Thermoselect plant in Chiba (waste gasification), because the quality of the respective gases is very similar (Fig. 6). In the case of the Chiba Thermoselect plant it is no problem to adjust the engine to attain a NOx level of 70 mg/Nm3 (the same BMEP). Here only thermal NOx is formed. An initial ana-lysis indicated that in the case of the Güssing plant, which runs close to the lean-burn limit
Session 1 – Gaseous emissions ________________________________________________________________________________
________________________________________________________________________________
34
(smallest possible NOx emissions). Through the considerable amount of NH3 (440 mg/Nm3) much more so-called fuel-bound NOx is formed than thermal NOx. In total, the limit value of 500 mg NOx/Nm3 is attained only with a great deal of effort. More recent analyses (last adjustment with almost 2 MW) resulted in a ratio of 40% thermal NOx and 60% fuel NOx.
Fig. 6: The influence of ammonia on the NOx emissions of the engine
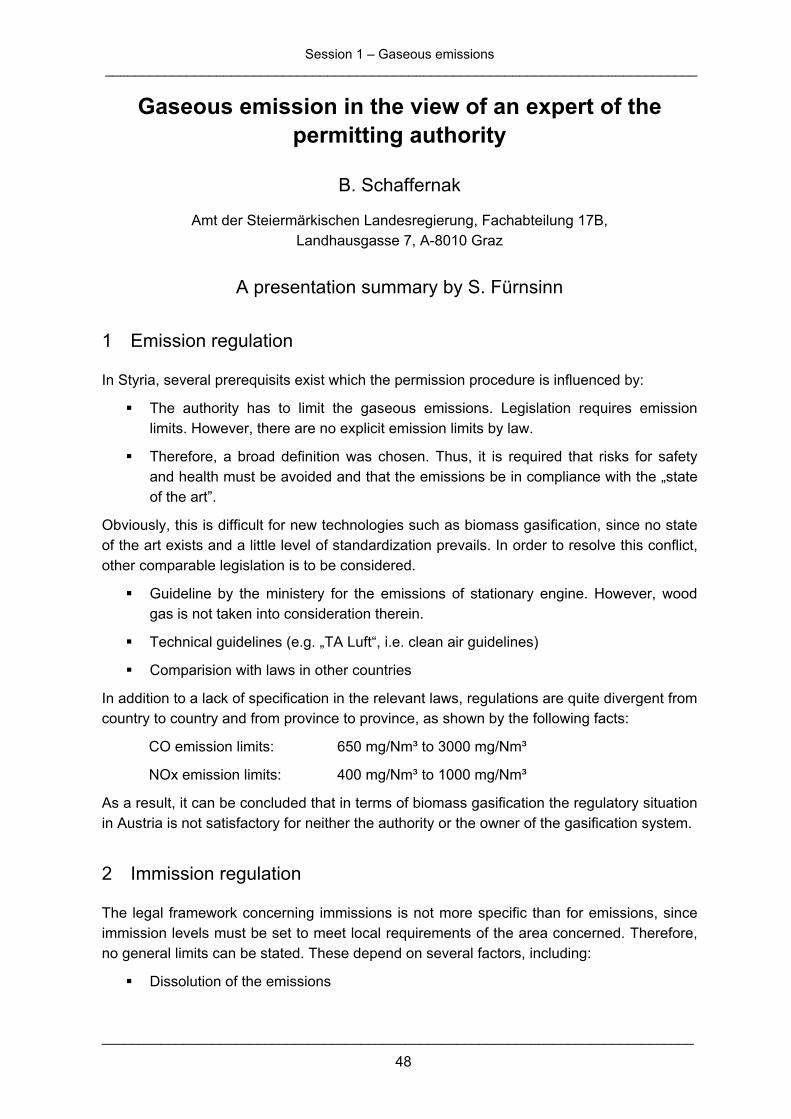
5 Fluctuations of the gas quality and the effect on emissions
With the use of modern control concepts it is possible to adjust the fluctuations in gas quality without any great problems and to maintain almost constant NOx values in the exhaust gas. Such fluctuations in the starting phase of the gasifier can be observed particularly where there are still no stationary conditions [4]. Fig. 7 shows the fluctuation at the start-up of the Civitas Nova plant, where in the case shown the amount of H2 varies from 10 up to over 20 %.
Fig. 7: Gas composition during the start-up phase of the gasifier (Civitas Nova)

Session 1 – Gaseous emissions ________________________________________________________________________________
________________________________________________________________________________
35
Figure 8: Fluctuations in gas quality at Pyroforce Spiez
Fluctuation in the composition of the wood gas causes the calorific value to change (about ± 10 %) and additionally influences the generation of NOx. Operation close to the lean limit is critical for engine operation because this may result in massive misfires and flashes in the exhaust gas train. From the viewpoint of GEJ, settings greater than 250 mg NOx/sm³ are also tolerant enough to cope with fluctuations in the gas quality of properly operated wood gasifiers.
A further example (Spiez) of fluctuations in composition is shown in Figure 8. Here too the fluctuation range is about ± 10 %, which must be compensated for via the engine control system regarding NOx emissions.
6 Relationship between maximum output and NOx emissions
The power output of the engine and the NOx emissions show further potential for optimization. Figure 9 shows in this (Chiba plant) regard the influence of air excess ratio variation on the maximum possible output. In this way the output could be increased by about 20 % under otherwise identical conditions; the minimal air excess ratio is then 1.8. The NOx emission values with this setting are about 2000 mg. For reliable engine operation this air excess ratio is not possible because of the fluctuating H2 content, since backfiring can occur in the inlet system. With the given H2 contents it is recommendable to set a air excess ratio over 2 to ensure reliable operation. On the other hand, the engine could also be operated at a NOx emission level von 70 mg/Nm³; in such a case the power must be reduced by 15 %. The NOx emissions are essentially no problem regarding pyrolysis gas, but the situation looks different with CO.

Session 1 – Gaseous emissions ________________________________________________________________________________
________________________________________________________________________________
36
60
80
100
120
140
1.8 2 2.2 2.4 2.6 2.8
load [%]
nominal load
maximum load
air/fuel ratio [ ]
Figure 9: Load behavior dependent on air excess ratio
7 Turbocharging and NOx emissions
To optimize the cost-effectiveness ratio on the one hand and to improve the degrees of efficiency of the engines, the greatest possible BMEPs must be strived for. To achieve this, the turbocharger unit in the Harboøre plant was modified after the first year of operation to provide a greater charge pressure to increase power output. With the higher boost pressure it was possible to raise the BMEP from 1.1 MPa to 1.3 MPa (increase in output from 650 to 765 kW). In this regard Figure 10 shows turbocharger parameters from wood gas operation in comparison to operation with natural gas with the same NOx emissions (450 mg/sm³). The measured electrical efficiency of the gas engines after the optimization was 36.5 %, this amount was the same than with natural gas. Due to the somewhat lean operation in the case of wood gas the exhaust gas temperature sinks before and after the turbine (T4); as a result, the work capacity of the turbine sinks as well.
p2 p2
520°C
460°C
2000 mbar
1750 mbar
T4 T4
natural gas (1.56 MPa)Lambda = 1.69
wood gas (1.3 MPa)Lambda = 1.86
Figure 10: Harboøre turbocharger characteristic

Session 1 – Gaseous emissions ________________________________________________________________________________
________________________________________________________________________________
37
Figure 11 shows extreme conditions for the turbocharger; here the characteristic values of pure H2 (2 ppm NOx) and natural gas (90 ppm NOx) are compared.
Figure 11: Turbocharger parameters with natural gas compared with pure H2
The exhaust gas temperature (T4) with possibly very lean operation (Lambda = 2.58) was only 395°C. I.e., the manufacturers of turbochargers are called upon to deliver the highest possible boost pressures to achieve very low NOx emissions and very high BMEPs.
8 Aspects regarding emissions of wood gas plants
The composition of wood gas varies considerably (as shown in Figures 7 and 8). In most plants the reason for this effect lies in a certain variability of the water content in the wood, in part also in the plant concept (Harboøre). Fig. 12 shows initial experience gained at the Emmenbrücke plant, which can be immediately seen in the emissions resulting from constant power and the volumetrically fixed air/fuel ratio (richer mixture/higher calorific value – higher NOx emissions). Parallel to the emissions also the amount of O2 in the exhaust gas fluctuates.

Session 1 – Gaseous emissions ________________________________________________________________________________
________________________________________________________________________________
38
Fig. 12: Fluctuation of emissions depending on gas quality (Emmenbrücke – 1997)
9 Exhaust gas aftertreatment, oxidation catalyst
The combustion of diverse burnable gas mixtures in gas engines does not take place completely due to geometrical clearance volumes (e.g. the gap between the piston top land and cylinder liner) and the quench effect of the flame on the cold combustion chamber wall. Depending on the combustion concept, combustion air ratio and also other parameters, a fuel gas slippage of 1 to 2 % is measured. In the case of high CO values in the gas the crude emissions of CO of the wood gas engine are then also relatively high. Fig. 13 shows a “cross-section” of various plants in the case of use of diverse pyrolysis gases (wood gases and others). The same figure also shows the influence of the combustion air ratio. In the observed range in the trade-off higher temperatures mean higher NOx values and also less CO emissions. The measured raw emissions of CO lie in the range of 1,500 up to 3,300 mg/Nm³ @ 5% O2. With very lean engine operation with low NOx emissions the CO emission values can increase up to more than 4,000 mg/Nm³.
Fig. 13: Raw emission values of various plants (pyrolysis gas and wood gas)

Session 1 – Gaseous emissions ________________________________________________________________________________
________________________________________________________________________________
39
The first tests with oxidation catalysts did not run positively and further measurements were made with the help of an oxidation catalyst housed in the bypass (Figure 14). As a result, it is also possible to test the various gas cleaning concepts in a relatively cost-efficient way.
Figure 14: Catalyst test set-up at various pilot plants
In the meantime, investigations of several plants have shown that the task of removing the diverse catalytic poisons can indeed be fulfilled by several gas cleaning concepts. Fig. 15 shows the conversion rates of 4 selected plants measured over longer time intervals. What is very important, however, is the knowledge that a single malfunction can damage the catalyst in a relatively short time. Taking Güssing as an example, the oxidation catalyst functioned very well for about 3,000 oh and the conversion rates were at about 85 % with the selected high space velocities.
Figure 15: Catalyst conversion rates of specific wood gas plants
A single incident involving a forced shut-down of the plant (Güssing) caused condensate to flow into the catalyst, which at that moment was unfavorably positioned. The result was an “attack” of the active surface of the catalyst by the sour components, bringing about a partial deactivation of its function to about a 55 % conversion rate. The catalyst installed

Session 1 – Gaseous emissions ________________________________________________________________________________
________________________________________________________________________________
40
afterwards has now been in operation for more than 11,000 operating hours and the conversion rates are once again at a constant 90 %.
Due to the emission regulations of the individual countries it is therefore necessary to develop appropriate concepts that reduce the raw emissions of CO to levels close to “TA-Luft”. Initial tests with oxi-catalysts for CO reduction failed in a relatively short time (Emmenbrücke, Carbo V, 2SV and others). The reason for this was always symptoms of poisoning of the catalyst; in the case of tests at the Emmenbrücke plant the catalyst in the bypass was only about 50 % effective after about 30 oh [5]. In this context Fig. 16 shows the measured drop of the conversion rate. The ultimate analysis of the surface layer carried out by the manufacturer of the catalyst showed not only the catalytic poisons lead and zinc, but also potassium, which together with calcium causes a vitrification of the active surface (Fig. 17).
Figure 16: Drop of the conversion rate of the oxidation catalyst of the Emmenbrücke plant
This effect is the primary cause of the short-term drop in the conversion rate of the oxidation catalyst. The other elements (heavy metals) were also a reason why an oxidation catalyst would have practically no chance to “survive”. By means of the ultimate analysis of the wood, i.e. the ashes and the volume of condensates, it was possible to determine the source material definitely as the source of these pollutants (Emmenbrücke plant). Essentially, this means that a gas cleaning process downstream from the gasifier must be able to separate these elements from the gas with high precipitation rates. Simple cleaning concepts like a cork filter or only a scrubber on the basis of water as a scrubbing fluid are inadequate in light of the present state of knowledge. In the case of the plants mentioned previously, where the catalysts malfunctioned relatively quickly, exactly these concepts were employed.

Session 1 – Gaseous emissions ________________________________________________________________________________
________________________________________________________________________________
41
Figure 17: Analysis (X-ray) of the surface of the catalyst
10 Acidification of the engine oil due to condensation products (e.g. water) and deposition of different elements
Maintaining the proper oil quality is extremely important for the long service life expected of the engine and here attention is paid particularly to over-acidification (TBN/TAN ratio). Depending on the quality of the wood used and the concept of the plant/influencing variable (e.g. pre-coating material of the gas cleaning process), the wood gas can in part be considered very “sour“ (condensate PH value < 3.5). In such a case, the oil must be changed relatively frequently to prevent the engine from being exposed to an acid attack. According to our experience, the oil service periods of the observed plants range from 300 up to just about 4,000 oh (Güssing). The results of an initial very positive test series in Güssing with another heat transfer material or an S-containing pre-coating material showed an oil service life of only just over 1,000 oh. Extremely great differences are apparent and under no circumstances can a general statement be made. Another test series at the Civitas Nova plant in the course of experiments aimed at increasing output (during a cold period with high humidity values) led to the formation of condensate in the intercooler. In this case the condensate was initially fed to the engine oil unnoticed.
The daily prescribed oil level check led ultimately to recognition of the problem (milky engine oil). For the operator of a wood gas plant engine oil is the “blood“ of this relatively complex system. An oil analysis therefore shows the “clinical picture” clearly. Each influence of a malfunction of the system or a change to another wood quality (e.g. higher S-content – bark) of the plant can be clearly demonstrated. An example pertaining to the elements contained in the engine oil after a running time of 350 hours is shown in Figure 18 (Emmenbrücke plant). The left bars are the initial values in the fresh oil; the right bars show the accumulation after 350 hours. Especially the amounts of Cu, Pb and K are remarkable.

Session 1 – Gaseous emissions ________________________________________________________________________________
_________________________________________________________
42
Figure 18: Oil analysis after 350 h in the Emmenbrücke plant
Fig. 19 shows a negative example of a plant with about 60 kW in the Czech Republic.
Figure 19: Oil analysis sheet of the plant in the Czec
There the amount of potassium in the engine oil after a running4,000 mg, a value that even GEJ had never seen before. Thcatalyst tests carried out in this plant too. The new catalyst “sumeasurement run of about 3 to 5 hours, so that the plant was ceemissions. At the time of my visit (without emissions measuremeagain and in my estimation the CO emission value was again wh
not OK for catalysts,
gas cleaning is not
good enough
_______________________
h Republic
time of 300 oh was about e operator had oxidation
rvived” the TÜV emissions rtified as having good CO nt) the smell was “typical” ere no catalyst is used. As

Session 1 – Gaseous emissions ________________________________________________________________________________
________________________________________________________________________________
43
well, the high iron value already shows the critical condition of the engine (limit depending on the manufacturer from 20 to 30 mg).
11 Gas cleaning concepts
The gas cleaning process utilized at the above-mentioned plant is, like the type observed in Emmenbrücke, very simple. The wood gas coming from the gasifier is conducted in a quenche (water bath) and through a container with wood chips (cork). Any accompanying tar components are supposed to become deposited on the wood chips and thus bring the wood gas up to the degree of purity required for the engine. The oxidation catalyst was able to perform effectively only a few hours in all the plants monitored by GEJ and applying this gas cleaning concept. Potassium was positively identified as an indicator; together with other elements like Ca or Si, potassium produces a glass-like layer on the catalyst and renders it ineffective. On the basis of the latest state of knowledge there are only two concepts able to clean wood gas sufficiently for use with an oxidation catalyst. These are the following:
dry filter with a pre-coat material and
the use of a wet electrofilter
According to our state of knowledge the dry filter is preferable to the wet filter, since the costs of disposal of the washing water can be considerable. As an example, Figure 20 shows the successfully used cleaning concept of the Spiez plant.
Figure 20: Scheme of a gas cleaning process with a sufficient cleaning effect
A positive example of a highly efficient gas cleaning system is illustrated by the oil analysis of the Spiez plant in Figure 21; almost no potassium was found in the engine oil and the test catalyst of this plant has acceptable conversion rates even after 7,000 oh.

Session 1 – Gaseous emissions ________________________________________________________________________________
____________________________________________________________
44
Figure 21: Oil analysis sheet of the Spiez plant
12 Other concepts for reduction of emissions, especia
An innovative approach to controlling CO emissions can be seenCivitas Nova plant. In this case the location of the gasifier is pairebiomass heating station. The exhaust gas of the running engine is feof the infeed grate (high temperature zone - Fig. 22). The result hesensational, because the post-oxidation process reduces the high Cmg/Nm³ to a value of 6 mg/Nm³@ 3 % O2. The NOx level of the totalextremely good.
Figure 22: Concept-specific CO/NOx emissions of the Civitas
Ok for a catalyst
____________________
lly CO
in the concept of the d ideally with that of a d directly into the zone
re can also be seen as O emissions from 4,630 plant - 240 mg/Nm³ - is
Nova plant

Session 1 – Gaseous emissions ________________________________________________________________________________
________________________________________________________________________________
45
13 Special plant concepts for minimization of CO emissions
In the section on emissions attention was drawn to the problem area of CO emissions and a report given about the mutual efforts regarding gas cleaning and the development of catalysts. As before, GEJ presently still does not recommend the use of a catalyst, because a single and relatively brief malfunction of the gas cleaning unit can damage the catalyst at any time. A potential solution here is an adapted system of thermal post-oxidation (CL.AIR). This system is also very reliable in cases of poor gas quality (catalyst poisons) and is already employed in more than 200 units in countries with strict CO and formaldehyde emissions. Fig. 23 shows the system developed for the planned Rothenburg wood gas plant.
Figure 23: CL.AIR System for the Rothenburg plant
14 Acknowledgements
The authors of GEJ would like to heartily thank reNet, the FFF (Austrian Industrial Research Promotion Fund) and the EU for the generous financial assistance that has made it possible for the project operators to take new steps. The future of the worldwide assurance of the supply of energy also necessitates having funds and idealistic attitudes in order to set stake on the “Renewables”. Gratitude is also due the many colleagues in the various R&D departments who have made it possible thus far to be able to present the above results.
15 References
[1] G. Herdin, M. Wagner: “Stationary Gas Engines with H2 as Fuel or as a Fuel Component”, Lecture held at the WKO Austria (Chamber of Commerce Austria)
[2] G. Herdin, F. Gruber, D. Plohberger, D.I. Wagner: “Experience with Gas Engines optimized for H2-rich fuels”, ASME Spring Conference, 2003, in Salzburg

Session 1 – Gaseous emissions ________________________________________________________________________________
________________________________________________________________________________
46
[3] G. Herdin, M. Wagner: “Overview of the State of Development of Various Techniques of Wood Gasification”, Kraft Wärme Kopplung mit Holzenergie (Cogeneration with Wood Energy) in Hannover
[4] G. Herdin, M. Wagner: “Engine Use of Producer Gas, Experience and Requirements” Power Production from Biomass, Espoo/Finland
[5] G. Herdin, M. Schneider: “Utilization of Biogas and Experience of Wood Gas with Gas Engines 2nd Biomass Summer School, Graz University of Technology, Austria

Session 1 – Gaseous emissions ________________________________________________________________________________
________________________________________________________________________________
47
Session 1 – Gaseous emissions ________________________________________________________________________________
________________________________________________________________________________
48
Gaseous emission in the view of an expert of the permitting authority
B. Schaffernak
Amt der Steiermärkischen Landesregierung, Fachabteilung 17B, Landhausgasse 7, A-8010 Graz
A presentation summary by S. Fürnsinn
1 Emission regulation
In Styria, several prerequisits exist which the permission procedure is influenced by:
The authority has to limit the gaseous emissions. Legislation requires emission limits. However, there are no explicit emission limits by law.
Therefore, a broad definition was chosen. Thus, it is required that risks for safety and health must be avoided and that the emissions be in compliance with the „state of the art”.
Obviously, this is difficult for new technologies such as biomass gasification, since no state of the art exists and a little level of standardization prevails. In order to resolve this conflict, other comparable legislation is to be considered.
Guideline by the ministery for the emissions of stationary engine. However, wood gas is not taken into consideration therein.
Technical guidelines (e.g. „TA Luft“, i.e. clean air guidelines)
Comparision with laws in other countries
In addition to a lack of specification in the relevant laws, regulations are quite divergent from country to country and from province to province, as shown by the following facts:
CO emission limits: 650 mg/Nm³ to 3000 mg/Nm³
NOx emission limits: 400 mg/Nm³ to 1000 mg/Nm³
As a result, it can be concluded that in terms of biomass gasification the regulatory situation in Austria is not satisfactory for neither the authority or the owner of the gasification system.
2 Immission regulation
The legal framework concerning immissions is not more specific than for emissions, since immission levels must be set to meet local requirements of the area concerned. Therefore, no general limits can be stated. These depend on several factors, including:
Dissolution of the emissions

Session 1 – Gaseous emissions ________________________________________________________________________________
________________________________________________________________________________
49
Neighborhood
Special geographical situations
Hence, permission requirements will differ for rural and urban areas, as shown in Figure 1.
Figure 1: Regional particularities must be considered when judging immision impacts due to biomass gasification facilities.
Additionally, climate factors, e.g. wind velocities, precipitation, etc. must be taken into account.
3 Development of a „State of the art“:
In order to improve the legal situation and facilitate the permission procedure, the development of a “state of the art” for biomass gasification plants is aimed at. The following facts are detrimental for this process:
emission limits given by the authority are goals for the future
most biomass gasification systems exceed the current limits
only „Test permissions“ are attributed
during this test period emissions may exceed the limit
the test period is provided for up to three years
4 Permission process in Styria:
As styria is only one of nine provinces of Austria, the following values do not represent an Austrian standard:
• Emission limits (5% O2):
650 mg/m³ CO 400 - 500 mg/m³ NOx
• „Test permissions“ for 3 years
• Catalytic converter with warranty for the life time

Session 1 – Gaseous emissions ________________________________________________________________________________
________________________________________________________________________________
50
• Torch or other redundancy
5 Conclusions
• the situation in Austria isn‘t satisfying due to missing legal regulations
• a technical guideline considering the biomass gasification is required
• the development of a state of the art is needed

Session 1 – Gaseous emissions ________________________________________________________________________________
________________________________________________________________________________
51

Session 1 – Gaseous emissions ________________________________________________________________________________
________________________________________________________________________________
52
Permission of Biomass Gasification Plants – The Vision of German Manufacturers
E. Oettel, D. Bräkow
Fördergesellschaft Erneuerbare Energien e.V., D-12555 Berlin, Köpenicker Str. 325, tel.: +49 30 65 76 27 06, email: [email protected], web: www.fee-ev.de
A presentation summary by S. Fürnsinn
1 Introduction
In August 2005 Germany at last signed the IEA Bioenergy agreement and will take part in
Task 32: Biomass Combustion and Co-firing, Sjaak van Loo, the Netherlands
Task 33: Thermal Gasification of Biomass, Suresh Babu, USA
Task 34: Pyrolysis of Biomass, Tony Bridgwater, UK
Task 37: Energy from Biogas and Landfill gas, Arthur Wellinger, Switzerland
Task 39: Liquid Biofuels from Biomass, Jack Saddler, Canada
Task 41: Bioenergy Systems Analysis, Sven-Olov Ericson, Sweden
Two important legal documents have had a significant influence on biomass gasification:
Amended Act on Granting Priority to Renewable Energy, August 1, 2004
has created relative security for investment and profitablity for small and medium sized CHP gasification, but with a long return on investment
EU-Biofuel Guideline and German exemption of biofuels from mineral oil taxes until 2009
The Fördergesellschaft Erneuerbare Energien (FEE, Society for the Promotion of Renewable Energies) has come up with-definitions that categorize the capacity of gasification plants:
mini < 50 kWel
micro from 50 to 100 kWel
small from 100 to 500 kWel
medium from 500 to 1500 kWel
Criteria for this categorization are
Health, Security, Environment (HSE) demands
quantity of gasification fuel to be supplied continuously
need for profitability

Session 1 – Gaseous emissions ________________________________________________________________________________
________________________________________________________________________________
53
2 Current situation
2.1 Large scale BIGCC and BtL-plants
Currently, no major problems concerning legal rules for large bio-gasification plants, such working under pressure, such fuelled by contaminated wood or waste exist. This is also true for BIGCC or BtL-plants or for installations producing basic chemical products.
2.2 Thermal gasification for CHP, polygeneration
Here, no special regulations on thermal gasification for CHP, polygeneration exist. This
does not matter for large plants
creates insecurity for plants from 1 MWthp to 5 MWthp
represents an obstacle for smaller decentralized plants for demand-side supply
So far, there was no need for rules concerning biomass gasification but now first plants have become commercial and are ready for the market.
Currently, no uniform legal basis exists in Germany. The legal situation is even more difficult since permission lies within the responsibility of each German Bundesland (province) separately. Therefore, a high level of insecurity at all levels and in all fields is the consequence. Premission requirements may thus range from very strict, virtually economically prohibitive obligations to acceptance without nearly any additional measures. Similarly, technical requirements range from a low level to very strict, even exagerated environmental limits.
Furthermore, the situation is characterized by the fact that
manufacturers are exclusively small and medium enterprises (SME)
high technical requirements destroy profitability
grid operator must check conformity with the Act on Granting Priority to Renewable Energy
3 Suggestions and conclusions
3.1 General aspects valid for all countries
Try to implement unitarian permission rules on HSE in all member countries. In a first step EU legistlation should be encouraged.
Permissions granted in one country should either be accepted in all member-states or at least facilitate permission process in the respective countries.
Bureaucracy should be reduced (e.g. in Germany)

Session 1 – Gaseous emissions ________________________________________________________________________________
________________________________________________________________________________
54
All efforts should combine both high standards in terms of HSE, however, without blocking introduction of thermal gasification units
A more standardized differentiation between gasification plants with different purposes should be beneficial
Consider gasification facilities in a wholistic way. Consequently, a CHP or polygeneration plant should be treated as one technical system and not as a set of different components (dryer, gasifier, etc.)
Initiate research on suspected cancerogeuous impact
Combustion engines should be supplied with an oxycat or other appliances to limit CO-emissions
All inhouse plants need CO-sensors and actuators or similar appliances to detect and dilute CO-concentrations
3.2 Concerning Germany
Plants with < 1 MWTTP should be granted permission according to the Act on Construction Right (like biogas plants or wind turbines), Technical instructions on Air, Noise and Waste Water
Plants with > 5 MWTTP should be granted permission according to Ordinance on Plants Needing Permission (4th BImSchV- Federal Ordinance on Immission Protection, column 1 item 1.3)

Session 1 – Gaseous emissions ________________________________________________________________________________
________________________________________________________________________________
55

Session 1 – Panel discussion I ________________________________________________________________________________
________________________________________________________________________________
56
Panel discussion I Gaseous emissions in biomass gasification
Chairman: S. Babu
Participants: H. Hofbauer, H. Knoef, G. Herdin, H. F. Christiansen, B. Schaffernak, E. Oettel, R. Buehler
After session 1 of the workshop, in which several HSE-related aspects of gaseous emissions during biomass gasification were addressed, the speakers were asked to join in a panel discussion. There the goal was to conclude and summarize what was learnt in the morning session as well as to define open points and further directions for research.
In the course of the discussion it soon became clear that an unambiguous and universal distinction between relatively harmless emissions (“good guys”) and poisonous and dangerous emissions (“bad guys”) is crucial and should be drawn up in the near future. Although this seems inevitable for authorities to come up with sensible legislation, a significant level of uncertainty remains in this field. Besides general toxicity knowledge, profound information concerning the reactivity of CO in the atmosphere and the thus resulting residence time is not entirely widespread. It seems clear that dilution only helps if dangerous pollutants are eventually transformed into harmless substances. Therefore consensus on good and bad emission gases must be found to facilitate the interaction of practical, legislatory measures and technology development.
Ideal regulations lead to well performing plants but avoid too tight regulations. The question is how to reach such laws, especially since all countries have a different regulatory basis. Two possibilities exist for authorities: In the first case the best available technology must be used. Thus, strict emission limits are prescribed, which lead to the need for catalysts and consequently make especially new technologies more expensive. Alternatively, tolerating relatively high emission levels makes production cheaper, certainly at the price of higher emission levels. In any case a reliable and cheap pollutant measure is needed in order to judge environmental damage.
Concerning emission regulation, it was argued that limits must certainly not be set lower than technologically achievable. Nevertheless, clauses sometimes tend to surpass technical limits. Often directions raise the feeling that officials simply prescribe any available number, but not necessarily those leading to reasonable and attainable emission levels. At the moment, for instance, in Denmark formaldehyde limits are higher than originally proposed by some, since a reduction would have meant that current natural gas plants would have been forced to stop operation. On the other hand, Mr. Schaffernak replied that from the authorities’ point of view limits should certainly not be set to higher values than technically possible so as to guarantee a minimum of environmental damage. Especially since atmospheric reaction paths are complex and partly unknown, photochemical reactions leading to ozone production must not be left out of the consideration. Therefore, limits on CO and NOx should be kept to the technically achievable minimum.

Session 1 – Panel discussion I ________________________________________________________________________________
________________________________________________________________________________
57
However, carbon monoxide is not generally regarded as a good emission indicator. In fact, CO was only chosen as a measure because it was easy to detect in the 1970s. Today, modern analytics qualify for a much more differentiated interpretation of emission data. Therefore, CO emission limits should be more flexible to allow for a reduction of other pollutants.
For example, in modern gas engines using a CO and H2-rich producer gas as the fuel, CO and NOx emission levels go into opposite directions. When CO is minimized, a richer combustion is needed, which leads to higher NOx emissions. Therefore it is not enough to only look at one compound, i.e. CO, to minimize environmental damage. Similarly, if CO was found to be less harmful to the environment, the minimization of NOx with correspondingly higher carbon monoxide emissions would be sensible. In order to minimize both contraries, the use of a catalyst is inevitable, which would increase costs.
Despite some controversy, CO can be considered to be a cheap and quite reliable indicator for the overall environmental compliance and a trend measure for other pollutants. A generalization of this aspect for any energy conversion installation is difficult also because CO emissions depend on many other factors, including fuel composition. Thus, complementary information is needed. Finding a cheap and reliable indicator for all other “bad guys” therefore is an important objective for future research.
Besides technological constraints of biomass gasification, emission limits should also be evaluated in comparison with other technologies. CO emission levels prescribed for gasification plants, for example, must also be reasonable to operators of combustion plants. While gasification should not have legislative disadvantages compared to incineration, environmental standards ought to be preserved. Furthermore, concerning emissions it should not be forgotten that concentration-related limits are often insufficient. In fact, absolute values and immission limits should also be included in governmental policies. This also means measuring pollution in the distance, or including dispersion in the concepts as well.
Another important, but less regularly discussed topic concerning biomass gasification HSE are smell emissions and corresponding limits. In Denmark people have complained about odorous emissions. In such cases the responsible pollutant must first be detected. It is questionable whether small amounts of formaldehyde can be the cause of disturbing smells. Unburnt substances such as sulphur components should also be limited in gas engines to reduce smell. A further problem is smell detection which is not straightforward. Answering the corresponding question by Prof. Hofbauer, Mr. Christiansen pointed out that, as a matter of fact, a group of people is asked to express their feelings in relation to a reference gas of known composition and the actual gas released into the atmosphere to measure smell emissions.

________________________________________________________________________________
58
Session 2 _____________________________________________________________________________________________________
Waste water
Chairman: R. Buehler
Contributions:
R. Rauch: Formation, treatment and avoiding of waste water
K. Jonsson: Composition and treatment of waste water from gasifiers – Danish experience with toxicity evaluation and reduction

________________________________________________________________________________
59

Session 2 – Waste waterI ________________________________________________________________________________
________________________________________________________________________________
60
Formation, Treatment and Avoiding of Waste Water
Reinhard Rauch
Vienna, University of Technology, Insitute of Chemical Engineering Getreidemarkt 9/166, 1060 Vienna
1 Introduction
Gasification is an endothermic process, where a solid feedstock is converted in a combustible gas. Opposite to combustion processes, where water is formed, is gasification a water consuming process. Depending on the type of gasifier and the operation conditions about 0.01 to 0.1 kg water per kg of dry fuel is consumed. The excess of water, which is transported into the gasification system by the water content of the biomass, leaves the gasifier together with the product gas. Depending on the type of gas treatment, temperatures and pressures this excess of water can condense in different stages of the gas treatment or inside the gas engine.
2 Formation of waste water in gasification processes
Waste water is during normal operation of a gasification system only produced in the product gas treatment. As in the product gas treatment also the tars and particles are removed, the waste water contains particles, fly coke and aromatic components. The gas engine requires for smooth operation a gas which is free of aerosols to prevent damages on the gas control line, during combustion inside the cylinder and in the flue gas line. The water content in the product gas can condense in the following steps of the system:
Gas cooling (depending on gas and surface temperatures and pressure)
Gas cleaning
Tubes
Blowers
Gas engine
- Gas air mixer
- Intercooler after turbo charger
- Flue gas heat exchanger
In all parts of the product gas line during start up, shut down and instable operation
Especially, when the product gas is mixed with air and in the intercooler after the turbo charger the dew point of the gas air mixture has to be calculated carfully to avied any condensation inside the gas engine.

Session 2 – Waste waterI ________________________________________________________________________________
________________________________________________________________________________
61
The following figure shows possible points in a plant where condensation of water can occur.
Gas engine
Gasifier Gas cooling
Gas mixer
chimney
Biomass water content 8-50%
Gasification agent (air, steam, etc.) Waste water &
condensate Condensate
Turbo charger
Intercooler
Combustion in cylinder
Flue gas treatment
Flue gas heat exchanger
Gas cleaning
Combustion air
Waste water treatment
Figure 1: Water formation in biomass gasification plants
In principle waste water can be formed in two different ways in a gasification plant:
Condensation of water because temperature is below dew point
Usage of water during gas cleaning (wet scrubber)
The water balance in a gasification plant can be handled in different ways:
Disposal of formed waste water
Internal processing/usage of waste water by
- Combustion
- Waste water treatment
Avoiding/minimisation of waste water by drying the biomass and high inlet temperatures into gas engine (water input in biomass = water output in chimney)
During design of the gasification plant the following data for the water balance has to be taken into account:
Water input with fuel
Water conversion in gasifier
Dew point of product gas before gas treatment for water and tar

Session 2 – Waste waterI ________________________________________________________________________________
________________________________________________________________________________
62
Temperatures in the gas treatment and safety distance to dew point
Dew point in gas air mixer, intercooler and flue gas cooler
3 Problematic compounds in the waste water
Depending on the gasification technology, the type of gas treatment and the operating parameters the waste water can contain different organic and inorganic substances.
Fixed bed gasifiers contain normally only small amounts of particles (typically <1g/Nm³), fluidised bed gasifiers contain normally much higher amount of particles (>10g/Nm³).
The amount of fly coke depends on the reaction conditions and on the velocity at the exit of the gasifier. Here values between 0.1 and 50g/Nm³ are documented.
The amount and type of hydrocarbons depends, also like the other substances, on the type of gasifier, the residence time and the gasification temperature. Staged gasification systems have almost no hydrocarbons. Updraft gasifiers have the highest values on tars, downdraft gasifiers have a low tar content. Fluidised bed gasifiers produce tar contents, which are between the above mentioned fixed bed gasifiers. Beside the tars also benzene, toluene, phenols and other aromatic hydrocarbons are produced by gasification and can be found in the waste water.
The main component from the inorganic gaseous components is ammonia. Beside this also small amounts of hydrogen sulphide are found in the product gas. In untreated biomass only very small amounts of hydrogen chloride are found (<10ppm).
If these contaminants are removed from the product gas in a single unit (e.g. wet ESP), then all these contaminants are found in the waste water and have to be treated. If the contaminants are removed in separate units (e.g. bag filter and scrubber), then only the organic components and the ammonia has to be treated in the waste water.
4 Waste water treatment systems
The treatment systems for waste water are based on chemical, physical or biological processes. The substances in the waste water have to be converted or concentrated to remove them from the waste water.
Different waste water treatment systems were investigated till now in gasification systems. The most successful are based on the following principle:
1. Sedimentation to remove the main amount of organic substances
2. Evaporation of the waste water and combustion of the produced steam
In the biomass CHP Harboore in Denmark a separate combustion system was designed and operated to treat the waste water from the gasifier. At the biomass CHP Güssing in Austria a biodiesel scrubber is used to remove the tars from the product gas. In a sedimentation step the biodiesel is separated from the water fraction. The water fraction is evaporated and combusted in the combustion zone of the gasifier.

Session 2 – Waste waterI ________________________________________________________________________________
________________________________________________________________________________
63
5 Comparison of different gas cleaning concepts
At biomass gasification systems, which are in operation, the produced waste water is either treated inside the plant, or it is collected and sent to a special waste water treatment system. In the following table the gas cleaning concepts and the waste water systems are described.
Gas cleaning system
dry wet details
Preparation of waste water
Utilisation of waste water
Güssing X X Bag filter and wet scrubber evaporation Combustion in
gasifier
Harboore X Quensch and wet ESP evaporation External
combustion
Wr. Neustadt X Quensch and wet ESP
Minimisation by optimal humidity of product gas
disposal
Pyroforce X X Bag filter and wet scrubber
Minimisation by optimal humidity of product gas
disposal
Xylowatt X quensch none Disposal
IWT double fired fixed bed gasifier
X X Bag filter and scrubber
Evaporation and stripping Disposal
DTU Viking gasifier X Bag filter and
kondensation Not necessary disposal in public waste water treatment
Some gasification systems try to operate without any production of waste water. In principle this is possible, but the following points has to taken into account:
The amount of water, which enters the system with the biomass has to be the same or lower, than the amount of water which leaves the system in the flue gas of the gas engine
In the gas cleaning, the pollutants from the product gas are removed. By a recirculation of the pollutants an accumulation can occur, because some pollutants (e.g. potassium) cannot be converted in the gasifier
Recirculation of waste water can have a negative influence on the gasifier itself
The most used treatment of waste water is evaporation and combustion of the produced steam in an external unit (e.g. Harboore) or internal (e.g. Güssing: in the combustion zone of the gasifier). This concept is useful for larger biomass CHP systems.

Session 2 – Waste waterI ________________________________________________________________________________
________________________________________________________________________________
64
The small scale fixed bed gasifier try mainly to avoid waster water. This is done by drying the biomass to a level, that the water input into the gasifier is lower, than the water output of the system with the flue gases of the gas engine. Here higher inlet temperatures of the product gas into the gas engine have to be used, which causes a derating of the gas engine. Also has to taken into care that no condensation in the air-gas mixer or in the intercooler occurs.
6 Valid limits for disposal of waste water in public waste water treatment
In Austria there is no special limit for biomass gasification systems. So two different limits for the waste water can be applied:
1. Generell limits for waste water:
„Verordnung des Bundesministers für Land- und Forstwirtschaft über die allgemeine Begrenzung von Abwasseremissionen in Fließgewässer und öffentliche Kanalisationen (AAEV)“
2. Limits for waste water from gas cleaning:
„Verordnung des Bundesministers für Land- und Forstwirtschaft, Umwelt und Wasserwirtschaft über die Begrenzung von Abwasseremissionen aus der Reinigung von Abluft und wässrigen Kondensaten (AEV Abluftreinigung)“
In the following table the limits of the AAEV for disposal of waste water into a public waste water treatments and published values of different gasification systems are shown. As for most pollutants no published data from gasification systems are published, only the pollutants, where published data were available, are included into the table.
A) Fluidised bed steam gasification (before waste water treatment)
B) Double fired fixed bed gasifier (before waste water treatment)
C) 2 step gasification
D) Open Top fixed bed gasifier
E) Pilot plant double fired fixed bed gasifier

Session 2 – Waste waterI ________________________________________________________________________________
________________________________________________________________________________
65
limit A B C D E
pH-value 6,5–9,5 8,5-9,5 8
Pb mg/l 0,5 0,06
Cd mg/l 0,1 < 0,002
Cr mg/l 0,5 0,009 Co mg/l 1,0 0,1 Cu mg/l 0,5 0,08 Ni mg/l 0,5 0,16 Zn mg/l 2,0 1,84
Ammonia cal. as N mg/l can be limited
950-1050 2000 1000 <8
Chloride cal. as Cl – < 10 75 Cyanide, cal. as CN mg/l 0,1 0,051
Phosphor – total cal. as P – 2,8 6,1
Sulphate cal. as SO4 mg/l 200 < 5 Sulphide cal. as S mg/l 1,0 < 0,2 Total organic carbon TOC cal. as C mg/l – 96 1800-
2500 6
Chemical oxygen consumption CSB cal. as O2 – 108 <350
heavy lipophile compounds mg/l 100 210*
amount of hydrocarbons mg/l 20 < 0,05
Phenol index cal. as Phenol mg/l 10 1-6 80-700 1530 4
amount of volatile aromatic hydrocarbons. Benzene, Toluene und Xylene (BTX)
mg/l 0,1 40
* mainly Biodiesel, which is used as scrubbing liquid
7 Safety measures for the handling of waste water from biomass gasification systems
The waste water from biomass can contain the following problematic compounds in regard to health and safety:
Inorganic substances
- Ammonia
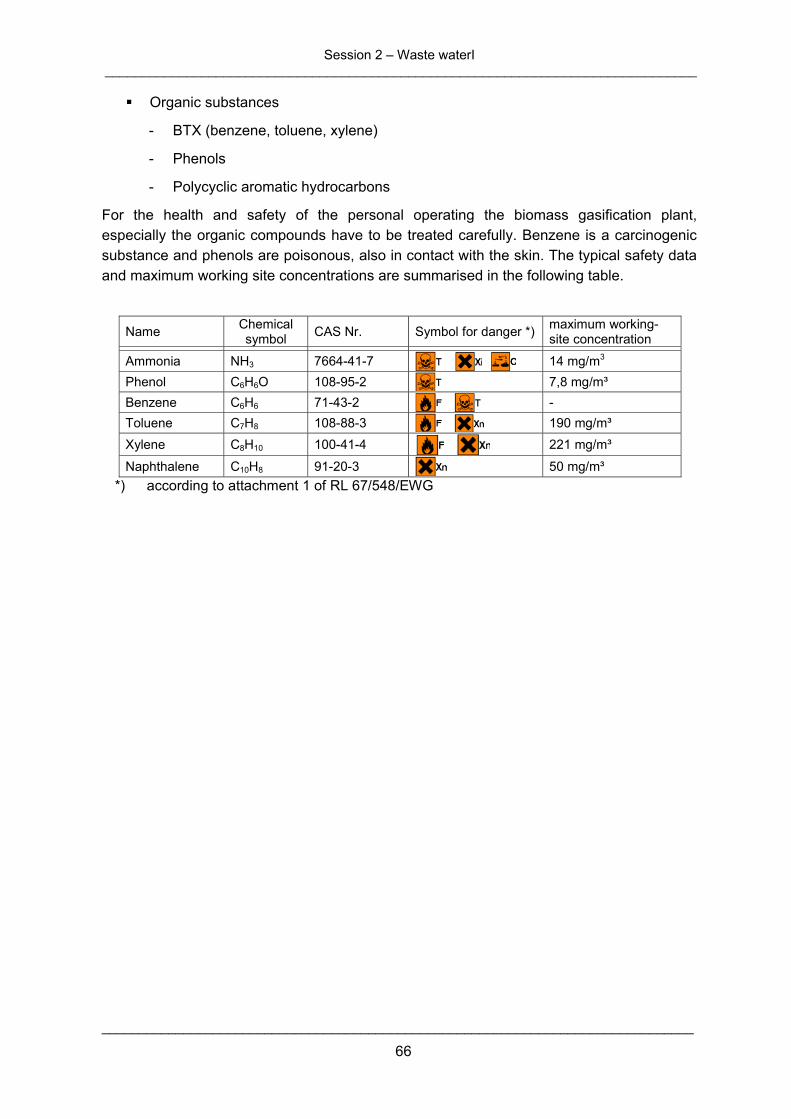
Session 2 – Waste waterI ________________________________________________________________________________
________________________________________________________________________________
66
Organic substances
- BTX (benzene, toluene, xylene)
- Phenols
- Polycyclic aromatic hydrocarbons
For the health and safety of the personal operating the biomass gasification plant, especially the organic compounds have to be treated carefully. Benzene is a carcinogenic substance and phenols are poisonous, also in contact with the skin. The typical safety data and maximum working site concentrations are summarised in the following table.
Name Chemical symbol CAS Nr. Symbol for danger *) maximum working-
site concentration
Ammonia NH3 7664-41-7 14 mg/m3 Phenol C6H6O 108-95-2 7,8 mg/m³ Benzene C6H6 71-43-2 - Toluene C7H8 108-88-3 190 mg/m³ Xylene C8H10 100-41-4 221 mg/m³
Naphthalene C10H8 91-20-3 50 mg/m³ *) according to attachment 1 of RL 67/548/EWG

Session 2 – Waste waterI ________________________________________________________________________________
________________________________________________________________________________
67

Session 2 – Waste waterI ________________________________________________________________________________
________________________________________________________________________________
68
Composition and Treatment of Wastewater from Gasifiers – Danish Experience with Toxicity
Evaluation and Reduction
Karin Jönsson and Jes la Cour Jansen
Department of Water and Environmental Engineering, Lund Institute of Technology, P.O. Box 118, SE-221 00 LUND, SWEDEN
E-mail:[email protected], [email protected]
1 Introduction
The Danish Follow-up Programme for Small-scale Solid Biomass Combined Heat and Power Plants (CHP) was established in 1994/1995 by the Danish Energy Agency. The programme supports the establishing of new CHP plants. The programme collects, evaluates and distributes production and performance data from commercial and semi-commercial/demonstration plants. The data are being controlled, registered and analysed by the general CHP monitoring programme of the Danish Energy Agency. The following institutes participate in the programme and are responsible for the validation and quality of the reported data; Danish Forest and Landscape Research Institute (fuel analyses), the Danish Technological Institute (energy and environmental analyses), dk-TEKNIK ENERGY & ENVIRONMENT (ash analyses), Danish District Heating Association (economy analyses), Danish Utilities ENERGI E2/ELSAM (plant operation data), Lund Institute of Technology (wastewater analyses), RISØ National Laboratory (tar and chemical analyses) and the Technical University of Denmark (process analyses).
The Department of Water and Environmental Engineering participated in the programme based on experiences in toxicity testing of wastewater to be discharged to wastewater treatment plants and biological methods for detoxification of such wastewater. The activities were focused on gasification technologies since tar-water, condensate and other wastewater streams from gasification plants may contain very high concentrations of organic substances and/or substances inhibitory to nitrifying bacteria. (Nitrifving bacteria are vital for the conversions of nitrogen in wastewater treatment plants.) Such wastewater is normally discharged into the municipal sewer network and treated in the local municipal wastewater treatment plant. In Denmark such discharges from industrial sources to municipal wastewater treatment plants are liable to a charge according to the content of organic matter and maximum permissible levels of inhibitory effects have been laid down [1].
The activities within the programme were solely related to problems associated with discharge to the municipal sewer network and comprised three main activities:
Characterisation of inhibitory effects caused by wastewater from gasification plants before and after treatment and from pure substances found in such wastewater.

Session 2 – Waste waterI ________________________________________________________________________________
________________________________________________________________________________
69
Biological degradation of inhibitory substances found in wastewater from gasification plants.
Establishment of discharge permits for wastewater from gasification plants.
The main results are presented in [2] and [3]. The present paper summarises the results.
2 Plants included in the examination
2.1 Gasifiers
The work has especially emphasised characterisation of inhibitory effects caused by wastewater from gasification plants but corresponding wastewater types from other energy producing facilities based on biomass or fossil fuel have been included. The gasification technologies are briefly presented together with a short presentation of the other facilities included in the examination.
Up to 2004 five gasification plants have been in operation in Denmark but only three of them have had longer operational periods and were included in the examination. Two of the plants have been commercially operated, while the last one has been extensively used for research. Further some pilot-plants have been in operation for shorter periods of time but they have not been included in the testing programme up till now. Further inhibition results of wastewater from the gasifier at Chatel-St-Denis (Switzerland) has been included in the examination.
Harboøre CHP plant
In 2000 a complete biomass gasification process system fitted with two gas engines of 1.5 MWel in total was set in operation at Harboøre district heating plant. The plant is based on a traditional German up-draft moving-bed gasifier. Since 1996 the gasification plant has produced all district heating for Harboøre. The final conversion to a CHP plant was completed in late 1999. The operation of the engines has been limited due to the heat consumption of Harboøre and the fact that it is necessary to get rid of the tar-contaminated wastewater by burning in the boiler. The gas cleaning is working but the wastewater from the gas cleaning is limiting the operating hours of the engines.
Høgild CHP plant
In 1994 the French Company Martezo supplied the original down-draft moving-bed gasifier. However it turned out to have so many defects that a complete new gasifier and gas-cleaning system were installed. In 2000 a redesign in order to obtain higher fuel flexibility was finished. The plant was converted from operation with wood blocks into conventional woodchips. The new plant was put in operation and has been in operation for a period for experimental purposes but is now closed down.
Two-stage gasifier at DTU
The gasification group at Technical University of Denmark has constructed and operated a 75 kWthermal two-stage gasification plant mainly for long term testing of the gasifier and for

Session 2 – Waste waterI ________________________________________________________________________________
________________________________________________________________________________
70
testing of essential components in the CHP set-up. A number of short- and long-term testing projects have been performed.
Gasification system at Chatel-St-Denis (Switzerland)
The gasifier system in Chatel-St-Denis (Switzerland) has been developed at the Indian Institute of Science (IISc) in Bangalore (India). The principle is based on an open-top down-draft gasifier.
2.2 Energy producing plants included in the examination
Scrubber water and condensate has been examined at many different Danish and Swedish energy-producing plants. Only a very brief presentation is made as the facilities do not participate in the programme but just deliver samples for the testing programme.
Scrubber water from flue-gas cleaning of incineration of woodchips
Scrubber water from flue-gas cleaning of incineration of woodchips has been examined at three different facilities.
Condensate from drying of woodchips and bark
Condensate from drying of woodchips and bark has been examined at two Swedish facilities. At one plant two examinations have been performed. One examination was performed under normal operation and one at an occasion with drying of bark, where the operation was characterised as less satisfactory.
Condensate from desulphurisation at coal fired power plants
Condensate from desulphurisation at coal fired power plants has been examined at two big Danish power plants. Both plants discharge condensate to the public sewer after internal treatment. The internal treatment comprises gypsum separation and precipitation of heavy metals in a system with pH adjustment, flocculation, sedimentation and sand filtration.
Condensate from power production based on natural gas
Flue-gas condensate from a plant in Sweden is included in the examination. The condensate is discharged to the storm-water system and is then let to the receiving water without any further treatment. Work is in progress in order to use the condensate as water supply for the district heating.
3 Legislation for discharge of wastewater from industry in Denmark
In Denmark and in many other countries in Europe requirements for nitrogen removal from the municipal wastewater treatment plants have been implemented in order to reduce eutrophication of the receiving waters and, especially in streams, in order to reduce fish-toxicity. In addition to the discharge limits, the discharge of organic matter, phosphorus and nitrogen is taxed. Details of the regulation and taxation can be found in [1]. At the point of discharge, the maximum inhibition of nitrification has to be less than 20% for a 5-fold

Session 2 – Waste waterI ________________________________________________________________________________
________________________________________________________________________________
71
dilution of the wastewater. If the inhibition is above 20% but less than 50%, the wastewater can be discharged if the substances causing inhibition can be degraded in the wastewater treatment plant or from a general point of view can be judged as less important. If the inhibition is above 50%, permit to discharge will not be given.
4 Evaluation of toxicity
Inhibition of nitrification is highly critical for the proper function of municipal wastewater treatment plants and different methods for evaluation of the inhibitory effects from industrial effluents have been developed. The ISO standard [4] has been extensively used, but in order to optimise examinations of a greater number of industrial effluents a new test method for inhibition of nitrification has been introduced. The method is a screening method developed in Denmark and Sweden [5] and [6]. The basic principle of the method is that sludge from a municipal wastewater treatment plant, containing nitrifying bacteria, is mixed with a synthetic buffer and nutrient solution. The suspension is mixed with tap water and the wastewater under consideration in proportions, which secure the proper dilution of the wastewater. The mixture is aerated by shaking for 120 minutes, and then the nitrification is stopped by filtration and cooling of the samples. Nitrification inhibition is found by comparing the nitrate production in samples containing wastewater with reference samples without wastewater - See Figure 1. A detailed description of the method can be found in [7].
Figure 1. Schematic description of the screening method for determination of inhibition of nitrification.
Often the examination is performed with a series of dilutions in order to establish a dose-response relationship. The graphical presentation then typically looks like Figure 2.
The test method can be applied for pure substances as well and in such cases the concentration replaces the dilution. As the inhibition is found from the difference between the test sample and the reference, minor negative inhibition may occur if the test sample is without inhibiting substances, due to the uncertainties related to the test. Further some substances are known to stimulate nitrification, which also lead to negative inhibition.

Session 2 – Waste waterI ________________________________________________________________________________
________________________________________________________________________________
72
0.01 0.1 1 10 100Dilution (%)
-20
0
20
40
60
80
100Nitrification inhibition %
Figure 2. Typical dose-response relationship obtained with the screening method. The graph shows inhibition from condensate from the down-draft gasifier at Høgild.
5 Inhibition found in wastewater from four full-scale and pilot-scale gasifiers
The wastewater from the gas-cleaning systems at the full-scale plants in Harboøre (up-draft gasifier), Høgild (down-draft gasifier) and at the experimental plants at DTU, Lyngby (two-stage gasifier) and in Chatel-St-Denis, Switzerland (open-top down-draft gasifier) has been examined. The plant in Harboøre has been extensively tested whereas the examinations at the other plants have been more limited. The examination at Høgild is from a period when the plant was operated with wood blocks before the reconstruction of the plant. Details from the examinations can be found in [2].
The gas-cleaning systems of the plants are very different and in some cases the systems have changed dramatically. The wastewater from the four gasifiers is very different in composition and in toxicity. At some plants samples can be taken from the final effluent of the gas-cleaning system whereas other systems enable sampling inside the process. The different systems for cleaning of the gas and the wash water also differ a lot. Figure 3 shows typical inhibition curves from the wastewater from the gas-cleaning systems from the four gasifiers. The wastewater from the up-draft gasifier at Harboøre and the two-stage gasifier at DTU comes directly from the gas-cleaning systems whereas the wastewater from the down-draft gasifiers has been treated slightly before sampling.
It is seen that wastewater from the up-draft gasifier is about one decade more toxic to nitrifiers than the open top down-draft gasifier, two decades more toxic than the wastewater from the down-draft gasifier and about three decades more toxic than the wastewater from the two-stage gasifier.

Session 2 – Waste waterI ________________________________________________________________________________
________________________________________________________________________________
73
0.001 0.01 0.1 1 10 100
Dilution (%)
-20
0
20
40
60
80
100
Nitrification inhibition %
Up draft Two-stage Downdraft Open down draft Guidelines
Figure 3. Inhibition curves for wastewater from the gas-cleaning system from four different gasifiers together with the Danish guidelines for discharge of industrial wastewater into the public
sewer.
Discharge of the wastewater into the public sewer in Denmark is not possible with an inhibition like this and extensive work has been made to find solutions for the treatment of these wastewater types, especially from the up-draft gasifier at Harboøre. Even the two-stage gasifier needs improvements if discharge to the public sewer shall be accepted.
6 Inhibition of pure substances present in wastewater from gasifiers
The laboratory at Risø has undertaken an extensive work on identification of substances present in the wastewaters from gasifiers. When a substance was identified, a solution of the corresponding pure substance was tested for nitrification inhibition at the laboratory at the Department of Water and Environmental Engineering. The purpose of this part of the examination was to identify especially problematic substances or groups of substances present in wastewater from gasification plants. Table 1 gives the list of substances examined together with typical values for highest concentrations found during the examinations. Table 1 also includes substances that might be formed during thermal cracking of tar-water (e.g. hexamine), substances relevant in the context of some other energy-producing techniques than gasification of woodchips (sulphate, chloride), substances relevant to the method (ammonium, nitrite, nitrate) and a reference substance commonly used for nitrification inhibition (ATU).
In most cases no literature data regarding nitrification inhibition was available.

Session 2 – Waste waterI ________________________________________________________________________________
________________________________________________________________________________
74
Table 1. Pure substances investigated within this study.
Group
Substance “Detected in what wastewater type”
Concentration in wastewater (g/l)
Simple alcohols
Methanol Tar-water up-draft gasifier
3
Ethanol Low
Carboxylic acids
Acetate Tar-water up-draft gasifier
30
Formic acid Tar-water up-draft gasifier
4
Simple phenols
Phenol Tar-water up-draft gasifier
0.85
Sum cresols 0.3
o-Cresol Similar to p-Cresol
m-Cresol Low
p-Cresol Similar to o-Cresol
Methoxy compounds
Guaiacol (2-methoxy-phenol)
Tar-water up-draft gasifier
1
Me-Guaiacol (2-methoxy-4methyl-
phenol)
Tar-water up-draft gasifier
0.5
Anisole -
Dihydroxybenzenes
1,2-dihydroxybenzene (pyrocatechol)
Tar-water up-draft gasifier
0.5
1,2-dihydroxy-4-methyl-benzene
(4-methyl-pyrocatechol)
Tar-water up-draft gasifier
0.2

Session 2 – Waste waterI ________________________________________________________________________________
________________________________________________________________________________
75
Simple aromatic
compounds*
Aldehydes Formaldehyde Low
Acetaldehyde -
Furfural Low
Cinnamic aldehyde
-
Hexamethylentetramine
-
Reference substance
ATU -
Inorganic substances
Ammonium, nitrite and nitrate
Sulphate and Chloride
-
* Inhibition results not reported, low solubility of the compounds in water, make test concentrations questionable.
After identification, attempts were made at finding out whether a substance is likely to contribute to the total inhibition of a specific wastewater by comparison of the inhibitory concentration for a substance (i.e. the inhibition curve) and the concentration of the substance found in the investigated wastewater types.
In some cases, synergistic and antagonistic interactions between the substances identified in wastewater were investigated. Synthetic wastewaters were prepared from pure substances so that the final concentration of each substance corresponded to the concentration in the real tar-water. The synthetic tar-waters were then analysed for nitrification inhibition.
All results of inhibition from pure substances can be found in [2] and Figure 4 shows as examples the inhibition curves for guaiacol, phenol and methanol, which are present in high concentrations in tar-water from up-draft gasifiers.
It is seen that guaiacol and phenol have similar toxicity. The substances are about hundred times more toxic to nitrification than methanol.

Session 2 – Waste waterI ________________________________________________________________________________
________________________________________________________________________________
76
0.0001 0.001 0.01 0.1 1 10Concentration (g/l)
-200
20406080
100Nitrification inhibition (%)
Guaiacol Phenol Methanol
Figure 4. Inhibition of nitrification from guaiacol, phenol and methanol.
7 Toxicity evaluation based on toxicity of the pure substances found in the wastewater
Tar-water contains many different substances potentially toxic to nitrification. Based on the concentration of each potentially inhibitory substance and the inhibition found from the pure substances as described above it is possible to evaluate if the main toxicants have been identified simply by comparing the toxicity from the sample compared to mixtures of the pure substances in the same proportion.
Table 2. Typical concentrations of the most significant toxic components in tar-water from an up-draft gasifier before and after RO/membrane treatment.
Raw tar-water (mg/l) After RO/membrane treatment (mg/l)
Methanol 5200 1500
Acetic and formic acid
28000 600
Phenol 1000 1-10
Guaiacol 1340 < 1
Table 2 shows the typical concentrations of the main components in raw and RO/membrane treated tar-water, and in Figure 5 the inhibition in one sample is compared to the inhibition

Session 2 – Waste waterI ________________________________________________________________________________
________________________________________________________________________________
77
from methanol and phenol that is expected to contribute most to the inhibition. Further the inhibition of a mixture of the same concentrations is shown.
0.001 0.01 0.1 1 10 100Dilution %
-200
20406080
100Nitrification inhibition %
Updraft gasifierRO/membrane
Methanol+PhenolMethanol
PhenolGuidelines
Figure 5. Inhibition curves for raw tar-water and tar-water after RO/membrane treatment together with inhibition from methanol and phenol and a mixture of the same concentration
as found in the sample.
It is seen that the toxicity of the mixture of methanol and phenol is close to the inhibition of the sample but to a minor extent more substances have to contribute to the toxicity.
8 Reduction of inhibition of nitrification from wastewater from the two-stage gasifier at DTU
Nitrification inhibition of condensate from the two-stage gasifier has been extensively studied in order to identify the substances responsible for the inhibition and to find methods for their reduction, as the toxicity is limited but still not directly acceptable for discharge to the public sewer. Details of the examinations can be found in [2]. The main reasons for the inhibition were either poor operation where organic substances were present in the condensate or the high ammonium content in the condensate. Poor operation has to be avoided or the condensate has to be treated in an activated carbon filter as this was demonstrated to remove the toxic organic substances. Ammonium is the substrate for the nitrifying bacteria that convert ammonium into nitrate but at high concentrations and especially at high pH ammonium becomes toxic. Figure 6 shows the inhibition from one sample compared to the toxicity from a sample of potable water spiked with the same ammonium concentration as those found in condensate and with pH adjusted to the same level. It is seen that the ammonium content almost fully can explain the observed inhibition.
The examinations have confirmed that the inhibition of condensate from the two-stage gasifier under good operational conditions or after treatment with activated carbon is attributed mainly to the content of ammonium. As ammonium is one of the substances

Session 2 – Waste waterI ________________________________________________________________________________
________________________________________________________________________________
78
treatment plants have been built for in Denmark, discharge of condensate can be looked upon just as other industrial discharges with high ammonium content. Dilution in the sewer network and in the wastewater treatment plant will easily bring the concentration down to a level that can be treated without problems.
0.001 0.01 0.1 1 10 100
Dilution (%)
-20
0
20
40
60
80
100
Nitrification inhibition %
Condensate Inhibition fromammonium
Guidelines
Figure 6. Inhibition curves for condensate from the two-stage gasifier and from the ammonium concentration in each sample.
9 Reduction of inhibition of nitrification from wastewater from the up-draft gasifier at Harboøre.
9.1 Wastewater composition
The wastewater from the up-draft gasifier at Harboøre is highly toxic and Table 3 shows the typical composition of the tar-water. Many of the constituents in the water contribute significantly to the toxicity.

Session 2 – Waste waterI ________________________________________________________________________________
________________________________________________________________________________
79
Table 3. Typical composition of the tar-water from Harboøre up-draft gasifier [8].
Substance Concentration mg/l
Phenol 800
Guaiacol 1,200
Other Phenols 4,000
Napthalene 0.5
Anthracene/Phenanthrene 0.05
Pyrene/Flouranthene 0.005
Acetic acid 35,000
Formic acid 5,000
Methanol 5,000
TOC 50,000
pH 2.3
In order to reduce the toxicity several methods have been tested; among others:
RO/membrane filtration
Thermal cracking after RO treatment
RO/membrane filtration combined with biological treatment
Tar-Water Cleaning Process (TARWATC)
Supercritical wet oxidation and gasification (SCWO/G).
9.2 RO/membrane filtration
Treatment of tar-water by ultra-filtration in combination with reverse osmosis was tested in Harboøre. After a series of laboratory experiments with different membranes a full-scale plant was commissioned. Under the test run it was experienced that the high phenol content destroyed the membranes and the plant was never put into operation. Many samples were tested after RO/membrane separation in pilot scale and Figure 7 shows the span of the results together with the typical inhibition curve for the untreated wastewater.
It is seen that toxicity is reduced about two decades but that the wastewater still is too toxic for discharge.

Session 2 – Waste waterI ________________________________________________________________________________
________________________________________________________________________________
80
0.001 0.01 0.1 1 10 100Dilution (%)
-200
20406080
100Nitrification inhibition %
Raw tar-waterWorst RO/membrane sample
Best RO/membrane sampleGuidelines
Figure 7. Span of inhibition of tar-water after RO/membrane filtration.
9.3 Reduction of toxicity by thermal cracking of tar-water
Catalytic cracking of the organic compounds in the tar-water from RO/membrane treatment was examined in laboratory scale in order to evaluate the potential for further reduction of the organic substances responsible for inhibition. The temperature was around 750°C and typically Ni was used as catalyst. The process was combined with activated carbon and also activated carbon alone was tested. Figure 8 shows the inhibition results.
0.001 0.01 0.1 1 10 100Dilution (%)
-200
20406080
100Nitrification inhibition %
Raw tar-waterRO
RO+thermalRO+thermal+carbon
RO+carbonGuidelines
Figure 8. Inhibition of nitrification of RO/membrane treated tar-water after thermal cracking and/or with activated carbon treatment.
It is seen that thermal cracking and activated carbon reduces the inhibition with about half a decade but that the toxicity still is too high for discharge into the public sewer.

Session 2 – Waste waterI ________________________________________________________________________________
________________________________________________________________________________
81
9.4 Biological detoxification of tar-water
The need for improved detoxification of tar-water after RO/membrane filtration and the wish to demonstrate that the treated water could be handled at a biological wastewater treatment plant resulted in extensive examinations of the potential for biological detoxification of the RO/membrane treated wastewater. The full examination is described in [1] and [2]. In laboratory-scale experiments it was demonstrated that the organic matter and the toxicity could be dramatically reduced in an aerobic activated sludge process after a short running-in period. The organic matter measured as Chemical Oxygen Demand (COD) could be reduced with about 95% and the toxicity could be reduced to a level where it complies with the Danish guidelines for discharge of industrial wastewater to the public sewer. It was also shown that the dominating part of the identified compounds of the RO/membrane treated tar-water was easily degradable organic substances such as methanol, acetate and formic acid, but phenolic compounds such as phenol, guaiacol and Me-guaiacol were also present in significant concentrations.
Figure 9 shows the inhibition of the raw tar-water, the inhibition after RO/membrane treatment and finally the inhibition after biological detoxification.
0.001 0.01 0.1 1 10 100Dilution (%)
-200
20406080
100Nitrification inhibition %
Raw tar-waterBiologically treatment
RO/membrane treatmentGuidelines
Figure 9. Inhibition of nitrification of the raw tar-water, after RO/membrane treatment and after RO/membrane treatment followed by biological detoxification.
9.5 Reduction of toxicity of tar-water by the Tar-Water Cleaning (TARWATC) process
In early 2001 the Babcock & Wilcox Volund R&D Centre carried out experiments with a novel process for cleaning of tar-water from the gas-cleaning system from gasifiers as the one in Harboøre. The process is based on evaporation followed by oxidation at about 800°C of the concentrate. Pilot-scale experiments showed that the method leads to almost complete destruction of the content of organic matter and that the inhibition disappeared almost completely. The process has since then been established in full-scale at Harboøre.
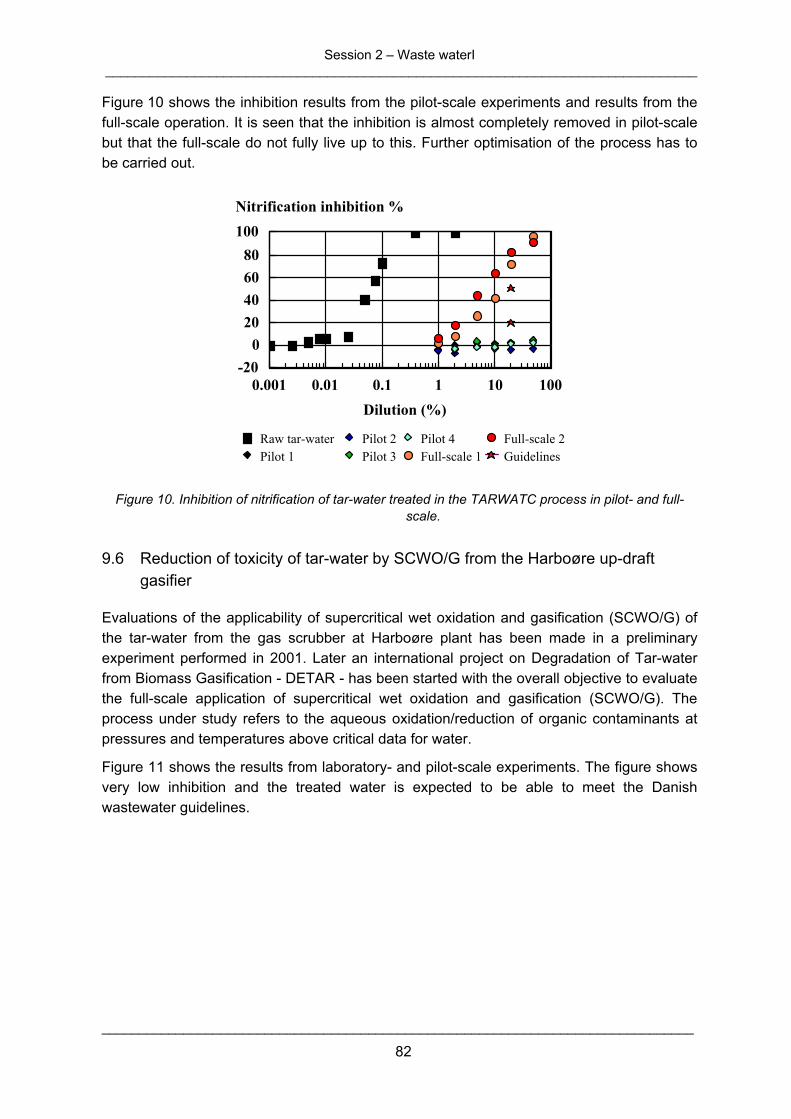
Session 2 – Waste waterI ________________________________________________________________________________
________________________________________________________________________________
82
Figure 10 shows the inhibition results from the pilot-scale experiments and results from the full-scale operation. It is seen that the inhibition is almost completely removed in pilot-scale but that the full-scale do not fully live up to this. Further optimisation of the process has to be carried out.
0.001 0.01 0.1 1 10 100Dilution (%)
-200
20406080
100Nitrification inhibition %
Raw tar-waterPilot 1
Pilot 2Pilot 3
Pilot 4Full-scale 1
Full-scale 2Guidelines
Figure 10. Inhibition of nitrification of tar-water treated in the TARWATC process in pilot- and full-scale.
9.6 Reduction of toxicity of tar-water by SCWO/G from the Harboøre up-draft gasifier
Evaluations of the applicability of supercritical wet oxidation and gasification (SCWO/G) of the tar-water from the gas scrubber at Harboøre plant has been made in a preliminary experiment performed in 2001. Later an international project on Degradation of Tar-water from Biomass Gasification - DETAR - has been started with the overall objective to evaluate the full-scale application of supercritical wet oxidation and gasification (SCWO/G). The process under study refers to the aqueous oxidation/reduction of organic contaminants at pressures and temperatures above critical data for water.
Figure 11 shows the results from laboratory- and pilot-scale experiments. The figure shows very low inhibition and the treated water is expected to be able to meet the Danish wastewater guidelines.

Session 2 – Waste waterI ________________________________________________________________________________
________________________________________________________________________________
83
0.001 0.01 0.1 1 10 100Dilution (%)
-200
20406080
100Nitrification inhibition %
Raw tar-waterSCWO lab
SCWO pilot 1SCWO pilot 2
SCWO pilot 3Guidelines
Figure 11. Inhibition of nitrification of tar-water after SCWO in laboratory and pilot scale.
10 Toxicity present in wastewater from other energy producing facilities
Gasification, incineration and drying of organic biomass for energy production often give rise to wastewater consisting of condensates or scrubber water from the gas-cleaning systems. Often, the most cost-effective way to handle these wastewater types is discharge into the public sewer. This can only be permitted if it can be shown that the effluent will not harm the biological processes at the wastewater treatment plant. As a comparison to wastewater generated from gasification of wood chips, other wastewater types originating from energy production have been tested and evaluated against guidelines for acceptance of discharge of wastewater to public sewers. No attempt at identifying the inhibitory substances in these wastewaters has been made. Neither has any explanations for the measured inhibition been sought. The full examination is described in [2], [7] and [9]. Below the main results from the examination are presented.
0.001 0.01 0.1 1 10 100Dilution (%)
-200
20406080
100Nitrification inhibition %
Up-draftTwo-stage
Incinerationwoodchips 1
Incinerationwoodchips 2
Guidelines
Figure 12. Inhibition of nitrification from scrubber water from flue-gas cleaning from incineration of
wood chips together with inhibition from tar-water and condensate from the two-stage gasifier.

Session 2 – Waste waterI ________________________________________________________________________________
________________________________________________________________________________
84
Figure 12 shows the inhibition of scrubber water from flue-gas cleaning from two district heating plants based on incineration of wood chips together with inhibition from tar-water and condensate from the two-stage gasifier. The same low toxicity is found in all examinations of this type of scrubber water.
Figure 13 shows the inhibition from condensate from drying of bark and wood chips under normal and poor operational conditions together with inhibition from tar-water and condensate from the two-stage gasifier. It is seen that the condensate may vary much in toxicity with significant inhibition under poor operational conditions.
0.001 0.01 0.1 1 10 100Dilution (%)
-200
20406080
100Nitrification inhibition %
Up-draftTwo-stage
Drying, pooroperation
Drying, normaloperation
Guidelines
Figure 13. Inhibition of nitrification from scrubber water originating from drying of bark and wood chips under good and poor operational conditions together with inhibition from tar-water and
condensate from the two-stage gasifier.
0.001 0.01 0.1 1 10 100Dilution (%)
-200
20406080
100Nitrification inhibition %
Up-draftTwo-stage
Coal 1Coal 2
Natural gas Guidelines
Figure 14. Inhibition of nitrification from condensate from desulphurisation of flue-gas at two Danish coal-fired power plants and condensate from the gas-cleaning system from a natural-gas
fired facility together with inhibition from tar-water and condensate from the two-stage gasifier.

Session 2 – Waste waterI ________________________________________________________________________________
________________________________________________________________________________
85
Figure 14 shows the inhibition from condensate from desulphurisation of flue-gas at two Danish coal-fired power plants and condensate from the gas-cleaning system from a natural-gas fired facility together with inhibition from tar-water and condensate from the two-stage gasifier. It is seen that the condensates from the coal-fired plants are similar to the condensate from the two-stage gasifier while the toxicity from the natural-gas facility is much lower.
11 Conclusions
Wastewater from full-scale and experimental-scale gasifiers have shown not to comply with the Danish guidelines for discharge into the public sewer due to too high inhibition level for nitrifying bacteria.
For an experimental facility based on two-stage gasification the problems seem to be an elevated level of ammonium in the condensate, which in practice will cause no problems for discharge.
Tar-water from a full-scale up-draft gasifier was a factor of about tree orders of magnitude too high for discharge into the public sewer and significant reduction in toxicity is needed.
Many different compounds found in the gas-scrubber water from the up-draft gasifier were found to contribute to the toxicity. Simple organic compounds such as acetic acids, formic acid and methanol together with phenol and phenolic substances were the most important contributors to the toxicity.
Several methods have been tested in order to reduce the toxicity of the tar-water to an acceptable level.
The TARWATC process based on evaporation followed by oxidation at about 800°C of the concentrate has been implemented in full-scale.
In pilot scale SCWO has demonstrated to lead to the necessary toxicity destruction.
RO/membrane treatment combined with biological treatment has demonstrated in laboratory scale to lead to sufficient toxicity reduction but membranes that can resist the high phenol content need to be found.
Wastewater from gasification seems in general to be more toxic than wastewater from other more traditional energy-producing systems.
Poor operation of facilities for energy-production from wood might lead to increased toxicity of the wastewater.
12 References
[1] Jansen, J. la C. and Jönsson, K. (2001). Nitrification inhibition of tar-water from wood chips gasifiers. 1st World Conference on Biomass for Energy and Industry. Proceedings of the conference held in Sevilla, Spain, 5-9 June 2000, Vol. II, 1549-1552, Eds. Kyritsis, S., Beenackers, A. A. C. M., Helm, P., Grassi, A. and Chiaramonti, D., James & James Science Ltd.

Session 2 – Waste waterI ________________________________________________________________________________
________________________________________________________________________________
86
[2] Toxicity of wastewater generated from gasification of woodchips, June 2003. Report from the Department of Water and Environmental Engineering, Lund University, to the Danish Energy Agency.
[3] Toxicity testing of wastewater from gasification of woodchips in the up-draft gasifier in Harboøre, August 2005. Report from the Department of Water and Environmental Engineering, Lund University, to the Danish Energy Agency.
[4] ISO 9509 (1989). (E) Method for assessing the inhibition of nitrification of activated sludge-organisms by chemicals and wastewaters. International Standards Organisation.
[5] Arvin, E., Dyreborg, S., Menck, C. and Olsen, J. (1994). A mini-nitrification test for toxicity screening, MINNTOX. Wat. Res. 28(9), 2029-2031.
[6] Swedish EPA (1995). Screening method for estimation of inhibition of nitrification at municipal wastewater treatment plants. (Screeningmetod för bestämning av nitrifikationshämning - vid drift av kommunala avloppsreningsverk). Report No. 4424. (In Swedish)
[7] Jönsson, K. (2001). Inhibition of Nitrification in Municipal Wastewater – Sources, Effects, Evaluation and Remedies. PhD thesis, Lund University. Department of Water and Environmental Engineering. Report TVVA 1006. ISBN 91-7874-127-0.
[8] Egsgaard H. (2005). Afslutningsrapport for Kemiske Analyser. Opfølgningsprogram for decentrale kraftvarmeværker. Forskningscenter Risø Maj 2005.
[9] Jansen, J. la C., Jönsson, K. and Hagman M. (2002) Biological Detoxification of Tar-water. Wat. Sci. Tech., Vol. 46, No 4-5, pp. 59-65.
[10] Jönsson, K. and Jansen, J. la C. Nitrification inhibition of wastewater from biomass-based energy production. (2004). 2nd World Biomass Conference on Biomass for Energy, Industry and Climate Protection. Proceedings of the conference held in Rome, Italy, 10-14 May 2004, Vol. I, 777-780, Eds. Swaaij, W. P. M., Fjällström, T., Helm, P., and Grassi, A., ISBN 88-89407-04-02, ISBN 3-936328-16-7.

Session 2 – Waste waterI ________________________________________________________________________________
________________________________________________________________________________
87

________________________________________________________________________________
88
Session 3 _____________________________________________________________________________________________________
Risk assessment
and permission procedure
Chairman: H. Hofbauer
Contributions:
F. Lettner: Legal basis for placing gasifiers on the market
L. Cusco: Standards, good practice and goal-setting for risk assessment – the UK regulatory perspective
F. Lettner: Overview on risk assessment of gasification plants
H. Timmerer: Explosion parameters and explosion protection
F. Lettner: Required documentation for the permitting procedure – example of the Austrian situation
T. Koch: Experiences of a plant supplier
A. Hofmann: Measures to meet the H+S regulations of the pyroforce gasifier plant
Panel Discussion

________________________________________________________________________________
89

Session 3 – Risk assessment and permission procedure ________________________________________________________________________________
________________________________________________________________________________
90
Legal basis for placing gasifiers on the market
Friedrich Lettner, Helmut Timmerer
Institute of Thermal Engineering, Graz University of Technology, A-8010 Graz, Inffeldgasse 25B
1 Overview
Like all other products/machineries/plants also gasification plants which should be placed on the market have to meet minimum requirements according to several EU-directives and guidelines. In this context this paper should give an overview about some essential guidelines, especially with the focus on mechanical and chemical engineering parts of the plant, which have to be fulfilled by the manufacturer and the operator (employer) before placing on the market or getting into operation with employees working at such a plant.
Therefore products have to meet the requirements, especially determined by following directives/guidelines:
Machinery-Directive 98/37/EC [1]
ATEX Guidelines of the European Union:
Directive 1999/92/EC (ATEX 137) [2] and
Directive 1994/9/EC (ATEX 95) [3]
Pressure Equipment Directive 97/23/EC [4]
+ various others (e.g. Low Voltage Directive 73/23/EC [5], EMC – Guideline 2004/108/EC [6], etc.)
Please pay additional attention to the EU CHP Directive 2004/8/EC dealing with requirements of such plants regarding to minimum efficiencies / necessary reduction potentials in primary energy consumption with regard to the standard energy supply chain – and its consequences to plant dimensioning.
2 Machinery Directive 98/37/EC [1]
2.1 Objectives and scope
The machinery directive applies to all which is defined as “Machinery” or “safety component” and lays down the essential minimum health and safety requirements, defined in Annex I of this directive.
Definition of the term “Machinery“ within this directive:

Session 3 – Risk assessment and permission procedure ________________________________________________________________________________
________________________________________________________________________________
91
an assembly of linked parts or components, at least one of which moves, with the appropriate actuators, control and power circuits, etc., joined together for a specific application, in particular for the processing, treatment, moving or packaging of a material,
an assembly of machines which, in order to achieve the same end, are arranged and controlled so that they function as an integral whole,
interchangeable equipment modifying the function of a machine, which is placed on the market for the purpose of being assembled with a machine or a series of different machines or with a tractor by the operator himself in so far as this equipment is not a spare part or a tool.
Definition of the term “Safety component“ within this directive:
It means a component, provided that it is not interchangeable equipment, which the manufacturer or his authorized representative established in the Community places on the market to fulfill a safety function when in use and the failure or malfunctioning of which endangers the safety or health of exposed persons.
2.2 Declaration of Conformity & CE-marking
Article 2 of this directive says:
Member States shall take all appropriate measures to ensure that machinery or safety components covered by this Directive may be placed on the market and put into service only if they do not endanger the health or safety of persons and, where appropriate, domestic animals or property, when properly installed and maintained and used for their intended purpose.
Article 3 of this directive says:
Machinery and safety components covered by this Directive shall satisfy the essential health and safety requirements set out in Annex I.
‘Interchangeable equipment’, as referred to in the third indent of Article 1(2)(a), must in all cases bear the CE marking and be accompanied by the EC declaration of conformity referred to in Annex II.
Article 5 of this directive defines:
1. Member States shall regard the following as conforming to all the provisions of this Directive, including the procedures for checking the conformity provided for in Chapter II:
machinery bearing the CE marking and accompanied by the EC declaration of conformity referred to in Annex II, point A,
safety components accompanied by the EC declaration of conformity referred to in Annex II, point C.
Gasification plants are in principle an “assembly of machines” and therefore they have to meet the requirements of Annex I
Annex I – Point 1.7.3. says:

Session 3 – Risk assessment and permission procedure ________________________________________________________________________________
________________________________________________________________________________
92
All machinery must be marked legibly and indelibly with the following minimum particulars:
name and address of the manufacturer,
the CE marking (according to Annex III of this directive),
designation of series or type,
serial number, if any,
the year of construction.
Furthermore, where the manufacturer constructs machinery intended for use in a potentially
The EC declaration of conformity referred to in Annex II, point A, has to contain following particulars:
name and address of the manufacturer or his authorized representative established in the Community,
description of the machinery,
all relevant provisions complied with by the machinery,
where appropriate, name and address of the notified body and number of the EC type-examination certificate,
where appropriate, the name and address of the notified body to which the file has been forwarded in accordance with the first indent of Article 8(2)(c),
where appropriate, the name and address of the notified body which has
carried out the verification referred to in the second indent of Article 8(2)(c),
where appropriate, a reference to the harmonized standards,
where appropriate, the national technical standards and specifications used,
identification of the person empowered to sign on behalf of the manufacturer or his authorized representatives.
3 Directive 1999/92/EC (ATEX 137) [2] and 1994/9/EC (ATEX 95) [3]
In principle gasification plants can be treated by the ATEX Directives or the Pressurized Equipment Directive depending on their operating conditions.
ATEX Directives have to be fulfilled when for instance gasification plants are operated at atmospheric conditions. These “atmospheric conditions” are not especially defined within the ATEX Directives but a definition is given by one of the guidelines for the application [7] with a range of surrounding temperature between –20°C and 60°C and a range of pressure between 0,8 bar and 1,1 bar.
All two ATEX Directives lay down minimum standards to “equipment” and “protective systems” on the one hand [3] (directive to the manufacturers) and on the other hand on safety and health protection of workers potentially at risk from explosive atmospheres [2] (directive to the employers)
Session 3 – Risk assessment and permission procedure ________________________________________________________________________________
________________________________________________________________________________
93
3.1 Directive 1994/9/EC (ATEX 95) [3]
Directive ATEX 95 deals in principle with technical explosion protection measures (primary-, secondary- and tertiary measures).
Article 2 defines:
Member States shall take all appropriate measures to ensure that the equipment, protective systems and devices referred to in Article 1 (2) to which this Directive applies may be placed on the market and put into service only if, when properly installed and maintained and used for their intended purpose, they do not endanger the health and safety of persons and, where appropriate, domestic animals or property.
Article 1 defines different Equipment Groups and within group II there are three different categories which are defining the required level of protection and the efforts for CE marking and EC type-examination (see Annex I) as follows:
Equipment Group I (for underground use, mines etc.)
Equipment Group II (for all others)
o Category I – very high level of protection… for use in explosive atmospheres which are present continuously, for long periods or frequently – CE type-examination and CE marking (Annex III) in conjunction with production quality assurance (Annex IV) and product verification (Annex V)
o Category II – high level of protection… for use in explosive atmospheres which likely to occur - CE marking and CE type-examination with conformity of type (Annex VI) or product quality assurance (Annex VII)
o Category III – low level of protection… for use in explosive atmospheres which occur only for short periods or infrequently - CE marking and internal control of production (Annex VIII)
The different Annexes describe the various efforts within the procedure whereby the manufacturer ensures and declares that the products are in conformity of … [see from Annex III to VIII]
3.2 Directive 1999/92/EC (ATEX 137) [2]
Objectives and Scope: define minimum requirements for the safety and health protection of workers potentially at risk from explosive atmospheres…
Therefore an Assessment of risk is essential:
… the employer shall assess the specific risks arising from explosive atmospheres, taking account at least of (see article 4):
the likelihood that explosive atmospheres will occur and their persistence,
the likelihood that ignition sources, including electrostatic discharges, will be present and become active and effective,

Session 3 – Risk assessment and permission procedure ________________________________________________________________________________
________________________________________________________________________________
94
the installations, substances used, processes, and their possible interactions,
the scale of the anticipated effects.
Explosion risks shall be assessed overall.
Places which are or can be connected via openings to places in which explosive atmospheres may occur shall be taken into account in assessing explosion risks.
Article 8 defines the necessary steps toward to the Explosion protection document:
… the employer shall ensure that a document, the “explosion protection document”, is drawn up and kept up to date.
The explosion protection document shall demonstrate in particular:
that the explosion risks have been determined and assessed,
that adequate measures will be taken to attain the aims of this Directive,
those places which have been classified into zones in accordance with Annex I,
those places where the minimum requirements set out in Annex II will apply,
that the workplace and work equipment, including warning devices, are designed, operated and maintained with due regard for safety,
that in accordance with Council Directive 89/655/EEC (1), arrangements have been made for the safe use of work equipment.
The explosion protection document shall be drawn up prior to the commencement of work and be revised when the workplace, work equipment or organization of the work undergoes significant changes, extensions or conversions.
The employer may combine existing explosion risk assessments, documents or other equivalent reports produced under other Community acts.
4 Pressurized Equipment Directive 97/23/EC [4]
For Gasification plants working at a pressure higher than 0,5 bar the Pressurized Equipment Directive (PED) [4] has to be concerned in the design, manufacturing and the conformity assessment procedure of the pressurized equipment and its assemblies. Similar to the ATEX 95 but going much more into detail it defines the conformity procedures, approval of materials etc.
Due to the fact that most of small and medium scale gasification plants, which are covered by this conference, will not be designed pressurized, the paper will not go into detail with PED.
5 Conclusions
Within the European Union several Directives and Guidelines have to be considered for the placement of products on the market. All of this directives define in principle minimum

Session 3 – Risk assessment and permission procedure ________________________________________________________________________________
________________________________________________________________________________
95
standards for safety and health of such products when they are used by operators/employees or consumers.
With regard to gasification plants the most important directive to be considered is the Machinery directive which lays down the essential minimum health and safety requirements for such assembled machineries and defines the procedure for the EC declaration of conformity and the CE marking.
Depending on the operating conditions gasification plants manufacturers have to consider ATEX 95 or Pressurized Equipment Directive which lay down additional requirements to health and safety especially for the use in explosive atmospheres or at higher operating pressures as well as additional requirements in the EC-conformity procedure and CE marking.
Moreover the employer has to consider ATEX 137 which defines minimum requirements for the safety and health protection of workers potentially at risk from explosive atmospheres. According to this Directive the employer has to prepare the Explosion protection document which is principally regulated in ATEX 137 but in detail regulated by national laws.
6 Literature
[1] The European Parliament and the Council of the European Union, DIRECTIVE 98/37/EC OF THE EUROPEAN PARLIAMENT AND OF THE COUNCIL of 22 June 1998 on the approximation of the laws of the Member States relating to machinery. 1998.
[2] The European Parliament and the Council of the European Union, DIRECTIVE 1999/92/EC OF THE EUROPEAN PARLIAMENT AND OF THE COUNCIL of 16 December 1999 on minimum requirements for improving the safety and health protection of workers potentially at risk from explosive atmospheres (15th individual Directive within the meaning of Article 16(1) of Directive 89/391/EEC). 1999.
[3] The European Parliament and the Council of the European Union, DIRECTIVE 94/9/EC OF THE EUROPEAN PARLIAMENT AND THE COUNCIL of 23 March 1994 on the approximation of the laws of the Member States concerning equipment and protective systems intended for use in potentially explosive atmospheres. 1994.
[4] The European Parliament and the Council of the European Union, DIRECTIVE 97/23/EC OF THE EUROPEAN PARLIAMENT AND OF THE COUNCIL of 29 May 1997 on the approximation of the laws of the Member States concerning pressure equipment. 1997.
[5] The European Parliament and the Council of the European Union, Council Directive 73/23/EEC of 19 February 1973 on the harmonization of the laws of Member States relating to electrical equipment designed for use within certain voltage limits. 1973.
[6] The European Parliament and the Council of the European Union, DIRECTIVE 2004/108/EC OF THE EUROPEAN PARLIAMENT AND OF THE COUNCIL of 15 December 2004 on the approximation of the laws of the Member States relating to electromagnetic compatibility and repealing Directive 89/336/EEC. 2004.

Session 3 – Risk assessment and permission procedure ________________________________________________________________________________
________________________________________________________________________________
96
[7] European Commission, GUIDELINES ON THE APPLICATION OF COUNCIL DIRECTIVE 94/9/EC OF 23 MARCH 1994 ON THE APPROXIMATION OF THE LAWS OF THE MEMBER STATES CONCERNING EQUIPMENT AND PROTECTIVE SYSTEMS INTENDED FOR USE IN POTENTIALLY EXPLOSIVE ATMOSPHERES, download from http://europa.eu.int/comm/enterprise/atex. July 2005.

Session 3 – Risk assessment and permission procedure ________________________________________________________________________________
________________________________________________________________________________
97

Session 3 – Risk assessment and permission procedure ________________________________________________________________________________
________________________________________________________________________________
98
Standards, Good Practice and Goal-setting – the UK Regulatory Perspective
Dr Laurence Cusco
Health and Safety Laboratory Harpur Hill, Buxton, Derbyshire, SK17 9JN, United Kingdom
1 Introduction
This article is drawn closely from the presentation made at the workshop and is therefore in the ‘style’ of a presentation rather than an original journal article. It gives an overview of the general risk assessment process, focussing particularly on how safety aspects would be expected to be approached from a UK regulatory perspective.
2 UK Regulators
In the UK, the relevant regulators with some their responsibilities are:
1. Health and Safety Executive: risk assessment, risk reduction policy, guidance, inspection, ATEX directive, pressure equipment directive …
2. Environment Agency and Scottish Environmental Protection Agency: environmental impact assessment, integrated pollution prevention and control
3. Local authorities: planning permission
It may also be of interest to some that the UK Department of Trade and Industry operates some programs to support sustainable and efficient energy production.
3 Types of risk assessment
Safety risk and health risk are different:
Safety risk is based on events
Health risk is based on exposure (concentration and time)
Risk assessment should take account of both:
Severity / consequence
Probability / likelihood / frequency
The risk assessment process may be represented as in Figure 1.

Session 3 – Risk assessment and permission procedure ________________________________________________________________________________
________________________________________________________________________________
99
Hazard Identification
Risk Evaluation
Risk Estimation
Risk Reduction
RiskOK? END
Hazards?New
YES
NO
YES
NO
Hazard Identification
Risk Evaluation
Risk Estimation
Risk Reduction
RiskOK? END
Hazards?New
YES
NO
YES
NO
Figure 1: Outline Risk Assessment decision-making flow chart
The fundamental questions to be answered in risk assessment have been summarised succinctly as: what, how bad, how often, and so what? These represent:
1. What? Hazard identification
2. How bad? Severity
3. How often? Frequency
4. So what? Risk assessment
Useful information on many technical aspects needed for risk assessment in the process industries is available in standard reference texts [1].
4 Hazard Identification
The value of subsequent activities in the risk assessment process is dependent on the thoroughness of the hazard identification step. This should be a team-based ‘brainstorming’ activity. It is often useful to get suggestions from outside the immediate design team.
However, it is important to use a structured approach so that it aspects are not missed. Options for this include:
Hazard and operability study (HAZOP),
Failure mode effect analysis (FMEA),

Session 3 – Risk assessment and permission procedure ________________________________________________________________________________
________________________________________________________________________________
100
‘What if’ studies
Top down – from final consequences
Bottom up – from initial causes
A widely used hazard identification study is based on that developed by ICI [2]. This was originally a six stage hazard identification study. An extra step has later often been added to cover decommissioning.
1. Inherent safety of concept design
2. Top down study using keywords at design flowsheet stage
3. Hazop of piping and instrumentation diagram
4. Check actions complete before commissioning
5. Inspect plant before commissioning
6. Follow up when plant operating
7. Decommissioning
5 Severity
Severity describes the number and level of injury and the number of fatalities where relevant. To evaluate severity, the harm criteria must be selected, e.g. lethal dose 50 (LD50), immediate danger to life and health (IDLH), injury or illness.
Housing
SiteMotorway
school Hospital
River
Figure 2: Schematic of a hypothetical hazard range

Session 3 – Risk assessment and permission procedure ________________________________________________________________________________
________________________________________________________________________________
101
Consideration must be made of the specific location – the relative distance from hazards to people or domino effects such as fire effects on other pressure vessels. Software codes are commercially available that can be used in consequence modelling of this sort e.g. DNV PHAST, Shell FRED.
Evaluation may be needed of:
Gas dispersion
Toxicology
Thermal effects
Explosion blast
6 Frequency
Frequency is usually more difficult to quantify than severity. Not only hardware technical failure rates are needed, but also there will be human factors and operational errors to be taken into account. Industry accident history can provide useful overall data. Another approach is to use fault trees to calculate the likely frequency of a loss of containment from the individual components. Failure rate databases are available that include data on: unit failures (pumps, compressors etc), pressure vessel integrity, piping and flange failures and so on.
7 Proportionate risk assessment
The three main options, in increasing level of rigour are:
Qualitative (Q)
Semi-quantitative (SQ)
Quantified (QRA)
Qualitative risk assessments represent severity and frequency in words e.g. high, medium low. Semi-quantitiative risk assessments represent severity and frequency as scores or in terms of numerical range e.g. frequency could be between 10-5 and 10-4 chances per year and consequence could be a major injury. Quantified risk assessments (QRA) include full quantification of both severity and frequency and often uses plots of risk contours.
A guide to choice of appropriate proportionality is presented in the Figure 3.

Session 3 – Risk assessment and permission procedure ________________________________________________________________________________
________________________________________________________________________________
102
Proportionate risk assessment
Intolerable
ALARP region
QQQ Q
Intolerable
ALARP region
Broadly acceptable
QRA
SQ
Q
Figure 3: Proportionality in risk assessment detail
8 Risk matrices
Risk matrices as a very useful tool in risk assessment. An example is given in Figure 4 where the intolerable area is shown in red, the broadly acceptable area is in green and the intermediate ALARP region in is yellow. Specific accident scenarios can then be place on the matrix. This enables decisions to be made on where further effort is best concentrated.

Session 3 – Risk assessment and permission procedure ________________________________________________________________________________
________________________________________________________________________________
103
Severity
Freq.1 2 3 4 5
4
3
2
1
5*A
*B*C
*D
*E
*F*G
*H
*I
*J
*K
Figure 4: A typical risk matrix
9 Tolerability of risk
A summary of the UK tolerability of risk data is given in HSE’s publication ‘Reducing risks protecting people’ [3].
Figure 5: Tolerability of risk

Session 3 – Risk assessment and permission procedure ________________________________________________________________________________
________________________________________________________________________________
104
Figures are given for boundaries of the tolerability of individual risk to both workers and to members of the public. There is also some more restricted data on tolerability of societal risk. There is a difference between individual risk and societal risk as there is aversion to certain types of event e.g. multiple fatality events and dread of certain accidents where cause is beyond immediate perceived control.
10 Good practice
Source of ‘good practice’ include:
Approved codes of practice
Standards
CEN, CENELEC, ISO, IEC, national standards
HSE guidance
Other government departments
Trade associations
Professional institutions
‘Good practice’ changes with time as knowledge about hazards improves or risk acceptability criteria develop. There are particular challenges for industrial duty-holders and regulators in emerging areas of technology where ‘good practice’ is not yet well defined.
11 ALARP concept
The UK has long pioneered the ‘goal-setting’ approach in risk assessment – this concept is rather different to regulatory regimes in some other countries. Between the intolerable and generally acceptable regions, there is a need to demonstrate risks are as low as reasonably practicable (ALARP). The ALARP concept is fundamental to the UK regulatory approach and has a legal basis [4].
The balance in cost benefit analysis must be weighted towards health and safety improvement unless there is ‘gross disproportion’. The approximate environmental equivalent of ALARP is: best available technology not entailing excessive cost (BATNEEC).
12 Risk Reduction Measures
Some examples of possible risk reduction measures that may be the outcome of ALARP considerations include:
Laboratory characterisation of explosion characteristics
Install explosion vents
Ignition prevention
Gas detectors

Session 3 – Risk assessment and permission procedure ________________________________________________________________________________
________________________________________________________________________________
105
Improve safety integrity level of electronic control
Automatic emergency shut down (ESD) systems
Control room building structure
Remote operation
Higher specification local extract ventilation & filters
More maintenance effort
Training of operators
This list is not exhaustive and the particular measures will depend on the specific circumstances and design.
13 Conclusions
Undertake a proportionate risk assessment.
Follow good practice precautions e.g. guidance, codes of practice and standards where available.
Demonstrate risks are as low as reasonably practicable by considering what else you could do and justify why you have not done more for the high risk scenarios.
Document what is done and have a safety management system so reality matches theory.
14 References
[1] Mannan S (Ed.) 2005 Lee’s Loss Prevention in the Process Industries 3rd Edition Elsevier, Oxford UK.
[2] Crawley F and Tyler B 2003. Hazard Identification Methods, Institution of Chemical Engineers Publishing, Rugby UK.
[3] Health and Safety Executive 2001. Reducing risks protecting people: HSE’s decision making process, HSE books, Norwich UK. Also available at: http://www.hse.gov.uk/risk
[4] Edwards vs National Coal Board 1949. 1 KB 704.

Session 3 – Risk assessment and permission procedure ________________________________________________________________________________
________________________________________________________________________________
106
Overview on risk assessment of biomass gasification plants
Helmut Timmerer, Friedrich Lettner
Institute of Thermal Engineering, Graz University of Technology, A-8010 Graz, Inffeldgasse 25B
1 Biomass gasification and the need of a risk assessment
Biomass gasification gives the opportunity for a combined heat and power production by operating a thermo-chemical driven gas generating process as a part of a process chain, which has to be equipped with an adequate gas cooling, gas cleaning and gas utilization system. The thermo-chemical conversion process gives the main advantage to convert the stored energy from solid biomass to a secondary gaseous fuel, which can be utilized with higher electrical efficiencies e.g. in IC engines for small scale systems than comparable systems based on biomass combustion.
The properties of the produced/treated and converted gaseous secondary fuel with its toxicity, hot plant utilities, burnable explosive gas mixtures, etc. as well as the plant with its mechanical components, reactors and aggregates causes a number of risks, which have to be considered in a detailed risk analysis with enclosed risk assessment procedure to provide a technology which is stable and safe in operation. The systematic risk assessment is required in general from authorization frame, without any restrictions on the used technology.
For example a detailed risk analysis is required in the following:
Machinery Directive [3]
Pressurized Equipment Directive – pressure resistant or pressure shock resistant dimensioning based on long time experiences – risk assessment also necessary [4]
ATEX – dimensioning on basis of remaining risk and dangers at the plant [1], [2]
Providing a technological documentation of the risk assessment is not only required by the directives as mentioned above – for the placing a product/machinery into the market it also protects the manufacturer/employees/operators in principle from negligent prosecutions when an extensive risks assessment has been done using the last standard of development in this context and e.g. an accident which was not taken into account at the risk assessment in spite of well developed, argued and documented risk assessment.
The procedure of risk assessment is not generally standardized and is only supported by a huge amount of case studies from different other branches of the industry (e.g. food industry, chemical industry, metal industry, etc.). These given examples can only give guidance for finding a systematic and have to be modified for the application of biomass gasification plants.

Session 3 – Risk assessment and permission procedure ________________________________________________________________________________
________________________________________________________________________________
107
2 Risk assessment – Systematic and Approach
Risk identification and assessment is a very extensive work and needs to be aware about the process, its behaviour and to be aware about the risk assessment methodology [6], [7].
In a part of an Austrian project these topics where treated to give first steps to a possible risk assessment procedure.
Figure 1 gives an overview of principles and the systematic in general for the possible risk assessment approach, which was chosen in the Austrian project.
Technology
Description and Classification
Risk
identification
Risk assessment
Ris
k
char
acte
rizat
ion
Estimation of concentrations /
effects
Estimation on exposure
Risk minimization / Safety concept
Figure 1: Systematic of a risk assessment procedure [8]
The risk assessment is based on the systematic of a detailed technology description and classification of the plant concept. The next step further in the procedure is to prepare a risk identification, which means to identify potential risks as well as to do estimations on exposure in combination with estimation of concentrations and their effects. This gives the initial conditions for risk assessment itself. All detected risks within the risk assessment have to be minimized to an acceptable level. This procedure should not be taken as a straight forward process - interaction and loops between the different steps are allowed and necessary for including all the certainties and possibilities before going further steps of the development.
2.1 Technology Description and Classification
An accurate and suitable technology description and classification is fundamental for the assessment of the risk which covers all the possible risks and plant operation details. Figure 2 presents a typical process configuration of a gasification plant. For detailed analysis of risks and dangers it is helpful to subdivide the process chain into different plant sections, where operation modes, temperatures, pressures, used and treated plant utilities can be easier defined. Interfaces between the process sections have to be defined for an overall analysis and assessment in a second step to combine the different analyses of risks and risk consequences from the different process sections.

Session 3 – Risk assessment and permission procedure ________________________________________________________________________________
________________________________________________________________________________
108
Gasifier Gas cooling & Gas cleaning
Gas-
utilisation
- fixed bed gasi-fication
- fluidized bed
- gasification utilities (water vapour,
air, additives)
- gasification boundaries
(pressurised, atmospheric)
- cyclone
- bag house
- filtering
- wet dedusting/ cleaning
- residues treatment
- etc.
- gas engine
- gas turbine
- micro gas turbine
- synthetic fuel applications
- etc.
Fuel supply/ storage
- biomass storage
- utilities storage
- intermediate storage of gasification residues
- conveying technology
- input units or rotary valves, vibroconveyor etc.
Process Automation System
exem
plar
ily c
onfig
urat
ion
Figure 2: Typical process configuration of a gasification plant, [5], [8]
The red framed area in the figure above gives an example of a possible plant configuration. Based on such exemplary configurations the used aggregates, electrical drives, reactors, etc. are investigated within a detailed analysis to define the operation mode of the plant sections. A template with an exemplarily layout for such a technology description and classification beyond the generally systematic is shown at Figure 3.
In the left hand side column the plant sections with their components have to be defined. In columns of the data field an identification number as well as the wanted information have to be filled in. This format of a detail description allows to search within a clearly arranged data collection for potential risks for the next step of the procedure (see chapter 2.2) – e.g. parts or section of plant were high temperatures are expected.

Session 3 – Risk assessment and permission procedure ________________________________________________________________________________
________________________________________________________________________________
109
identification nr. temperature range pressure range
gaseous liquid solid from - up to from - up to
1 Fuel storage and fuel feedinge.g. vibro conveyor FEED/01/10 --- --- biomass; 60 kg/hr 20-100°C ---
…
2 Fuel and additive input
e.g. rotating valve FUEL/02/05
pyrolysis gas form gas escapes lubricants biomass; 60 kg/hr 20-500 +/- 100 mbar
…
3 Gas generator
e.g. fixed bed gasifier GAS/03/02wood gas, pyrolysis gas --- biomass, ash, char 20-1200°C +/- 100 mbar
…
4 Gasifier surroundinge.g. gasifier air supply GASS/04/01 air, wood gas lubricants --- 20-150°C 0-100 mbar
…
5 Gas cooling e.g. heat exchanger HEA/05/05 wood gas water dust 50-600°C +/- 100 mbar
…
6 Gas cleaninge.g. dry dedusting - jet tube filter GCL/06/05 wood gas dust 100-250°C +/- 100 mbar
…
7 Gas utilisation / flare gase.g. gas mixer / intake system GUT/07/08 wood gas, air condensables dusts 20-120°C +/- 100 mbar
…
8 Process automatione.g. electrical moved valves PAS/08/09 air, wood gas --- --- 20-200°C ---
…
description of utilities
TECHNOLOGY DESCRIPTION AND CLASSIFICATION
1
Figure 3: Template for a technology description and classification [8]
2.2 Risk Characterisation
The next step in the procedure of risk assessment is the risk identification as mentioned in Figure 1. Relating to expected dangers in different plant sections a huge variety of the risks and risk consequences can occurs, which makes the risk identification difficult without any examples and case studies. It is necessary to differentiate into risks and their consequences to argue on a more clearly way when discussing, implementing and documenting safety measures. In cooperation with agents of the permitting authorities, plant manufacturers and scientific institutes a list of possible risks was collected for giving a checklist – the list in the current configuration has to be adapted and completed with regard to the actual plant design. Potential risks of gasification plant could be [8]:
leakages (gas escapes, air intake, leakages steam system, leakages in water caring systems) temperatures out of normal operation areas),
pressure fluctuations,
mechanic failures (mechanical strength, thermal strength, wear-out, blocking, failure on seals, corrosion, icing),
hot surfaces,
sensor failures,
failures of electrical drives,

Session 3 – Risk assessment and permission procedure ________________________________________________________________________________
________________________________________________________________________________
110
failures of electrical plant steering and control,
failures of electric supply,
harmful plant utilities on human health during normal operation, measurements, scheduled maintenance,
harmful emissions from parts of the gasification plant (exhaust gas, washing utilities, solid residues),
varying operating conditions (start up, shut down, changes on power load, emergency case shut down),
forces of nature (floods, stroke of lightning, storm/thunderstorm),
…
These potential risks cause dangerous effects/situations when occurring during the plants operation and cause therefore different consequences. The effects from these risk consequences have to be minimized by developing safety procedures to keep off damages on human life, environment and the plant itself. The following risk consequences have to be considered and analysed on the frequency of their occurrence [8]:
explosion,
fire,
danger from electricity,
poisoning,
danger to health,
harms to persons (burn, scald, etc.),
irritation (skin, mucous membrane),
mechanic failure,
noise pollution, ototoxic effects,
immission,
emergency stop gas engine,
failure in combustion system,
failure flare / emergency case gas utilisation,
failure/malfunction of the automation system,
…
Analogue to the template of the technology description and classification additional columns at the datasheets were added to include the investigations of the risk characterization - see Figure 4.

Session 3 – Risk assessment and permission procedure ________________________________________________________________________________
________________________________________________________________________________
111
identification nr. … Risk Risk Estimation of Estimation ofconsequence exposure concentrations/effects
1 Fuel storage and fuel feedinge.g. vibro conveyor FEED/01/10 jam one´s finger Heavy injurance minimum after Heavy injurance
… during check/maint. … instruction…
2 Fuel and additive input
e.g. rotating valve FUEL/02/05 blocking Shut down of the plant 10% -… valve-leackage gas e-/immission 10% (gas warning low (gas warning, ventilation)
… Injurance during check device) low (manual, instruction)3 Gas generator
e.g. fixed bed gasifier GAS/03/02 Temperatur high material problems min. min. (action automation system)… Bridging gas quality loss, maybe min. min. (automated grate movement and
… dangerous regarding explosion temperature control)4 Gasifier surrounding
e.g. gasifier air supply GASS/04/01 malfunction of the Temperatur increase, min. min. (control circuit and auto-… frequency generator of the fan slight overpressure in the gasifier - mated reset and close of the main valve)
… gas emission5 Gas cooling
e.g. heat exchanger HEA/05/05 outlet temperatur too high demage of the bag house min. (second cooler) burning of the bag house… ..
6 Gas cleaninge.g. dry dedusting - bag house filter GCL/06/05 leak apparatous explosive gas mixture min. (construction de min. (O2 detection and action)
… temperature high demage of filter materials min. burn off, but warning and shut down… before
7 Gas utilisation / flare gase.g. gas mixer / intake system GUT/07/08 blocking, malfunction engine min. automated emergency flare
… … gas emission min. min. (gas warning device, maintenance)
8 Process automatione.g. electrical moved valves PAS/08/09 blocking maybe dangerous plant operationmin (essential parts min. (maintenance intervalls)
… … are designed with more power than theoretically needed)
Figure 4: Risk characterisation [8]
The columns of the table give information about the different plant sections. The assessment is prepared on the estimation of exposure, expected concentrations and possible effects from risks.
2.3 Risk Assessment – Risk minimization
The final steps of the procedure are the risks assessment itself and the risk minimization by involving all available information from the previous steps. The result from the assessment shows the existing risks with valuated effects in detail and allows to make a decisions whether a present risk is acceptable or not and to ask for requirements, which are necessary for eliminating dangers from different effects from risks. The assessment has to be carried out in the context of dependencies in the field of the used technology and their risks regarding health, safety and environment as shown in Figure 5.
TECHNOLOGY TECHNOLOGY DESCRIPTIONS & DESCRIPTIONS & CLASSIFICATIONCLASSIFICATION
HEALTHHEALTH
SAFETYSAFETY ENVIRONMENTENVIRONMENT
e.g. fixed bed gasifier
gasifier casing
ash emptying
air supply
Exemplarily possible crossing pointsD&C < > HSE
RISKS ON …
…
Figure 5: Technology – Risk Matrix [8]

Session 3 – Risk assessment and permission procedure ________________________________________________________________________________
________________________________________________________________________________
112
The aim of the risk assessment is to get knowledge about effects on human life, environment and damages to the plant site. The precautions itself have to be embedded into the investigation/assessment in a separate loop to be aware of interactions and influences from the added design features and safety components in the further development of the plants safety concept. Especially secondary risks have to be considered because of difficult boundary conditions of the biomass gasification process (polluted producer gas, corrosive and erosive plant utilities etc.) – to give an example: safety components, safety design features etc. may not work durable successful, to fulfil the allocated functions – in a worst case these activities could bring additional risk to the system!
3 Conclusions
For the technical application of biomass gasification risk assessment is a very extensive topic because of the need of a huge amount of information from the plant, plant concept and different operation modes etc., which have to be prepared before starting risk assessment. Based on the experiences of an Austrian project the following points have to be taken into consideration at the risk assessment procedure.
description and classification of the used technology,
definition of a pool of certainties and possible risks in operation of gasification plants,
risks characterisation and identification,
analyses and combination of risks/risks consequences with regard to used technology,
tabulated analysis of possible risks/possible reasons/ etc.,
upgrading/updating of the systematic,
support of the systematic by case studies (see for e.g. BGR 104).
Essential for the comprehensible risk assessment documentation is a clearly defined range of analysis. To support this, templates were arranged for an accelerated preparation of the risk assessment, giving examples and a case study for a possible way. Moreover it should be aspired in the near future to prepare a general risk assessment tool for manufacturers and employers (operators) which should also go further in development by including procedures from common, professional risk assessment approaches.
4 References
[1] Richtlinie 1994/9/EG des europäischen Parlaments und des Rates vom 23. März 1994 zur Angleichung der Rechtsvorschriften und Verwaltungsvorschriften der Mitgliedsstaaten für Geräte und Schutzsystem zur bestimmungsgemäßen Verwendung im explosionsgeschützten Bereich – ATEX 95

Session 3 – Risk assessment and permission procedure ________________________________________________________________________________
________________________________________________________________________________
113
[2] RICHTLINIE 1999/92/EG DES EUROPÄISCHEN PARLAMENTS UND DES RATES vom 16. Dezember 1999 über Mindestvorschriften zur Verbesserung des Gesundheitsschutzes und der Sicherheit der Arbeitnehmer, die durch explosionsfähige Atmosphären gefährdet werden können (Fünfzehnte Einzelrichtlinie im Sinne von Artikel 16 Absatz 1 der Richtlinie 89/391/EWG) - ATEX 137
[3] Directive 98/37/EC of the European Parliament and of the Council of 22 June 1998 on the approximation of the laws of the Member States relating to machinery (OJ L 207, 23.7.1998, p. 1)
[4] Druckgeräterichtlinie 1997: Richtlinie 1997/23/EG des europäischen Parlaments und des Rates vom 29. Mai 1997 zur Angleichung der Rechtsvorschriften und Verwaltungsvorschriften der Mitgliedsstaaten über Druckgeräte
[5] Lettner F., Timmerer H., Wallner C.: Explosion risks in biomass gasification plants, Institute of Thermal Engineering, Paper and Poster presented at 2nd World Conference on Biomass for Energy, Industry and Climate Protection, Rome, 2004
[6] DIN EN 1050: Sicherheit von Maschinen – Leitsätze zur Risikobeurteilung, 1996
[7] DIN IEC 56(Sec)410: Analyse des Risikos technischer Systeme – Leitfaden (IEC 56(Sec)410:1994), 1995
[8] Lettner F., Timmerer H.: Leitfaden – Anlagensicherheit und Genehmigung von Biomassevergasungsanlagen, Projektendbericht, Institut für Wärmetechnik, TU Graz, 2005

Session 3 – Risk assessment and permission procedure ________________________________________________________________________________
________________________________________________________________________________
114
Explosion parameters and Explosion Protection in Biomass Gasification plants
Helmut Timmerer, Friedrich Lettner
Institute of Thermal Engineering, Graz University of Technology, A-8010 Graz, Inffeldgasse 25B
1 Requirements on Explosion protection systems at Biomass Gasification Plants
Biomass gasification serves a possibility for an efficient conversion process for supplying combined heat and power in small scale systems by producing a burnable wood gas mixture from solid biomass. By utilizing such a burnable gas e.g. with IC- engines a high total electrical efficiency can be reached. The composition of the producer gas mixture depends on the used gasification system. In principle gasification systems can be classified by the
used gasification agent (air-blown, steam-blown)
internal energy management of the gas generator/gasifier (allothermal or autothermal)
heating value of the producer gas due to different contents of flammable (H2, CO, CH4, etc.) and not flammable/inert (N2, H2O and CO2) components
dusts and burnable hydrocarbons in the shape of fly ash, vapours, aerosols or in condensed face (e.g. at the surface of dusts, at apparatus surfaces)
A fully assessment of dangers/risks from the burnable gas atmosphere requires information on explosion characteristics of possible gas/oxidizer mixtures in and around the plant, caused by leakages, failures of rotary valves, damages of pipes, casings etc. - therefore a data pool must be available for:
flammability limits (upper flammability limit and lower flammability limit, critical oxygen threshold limiting value)
maximum explosion pressure for different producer gas compositions referring to different operation modes of the plant (start up, shut down, normal operation, emergency shut down)
maximum temporal increase of explosion pressure as an indicator for the violence of a happening explosion event
self-ignition temperatures of possible gas mixtures etc.
data from risk assessment about the risk of malfunction of a safety component and its consequences etc.

Session 3 – Risk assessment and permission procedure ________________________________________________________________________________
________________________________________________________________________________
115
The explosion characteristics are influenced by a huge variety of different boundary conditions inside and around the plant. Especially the number of gas components (burnable, not burnable) with its different characteristics, different temperatures and pressures over the plant profile, influence of tracer compounds and the interaction with dusts, tary compounds and apparatuses geometry etc. makes estimations and basic calculations nearly impossible (because of not fully investigated behaviour and interaction of different compounds until now). Without any detailed information there are in general possibilities for selecting/determining explosion characteristics for the application. Explosion parameters could be taken:
from the most critical component in the gas regarding to the wanted explosion parameter (e.g. flammability – hydrogen, explosion pressure – methane etc.),
explosion tests,
by using valid calculation models.
The first possibility gives very strict values but on the safe side for explosion parameters, which could be obstructive, when meeting targets for safe and economical design. The second possibility gives exact figures for typical gas compositions. Monitoring of the plant operation shows, that fluctuations in gas compositions can be observed, which involves divergent numbers for explosion parameters – because of high costs for explosion tests it does not make sense to do lots of explosion tests. Simplified calculation models are helpful in that case, to fill the gaps of information between tested and well known points for actual explosion parameters of different gas compositions. For the application of wood gas existing calculation models have to be modified and new approaches have to be found, because of not transferable initial boundary conditions of the models which are used e.g. for the determination of explosion parameters for natural gas.
Fluidized bed gasification – steam blown Fixed bed gasification – air blown
23
1138
197 2
Kohlenmonoxid CO [Vol.-%] Methan CH4 [Vol.-%]
Wasserstoff H2 [Vol.-%] Kohlendioxid CO2 [Vol.-%]
Wasserdampf H2O [Vol.-%] Stickstoff N2 [Vol.-%]
carbon monoxide [Vol.-%]
hydrogen [Vol.-%]
water vapor [Vol.-%]
methane [Vol.-%]
carbon dioxide [Vol.-%]
nitrogen [Vol.-%]
23
1138
197 2
Kohlenmonoxid CO [Vol.-%] Methan CH4 [Vol.-%]
Wasserstoff H2 [Vol.-%] Kohlendioxid CO2 [Vol.-%]
Wasserdampf H2O [Vol.-%] Stickstoff N2 [Vol.-%]
carbon monoxide [Vol.-%]
hydrogen [Vol.-%]
water vapor [Vol.-%]
methane [Vol.-%]
carbon dioxide [Vol.-%]
nitrogen [Vol.-%]
17 214
162
49
Kohlenmonoxid CO [Vol.-%] Methan CH4 [Vol.-%]
Wasserstoff H2 [Vol.-%] Kohlendioxid CO2 [Vol.-%]
Wasserdampf H2O [Vol.-%] Stickstoff N2 [Vol.-%]
carbon monoxide [Vol.-%]
hydrogen [Vol.-%]
water vapor [Vol.-%]
methane [Vol.-%]
carbon dioxide [Vol.-%]
nitrogen [Vol.-%]
17 214
162
49
Kohlenmonoxid CO [Vol.-%] Methan CH4 [Vol.-%]
Wasserstoff H2 [Vol.-%] Kohlendioxid CO2 [Vol.-%]
Wasserdampf H2O [Vol.-%] Stickstoff N2 [Vol.-%]
carbon monoxide [Vol.-%]
hydrogen [Vol.-%]
water vapor [Vol.-%]
methane [Vol.-%]
carbon dioxide [Vol.-%]
nitrogen [Vol.-%]
Figure 1: Overview of the gas compositions which were used for
the investigations of explosion characteristics
Two typical gas compositions from two different biomass gasification systems have been taken into account for the investigation of the explosion characteristics – see Figure 1. The producer gas properties are quite different, because of different shares on burnable and not

Session 3 – Risk assessment and permission procedure ________________________________________________________________________________
________________________________________________________________________________
116
burnable components coming from the used gasification agent and process conditions. Therefore totally different explosion characteristics can be observed. The explosion tests for the following gas compositions were commissioned at Physikalisch Technische Bundesanstalt (PTB), Germany [4]
2 Flammability Limits
The flammability of a burnable explosive gas mixture is restricted by flammability limits. A fuel-air mixture will only burn as long as the fuel concentration is between the upper (UFL) and the lower flammability limit (LFL). The flammability range is widened with increasing temperature. This effect is based on the tendency of an easier ability for ignition because of decreasing need of ignition energy with increasing temperatures of the gas mixture. Below the LFL, the mixture is too lean to sustain combustion. Above the UFL the reaction stops because of a deficiency in oxygen. The following Figure 2 represents the coherences of flammability limits in general.
UFL – envelope limiting values over all gas component properties
LFL – envelope limiting values over all gas component properties
fuel
[%]
temperature [°C]
UFL – limiting values for gas mixtures with inert gas
LFL – limiting values for gas mixtures with inert gas
UFL – limiting values for gas mixtures with inert gas
LFL – limiting values for gas mixtures with inert gas
not flammable
not flammable
flammable
not flammable
not flammable
flammable
Figure 2: Principle overview about the increasing range of flammability of a gas mixture with rising temperatures and the general effect of a decreasing
flammability range with a rising share of inert gas components [1], [2], [3]
The green areas show in principle not flammable gas mixtures. These green marked areas refer to components properties, which are available for mixtures with only one burnable gas component (methane, hydrogen, carbon monoxide) with an variation of inert gas components (carbon dioxide, water vapour, nitrogen – if available). For being on the “safe side” an envelope for UFL and LFL limiting value can be drawn as shown in Figure 2 (dotted line) - the yellow marked area stands in total for flammable gas mixtures depending on the gas/oxidizer mixture and the temperature. For gas compositions with increasing shares of inert gas components, as existing in producer gas mixtures, an additional reduced area of principle flammable gas mixtures can be observed.

Session 3 – Risk assessment and permission procedure ________________________________________________________________________________
________________________________________________________________________________
117
Because of no existing values for flammability limits from explosions tests or valid calculation models the question of the margin between the LFL or UFL threshold values of mixtures within one burnable gas component in all variation mixtures and wood gas compositions with a big number of components could not be answered (up to now - therefore additional research should be done in the future).
Based on commissioned explosion tests and further development of the calculation models for the prediction of explosion characteristics it was possible to fill this gap by giving an overview on valid explosion calculation models and by exemplarily figures/values for detailed analysed gas mixtures – see Table 1. In a short-list the equations of Le Chatelier, Bartknecht and a flame speed based model were taken into account for the validation and further development.
Table 1: Investigated simplified calculation models
∑=
= n
i Ti
iTGemisch
LFL
LFL
1 ,
,100ν
∑=
−+
=n
i T
CH
TCH
CHTGemisch
UFLUFL
UFL
1 max,,
,
))1(
(
100
4
4
4νν
⎥⎦
⎤⎢⎣
⎡−−
−=BF
BBTGemisch TT
TTTLFLLFL 1*)(,
⎥⎦
⎤⎢⎣
⎡+−
+=BF
BBTGemisch TT
TTTUFLUFL 1*)(,
24
42*)44*043,0(*)18*016,0(*)108*13,0( .,.,.,
0HCOCH
CHadiabatFlCOadiabatFlHadiabatFl TTTu
νννννν
++
−+−+−=
Le ChatelierLe Chatelier
BartknechtBartknecht
flame speedflame speed
property based model property based model
property based modelproperty based model
based on ideal combust based on ideal combust calulationcalulation
original used for LFLoriginal used for LFL
adapted model used for UFLadapted model used for UFL
validation with explosion tests validation with explosion tests okayokay
apply average adiabatic flame apply average adiabatic flame temperaturestemperatures
validation with explosion tests validation with explosion tests -- inaccurateinaccurate
limiting values from limiting values from experiences of internal experiences of internal combustion engine operationcombustion engine operation
validation with explosion tests validation with explosion tests -- inaccurate, further developinaccurate, further develop--
mentment
All models show, that they fit to the results from the explosion test, but with different ranges of inaccuracy. All models give values which are on the safe side. The original Le Chatelier model is in principle used for the lower flammability limit. Within moderate temperature ranges (up to approx. 400°C for the temperature of the gas mixture) the model is in very good agreement with the experimental results. For the upper flammability limit an adapted model was developed. The UFL is mainly influenced by the methane content. The adapted model treats the gas mixture as a mixture of only two gas components (methane and the gas component with the maximal UFL value; in general hydrogen), which is implemented under the fraction line. The comparison of flammability properties of the pure component shows that the values are quite different concerning to the upper flammability limit. Methane has a very narrow flammability range. Hydrogen has a very wide flammability range. Both of them have a similar lower flammability limit. Therefore the UFL for the gas mixture is between these values. For a mixture mainly consisting of methane the UFL is low, i.e. it is difficult to inflame the gas mixture. For a gas mixture, which mainly consists of hydrogen the ULF must be very high, that means the gas mixture can easily be inflamed.

Session 3 – Risk assessment and permission procedure ________________________________________________________________________________
________________________________________________________________________________
118
The calculation model of Bartknecht is property based and uses for the calculation of the flammability limits average adiabatic flame temperatures. The basic assumption for the calculation of the values is the knowledge about one point for UFL and LFL and the adiabatic flame temperature of the burnable gas mixture. Without the knowledge of any property the model does not work. This model is inaccurate, because of the lack on available data for the adiabatic flame temperature - this value varies in an unsatisfying range, because of different approaches for calculation and measuring of those values.
The flame speed is a very essential gas mixture property and gives a quality parameter for the utilisation of the fuel. There is an existing limiting value for the utilization of gas mixtures in IC engines. A deviation below this limit by influencing these gas/air mixtures causes failures on the internal combustion and the operation of the IC-engine – analogue to this experience in the IC-engine utilization this property can be used for the description of flammability limits. For the calculation of the laminar flame speed a simple model was found to calculate these numbers on an easy way by including terms of the share on burnable gas components as well as terms from a theoretical adiabatic flame temperature. This model was modified for the requirements of low heating value gas mixtures of the producer gas from biomass gasification plants. Based on values calculated from this model the air to fuel ratio was varied to get a chain of calculated flame speeds depending on the air to fuel ratio. These results have to be combined with a threshold value for the lower utilization limit in the area of 8-12 cm/s to get values for the flammability limits.
Flammability is mainly needed for the development of safety concepts regarding to primary measures (avoiding of the occurrence explosive atmospheres) in combination with secondary measures (avoiding potential ignition sources) for a safe plant design. Threshold values for the critical oxygen content in producer gases are essential for the plant design, which includes geometrical dimensions as well as influences from gas flow streams, dispersion etc. – see safety measures.
3 Explosion Pressure
The determination of possible arising explosion pressures is very essential for the plant design. Especially for the dimensioning of safety components and plant reactors/aggregates/pipes in total the knowledge on explosion pressures relating properties is needed.
It has to be differentiated between:
maximum explosion pressure and
maximum temporal increase of explosion pressure.
Explosion causes an increase of temperature and pressure - during the ongoing explosion it reaches a maximum of pressure. This short time event of reaching a highest level of pressure is a typical property of the gas mixture. The maximum explosion pressure is determined under ideal test conditions (ideal mixed gas, defined start conditions before ignition, etc.) and special test rigs (defined geometry of the test rig, insulation, closed system, standardized according to EN 13673, [9], [10]). It gives values for an ideal development of the explosion event. Effects from geometry, turbulence, special ignition

Session 3 – Risk assessment and permission procedure ________________________________________________________________________________
________________________________________________________________________________
119
sources, etc. can not be included, for giving realistic maximum explosion pressures at a real plant side.
The maximum temporal increase of explosion pressure is an indicator for the violence of explosions and is therefore used for the dimensioning of valves, aggregates, apparatuses, safety components, etc. Regarding to possibilities of different plant features (pressure resistant, pressure shock resistant, pressure relieve) this value has an impact on the calculation of mechanical strength and the selection of the threshold pressure for a pressure relieved design to meet all targets for a safe plant design.
Before existing data for real explosion pressures have been available, maximum explosion pressures for the pure components were taken into consideration. Table 2 gives the values for the explosion pressures by initial conditions at 1 bar, 25°C, for closed apparatuses and air used as oxidizer.
Table 2: Maximum explosion pressures for flammable components from initial pressure of 1 bar and initial temperature of 25°C, air as oxidizer, [2], [3]
8,2CO
7,9H2
8,3CH4
pmax [bar]1)Component
8,2CO
7,9H2
8,3CH4
pmax [bar]1)Component
1) p0=1 bar, t0= 20°C, Air
As mentioned in the enumeration above one possibility is to choose the explosion properties of methane, because of the highest maximum explosion pressure. For the investigated explosion pressures from real wood gas mixtures Table 3 gives the evaluated values for 2 different initial temperatures and compositions to have the basis for the validation of the calculation models (see Figure ).
Table 3: Maximum explosion pressures for different wood gas mixtures from initial pressure of 1 bar and air as oxidizer [4]
The determined values of the explosion pressure for mixture I are similar to them of pure components. The reason for that is due to the high heating value of the gas mixture as well as the declaration of rounding up the values, which were investigated in the explosion tests.
For mixture II, which is a reference gas composition from an air blown gasification system, lower maximum values can be observed, because of lower heating values depending on the share of burnable and not burnable gas components. Furthermore the content of inert gases has to be considered because of retarding the explosion process (heat transfer, radical reactions, etc.).

Session 3 – Risk assessment and permission procedure ________________________________________________________________________________
________________________________________________________________________________
120
For the calculation of maximum explosion pressures, an enlarged combustion model was developed, which allows a calculation of ideal maximum explosion pressures based on adiabatic flame temperatures and the ideal gas law, which includes requirements from effects coming from a higher share of inert gas components in investigated gas mixture.
Figure 3 gives an exemplarily result of the calculations - parameter lines for maximal explosion pressures based on constant values for the share of hydrogen, carbon dioxide, water vapour with variable content of methane, and carbon monoxide - balance nitrogen.
carbon monoxide CO [1]
met
hane
CH
4[1
]
carbon monoxide CO [1]
met
hane
CH
4[1
] mixture
remaining
Figure 3: Parameter lines for the explosion pressure based on an enlarged combustion model for initial conditions 1 bar and air as oxidizer
This calculation takes the requirements of divergent operation modes and states (start up, shut down, normal operation, etc.) with their divergent possible produced gas compositions into account and offer therefore the principle opportunity for the estimation for possible explosion parameters.
4 SAFETY ISSUES
Gasifiers have to be designed to meet all safety requirements according to several European directives, guidelines as well as national directives and laws. For a safe design a lot of certainties, risks and dangers of such a plant have to be considered and precaution procedures against these risks and dangers have to be taken by manufacturers and employers.
Regarding to this, a detailed description of the plant configuration (technical concept, plant pressures and temperatures, etc.) as well as the knowledge about plant utility properties has to be delivered to consider all this points.
Figure 4 shows the development of typical temperature (left ordinate, range between two blue lines) and typical pressure (right ordinate, range between two red lines) over the gasification plant of the Institute for Thermal Engineering in Graz, Austria. The front part of the plant is working under atmospheric pressure (left part of Figure 4) and the back part is

Session 3 – Risk assessment and permission procedure ________________________________________________________________________________
________________________________________________________________________________
121
at overpressure (right part of Figure 4Fehler! Verweisquelle konnte nicht gefunden werden.).
10 IC-engine9 Last cool.8 Fan 27 Wet scrubber6 Fan 1
5 Bag house4 Cooling 23 Cooling 12 Cyclone1 Gasifier
10 IC-engine9 Last cool.8 Fan 27 Wet scrubber6 Fan 1
5 Bag house4 Cooling 23 Cooling 12 Cyclone1 Gasifier
pplant < patUFL
pplant > patLFL
Gas
Air
Gas
Air
Gas
Gas
Gas
Gas
pplant < patUFL
pplant > patLFL
Gas
Air
Gas
Air
Gas
Gas
Gas
Gas
Figure 4: Exemplary operating temperature and pressure in a gasification plant and its effect to the calculation of the closed systems explosion pressure
In case of a leakage in the front part of the plant, working below atmospheric pressure, air will be sucked into the plant; therefore the upper flammability limit has to be considered. Quite converse is the situation in part of the plant working at overpressure. In case of a leakage producer gas escapes from the plant and the lower flammability limit has to be considered outside.
The explosion pressure (first right ordinate) is higher in case of low gas temperatures and lower with hot gases, because of low gas densities at high temperature and the lower margin between the maximum adiabatic flame temperature and the gas temperature for the considered section of the plant.
As mentioned above precaution procedures have to follow the rules, enumerations, guidance from several European directives – especially for the themes of explosion prevention and protection the ATEX directives have to be applied. The directives define measure categories, which have to be followed top down as shown in Figure 5.

Session 3 – Risk assessment and permission procedure ________________________________________________________________________________
________________________________________________________________________________
122
Explosion protection measures at biomass gasification plants
Primary measures(see detail)
1prim. OK -> Stop
yes Secondary measures(see detail)
2prim. + sec.OK -> Stop
yes
no
Tertiary measures(see detail)
3prim.+sec.+tert.OK -> Stop
yes
no
no
Ignition protection
Ex-Zones - definition
Applying rules to meet targets on explosion
protection
Measure catalogue
Risk assessment
Ex - document
Figure 5: Explosion protection measures – concept and systematic according to European ATEX directives
As shown in the figure above explosion protection and prevention measures can be subdivided into primary, secondary and tertiary measures. There are lots of tools, which help and have to be applied when meeting the targets of the guideline listed on the right hand side of the figure. The toolbar can be grouped into a part of risk assessment/technology description, avoiding of explosive atmospheres (primary – e.g. leakages, gas escapes), avoiding of ignition sources (secondary – e.g. sparks, hot particles etc.) as well as dimensioning principles of plant aggregates, reactors and apparatuses for a pressure resistant or pressure relieved design (tertiary – e.g. for decreasing effects from happening explosion on human life, environment and protection of the plant and plant site).
For avoiding explosive atmospheres areas inside and outside the pipes, reactors, aggregates etc. have to be considered. The following Figure 6 presents a possible way of applying safety measures to fulfil the requirements, which have to be done for a successful introduction of primary measures.

Session 3 – Risk assessment and permission procedure ________________________________________________________________________________
________________________________________________________________________________
123
Primary measures in detail
Around the plantInside the apparatus
Technical equipment/design
Parameter / characteristics
Pay attention to
O2-sensor
O2 < limiting value
Dispersion
Emergency shut downCheck-up (safetyinstructions!)
Consequence
CO-sensor
CO < limiting value (attention on MAC-value H&S)
air change
Increase air change,Failure signal, Emergency shut down,Check-up (safety instructions!)
Figure 6: Primary measures for avoiding explosive atmospheres inside and around the plant - exemplarily for a gasification plant; [11]; [12]
A feasible way is given by the monitoring of gas concentrations (producer gas composition, air/oxygen) inside and around the plant. Inside the plant, the upper flammability limit has to be controlled. In case of reaching a threshold value – depending on dispersion effects inside the plant – safety routines have to be applied. Around the plant carbon monoxide has to be monitored. Carbon monoxide is twice necessary with regard to health und safety issues. On the one hand carbon monoxide is a very toxic gas component, which has to be monitored continuously with regard on MAC concentration to exclude any damages on human health/life. On the other hand CO concentration can easily to be measured, which is a good indicator for leakages and when gas escapes from the plant.
CCin
C1 C2 Cout
Messstreckenabschnitt a
Messstreckenabschnitt c
Cin Messstreckenabschnitt b
Cout
tin t1 t2 tout
plant section a
plant section b
plant section c
CCin
C1 C2 Cout
Messstreckenabschnitt a
Messstreckenabschnitt c
Cin Messstreckenabschnitt b
Cout
tin t1 t2 tout
plant section a
plant section b
plant section c
safety margin O2- limiting value ULF
O2-threshold value
O2- limiting value UFL
sampling point
Figure 7: Dispersion at coupled reactors [7]0
Especially inside the plant dispersion effects have to be considered. Dispersion is an effect, which causes a change of gas concentrations due to mixing in apparatuses/mixing in turbulent flows and boundary layers of gas streams in pipes, reactors, etc. – see Figure 7.

Session 3 – Risk assessment and permission procedure ________________________________________________________________________________
________________________________________________________________________________
124
An entering gas concentration is reduced from a maximum concentration by mixing in different reactors – each of these reactors/pipes can be considered as a mixer. So it is necessary to choose the right position of the sampling point regarding to expected concentration developments, as shown in the figure above. An explosion protection system based on primary explosion protection measures has to guaranty, that nowhere in the plant critical gas concentrations regarding to flammability limits can be reached. The graphic above shows the critical oxygen limit – for being on the safe side a safety margin has to be set, which marks the maximum acceptable oxygen concentration inside the plant. Depending on the expected maximum effect from dispersion a threshold value for the maximum acceptable oxygen concentration has to be found by considering:
the position of the oxygen sensors,
dispersion effect,
o superficial velocities,
o number and volume of the reactors etc.,
o piping and sampling train,
fluctuation of the producer gas composition etc.
In the case that primary measures does not allow to reach an acceptable safety standard secondary explosion protection measures must be added - the systematic follows as pictured in Figure 8.
Secondary measures in detail
Ignition protectionPlant design
Design of mechanical components
Adherence of zone rules
Ex-Zone Concept
Design of electric drives and devices
Apparatus design
Analysis on ignition sources
• Hot surfaces (reactor, piping,external heated components etc.)
• Mechanic or electric sparks (blower, etc.)• Static electricity charge• Sparks, hot particle etc.
Figure 8: Secondary measures – modalities for avoiding ignition sources at gasification plants, [11]; [12}
Secondary measures are directly coupled with the explosion area/zone concept of the plant. The frequency of the occurrence of explosive atmospheres inside and around the plant defines “Explosion zones” which are special defined plant areas, sections or spaces. In these expelled areas special requirements have to be fulfilled for a safe design and operation. The aim is to avoid explosion by preventing ignition sources considering the plant design with regard to design principles and ignition protection features of the plant, plant

Session 3 – Risk assessment and permission procedure ________________________________________________________________________________
________________________________________________________________________________
125
components, reactor design, etc. By reaching these requirements from secondary measures, explosions from explosive atmospheres can be avoided, because of no existing ignition sources.
In case of failing of all these requirements (primary and secondary measures) tertiary measures have to be applied, which are aimed to protect the plant and the employees around in case of explosions – see Figure 9.
Tertiary measures in detail
Design featuresDesign features
Pressure resistant
Pressure shock resistant
Pressure relieve
pay attention to:with regard to:
Decoupling of apparatuses &flame arrestor
Pressure relieve -Pressure relieve line
Continuous operation,Safe operation
Maintenance &Maintenance interval
Emergency measures, Emergency operation
Figure 9: Tertiary measures – Design features and important limiting facts for applying such concepts at gasification plants, [11]; [12]
Depending on the technical concept different design principles (pressure resistant, pressure shock resistant, pressure relieve) can be applied, which entails for a pressure resistant or pressure relieved design a decoupling of the linked reactors (e.g. flame arrestors). These measures bring the need of special consideration on the pressure relieve lines, which could cause additional risk in case of triggering of pressure relieve components because of emitting a hot outlet stream of burnable and toxic gases. To guarantee a safe plant operation of all safety measures and components the effects from the handled fluids (e.g. containing dust, tar, acids) on their long term functionality has to be considered (in standard operation as well as in start up, shut down, emergency case operation and during maintenance).
5 Conclusions
Explosion prevention and protection is a very important issue during the development of the gasification process and the plant because of interactions between parts of the plant and the feasibility of technical configurations and the operation management of the whole process chain. Therefore deliberations on the safety concept have to be done as early as possible to safe efforts during the development and the implementation of the safety concept itself as well as supporting the development of an operable plant concept.

Session 3 – Risk assessment and permission procedure ________________________________________________________________________________
________________________________________________________________________________
126
For recommendations referring to conceptual design principles for a safe plant design it can be summarized that an achieving of explosion protection aims requires the knowledge about
technical application – Technological description and classification,
risk assessment (results) of the plant (technical equipment, operation modes of the plant, etc.),
explosion parameters of produced and utilized gas compositions.
Based on this knowledge a concept for safe design can be developed. The first step of the general investigation on explosion characteristics showed problems when applying available data and calculation models due to general gaps of information for the wood gas application. More investigation regarding the estimation of explosion parameters as well as for the estimation of the behaviour of explosion prevention measures (flame arrestors, pressure relieved valves, pressure relieve pipes etc.) should be done in the future.
The present paper gives an overview on the work which has been done at the Institute of Thermal Engineering and it delivers an insight of ongoing further steps by giving examples of problematic facts around the theme of explosion prevention and protection. Based on the approach of giving a general introduction on European directives, national directive and laws etc. possible solution paths have been shown just to give examples for a specific case from practice as well as to get a feeling for interactions and possible ways of solving problems.
6 References
[1] Steen, H.: Handbook of explosion prevention and protection, WILEY-VCH Verlag, 2004, ISBN 3-527 30718-4
[2] Brandes E., Möller W.: Sicherheitstechnische Kenngrößen Band 1, Wirtschaftsverlag NW, 2003, ISBN 3-89701-745-8
[3] Molnarne M., Schendler Th., Schröder V.: Sicherheitstechnische Kenngrößen Band 2, Wirtschaftsverlag NW, 2003, ISBN 3-89701-746-6
[4] Brandes E. et.al.: Explosionstests für Gas aus Biomassevergasungsanlagen I+II, im Auftrag des Instituts für Wärmetechnik, TU Graz, Braunschweig, September 2003, Mai 2004
[5] Lettner F., Timmerer H., Wallner C.: Explosion risks in biomass gasification plants, Institute of Thermal Engineering, Paper and Poster presented at 2nd World Conference on Biomass for Energy, Industry and Climate Protection, Rome, 2004
[6] Directive 98/37/EC of the European Parliament and of the Council of 22 June 1998 on the approximation of the laws of the Member States relating to machinery (OJ L 207, 23.7.1998, p. 1)
[7] O. Levenspiel: The Chemical Reactor Book, Chemical Engineering Department, Oregon State University, OSU Book Store, 1996

Session 3 – Risk assessment and permission procedure ________________________________________________________________________________
________________________________________________________________________________
127
[8] Lettner F., Timmerer H.: Leitfaden – Anlagensicherheit und Genehmigung von Biomassevergasungsanlagen, Projektendbericht, Institut für Wärmetechnik, TU Graz, 2005
[9] prEN 13763-1: Verfahren zur Bestimmung des maximalen Explosionsdruckes und des maximalen zeitlichen Druckanstieges für Gase und Dämpfe, 2003, Teil 1: Bestimmungsverfahren für den maximalen Explosionsdruck
[10] prEN 13673-2: Verfahren zur Bestimmung des maximalen Explosionsdruckes und des maximalen zeitlichen Druckanstieges für Gas und Dämpfe, 2002, Teil 2: Bestimmungsverfahren für den maximalen zeitlichen Druckanstieg
[11] Richtlinie 1994/9/EG des europäischen Parlaments und des Rates vom 23. März 1994 zur Angleichung der Rechtsvorschriften und Verwaltungsvorschriften der Mitgliedsstaaten für Geräte und Schutzsystem zur bestimmungsgemäßen Verwendung im explosionsgeschützten Bereich – ATEX 95
[12] RICHTLINIE 1999/92/EG DES EUROPÄISCHEN PARLAMENTS UND DES RATES vom 16. Dezember 1999 über Mindestvorschriften zur Verbesserung des Gesundheitsschutzes und der Sicherheit der Arbeitnehmer, die durch explosionsfähige Atmosphären gefährdet werden können (Fünfzehnte Einzelrichtlinie im Sinne von Artikel 16 Absatz 1 der Richtlinie 89/391/EWG) - ATEX 137

Session 3 – Risk assessment and permission procedure ________________________________________________________________________________
________________________________________________________________________________
128
Required Documentation for the Permitting Procedure – the Austrian Situation as an Example
Friedrich Lettner, Helmut Timmerer
Institute of Thermal Engineering, Graz University of Technology, A-8010 Graz, Inffeldgasse 25B
1 Overview
In general it has to be considered that gasification plants have to fulfill on the one hand all the requirements for placing on the market [like Machinery-Directive 98/37/EC [1], Directive 1999/92/EC (ATEX 137) [2], Directive 1994/9/EC (ATEX 95) [3], Pressure Equipment Directive 97/23/EC [4], various others (e.g. Low Voltage Directive 73/23/EC [5], EMC – Guideline 2004/108/EC [6], etc.) ] – on the other hand they have to fulfill the laws within the countries where they are erected and operated. Therefore they have to be permitted before their erection and before going into operation at the planed place.
This paper will not go into detail with the procedures which are required to be able to place a product/machinery/component into the European market – details for that procedure can be found in [7]. However it will focus on the question which authority is responsible and gives an overview what documents/information will be useful/necessary for the permission considering the Austrian situation as an example.
2 Which authority is responsible for the local permitting procedure?
For the permission which is necessary that the plant can be erected and operated on site different species of law can be responsible:
• Building laws,
• Industrial Law (for commercial use – the most used procedure),
• Laws for simplified authorization for plants dealing with renewable energy (in principle for gasification plants, but e.g. in Austria, when used commercially: documents and authorization according to industrial law),
• Special laws, e.g. IPPC-categories etc. for special facilities (depending on the use, chemicals, power load,…) – but for small scale gasification application not applicable
… therefore different documents are necessary for the authorization process…
The responsible authority in Austria for the local permission is in most cases the local district authority – in some cases the authority of the provincial state.
Session 3 – Risk assessment and permission procedure ________________________________________________________________________________
________________________________________________________________________________
129
3 Required documents for the permitting procedure – Austrian situation as an example
Depending on the different kinds of laws which are the basis for the permission procedure the following documents can be useful/necessary for the local permission of the plant:
3.1 Information to the plant location and the principle setup
Site plan (min. scale 1:1000), with marked gasification plant and adjacent neighbors/objects (with type of use, e.g. marking of dwelling houses, number of site dedication, name of owner, postal address), marked main systems (electricity, transformation substations, gas, water, district heating system, waste water system,…), marked traffic ways.
Information about possible danger zones (e.g. avalanche protection zones, flood spillways) in or around the plant size
Catalogue about the neighbors with their postal addresses
Construction plan of the building (plan view, front view, sectional view) in a scale (e.g. 1:100, 1:50), from which the principal aggregates and their collection/embedment into the total plant can be seen.
Specification of the main parts
3.2 Principal technical description and presentation (Technical drawings, schemes etc.) from the plant and the plant building
Machinery installation plans with machinery list (manufacturer, type, electrical input power etc.),
Machines and plants with simple scheme of their main parts (e.g. in symbols),
Stores and Plants for gases, scheme of central gas supply devices,
Fireplaces, stationary storage containers for liquid fuels, scheme of gas supply devices,
Types of used parts for sewage treatment,
3.3 Description of the technical plant- and concept of operation
(standard-, start up, shut down and emergency operation, …)
Flow sheet of the plant with:
Used fuel (natural wood chips, additional fuels e.g. for co-firing, flare etc.),
All used media in operation (for cooling, lubrication…),
Producer gas data and all existing valves and safety devices,

Session 3 – Risk assessment and permission procedure ________________________________________________________________________________
________________________________________________________________________________
130
All produced residues (solid waste (ash, dust, coke etc.), liquid residues (condensates, waste water, washing agents etc.) and
Off- and exhaust gas streams (IC-engines exhaust gas, boiler and flare exhaust, air ventilation exhaust, etc.).
Arrangement of sampling and measuring points
Information about the heat supply to third parties (energy, electricity, fuels, heat balance), annual efficiency, long term heat delivery contracts (min. 10 years), calorimeters for the heat exchange with the district heating system, etc.)
3.4 Technical description of the gasification plant in detail
(Process steps, process flow, mass and energy balance, water balance, integration of the plant regarding to the produced heat, efficiency (efficiency and annual efficiency), Equipment in the producer gas stream – Producer gas and exhaust gas cleaning devices, Ventilations systems, etc.), Flow sheets (acc. to EN ISO 10628), description of the apparatus in the plant)
Number of employees working on/around the plant
Measures for the protection against accidents - according to the risk assessment
Fuel logistic (number and time of fuel deliveries etc.)
Fuel storage and logistic inside the plant
Storage of fuels
Storage of residues and wastes
Instruction manual for the plant
Instruction/Manual for the start up and re-start procedure
Instruction/Manual for the standard operation
Instruction/Manual for the case of malfunctions at the plant
Instruction/Manual for shut down
Waste management concept
3.5 Description of the electro technical equipment
Technical description of the electrical high voltage facilities including their arrangement and installation (high voltage cables, high voltage switchgear, transformation substations)
Unipolar overview on production, transmission and supply with electricity
Setup diagram of the high voltage facilities and cables …
Information about the borders of property between the plant owner and the local electricity supplier

Session 3 – Risk assessment and permission procedure ________________________________________________________________________________
________________________________________________________________________________
131
Information about the electricity feeding point and metering point
Operation concept for high voltage facilities
Technical description of low voltage facilities
Technical description of electricity production unit (generator, power switch and – electronics)
Operation concept for the electricity production unit
General description of the installation, lighting system, safety lighting system, input power of the electrical consumers
Lightning protection system, category acc. to ÖVE/ÖNORM E 8049-1
Control, automization and measuring system; Safety routines
3.6 Description of the safety system and safety engineering concepts
Measures for the protection of employees
Explosion protection
o Evaluation of the explosion risk
o Layout of different explosion zones
o Explosion protection measures according to the explosion risks and the explosion zones - preliminary explosion protection document for the permitting procedure
Fire Protection
o Description of the handled and stored burnable fuels with description of the measures for fire protection (e.g. fuel storage, fuel handling system etc.)
o Definition of fire protection units inside the plant
o Points of fire-evolution – distance to burnable parts, expected temperature
o Technical description of fire protection installation (back fire safety system, warning and control system)
o Mobile fire extinguishers and extended extinguisher installations/measures
3.7 Emissions of the plant
(gaseous, liquid, solid)
Acoustic emission of the total plant
o Acoustic emission from machines, ventilation systems etc.; information about the expected sound level

Session 3 – Risk assessment and permission procedure ________________________________________________________________________________
________________________________________________________________________________
132
o Measures for the reduction of acoustic emissions, vibrations etc., noise control in working rooms (sound absorbing sealing, encapsuling from machines etc.)
Gaseous Emissions of the gasification plant
o Information on engine exhaust emission (type, concentration and mass flow)
o Information on the concept of exhaust gas treatment (in accordance with producer gas quality achieved by the used gas cleaning system – see catalyst life time, catalyst poisoning / aging)
o Information on precaution measures for the minimisation of gaseous pollutants in engine exhaust emission
o Information on the emission by the emergency gas flare
o Information on the emission by biomass combustion plants, which are included in the permitting procedure or are technically related to the gasification plant (e.g. waste water disposal, utilization of residues from the gasification plant)
o Information on the conduction of (periodic) emission measurements during the test phase and the regular plant operation
o Exhausting height above ground and roof exhausting velocity and temperature
Residues and wastes from the gasification process
o Mass and composition of the residues (waste water, ash, dust, coke, sludge from gas cleaning) – with mass balance
o Check of the water right responsibility regarding to the incidental waste water and/or cleaning system
o Information on the handling and intermediate storage and internal recovery or disposal (safety measures, place, storage mass,…)
4 Summary
In principle several Directives and Guidelines have to be considered for the placement of products on the market within the European Union. All of this directives define in principle minimum standards for safety and health for such products when they are used by operators/employees or consumers.
Additional to the EC-certification of products they have to be permitted to be installed/erected and operated on site. Depending on the use and the legal situation in the member states different laws have to be considered within the permitting procedure. A list of useful information/documentation for applicants seeking for permission is given above – with regard to the plant size and use it has to be clarified with the authorities in which detail the information is required.

Session 3 – Risk assessment and permission procedure ________________________________________________________________________________
________________________________________________________________________________
133
5 Literature
[1] The European Parliament and the Council of the European Union, DIRECTIVE 98/37/EC OF THE EUROPEAN PARLIAMENT AND OF THE COUNCIL of 22 June 1998 on the approximation of the laws of the Member States relating to machinery. 1998.
[2] The European Parliament and the Council of the European Union, DIRECTIVE 1999/92/EC OF THE EUROPEAN PARLIAMENT AND OF THE COUNCIL of 16 December 1999 on minimum requirements for improving the safety and health protection of workers potentially at risk from explosive atmospheres (15th individual Directive within the meaning of Article 16(1) of Directive 89/391/EEC). 1999.
[3] The European Parliament and the Council of the European Union, DIRECTIVE 94/9/EC OF THE EUROPEAN PARLIAMENT AND THE COUNCIL of 23 March 1994 on the approximation of the laws of the Member States concerning equipment and protective systems intended for use in potentially explosive atmospheres. 1994.
[4] The European Parliament and the Council of the European Union, DIRECTIVE 97/23/EC OF THE EUROPEAN PARLIAMENT AND OF THE COUNCIL of 29 May 1997 on the approximation of the laws of the Member States concerning pressure equipment. 1997.
[5] The European Parliament and the Council of the European Union, Council Directive 73/23/EEC of 19 February 1973 on the harmonization of the laws of Member States relating to electrical equipment designed for use within certain voltage limits. 1973.
[6] The European Parliament and the Council of the European Union, DIRECTIVE 2004/108/EC OF THE EUROPEAN PARLIAMENT AND OF THE COUNCIL of 15 December 2004 on the approximation of the laws of the Member States relating to electromagnetic compatibility and repealing Directive 89/336/EEC. 2004.
[7] Lettner, F., Legal basis for placing on the market; Proceedings for the Thermalnet-Workshop on Health, Safety and Environment for Gasification Plants, 28.9.2005, Innsbruck. 2005.

Session 3 – Risk assessment and permission procedure ________________________________________________________________________________
________________________________________________________________________________
134
Experiences of a plant supplier
T. Koch
TK Energi AS, Stationsvej 4, DK 4621 Gadstsrup, Denmark
A summary by Stefan Fürnsinn
1 Biomass gasification as an investment
Before discussing HSE-related topics in biomass gasification, it must be analyzed weather gasification is attractive at all for investors. Only in this case plants will be installed and HSE measures become necessary.
One of the most crucial aspects of biomass gasification plants are economies of scale, which strongly encourage investors to surpass a minimum gasifier size. As some equipment is expensive for small plants, but can be scaled-up with decreasing marginal costs, larger plants tend to relatively cheaper, as illustrated in the following figures.
Turnkey Plant Price
0
500
1000
1500
2000
2500
3000
3500
4000
300 500 700 850 1000kWe
€/ k
We
0
500.000
1.000.000
1.500.000
2.000.000
2.500.000
Pric
e (€
)
Price (€)
€/ kWe
Figure 1: Electricity production costs and plant costs for different plant sizes.

Session 3 – Risk assessment and permission procedure ________________________________________________________________________________
________________________________________________________________________________
135
A)
Electricity production price estimation at variable fuel and heat sale prices
-10,0
-5,0
0,0
5,0
10,0
0 10 20 30 40 50 60 70 80Heat sale price (€/ MWh)
Elec
trici
ty p
rodu
ctio
n pr
ice
(€ce
nt/k
Wh)
15 €/ MWh fuel10 €/ MWh fuel5 €/ MWH fuel
This calculation is based on a 300 kWe plantPrice: 1,080,000 €Efficiency (biomass to electricity): 25 %Efficiency (biomass to heat): 52 %Availability: 5500 hours annuallyAnnual operation costs: 8 % of total price
Fuel price: 15 €/ MWh (65-70 €/ ton dry wood)Heat sale price: 20 €/ MWhElectricity production price: 7,1 €cent/ kWh
B)
Electricity production price estimation at variable fuel and heat sale prices
-10,0
-5,0
0,0
5,0
10,0
0 10 20 30 40 50 60 70 80Heat sale price (€/ MWh)
Elec
trici
ty p
rodu
ctio
n pr
ice
(€ce
nt/k
Wh)
15 €/ MWh fuel10 €/ MWh fuel5 €/ MWH fuel
This calculation is based on a 1000 kWe plantPrice: 2,200,000 €Efficiency (biomass to electricity): 30 %Efficiency (biomass to heat): 55 %Availability: 5500 hours annuallyAnnual operation costs: 8 % of total price
Fuel price: 15 €/ MWh (65-70 €/ ton dry wood)Heat sale price: 20 €/ MWhElectricity production price: 4,5 €cent/ kWh
Figure 2: Economies of scale: comparison of different plant sizes. A) plant with 300kWel; B) plant with 1000 kWel
Finally, it can be concluded that it does pay off to invest into biomass gasification plants. Therefore a detailed analysis of health, safety and environment is clearly needed.
2 Health and safety issues
HSE-issues include primarily the following:

Session 3 – Risk assessment and permission procedure ________________________________________________________________________________
________________________________________________________________________________
136
• Environmental issues
• Short term working environmental issues
• Long term working environmental issues.
• Generel construction issues.
• No tar principle
• Post combustion chamber
• CO alarms
As gasification is highly innovative, unforeseen problems may occur and must be solved by adequate technical solutions. The following photography shows a hot spot in the gasifier shell due to material deficiencies that were tackled using extensive phase analysis and new material development.
Figure 3: Consequences of an insulation failure at the gasifier shell.
• Explosion safety features
• Cold pressure barriere calculated to with stand maximum explosion pressure
• Insulation materials will not reduce and reduce strength of outer shell
• No moving parts that can cause blockages
The following table gives an example of how explosion risks can be reduced by careful planning:

Session 3 – Risk assessment and permission procedure ________________________________________________________________________________
________________________________________________________________________________
137
6,8 bar7,5 bar7,2 bar6,3 bar3,4 barMaximum pressure
0002546Vol% CO2
0002545Vol% H2O
1000081Vol% H2
01000213Vol% CO
00100215Vol% CH4
Scenario 5Scenario 4Scenario 3Scenario 2Scenario 1
6,8 bar7,5 bar7,2 bar6,3 bar3,4 barMaximum pressure
0002546Vol% CO2
0002545Vol% H2O
1000081Vol% H2
01000213Vol% CO
00100215Vol% CH4
Scenario 5Scenario 4Scenario 3Scenario 2Scenario 1
From the above it can be concluded that HSE issues often require completely new construction details, which may result in higher development costs. Still, these issues must be carefully taken into consideration to allow for the long term development of economical gasification technologies.

Session 3 – Risk assessment and permission procedure ________________________________________________________________________________
________________________________________________________________________________
138
Measures to meet the H+S Regulations of the Pyroforce® wood gas system
Martin Schaub1, Angela Hofmann2, Willy Gemperle3, Herbert Gemperle3 1CTU – Conzepte Technik Umwelt AG, CH-8400 Winterthur
2ATB/TBB – Antennen°Umwelt°Technik°Becker, A-6067 Absam 3Pyroforce Energietechnologie AG, CH-6020 Emmenbrücke
1 Plant Design, general considerations, Operating Experience
1.1 Introduction
Pyroforce® Energietechnologie AG had developed in the 90-ies a wood gasifier for the range of a few hundred kW (electrical power) in order to meet the demand of small co generation applications using wood as a fuel. While a first pilot plant was run successfully from a gasifier point of view, the synthesis gas purification was not satisfactory and caused too many shut downs of the system.
As a 2nd stage a plant for 200 kWel could be built in Spiez (Switzerland) applying a different gas cleaning system. In the mean time the plant has already been run more than 10'000 hours and the mean time between failures could be brought to a very acceptable level.
The paper shall describe the design of the system, shall give information on the operating experience and shall also describe the safety and health measures to be taken for future Pyroforce® gasifier plants.
1.2 Gasifier Design
The patented Pyroforce® gasifier is based on a co current fixed bed design with some special features leading to very low tar production.
The drying, warm up and pyrolysis zone are located in the upper part of the reactor, where a low amount of air is admitted only in order to prevent from gas escaping to atmosphere. The combustion air is lead to the centre of the reactor, where combustion takes place on part of the wood in order to produce the energy required for gasification. Temperature in the combustion zone is fairly high (approx. 1300°C). Heat is radiating to the upper part of the reactor (drying, warm up, pyrolysis), while the pyrolysis gas is flowing through the reaction zone thus converting long or closed hydro carbon chains into the desired gas components. In the lower part of the reactor the main gasification process takes place, where CO2 from combustion is reacting with remaining carbon from the coke. The synthesis gas finally is removed with approx. 600°C from the reactor after indirectly heating the upper zones again before leaving the reactor.

Session 3 – Risk assessment and permission procedure ________________________________________________________________________________
________________________________________________________________________________
139
Low tar emissions are achieved because the wood is converted to a already reasonable coke in the upper part and the emitted long hydrocarbons are cracked in the heat influenced part of the reactor. The hot ash is removed from the system using a moving grate which allows for extraction of ash even if it is slightly slagging.
PyrolysePyrolysis
Drying
Oxidation
Reduction
AshAsh
FuelFuel
AirAir
SynSyn GasGas
AirAir
Figure 1: Schematic drawing of gasifier
1.3 Synthesis Gas
The synthesis gas from the reactor is composed of the expected components CO, hydrogen and methane as main energy carriers. Larger hydrocarbons than methane only contribute between 2 and 3% of the energy content of the gas. Total tars (including BTN) have been measured to be in sum below 1.5g/Nm3, which is a surprisingly low tar content for a fixed bed reactor.
Big influence of wet wood has been observed on the tar production. Therefore a drier is installed upstream of the reactor in order to dry the wood to below 10% humidity, although operation of the system still is possible with higher humidity, meantime between shut downs will be shorter.
The energy content of the synthesis gas has been measured to be in the range from 1.1 to 1.2 kWh/Nm3.
Soot development cannot be completely suppressed in the reactor, thus soot is being removed together with the synthesis gas from the reactor. The amount of soot has been balanced using soot extraction mass from the cyclone installed downstream of the reactor leading by a backward calculation to an amount of approx. 2g/Nm3 of soot.

Session 3 – Risk assessment and permission procedure ________________________________________________________________________________
________________________________________________________________________________
140
Since soot is an energy carrier as well but needs to be considered as an energy loss, recycling of soot has been tried successfully (see below).
1.4 Synthesis gas purification
Synthesis gas needs to be purified in order to feed an engine otherwise the engine will not have high availability. Particularly important is the reduction of solids (dust) as well as the removal of tars. Dust would lead to erosion and emission problems, while tars tend to coke within the engine leading to erosion problems as well. Furthermore the temperature of the gas shall be approx. ambient in order to mix it with the combustion air and to limit the volume of the gas.
If waste wood is being used, additional precaution needs to be taken because of the emissions from the system. Particularly hydrochloric acid (developed from PVC coatings) and heavy metals shall be abated.
Thus the demands for the synthesis gas cleaning are fairly high and the following solution has been selected. As a first step, the synthesis gas is cooled in an air cooled tube bundle type cooler (the air can be used as preheated air for gasification or for drying of the fuel). Care needs to be taken that high boiling tars will not solidify in the cooler otherwise it will plug quickly. Furthermore soot also might accumulate and form a very sticky product. Thus soot blowing and temperature control are of utmost importance in such coolers. If a temperature of below 160°C is reached, heavy metals and hydrochloric acid can be removed in one step using a bag house coated with a lime/charcoal mixture. While the lime serves as neutralisation agent for the hydrochloric acid, the char coal can trap even nasty metals like mercury (or arsenic) quite efficiently. The filter serves also as a very efficient removal step for soot and some tars, which condense on the lime/char particles.
It has been shown that tar and soot removal also work without charcoal addition. Thus if fresh wood is used, no charcoal needs to be added.
Further cooling is done using a cooled washing column, where water is condensed out while the gas is cooled to the required temperature. Addition of suitable oil (e.g. RME) into this column will prevent from clogging with condensed hydrocarbons which tend to agglomerate and polymerise. Used oil can be added to the fuel such that it will not present a waste product.
The engine manufacturers also define very low amounts of ammonia to be admitted to the engine. Ammonia does develop in the gasification reaction from the fuel born nitrogen content and thus cannot be avoided completely. Although catalysts are known accelerating the decomposition of ammonia, until now life times of such catalysts have been extremely short and they cannot be applied. Ammonia can also be removed by washing using an acid. Also CO2 serves as an acid and automatically some ammonia is removed in the washing column, however not sufficient to satisfy the inlet concentration defined by the engine manufacturers. Experience however shows that the engines do not suffer because of the ammonia content, neither the lubrication oil nor the NOx development showed any significant impact by the ammonia thus allowing to avoid addition of acid to the scrubber

Session 3 – Risk assessment and permission procedure ________________________________________________________________________________
________________________________________________________________________________
141
which would be costly on the one hand and would create a waste product on the other hand.
1.5 Engine
The engine used in the SPIEZ plant is a GE-JENBACHER J208. It is equipped with a turbo charger and subsequent gas cooler in order to achieve high power with the low calorific gas produced in the Pyroforce® gasifier. Its exhaust is equipped with a catalyst system in order to emit low emissions of CO and NOx only. The thermal efficiency of the engine was according to expectation (approx. 36%), while the availability became very satisfying after a few problems at start with impure gas and with unsuitable spark plugs. In the meantime, these problems have been resolved and the engine performs without problems. The exhaust concentrations (NOx, CO) of the engine are below the lawful limits for such engines and are very close to the values achieved with engines run by natural gas, although there is high CO concentration and ammonia concentration in the synthesis gas.
The expected degradation of the oil because of ammonia never occurred. Today oil changes are very infrequent and exceed the expectation by large.
1.6 By products
Operation of a gasifier leads to by products. There is certainly the ash to be considered, which is not fully burned out and carries approx. 50% of coke. This ash needs to be disposed of. Not all countries accept the same reuse. While a number of countries accept inmixing into compost, others do not because of potential content of aromatic components in the coke.
A 2nd by product is the soot removed from the cyclone. It has been demonstrated that this material can be – together with the filter cake from the gas cleaning – pelletized and recharged to the reactor thus using the energy content of the soot as well.
The 3rd by product of the process is the ash from the filter. As said above, this product can be recycled, except for the case of using waste wood as a fuel. In such a case this product needs to be disposed of because of its content of heavy metals.
A 4th by product is the oil from the scrubber, which can be used as a fuel in the process.
The 5th by product is the condensed water from the cooling of the gas. Its recycle is done by adding it to the fuel after drying thus preventing its disposal. Another method which has been demonstrated is using it as an additional gasification medium shifting the gas more to the hydrogen side from the CO side.
Thus the only product to be removed remains the ash which is enriched with the lime added for the pre coating of the bag house.
1.7 Over all process
The above description leads to the over all flow sheet of the process as depicted in graph 2 below. This graph is taken from the control system monitor at the SPIEZ plant.

Session 3 – Risk assessment and permission procedure ________________________________________________________________________________
________________________________________________________________________________
142
Figure 2: Flow diagram of Spiez plant as depicted on control system.
2 Measures to meet the H+S regulations
2.1 Health
2.1.1 Risks
Wood gas results from the under-stoichiometric thermal decomposition of wood. The two main components relevant for engine use are hydrogen and carbon monoxide, whereby hydrogen must be considered in connection with fire and explosion prevention as the critical component. The high toxicity of carbon monoxide however causes that wood gas must be regarded also from the health point of view. The low MAC-value of CO (30 ppm, approx. factor 4000 below lower explosion limit) requires special attention for the planning of the security concept of a wood gas plant. Additionally, CO is colour-, smell- and tasteless and therefore no warning effect is given. Enrichment of CO either lower or upper levels of a building does not occur, since CO has the same density as air.
2.1.2 Safety measures
The gasifier system, the gas cooling and cleaning as well as the auxiliary subsystems are located in a structural steel construction; with this, a good aeration of the surrounding of the plant is guaranteed. Moreover, the plant is operated under a slight vacuum from the reactor to the compressor unit, thus possible leakages lead not to a leakage of the wood gas. The components from the compressor to the CHP-engine, which are under a slight overpressure, are located in a closed area for noise control reasons. This area is equipped with an automatically controlled ventilation system. In this area a CO sensor is located,

Session 3 – Risk assessment and permission procedure ________________________________________________________________________________
________________________________________________________________________________
143
which is acting directly upon the superordinate control for alarm and the safety-relevant regulations. Reaching an early warning stage (20 % MAC) a notification of emergency is given and the ventilation of the closed room is increased. When reaching the alarm value of 50 % MAC the plant is switched off automatically and at the same time into a safe operating condition.
2.2 Environment
2.2.1 Risks
Gaseous emissions
The exhaust air from the preliminary drying of the wood chips contains as main parts water and also slight odours, usually resulting when drying fresh wood. Since this smell results also with the storage of the input material, an additional load does not need to be considered. In sensitive operational areas, attaching a bio filter may be an option. The exhaust gas from the CHP-engine may be a critical factor, since with CO as a gaseous fuel, CO emissions are also increased. Contrary to natural gas or fermentation gas engines, whose main fuel represents methane, the CO emission from the wood gas engine cannot serve as an indicator for a poor combustion in the engine but is rather a consequence of fuel slip, which is exhibited by every engine.
Solid emissions
The solid residues from the gasification process are different ashes: Reactor ash from the wood gas reactor essentially consists of the mineral substances, which are contained in the wood. Unburned organic residual substances are contained in traces. Ash from the cyclone consists mainly of unburned wood particles, which are loaded with tars. The third ash fraction forms ash from the textile filter, which contains besides fine dust also the adsorbent material. The adsorbent, which is strongly loaded with tars, consists to 20 % of activated charcoal.
Liquid emissions
The condensate resulting from the cooling of the cleaned wood gas from 150°C to 25°C is essentially contaminated with fine dust particles and also some condensed volatile organic substances which are not easily adsorbable by activated charcoal. Unfortunately they also contain some organics which are not easily biodegradable.
2.2.2 Safety measures
Gaseous emissions
Use of oxidation catalysts decreases the CO-emissions from the gas engine substantially. Reaching the strict emission limit values of the “TA Luft” for natural or fermentation gas driven stationary engines is however still a technical and also economic problem. Specific regulations for wood gas engines were not adhered to in the “TA Luft” or other standards.

Session 3 – Risk assessment and permission procedure ________________________________________________________________________________
________________________________________________________________________________
144
Solid emissions
The ash fractions of the cyclone and the textile filter has to be disposed of as a dangerous waste. Since however both fractions are thermally usable, they are recycled to the reactor in the course of an operating optimization, where the unburned parts are decomposed in the high temperature zone again. Accumulation of tars does not take place here. Also accumulation of heavy metals is not to be expected, since in natural wood chips mercury is contained only in traces. Other heavy metals which may be contained in the wood in traces are extracted from the reactor with the reactor ash.
Liquid emissions
Also the condensate has to be disposed as a dangerous waste. Since for the gasification process a small quantity of fresh water must be admitted anyway, for this also the condensate can be used. In the course of the operating optimization the condensate is used in the process and is not released to the environment. Also here, accumulation of organic substances is not expected.
2.3 Fire prevention
2.3.1 Risks
The substantial factors of the safety of wood gas plants regarding the fire prevention form on the one hand the input material (wood chips) and on the other hand the gaseous fuel. Conventional fire safety devices like fire dampers or flame detectors are not the best choice, since on the one hand the gas is produced continuously without pressure or buffer and on the other hand, no flame formation takes place in the reactor.
2.3.2 Safety measures
Constructive safety measures – creation of fire compartments
The requirements of the local fire protection regulations are to be considered in the planning phase of the plant. In the security concept of the Pyroforce® wood gas plant, the creation of 3 fire compartments is recommended: Biomass storage, gasifier construction and the CHP-engine are separated from each other by appropriate structural measures (safety margins, fire protection walls).
Safety measures at the plant – installations
Temperature controls and water sprinklers are installed in biomass storage (conveyor), the dryer and the small buffer storage.
The reactor is driven with slight negative pressure (about 8 mbar below atmospheric pressure), to avoid the discharge of flammable gas. All in- and output installations for solid substances are accomplished with rotary valves. The downcomers for ash extraction are equipped with two alternating flaps to prevent air intake to the system.

Session 3 – Risk assessment and permission procedure ________________________________________________________________________________
________________________________________________________________________________
145
The gas pipe to the CHP-engine is equipped with a conventional fire safe fast action valve. The pipe between the gas compressor and CHP-engine is fully welded Thus it can be considered “long-term technical tight”.
The emergency torch is also equipped with a conventional fire safe fast action valve.
Alarm system, fire fighting
The fire alarm systems are installed locally as optical and acoustic warning devices. Moreover, warnings can be sent from the central control software in form of a SMS on a mobile telephone. For the first fire fighting, corresponding installations (extinguisher) are to be provided from the operator of the plant according the local regulations.
2.4 Explosion prevention
2.4.1 Risks
The relevant components of the wood gas, carbon monoxide and hydrogen, are able to build an explosive mixture with air.
For the operation of the emergency torch, propane gas (or another fuel gas) gas is needed for piloting the flare. Also this gas is able to create an explosive atmosphere.
2.4.2 Risk analysis
Normal operating conditions and maintenance work
Under normal operating conditions no explosion risk is present. Maintenance shall be accomplished exclusively by trained personnel and according to the manual. If the exchange of the propane gas cylinders takes place with consideration of the relevant safety precautions, also in this range no risk for explosion exists.
Start up / shut down of the plant
During the start up and shut down of the plant, slight deflagrations can take place in the reactor, which are intercepted by the plant construction. During these procedures, the product gas is ducted through the emergency flare and the plant is purged with nitrogen. Under adherence of the manual, during these work no explosion risk exists.
Operational disturbances and predictable errors
Operational disturbances can occur with highest probability in form of failures of auxiliary installations (e.g. the conveyor system). For operational disturbances a multi-level alarm system is installed, which releases automatically the respective alarm assigned safety chain. If it comes to an external power failure, the CHP-engine is switched off by the net frequency control. All valves of the plant are steered pneumatically, in the case of a missing power supply, the valves are driven in fail safe positions.
Predictable operation failures
Predictable operation failures can take place during inappropriate operation of the plant, by neglect of the manual or by non-operating personnel. The plant is to a large extent secured

Session 3 – Risk assessment and permission procedure ________________________________________________________________________________
________________________________________________________________________________
146
for this case by the control software, substantial and safety-relevant operating parameters can exclusively be changed by the manufacturing enterprise or specially trained maintenance personnel.
2.4.3 Safety measures
Primary explosion prevention
The primary explosion prevention shall avoid the creation of explosive atmosphere with appropriate measures. At the Pyroforce®-plant, the following measures are adopted:
A superordinate control for safety-relevant parameters with limited access is provided. Thus these parameters cannot be changed by local personnel.
All valves of the plant are controlled pneumatically, in the case of a missing power supply, the valves are driven in their fail safe position.
The entire gasifier construction and also the gas cleanup are run under a slight vacuum. Thus no escape of wood gas can take place at possibly arising leakages in the system, but outside air is rather sucked into the system. An on line oxygen sensor is monitoring the wood gas. In case of oxygen excess, the plant is automatically shut down.
All inputs and outputs for solid substances are accomplished using rotary valves or double alternating flapsin order to avoid any inleakage of air into the system.
Control of the operating parameters oxygen, pressure and temperature takes place continuously.
In the case of a failure in operation, the plant is shut down automatically by the actions of a multilevel alarm system:
Shut down of the CHP-engine
Stopping of the biomass input
Wood gas is burned at the emergency flare
Nitrogen flush is initiated
Secondary explosion prevention
The secondary explosion prevention shall avoid ignition sources in dangerous areas. Therefore explosion zones are defined, in which special regulations apply. The classification of the zones has to be made according to the guideline 1999/92/EG (ATEX 118a).
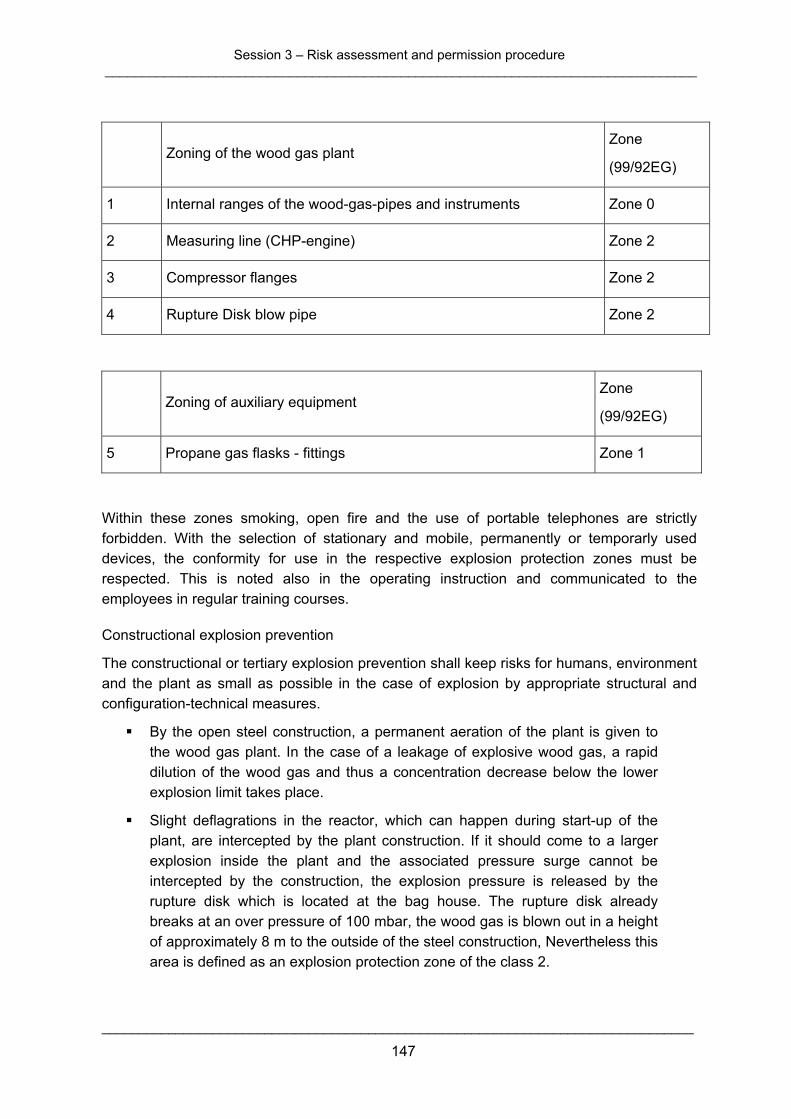
Session 3 – Risk assessment and permission procedure ________________________________________________________________________________
________________________________________________________________________________
147
Zoning of the wood gas plant
Zone
(99/92EG)
1 Internal ranges of the wood-gas-pipes and instruments Zone 0
2 Measuring line (CHP-engine) Zone 2
3 Compressor flanges Zone 2
4 Rupture Disk blow pipe Zone 2
Zoning of auxiliary equipment
Zone
(99/92EG)
5 Propane gas flasks - fittings Zone 1
Within these zones smoking, open fire and the use of portable telephones are strictly forbidden. With the selection of stationary and mobile, permanently or temporarly used devices, the conformity for use in the respective explosion protection zones must be respected. This is noted also in the operating instruction and communicated to the employees in regular training courses.
Constructional explosion prevention
The constructional or tertiary explosion prevention shall keep risks for humans, environment and the plant as small as possible in the case of explosion by appropriate structural and configuration-technical measures.
By the open steel construction, a permanent aeration of the plant is given to the wood gas plant. In the case of a leakage of explosive wood gas, a rapid dilution of the wood gas and thus a concentration decrease below the lower explosion limit takes place.
Slight deflagrations in the reactor, which can happen during start-up of the plant, are intercepted by the plant construction. If it should come to a larger explosion inside the plant and the associated pressure surge cannot be intercepted by the construction, the explosion pressure is released by the rupture disk which is located at the bag house. The rupture disk already breaks at an over pressure of 100 mbar, the wood gas is blown out in a height of approximately 8 m to the outside of the steel construction, Nevertheless this area is defined as an explosion protection zone of the class 2.

Session 3 – Risk assessment and permission procedure ________________________________________________________________________________
________________________________________________________________________________
148
Organisational preventive measures
For the operation of the wood gas plant, operating instructions are written, which contain activity-referred, mandatory behavior rules for the employees. The operating instructions describe, besides the work-specific risks for human beings and the environment, also preventive measures to be taken. From the documents follows in particular, at which areas explosion risks exist, which mobile instruments may be used and which measures are to be taken.
The employees must be trained on explosion risk of the plant and preventive measures to be taken. A repetition of the training takes place in appropriate time intervals.
An explosion prevention document according to the regulations of the guideline 1999/92/EG is to be created and maintained by the operator of the plant.

Session 3 – Risk assessment and permission procedure ________________________________________________________________________________
________________________________________________________________________________
149
Session 3 – Panel discussion II ________________________________________________________________________________
________________________________________________________________________________
150
Panel discussion II Risk assessment and permission procedure –
Lessons learnt
Chairman: Prof. H. Hofbauer
Participants: F. Lettner, L. Cusco, H. Timmerer, T. Koch, A. Hofmann, R. Buehler
After session 3, which treated risk assessment and permission procedure, had been completed, the chairman of the second panel discussion, Prof. Hofbauer, asked the speakers to discuss the results and lessons learnt of this session.
In his introductory note he provocatively concluded that, as a matter of fact, all questions concerning risk evaluation and permission requirements should have been answered in the course of the presentations. Especially due to the extensive analysis performed by the University of Technology of Graz/Austria, a comprehensive guide for manufacturers and operators was elaborated which should well cover all aspects of gasification commissioning and operation.
In response, open points were readily addressed by gasifier manufacturers. Especially concerning long-term operability many questions still have not been answered satisfactorily. One of the most striking problems appears in relation to corrosion stability, since corrosion mechanics and the consequences of acidic attack during start-up and shut-down are not clear yet. Evidently, more experience would be needed, but this depends on gasifiers being commissioned. Consequently, a vicious circle results.
Concerning documentation requirements, enormous efforts are needed for gasifier commissioning. Note that each permission is only valid for one specific plant. Typically more than 140 pages must be submitted, indicating not only the amount of technical details involved but also the high costs of the process. For a first commissioning, which is most difficult, four to five weeks are needed to find relevant laws and regulations, acquire data from manufacturers and partners and set up a first written draft. Thereafter, a careful translation into legal language must follow. In an average procedure, documents passed to the authority will be discussed in a meeting after six weeks, where also supplements are called for and citizens participate. After this, further meetings will be announced, until permission is obtained. Despite complete documentation, a high level of uncertainty remains, since authorities are usually not familiar with gasification systems. Prejudices and aversion may also hinder permission.
Yet, authorities do not place a high value on extensive documentation, but only want an adequate list of possible incidents and corresponding action to prevent or deal with these. The main focus should therefore lie on convincing authorities that the main problems have been understood and taken into consideration. Of course, proper solutions are crucial for

Session 3 – Panel discussion II ________________________________________________________________________________
________________________________________________________________________________
151
permission. The better the structure of the risk assessment and the more proper safety measures, the faster the permission procedure will be.
Concerning the question whether there should not already exist sufficient knowledge on permission requirements from wood combustion plants, there was general agreement that gasification involves several additional risks, such as explosion threats. Therefore, numerous new crucial aspects have to be dealt with. In addition, manufacturers are confronted with various organizations involved in the permission procedure, so communication is often difficult. Consequently, it was suggested that names and addresses of officials be exchanged among operators and manufacturers to ease information flows. However, practical experience from Switzerland shows that county boundaries are often obstacles to efficient knowledge transfer.
In relation to the limited availability of safety standards, it was argued that much knowledge may well be adopted from other related industries, particularly from coal gasification and refining. It remains questionable why this has not happened to a greater extent.
In the second part of the discussion, the topic of commercial gasification plants was addressed, especially, of course, in relation to risk assessment and permitting procedure.
In a first step, a common definition was looked for, specifying when a gasification plant is actually considered to be commercial. Consensus was reached that no minimum operation time or installation capacity determines commercialization, but that gasifiers are commercial if they can be sold to a customer. Although technologies which have been operated and modified for several generations are commonly regarded as commercial, the selling prospective is decisive. As a result, risk and maintenance uncertainties only influence commercialization indirectly, as consumers must be willing to buy gasifiers given their safety risks. Earnings from operation must therefore outweigh expected costs of maintenance, safety hazards, etc.
It was also found that procedures are basically alike for small pilot plants and large scale facilities. However, the level of detail requested by authorities for permission differs, obviously significantly confining documentation for small plants. This is due to the fact that risk levels are different. Nevertheless, HSE aspects are not only important for commercial plants, since pilot plants may cause danger to workers and the environment as well. Clearly, public awareness will be different for 300 kW and 300 MW plants. As differences in plant size usually lead to different authorities being in charge, different interpretations of plant documentation may result, thus increasing costs and time for permission. Additionally, the focus may be put on different parts of the documentation.
Finally, the question of liability was discussed. Since new technologies naturally incorporate a high level of uncertainty, liability for defects is problematic. Especially if workers are injured or killed, manufacturers fear ruinous claims. After 20 years of experience as with scrubbers, operators are on the safe side, but developing new processes and apparatuses is not easy.
Even though generalization is difficult due to diverging legal systems, it was agreed that liability be limited to cases where feasible measures and precautions were not fulfilled properly. This is often tied to generally accepted rules in engineering which define a certain “code of practice”. However, such rules do not exist for gasification, and can thus only be

Session 3 – Panel discussion II ________________________________________________________________________________
________________________________________________________________________________
152
derived from other industries and related technologies. Evidently, this is not satisfactorily and once more shows the need for further work in this field.

Session 3 – Panel discussion II ________________________________________________________________________________
________________________________________________________________________________
153