health seeking behavior, willingness and ability to pay ...pdf.usaid.gov/pdf_docs/pnacn529.pdf ·...
TRANSCRIPT

1
Health Seeking Behavior, Willingness and Ability to Pay for Selected Health Services inUrban Family Health Partnership (UFHP) Areas of Bangladesh
Report based on the field survey carried out during October-December 1999
FINAL REPORTAUGUST 2000
Report prepared by:
M. Mahmud KhanZahidul Quayyum
Shakil AhmedNazmul Sohel
Badal Chandra Dhar
Study funded by: UFHP and USAID
Health Economics Programme, Public Health Sciences Division, ICDDR,B, Dhaka,Tulane University, New Orleans, USA andPHR, Abt Associates, USA

2
Acknowledgement
We would like to thank Dr Kanta Jamil of USAID, Dhaka, Mr. Peter Cornell of JSI, Dr Ahmedul Kabir , Mr NoorMohammed of UFHP/JSI for comments and suggestions during the designing of the project. We acknowledge thehelp received from the staff members of UFHP/JSI and UFHP funded NGOs during the data collection phases.
This research was funded by USAID to the Health Economics Programme of ICDDR,B - Centre for Health andPopulation Research, ICDDR and through the partnership for Health Reform (PHR) of Abt. Associates. ICDDR,Backnowledges with gratitude the commitment of donors to the Centre research effort.

3
Table of Contents
ExecutiveSummary………………………………………………………………………………. i1.INTRODUCTION………………………………………………………………………………. 12.UFHP HEALTH CARE DELIVERYSYSTEM………………………………………………. 43.OBJECTIVES OF THERESEARCH………………………………………………………….. 54.METHODOLOGY OF THESTUDY………………………………………………………….. 6 4.1 SurveyMethod………………………………………………………………… 6 4.2 Data Processing andAnalysis…………………………………………………. 135. DEMOGRAPHIC AND SOCIO-ECONOMC CHARACTERSTICS OF THESURVEYED
HOUSEHOLD…………………………………………………………………………………. 16 5.1 CensusInformation…………………………………………………………….. 16 5.2 Characteristics of SurveyedHousehold………………………………………... 196.KNOWLEDGE AND UTILIZATION OF SELECTED HEALTH CARESERVICES……….. 23 6.1 AntenatalCare……………………………………………………………….. 6.1.1 Knowledge about ANCservices…………………………………………….. 6.1.2 Uitlization of ANCservices…………………………………………………. 6.1.3 Willingness to pay for ANCservices……………………………………….. 6.1.4 Factors affecting willingness to pay for ANCservices………………………
2323252830
6.2 Immunization…………………………………………………………………6.2.1 Knowledge about child immunization services………………………………6.2.2 Utilization of Immunization Services………………………………………...6.2.3 Willingness to pay for Immunization………………………………………...
31313233
6.3 Acute Respiratory Infections (ARI) and Diarrhoea…………………………..6.3.1 Knowledge about ARI ……………………………………………………….6.3.2 Knowledge about diarrhoea………………………………………………….6.3.3 Utilization of Curative Services……………………………………………...
353536

4
37
6.4 Family Planning Services ……………………………………………………6.4.1 Knowledge about Family Planning…………………………………………..6.4.2 Utilization of family planning services………………………………………6.4.3 Willingness to pay for family planning services……………………………..6.4.4 Determinnats of Willingness to pay fro fam,ily planning services…………..
3838394041
7. COMMUNITY HELATH WORKER CONTACTS…………………………………………... 438. CHARACTERSTICS OF NON-USERS OF HEALTH SERVCIES………………………….. 459. EXIT INTERVIEW OF CLIENTS AT UFHP CLINICS……………………………………… 4710. WILLINGNESS TO PAY FOR IMPROVED QUALITY OF CARE……………………….. 4811. COMPARISOSN OF UFHP AND OTHER NBGO CLINIC………………………………... 5212. ABILTY TO PAY FOR BASIC HEALTH PACKAGE……………………………………... 5313. CONCLUSION AND POLICY IMPLICATION…………………………………………….. 56

5
ANNEXURES – A QUESTIONNAIRE…………………………………………………………. Q-1A1. HOUSEHOLD CENSUS FORM……………………………………………………….. Q-1A2. PART I: INDIVIDUAL HOUSEHOLD INFORMATION…………………………….. Q-2A3. PART II: KNOWLEDGE ABOUT THE BENEFITS AND COSTS OF
PREVENTIVE AND CURATIVE CARE……………………………………………… Q-5 A4. PART III: ANTE NATAL CARE (ANC)………………………………………………. Q-25 A5. PART IV: CHILD IMMUNIZATION………………………………………………….. Q-31 A6. PART-V: FAMILY PLANNING………………………………………………………. Q-37 A7. PART-VI: ILLNESS…………………………………………………………………….. Q-43 A8. PART VII: EXIT INTERVIEW………………………………………………………… Q-49 A9. PART VIII: FACILITY SURVEY…………………………………………………… Q-53
ANNEXURES – B TABLES…………………………………………………………………….. A-1 Table I-1: Age distribution of the household members in the UFHP clinic areas…………… A-1 Table I-2 : Age distribution of household members in the UFHP clinic areas…………….… A-2 Table I-3 : Age distribution of household members in the UFHP clinic areas………………. A-3 Table I-4 : Age distribution of household members in the UFHP clinic areas………………. A-4 Table I-5 : Years of schooling of the head of the households surveyed in the UFHP areas…. A-5 Table I-6 : Years of schooling of the head of the households by UFHP Urban categories….. A-6 Table I-7 : Years of schooling of the head of households by UFHP Urban categories……… A-6 Table I-8 : Percentage distribution of households into household expenditure groups by UFHP areas……………………………………………………………………….. A-7 Table II-1: Women’s knowledge about the need for ANC and opinion about the number of ANC visit………………………………………………………………………… A-8 Table II-2 : Women’s knowledge about the benefits of ANC visit………………………….. A-9 Table II-3 : Women’s knowledge about possible sources of ANC in UFHP areas by type of providers……………………………………………………………………… A-10 Table II-4: Women’s knowledge about ANC providers who do not charge any money in UFHP areas………………………………………………………………………. A-11 Table II-5: Women’s knowledge about ANC providers charging money in UFHP areas and by socio-economic group………………………………………………………… A-11 Table II-6: Women’s knowledge about the service charges for ANC services in UFHP Areas…………………………………………………………………………….. A-12 Table II-7: Visit for ANC by different categories…………………………………………… A-13 Table II-8: Source of ANC for respondents (delivered in last one year ) in UFHP areas…… A-13 Table II-9: Source of ANC for respondents (currently pregnant) in UFHP areas…………… A-13 Table II-10 : Reasons for selecting the providers used for ANC services…………………… A-14 Table II-11: Expenditure on ANC services by different socio-economic groups and by Source…………………………………………………………………………… A-15 Table II-12: Expenditure on ANC services by different socio-economics groups and by source (NGO Category A)……………………………………………………… A-16 Table II-13 : Expenditure on ANC services by different socio-economics groups and by source (NGO category B)……………………………………………………… A-17 Table II-14 : Expenditure on ANC services by different socio- economics groups and by source (NGO category C)……………………………………………………… A-18 Table II-15: Source of ANC services by economic status of households…………………… A-19 Table II-16: Comments on the level of payment made for ANC services by different socio- economic groups and by source……………………………………………….. A-20 Table II-17: Median willingness to pay for ANC by different socio-economic groups and NGO category………………………………………………………………….. A-21

6
Table II-18: Mode willingness to pay for ANC by different socio-economic groups and NGO category………………………………………………………………….. A-22 Table III-1: Knowledge about the need for childhood immunization……………………….. A-23 Table III-2: Women’s knowledge about the source of immunization in UFHP areas and by socio-economic groups and source of service………………………………….. A-24 Table III-3: Women’s knowledge about the benefits of immunization by UFHP urban Categories………………………………………………………………………. A-25 Table III-4: Distribution of immunization events by date of last visit and urban categories… A-25 Table III-5: Reasons for Selecting providers for Immunization by different service Providers………………………………………………………………………… A-26 Table III-6: Expenditure on Immunization Services by different socio-economic groups and by source……………………………………………………………………. A-27 Table III-7: Comments on the level of payment made for Immunization services by socio- economic groups and by source (For those who paid a fee)……………………. A-28 Table III-8: Average willingness to pay for Immunization services at UFHP by different socio- economic groups and by NGO category………………………………… A-29 Table IV-1: Women’s knowledge about ARI in UFHP areas……………………………….. A-30 Table IV-2: Women’s knowledge about the source of treatment for ARI in UFHP areas and by socio-economic group………………………………………………….. A-31 Table IV-3: Knowledge about ARI related Service Providers who provide Service free of Cost by Urban Categories and Household Socio-economic Status………….. A-32 Table IV-4: Knowledge about ARI treatment providers charging money in UFHP areas by socio-economic group……………………………………………………….. A-33 Table IV-5: Women’s knowledge about service charges for ARI treatment in UFHP areas by socio-economic groups………………………………………………………. A-34 Table IV-6: Knowledge about the source of treatment for diarrhoea in UFHP areas by socio-economic groups………………………………………………………….. A-35
Table IV-7: Women’s knowledge about providers who provide treatment for diarrhoea free of charge in UFHP areas by socio-economic groups………………………. A-36 Table IV-8: Women’s knowledge about the treatment providers for diarrhoea charging money in UFHP areas and by socio-economic group………………………….. A-37 Table IV-9: Source of care for illness by different categories of UFHP areas………………. A-38 Table IV-10: Average Expenditure per illness episode by Source of services by different categories of UFHP areas……………………………………………………… A-38 Table V-1: Women’s knowledge about the source for getting family planning methods in UFHP areas by Socio-economic group………………………………………….. A-39 Table V-2: Women’s knowledge about family planning methods related service providers who provides service free of cost by urban categories and socio- economic group A-40 Table V-3: Source of services for selecting providers for Family Planning by different NGO category……………………………………………………………………. A-41 Table V-4: Source of supplies by type of Family Planning method…………………………. A-42 Table V-5: Reasons for selecting providers for Family Planning……………………………. A-43 Table V-6: Expenditure on Family Planning services by different socio-economic groups and source of services……………………………………………………………. A-44 Table V-7: Comments on the level of payment made for Family planning services by different socio-economic groups and by source of service………………………. A-45 Table V-8: Willing to pay for Family Planning services more than what has been paid by different socio-economic groups and by source of service and by NGO category… A-46 Table VI-1: Average waiting time in minutes and travel cost and treatment costs in taka by service type in UFHP clinic…………………………………………………. A-47 Table VI-2: Will pay more than what is paid by service type in UFHP clinic………………. A-48 Table VI-3: Average willingness to pay in Taka by service type in UFHP clinic…………… A-49

7
Table VI-4: Services provided by UFHP and NGO facilities……………………………….. A-50 Table VI-5: Laboratory Services provided by UFHP and NGO facilities…………………… A-51 Table VI-6: Registration fee for the facilities……………………………………………….. A-51 Table VI-7: Staff positions at the facilities………………………………………………….. A-52 Table VII-1: Satisfaction with service provided for ANC by different socio-economic groups and by source of service and by NGO category………………………. A-53 Table VII-2: Satisfaction with service provided for Immunization by different socio- economic groups and by source of service and by NGO category……………. A-54 Table VII-3: Satisfaction with service provided for Family Planning by different socio- economic groups and by source of service and by NGO category……………. A-55 Table VII-4: Satisfaction with service provided for Illness by different socio-economic groups and by source of service and by NGO category……………………….. A-56 Table VII-5: Satisfaction with service provided for ANC by different socio-economic groups and by source of service and by NGO category………………………. A-57

i
Executive Summary
1. The study has been conducted to understand health-seeking behavior, willingness andability to pay for health services of the people living in the catchment area of the UFHPfacilities. The purpose of this study is to help the policy makers in deciding the level of usercharges for selected ESP services, and to describe the possible impact of increasing usercharges on utilization. The study also examined the role of community level workers inimproving the knowledge and utilization of health care services and about illnesses.
2. The study was conducted in areas served by 10 different UFHP funded NGOs providingESP services. Households were selected from the catchment area of the static and satelliteclinics of selected UFHP NGOs for the survey. These NGOs are classified in three differentcategories: A, B, C. Category A clinics are located in the metropolitan area, B and C in themunicipal areas and small cities respectively. Listing of households was carried out withinone-mile radius from the selected clinics. About 300 households were entered in the censuslist for each static/satellite clinic for the survey. These households were used as the samplingframe for the study. Four satellite sites were selected for each static clinic, hence the surveywas carried out in the catchment area of 40 satellite sites, and ten static sites. The censuscollected data from about 15,000 households residing in the catchment areas of 50 sites.Information on basic household characteristics was collected to identify the eligiblehouseholds for in-depth household survey.
3. From the 300 households selected in each clinic area (static and satellite), 80 householdswere randomly drawn by categorizing them into different criteria/conditions for selection.The conditions were: currently pregnant women, and women who delivered recently,currently married women of reproductive age group and children of less than five years ofage. The target was to interview at least 60 households from the 80 households. The totalnumber of households surveyed in each clinic (the main static clinics and four satelliteclinics) area were 300. For the ten-clinic area, 3000 households were interviewed for the in-depth survey on health seeking behavior, pattern and utilization of health facilities andwillingness to pay for medical care services.
4. Currently married women of reproductive age group were interviewed for the in-depthsurvey using six sets of household questionnaires. The “household informationquestionnaire” was used to collect information on demographic information, socio-economic status of the households, and on visit of field worker for social mobilization. The“knowledge questionnaire” collected information about women’s knowledge on: familyplanning methods, ANC, diarrhea and ARI of children, child immunization, signs ofseverity of diarrhea and ARI, positive and negative externalities of seeking variouspreventive and promotive health care services. Information on women’s knowledge aboutthe providers in the locality, and prices they charge was also collected.
5. The in-depth survey collected information on care seeking behavior for selected ESPservices: child immunization, family planning services, and general illness. Information onlast source used for these services, the amount of money spent, ability to pay, willingness topay additional amount of money for the services/care, and opinion about the quality ofservices and willingness to pay for the quality improvement was also collected.
6. To crosscheck the household information on quality and willingness to pay, the studysurveyed a number of clients who have used the UFHP facilities. A questionnaire on“facility survey” were used to collect information on quality of care, type of services
ii
provided, the cost recovery strategy and charges for services. Two of the 10 static facilitieswere selected for this survey.
7. Patient’s observation and exit interviews were conducted in six of the 10 facilities. This wasdone to find out the procedure followed by the NGO clinics to process patients. For policypurposes, it is important to know at what point the clients are informed about charges, whoprovides the information, who collects the fees, and who assess the clients’ ability to pay.The exit interviews collected information on reasons for using the facility, total waitingtime, total travel time and expenditure, total expenditure at the facility, opinion about thelevel of users fees, willingness to pay an additional amount for the services with and withoutquality improvements. Information was collected for 177 clients through this exit interview.
8. About 80% of the households in the census are from the satellite clinic areas. This is due tohigher weight assigned to satellite clinics. The population in the satellite clinic area hashigher number of children per household than that in static clinic areas. The number ofcurrently married women per household was about one for all areas. The number of womendelivering over the last 12 months varied from 7 per 1000 households in urban category Ato 12 per 1000 households in category C. About 17% the households used poor constructionmaterial in the catchment areas of static clinics. This ratio was found to be 50% in theareas of satellite clinics. Among the census households 55% indicated that the main cause inthe household are involved in daily wage employment.
9. The average household size of the households selected for the in-depth survey was 5.3. Theage distribution of the population of the sample households is biased towards lower agegroups. About 21 % of the individual belong to the age group less than five years. Thepopulation in the age group 15-39 is also higher than the national average.
10. About 60% of the head of the households in the static clinic areas reported to havecompleted five years of education. This proportion was about 28% in the satellite clinicareas, where half of all household heads had no formal education.
11. The households living in the satellite clinic areas were much poorer than the households instatic clinic areas. About 57% of households in satellite clinic areas belonged to less thanTk. 3000 monthly expenditure group. On the other hand, 27.8% of households in staticclinic area and 5.7 % in satellite clinic areas belonged to more than Tk. 7,000 expenditurecategory.
12. For all women in the survey (3148 currently married women in the reproductive agegroup), 93.5% knew that pregnant women should go to a medical care provider eventhough they are not sick. Lack of knowledge about ANC was 2% in category A clinic and12% in category C clinic.
13. About 30% of the women mentioned that a woman should have 3 to 5 ANC visits over thewhole pregnancy period. About 25% thought that the number of visits should be once permonth and 13% mentioned either less than three visits or more than 10 visits.
14. Most of the women (about 91%) in the survey were aware of the benefits of ANC. Thebenefits mentioned are ANC service helps to identify mothers’ physical problems and

iii
position of the baby. Poor women appear to be less aware about the benefits of ANC thanthe women from richer households.
15. About 92% of women reported that they know at least one ANC provider in the locality.About 80% of all women mentioned public facilities as one of the ANC providers. Thisproportion varies with the degree of urbanization of the area. In most urbanized area(Category A), only 62% of women mentioned public facility as a source but in the leasturbanized part of the country (Category C), 91% of respondents mentioned public facilities.
16. In most urbanized area (category A), 62% of women mentioned UFHP clinic while incategory C area only 29% mentioned it as a source. More than 45% of women from theexpenditure category less than Tk.5,000 per month mentioned UFHP clinic as a sourcecompared to less than 30% for households with expenditures exceeding Tk.5,000.
17. About 30% of women were aware of a facility where ANC was available free in theirlocality. About 46% women in “C” category knew where they could find free ANC servicescompared to 27% and 13% in categories “B” and “A” respectively. About a quarter ofwomen could not mention whether the facilities in the locality charge money or not.
18. About 76% of women were aware of at least one ANC provider charging money. 50% ofthem mentioned UFHP clinic as one of the providers providing care against a fee. About28% from the lowest expenditure category and 13% from the highest expenditure categorylacked knowledge about a facility, which is charging fee for ANC.
19. The respondents in lowest expenditure group reported that the normal charge for ANCrange from Tk.20 and 30, and those in the highest expenditure group reported that it rangefrom Taka 54 and 90.
20. The average price of UFHP clinic ANC services was reported to be Tk.14. About 18% ofwomen consider the UFHP price as ‘high’ and more than 60% thought that the price was‘OK’. Proportion of women reporting UFHP prices as `high’ declines with improvingeconomic status.
21. 63% of women who delivered within 12 months prior to the survey sought ANC while 50%of women pregnant at the time of survey used ANC services. The lower rate amongcurrently pregnant group may be due to early stage of pregnancy for some women.Proportion of women seeking ANC was found to be highest in Category B urban areascompared to that in A or C.
22. Over the last two-year period, the public sector as a source of ANC has declined in categoryA and category B of urban areas. In category C, role of public sector in the provision ofANC has remained more or less static. A significant expansion in the use of UFHP clinics incategory B has been observed. In all categories, a higher proportion of women reportedusing UFHP clinics and this expansion was mainly at the expense of public sector.
23. The modal reason for using the public providers/facilities was `free service and free drugs’.The second most important reason mentioned was the presence of `qualified provider’ inthe facility. For the users of private sector providers, the most common reason mentionedwas the presence of `qualified providers’ followed by `convenient hours’ of the facility. ForUFHP clinics, the modal group was that the facility is located `near the house’.

iv
24. About a third of all women seeking ANC reported an expenditure of Tk.26 or more pervisit. A significant proportion of women obtained ANC free of charge (24%). The use of freeANC services was more common among the poor households. Only about 15% of womenbelonging to household expenditure category Tk.5001 and above sought free ANC.
25. The average cost per ANC visit varies from Tk.18.30 for the lowest economic status groupto Tk.94 for the highest economic status group. On the average, the reported ANC visit costwas Tk.42. The average cost of ANC in private sector was reported at Tk.110 while theaverage costs at UFHP clinics and public facilities were only Tk.16 and Tk.17 respectively.Other NGOs charge about Tk.28 on the average according to the women using the facilities.
26. Among the lowest household expenditure group, 38% used the public facilities and another34% used UFHP facilities. Only about 13% of the poorest group went to private providersfor getting ANC. For the richest group, 56% went to private providers and another 21%went to public facilities. Utilization of ANC services from UFHP clinics shows a systematicdownward trend with improving economic status.
27. The estimates of the logistic regression model show that the utilization of ANC is affected byhousehold expenditure level (up to Tk.6,000), having primary level education, knowledgescore of woman about ANC, knowledge about the presence of a health center that providesfree ANC care. The price charged by the clinics for ANC care was not statisticallysignificant in the model.
28. About a fifth of all ANC users thought that the price they paid was too high and two-thirdsconsidered the price as `just right’
29. About 60% of women from poor households reported their willingness to pay (WTP) someadditional money (over what has been paid) for the services. This proportion tends toincrease with household income excepting the expenditure category Tk.5,001-7000. Forpublic facilities the proportion was 66% and for UFHP clinics, it was 60%. In category Curban areas, 65% of women said that they will pay more money for ANC while theproportions were 62% and 58% for category A and B areas respectively.
30. The median value of willingness to pay was found to be about Tk.40 for public sector,Tk.150 for the private sector and Tk.40 for NGOs, when we consider only those women whopaid for their last ANC visit. If the last visit was free, the willingness to pay amounts wassignificantly lower, Tk.13 for public sector, Tk.27 for private and Tk.17 for NGO facilities.
31. Among the women who paid some money during the last ANC visit at UFHP, the averagewillingness to pay varies from Tk.22 for the lowest economic category to Tk.41 for therichest group. There is a clear increasing trend in willingness numbers with improvingeconomic status.
32. Estimates of regression models suggest that knowledge about ANC service affect the WTPsignificantly in all areas. A 10% increase in knowledge index from the mean value willincrease the willingness to pay for ANC services by about Tk.1.25. Access to free carereduces WTP significantly, it is about Tk.14 lower than the others who obtained care at afee. The effect of access to free care was strong in urban area A and B but the variableshows no impact in urban area C. Education of woman seeking care is another significantvariable in affecting WTP. Those who have more than five years of education are willing topay Tk.50 more than others.

v
33. Economic status has no impact on WTP for ANC services except in Urban C areas where ithas been found that an increase in the household economic status or expenditure levels by10% will increase the WTP by about Tk. 1.81.
34. 98% of women knew about the need for immunizing children by age 12 months and theyalso knew the sources of such services. The most common source mentioned was the `publicfacilities’ followed by the UFHP clinics. Other NGOs were also mentioned by about aquarter of all women. Private facilities were mentioned by only 5% of respondents.
35. Ninety nine percent of women in the survey knew about the benefits of childhoodimmunization. More than 73% of the respondents mentioned that immunization preventsdiseases of children.
36. 31% of the children in the survey were not immunized. Almost perfect knowledge aboutimmunization did not translate into actually obtaining immunization. In terms ofproportion of children immunized, urban category B was the best followed by urbancategory A and C.
37. Out of the total number of immunized in the last three months, 48% obtained their lastimmunization from the public facility and 32% obtained that from the UFHP clinics. Only5% reported obtaining immunization from private facilities. Other NGOs providedimmunization to 15% of children.
38. The modal responses for reasons for choosing the facility: close to the house for publicsector, other NGOs and UFHP, free service or free drugs for public sector and other NGOs,convenient hours for private facilities. For UFHP clinics, close to the house is thepredominant reason (52% mentioning the reason).
39. About 50% of all women obtaining immunization for children got the service free of costand another 44% received the service by paying less than Taka 10. In public facilities about73% of immunizations were obtained free. In UFHP clinics, 37% received freeimmunization. The proportion of children getting free immunization appears to beindependent of expenditure levels.
40. The average charge for one immunization visit was Tk.3.73. Cost of immunization variesquite significantly by source of care. The average cost of immunization in the public sectoris Tk.1.42 and in other NGOs, it was Tk.7.63. The UFHP clinics charge about Tk.5.00 forimmunization on the average. The average cost of immunization in the private sector is alsoquite low, lower than what ‘other NGO’s were charging.
41. Although the immunization charges are low, 17% of mothers felt that the charge was toohigh. Almost 70% of the mothers were of opinion that the charges they have paid were`alright’. Excepting the richest household group, about 20% mothers from all other groupsfelt that the prices were too high. About a quarter of all mothers from expenditurecategories Tk.5,000 and above reported that the price they paid were too low. About a fifthof UFHP users thought that the UFHP price for immunization was too high and anotherone fifth thought that the UFHP price is too low.
42. About 56 % of the mothers who have paid some money for immunization during the lastvisit were willing to pay more money. The proportion willing to pay more money remains at

vi
around 50 to 60% for expenditure categories less than Tk.7,000, and 84% in the next higherexpenditure group. The proportion of households willing to pay more was about 65% forboth public and private providers and about 50% for UFHP and other NGOs. Proportionwilling to pay more for immunization was lowest in category A areas and highest in thecategory B areas.
43. The average WTP for immunization were found to be Tk.11, Tk.15 and Tk.14 for public,private and NGO providers for those who paid some money in the last visit. The averagewillingness tends to increase with economic status of households. It remains about Tk.7 to 8for the mothers who did not pay anything during the last visit.
44. The estimates of multivariate analysis shows that household expenditure levels increasewillingness to pay by Tk.0.0007 for each Taka increase in expenditure. Five or more yearsof education of women increases the WTP for immunization by Tk.1.50, knowledge aboutthe presence of a free facility reduce WTP by Tk.4.70, etc.
45. About 48% of women could identify three major symptoms of ARI (unprompted) in thesurvey. In urban location A, a higher proportion of women could identify the symptoms(56%) while in urban category B about 42% could mention the three major symptoms.
46. More than 95% of women knew at least one provider for ARI related care. Knowledgeabout source of care was slightly higher in urban category C than in categories A and B.Three quarters of all women mentioned private facilities as a source while 47% mentionedpublic facilities as a source. The UFHP clinic as a source of care for ARI was mentioned byonly 14% of women. The average number of sources mentioned per woman in the surveywas about 1.4.Only 21% of women knew at least one provider who supply service free ofcost. The knowledge about the presence of free provider is much higher in urban categoryC than in other two urban categories. 24% in the lowest expenditure category knew a freecare provider but it was found to be about 18% for all other expenditure categories.
47. Although a high percent of women did not know a facility where ARI treatment wasprovided free of charge, about 90% knew a facility where ARI treatment is provided for afee. This type of knowledge about market situation is slightly lower in category C urbanareas.
48. On the idea of the respondent’s market price for ARI treatment, the average of maximumreported prices charged for ARI treatment was Taka 64.76 while the average of minimumwas Tk.40.64. The average prices show an increasing trend with expenditure levels of thehouseholds. The average price mentioned for UFHP was less than Tk.15, much lower thanthe average of the minimum prices in the locality. About 17% of women who knew aboutUFHP clinics mentioned that the price was too high and 14% thought that the price atUFHP clinics was low.
49. About 97% of women could identify a place where treatment for diarrhoea was available.Most of the women mentioned the public and private facilities as sources of care. Only 6%of women reported UFHP clinic as a possible source of care, indicating that they do notconsider UFHP clinic as a source of curative care services.
50. About 35% of women reported that they were aware of facilities where treatment fordiarrhoea was available free of charge. In urban category C, almost 50% mentioned that

vii
they knew a free facility for treating diarrhea but the proportion was less than 30% forurban categories A and B.
51. 78% of women were aware of at least one provider in the locality who delivers treatment fordiarrhea by charging money. This proportion was lowest in urban category C (68%) andhighest in urban category B (90%). The UFHP clinics were also mentioned as a source ofcare in exchange for money by only 8.5% of respondents. Less than 8% of women in thelowest expenditure category mentioned UFHP clinics as an option but the proportion wasabout 13% for the highest expenditure group.
52. The number of illnesses per household over the two-week period was 0.75. The reportedprevalence rate of illness among the survey individuals was about 141 per thousand.
53. 50% of all illness cases did not seek medical attention. The proportion not seeking carevaried from about 45% in urban category A to 54% in urban category C. Among the usersof medical care, more than 80% sought care from private providers and another 12%obtained care from public facilities. Only about 3% of illness cases obtained care from theUFHP clinics in the location, which is consistent with the response obtained from thewomen about their knowledge of sources of care for curative services.
54. The average cost of care was highest in urban category B followed by urban category A.The average cost in public facilities was also quite high. This may indicate that the severity-mix of the illnesses seeking care from public facilities may be higher than the severity-mixin other sources. The UFHP clinics show relatively low cost and the severity of casesshowing up in UFHP clinics, by definition, should be very low.
55. No relationship between willingness to pay and educational status of women, knowledgeabout illnesses, were found in multivariate analysis. Only variable that turns out to bestatistically important in explaining WTP is the expenditure level of households. Increase inthe household expenditure by Tk.100 per month will increase the willingness to pay forcurative care by about Tk.5.
56. About 97% of the women knew the places to get family planning methods. 67% of therespondent mentioned private providers as a source and 60% mentioned public facilities asa source. About 46% of women also mentioned UFHP clinics as a source. Knowledge aboutUFHP clinics as a source of family planning services was highest in urban area A. About1.9 sources per woman were noted. On the average this is the highest number of sourcesmentioned among all the different types of services considered in this study.
57. Women from higher economic status mentioned private sector as a source (more than 70%compared to 63% for the lowest expenditure category).
58. Only about one third knew about a free provider of family planning services in their area.About a quarter did not know whether the providers in the locality were free or not. In theurban category A only about 10% reported knowing a free provider but in urban categoryC more than 50% knew a free provider of family planning services.
59. About 24% of women mentioned public sector facilities as a source. Private providers andfacilities were mentioned by about 38% of women and 29% mentioned UFHP clinics. OtherNGOs and other providers constituted only a very small proportion of total, less than 10%of the current users. In category A area, 12% mentioned public sector as a source but in

viii
category C about 36% mentioned public sector as a potential source. The UFHP clinic wasmentioned as a source by 35% of women in A but by only 23% women in C.
60. Women selecting private sector as the source were basically pill users (96%) and UFHPclinic users were equally split between adoption of pill or condoms and injectables. Forinjectables, UFHP clinics were the principal suppliers accounting for 70% of total injectableusers. For IUD/Norplant and sterilization, public sector is the predominant supplier.
61. The modal reason mentioned for selecting public facility was that the services wereprovided free of cost. The modal reasons for private, UFHP and other clinics wereconvenient time of operation, close to the house and convenient time of operationrespectively. Privacy has been mentioned by 11% of responses for the reason for selectingprivate providers and by only 1.2% of the UFHP facility users. Cleanliness and lowerwaiting time was mentioned less than 3% of all respondents.
62. The average costs of family planning services vary quite significantly among all the sourcesof care. The average cost of family planning services in the public and private sectors wereTaka 1.00 and 14.00 respectively. For other providers, the average price was about Taka7.00.The average cost of a family planning visit was found to be about Tk.8.00. A higherproportion of women from the lowest household expenditure group obtained free serviceand supplies (27%) than that in the highest expenditure group (16%). Only 2.4% of users ofUFHP clinics mentioned that they obtained family planning services free of cost
63. About a fifth of all women mentioned that the price they have paid for family planning wastoo high. About 70% mentioned that the price they have paid is all right. About 12%women using UFHP clinics and 16% using public facilities mentioned that the prices theyhave paid were too low.
64. About 52% of women mentioned that they would pay more than what they have alreadypaid to obtain the family planning services. The willingness to pay more increases with theeconomic status of the household.
65. The average willingness to pay for family planning services in the public sector was Tk.12for those who paid a price and Tk.9.25 for those who did not pay anything for getting familyplanning services or supplies. The average willingness to pay for the private sector washigher than any other sources, at about Taka 19. The average willingness number for NGOservice providers was about Taka 13, irrespective of whether the women paid for the serviceor not.
66. Multivariate analysis showed that knowledge about a free provider or obtaining service forfree in the past do not affect the willingness to pay for family planning services. Educationof woman (whether the woman has five years of education or not) significantly affects thewillingness to pay in all urban regions.
67. The Community Health Workers (CHWs) visited about 25% of all households in thesurvey. CHW visits are not specially targeted towards the households with low income orlow educational status of women. The CHW visits are not also related to knowledge andutilization of specific health care services like immunization and ANC services. Women’sknowledge about immunization and ANC were not higher than the average if the householdwas visited by a CHW.

ix
68. CHWs can potentially play an important role in increasing the demand for health careservice and the willingness to pay for various health interventions. Knowledge about healthcare services turned out to be an important variable affecting the willingness to pay.Women from lower socio-economic groups have lower level of knowledge and if the CHWactivities are targeted towards them, it will help to increase the utilization of services as wellas the willingness to pay for the services.
69. The exit interview information indicates that the average waiting time was highest forobtaining immunization services (27.66 min.). Average travel cost was minimum formaternal service.
70. The other NGO in the study areas were found to be providing ESP services. They werefound to have field workers to providing doorstep services. The UFHP clinics were found tobe more equipped with IEC materials
71. Using a definition of a basic health service package (which included ANC services,immunization of children, family planning services, child hood illness and adult illness), costwas estimated for each of the households depending upon the demographic characteristicsof the household. Using the median and mode values of the reported price paid, total cost ofthe service package was estimated and then compared with the household expenditure levelto determine the proportion of households who should be able to pay. If the prices for theservices were set at the modal value, only 3.7% of the households will not be able to pay.Using any other price levels the program managers can simulate the results to examine theimpact of change in price of services.

A - 10
Health Seeking Behavior, Willingness and Ability to Pay forSelected Health Services in Urban Family Health Partnership(UFHP) Areas of Bangladesh
1. Introduction
The Government of Bangladesh (GOB) adopted a comprehensive health and population project during thefourth five-year plan (1990-95) which recommended decentralized but `functionally integrated familyplanning and health services’. By the end of 1995, the country saw significant progress in rural healthinfrastructure development, contraceptive prevalence rates, development of private hospitals,improvements in safe water supply and decline in infant mortality rates. Despite the improvements ingeneral health status of the population, a number of shortcomings of the system also became apparent bythe end of 1995. The quality of service provided through the public sector remained very poor whichaffected its utilization rate. Vertical segmentation of family planning and health services led to inefficientuse of resources and inadequate provision of primary or essential health services adversely affected thehealth of the disadvantaged groups, especially the poor and women.
A number of research findings also questioned the efficacy and effectiveness of existing health and familyplanning delivery structure. For example, it was observed that the family planning program of the countryshowed significant progress and most of the ever-married women were fully aware of the benefits of familyplanning services. In this situation, high-cost doorstep delivery system is not needed. But on the other handpeople have little confidence in the static health care facilities. The presence of unofficial payments,frequent absence of health care providers from duty stations, poor quality of care are the principal reasonsfor the low confidence in the system. Household surveys also indicated that people in both rural and urbancommunities would like to see one-stop service centers, where all types of health care services, includingfamily planning and immunization, will be provided. Dissatisfaction with the public health care deliverysystem led to the development of Non-Government Organization (NGO) run and other privately organizedhealth care facilities.
The current plan, Health and Population Sector Program (HPSP) 1998-2003, addresses some of theseconcerns of the health system. The HPSP officially integrates health and population activities at all levels toreduce costs, improve the referral system and quality of care. The HPSP explicitly accepts the fact thatresource availability in the public sector is too low to provide all types of medical and health care servicesto the population. Therefore, the limited resources available must be used in the most efficient manner anda package of health care services has been defined (Essential Service Package, ESP) to ensure that theavailable money is used in interventions with highest levels of potential health outcomes. The delivery ofEssential Service Package (ESP) is one of the major initiatives of the Health Sector Reform beingimplemented by the Ministry of Health and Family Welfare, Government of Bangladesh. By the end of thefifth plan, the GOB intends to ensure universal access to essential health services of acceptable quality.The components of ESP are: Reproductive Health Care, Child Health Care, Communicable DiseaseControl, Limited Curative care, and Behavioral Change Communication.
The sector-wide approach is intended to improve the performance of the health sector and to enhance theefficiency in resource use. The ESP under the HPSP has been developed to cater to the needs of the mostvulnerable groups in the society- women and children from the poor families. According to the currentplans, the ESP will be implemented in a phased manner based on the resource availability and cost-effectiveness of the interventions. For efficient implementation of the reform strategy, it is extremelyimportant to estimate the amount of resources needed for delivering this package of services. There areseveral estimates of financial resource requirement of ESP under the HPSP. It is estimated that the full ESPwill cost about US$ 13 per capita per year but the current health expenditure in Bangladesh is about US$8.5 per capita per year (in modern allopathy medicine), implying a resource gap of US $4.5. Thegovernment does not have enough resources at its disposal to bridge this gap. Therefore, the
A - 11
implementation of ESP will require participation of various NGOs and private providers and generation ofadditional resources from alternative sources. Cost recovery strategies are being tried by the NGOs togenerate additional resources. Planners are also considering user fees and other forms of cost recovery forresource mobilization and to reduce the misuse and wastage of resources.
The application of user fee as a cost-recovery strategy has been proposed both for the non-profit sectors andthe public providers. User fees are not new in Bangladesh. Many private providers do charge fee for theservices they provide. However, imposition of user fees should carefully consider the consequences of theprices, especially on access and utilization of basic primary care services. The pricing policy should try toenhance social wellbeing by examining various aspects of medical care delivery. The resource mobilizationaspect is important if it can directly affect the supply of services. Pricing policy must also take into accountthe health seeking behavior of the population, the perceived quality of care received, the value peopleassign to the medical care services at the local level and the role of provider-consumer communication inhousehold decision making. In a poor community, it is important to examine the feasibility and desirabilityof user fees or some form of cost-recovery very carefully by analyzing the effects of cost-recovery policieson utilization, health-seeking behavior.
Under the National Integrated Population and Health Program (NIPHP), the Urban Family HealthPartnership (UFHP) funded various NGO-run health facilities to provide the ESP services to urbanpopulation of Bangladesh. Besides its efforts for the improvement in management and quality of service,the NIPHP emphasizes the sustainability of health care delivery activities. In order to attain sustainability,cost recovery through the introduction of user fees has been adopted. The current shift of the program focuson the delivery of an essential package of health and family planning services (ESP) requires a pricingstrategy based on all the important components of the package. There are two distinct but inter-relatedaspects of pricing at the primary care facility level: first, the overall objective of pricing policy will guidethe policy makers to choose the appropriate types of interventions and second, the levels at which the pricesshould be set. For example, if the principal objective of a pricing policy is to reduce wastage rather thanresource mobilization, the prices may be set without considering the cost of production of the services.However, if cost-recovery is an important objective, the policy makers need to find out the cost ofproduction of various components of ESP, the exemption policy to be followed for increasing socialbenefits, cost recovery targets, the possibility of cross subsidization, and health seeking behavior of thepopulation in terms of the ESP services.
It was felt by the service delivery partners and the USAID that a pricing policy with specific guidelines andsuggestions should be devised and made available to the NGOs delivering the ESP services to rationalizethe use of health care resources allocated to the primary care facilities of the country. In order to addressthe issues on utilization of medical care services and willingness to pay, a working group was formed withthe participation of USAID, UFHP, RSDP, and ORP/ICDDR,B. The working group identified a number ofresearch issues related to health seeking behavior of the population, the definition of quality of care in thecontext of Bangladesh, and willingness and ability to pay for health care services.
On the provider side, it was felt that it is necessary to assess the unit cost of services and effects of qualitychanges on costs. Many of the NGOs provide the ESP services to the population but the cost of providingthe services is not known. A rational pricing system needs to consider not only the willingness to pay of theconsumers/customers but also the resource requirements in the delivery of the services. Therefore, pricingpolicy analysis should examine the willingness and ability to pay for the ESP components by theconsumers and the cost of producing the ESP components at the local level. The costing exercise shouldalso indicate the effect of quality improvements, management efficiency, changes in utilization, andpersonnel mix on the cost of production.
To clearly define the scope of this study for UFHP/JSI, the working group met with the Health EconomicsProgram (HEP) of ICDDR,B to discuss the methodology to be followed, types of information to becollected, and the analysis plan. The HEP developed a study proposal taking into account the informationneeds identified and other related ideas and suggestions discussed in the meetings during the preparationphase. The revised final proposal was submitted to the UFHP/JSI office in August, 1999 and a contract was

A - 12
signed between UFHP/JSI and ICDDR,B on 15 August 1999 to undertake a study for examining thewillingness and ability to pay of the population for various components of ESP.

A - 13
2. UFHP HEALTH CARE DELIVERY SYSTEM
The National Integrated Population and Health Program (NIPHP) of USAID started its activities on 1 July,1997. The program consists of nine partners, each responsible for a specific aspect of health and medicalcare delivery. Two of the partners – Rural Service Delivery Partnership (RSDP) and Urban Family HealthPartnership (UFHP) – deliver a set of primary health care services, the Essential Service Package (ESP),through clinics operated by NGOs.
The ESP of NIPHP consists of the following types of medical care services: family planning (clinical andnon-clinical methods), maternal health care (ANC, PNC and iron supplementation, TT, safe delivery, EOC,Post-partum complication, and post-partum contraception), management of RTI/STDs, HIV/AIDS, childhealth (that include EPI, Vit. A, CDD, ARI, IMCI) and selected communicable and vector borne diseases(tuberculosis, malaria) and limited curative health care. The HPSP package includes a number of additionalservices not provided through the NIPHP clinics. For example, the HPSP defined package also includestreatment and prevention of communicable diseases like leprosy, kala-azar, filaria, intestinal parasite, andMR in the reproductive health.
Compared to the previous USAID-funded program in the health sector, the NIPHP introduced thefollowing two major changes:
• Provision of a broader range of health and family planning services;• Switch from doorstep service delivery by field workers to clinical delivery by trained technical staff.
The UFHP delivery model has two tiers: satellite clinics and static clinics. The UFHP, for the delivery ofhealth and family planning services, has divided the country into 25 urban clusters and contracted 24 NGOsto provide ESP in these clusters. The UFHP categorizes the urban clusters into three groups: A, B and C.The categories of urban areas are defined by considering the size of the urban area, population density etc.
The UFHP tries to make high-quality ESP widely available to the urban population and has set a minimumstandard and requirement for the delivery of quality services. Currently, the UFHP delivers health andfamily planning services in urban areas of Bangladesh through 121 static clinics run by 24 NGOs.

A - 14
3. OBJECTIVES OF THE RESEARCH
Most of the UFHP NGOs charge user fees for the services they provide through the health centers. It isassumed by the UFHP that customers/potential customers will be willing to pay for the services when thequality improvements are realized. This research work was initiated to examine the willingness to pay ofthe population residing in the catchment area of the health centers. The NGOs contracted by UFHP havealready adopted a user-fee-based service delivery system. Nevertheless, to improve efficiency in servicedelivery and to protect the poor, the UFHP is interested in determining a proper pricing policy and strategythat will be based on careful evaluation of costs of production, willingness and ability to pay of the clients.The delivery system is also interested to find out the possible effects of user charges on utilization ofservices and implications for access to care by the disadvantaged groups, the poor and women. The qualityof care provided through the health centers is also important in determining the willingness to pay. If aspecific level of quality care is ensured by UFHP, the willingness to pay indicates the amount of money theconsumers or clients are willing to pay for the specified service quality.
Although all these questions are important for a comprehensive pricing policy, the UFHP decided to carryout the study in phases or stages through various research organizations. The Health EconomicsProgramme of ICDRR,B was responsible for a number of specific areas of the research questionsmentioned above. The definition of 'quality' from the client's point of view was examined by a separateresearch initiative. The cost of producing health care services in the UFHP facilities were conducted byanother study of UFHP.
The HEP of ICDDR,B examined the following aspects of pricing policy through this research:
a. To understand the health seeking behavior of the population in the catchment area of thehealth facilities
b. To examine the willingness and ability to pay for the health services provided by the NGOclinics
c. To suggest the level of user charges for each of the ESP services based on the willingnesssurvey as well as actual price paid by household members.
d. To examine the extend of “social mobilization” contacts in the catchment areas and thepotential effects on knowledge about health and illnesses, willingness and ability to pay forthe ESP services and its utilization.
e. To understand the perception and knowledge of households about the benefits of the servicesprovided by the NGO health facilities.
f. To describe the possible impact of increasing user charges on utilization of various services.

A - 15
4. METHODOLOGY OF THE STUDY
4.1 Survey Method
This study mainly concentrates on the survey of household in the area served by UFHP to collectinformation on household characteristics, households’ health seeking behavior, knowledge about benefitsand costs of preventive and curative care, willingness to pay for services.
Ideally, health care seeking behavior survey should have a number of discrete steps. These include: aqualitative survey to prepare a list of commonly occurring illnesses and conditions with local terminology;a key informant interview survey to list all the health care options available in the community; a survey ofproviders to understand the types of services provided, training and experience of health care personnel,quality of physical infrastructure, household survey to explore illness occurrences and utilization ofservices, and household survey to understand the willingness and ability to pay for different types of healthcare services.
Considering the constraint of time and other resources, the following survey methodology was adopted:
i. Select urban health centers of UFHP for the surveyii. Select household for the survey from the catchment area of UFHP health centers and their
satellitesiii. Exit interview of selected clients using UFHP health center.
The primary objective of the study is to determine the willingness to pay for primary health care services,including family planning, of the population living close to the UFHP health centers, The presence of otherhealth centers and other medical facilities may change the willingness to pay for services. Therefore, tocome up with a pragmatic proposal on pricing levels and structure, the household survey should be carriedout in the catchment area of UFHP clinics and the satellite. The selection of UFHP clinics for the surveyshould be based on the health care market structure in the area, degree of competitiveness, clinic type andutilization pattern. Therefore, the study explicitly designed an appropriate sampling mechanism for theselection of the clinics.
(a) Selection of the fixed and satellite clinics for the survey
The study was designed to select households from the catchment area of the UFHP static and satelliteclinics. The first step in sampling was to select the UFHP clinics from different urban categories: A, B, andC. These categories are defined by the size of urban area or the degree of urbanization in which the clinic islocated. Clinics in categories A are located in major cities, and clinics in category B and C are located insmaller cities. It is expected that UFHP will expand C categories of clinics in the future. UFHP suggestedto select three from each and an extra one be selected from category C. So, from the list of all clinics underUFHP contract, four clinics from category C, and three each from A and B were selected randomly. Thestatic clinics selected for the survey are listed in Table 1.Table 1:List of the UFHP NGO Health Centers Selected by the Study
NO CATEGORY NGO NAME CLINIC
01 A NISHKRITIStatic Clinic # 4,58 Kazi Nazrul Islam RoadFiringi Bazar, Chittagong
02 A PSKPStatic Clinic # 3,House 11, Road 11/2, Block-BSection-10, Mirpur,Dhaka

A - 16
03 A FPABStatic Clinic # 1,103 Central Block, Eidgah RoadKhalishpur Housing StateKhulna
04 B CAMSStatic Clinic # 1,Pandit Para, Goakhola RoadChandpur
05 B VFWAStatic Clinic # 1, AlipurFaridpur
06 B UPGMS/BStatic Clinic # 1,Dinajpur Road, NamajgharBogra
07 C SSKSStatic Clinic # 3,Sabuj Bagh, Hospital Road,Habiganj
08 C CWFD/MStatic Clinic # 2,Ajhore Road, Netrokona
09 C MALANCHAStatic Clinic # 3,Hospital Road, Sharisha Bari
10 C TILOTTOMAStatic Clinic # 4,Sharishabari, Nawabganj
Once the static clinics were selected, all satellite clinics associated with each of the static clinics werelisted. Four satellite clinics were randomly selected from the list of all satellites under a static clinic.
Table 2 lists all the satellite clinics selected for survey by the static clinic of the satellites.

A - 17
Table 2: List of Satellite clinics Selected for Survey by Static clinics Selected
NO CATEGORY NGO NAME CLINIC SATELLITE SITES
01 A NISHKRITIStatic Clinic # 4,58 Kazi Nazrul Islam RoadFiringi Bazar, Chittagong
Satellite sitesHazi colonyStation collonyPatharghataYakubnagar
02 A PSKPStatic Clinic # 3,House 11, Road 11/2, Block-BSection-10, Mirpur,Dhaka
Satellite sitesMirpur-13BashantakeMirpurMirpur
03 A FPABStatic Clinic # 1,103 Central Block, Eidgah RoadKhalishpur Housing StateKhulna
Satellite sitesPura MosjedEast BosraPort CollonyGobor Chaka
04 B CAMSStatic Clinic # 1,Pandit Para, Goakhola RoadChandpur
Satellite sitesTila BariShabdar Khan BariNataiganjNazirpara
05 B VFWAStatic Clinic # 1, AlipurFaridpur
Satellite sitesEast KhabashpurKomlapurVatilokhipurGreholokhnipur
06 B UPGMS/BStatic Clinic # 1,Dinajpur Road, NamajgharBogra
Satellite sitesChaloparaCatnarparaPhool paraBrinda ban bari
07 C SSKSStatic Clinic # 3,Sabuj Bagh, Hospital Road,Habiganj
Satellite sitesUmodnagarKaligachhatalaNazirabadAnantapur
08 C CWFD/MStatic Clinic # 2,Ajhore Road, Netrokona
Satellite sitesPurbo MaliniShatpaiRishi paraPukuria
09 C MALANCHAStatic Clinic # 3,Hospital Road, Sharisha Bari
Satellite sitesKona BariDhanataKamrabadBhurar bari
10 C TILOTTOMAStatic Clinic # 4,Sharishabari, Nawabganj
Satellite sitesAzaipurShiala collonyChandlaiP.T.I Master Para
A - 18
(b) Selecting households from the catchment area of UFHP clinics
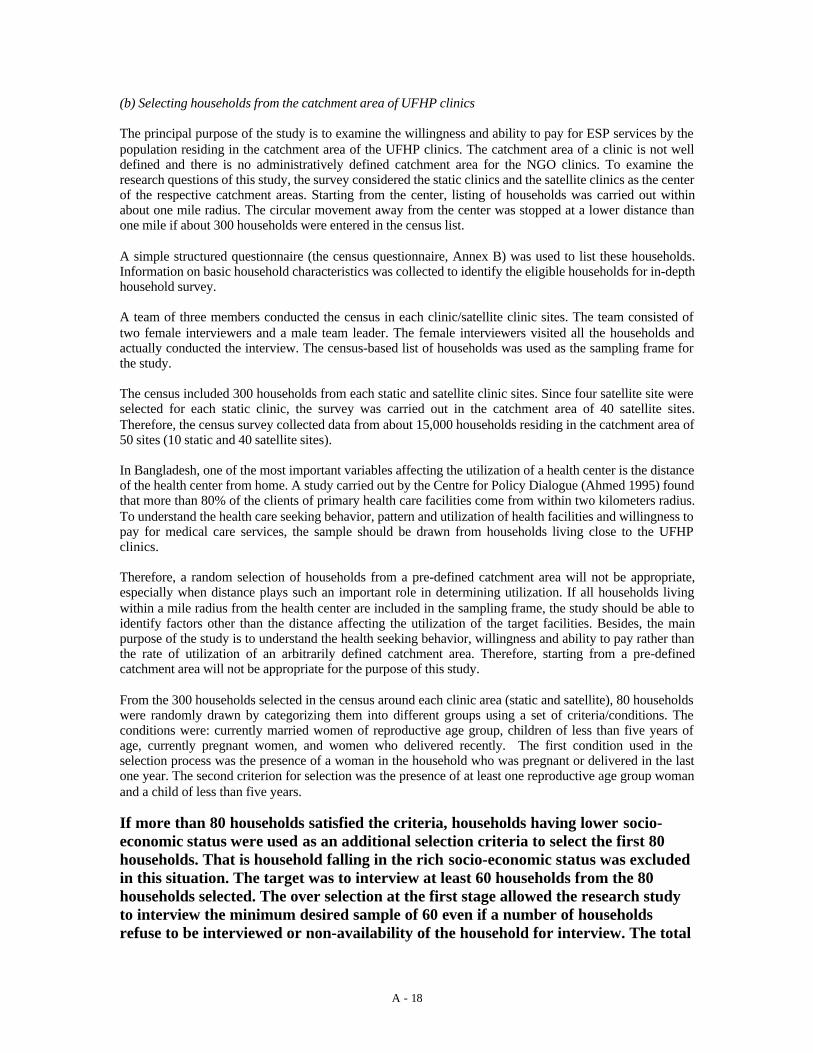
The principal purpose of the study is to examine the willingness and ability to pay for ESP services by thepopulation residing in the catchment area of the UFHP clinics. The catchment area of a clinic is not welldefined and there is no administratively defined catchment area for the NGO clinics. To examine theresearch questions of this study, the survey considered the static clinics and the satellite clinics as the centerof the respective catchment areas. Starting from the center, listing of households was carried out withinabout one mile radius. The circular movement away from the center was stopped at a lower distance thanone mile if about 300 households were entered in the census list.
A simple structured questionnaire (the census questionnaire, Annex B) was used to list these households.Information on basic household characteristics was collected to identify the eligible households for in-depthhousehold survey.
A team of three members conducted the census in each clinic/satellite clinic sites. The team consisted oftwo female interviewers and a male team leader. The female interviewers visited all the households andactually conducted the interview. The census-based list of households was used as the sampling frame forthe study.
The census included 300 households from each static and satellite clinic sites. Since four satellite site wereselected for each static clinic, the survey was carried out in the catchment area of 40 satellite sites.Therefore, the census survey collected data from about 15,000 households residing in the catchment area of50 sites (10 static and 40 satellite sites).
In Bangladesh, one of the most important variables affecting the utilization of a health center is the distanceof the health center from home. A study carried out by the Centre for Policy Dialogue (Ahmed 1995) foundthat more than 80% of the clients of primary health care facilities come from within two kilometers radius.To understand the health care seeking behavior, pattern and utilization of health facilities and willingness topay for medical care services, the sample should be drawn from households living close to the UFHPclinics.
Therefore, a random selection of households from a pre-defined catchment area will not be appropriate,especially when distance plays such an important role in determining utilization. If all households livingwithin a mile radius from the health center are included in the sampling frame, the study should be able toidentify factors other than the distance affecting the utilization of the target facilities. Besides, the mainpurpose of the study is to understand the health seeking behavior, willingness and ability to pay rather thanthe rate of utilization of an arbitrarily defined catchment area. Therefore, starting from a pre-definedcatchment area will not be appropriate for the purpose of this study.
From the 300 households selected in the census around each clinic area (static and satellite), 80 householdswere randomly drawn by categorizing them into different groups using a set of criteria/conditions. Theconditions were: currently married women of reproductive age group, children of less than five years ofage, currently pregnant women, and women who delivered recently. The first condition used in theselection process was the presence of a woman in the household who was pregnant or delivered in the lastone year. The second criterion for selection was the presence of at least one reproductive age group womanand a child of less than five years.
If more than 80 households satisfied the criteria, households having lower socio-economic status were used as an additional selection criteria to select the first 80households. That is household falling in the rich socio-economic status was excludedin this situation. The target was to interview at least 60 households from the 80households selected. The over selection at the first stage allowed the research studyto interview the minimum desired sample of 60 even if a number of householdsrefuse to be interviewed or non-availability of the household for interview. The total

A - 19
number of households surveyed in each study site (the main static clinics and foursatellite clinics) area was 300 (5x60). For all the ten clinic areas under the survey,3000 households were interviewed for the in-depth survey.
(c) Questionnaire development and training of enumerators
The household census questionnaire collected very basic information about the households living in thecatchment areas. The data collected during the census included: information on the location of thehousehold, name of the head of household, presence of at least one reproductive age group woman in thehousehold, presence of at least one under-five child in the household, presence of a pregnant women in thehousehold, presence of a woman who delivered a baby during the preceding 12 months, etc. The censusquestionnaire also collected information about the quality of housing, and whether the main earner of thehousehold worked as a day laborer in the past. Both of these data types were included to understand thesocio-economic status of the households.
The in-depth household interviews were carried out to collect information on common illness occurrencesand health service utilization in the community during the last two weeks prior to the visit. Recall period oftwo-weeks may be too short for certain types of services provided through the ESP. For example, antenatalcare (ANC) services are used by about 60% of all women giving birth during the year. The Crude BirthRate (CBR) in Bangladesh is about 25 per thousand and therefore about 15 per thousand use ANC overtheir pregnancy. If the recall period of using ANC services is three months, we should get only four usersper thousand population. A recall period of one-year should increase the numbers to about 16 per thousand.Therefore, a random sample drawn from the household list will not generate enough cases of ANC andpossibly other health services for statistical precision.
To ensure that a higher number of pregnancy cases and users of ANC services are observed, the selectionof household for the survey was biased towards households with at least one woman in the reproductive agegroup and having a child of less than two year old. Most of the ESP services delivered by the NGOs are forwomen in their reproductive age group, children of age less than five years and pregnant women.Therefore, selecting the households satisfying the above three conditions should provide the relevantinformation on the use of ESP services in the country.

A - 20
The survey used the following questionnaires for the study:
(i) Household census form(ii) Questionnaire to understand household knowledge about the benefits and costs of
preventive and curative care(iii) Questionnaire on antenatal care(iv) Questionnaire on child immunization(v) Questionnaire on family planning services(vi) Questionnaire on other illnesses.(vii) Questionnaire on patient observation & exit interview(viii) Questionnaire on facility survey
All the questionnaires, excepting the census form, were translated into Bangla for pre-testing. The draftquestionnaires were pre-tested by HEP field investigators in two UFHP areas. The revised questionnaireswere finalized by the HEP after discussions with Dr. Kanta Jamil of USAID and Mr. Noor Mohammed ofUFHP.
The HEP organized the training of field researchers during October 4-12, 1999. Practical training on fieldsurvey was also organized in Shahzadpur and Shamoli areas of Dhaka. The household survey of UFHPstarted on October 16, 1999.
Once the households are selected, the in-depth household survey were carried out to understand the healthseeking behavior of the population, especially the preventive services as well as maternal and child healthrelated activities. The individuals selected as respondents for the in-depth survey were the mothers in thereproductive age group.
The household in-depth questionnaire (Part I at Annex B) was used to collect the following information:demographic information (age, sex, marital status of the members of the household, eligibility asrespondent for the survey i.e. currently married women of the reproductive age group), information onsocio-economic status (housing structure, ownership of land and household, household expenditure,household assets and their ownership), asset ownership, etc. The questionnaire also included a checklist todetermine the number of respondents in a household acceptable for providing information on familyplanning, child immunization, ANC care and illness (Annex B).
A section of the in-depth questionnaire (Part II at Annex B) collected information from all women ofreproductive age group on their knowledge about the costs and benefits of preventive and curative care.The women were asked about their knowledge on family planning methods, ANC, diarrhoea and ARI ofchildren, child immunization, signs of severity of diarrhea and ARI. They were also asked about the theirperception of benefits and costs of seeking such services and care. Attempts were made to determinewhether they were aware of the positive and negative externalities of seeking various preventive andpromotive health care services. The knowledge questionnaire also tried to understand whether the womenknow the providers in the locality and the price they charge.
Four different modules were used to collect necessary information on curative care. These are
- Questionnaire on antenatal care (Part III)- Questionnaire on child immunization (Part IV)- Questionnaire on family planning services (Part V)- Questionnaire on other illnesses. (Part VI)
These questionnaires (Annex B) were used to collect the information on care seeking behavior for ANC,child immunization, different family planning services, and for general illnesses. These questionnairescollected information on last source used for these services and for illnesses, the amount of money spent,

A - 21
willingness to pay additional amount of money for the services/care, and opinion about the quality ofservice and willingness to pay.
The health centers provide many different types of primary health care services. In general, UFHP clinicsare supposed to provide the major components of ESP. Since the ESP list is quite long and each service canfurther be subdivided into sub-activities, the willingness to pay should address many different lines ofactivities. An additional dimension of all service activities is the “quality” of services delivered. If all thepossible ESP activities with various indicators of quality are considered, the questionnaire will become toocomplicated and unmanageably large. To simplify the problem, the study had two alternative options: use aset of priority ESP components or select a number of ESP activities that the policy makers considerimportant for decision making. After discussions with the UFHP, the study decided to adopt the secondapproach. The UFHP identified a number of activities as crucial for their delivery system and the list wasused for inquiring about the willingness and ability to pay.
The recall period for service utilization or health conditions was different for different services. Thecurative and preventive services delivered through the clinics had a recall period of two weeks. The satelliteclinics are often held fortnightly in a location and therefore, to get some idea about the utilization of UFHPsatellite clinics, the recall period should not be less than two weeks. The recall period for the utilization ofANC and immunization was one month in the survey.
The quality indicators used in the household survey were the perceived ‘quality indicators’ householdsthemselves consider important. A survey on perceived quality provided the list of relevant qualityindicators and the household survey used two to three important indicators to examine how the willingnessto pay may change due to quality differences. Note that the quality issues discussed at the household levelare the subjective evaluation of quality by households without any independent check of “quality” at thefacility levels. So, the respondents were asked to evaluate the quality of service received in terms ofspecific quality indicators like waiting time, quality of provider, perceived quality of treatment/care, andcleanliness of the facility. The next step was to ask them about the additional amount of money they arewilling to pay for improvements in one or two selected areas.
One problem of household survey in the community is the lack of “objective” information on clinicsreported to have been used by the households. The willingness to pay for any services may be significantlyaffected by the “quality” of the services received recently. Although the household questionnaire makes anattempt to evaluate the quality of recently-used health center, the inter-household variability in perceptionsmay be very wide to affect the statistical validity of results. The likelihood of error in reporting quality isalso usually high.
To crosscheck the household information on quality and willingness to pay, the study surveyed a number ofclients who have used the UFHP facilities. The questionnaire on “facility survey” was used for collectinginformation on quality of care, type of services provided, information about the providers, the cost recoverystrategy and charges for services, etc. The program managers of the facilities were interviewed by aphysician of the HEP. Two out of the 10 facilities were selected purposely for this facility based exitsurvey. These two sites were in Dhaka (UFHP category A area) and Netrokona (UFHP category C area).
A small number of patients were selected for observation and exit interviews in six static facilities. Threeinvestigators at every static clinic selected every third patient at the point of entry. They were also observedfor the whole period of their stay at the facility. The major purpose of the observation was to find out atwhat point the clients are informed about the charges, who provides the information, who collects the feespaid by the clients, etc. The questionnaire also attempts to determine when the clinic staff assesses theability to pay of the client. The observation of the patient noted the waiting time and time with theproviders.
Clients were interviewed at the exit point by an interviewer (not by the interviewer who observed theclients during their stay at the facility) to collect information on the reasons for using the facility, totalwaiting time, total travel time and expenditure, total expenditure at facility, opinion about the level of userfees, willingness to pay an additional amount for the services with and without quality improvements. The

A - 22
exit interviews were carried out in six clinics including the two clinics where quality questionnaire wasadministered. About 30 clients from each static clinic were interviewed. A total of 177 clients wereinterviewed at the exit points in the six selected static clinics. The purpose of this approach is to reduceinter-individual variability in recalling quality-related variables and the services received.
4.2 Data Processing and Analysis
A data entry program was used to enter the data directly from the questionnaire. Thequestionnaires were designed in such a way so that the information can be keyed indirectly. The program for data entry was developed to handle data entry of large complexdata sets. The program carries out consistency checks of the data fields as soon as theyare entered. After the entry of the data, further cross-checking were carried out to ensureconsistency of different components of the survey. The data sets entered were thenconverted into SPSS system files for analysis.
Using the sets of questionnaires as the guide, eight different data sets were created withappropriate identification fields in each of the records for linking. These eight data filesare: census of households, information on selected households for in-depth survey,knowledge about health care services, information about health seeking behavior andwillingness to pay for ANC services, for immunization, for family planning, for illnesses,exit interview information and facility survey information.

A - 23
The data sets were analyzed using SPSS. Cross tabulation and regression models wereused to analyze the data.
Defining the depth of knowledge about health care services
For the analysis of the knowledge information, an attempt was made to estimate the depth of knowledgeregarding ANC, immunization, family planning and a number of childhood illnesses. The responses ofwomen respondents were compared with a predefined list of correct responses. Depending upon thenumber of responses correctly identified, the respondent was assigned a knowledge score. If there aremultiple questions on knowledge of specific health care services, the scores from all these questions wereaveraged together to obtain the overall knowledge score for each of the services.
Methodology followed to estimate willingness to pay
Willingness to pay for health care services were obtained by directly asking the respondents about theamounts they are willing to pay for specific health care services. The amount of money users of the serviceactually paid represents the lower limit of willingness. This method of defining the lower limit isproblematic for high cost inpatient and outpatient services. For life threatening cases, amount actually paidmay not necessarily represent the amount people will be willing to pay under different circumstances.However, the types of services being considered here are basically low-cost primary care services andactual pay out may be considered the minimum level of willingness.
Using the actual payments made by individuals as the starting value, the additional amount individualsreported willing to pay were added to define the maximum willingness to pay. For individuals whoobtained free services, the maximum level of willingness was considered. The individuals were asked abouttheir maximum willingness to pay for different services.
Methodology followed to define ability to pay
In this study, we have used two approaches of defining ability to pay for health care services. The firstdefinition uses the actual payments individuals reported making for obtaining the care. Again, since theservices considered are of primary care type, actual payment should be a reflection of what people are ableto pay if options for choosing different types of providers with different prices exist in the community. Inabsence of choice of providers, actual payment will not reflect ability to pay. Since respondents in thesurvey mentioned presence of different types of providers in the same location, we can use the actualpayment as a crude approximation of ability to pay.
The second definition of ability to pay is based on WHO type definition of ability, where total expenditureon medical care services as a proportion of total expenditure is used to define ability to pay. For pooreconomies, if the total health care expenditure is about 5% of total expenditure, the medical care servicesare considered affordable. In Bangladesh, total health care expenditure (including family planning) is about5% of GDP of which about a third is provided through the government. In other words, the average out-of-pocket health care expenditure should be about 3.5% of household income. Although current expenditureson primary care services are relatively low, an efficient system in poor developing countries should allocateabout a third of total health care expenditures on very basic health care services (see Khan, 1997).Therefore, allocation on basic health care services (outpatient care only) should be about 1.5% of totalexpenditure. This second definition of ability pay uses this cut-off point. A list of basic health care packagehas been defined and the modal or median prices of the services were estimated from the survey data. Totalcost of the package was estimated for each of the households in the sample and cost-to-expenditure ratioswere estimated. The households with cost-to-expenditure ratio exceeding 1.5% were categorized as `unableto pay’ the price set considered. The price set was changed to see the effect of price on the ability to pay.

A - 24
5. DEMOGRAPHIC AND SOCIOECONOMIC CHARACTERISTICS OF THE SURVEYEDHOUSEHOLDS
5.1 CENSUS INFORMATION
As mentioned in the methodology section, all households residing around the UFHP health centers wereinterviewed. The survey around 10 static clinics and 40 satellite clinics generated information from 14,994households. The distribution of households among the three urban categories and by static and satelliteclinic areas is presented in Table 3 below. Note that about 80% of all households in the census are from thesatellite clinic areas. This is due to the higher weight assigned to satellite clinics in the survey method. Theweights of urban categories were also predefined rather than using a proportional sample from each of thecategories.
Table 3: Number of Households in the Census by Urban Category and type of Clinic_________________________________________________________________________Urban category Static Clinic area Satellite Clinic area
No. of areas # of Households No. of areas # of HouseholdsA 3 900 12 3,600
B 3 900 12 3,600
C 4 1,199 16 4,795
TOTAL 10 2,999 40 11,995
Table 4 reports the number and proportion of various demographic groups in the census by urbancategories. The population in the satellite clinic areas has higher number of children per household than thatin static clinic areas. As expected, the number of children per household was found to be highest in thesatellite clinic areas of urban category C (0.64 per household). Urban category A shows higher number ofunder-5 children than category B. The proportion of households with at least one under-5 child varies inbetween 37% to 39% for static clinic areas and between 43% to 50% for satellite clinic areas.

A - 25
Table 4: Demographic Characteristics of the Census Households by Urban Category
DemographicCharacteristics
Urban Categories and clinic type
Urban category A Urban category B Urban category C TotalStatic Satellite Static Satellite Static Satellite Static Satellite
HH with U5 children 337 1774 350 1559 474 2411 1161 5744% HH with U5 child 37.44 49.3 38.9 43.3 39.5 50.00 38.7 47.88Number of U5 children 414 2152 426 1844 566 3085 1406 8487U5 children/HH .46 .59 .47 .51 .47 .64 .47 .56
HH with Currently.married women(CMW)
829 3330 803 3201 1067 4226 2699 10757
% HH with CMW 92.11 92.50 89.22 88.91 88 87.17 90.01 89.68Number of CMW 918 3508 899 3489 1210 4596 3027 11593# CMW/HH 1.02 0.97 1.0 .96 1.0 .96 1.00 .96
HH with pregnantwomen(PGW)
46 232 51 195 74 400 171 827
% HH with PGW 5.11 6.44 5.66 5.42 6.17 8.34 5.85 6.89Number of PGW 47 234 52 199 74 404 173 837No of PGW/HH .05 .06 .06 .05 .06 .08 .06 .07
HH with womendelivered in last 12months(DW12)
66 398 78 374 127 565 271 1337
% of HH with DW12 7.33 11.05 8.75 10.47 10.60 11.87 9.04 11.15Number of DW12 66 403 79 377 127 573 272 1353No. of DW12/HH .07 .11 .08 .10 .11 .12 .09 .11
Note from Table 4 that the number of currently married women per household remains at about 1.0 for allurban categories and clinic types. Urban category A shows slightly higher proportion of households withmarried women than other two categories. Proportion of households with pregnant women was highest inurban category C. The census information also indicates that the number of women delivering over the last12 months varies from 7 per 100 households for urban category A to 12 per 1000 households for urbancategory C. Again, satellite clinic areas show higher number of women delivering over the last 12 monthscompared to the rates for static clinic areas.
Table 5 reports the construction material used by the households for constructing the residential houses inthe catchment areas of health clinics. The construction materials of the residential house can be used as anindicator of socio-economic status of the households. Material used for walls appear to discriminate thesocio-economic status better than the construction material of roof. It is clear from the table that thehouseholds living around the satellite clinics are much poorer than the households living around the staticclinics. About 17% of all households in the catchment area of static clinics used leaves, bamboo or mud forconstructing the wall. In the satellite clinic areas, this ratio was found to be 50%.
Table 5: Percent Distribution of Construction Materials used for Roof and Wall ofResidential Structures in Static and Satellite Clinic areas (Census data)
Urban area A Urban area B Urban area C TotalConstruction materialStatic Satelite Static Satelite Static Satelite Static Satelite
Roof
Jhupri/ bamboo/ clay 10.9 30.6 .3 .3 .5 10.7 3.6 13.6

A - 26
Tin/ Tile 30.3 55.6 76.0 88.2 69.0 81.8 59.5 75.9Concrete 58.8 13.8 23.7 11.5 30.5 7.5 36.9 10.6Total 100.0 100.0 100.0 100.0 100.0 100.0 100.0 100.0Total number 895 3584 895 3590 1197 4770 2987 11944WallJhupri/ bamboo/ mud 20.0 67.1 20.3 32.8 13.0 50.0 17.3 50.0Tin/ wood 3.4 3.3 18.4 23.8 32.9 21.3 22.8 16.7Brick/ pucca 76.6 29.6 61.4 43.3 54.0 28.7 63.0 33.4Total 100.0 100.0 100.0 100.0 100.0 100.0 100.0 100.0Total number 895 3591 898 3591 1196 4777 2989 11959
Another indicator of low income of households is the participation of the main earner in the daily wagelabor market. In Bangladesh, participation in the labor market as a daily wage earner is considered sociallydegrading and household members from middle and high socio-economic groups often do not work as adaily wage laborer. Table 6 reports the participation rate of households in wage employment by cliniclocation (urban categories) and clinic type. In static clinic catchment areas, about a quarter of householdsreported participation in the wage labor market. In the satellite clinic areas, the percent of householdsinvolved in the wage labor market was found to be much higher, about 55%. Again, the wage employmentindicator of socio-economic status confirms that the households living around the satellite clinics of UFHPare relatively poorer than the households living around the static clinics.
The information in Tables 5 and 6 indicate that the UFHP clinics select relatively poor neighborhoods to setup the satellite clinics.
Table 6: Percent of Households reporting Daily Wage Employment of PrincipalEarner (Census of Households in Catchment Areas of UFHP Clinics)
Category Static Satellite Total HH with mainearner as daily wageearner
Total number# of HH
A 23.6 59.7 2360 4500
B 30.0 41.9 1779 4500
C 25.0 60.1 3181 5994
Total 26.1 54.5 7320 14994
Total number 782 6538 7320 14994
5.2 CHARACTERISTICS OF SURVEYED HOUSEHOLDS
As mentioned in the methodology of the survey, a number of households were selected from the census listbased on some specific target characteristics. The study collected in-depth information from 3,004households. Total number of individuals belonging to these households was found to be 15,927 implying

A - 27
that the average family size in the UFHP survey areas was about 5.30. The average size of the family isslightly larger than the country average due to purposive selection of households with children, pregnantwomen, etc. The male to female ratio in the survey was about 1.0 but the ratio was more than 1.0 in staticclinic areas (1.06) and less than 1.0 in satellite clinic areas.
Since the selection of households used presence of young children, pregnant women and mothers whodelivered within 12 months prior to the survey, the age distribution will be biased towards the somespecific age groups. For example, the percent of population in the age group less than five years should behigher in the sample compared to national proportions. Table 7 shows the age distribution of householdmembers obtained from the survey. About 21% of the individuals in the survey belong to the age group lessthan five years. At the national level, the proportion should be no more than 15%. The proportion ofpopulation in the age group 15-39 years is also higher than the national level due to the emphasis of thesurvey on pregnant women and mothers with young children. The age distribution patterns of theindividuals in the survey were found to be quite similar in all three urban locations.
Table 7: Age Distribution of Individuals in the Surveyed Households(in-depth Survey of Households in UFHP Clinics)
Age groups Percent of individuals by Urban categories Percent ofCategory A Category B Category C total
Less than 5 years 21.7 21.5 21.0 21.4
5 to 9 years 12.7 11.3 13.1 12.5
10-14 years 10.3 8.7 9.2 9.4
15-39 years 43.6 44.9 42.6 43.5
40-59 years 8.7 9.2 9.4 9.1
60 years + 3.0 4.5 4.8 4.2
All groups 100 100 100 100
In terms of educational status of the household head, 61% reported more than five years of education in thestatic clinic areas while in satellite clinic areas the proportion was 27.8%. About three percent of householdheads in static clinic areas and 1.2% in satellite clinic areas were women. In satellite clinic areas, about halfof all household heads had no formal schooling. For static clinics the proportion was much lower, about18.3%. The detail tables on age distribution, educational status by clinic type (static or satellite) andlocation (urban categories) are reproduced in Annex I (Table I-1 to I-7).
In terms of economic status of households, one third of all households in static health center areas and 57%of households in satellite clinic areas belonged to less than Tk.3,000 monthly expenditure group. On theother hand, 27.8% of households in static clinic areas and 5.6% in satellite clinic areas belonged to morethan Tk.7,000 expenditure category. Clearly, the households living in the satellite clinic areas were muchpoorer than the households living in static clinic areas. In terms of urban categories, households living incategory C health centers were the poorest. Annex table I-7 reports the percent distribution of thehouseholds by urban categories and clinic types.
Table 8 below reports the construction materials used in the construction of residential houses by thesurveyed households. This table allows comparison of the socio-economic status of the surveyedhouseholds with the census information. If we compare the numbers in Table 8 with those in Table 5, we

A - 28
find that the households selected for the in-depth interview were poorer than the socio-economic status ofthe population in general in the areas. For example, the census data show that 50% of households insatellite clinic areas used leaves, bamboo or mud to construct the walls and the proportion is about 62%among the surveyed households.
Table 8: Percent Distribution of Construction Materials used for Roof and Wall of in Staticand Satellite Clinic areas by Surveyed Households
Urban area A Urban area B Urban area C TotalConstruction materialStatic Satellite Static Satellite Static Satellite Static Satellite
RoofJhupri/ bamboo/ clay 13.5 33.8 .6 1.9 1.2 10.1 4.7 15.4Tin/ Tile 43.3 62.6 88.4 95.8 76.3 85.1 70.2 80.8Concrete 43.3 3.6 11.0 2.2 22.4 4.9 25.2 3.7Total 100.0 100.0 100.0 100.0 100.0 100.0 100.0 100.0Total number 178 773 181 667 241 964 600 2404WallJhupri/ bamboo/ mud 27.0 78.4 26.5 49.8 19.9 56.7 24.0 61.8Tin/ wood 2.2 5.0 25.4 23.2 35.7 20.1 22.7 16.1Brick/ pucca 70.8 16.6 48.1 27.0 44.4 23.1 53.3 22.1Total 100.0 100.0 100.0 100.0 100.0 100.0 100.0 100.0Total number 178 773 181 667 241 964 600 2404
Construction material used for the construction of the residential houses shows aclear trend with household expenditure per month. For example, 25% of householdsin the expenditure category 1,500 taka or less per month had bamboo or leaves asroof of the residential house while only about 3% of households in the expenditurecategory Tk. 7,000 or more had bamboo or leaves as roof. Construction material ofhouse also shows similar variation with economic status of households. For thepoorest households, 75% used bamboo, leaves and mud for constructing the wallwhile it was about 18% for the richest group. It should be mentioned here thathousehold expenditure pattern shows that less than 3% of households belong to theextremely poor category (less than Tk.1,500 expenditure per month) and only about13% belong to the richest category (more than Taka 7,000 per month).
Table 9 reports the demographic characteristics of the surveyed households. The numbers in the table canbe compared with those in Table 4 to see the extend of bias introduced in the sample to obtain householdswith children, pregnant women and women delivering in last 12 months. In the census, number of childrenper household was about 0.5 while in our sample, the number of children per household was more than 1.2.Only about 6% of households had one pregnant woman in the census but in the sample selected for thedetail survey, 19% of households had pregnant women. The sample was purposely biased to obtain a highernumber of households with pregnant women, women delivered in the last 12 months and children. Thesedemographic characteristics represent our target population and such a bias provides a better understandingof health seeking behavior, willingness and ability to pay of these households.
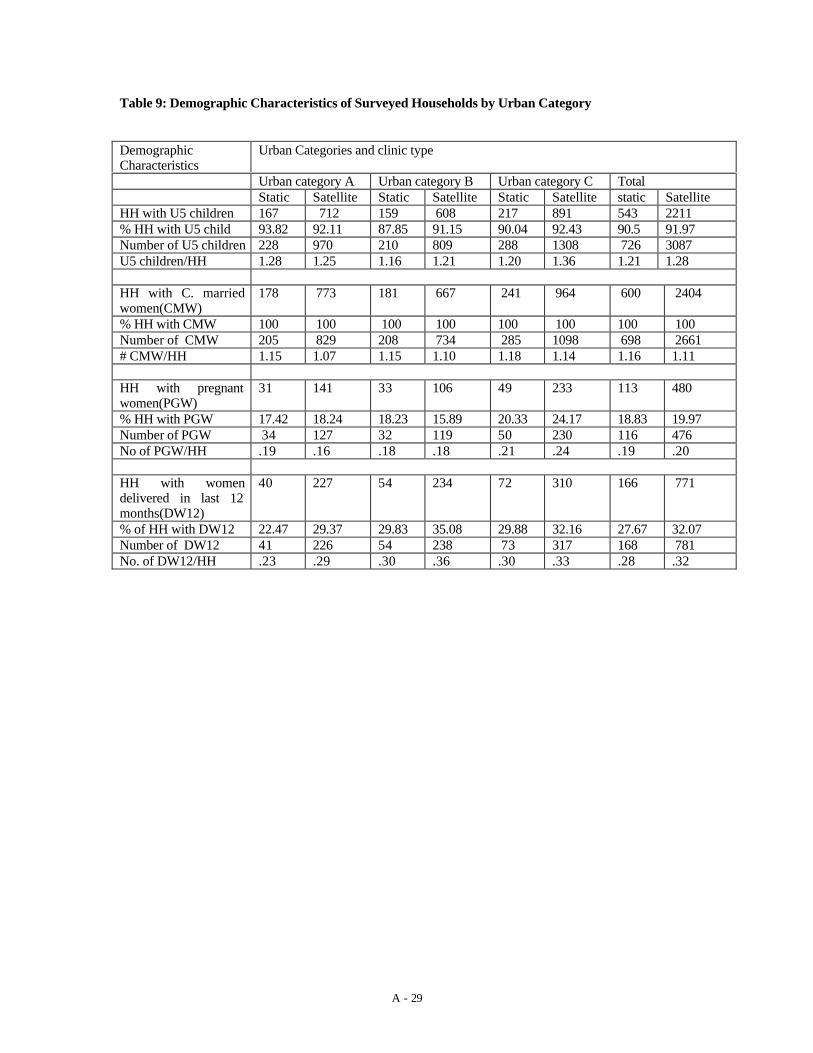
A - 29
Table 9: Demographic Characteristics of Surveyed Households by Urban Category
DemographicCharacteristics
Urban Categories and clinic type
Urban category A Urban category B Urban category C TotalStatic Satellite Static Satellite Static Satellite static Satellite
HH with U5 children 167 712 159 608 217 891 543 2211% HH with U5 child 93.82 92.11 87.85 91.15 90.04 92.43 90.5 91.97Number of U5 children 228 970 210 809 288 1308 726 3087U5 children/HH 1.28 1.25 1.16 1.21 1.20 1.36 1.21 1.28
HH with C. marriedwomen(CMW)
178 773 181 667 241 964 600 2404
% HH with CMW 100 100 100 100 100 100 100 100Number of CMW 205 829 208 734 285 1098 698 2661# CMW/HH 1.15 1.07 1.15 1.10 1.18 1.14 1.16 1.11
HH with pregnantwomen(PGW)
31 141 33 106 49 233 113 480
% HH with PGW 17.42 18.24 18.23 15.89 20.33 24.17 18.83 19.97Number of PGW 34 127 32 119 50 230 116 476No of PGW/HH .19 .16 .18 .18 .21 .24 .19 .20
HH with womendelivered in last 12months(DW12)
40 227 54 234 72 310 166 771
% of HH with DW12 22.47 29.37 29.83 35.08 29.88 32.16 27.67 32.07Number of DW12 41 226 54 238 73 317 168 781No. of DW12/HH .23 .29 .30 .36 .30 .33 .28 .32

A - 30
6. KNOWLEDGE AND UTILIZATION OF SELECTED HEALTH CARE SERVICES
The survey collected information on a number of curative and preventive healthcare services delivered through the UFHP clinics. It was agreed in a meeting priorto the survey that the study would concentrate on Antenatal Care (ANC), Childimmunization, family planning and common childhood illnesses. The followingsections summarize the results for each of the ESP services selected for in-depthanalysis.
6.1 Antenatal care (ANC) servicesThis study selected all currently married women in the reproductive age group from the households in thesample to collect information about the use of ANC services. Using the methodology of householdselection, 3004 households were selected from the 50 clinic catchment areas. In these 3004 households, thesurvey found 3148 currently married women in the reproductive age group. The knowledge questionnaireon ANC services was used to obtain information from all the 3148 women. The knowledge part of theanalysis is based on this questionnaire.
6.1.1 Knowledge about ANC servicesTable 10 reports the knowledge of women regarding ANC services. Most of the women in the survey knewabout the need for ANC. For all women in the survey, 93.5% knew that pregnant women should go to amedical care provider even though they are not sick. The knowledge about the need for ANC was highestin category A clinic areas, where only about 2% of women did not know that pregnant women should getregular medical care or checkup. In category C clinic areas, more than 12% of women did not know aboutANC.
Although most of the women knew about the need for ANC, they differed quite significantly in terms ofdepth of knowledge. About a quarter of all women who knew about the need for ANC could not mentionthe frequency of ANC visits. About 30% in all urban categories mentioned that a woman should have 3 to 5ANC visits over the whole pregnancy period. About 25% thought that the number of visits should be onceper month and 13% mentioned either less than three visits or more than 10 visits.
Table 10: Knowledge about Need for ANC and Number of Visits Over Whole Pregnancy__________________________________________________________________________Urban Total Need for ANC No. of ANC visits over the pregnancyCategories Women Yes No 3-5 times 6-10 Others Don’t Know__________________________________________________________________________A 980 961 19 268 320 135 238
(100) (98.1) (1.9) (27.9) (33.3) (14.0) (24.8)
B 887 857 30 242 257 152 206(100) (96.6) (3.4) (28.2) (30.0) (17.7) (24.0)
C 1281 1124 157 352 290 187 295(100) (87.7) (12.3) (31.3) (25.8) (16.6) (26.2)
________________________________________________________________________________
In terms of economic status of households, women from higher expenditure household groups showslightly higher level of knowledge than the women from poor households. The depth of knowledge is alsohigher for the higher expenditure groups. More than 50% of women in the expenditure group Tk.7,000 permonth or above correctly reported the frequency of ANC visits during pregnancy. About 30% of thewomen in poorest expenditure group said that they do not know the number of times a pregnant womenshould visit health care providers for obtaining ANC services. This proportion was about 16% and 12% for

A - 31
the expenditure categories Tk.5001-7000 and greater than Tk.7000 respectively. Annex table II-1 reportsthe results about need for ANC and frequency of ANC services.
Most of the women (about 91%) in the survey were aware of the benefits of ANC. The benefits mentionedby women were that the service helps to identify mothers’ physical problems and position of the baby.Poor women appear to be less aware about the benefits of ANC than the women from richer households.Annex table II-2 shows that 10% of women in less than Tk 3,000 expenditure category per month did notknow the benefits of ANC. For the highest expenditure category households, the proportion was found tobe 5.1%.
About 92% of women reported that they know at least one provider of ANC services in the locality.Knowledge about the presence of providers in the area is quite similar in all the urban categories, althoughit is slightly lower in category C clinic areas. The knowledge about local availability of the serviceincreases with the level of expenditures of the households. In the lowest expenditure category (less thanTk.3000 per month), 90% of women reported knowing at least one facility that provides ANC but theproportion was 97% for the highest expenditure group. Those who knew about the presence of a serviceprovider, they mentioned 1.5 providers on the average. In other words, half of the respondents mentionedthat they knew two facilities, which provided ANC services. Annex table II.3 reports the knowledge ofwomen about possible sources of ANC care.
The table (Table II-3) also shows that 80% of all women mentioned public facilities as one of the ANCproviders. This proportion varies with the degree of urbanization of the area. In most urbanized area(Category A), only 62% of women mentioned public facility as a source of ANC but in the least urbanizedpart of the country (Category C), 91% of respondents mentioned public facilities. Clearly, in category Careas, public sector is one of the most important sources of primary health care services. Anotherinteresting pattern reported in the table is the percent of women mentioning UFHP as a possible source ofcare. In most urbanized area (category A), 62% of women mentioned UFHP clinic while in category Carea only 29% mentioned it as a source. If we examine the economic status of the respondents, more than45% of women from the expenditure category less than Tk.5,000 per month mentioned UFHP clinic as asource compared to less than 30% for households with expenditures exceeding Tk.5,000.
About 30% of women in our sample were aware of a facility where ANC was available free in theirlocality. About 46% women in “C” category knew where they could find free ANC services compared to27% and 13% in categories “B” and “A” respectively. It is interesting to note that about a quarter ofwomen could not mention whether the facilities in the locality charge money or not. This proportion is alsoidentical in all three urban categories implying that presence of unofficial charges may not be the mainreason for the lack of knowledge about charges (unofficial charges are likely to be present in publicfacilities and the category should have a higher proportion in C). An alternative explanation could be thatthe fee, if any, was paid by someone else accompanying the woman (see Annex table II-4).
Annex table II-5 reports the number of women who knew about a health center which provides fee basedANC services. About 76% of women were aware of at least one ANC provider charging money. Thosewho knew about at least one facility, 50% of them mentioned UFHP clinic. About half of them mentionedUFHP facility alone and the rest mentioned UFHP with some other clinics or providers. More relevantindicator of knowledge about the presence of a fee-for-service provider here is the proportion of womenmentioning `don’t know’ or `no’. The proportions were 16%, 20% and 33% for urban areas A,B and Crespectively. If per capita expenditure categories are considered, 28% from the lowest expenditure categoryand 13% from the highest expenditure category lacked knowledge about a facility charging fee for ANC.
In the survey, the respondents were also asked about their knowledge of charges in the facilities in thelocality, if the services are not provided free of charge. Out of 2,388 women who knew at least one facilityin the locality charging fee for ANC, 2085 gave their opinion about the minimum and maximum fees theythink the health centers normally charge. The average of the minimum and maximum fee mentioned wasTk.30 and 47 respectively. It is interesting to note that the averages of the fee levels were found to behigher for the least urbanized area. On the other hand, average fee mentioned by the respondents increaseswith increasing expenditure of the household. The minimum and maximum charges mentioned were Tk.20

A - 32
and 30 for the lowest expenditure group and Taka 54 and 90 for the highest expenditure group. Table II-6reports the average prices mentioned by the respondents.
The respondents who knew about UFHP clinics were also asked about the knowledge on the fee charged bythe clinics. The average price of UFHP clinic ANC services was reported to be Tk.14, much lower than theaverage minimum price mentioned for the clinics in the survey areas. Therefore, the current prices chargedby UFHP are lower than the prices charged by other clinics. The respondents in urban category C reporteda lower average price for UFHP services than the prices in A or B. The average price charged by UFHP forANC show an increasing trend with economic status of the household. About 18% of women mentioning aprice for UFHP clinics thought that the price was high and more than 60% thought that the price was `OK’.Proportion of women reporting UFHP prices as `high’ declines with improving economic status of thehouseholds.
6.1.2 Utilization of ANC services
This study asked both the currently pregnant women and women who delivered within one year prior to thesurvey about their utilization pattern of ANC services. The number of women eligible as a respondent forthe utilization module were 1541. Out of the total respondents, 945 women delivered during the past 12months and the rest, 596 were pregnant at the time of the survey. Table II-7 shows that about 63% ofwomen who delivered within 12 months prior to the survey sought ANC while 50% of women pregnant atthe time of survey used ANC services. The lower rate among currently pregnant group may be due to earlystage of pregnancy of some of the women. Proportion of women seeking ANC was found to be highest inCategory B urban areas compared to the situation in A or C.
To make the two numbers comparable, we can use information on utilization ofANC by stage of pregnancy. For simplicity, let us assume that stage of pregnancy isequally distributed, i.e., the number of pregnant women in each month gestationperiod is the same. The number of pregnant reported in the survey are basically thepregnancies with more than three months of gestation. Distributing the currentnumber of pregnant women over six months gives us 100 cases in each stage ofpregnancy (months pregnant). According to the Demographic and Health Survey ofBangladesh 1996-97, the median number of months pregnant at first visit was 5months. If we assume that all ANC visits are concentrated in five month stage ofpregnancy, it is expected that the number of visits will increase by 100 if the overallANC utilization rate is no less than 50% among pregnant women with gestationperiod less than five months. If we assume that the ANC seeking is 30% higheramong the pregnant women with more than five months of pregnancy compared toother pregnant women, the increase in ANC seeking should be about 70. If we addthis additional ANC visits expected for the currently pregnant sample (when theycomplete their pregnancy), the proportion of women seeking care should become62%. Therefore, even with very conservative estimation of ANC utilization rate ofcurrently pregnant women, the utilization rate should be no less than the utilizationrate observed for women who delivered during the past one year.
Annex Tables II-8 and II-9 report the source of ANC care for the women who reported using the services.The utilization pattern of the sources appear to be quite different between the pregnant women and womendelivering in the past 12 months. Over the last two-year period, the public sector as a source of ANC hasdeclined in category A and category B of urban areas. In category C, role of public sector in the provisionof ANC has remained more or less static. Another important trend that can be observed from these twotables is the significant expansion in the use of UFHP clinics in category B. In all categories, a higherproportion of women reported using UFHP clinics. Again, the relative decline in the use of public sector

A - 33
was also low indicating that the expansion in the use of UFHP clinics was mainly at the expense of publicsector.
Annex Table II-10 lists the reasons women have mentioned for using the health facility for ANC. Thosewho used the public sector clinics or providers, the modal reason was `free service and free drugs’. Thesecond most important reason mentioned was the presence of `qualified provider’ in the facility. For theusers of private sector providers, the most common reason mentioned was the presence of `qualifiedproviders’ followed by ‘convenient hours’ of the facility. For UFHP clinics, the modal group was that thefacility is located `near the house’. A number of other reasons mentioned may be considered almost tied forthe second important reason. These are: convenient hours and presence of female providers. For otherNGOs providing ANC services, no single reason turned out to be important. The users have mentionedlocation, convenient hours, presence of qualified provider, free service or drugs as important reasons forusing the health centers. On the average, the respondents have mentioned two reasons for using the facilitythey have used.
Annex Table II-11 reports the expenditures incurred by the women in obtaining ANC services per visit.About a third of all women seeking ANC reported an expenditure of Tk.26 or more per visit. A significantproportion of women obtained ANC free of charge (24%). The use of free ANC services was morecommon among the poor households. About a third of them obtained ANC care free of cost. On the otherhand, only about 15% of women belonging to household expenditure category Tk.5001 and above soughtfree ANC.
The average cost per ANC visit varies from Tk.18.30 for the lowest economic status group to Tk.94 for thehighest economic status group (including the zero prices). On the average, the reported ANC visit cost wasTk.42. The reported average cost also varies considerably depending upon the source of care. For example,the average cost of ANC in private sector was reported at Tk.110 while the average costs at UFHP clinicsand public facilities were only Tk.16 and Tk.17 respectively. Relatively higher average for public sector isbasically due to high average cost of the cases who reported more than Tk.50 as ANC cost. This group mayhave confused ANC cost with costs associated with delivery. For example, one respondent mentionedTk.450 as the fee paid to a public facility for ANC. Such a high level of charge is clearly not for ANCalone. Other NGOs charge about Tk.28 on the average according to the women using the facilities.
Annex Tables II-12 to II-14 report the average expenditure on ANC by urban categories A, B and C. In allurban categories, the average price of ANC was about Tk.42. The cost of ANC also show an increasingtrend with better socioeconomic status in all areas. One of the most important differences among thesethree locations or urban areas is the use of free service. In urban category A, less than 20% reportedobtaining ANC from public facilities free of charge while the proportions were 47% in urban category Band 81% for urban category C. For UFHP clinics, women have reported an average cost of Tk. 14 for urbancategories A and C and about Tk. 20 for urban category B.
Table II-15 (Annex-II) cross tabulates source of ANC care with the economic status of the households.Among the lowest household expenditure group, 38% used the public facilities and another 34% usedUFHP facilities. Only about 13% of the poorest group went to private providers for getting ANC. For therichest group, 56% went to private providers and another 21% went to public facilities. Utilization of ANCservices from UFHP clinics show a systematic downward trend with increasing economic status. Less than13% from the richest group used the UFHP facilities for ANC. The sources of ANC services by urbancategories. Among the poorest households, 29% used public facilities for ANC while the proportions were35% and 45% for the urban categories B and C respectively. In all areas, utilization of public sources forANC declines with economic status but the rate of decline was lower in urban categories C and Acompared to that in B. In urban categories A and C, the UFHP clinics appear to be equally popular amongthe expenditure groups below Tk.7,000. In urban category B, the UFHP clinics appear to be equallypopular among all economic groups.
To understand the factors that affect the utilization decision, i.e., whether to use ANC or not, a logisticregression model was estimated with the utilization of ANC defined as a dichotomous variable (usedANC=1, did not use=0). The model shows that the utilization of ANC is affected by household expenditure

A - 34
level (upto Tk.6,000), whether the woman has five years of education or not, knowledge score of thewoman, knowledge about the presence of a health center that provides free ANC care. The price charged bythe clinics for ANC care was not significant statistically in the model. Higher than 2.0 odd ratios wereobtained for education of the woman, knowledge about ANC, whether the woman knows the benefits ofgetting ANC, and whether the woman thinks that non utilization of ANC by a pregnant woman has othersocial implications. Therefore, although price and distance variables were statistically significant at 8%level or better, the relative impact of the variables were very small implying that price in the market placewas not an important variable in explaining non-utilization of ANC services.
6.1.3 Willingness to pay for ANC services
To understand the willingness and ability to pay for ANC services, the first step should be to examine thecurrent out-of-pocket expenses and the opinion of the women and the level of fees they have paid recently.Annex table II-16 reports the opinion of ANC service users by economic status and by the source ofservice. About a fifth of all users thought that the price they paid was too high and two-thirds consideredthe price as `just right’. Economic status of the household does not seem to affect the opinion in asystematic manner. If the source of service is considered, a higher proportion of NGO service users thoughtthat the prices they charged were `just right’. About 78% of the users thought that the prices they have paidwere not `too high’ indicating that the average amount paid will be a good starting point for the estimationof willingness.
Table 11 reports the willingness of the women to pay more for the ANC services. Note that the willingnessquestion was asked to those women who have used the ANC services in the recent past. It is interesting tonote that about 60% of women from poor households reported their willingness to pay some additionalmoney for the services. This proportion tends to increase with household income excepting the expenditurecategory Tk.5,001-7000. Proportions of women mentioning willingness to pay additional money were quitesimilar for all types of facilities, at around 60%. For public facilities the proportion was 66% and for UFHPclinics, it was 60%. In category C urban areas, 65% of women said that they will pay more money for ANCwhile the proportions were 62% and 58% for category A and B areas respectively.
Table 11: Willingness to Pay Additional Money over and above the Current Costs ofObtaining ANC by Economic Status of Households, Source of Care and category ofurban centers
Will you pay more money for the ANC if needed? TotalYes, willing to pay more No, will not pay any more number
NumberPercent NumberPercent of womenHH Expenditure groups
Tk.3,000 or less 147 57.6 108 42.4 255Tk.3,001-5,000 124 60.2 82 39.8 206Tk.5,001-7,000 59 58.4 42 41.6 101Tk.7001 or above 86 76.1 27 23.9 113TOTAL 416 61.6 259 38.4 675
Source of carePublic facility 82 65.6 43 34.4 125Private facility 124 60.2 82 39.8 206UFHP Clinic 146 59.6 99 40.4 245Other NGOs 63 64.3 35 35.7 98Others 2 100 0 0 2
Urban CategoriesCategory A 130 61.6 81 38.4 211Category B 134 58.0 97 42.0 231Category C 153 65.4 81 34.6 234The charges paid by individuals were added with the additional money they reported willing to pay toderive the maximum willingness to pay. The average of the willingness to pay varies with the source ofcare, urban category in which the household is located and the economic status of the household. The

A - 35
average willingness to pay is also affected by the price the women have paid during the last visit. If theservice was obtained free of charge, the willingness to pay was also lower. Table 11 reports the averagewillingness to pay for ANC by household economic status, urban location and whether or not they paid forANC during the last visit.
The median value of willingness to pay was found to be about Tk.40 for public sector, Tk.150 for theprivate sector and Tk.40 for NGOs if we consider only those women who paid for their last ANC visit. Ifthe last visit was free, the willingness to pay amounts were significantly lower, Tk.13 for public sector,Tk.27 for private and Tk.17 for NGO facilities. The results are summarized in table II-17 in the annex.
Table 12 reports the average willingness to pay for ANC services at the UFHP clinics by economic statusof households, urban categories and whether or not the women paid any money during the last ANC visit.Among the women who paid some money during the last ANC visit, the average willingness to pay variesfrom Tk.22 for the lowest economic category to Tk.41 for the richest group. There is a clear increasingtrend in willingness numbers with improving economic status. Since the number of women who did not payfor ANC last time at UFHP clinics are very small, the average willingness numbers for them are notreliable.
Table 12: Average Willingness to Pay for ANC Services at UFHP Clinics
Women who paid for service Women who did not pay for ANCAverage willingness (Tk) Average willingness (Tk)Number Taka Number Taka
HH Expenditure levels (Tk/month)
Tk.3000 or less 122 21.7 9 10.6Tk.3,001-5000 76 24.7 2 5.0Tk.5,001-7000 30 30.2 0 ****Tk.7,001+ 16 41.3 1 20.0
Urban CategoriesCategory A 77 22.7 4 5.0Category B 55 34.6 4 12.5Category C 113 21.8 4 13.8
Average 245 25.0 12 10.4

A - 36
6.1.4 Factors affecting willingness to pay
A number of regression models were run to examine the relationship among willingness to pay for ANCservices and various individual and household characteristics. The urban categories were also included in anumber of regression models. The regression results indicate that if we control for household expenditurelevels, educational status of women, etc., urban location shows no impact at all on willingness to pay.However, inter-location variability exists in terms of the effect of other independent variables. Table 13below summarizes the results of the regression model.
Note from the table that knowledge about the ANC service affect the WTP significantly in all areas and thequantitative value of the effect is also quite high. The knowledge index was constructed by combining theresponses of two questions in the questionnaires, question numbers 203 (in your opinion how many times apregnant woman should go for check up over the whole pregnancy) and 207 (list the components of ANCactivities, the activities performed by the provider during an ANC visit). A predefined list was prepared torepresent the highest degree of knowledge. In each of these questions, the respondents can get the highestscore of 1.0 if the response exactly matches the predefined values or list. Deviation from the list will beassigned a value less than 1.0. The knowledge index was calculated by taking the average value of the twoscores. In the survey, the average knowledge score of women was quite low, about 0.2 even though anumber of women obtained scores as high as 0.8. Therefore, a 10% increase in knowledge index from themean value will increase the willingness to pay for ANC services by about Tk.1.25.
Access to free care reduces WTP significantly. Those who obtained free care during the last ANC visit,their WTP is about Tk.14 lower than the others who obtained care at a fee. The effect of access to free carewas strong in urban area A and B but the variable shows no impact in urban area C.
Education of the woman seeking care is another significant variable in affecting WTP. Those who havemore than five years of education are willing to pay Tk.50 more than others. It is important to note that thecoefficients of education in three urban categories were almost identical. Clearly, women’s educationalstatus is an important variable affecting WTP even when we control for the service specific depth ofknowledge.
Household expenditure levels were not significant in all the equations estimated excepting the model forurban location C. In general, economic status has no impact on WTP for ANC services but in the leasturbanized part of the country (among urban areas), household expenditure level turns out to be statisticallysignificant. Urban location C is relatively poor (average expenditure in C was reported at about Tk.4500compared to Tk.5,800 in category A). In category C areas, increase in the household economic status orexpenditure levels by 10% will increase the WTP by about Tk. 1.81.
Table 13: Effect of Independent Variables on WTP for ANCIndependent All locations Urban location A Urban location B Urban location CVariables Coeff t-value Coeffi t-value Coeffi t-value Coeffic t-valueKnowledgeIndex 62.12 3.14 54.31 1.89 72.14 2.32 66.64 1.74
Free carelast time -14.1 7.23 -27.3 -1.89 -35.9 -3.14 -2.6 -.20
EducationGT 5yrs 52.60 7.09 35.80 3.24 51.19 4.75 51.59 3.22
HH Exp .0002 0.90 .0003 1.46 -.0001 -.51 0.004 2.36

A - 37
Constant26.89 3.61 25.89 2.35 29.66 2.54 11.27 0.76R-square 0.102 0.113 0.142 0.123F-value 22.92 7.22 10.55 10.95
6.2 Immunization
All mothers in reproductive age group were asked a number of questions to understand their knowledgeabout child immunization. Almost all women reported that they knew about the need for immunizingchildren by 12 months of age. Willingness to pay for immunization services were also derived through theinterview of mothers. As mentioned above, 3148 women responded to the immunization related questions.
6.2.1 Knowledge about Child Immunization services
Most of the women in Bangladesh know about the need for childhood immunization by age 12 months.Annex table III-1 shows that 98% of women knew about the need for immmunization. The proportionremains similar for all household expenditure categories and urban location of the facility.
When asked about the source of immunization services in the community, 98% of the women mentionedthat they knew where to get their children immunized. The knowledge about the source of immunizationservices is high in all urban areas and for all household expenditure groups. Therefore, women inBangladesh are well aware of the sources of immunization services. On the average, the respondentsmentioned 1.45 sources per woman.
The most common source mentioned by the women was the `public facilities’ followed by the UFHPclinics. Other NGOs were also mentioned by about a quarter of all women. Private facilities werementioned by only 5% of respondents and most of these respondents live in urban category B. Table III-2reports the knowledge of immunization source by urban categories and economic status of households.
Ninety nine percent of women in the survey knew about the benefits of childhood immunization. More than73% of the respondents mentioned that immunization prevents diseases of children. Table III-3 reports theresponses of the women on the benefits of immunization. Clearly, women in Bangladesh are well aware ofthe benefits of immunization.
6.2.2 Utilization of Immunization
Table III-4 in the annex shows the distribution of immunized children in the survey. The survey asked allmothers about the immunization status of children of age 11 months. About 31% of children were reportedto be not immunized in the survey. Out of 955 children eligible for immunization, only 658 wereimmunized. It appears that almost perfect knowledge about immunization did not translate into actuallyobtaining immunization. In terms of proportion of children immunized, urban category B was the bestfollowed by urban category A.
Those who obtained immunization during the past three months, the respondents were asked about thesource of immunization. Only 446 cases obtained immunization within three months prior to the survey.Out of these immunized cases, 48% obtained their last immunization from the public facility and 32%obtained that from the UFHP clinics. Only 4.5% reported obtaining immunization from private facilities.Other NGOs are also important in the provision of immunization; they provided immunization to 15% ofchildren. Table 14 shows the source of immunization for the children. Note that mothers in category C didnot use any private sector.
Table 14: Source of Immunization by Urban Categories for children who ReceivedImmunization with Three Months Prior to the Survey

A - 38
Urban Category Public Sector Private Sector UFHP Clinics Other NGOs No. % No. % No. % No. %
Category A 45 33.3 5 3.7 49 36.3 35 25.9
Category B 85 51.2 15 9.0 39 23.5 26 15.7
Category C 85 58.2 0 0 54 37.0 7 4.8
Total 215 48.1 20 4.5 142 31.8 68 15.2
Annex Table III-5 reports the reasons for the selection of the provider for getting immunization services forchildren. The modal responses for the selection of the facility chosen by mothers were: close to the housefor public sector, other NGOs and UFHP, free service or free drugs for public sector and other NGOs,convenient hours for private facilities. For other NGOs, convenient hours and free service or drugs werealso important. For UFHP clinics, close to the house is the predominant reason (52% mentioning thereason).
About 50% of all women getting immunization for children with the past three months got the service freeof cost and another 44% received the service by paying less than Taka 10. In public facilities about 73% ofimmunizations were obtained free. In UFHP clinics, 37% received free immunization among all those whoobtained immunization from UFHP. The proportion of children getting free immunization appear to beindependent of expenditure levels of the households. In all household categories, the proportions werearound 50% excepting the expenditure category Tk.3,001 to 5,000. Annex Table III-6 reports thesenumbers.
The table also shows the average cost paid for immunization by household economic status and sources ofcare. The average cost of immunization do not show any systematic trend with income. The average chargefor one immunization visit was Tk.3.73. Cost of immunization varies quite significantly by source of care.The average cost of immunization in the public sector is Tk.1.42 and in other NGOs, it was Tk.7.63. TheUFHP clinics charge about Tk.5.00 for immunization on the average. It is interesting that the average costof immunization in the private sector is also quite low, lower than what other NGOs were charging.
6.2.3 Willingness to pay for immunization
Annex Table III-7 shows the opinion of mothers about the immunization charges. Table III-6 shows that225 mothers reported paying money for obtaining immunization for their children. These mothers wereasked whether they feel that the price they have paid was too high or not. Although the immunizationcharges are low, 17% of mothers felt that the charge was too high. Almost 70% of the mothers were ofopinion that the charges they have paid were `alright’. Excepting the richest household group, about 20%mothers from all other groups felt that the prices were too high. About a quarter of all mothers fromexpenditure categories Tk.5,000 and above reported that the price they paid were too low. About a fifth ofUFHP users thought that the UFHP price for immunization was too high and another one fifth thought thatthe UFHP price is too low.
Table 15 below shows the number of women who said that they are willing to pay more for immunizationservices, if needed. About 56% of the mothers who has paid some money for immunization during the lastvisit were willing to pay more money. The proportion willing to pay more money remains at around 50 to60% for expenditure categories less than Tk.7,000. For the highest household expenditure group, theproportion willing to pay more money jumps to about 84%. The proportion willing to pay more was about

A - 39
65% for both public and private providers and about 50% for UFHP and other NGOs. Proportion willing topay more for immunization was lowest in category A areas and highest in the category B areas.
Table 15: Willingness to Pay Additional Money over and above the Current Costs ofObtaining Immunization by Economic Status of Households, Source of Care andcategory of urban centers
Will you pay more for immunization if needed? Total Yes, willing to pay more No, will not pay any more number
NumberPercent NumberPercent of womenHH Expenditure groups
Tk.3,000 or less 42 50.0 42 50.0 84Tk.3,001-5,000 42 50.0 42 50.0 84Tk.5,001-7,000 14 58.3 10 41.7 24Tk.7001 or above 27 84.4 5 15.6 32TOTAL 125 61.6 99 44.2 224
Source of carePublic facility 37 64.9 20 35.1 57Private facility 12 66.7 6 33.3 18UFHP Clinic 44 50.0 44 50.0 88Other NGOs 31 51.7 29 48.3 60Others 1 100 0 0 1
Urban CategoriesCategory A 52 49.5 53 50.5 105Category B 56 62.9 33 37.1 88Category C 17 56.7 13 43.3 30The average willingness to pay for immunization was obtained from the users of the service. Table 16reports the average willingness to pay for immunization by household expenditure categories and urbanlocations. The table also shows the average willingness by source of service and whether or not the motherpaid for child immunization during the last visit. The average WTP for immunization were found to beTk.11, Tk.15 and Tk.14 for public, private and NGO providers for those who paid some money in the lastvisit. The average willingness tends to increase with economic status of households. For the public sector,the average WTP is almost identical in all urban locations A, B and C. The average willingness to payremains about Tk.7 to 8 for the mothers who did not pay anything during the last visit.
Table 16: Average Willingness to Pay for Immunization by Socioeconomic Status ofHouseholds, by Source of Service and by Urban Category
Willingness to pay for immunization services in UFHP areasThose who paid for service Those who did not pay for service
Public Private NGOs Public PrivateNGOsHH Expenditure groupsLess than Tk.3,000 11.80 10.88 15.175.79 -- 6.70Tk.3001-5000 10.00 15.50 11.838.38 10.00 7.50Tk.5,001-7000 9.30 9.00 11.429.27 -- 5.00Tk. 7001+ 11.40 26.25 16.6713.75 5.00 7.50Urban category

A - 40
Category A 11.20 16.80 16.60 5.30 5.30 ---Category B 10.10 14.60 11.40 8.40 10.00 6.90Category C 10.00 --- 6.90 7.60 ---- -----Total 10.60 15.10 13.90 7.70 7.506.90
6.2.4 Factors affecting the Willingness to pay for immunization
The regression model estimated to see the impact of various factors on the WTP for immunization servicesis reproduced below:
WTP for immunization = 10.87+ 0.0007* EXP + 1.497* EDUC + 2.716* BENEFIT– 4.693*FREE –0.209* PREV, R-sq = 0.145
In the equation EXP represents expenditure level of the household if expenditure per month is Tk.6,000 orbelow, EDUC is a dummy variable to indicate whether the woman has more than five years of education ornot, BENEFIT is a knowledge variable indicating that the woman could identify the correct benefits ofimmunization, FREE is a dummy variable to show whether the woman knows about a health center thatprovides free immunization and PREV is a knowledge variable that shows whether the woman could namethe vaccine preventable diseases correctly or not. Note that all these variables are significant at 10% levelor better. As expected, household expenditure levels increase willingness to pay by Tk.0.0007 for eachTaka increase in expenditure. Five or more years of education of women increases the WTP forimmunization by Tk.1.50, knowledge about the presence of a free facility reduce WTP by Tk.4.70, etc.
Regression models were also run for the urban categories separately to see whether the WTP function isdifferent in different urban areas. In urban category A, all variables other than the knowledge about thepresence of a free provider becomes statistically insignificant. Therefore, in metropolitan areas income,education etc. have no impact on WTP for immunization services. The results are quite similar for urbanlocation B as well. The only significant variables in explaining WTP for immunization in urban location Bwere the knowledge-related variables. In urban location C, knowledge, education turns out to be importantin explaining WTP.
6.3 Acute Respiratory Infections (ARI) and Diarrhoea
6.3.1 Knowledge about ARI
About 48% of the women could identify the three major symptoms of ARI (unprompted) in the survey. Inurban location A, a higher proportion of women could identify the symptoms (56%) while in urbancategory B about 42% could mention the three major symptoms. Annex Table IV.1 shows the proportionsby urban categories.
Table IV-2 in the annex reports the source of care for ARI cases in the UFHP areas. More than 95% ofwomen knew at least one provider for ARI related care. Interestingly, the knowledge about source of carewas slightly higher in urban category C than in categories A and B. Three quarters of all womenmentioned private facilities as a source while 47% mentioned public clinics or facilities as a source. TheUFHP clinics as a source of care for ARI was mentioned by only 14% of women. It appears that thewomen in the locality do not consider UFHP clinic as the source of curative services.
The table also shows the knowledge about source of care by economic status of households. The
knowledge about sources is also similar for all economic groups, almost 95% women in all householdexpenditure categories knew about a source of care. The pattern of specific sources mentioned was alsosimilar for all four expenditure groups. The average number of sources mentioned per woman in thesurvey was about 1.4.

A - 41
Annex Table IV-3 reports the knowledge of the women surveyed on availability of free medical servicesfor the treatment of ARI. Only 21% of women knew at least one provider who supply service free of cost.The knowledge about the presence of free provider is much higher in urban category C than in other twourban categories. In urban category C more than a third of all women mentioned that they knew a freeprovider while in A and B it was about 10%. If we examine the knowledge about free care provider, 24%in the lowest expenditure category knew a provider but it was found to be about 18% for all otherexpenditure categories. Availability of free care may be higher in urban location C explaining the higherknowledge there. The poorest in the community probably try to find out about the availability of free care.
Although a high percent of women did not know a facility where ARI treatment was provided free ofcharge, about 90% knew a facility where ARI treatment is provided for a fee. This type of knowledgeabout market situation is slightly lower in category C urban areas. Only 16% of women mentioned UFHPas a possible source of fee based ARI treatment. In the knowledge question on the source of care, somewomen did not mention UFHP clinics as a source but when asked about fee based sources UFHP clinicswere mentioned. About 20% of women in the expenditure category Tk.7,000 or more knew UFHP as asource of ARI treatment facility on payment of fee. This proportion is around 15% for all the otherexpenditure groups.
The average of maximum reported prices charged for ARI treatment was Taka 64.76 while the average ofminimum was Tk.40.64. The averages of the minimum and maximum prices do not show any systematictrend with the degree of urbanization of the location (urban locations A,B and C). The average prices showan increasing trend with expenditure levels of the households. For the lowest expenditure category theaverages of minimum and maximum prices were Tk.31 and 50 respectively but the averages for thehighest expenditure group were Tk.63 and Tk.100. The average price mentioned for UFHP was less thanTk.15, much lower than the average of the minimum prices in the locality. The average UFHP pricementioned was similar for all economic groups. The average of UFHP clinic price mentioned in urbanlocation C was lower than in other two areas. Those who mentioned that they knew about UFHP cliniccharges for ARI treatment, they were asked about their opinion whether the price was low or high. About17% of women who knew about UFHP clinics mentioned that the price was too high and 14% thought thatthe price of UFHP clinics was low. Annex Table IV-5 reports all these numbers by urban category andhousehold expenditure groups.
6.3.2 Knowledge about diarrhoea
About 97% of women could identify a place where treatment for diarrhoea was available. This knowledgeis similar for all urban areas and household expenditure groups. Most of the women mentioned public andprivate facilities as sources of care for diarrhoea. Only 6% of women reported UFHP clinic as a possiblesource of care. This finding again indicates that the women in UFHP clinic areas do not consider the clinicas a source of curative care services. Annex table IV-6 reports the knowledge about source of care fordiarrhoea.
About 35% of the women reported that they were aware of facilities where treatment for diarrhoea wasavailable free of charge. In urban category C, almost 50% mentioned that they knew a free facility fortreating diarrhoea but the proportion was less than 30% for urban categories A and B. Table IV-7 showsthat there is no systematic trend about the knowledge of the free providers by economic status ofhouseholds.
Annex Table IV-8 shows that 78% of women were aware of at least one provider in the locality whodeliver treatment for diarrhoea by charging money. This proportion was lowest in urban category C (68%)and highest in urban category B (90%). The UFHP clinics were also mentioned as a source of care inexchange for money by only 8.5% of respondents. The response was similar in urban category A and C butlower in B. With the increase in the economic status of households, a higher proportion of women identifyUFHP clinics as a source of care. Less than 8% of women in the lowest expenditure category mentionedUFHP clinics as an option but the proportion was about 13% for the highest expenditure group.

A - 42
To summarize, women living in the catchment area of UFHP clinics do not consider the clinics as majorprovider of curative care. The UFHP clinics are mentioned very often for ANC and immunization but notfor ARI and diarrhoea.
6.3.3 Utilization of Curative Services
The survey obtained information about illnesses in the household over the previous two weeks (two weeksprior to the survey). The respondents were asked to mention all illnesses in the household even the veryminor types and chronic conditions. In the 3,004 households in the survey, 2257 cases of illness wasmentioned. Therefore, the number of illnesses per household over the two-week period was 0.75. Theprevalence rate of illness among the survey individuals was about 141 per thousand.
On the average, 50% of all illness cases did not seek medical attention and the proportion not seeking carevaried from about 45% in urban category A to 54% in urban category C. Among the users of medical care,more than 80% sought care from private providers and another 12% obtained care from public facilities.Only about 3% of illness cases obtained care from the UFHP clinics in the location. It is consistent with theresponse obtained from the women about their knowledge of sources of care for curative services. Thepattern of utilization of various sources are quite similar in all areas of urban categories. Table IV-9 reportsthe medical care seeking pattern of the survey population by urban categories and by sources of care.
Annex Table IV-10 reports the average cost of care for illness episode. The average cost of care washighest in urban category B followed by urban category A. It is interesting to note that the average cost inpublic facilities was also quite high. This may indicate that the severity-mix of the illnesses seeking carefrom public facilities may be higher than the severity-mix in other sources. The UFHP clinics showrelatively low cost and the severity of cases showing up in UFHP clinics, by definition, should be very low.In this sense, these average cost numbers are not directly comparable. However, without more detailinformation about the severity of illnesses, it is not possible to correct the average cost values for the illnesscondition. Therefore, for comparing the average cost of limited curative care services, we should use themodal value of costs rather than the average cost or the median value.
6.3.4 Willingness to pay for curative care
Willingness to pay for curative care does not show any relationship between willingness to pay andeducational status of women, knowledge about illnesses, etc. Only variable that turns out to be statisticallyimportant in explaining WTP is the expenditure level of households. The effect of household expenditureon WTP turns out to be quite significant, about 0.05 for each Taka increase in expenditures. Therefore,increase in the household expenditure by Tk.100 per month will increase the willingness to pay for curativecare by about Tk.5. The regression equation estimated for WTP is given below. Note that no othervariables, educational status, knowledge about ARI, knowledge about diarrhoea are not statisticallysignificant in the model.
WTP = -153.46 + 0.05* EXP + 99.58 EDUC + 54.34 KNOW-ARI+ 111.75 KNOW-DIA R-sq=0.009
6.4 Family Planning Services
6.4.1 Knowledge about Family Planning
Table V-1 shows the knowledge of the surveyed women about the source of family planning services andsupplies in the locality. About 97% of the women knew places where they could get family planningmethods. The knowledge about the source of family planning services was similar in all urban categoriesA, B and C. In all these areas about 96% women knew where to get family planning services and supplies.
When the women were asked to name the sources, 67% mentioned private providers as a source and 60%mentioned public facilities as a source. About 46% of women also mentioned UFHP clinics as a source of

A - 43
family planning services and supplies. Those who knew about a source, they mentioned 1.9 sources perwoman. On the average this is the highest number of sources mentioned among all the different types ofservices considered in this study. Therefore, women not only knew about the source of care, they knewmore than one source of family planning services and care. Knowledge about family planning appears to bethe best among limited curative care, immunization, ANC services, etc. As expected, 75% of womenmentioned public facilities as a source of care in urban category C while the proportion was less than 40%in urban category A. Knowledge about UFHP clinics as a source of family planning services was highest inurban area A. Table V-1 also shows that a relatively higher proportion of women from higher economicstatus mentioned private sector as a source (more than 70% compared to 63% for the lowest expenditurecategory).
Table V-2 reports the proportion of women who mentioned that they knew at least one provider whosupplies family planning services free of charge. Only about a third said that they know a free provider intheir area. About a quarter did not know whether the providers in the locality were free or not. In the urbancategory A only about 10% reported knowing a free provider but in urban category C more than 50% knewa free provider of family planning services. Again, this knowledge may be related to the supply situation inthe market place. Knowledge about a free provider was relatively higher among the lowest expenditurecategory households.
6.4.2 Utilization of family planning services
The women who were currently using family planning methods were asked about the source of familyplanning services and supplies. About 24% of women mentioned public sector facilities as a source.Private providers and facilities were mentioned by about 38% of women and 29% mentioned UFHPclinics. Other NGOs and other providers constituted only a very small proportion of total, less than 10% ofthe current users. The source of care is also considerable different among the three urban categories. Inurban category A, 12% mentioned public sector as a source but in category C about 36% mentioned publicsector as a potential source. The UFHP clinics was mentioned as a source the women used by 35% ofwomen in A but by only 23% women in C. Table V-3 in the annex gives the detail about the source offamily planning services by urban categories.
In the survey 305 women mentioned public sector as the source and 58% of them went to public facilitiesto get pill or condom. About 21% in the public sector users adopted injectables as a family planningmethod and 15% chose sterilization. The women selecting private sector as the source were basically pillusers (96%) and UFHP clinic users were equally split between adoption of pill or condoms and injectables.The utilization of family planning services were almost similar in other NGO providers and otherproviders. Among the pill and condoms users, more than 50% went to the private sector followed by thepublic sector. For injectables, UFHP clinics were the principal suppliers accounting for 70% of totalinjectable users in the survey. For IUD/Norplant and sterilization, public sector is the predominantsupplier. Annex Table V-4 reports the source of supply by type of family planning method adopted bywomen in the survey.
Annex Table V-5 is the frequency distribution of the reasons mentioned by women for the selection of thespecific provider. On the average, family planning users mentioned 1.5 reasons per woman for selecting afacility or provider. If we use the modal reason, the reason for selecting public facility is because theservices are provided free of cost. The modal reasons for private, UFHP and other clinics were convenienttime of operation, close to the house and convenient time of operation respectively. Privacy has beenmentioned by 11% of responses for the reason for selecting private providers but for UFHP clinics theproportion of women mentioning privacy being maintained by 1.2% of responses, less than the proportionof responses in this category for public sector. Cleanliness and lower waiting time was mentioned by onlyfew individuals, less than 3% of all respondents. It appears that for the women in Bangladesh, convenienttiming, close to the house, provision of free service and maintenance of privacy are much more importantthan cleanliness of the clinic, lower waiting time, and well-behaved provider.
Annex Table V-6 reports the distribution of expenditures incurred by women for obtaining family planningservices and supplies. About a quarter of all women obtained the family planning services free of cost.

A - 44
More than 55% of family planning services users paid Taka 10 or less. The average cost of a familyplanning visit was found to be about Tk.8.00. A higher proportion of women from the lowest householdexpenditure group obtained free service and supplies (27%) than that in the highest expenditure group(16%). The average cost of family planning also increases with better economic status of households. Thewomen from the lowest expenditure category had paid Tk.6.4 on the average and the average cost was Taka12.9 for the highest household expenditure group.
In terms of the sources of care, almost all free care was obtained from the public providers. All women whomentioned getting free service 85% of them obtained that from the public sector. Similarly, all women whogot care from the public sector, 83% got the service free. Only 2.4% of users of UFHP clinics mentionedthat they obtained family planning services free of cost. Almost all of the UFHP clinic users paid less thanTaka 10 (92% of women). The women who mentioned that they paid more than Tk.25 for family planningabout 95% of them paid that amount to private providers. Private sector also dominates in the cost categoryTaka 11-25; about 74% of those who paid an amount within this range obtained their service from theprivate sector.
The average costs of family planning services vary quite significantly among all the sources of care. Theaverage cost in the public and private sectors were Taka 1.00 and 14.00 respectively. For other providers,the average price was about Taka 7.00.
6.4.3 Willingness to pay for family planning services
Table V-7 in the annex reports the opinion of women about the charge they have paid for the familyplanning services. About a fifth of all women mentioned that the price they have paid for family planningwas too high. A slightly higher proportion from the lower economic categories mentioned this than thewomen from relatively higher expenditure groups. Most of the women, about 70%, mentioned that theprice they have paid is alright. Economic status of households does not appear to be related with theproportion of women mentioning that the prices they paid were ok. About 12% women using UFHP clinicsand 16% using public facilities mentioned that the prices they have paid were too low.
Table 17 below reports the opinion of the women when they were asked whether they will pay more moneyfor family planning services if needed. About 52% of women mentioned that they will pay more than whatthey have already paid to obtain the family planning services. The willingness to pay more increases withthe economic status of the household. About 46% of women from the lowest expenditure group and 70% ofwomen from the highest expenditure group mentioned their willingness to pay more, if needed to ensureservice availability. Willingness to pay more was found to be about 50% or above for all sources of careexcepting the category `other’. In fact, this category was also considered to have too high a price. Thesample size in this category is quite low and this result may be due to the low numbers in the cells.Proportions of women mentioning that they are willing to pay more were around 50% for all urbancategories (A, B and C).
Table 17: Willingness to Pay Additional Money over and above the Current Costs ofObtaining Family Planning Services by Economic Status of Households, Source ofCare and category of urban centers
Will you pay more for family planning if needed? Total Yes, willing to pay more No, will not pay any more number
NumberPercent NumberPercent of women

A - 45
HH Expenditure groupsTk.3,000 or less 185 46.4 214 53.6 399Tk.3,001-5,000 151 50.3 149 49.7 300Tk.5,001-7,000 55 59.8 37 40.2 92Tk.7001 or above 95 69.9 41 30.1 136TOTAL 486 52.4 441 47.6 927
Source of carePublic facility 28 56.0 22 44.0 50Private facility 251 58.4 179 41.6 430UFHP Clinic 171 47.2 191 52.8 362Other NGOs 19 51.4 18 48.6 37Others 18 36.7 31 63.3 49
Urban CategoriesCategory A 191 53.4 167 46.6 358Category B 157 52.3 143 47.7 300Category C 139 51.5 131 47.5 270
Annex Table V-8 shows the average willingness to pay for family planning services by source, economicstatus of households and urban locations. The table also shows the average willingness to pay for those whopaid for service and for those who did not pay for service.
The average willingness to pay for family planning services in the public sector was Tk.12 for those whopaid a price and Tk.9.25 for those who did not pay anything for getting family planning services orsupplies. The average willingness to pay for the private sector was higher than any other sources, at aboutTaka 19. The average willingness numbers for NGO service providers were about Taka 13, irrespective ofwhether the women paid for the service or not. The average willingness for both the private and publicsectors increases with greater level of urbanization. The average willingness for public sector service inurban category C was Tk.14 compared to Tk.10 in category A for women who paid for service. The trend isopposite if the women who did not pay for service is considered. In general, it appears that the willingnessto pay for family planning declines only slightly if a woman have not paid for the service in the past.
6.4.4 Determinants of Willingness to pay for family planning services
Table 18 reports the regression results to show the relationship between willingness to pay for familyplanning services and other independent variables. Many variables were considered in the model and thebest results are provided here in the table. The equations confirms that knowledge about a free provider orobtaining service for free in the past do not affect the willingness to pay for family planning services. Noneof these variables were important in any of the equations estimated. Knowledge about the different methodsof family planning available was important only in urban category A. Education of the woman (whether thewoman has five years of education or not) significantly affect the willingness to pay in all urban regions.On the average, education of the woman increase willingness to pay by Taka 7.00.
Table 18: Effect of Independent Variables on WTP for Family Planning ServicesIndependent All locations Urban location A Urban location B Urban location CVariables Coeff t-value Coeff t-value Coeff t-value Coeff t-value
Knowledgevariable 0.963 0.29 9.99 2.05 4.04 0.65 -9.14 -1.64EducationGT 5yrs 7.00 5.37 8.13 4.32 5.57 2.29 7.45 3.08HH Exp .002 5.76 .0018 3.10 0.003 3.68 0.002 2.86Constant6.33 3.06 3.75 1.31 4.00 0.96 10.99 3.01R-square 0.084 0.128 0.077 0.079

A - 46
F-value 34.89 18.26 10.51 10.83
The models presented in the table also shows strong positive effect of household expenditure on WTP uptoan expenditure level of Taka 6,000 per month. The combined regression model suggest that every taka 100increase in expenditure will increase the willingness to pay by taka 0.2. Therefore, in quantitative terms, theeffect of income or expenditures on WTP is relatively low. The only variable that has strong and highimpact on willingness to pay is the educational status of the woman.

A - 47
7.0 COMMUNITY HEALTH WORKER CONTACTS
The Community Health Workers (CHWs) had contacts with about 25% of all households during the pastone month in the survey. The proportion of poor households visited by the CHWs was about 27% althoughthey visited about 25% of all households. Therefore, the visit rate to poor households was slightly higherthan the visits made to other better-off households. If the total number of households contacted areconsidered, more than 56% happened in poor households (less than Tk.3,000 expenditure per household)although the poor group represents about 52% of all households. A number of other socio-economic statusrelated variables were used to examine whether the CHWs target the poorer households. The ownershipstatus of house, ownership of land and construction material used in roof construction does not show anysignificant bias towards the poorer groups.
Among the women who are currently pregnant or women who delivered within 12 months prior to thesurvey, only 22% mentioned that a community health worker visited their house. Out of the 328 visits, 68%occurred in the households where women know about the importance of obtaining ANC services. Morethan 72% of women who reported no community health worker visits lacked knowledge about ANC.Although the difference in knowledge between these two groups (had contacts with CHW or did not havecontacts with CHW) is not very significant, the visits may have some minor impact on knowledge aboutANC.
The distribution of household expenditure levels for those who reported a visit by CHWs was very similarto the overall distribution of expenditure levels. About 45% of all visits occurred in the households withexpenditure levels less than Tk.3,000 per month and number of respondents belonging to this group isabout 44%.
It is interesting to note that the coverage of CHW visits to the households where the women had no formaleducation was lower than the next educational category 1-5 years of education. Overall 46% of the womenresponding to ANC questionnaire reported being illiterate (no education) and 44% of the visits occurred inthese households. Only 21% of women with no education were visited by the CHWs. About 29% of CHWvisits took place in the households where women had 1-5 years of education. For other educationalcategories, the coverage of CHW services were proportional to the number of respondents in thesecategories. Therefore, the CHW visits do not appear to be targeted towards the lower socio-economiccategory or lower educational status.
The study also examined the relationship between CHW visits and the knowledge of women about variousaspects of ANC services. None of these knowledge variables or knowledge index appears to be stronglycorrelated with the CHW visits. The impact of CHW visits on knowledge about ANC is not significant.Due to high knowledge scores in other types of services, the impact of CHW visits can not be observedfrom the data. The lack of relationship for ANC indicates that the CHW visits are not very effective inincreasing the knowledge base of the women in the locality.
For the households which reported child immunization, the CHW visits again were not targeted towards thepoorer socio-economic groups. About 24% of those who reported getting immunization for their childrenwere visited by a CHW. The poorest economic group represents about 44% of all immunization serviceusers and about 49% of CHW visits were to these households. The ratio of percent of household reportingvisit and the percent of households poor is more than 1.0, the ratio is not significantly higher to sayconfidently that the CHWs targeted the poorest group among the immunization users. None of theknowledge variables related to immunization show any statistically significant impact with CHW visits.
From the above analysis, we can say that the CHW visits are not specially targeted towards the householdswith low income or low educational status of women. The CHW visits are not also related to knowledgeand utilization of specific health care services like immunization and ANC services. Women’s knowledgeabout immunization and ANC were not higher than the average if the household was visited by a CHW.
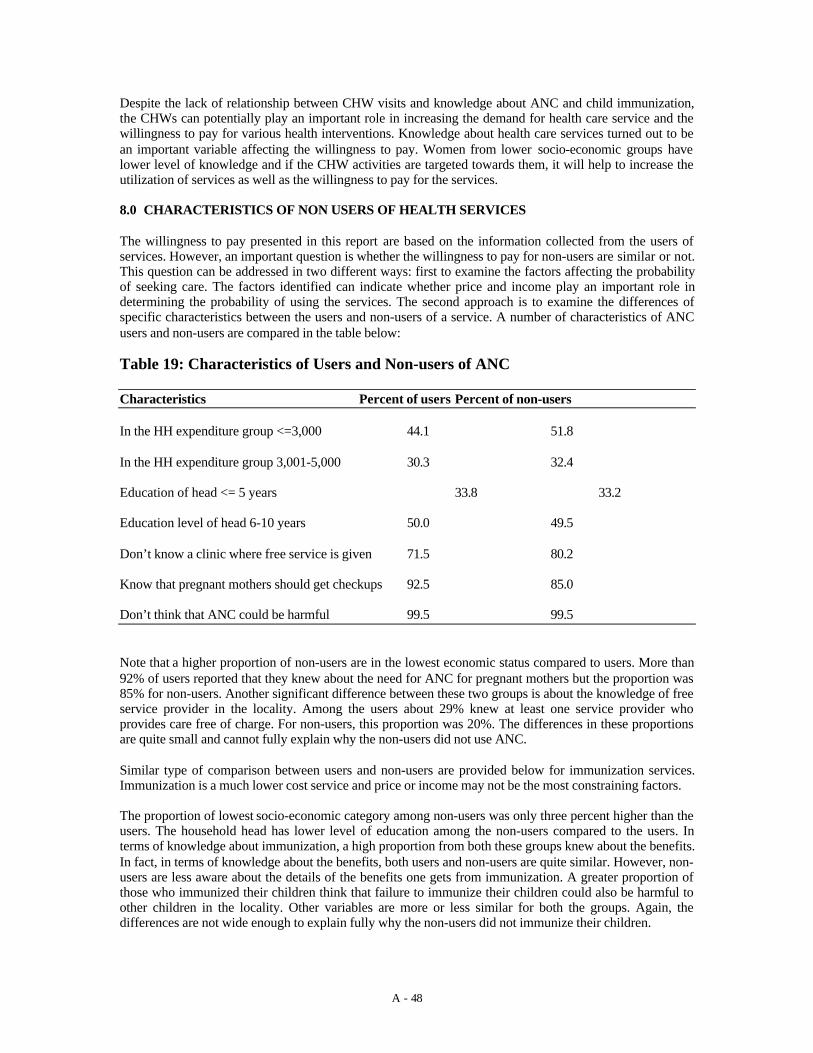
A - 48
Despite the lack of relationship between CHW visits and knowledge about ANC and child immunization,the CHWs can potentially play an important role in increasing the demand for health care service and thewillingness to pay for various health interventions. Knowledge about health care services turned out to bean important variable affecting the willingness to pay. Women from lower socio-economic groups havelower level of knowledge and if the CHW activities are targeted towards them, it will help to increase theutilization of services as well as the willingness to pay for the services.
8.0 CHARACTERISTICS OF NON USERS OF HEALTH SERVICES
The willingness to pay presented in this report are based on the information collected from the users ofservices. However, an important question is whether the willingness to pay for non-users are similar or not.This question can be addressed in two different ways: first to examine the factors affecting the probabilityof seeking care. The factors identified can indicate whether price and income play an important role indetermining the probability of using the services. The second approach is to examine the differences ofspecific characteristics between the users and non-users of a service. A number of characteristics of ANCusers and non-users are compared in the table below:
Table 19: Characteristics of Users and Non-users of ANC
Characteristics Percent of users Percent of non-users
In the HH expenditure group <=3,000 44.1 51.8
In the HH expenditure group 3,001-5,000 30.3 32.4
Education of head <= 5 years 33.8 33.2
Education level of head 6-10 years 50.0 49.5
Don’t know a clinic where free service is given 71.5 80.2
Know that pregnant mothers should get checkups 92.5 85.0
Don’t think that ANC could be harmful 99.5 99.5
Note that a higher proportion of non-users are in the lowest economic status compared to users. More than92% of users reported that they knew about the need for ANC for pregnant mothers but the proportion was85% for non-users. Another significant difference between these two groups is about the knowledge of freeservice provider in the locality. Among the users about 29% knew at least one service provider whoprovides care free of charge. For non-users, this proportion was 20%. The differences in these proportionsare quite small and cannot fully explain why the non-users did not use ANC.
Similar type of comparison between users and non-users are provided below for immunization services.Immunization is a much lower cost service and price or income may not be the most constraining factors.
The proportion of lowest socio-economic category among non-users was only three percent higher than theusers. The household head has lower level of education among the non-users compared to the users. Interms of knowledge about immunization, a high proportion from both these groups knew about the benefits.In fact, in terms of knowledge about the benefits, both users and non-users are quite similar. However, non-users are less aware about the details of the benefits one gets from immunization. A greater proportion ofthose who immunized their children think that failure to immunize their children could also be harmful toother children in the locality. Other variables are more or less similar for both the groups. Again, thedifferences are not wide enough to explain fully why the non-users did not immunize their children.

A - 49
Table 20: Characteristics of Users and Non-users of Immunization Services
Characteristics Percent of users Percent of non-users
HH expenditure <=Tk.3,000 44.2 47.0
HH expenditure in between 3,001-5000 29.6 29.1
Education of head <=5 years 69.5 77.5
Children should be immunized by age 1 97.5 97.2
Know where to take child for immunization 98.1 95.8
Know the benefits of immunization 98.6 96.8
Can specify the benefits of immunization 80.0 73.7
Think that immunization could be harmful 69.1 61.8
If not immunized, think that it may affect others 41.2 34.4
Know a facility that provides free immunization 56.4 56.1
To understand the use and non-use of ANC by currently pregnant women andwomen who delivered in last one year, two separate logistic regressions wereestimated. The first regression predicts the utilization of ANC by currently pregnantwomen. The regression equation shows that household economic status is importantin predicting the use of ANC. Educational level of women more than five years isalso important but price of ANC show no significant impact. Presence of freeproviders improves utilization rate. Age of woman is not important in explaining theANC utilization pattern.
For women who delivered in the last one year, all the variables found important for currently pregnantwomen also turned out to be important here. The predictive power of the model for this group was betterthan the currently pregnant group. It appears that there is no difference in the pattern of utilization of ANCby these two groups and there is also no age effect implying that among the currently married women, theutilization pattern is similar.

A - 50
9.0 EXIT INTERVIEW
In total 177 service recipients were interviewed at the exit point visiting six UFHP facilities. The averagewaiting time for all these service recipients were 16.6 minutes. The waiting time was found to be highest incase of child immunization (27.7 min.). The clients coming for pill and condom supply spend on averageabout 7 minutes in waiting at the facility for the supply. The average travel cost for them was Tk. 4.23, itwas lowest (Tk.2.9) for maternal health. (Table VI-1). The average cost of treatment at the facility
About 70% of the service recipients agreed to pay more than what has been paid for the services. 3% toldyes, if quality / behaviour improved (Table VI-2). The average willingness to pay for pill/condom wasTk.25. The willingness to pay maternal health and child health was high, Tk. 30.9 and Tk. 39.5respectively. For immunization, the average willingness to pay was found to be at Tk. 22.8.

A - 51
10. WILLINGNESS TO PAY FOR IMPROVED QUALITY OF CARE
This research also asked the respondents (selected for household indepth interviews) about their opinion onthe quality of care received from the health centers. The quality of care has been defined using fiveimportant attributes: information provided by the care providers, behavior of the providers with patientswhen providing the care, training and ability of the health care providers, cleanliness of the health centersand waiting time at the health center for receiving the care. All these dimensions of quality of care wereasked to the respondents for ANC, immunization, family planning and basic curative services separately.
ANC Service Quality
Annex table VII-1 reports the percent of users who reported that they were very satisfied with the servicesprovided. Among the poor households (with household expenditure below Tk.3,000), 82% reported that theproviders gave enough information about ANC when they sought care. Among the highest income grouphouseholds, 90% reported receiving adequate information. Almost all users reported that they were happywith the behavior of the ANC providers (98.5%). When asked about the quality of ANC checkup received,again 99% reported satisfaction with the service. More than 90% among the poor thought that the healthcenters where ANC services were provider were quite clean but 86% of the richest group considered theclinics clean. Waiting time was not a problem for 85% of respondents. Among the poor, 82% reported thatwaiting time was low. The satisfaction with waiting time tends to decline with higher income. It is not clearwhether the poorer households actually wait for longer period or they consider similar waiting time ashaving greater welfare declining impact.
The table also shows the quality of service indicators by urban categories A, B andC. In the most urbanized area, women reported least satisfied with the informationthey received about ANC from the providers. In urban category A, 36% reportedthat enough information was not provided but in urban areas B and C theproportion dissatisfied were 5% and 14% respectively. In general, users in categoryB of urban area clinics appear to be most satisfied. In category B health centers, lessthan 5% reported that the health centers were not clean and 9% reported that theyhad to wait a long period of time to obtain services. For categories A and C,dissatisfaction with cleanliness were 17% and 16% and dissatisfaction with waitingtime were 12% and 22% respectively.
If the quality indicators are examined by the type of health centers used by the respondents, public sectorfacilities appear worst in terms of all indicators excepting waiting time. Waiting time was mentioned as aproblem by 21% of users of UFHP clinics compared to 12% for the users of public health centers. Table 21reports the satisfaction indices by the five attributes for ANC users.
Table 21 below summarizes the willingness to pay for ANC if the quality of serviceis improved. Only very few respondents mentioned that they are willing to payadditional money for the improvements in different quality indicators. Note fromthe table that waiting time was the most important concern of the women followedby the information provided and cleanliness of the facilities. Among those who weredissatisfied, more than 75% mentioned that they will be willing to pay someadditional money to improve the amount of information provided. More than 82%and 76% of unsatisfied clients mentioned that they will pay for improved cleanlinessand reduced waiting time respectively. The table also reports the willingness to payfor ANC with and without the quality improvements.
Table 21: Willingness to Pay (WP) for Those who Were not Satisfied with ANC Quality of CareANC

A - 52
Willingness to pay forimprovement
Overall average for WP WP after qualityadjustment
Category
No Yes Total Mean Median Mode Mean Median
Mode
Information 33(23.1)
110(76.9)
143(100)
42.1 23.0 5.0 46.3 25.0 10.0
Behavior 4(44.4)
5(55.5)
9(100)
30.2 20.0 5.0 34.1 25.0 25.0
Providersquality
4(36.4)
7(63.6)
11(100)
14.6 15.0 15.0 19.0 15.0 15.0
Cleanliness 16(17.4)
76(82.6)
92(100)
72.4 27.0 15.0 76.0 31.0 20.0
Waiting time 55(23.1)
183(76.9)
238(100)
64.1 30.0 10.0 68.0 35.0 15.0
Quality of Immunization Services
For immunization services, more than 95% mentioned that they were happy withthe behavior of the providers and quality of the service received from the healthcenter. Clearly, the satisfaction scores for these two attributes are very high. Onereason could be that immunization activities require very little time of the providersand providing immunization in Bangladesh becomes an important social event. It isinteresting that provision of enough information, cleanliness of the facilities andwaiting time were mentioned as problematic by more than 20% of respondents.About a third of all mothers thought that they did not receive adequate informationduring the immunization sessions and 18% reported relatively long waiting time.The information provided was considered inadequate by 29% of poor and about26% of the richest group. Lower-middle income group (Tk.3001-5000) was mostdissatisfied in terms of information received, about 39% of the users from thisgroup. Annex table VII-2 reports the satisfaction level of respondents related toimmunization services.
If the urban categories are considered, mothers reported highest degree of unhappiness regardinginformation provision in category A clinics (44%). In category C clinics as well, about a third reported thatadequate information was not provided during immunization of children. Waiting time was also reported tobe high in category A clinics. If the types of clinics are considered, users of public clinics were relativelymore dissatisfied than the UFHP clinics in terms of information provision but UFHP clinics get slightlylower score than public facilities in terms of waiting time.
Table 22 is the summary of the additional amount respondents are willing to pay forimproved quality of immunization services. For immunization, the three mostimportant quality concerns are: lack of enough information, long waiting time andcleanliness. The problem of cleanliness is much lower for immunization than forANC. The proportion of dissatisfied clients willing to pay additional money is foundto be quite low for immunization.
Table 22: Willingness to Pay (WP) for Those who Were not Satisfied with Immunization Quality ofCare
Immunization

A - 53
Willingness to pay forimprovement
Overall average for WP WP after quality adjusted Category
No Yes Total Mean Median Mode Mean Median ModeInformation 58
(46.8)66(53.2)
124(100)
9.1 7.0 5.0 12.7 10.0 10.0
Behavior 4(100)
- 4(100)
7.5 7.5 5.0 10 10.0 10.0
Providersquality
4(100)
- 4(100)
10.0 7.5 5.0 13.1 10.0 10.0
Cleanliness 23(40.4)
34(59.6)
57(100)
12.0 10.0 5.0 16.0 15.0 15.0
Waiting time 16(21.9)
57(78.1)
73(100)
12.2 10.0 10 15.6 15.0 15.0
Quality of Family Planning services
For family planning services as well, almost all women were satisfied with the behavior of the provider.They also thought that the providers were `good’ and qualified. However, 74% of women from the poorestexpenditure class and 86% from the highest expenditure class considered that the information providedabout family planning was adequate. Higher expenditure groups appear to be less happy in terms ofcleanliness of the facility. The highest economic group was also most happy in terms of waiting time at thecenter for obtaining the services.
The women in urban category B were more happy than women in other urban areas in terms of informationprovided, behavior of the provider, quality of the provider, and cleanliness of facilities. In metropolitanareas (category A), about 48% of users of family planning services felt that enough information was notprovided to them by the providers.
When we examine the proportions of women satisfied with the quality of service, itis important to note that UFHP facilities get high rank in perceived qualitymeasures. In fact, women using family planning services considered UFHP clinicsbetter than the private clinics in all areas excepting the category `informationprovided’. In this category, 74% of UFHP users were satisfied compared to 76% forprivate clinics and 77% for public clinics. Waiting time was also reported to be lowby about 93% women using UFHP clinics. Annex table VII-3 reports the satisfactionof women with the quality of family planning services.
For family planning services as well the three most important quality concerns are inadequate provision ofinformation about the service, cleanliness of the facilities and long waiting time. In general, inadequateinformation concerns many more women than any other quality indicators we have used. A number ofthese unhappy clients were also willing to pay additional money for improving some specific aspects ofservice provision. If the health care delivery system can improve the amount of relevant informationprovided to women, improve the cleanliness of the facilities and reduce waiting time, more than 20% of allwomen will be wiling to pay additional Tk.4 to 10 taka for family planning services. Table 23 reports thesenumbers.
Table 23: Willingness to Pay (WP) for Those who Were not Satisfied with Family Planning Qualityof Care
Family PlanningWillingness to pay forimprovement
Overall average for WP WP after quality 0adjusted Category
NoExp
YesExp
Total Mean Median Mode Mean Median Mode

A - 54
Information 37(22.7)
126(77.3)
163(100)
11.6 10.0 15.0 15.2 15.0 20.0
Behavior 4(44.4)
5(55.6)
9(100)
14.3 11.0 15.0 16.8 16.0 10.0
Providersquality
12(70.6)
5(29.4)
17(100)
9.5 5.0 5.0 13.2 10.0 10.0
Cleanliness 11(21.2)
41(78.8)
52(100)
12.9 11.5 15.0 16.8 15.5 20.0
Waiting time 23(37.7)
38(62.3)
61(100)
14.2 10.0 15.0 17.4 15.0 15.0
Quality of basic curative service provided
Annex table VII-4 shows the proportion of respondents satisfied with the quality of service of curative care.Again, in general, respondents were quite happy with the quality of curative care provided by differentfacilities. Almost all respondents mentioned that the behavior of the medical care providers was good, theproviders were very qualified and the facilities were clean. About 25% of the women thought that thewaiting time for curative care was relatively long and 20% reported that they were not provided enoughinformation by the medical care providers about the illnesses. The satisfaction levels were almost identicalamong all the economic groups.
Women in urban area A were most unhappy about the level of information provided. In fact, 38% of therespondents in urban category A were not happy with the amount of information given in case of an illness.Waiting time was reported to be a problem more by the respondents in urban area B than in other urbanareas.
Public facilities were considered relatively bad in terms of information provision about illness and waitingtime. The UFHP was rated at least as good as the private providers in terms of all the quality indicatorsused here.
Table 24 shows the number of respondents reporting dissatisfaction with the quality of care provided forillness conditions. For illness cases, lack of information and waiting time both becomes equally important.
Table 24: Willingness to Pay (WP) for Those who Were not Satisfied with IllnessQuality of Care
IllnessWillingness to pay forimprovement
Overall average for WP WP after quality adjusted Category
NoExp
Yes Exp Total Mean Median Mode Mean Median Mode
Information 14(9.3)
137(90.7)
151(100)
99.7 60.0 20.0 103.7 65.0 210.0
Behavior 3(12.5)
21(87.5)
24(100)
198.1 90.0 20.0 199.6 91.3 20.0
Providersquality
2(8.7)
21(91.3)
23(100)
166.2 62.0 20.0 168.7 64.5 22.5
Cleanliness 17(15.7)
91(84.3)
108(100)
90.0 60.0 155.0 93.8 65.0 160.0
Waiting time 22(14.7)
128(85.3)
150(100)
127.6 62.5 10.0 131.6 65.0 25.0
A - 55
11. COMPARISON OF UFHP AND ANOTHER NGO CLINIC
The areas where comparison between NGOs were made were in category A and C.The other NGO was also found to be providing ESP services in these areas. It wasfound that these NGO had field workers to provide doorstep services. The NGOfound in Category A area provided MR services. The UFHP clinics were found to bemore equipped with IEC materials and staffing pattern also differ from others. Thecomparison of registration fee in the UFHP and other NGO facilities are given atTable: VIII-1 to VIII-4 gives the detail. The registration fee at one of the other NGOwas found to be higher than in UFHP NGO.
Among the different family planning services, UFHP clinic in urban category A didnot provide four specific services while the other NGO did not provide three. TheUFHP clinic in urban category C provides all the family planning services providedin urban clinic category A but the NGO clinic in urban category C was found to bevery basic. The NGO clinic in urban area C provided only two of nine differentfamily planning services. In reproductive health area, UFHP clinic provided lessnumber of lines of services than other NGO clinic in urban area A. For child healthand laboratory services, UFHP and other NGO clinics in urban location A arealmost similar in terms of different types of services available. In urban area C,UFHP clinic provide higher number of types of services than the NGO clinic.
Therefore, the UFHP clinics generally provide wide range of family planning,reproductive health, child health and laboratory services and it should be quitecompetitive in the market in terms of different lines of activities organized andprovided. In urban category C, the UFHP clinics appear to be much better in termsof number of different types of services provided.

A - 56
12. ABILITY TO PAY FOR BASIC HEALTH CARE PACKAGE
The study made an attempt to find out the ability to pay of the households for a predefined recommendedpackage of service. The standard package is assumed to include the following services:
ANC services: three1 visits per pregnancyImmunization of children: four visits for a child by 12 months of ageFamily planning2 services: Pill supply: 13 cycles per year
or Condom: 144 pieces3 per year (requiring 36 visits a year with eachvisits for a pack of four pieces)
or Injectables: 4 times per yearChildhood illnesses for under 5 children: two visits per yearAdult illnesses: one visit per year.
Using the definition of the package, cost was estimated for each of the households. For example, if ahousehold has one child of age 1 year, cost of four immunization visits and two other visits will beconsidered. If the family planning users of the household use pills, costs of obtaining pills were considered.
To find the price of the package, we need to use some standard market price. The best estimate of themarket price will be the price individuals have reported paying for obtaining the services4. Using thereported prices from the survey, the average prices were calculated. Due to few high values of the reportedcosts, the average values became very biased. The median and mode values are probably more relevant indescribing ability to pay rather than the average price.
The mean, median and mode prices are given below:
Service Mean price Median ModeANC Tk. 55 Tk.20 Tk.10Immunization Tk. 7 Tk.5 Tk.5Pills Tk.11 Tk.6 Tk.5Condoms Tk.8 Tk.5 Tk.5Injectables Tk.9 Tk.10 Tk.10U5 Illness Tk.63 Tk.40 Tk.20Other illness Tk.331 Tk.60 Tk.50
Using the prices, total cost of the package was estimated and then compared withthe household expenditure level. The percent of expenditure needed to buy thispackage was determined. If the percent of income needed exceeds 1.5%, thehousehold is categorized as not able to pay for the basic package. The followingshows the percent of households not able to pay for the assumed prices for thedifferent household expenditure group:
Table 25: Percentage of households not able to pay for the basic health carepackage in different expenditure group
0000-1500 1501-3000 3001-5000 50001-7000 7000+ AllPrice set at themean values 100 100 100 96.1 63.1 94.6
1 Though the ideal situations should be five visits per year, at least three visits is said to be necessary. ANCis considered for all pregnant women even if not using2 Family planning services recommended even if not a user (excluding those who are pregnant and notusing for valid reasons).3 A pack of four condoms is bought on each visit.4 This payment is the total money spent at the providers, transport cost is excluded.

A - 57
Price set at themedian level 91.6 47.0 9.3 1.1 - 24.9Price set atmodal value 47.0 5.3 0.8 - - 3.7
The results can be simulated by using any other price levels. If the major objective of the UFHP is costrecovery, the cost of production data can be used as the price to see whether most of the households in theUFHP areas will be able to pay for the service package. A computer program has been written to carryoutthese simulations and the HEP can perform the calculations for the alternative price scenarios if requestedby the policy makers or UFHP managers.
As noted earlier, the study households are selected in a way where households with pregnant mothers, orchildren, or mothers eligible for family planning are mainly selected. Under such circumstances, the sampleeither over or under-represent different demographic groups as compared to national estimates or ourestimates from the census survey (see annex table …). If we have to make estimates of the proportion ofpopulation who are not able to pay for the package by considering the community as whole, it will benecessary to correct the estimated value for the packages with correction factor that are shown in annextable ???.
One additional useful analysis could be to consider few hypothetical demographic characteristics ofhouseholds to estimate their health care expenditure based on the need definition mentioned above. Threedifferent hypothetical household expenditure groups (as a proxy of income) with five differentdemographic structures were considered to examine the ability to pay. In other words, this exercisedetermines whether a household belonging to a specific expenditure group (Tk. 2000, Tk.4000, and Tk.6000) can afford to pay for a set of very basic health care services. For each of these household categories,total health care expenditure has been calculated using modal values (using the survey data for differenttype of care) and shown as portion of their total household expenditure. The five hypothetical demographiccharacteristics of household that were considered are as follows:
HH1: One adult male, one adult female (the couple is family planning user), four under five children.This type of household’s health care need include one illness care for each adult person in a year, familyplanning services over the year, two illness episode for each child and immunization services for eachchild.
HH2: One adult male, one pregnant woman, four under five children. This type of household will need 3visits for ANC, and immunization services for two children, two illness care for them in a year, and twoillnesses care for other two children.
HH3: One adult male, one adult woman (using family planning), one child above 5 year, and 3 under fivechildren. In this household, the total demand for health services include, two illnesses care for the adultsperson, family planning services, one illness care for children, and six illness care for three children andtwo visits for immunization visits.
HH4: One adult male, one pregnant woman, one child above 5 years, three under five children. Thisfamily will need illness care for adults, ANC, child illness care visits, and six child illness care, and oneimmunization visits.
HH5: One adult male, one adult female (using family planning services), twochildren, above 5, two under five children. This type of family needs one adultillness care, one family planning services, four child health care need twoimmunization services through immunization.

A - 58
Table 25 shows the health care expenditure (using modal value) as a proportion of total householdexpenditure (income) of five different demographic structures. The value higher than 1.5 shows that thehousehold will not be able to pay for the services required as a basic health care package.
Table 26: Health Care Expenditure for the Basic Health Care as a Proportion of theTotal Household Expenditure Levels (Taka)
HH Structure 1500 3000 5000 7000
HH1
HH2
HH3
HH4
HH5
1.95
1.72
2.00
1.78
2.06
0.97
0.86
1.00
0.89
1.03
0.58
0.52
0.60
0.53
0.62
0.42
0.37
0.43
0.38
0.44
Note that, households earning Tk.1,500 per month will not be able to pay whatever be their demographiccomposition. Household expenditure level of Tk.3,000 or more should be able to pay for the basic healthcare services considered here. In fact, household expenditure level of Tk.2,000 becomes marginally notable to pay for the basic package of service. Therefore, if the health care system is planning to develop amechanism of `safety net’ for the disadvantaged groups, one criterion could be to use the expenditure levelof Tk.2,000 or less. Using expenditure levels as targeting criterion is extremely difficult and often notpractical. Further analyses should be carried out to identify a number of easily observable indicators, whichcan be used to identify the target group. This exercise indicates that about 15 to 17 percent of householdsshould be considered by the health care delivery system for some type of price subsidy.13. CONCLUSIONS AND POLICY IMPLICATIONS
The study examined the health seeking behavior, willingness and ability to pay for selective health careservices in urban Bangladesh. Using the UFHP definition of urban categories, the survey was carried out inall the three urban areas: A, B and C.
It should be noted here that the study examines the health seeking, willingness and ability to pay for aspecific target group, the households with women in reproductive age group. In selecting the sample,households with pregnant woman and women delivered during the last one year were emphasized.Therefore, the results of this analysis apply to these specific target groups. The types of services providedby UFHP implicitly target these groups and therefore, the analysis will be useful for understanding theutilization of UFHP provided services and the willingness and ability to pay of those households who aremore likely to use the UFHP facilities.
The survey of this research was carried out in the immediate geographic area around the UFHP healthcenters. Comparison of the average economic status of households around the static clinics and satelliteclinics indicates that the population around the satellite clinics are much poorer than the households aroundthe static clinics. Clearly, operation of satellite clinics significantly improves the access of the poor toUFHP clinics. This also indicates that UFHP is quite successful in locating the satellite clinics in areas toimprove the access of extremely poor households to the clinic services.
The study examined a number of specific health care services for more in-depth analysis. The healthservices considered here are: Antenatal Care, Immunization, Family planning and basic curative services.
The survey found that most women are aware of the benefits of ANC. Although more than 95% of womenreported that ANC services are needed for pregnant women, 13% of women in urban area C (the least

A - 59
urbanized area) did not know the importance of ANC. Therefore, it is important to strengthen the healtheducation aspects in urban area C. The survey also indicates that the women are not fully aware of thebenefits of ANC. Efforts should be directed towards improving the depth of knowledge in all urban areas ofthe country.
Knowledge about availability of ANC providers was also found to be quite good among the women. Inurban area C, slightly higher proportion of women were not aware compared to the proportions in other twoareas. In urban location C, only 29% of women mentioned UFHP clinics as a source of ANC. Since thesurvey households are located very close to the UFHP clinics, it is quite surprising that so many failed tomention UFHP clinics. In urban category C, UFHP should try to improve the visibility of their clinics andtake appropriate actions to better market the services provided through their clinics.
Most of the women were aware of the market price of ANC services. Minimum market prices of ANCreported by women vary from about Taka 20 to 60. Less than 20% of women consider UFHP price forANC as high. This should be the upper limit of the proportion of households not able to pay for ANCservices.
The comparison of the utilization patterns of public and UFHP clinics for currently pregnant women andwomen who delivered in the last one year indicates an interesting trend. The utilization patterns show thatthe UFHP clinics have become relatively more important for ANC services for currently pregnant womencompared to the relative utilization rate for women who delivered in the last one year. Therefore, over thelast one-year period, women are using the UFHP clinics more frequently than they used in the past. Therelative increase in the utilization of UFHP clinics has occurred at the expense of public facilities. In otherwords, the UFHP clinics are competing with the public sector facilities for the delivery of ANC.
The ANC service is relatively expensive (per unit cost) but still price paid for ANC was not very significantin explaining utilization or non-utilization of ANC services. Household income, education level of thewoman and knowledge of woman about the benefits of ANC appear much more important in determiningthe demand for ANC.
For the immunization activities, the survey found that women had almost perfect information aboutimmunization. So, knowledge was not a problem for immunization. Despite the perfect knowledge only69% of the children were immunized. Important sources of immunization were public facilities and UFHPclinics. Therefore, knowledge has not been transformed into action in Bangladesh urban areas. It isimportant to examine why so many households fail to immunize their children even though they are fullyaware about the benefits of immunization.
In urban areas, about 50% of mothers reported obtaining immunization free of cost. Access to freeimmunization is similar for all socioeconomic groups. Access to free immunization may be important forincreasing the coverage of immunization. However, it is not clear how important is access to free servicefor seeking immunization for children. Further analyses are needed to find out the effect of price and freecare on the utilization of immunization by various socioeconomic groups. It is possible that for poorhouseholds availability of free immunization is important. Since about half of the respondents paid somemoney for immunization, equity in the delivery of immunization can be improved by better targeting thefree provision towards the poorer households.
About 17% of women who paid for immunization mentioned that the fee for immunization was too high. Ifwe consider the households who did not pay anything for immunization as belonging to this group, totalproportion of women considering the current charges too high should be about 58%. About 62% of motherswho paid for immunization mentioned that they are willing to pay more money than what they have paidlast time, if needed. Therefore, about 30% of households with young children are willing to pay more thanwhat they have already paid last time.
It appears that imposing fee on immunization may adversely affect the utilization of immunization services.Since the coverage of immunization is quite low, it is important to strengthen delivery of immunizationservices in urban areas. The UFHP clinics are already playing very important role in the delivery of

A - 60
immunization along with the public sector. The efforts of public sector and UFHP should be closelycoordinated to improve the delivery of immunization services.
For the curative care services, households living in the UFHP clinic areas do not consider the clinics as theproviders of basic curative services. Only 14% of respondents mentioned UFHP clinics as a source of ARIcare services. For diarrhoea, only 8.5% mentioned UFHP clinics as source. Households in the UFHP clinicareas consider the clinics as providing maternal and child care preventive services. The marketing strategyof UFHP should also emphasize the availability of curative services.
About 60% of women obtained family planning services from the public sector and the UFHP clinics. Theremaining 40% obtained the services from the private sector. Willingness to pay for family planningservices is dependent upon educational level of women and household economic status. Knowledge aboutfamily planning services was not important in determining the willingness to pay.
During the past one month (prior to the survey), a significant number of households were visited by acommunity health workers. It should be noted that all the community health worker visits may not be fromthe UFHP facilities. The study did not find any correlation between the CHW visits and the knowledge andpractice of the households. This does not necessarily imply that the CHWs are not effective. It is possiblethat the positive effects of CHW visits are not observable due to their visits to other households in theprevious months. If the CHW visits have any positive impact, visits to all or almost all households overfour to fine month period may reduce variability among households. However, the survey did not ask aboutthe visit of CHWs over the last four to five months and it was not possible to estimate the effect of CHWvisits.
Comparison of users and non-users of different services indicate that slightly higher number of non-users ofANC were from the poor household category. Non-users also differ significantly in terms of theirknowledge of a facility that provides free ANC service. Other than these two variables, the users and non-users of ANC are very similar. Knowledge and household economic status show some minor impact onimmunization rates. Again, the users and non-users of immunization were not significantly different interms of other variables. It appears that the change of status from non-user to user requires considerableefforts from the providers. Better education and knowledge improves the willingness to pay for services butdo not show significant impact on utilization.
A simple exercise was carried out to understand the ability of pay of households for basic medical careservices including family planning and preventive care. If the median price is used, about 23% ofhouseholds will not be able to pay for the basic package defined. If the modal price is used, less than fourpercent of households will not be able to pay. In general, the analysis indicates that Tk.2,000 of expenditureper household per month should be used as the cut-off level to define inability to pay for the basic package.If this definition is used, 14 to 17% of households will require price subsidy.
The survey shows that the average minimum price in the market reported by women for various serviceswere higher than the price charged by UFHP clinics. Therefore, the fee structure of UFHP is not higherthan the minimum price of the service in the market. This does not necessarily mean that UFHP shouldraise the price. As a responsible social organization, UFHP should carefully examine the impact of theprices on utilization and final outcome.
Even if the average willingness to pay numbers are used for various health care services, the amount ofpayment per service remains so low that it is unlikely to recover more than 50% of the cost. Since,implementing a perfectly designed sliding scale (i.e., prices charged is same as the willingness to pay) isimpossible, the cost recovery ratio in the short-run is unlikely to exceed 30% level. Given the fact thathealth care services from UFHP clinics will remain quite heavily subsidized, the policy makers shouldexamine differential subsidy levels for different types of services to improve total social well-being of thepopulation.

A - 61
Reference
Ahmed, Mozaffar (1995) Health Sector in Independent Review of Bangladesh, Center for Policy Dialogue,Dhaka, Bangladesh.
Bangladesh Bureau of Statistics, Yearbook of Bangladesh 1997, Ministry of Planning, Government ofBangladesh.
Khan, M. Mahmud, Zhu N., Ling J C (1997) “Designing a Health Insurance Programme for RuralBangladesh: Lessons from the Cooperative Medical System of Taicang County, China”. The BangladeshDevelopment Studies. Vol. XXV, March-June 1997, Nos. 1 & 2.

A - 1
ANNEX I
BASIC HOUSEHOLD INFORMATION
Table I-1 : Age distribution of the household members in the UFHP clinic areas
Static Clinic Areas Satellite Clinic Areas
AgeGroup
MaleN %
FemaleN %
Total MaleN %
FemaleN %
Total
< 1 yr 92 5.8 80 4.8 172 381 6.0 427 6.8 808
1-2 yr 127 8.0 112 6.7 239 486 7.7 462 7.3 948
3-4 yr 98 6.2 142 8.5 240 525 8.3 472 7.5 997
5-10 yr 216 13.6 224 13.3 440 930 4.7 996 15.8 1926
11-14 yr 82 5.2 120 7.1 202 467 7.4 445 7.0 912
15-19 yr 85 5.3 148 8.8 233 354 5.6 741 11.7 1095
20-24 yr 83 5.2 253 15.1 336 338 5.3 832 13.2 1170
25-29 yr 156 9.8 212 12.6 368 580 9.1 684 10.8 1264
30-34 yr 212 13.3 130 7.7 342 696 11.0 399 6.3 1095
35-49 yr 341 21.4 89 5.3 430 1141 8.0 360 5.7 1501
50+ 98 6.2 169 10.1 267 443 7.0 499 7.9 942
Total 1590 100 1679 100 3269 6341 100 6317 100 12658

A - 2
ANNEX I
BASIC HOUSEHOLD INFORMATIONCATEGORY A
Table I-2: Age distribution of household members in the UFHP clinic areas
Static Clinic Areas Satellite Clinic Areas
AgeGroup
MaleN %
FemaleN %
Total MaleN %
FemaleN %
Total
<1 yr 18 3.9 22 4.3 40 109 5.5 137 6.9 246
1-2 yr 42 9.1 41 8.1 83 145 7.3 156 7.9 301
3-4 yr 33 7.1 46 9.1 79 163 8.2 159 8.1 322
5-10 yr 70 15.2 65 12.8 135 317 16.0 312 15.8 629
11-14 yr 26 5.6 38 7.5 64 156 7.9 147 7.4 303
14-19 yr 26 5.6 35 6.9 61 120 6.1 241 12.2 361
20-24 yr 14 3.0 76 15.0 90 108 5.4 270 13.7 378
25-29 yr 46 10.0 68 13.4 114 195 9.8 204 10.3 399
30-34 yr 66 14.3 44 8.7 110 208 10.5 124 6.3 332
35-49 yr 100 21.6 30 5.9 130 350 17.7 113 5.7 463
50+ yr 21 4.5 43 8.5 64 111 5.6 111 5.6 222
Total 462 100.00 508 100.0 970 1982 100.0 1974 100.0 3956

A - 3
ANNEX I
BASIC HOUSEHOLD INFORMATION
CATEGORY B
Table I-3: Age distribution of household members in the UFHP clinic areas
Static Clinic Area Satellite Clinic AreaAge Group Male
N %Female
N %Total Male
N %Female
N %Total
<1 yr 39 8.3 19 3.9 58 102 6.2 129 7.7 231
1-2 yr 27 5.8 34 6.9 61 137 8.3 112 6.7 249
3-4 yr 31 6.6 40 8.1 71 138 8.3 116 6.9 254
5-10 yr 51 10.9 63 12.8 114 217 13.1 239 14.2 456
11-14 yr 25 5.3 38 7.7 63 115 6.9 108 6.4 223
15-19 yr 26 5.6 48 9.8 74 84 5.1 189 11.3 273
20-24 yr 31 6.6 76 15.4 107 88 5.3 242 14.4 330
25-29 yr 50 10.7 60 12.2 110 123 7.4 206 12.3 329
30-34 yr 53 11.3 35 7.1 88 216 13.0 110 6.6 326
35-49 yr 98 20.9 22 4.5 120 327 19.7 90 5.4 417
50+ yr 37 7.9 57 11.6 94 109 6.6 138 8.2 247
Total 468 100.0 492 100.0 960 1656 100.0 1679 100.0 3335
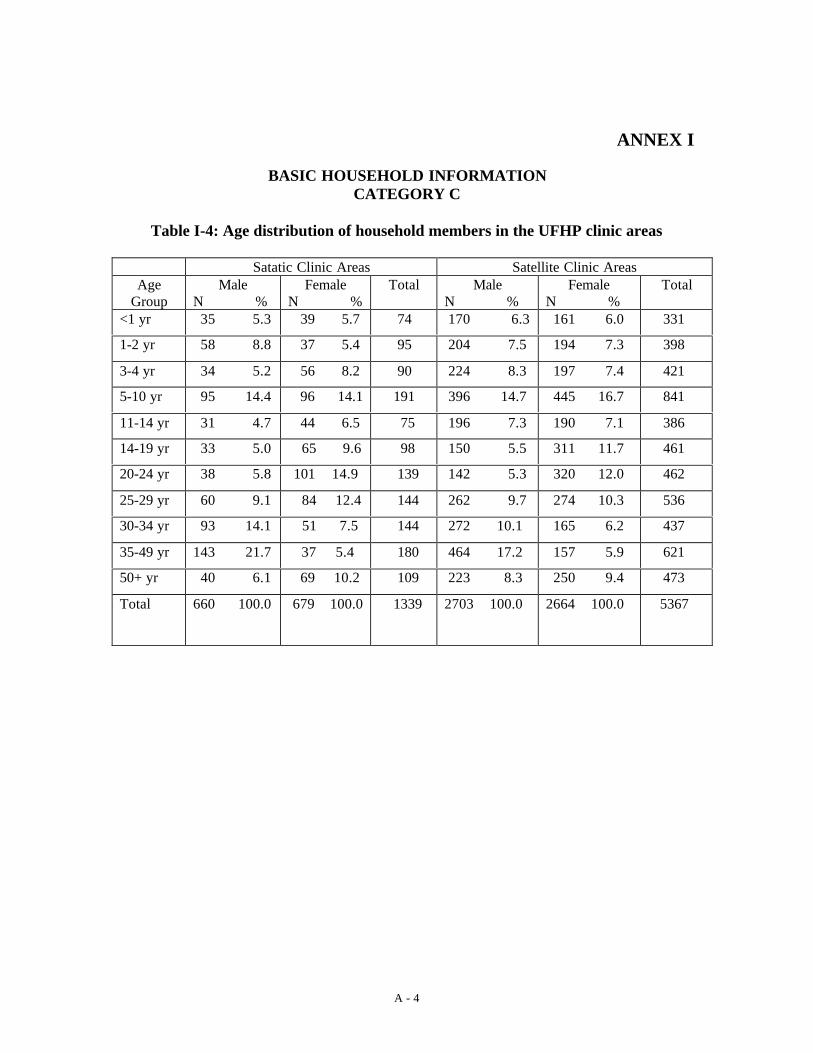
A - 4
ANNEX I
BASIC HOUSEHOLD INFORMATIONCATEGORY C
Table I-4: Age distribution of household members in the UFHP clinic areas
Satatic Clinic Areas Satellite Clinic AreasAge
GroupMale
N %Female
N %Total Male
N %Female
N %Total
<1 yr 35 5.3 39 5.7 74 170 6.3 161 6.0 331
1-2 yr 58 8.8 37 5.4 95 204 7.5 194 7.3 398
3-4 yr 34 5.2 56 8.2 90 224 8.3 197 7.4 421
5-10 yr 95 14.4 96 14.1 191 396 14.7 445 16.7 841
11-14 yr 31 4.7 44 6.5 75 196 7.3 190 7.1 386
14-19 yr 33 5.0 65 9.6 98 150 5.5 311 11.7 461
20-24 yr 38 5.8 101 14.9 139 142 5.3 320 12.0 462
25-29 yr 60 9.1 84 12.4 144 262 9.7 274 10.3 536
30-34 yr 93 14.1 51 7.5 144 272 10.1 165 6.2 437
35-49 yr 143 21.7 37 5.4 180 464 17.2 157 5.9 621
50+ yr 40 6.1 69 10.2 109 223 8.3 250 9.4 473
Total 660 100.0 679 100.0 1339 2703 100.0 2664 100.0 5367
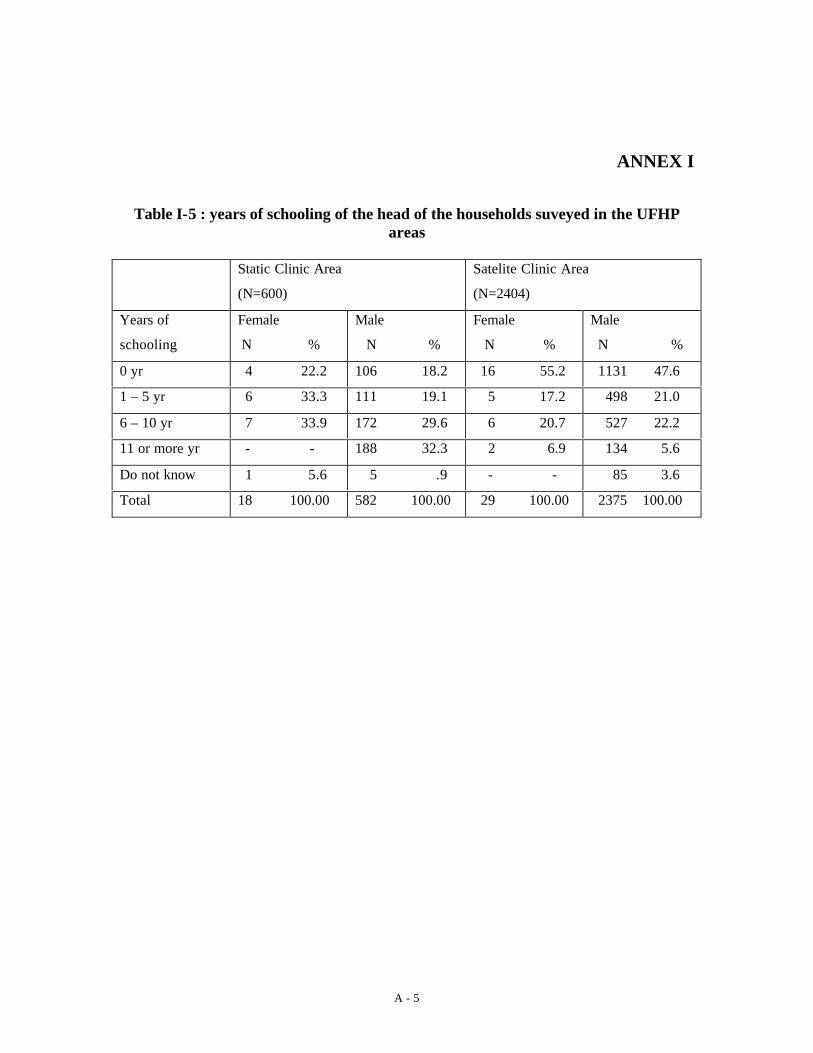
A - 5
ANNEX I
Table I-5 : years of schooling of the head of the households suveyed in the UFHPareas
Static Clinic Area
(N=600)
Satelite Clinic Area
(N=2404)
Years of
schooling
Female
N %
Male
N %
Female
N %
Male
N %
0 yr 4 22.2 106 18.2 16 55.2 1131 47.6
1 – 5 yr 6 33.3 111 19.1 5 17.2 498 21.0
6 – 10 yr 7 33.9 172 29.6 6 20.7 527 22.2
11 or more yr - - 188 32.3 2 6.9 134 5.6
Do not know 1 5.6 5 .9 - - 85 3.6
Total 18 100.00 582 100.00 29 100.00 2375 100.00

A - 6
ANNEX I
Table I-6 : years of schooling of the head of the households by UFHP Urbancategories
Years of schooling Category A
N %
Category B
N %
Category C
N %
0 yr 388 40.8 264 31.1 605 50.2
1 – 5 yr 197 20.7 192 22.6 231 19.2
6 – 10 yr 226 23.8 247 29.1 239 19.8
11 or more yr 106 11.1 117 13.8 101 8.4
Do not know 34 3.6 28 3.3 29 2.4
Total 951 100.00 848 100.0 1205 100.0
Table I-7 : years of schooling of the head of the households by UFHP Urbancategories
Category A Category B Category C
Years of
schooling
Static
N %
Satelite
N %
Static
N %
Satelite
N %
Static
N %
Satelite
N %
0 yr 31 17.4 357 46.2 32 17.7 232 34.8 47 19.5 558 57.9
1 – 5 yr 30 16.9 167 21.6 40 22.1 152 22.8 47 19.5 184 19.1
6 – 10 yr 43 24.2 183 23.7 60 33.1 187 28.0 76 31.5 163 16.9
11 or more yr 73 41.0 33 4.3 44 24.3 73 10.9 71 29.5 30 3.1
Do not know 1 .6 33 4.3 5 2.8 23 3.4 - - 29 3.0
Total 178 100.0 773 100.0 181 100.0 667 100.0 241 100.0 964 100.0

A - 8
ANNEX I
Table 1-8: Percentage distribution of househoulds into household expenditure groups by UFHPareas
All categories
(N=3004)
Category A
(N=951)
Category B
(N=848)
Category C
(N=1205)
HHExpenditureGroup (taka permonth)
StaticArea(N=600)
SatelliteArea(N=2404)
StaticArea(N=178)
SatelliteArea(N=773)
StaticArea(N=181)
SatelliteArea(N=667)
StaticArea(N=241)
SatelliteArea(N=964)
<=3000 32.5 56.6 28.7 53.3 36.5 54.4 32.4 60.7
3001-5000 24.7 28.6 21.3 33.8 26 28.9 26.1 24.2
5001-7000 15 9.3 16.3 9.1 14.4 10.2 14.5 8.8
7000+ 27.8 5.6 33.7 3.9 23.2 6.4 27 6.3
All groupstotal HH(N)
100 100 100 100 100 100 100 100

A - 9
ANNEX II
Table II-1: Women’s knowledge about the need for ANC and opinion about the number of ANC visit
Need for ANC Number of times ANC visits should be madeTOTAL
“No” “Yes”3-5 times 6-10 times When needed Other Don’t know
Urban Categories
A 980(100.0)
19(1.9)
961(98.1)
268(27.9)
320(33.3)
81(8.4)
54(5.6)
238(24.8)
B 887(100.00)
30(3.4)
857(96.6)
242(28.2)
257(30.0)
78(9.1)
74(8.6)
206(24.0)
C 1281(100.0)
157(12.3)
1124(87.7)
352(31.3)
290(25.8)
53(4.7)
134(11.9)
295(26.2)
Total (allcategories)
3148(100.0)
206(6.5)
2942(93.5)
862(29.3)
867(29.5)
212(7.2)
262(8.9)
739(25.1)
HH Expenditure Level (taka per month)
<=3000 1565(100.0)
113(7.2)
1452(92.8)
437(30.1)
321(22.1)
89(6.1)
158(10.9)
447(30.8)
3001-5000 879(100.0)
57(6.5)
822(93.5)
242(29.4)
249(30.3)
79(9.6)
54(6.6)
198(24.1)
5001-7000 341(100.0)
20(5.9)
321(94.1)
108(33.6)
114(35.5)
21(6.5)
26(8.1)
52(16.2)
>7000 363(100.0)
16(4.4)
347(95.6)
75(21.6)
183(52.7)
23(6.6)
24(6.9)
42(12.1)
Total 3148(100.0)
206(6.5)
2942(93.5)
862(29.3)
867(29.5)
212(7.2)
262(8.9)
739(25.1)

A - 10
ANNEX II
Table II-2: Women’s knowledge about the benefits of ANC visit
Any benefit of ANC? Reported benefits of using ANC servicesTOTAL
“No” “Yes”Helps toidentify
mothers’physicalproblem
Helps toidentify
children’sphysicalproblem
Position of thebaby can be
known
Possible toprevent
complexitiesduring
delivery
Others
Urban Categories
A 980(100.0)
39(4.0)
941(96.0)
571(60.7)
276(29.3)
494(52.5)
216(23.0)
226(24.0)
B 887(100.0)
63(7.1)
824(92.9)
384(46.6)
284(34.5)
516(62.6)
60(7.3)
293(35.6)
C 1281(100.0)
172(13.4)
1109(86.6)
612(55.2)
362(32.6)
512(46.2)
84(7.6)
332(29.9)
Total (allcategories)
3148(100.0)
274(8.7)
2874(91.3)
1567(54.5)
922(32.1)
1522(53.0)
360(12.5)
851(29.6)
HH Expenditure Level (taka per month)
<=3000 1565(100.0)
159(10.2)
1406(89.8)
728(51.8)
419(29.8)
701(49.9)
154(11.0)
408(29.0)
3001-5000 879(100.0)
75(8.5)
804(91.5)
450(56.0)
246(30.6)
425(52.9)
108(13.4)
241(30.0)
5001-7000 341(100.0)
26(7.6)
315(92.4)
173(54.9)
110(34.9)
193(61.3)
45(14.3)
103(32.7)
>7000 363(100.0)
14(5.1)
349(96.1)
216(61.9)
147(42.1)
203(58.2)
53(15.2)
99(28.4)
Total 3148(100.0)
274(8.7)
2874(91.3)
1567(54.5)
922(32.1)
1522(53.0)
360(12.5)
851(29.6)

A - 11
ANNEX II
Table II-3: Women’s knowledge about possible sources of ANC in UFHP areas by type of providers
Know an ANCprovider
Reported ANC providers in the areaTOTAL
“No” “Yes”Public Private UFHP Other NGO
Urban Categories (percent of women mentioning a source inparentheses)
A 980(100.0)
70(7.1)
910(92.9)
562(61.8)
235(25.8)
562(61.80)
7(0.8)
B 887(100.0)
54(6.1)
833(93.9)
689(82.7)
222(26.7)
320(38.4)
3(0.4)
C 1281(100.0)
134(10.5)
1147(89.5)
1044(91.0)
349(30.4)
331(28.9)
2(0.2)
Total (allcategories)
3148(100.0)
258(8.2)
2890(91.8)
2295(79.4)
806(27.9)
1213(42.0)
12(0.4)
HH Expenditure Level (taka per month)
<=3000 1565(100.0)
257(10.0)
1408(90.0)
1083(76.9)
382(27.1)
661(46.90
8(0.6)
3001-5000 879(100.0)
67(7.6)
812(92.4)
630(77.6)
209(25.7)
371(45.7)
4(0.5)
5001-7000 341(100.0)
22(6.5)
319(93.5)
279(87.5)
96(30.1)
93(29.2)
-
>7000 363(100.0)
12(3.3)
351(96.7)
303(86.3)
119(33.9)
88(25.1)
-
Total 3148(100.0)
258(8.2)
2890(91.8)
2295(79.4)
806(27.9)
1213(42.0)
12(0.4)

A - 12
ANNEX II
Table II - 4: Women’s knowledge about ANC providers who do not charge anymoney in UFHP areas
Know an provider which isfree?Urban
Categories“Yes” “No”
“Don’tknow”
TOTAL
A 126(12.9)
582(59.4)
272(27.8)
980(100.0)
B 241(27.2)
394(44.4)
252(28.4)
887(100.0)
C 591(46.1)
324(25.3)
366(28.6)
1281(100.0)
Total (allcategories)
958(30.4)
1300(41.3)
890(28.3)
3148(100.0)
Table II - 5: Women’s knowledge about ANC providers charging money in UFHPareas and by socio-economic group
Know a provider and the provider name
Only UFHP Both Only others“No” “Don’t
know”TOTAL (N)
Urban Categories
A 181(22.02)
278(33.82)
363(44.16)
27(2.8)
131(13.4)
980(100.0)
B 148(20.93)
133(18.81)
426(60.25)
25(2.8)
155(17.5)
887(100.0)
C 289(33.64)
167(19.44)
403(46.92)
71(5.5)
351(27.4)
1281(100.0)
Total (allcategories)
618(25.88)
578(24.20)
1192(49.92)
123(3.9)
637(20.2)
3148(100.0)
HH Expenditure Level (taka per month)
<=3000 337(29.98)
276(24.56)
511(45.46)
76(4.9)
365(23.3)
1565(100.0)
3001-5000 163(24.29)
177(26.38)
331(49.33)
30(3.4)
178(20.3)
879(100.0)
5001-7000 52(18.64)
65(23.30)
162(58.06)
9(2.6)
53(15.5)
341(100.0)
>7000 66(21.02)
60(19.11)
182(59.87)
8(2.2)
41(11.3)
363(100.0)
Total 618(25.88)
578(24.20)
1192(49.92)
123(3.9)
637(20.2)
3148(100.0)

A - 13
ANNEX II
Table II - 6: Women’s knowledge about the service charges for ANC services in UFHP areas
UFHP priceAverage ofmaximum fee
mentioned
Average ofminimum fee
mentioned
Average ofUFHP price
High Low Ok Total
Urban Category N Avg. N Avg N Avg N % N % N % N %
A 691 38.49 691 24.71 378 15.92 66 17.5 65 17.2 247 65.3 378 100
B 654 51.77 654 33.19 233 16.34 52 22.3 39 16.7 142 60.9 233 100
C 738 51.58 740 31.95 399 10.92 60 15.0 74 18.5 265 66.4 399 100
Total 2083 47.30 2085 29.94 1010 14.04 178 17.6 178 17.6 654 64.8 1010 100
Socio-economicgroup
N Avg. N Avg N Avg N % N % N % N %
Less than 3000 979 30.41 980 20.26 526 12.44 109 20.7 83 15.8 334 63.5 526 100
3001-5000 587 46.73 588 29.78 287 14.89 47 16.4 46 16.0 194 67.6 287 100
5001-7000 253 68.89 253 42.60 96 17.18 13 13.5 19 19.8 64 66.7 96 100
Above 7000 264 90.50 264 54.08 101 16.98 9 8.9 30 29.7 62 61.4 101 100
Total 2083 47.30 2085 29.94 1010 14.04 178 17.6 178 17.6 654 64.8 1010 100

A - 14
ANNEX IITable II - 7: Visit for ANC by different categories
Women delivered in last one year Women currently pregnantUrbanCategories
No. Percentageseeking ANC
No. Percentageseeking ANC
A 267 61.0 161 51.6B 289 69.6 154 55.2C 389 58.9 281 46.6
Total 945 62.8 596 50.2
Table II - 8: Source of ANC for respondents (delivered in last one year) in UFHP areas*
UrbanCategories
Public SectorN %**
Private SectorN %
UFHPN %
Other NGON %
A (N=83) 49 30.2 26 16.0 51 31.5 35 21.6B(N=85) 71 35.5 70 35.0 34 17.0 24 12.0
C(N=131) 83 36.4 65 28.5 70 30.7 9 3.9Total(N=299) 203 34.4 161 27.3 155 26.3 68 11.5* The residual category of providers “others” has been excluded from the table** Row percent; percent values do not add up to 100 due to “others”
Table II - 9: Source of ANC for respondents (currently pregnant) in UFHP areas
UrbanCategories
Public Sector Private Sector UFHP Other NGO
A(N=162) 15 18.1 13 15.7 32 38.6 22 26.5B(N=200) 23 27.1 26 30.6 25 29.4 11 12.9C(N=228) 47 35.9 33 25.2 48 36.6 3 2.3
Total(N=590) 85 28.4 72 24.1 105 35.1 36 12.0

A - 15
ANNEX IITable II-10: Reasons for selecting the providers used for ANC services
Reasons Public Sector N %
PrivateN %
UFHP N %
Other NGON %
Near the house 77 14.1 54 12.0 170 32.4 36 17.4
Free service/FreeDrugs
162 29.6 20 4.4 50 9.5 22 10.6
Convenient Time 91 16.6 85 18.8 69 13.2 39 18.8
Drugs Available - - 1 .2 3 .6 - -
Less Waiting time 2 .4 3 .7 11 2.1 - -
Clean Facility 4 .7 8 1.8 21 4.0 9 4.3
Qualified provider 94 17.2 170 37.7 52 9.9 34 16.4
Female provider 22 4.0 44 9.8 59 11.3 11 5.3
Well behavedprovider
18 3.3 31 6.9 29 5.5 10 4.8
Others 77 14.1 35 7.8 60 11.5 46 22.2
Total 547 100.0 451 100.0 524 100.0 207 100.0
Number using theprovider
288 233 260 104
Number of reasons/Respondent
1.90 1.94 2.02 1.99

A - 16
ANNEX II
Table II-11: Expenditure on ANC services by different socio-economics groups and by source
Expenditure on ANC services (in Taka) AverageExpenditure (Taka)
No exp
N %
1-25
N %
26-50
N %
50+
N %
WithZero
WithoutZero
HH Expenditure level (taka per month)
Less than 3000
3001-5000
5001-7000
Above 7000
Total
125 33.0
45 18.1
19 15.8
20 15.2
209 23.8
197 52.0
123 49.4
35 29.2
23 17.4
378 43.0
34 9.0
35 14.1
29 24.2
19 14.4
117 13.3
23 6.1
46 18.5
37 30.8
70 53.0
176 20.0
18.6
42.9
59.4
93.9
42.3
27.8
52.3
70.6
110.6
55.5Source of services
Public
Private
UFHP
Other NGO
Others
Total
161 56.7
26 11.3
14 5.4
6 5.8
2 50.0
209 23.7
68 23.9
21 9.1
215 83.0
73 70.2
2 50.0
379 43.0
40 14.1
39 17.0
22 8.5
16 15.4
- -
117 13.3
15 5.3
144 62.6
8 3.1
9 8.7
- -
176 20.0
17.0
110.3
16.0
27.8
3.8
42.3
39.4
124.3
17.0
29.5
7.6
55.5
* All percentages are row percent values

A - 17
ANNEX II
Table II-12: Expenditure on ANC services by different socio-economics groups and by source (NGO category A)
Expenditure on ANC services (in Taka) AverageExpenditure (Taka)
No exp
N %
1-25
N %
26-50
N %
50+
N %
WithZero
WithoutZero
HH Expenditure level (taka per month)
Less than 3000
3001-5000
5001-7000
Above 7000
Total
18 18.4
9 11.3
2 6.7
3 8.8
32 13.2
61 62.2
42 52.5
11 36.7
7 20.6
121 50.0
12 12.2
17 21.3
11 36.7
12 35.3
52 21.5
7 7.1
12 15.0
6 20.0
12 35.3
37 15.3
22.3
43.6
59.1
80.0
42.0
27.4
49.1
63.3
87.8
48.4Source of services
Public
Private
UFHP
Other NGO
Others
Total
12 19.7
9 23.1
6 7.2
3 5.3
2 100.0
32 13.2
17 27.9
1 2.6
67 80.7
36 63.2
-
121 50.0
26 42.6
4 10.3
10 12.0
12 21.1
-
52 21.5
6 9.8
25 64.1
-
6 10.5
-
37 15.3
34.2
127.8
14.8
32.7
0.0
42.0
42.6
166.2
16.0
34.5
-
48.4
* All percentages are row percent values

A - 18
ANNEX II
Table II-13: Expenditure on ANC services by different socio-economics groups and by source (NGO category B)
Expenditure on ANC services (in Taka) AverageExpenditure (Taka)
No exp
N %
1-25
N %
26-50
N %
50+
N %
WithZero
WithoutZero
HH Expenditure level (taka per month)
Less than 3000
3001-5000
5001-7000
Above 7000
Total
28 24.8
13 14.6
9 22.5
4 9.8
54 19.1
66 58.4
49 55.1
7 17.5
11 26.8
133 47.0
9 8.0
4 4.5
6 15.0
2 4.9
21 7.4
10 8.8
23 25.8
18 45.0
24 58.5
75 26.5
23.0
43.4
60.4
85.6
43.7
30.5
50.8
78.0
94.9
54.1Source of services
Public
Private
UFHP
Other NGO
Others
Total
44 47.3
5 5.2
4 6.8
1 2.9
-
54 19.0
41 44.1
15 15.6
48 81.4
29 82.9
1 100.0
134 47.2
5 5.4
9 9.4
4 6.8
3 8.6
-
21 7.4
3 3.2
67 69.8
3 5.1
2 5.7
-
75 26.4
10.7
98.6
20.0
21.1
10.0
43.6
20.2
104.1
21.4
21.8
10.0
53.9
* All percentages are row percent values

A - 19
ANNEX II
Table II-14: Expenditure on ANC services by different socio-economics groups and by source (NGO category C)
Expenditure on ANC services (in Taka) AverageExpenditure (Taka)
No exp
N %
1-25
N %
26-50
N %
50+
N %
WithZero
WithoutZero
HH Expenditure level (taka per month)
Less than 3000
3001-5000
5001-7000
Above 7000
Total
79 47.0
23 28.8
8 16.0
13 22.8
123 34.6
70 41.7
32 40.0
17 34.0
5 8.8
124 34.9
13 7.7
14 17.5
12 24.0
5 8.8
44 12.4
75 26.5
6 3.6
11 13.8
13 26.0
34 59.6
13.6
41.6
58.8
108.1
41.4
25.6
58.4
70.0
140.0
63.4Source of services
Public
Private
UFHP
Other NGO
Others
Total
105 80.8
12 12.6
4 3.4
2 16.7
-
123 34.6
10 7.7
5 5.3
100 85.5
8 66.7
1 100.0
124 34.9
9 6.9
26 27.4
8 6.8
1 8.3
-
44 12.4
6 4.6
52 54.7
5 4.3
1 8.3
-
64 18.0
13.6
114.8
14.9
23.8
5.0
41.4
70.6
131.4
15.4
28.5
5.0
63.4
* All percentages are row percent value
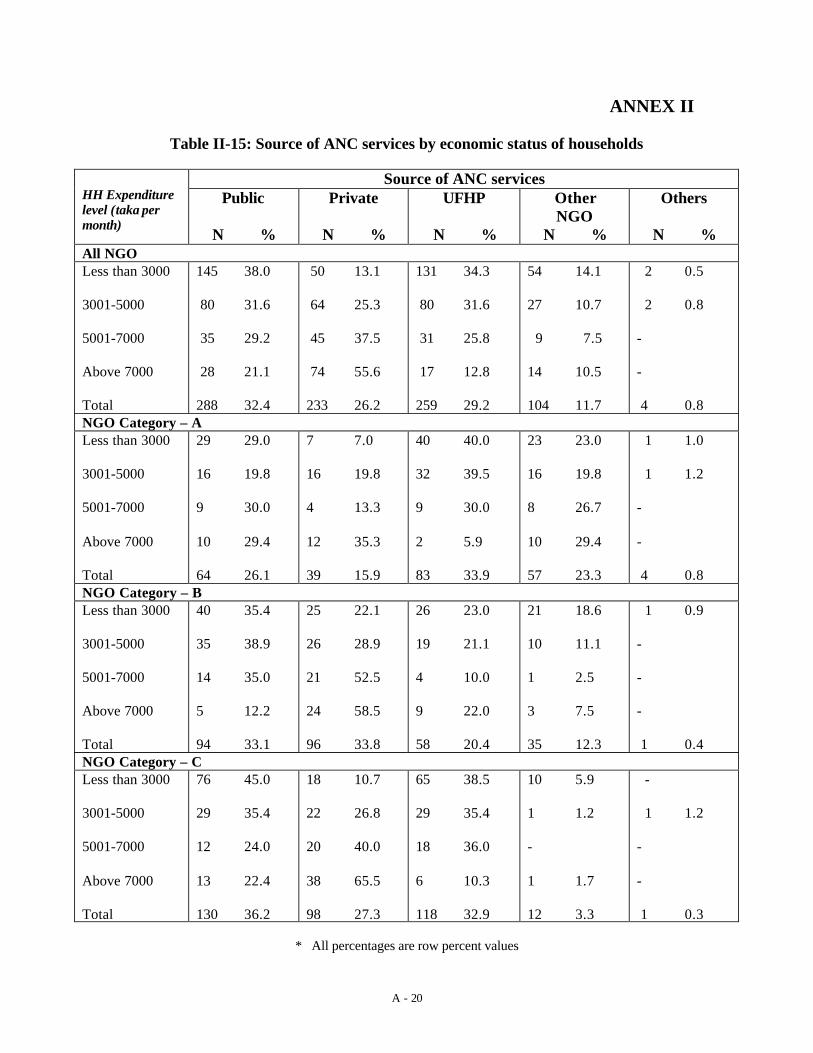
A - 20
ANNEX II
Table II-15: Source of ANC services by economic status of households
Source of ANC servicesHH Expenditurelevel (taka permonth)
Public
N %
Private
N %
UFHP
N %
OtherNGO
N %
Others
N %All NGOLess than 3000
3001-5000
5001-7000
Above 7000
Total
145 38.0
80 31.6
35 29.2
28 21.1
288 32.4
50 13.1
64 25.3
45 37.5
74 55.6
233 26.2
131 34.3
80 31.6
31 25.8
17 12.8
259 29.2
54 14.1
27 10.7
9 7.5
14 10.5
104 11.7
2 0.5
2 0.8
-
-
4 0.8NGO Category – ALess than 3000
3001-5000
5001-7000
Above 7000
Total
29 29.0
16 19.8
9 30.0
10 29.4
64 26.1
7 7.0
16 19.8
4 13.3
12 35.3
39 15.9
40 40.0
32 39.5
9 30.0
2 5.9
83 33.9
23 23.0
16 19.8
8 26.7
10 29.4
57 23.3
1 1.0
1 1.2
-
-
4 0.8NGO Category – BLess than 3000
3001-5000
5001-7000
Above 7000
Total
40 35.4
35 38.9
14 35.0
5 12.2
94 33.1
25 22.1
26 28.9
21 52.5
24 58.5
96 33.8
26 23.0
19 21.1
4 10.0
9 22.0
58 20.4
21 18.6
10 11.1
1 2.5
3 7.5
35 12.3
1 0.9
-
-
-
1 0.4NGO Category – CLess than 3000
3001-5000
5001-7000
Above 7000
Total
76 45.0
29 35.4
12 24.0
13 22.4
130 36.2
18 10.7
22 26.8
20 40.0
38 65.5
98 27.3
65 38.5
29 35.4
18 36.0
6 10.3
118 32.9
10 5.9
1 1.2
-
1 1.7
12 3.3
-
1 1.2
-
-
1 0.3
* All percentages are row percent values

A - 21
ANNEX II
Table II-16: Comments on the level of payment made for ANC services bydifferent socio-economic groups and by source
It was highN %
It was alrightN %
It was lowN %
Don’t KnowN %
Average
HH Expenditure level (taka per month)
Less than 3000
3001-5000
5001-7000
Above 7000
Total
60 23.4
36 17.5
27 26.7
18 15.9
141 20.9
163 63.7
142 68.9
61 60.4
80 70.8
446 66.0
30 11.7
26 12.6
13 12.9
13 11.5
82 12.1
3 1.2
2 1.0
- -
2 1.8
7 1.0
18.3
42.9
59.4
93.9
42.34Source of services
Public
Private
UFHP
Other NGO
Others
Total
20 16.0
56 27.1
45 18.4
20 20.4
- -
141 20.8
77 61.6
128 61.8
175 71.4
66 67.3
1 50.0
447 66.0
26 20.8
18 8.7
25 10.2
12 12.2
1 50.0
82 12.1
2 1.6
5 2.4
- -
- -
- -
7 1.0
17.05
110.28
16.04
27.79
3.75
42.30

A - 22
ANNEX II
Table II-17: Median willingness to pay for ANC by different socio-economicgroups and NGO category
Those who paid for theservice
Those who did not pay
Median (Taka) Median (Taka)Pub Pvt NGO Pub Pvt NGOHH Expenditure Level (taka per month)
Less than 3000
3001-5000
5001-7000
Above 7000
Total
24.0
29.0
50.0
50.0
35.0
55.0
105.0
105.0
170.0
150.0
20.0
27.0
50.0
42.5
27.0
5.0
10.0
10.0
20.0
10.0
10.0
10.0
30.0
35.0
20.0
10.0
7.5
-
-
10.0Urban Categories
A
B
C
Total
43.0
20.0
70.0
35.0
170.0
140.0
120.0
150.0
30.0
10.0
10.0
27.0
5.0
10.0
5.0
10.0
10.0
15.0
30.0
20.0
10.0
-
-
10.0

A - 23
ANNEX II
Table II-18: Mode willingness to pay for ANC by different socio-economicgroups and NGO category
Those who paid for theservice
Those who did not pay
Mode (Taka) Mode (Taka)Pub Pvt NGO Pub Pvt NGOHH Expenditure Level (taka per month)
Less than 3000
3001-5000
5001-7000
Above 7000
Total
10.0
20.0
100.0
50.0
10.0
30.0
150.0
100.0
150.0
150.0
10.0
10.0
50.0
10.0
10.0
5.0
5.0
5.0
10.0
5.0
10.0
10.0
25.0
20.0
10.0
10.0
5.0
-
-
10.0Urban Categories
A
B
C
Total
50.0
20.0
70.0
10.0
105.0
150.0
150.0
150.0
27.0
10.0
10.0
10.0
5.0
5.0
5.0
5.0
10.0
10.0
20.0
10.0
10.0
10.0
50.0
10.0

A - 23
ANNEX III
Table III-1: Knowledge about the need for childhood immunization
Need immunization ?HH Expenditure Level(taka per month) Yes
N %No
N %
Total
N %<=3000 1532 97.9 33 2.1 1565 100.0
3001-5000 868 98.7 11 1.3 879 100.0
5001-7000 334 97.9 7 2.1 341 100.0
>7000 349 96.1 14 3.9 363 100.0
Total 3083 97.9 65 2.1 3148 100.0

A - 24
ANNEX III
Table III-2: Women’s knowledge about the source of immunization in UFHP areas and by socio-economic groups and sourceof service
Know the service ? If know the service, specify the sourceTOTAL
“No” “Yes” Public Private UFHP Other NGO Other
Urban Categories
A 980(100.0)
33(3.4)
947(96.6)
497(52.9)
19(2.0)
608(64.2)
360(38.0)
2(0.2)
B 887(100.0)
24(2.7)
863(97.3)
626(72.5)
135(15.6)
350(40.6)
217(25.1)
1(0.1)
C 1281(100.0)
19(1.5)
1262(98.5)
985(78.1)
8(0.6)
620(49.1)
129(10.2)
-
Total (allcategories)
3148(100.0)
76(2.4)
3072(97.6)
2108(68.6)
162(5.3)
1578(51.4)
706(23.0)
3(0.1)
Socio-economic group
<=3000 1565(100.0)
42(2.7)
1523(97.3)
1064(69.9)
76(5.0)
741(48.7)
374(24.6)
3(0.2)
3001-5000 879(100.0)
23(2.6)
856(97.4)
583(68.1)
44(5.1)
444(51.9)
212(24.8)
-
5001-7000 341(100.0)
5(1.5)
336(98.5)
227(67.6)
21(6.3)
187(55.7)
58(17.3)
-
>7000 363(100.0)
6(1.7)
357(98.3)
234(65.5)
21(5.9)
206(57.7)
62(17.4)
-
Total 3148(100.0)
76(2.4)
3072(97.6)
2108(68.6)
162(5.3)
1578(51.4)
706(23.0)
3(0.1)

A - 25
ANNEX III
Table III-3: Women’s knowledge about the benefits of immunization by UFHP urban categories
Know about the benefits : The benefits areCategories Prevent
disease Othersbenefits
Total
Don’t knowthe benefits TOTAL (N)
A 835(85.6)
155(15.9)
976(99.6)
4(.4)
980(100.0)
B 714(81.5)
195(22.3)
876(98.8)
11(1.2)
887(100.0)
C 1026(81.4)
249(19.8)
1260(98.4)
21(1.6)
1281(100.0)
Total (allcategories)
2575(73.1)
599(19.2)
3112(98.9)
36(1.1)
3148(100.0)
Table III-4: Distribution of Immunization events by date of last visit and urban categories
When lastImmunized
Total number Percentage Total MeanAge
A B C A B C00 months ago 61 75 61 22.8 25.3 15.6 197 5.13
01 months ago 46 61 52 17.2 20.6 13.3 159 6.87
02 months ago 28 30 32 10.5 10.1 8.2 90 7.26
3-4 months ago 37 41 66 13.9 13.9 16.8 144 8.20
5+ months ago 11 20 37 4.1 6.8 9.4 68 9.45
Not Immunized 84 69 144 31.5 23.3 36.7 297 3.21
Total 267 296 392 100 100 100 955 5.81

A - 26
ANNEX III
Table III-5: Reasons for Selecting providers for Immunization by different service providers
Reasons Public SectorN %
PrivateN %
UFHPN %
Other NGON %
OthersN %
Near to the house 129 35.7 6 16.7 115 51.8 35 27.8 1 33.3
Free service/FreeDrugs
125 34.6 6 16.7 39 17.6 27 21.4 1 33.3
Convenient Time 71 19.7 13 36.1 27 12.2 30 23.8 - -
Drugs Available 1 .3 2 5.6 8 3.6 9 7.1 - -
Less Waiting time 6 1.7 2 5.6 7 3.2 6 4.8 - -
Clean Facility 2 .6 2 .9 3 2.4 - -
Qualified provider 13 3.6 3 8.3 7 3.2 13 10.3 - -
Female provider - - - - - - - - - -
Well behavedprovider
1 .3 3 8.3 9 4.1 1 .8 - -
Others 13 3.6 1 2.8 8 3.6 2 1.3 1 33.3
Total 361 100 36 100 222 100 126 100 3 100

A - 27
ANNEX III
Table III-6: Expenditure on Immunization Services by different socio-economic groupsand by source
Expenditure in Taka for the last immunisation visit Average TakaNo exp 1-10 11-25 26-50 With
ZeroWithout
ZeroHH Expenditure levelLess than 3000
3001-5000
5001-7000
Above 7000
Total
103 55.1
54 38.8
29 54.7
33 50.8
219 49.3
73 39.0
72 51.8
23 43.4
27 41.5
195 43.9
9 4.8
13 9.4
1 1.9
4 6.2
27 6.1
2 1.1
-
-
1 1.5
3 .7
3.4
4.5
2.5
3.9
3.7
7.6
7.4
5.6
8.1
7.3NGO categoryA
B
C
Total
30 22.2
77 46.4
113 78.5
220 49.4
78 57.8
87 52.4
30 20.8
195 43.8
25 18.5
2 1.2
-
27 6.1
2 1.5
-
1 .7
3 .7
7.0
3.1
1.3
3.7
8.9
5.8
6.3
7.3Source of services
Public
Private
UFHP
Oth NGO
Others
Total
157 73.4
2 10.0
52 36.9
8 11.8
1 50.0
220 49.4
55 25.7
16 80.0
79 56.0
44 64.7
1 50.0
195 43.8
2 .9
2 10.0
9 6.4
14 20.6
-
27 6.1
-
-
1 .7
2 2.9
-
3 .7
1.4
6.5
5.0
7.5
2.5
3.7
5.3
7.2
7.9
8.5
5.0
7.3

A - 28
ANNEX III
Table III-7: Comments on the level of payment made for Immunization services by socio-economic groups and by source
(For those who paid a fee)
It was high It wasalright
It was low
HH Expenditure level
Less than 3000
3001-5000
5001-7000
Above 7000
Total
17 20.2
15 17.6
5 20.8
2 6.5
39 17.4
59 70.2
63 74.1
13 54.2
21 67.7
155 69.2
8 9.5
7 8.2
6 25.0
8 25.8
29 12.9Source of Services
Public
Private
UFHP
Oth NGO
Others
Total
7 12.3
1 5.6
17 19.3
14 23.3
-
39 17.4
46 80.7
15 83.3
55 62.5
39 65.0
-
155 69.2
4 7.0
2 11.1
16 18.2
6 10.0
-
29 12.9
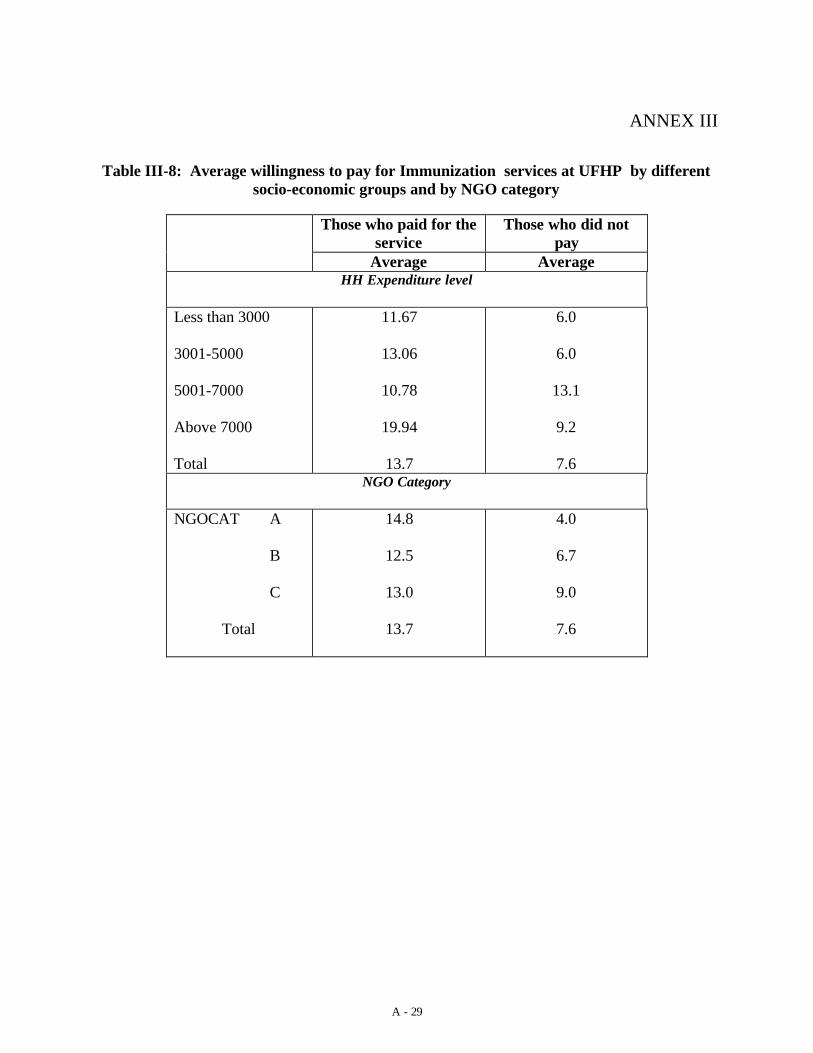
A - 29
ANNEX III
Table III-8: Average willingness to pay for Immunization services at UFHP by differentsocio-economic groups and by NGO category
Those who paid for theservice
Those who did notpay
Average AverageHH Expenditure level
Less than 3000
3001-5000
5001-7000
Above 7000
Total
11.67
13.06
10.78
19.94
13.7
6.0
6.0
13.1
9.2
7.6NGO Category
NGOCAT A
B
C
Total
14.8
12.5
13.0
13.7
4.0
6.7
9.0
7.6

A -30
ANNEX IV Table IV-1: Women’s knowledge about ARI in UFHP areas
Categories Total women(N)
No. of women who could identify theacute case of ARI and need of health
care
% of women who could identify the acutecase of ARI and need for health care
A 980 547 55.8
B 887 376 42.4
C 1281 591 46.1
Total (allcategories)
3148 1514 48.1

A -31
ANNEX IV
Table IV-2: Women’s knowledge about the source of treatment for ARI in UFHP areas and by socio-economic group
Know source of care Where can one get care for ARI ?TOTAL “No” “Yes” Public Private UFHP Other NGO Other
Urban Categories
A 980(100.0)
70(7.1)
910(92.9)
496(54.5)
575(63.2)
178(19.6)
150(16.5)
2(0.2)
B 887(100.0)
33(3.7)
854(96.3)
270(31.6)
744(87.1)
81(9.5)
12(1.4)
-
C 1281(100.0)
29(2.3)
1252(97.7)
650(51.9)
976(78.0)
171(13.7)
46(3.7)
1(0.1)
Total (allcategories)
3148(100.0)
132(4.2)
3016(95.8)
1416(46.9)
2295(76.1)
430(14.3)
208(6.9)
3(0.1)
Socio-economic group
<=3000 1565(100.0)
75(4.8)
1490(95.2)
729(48.9)
1120(75.2)
205(13.8)
115(7.7)
1(0.1)
3001-5000 879(100.0)
35(4.0)
844(96.0)
389(46.1)
635(75.2)
121(14.3)
63(7.5)
1(0.1)
5001-7000 341(100.0)
14(4.1)
327(95.9)
146(44.6)
260(79.5)
42(12.8)
11(3.4)
1(0.3)
>7000 363(100.0)
8(2.2)
355(97.8)
152(42.8)
280(79.5)
62(17.5)
19(5.4)
-
Total 3148(100.0)
132(4.2)
3016(95.8)
1416(46.9)
2295(76.1)
430(14.3)
208(6.9)
3(0.1)

A -32
ANNEX IV
Table IV-3: knowledge about ARI related Service Providers who provide ServiceFree of Cost by Urban Categories and Household Socio-economic Status
Know a free service provider ?
“Yes” “No” “Don’t know”
TOTAL
Urban Categories
A 94(10.3)
610(67.0)
206(22.6)
910(100.0)
B 80(9.4)
590(69.1)
184(21.5)
854(100.0)
C 466(37.2)
465(37.1)
321(25.6)
1252(100.0)
Total (allcategories)
640(21.2)
1665(55.2)
711(23.6)
3016(100.0)
Socio-economic group
<=3000 363(24.4)
777(52.1)
350(23.5)
1490(100.0)
3001-5000 154(18.2)
496(58.8)
194(23.0)
844(100.0)
5001-7000 59(18.0)
181(55.4)
87(26.6)
327(100.0)
>7000 64(18.0)
211(59.4)
80(22.5)
355(100.0)
Total 640(21.2)
1665(55.2)
711(23.6)
3016(100.0)s

A -33
ANNEX IV
Table IV-4: knowledge about ARI treatment providers charging money in UFHP areas by socio-economic group
Know a provider charging money by service
UFHP Others Total “Yes” No
TOTAL (N)
Urban Categories
A 176(21.2)
783(94.1)
832(91.4)
78(8.6)
910(100.0)
B 78(9.5)
791(96.6)
819(95.9)
35(4.1)
854(100.0)
C 186(17.5)
955(89.9)
1062(84.8)
190(15.2)
1252(100.0)
Total (allcategories)
440(16.2)
2529(93.2)
2713(90.0)
303(10.0)
3016(100.0)
Socio-economic group
<=3000 207(15.6)
1233(92.9)
1327(89.1)
163(10.9)
1490(100.0)
3001-5000 127(16.4)
726(93.6)
776(91.9)
68(8.1)
844(100.0)
5001-7000 41(14.2)
278(96.2)
289(88.4)
38(11.6)
327(100.0)
>7000 65(20.2)
292(91.0)
321(90.4)
34(9.6)
355(100.0)
Total 440(16.2)
2529(93.2)
2713(90.0)
303(10.0)
3016(100.0)

A -34
ANNEX IV
Table IV-5: Women’s knowledge about service charges for ARI treatment inUFHP areas by socio-economic groups
UFHP priceAverage ofmaximum fee
mentioned
Average ofminimum fee
mentioned
Average ofthe UFHP
price High Low Ok Total
Category N Avg N Avg N Avg N % N % N % N %
A 704 69.80 704 40.32 146 17.58 31 21.2 14 9.6 101 69.2 146 100
B 772 58.66 772 35.16 67 19.07 15 22.4 11 16.4 41 61.2 67 100
C 918 66.04 918 45.51 155 9.53 18 11.6 25 16.1 112 72.3 155 100
Total 2387 64.76 2394 40.64 368 14.46 64 17.4 50 13.6 254 69.0 368 100
Socio- economicgroup
N Avg N Avg N Avg N % N % N % N %
Less than 3000 1162 49.52 1167 31.48 182 13.23 37 20.3 21 11.5 124 68.1 182 100
3001-5000 684 67.98 685 41.84 108 14.99 18 16.7 13 12.0 77 71.3 108 100
5001-7000 253 85.61 254 54.20 27 18.19 3 11.1 1 3.7 23 85.2 27 100
Above 7000 288 100.29 288 62.98 51 15.75 6 11.8 15 29.4 30 58.8 51 100
Total 2387 64.76 2394 40.64 368 14.46 64 17.4 50 13.6 254 69.0 366 100

A -35
ANNEX IV
Table IV-6: knowledge about the source of treatment for diarrhoea in UFHP areas by socio-economic groups
Breakdown of “Yes”TOTAL “No” “Yes” Public Private UFHP Other NGO Other
Categories
A 980(100.0)
43(4.4)
937(95.6)
446(47.6)
501(53.5)
84(9.0)
295(31.5)
1(0.1)
B 887(100.0)
21(2.4)
866(97.6)
416(48.0)
631(72.9)
41(4.7)
133(15.4)
-
C 1281(100.0)
19(1.5)
1262(98.5)
960(76.1)
702(55.6)
64(5.1)
11(0.9)
1(0.1)
Total (allcategories)
3148(100.0)
83(2.6)
3065(97.4)
1822(59.5)
1834(59.8)
189(6.2)
439(14.3)
2(0.1)
Socio-economic group
<=3000 1565(100.0)
46(2.9)
1519(97.1)
943(62.1)
877(57.7)
75(4.9)
203(13.4)
-
3001-5000 879(100.0)
23(2.6)
856(97.4)
500(58.4)
506(59.1)
46(5.4)
138(16.1)
2(0.2)
5001-7000 341(100.0)
10(2.9)
331(97.1)
190(57.4)
219(66.2)
27(8.2)
34(10.30
-
>7000 363(100.0)
4(1.1)
359(98.9)
189(52.7)
232(64.6)
41(11.4)
64(17.8)
-
Total 3148(100.0)
83(2.6)
3065(97.4)
1822(59.5)
1834(59.8)
189(6.2)
439(14.3)
2(0.1)

A -36

A -37
ANNEX IV
Table IV-7: Women’s knowledge about providers who provide treatment for diarrhoea free of charge in UFHP areas bysocio-economic groups
“Yes” “No” “Don’t know” TOTALCategories
A 222(22.7)
536(54.7)
222(22.7)
980(100.0)
B 258(29.1)
446(50.3)
183(20.6)
887(100.0)
C 613(47.9)
427(33.3)
241(18.8)
1281(100.0)
Total (allcategories)
1093(34.7)
1409(44.8)
646(20.5)
3148(100.0)
Socio-economic group
<=3000 596(38.1)
665(42.5)
304(19.4)
1565(100.0)
3001-5000 282(32.1)
420(47.8)
177(20.1)
879(100.0)
5001-7000 98(28.7)
164(48.1)
79(23.2)
341(100.0)
>7000 117(32.2)
160(44.1)
86(23.7)
363(100.0)

A -38
Total 1093(34.7)
1409(44.8)
646(20.5)
3148(100.0)

A -39
ANNEX IV
Table IV-8: Women’s knowledge about the treatment providers for diarrhoea charging money in UFHP areas and by socio-economic group
“Yes”UFHP Others Total “Yes”
“No” “Don’tknow”
TOTAL (N)
Categories
A 83(10.7)
754(97.2)
776(79.2)
106(10.8)
98(10.0)
980(100.0)
B 38(4.8)
774(97.5)
794(89.5)
19(2.1)
74(8.3)
887(100.0)
C 88(10.1)
823(94.1)
875(68.3)
158(12.3)
248(19.4)
1281(100.0)
Total (allcategories)
209(8.5)
2351(96.2)
2445(77.7)
283(9.0)
420(13.3)
3148(100.0)
Socio economic group
<=3000 88(7.6)
1111(96.40)
1153(73.7)
172(11.0)
240(15.3)
1565(100.0)
3001-5000 53(7.5)
681(96.3)
707(80.4)
68(7.7)
104(11.8)
879(100.0)
5001-7000 30(10.6)
270(95.4)
283(83.0)
19(5.6)
39(11.4)
341(100.0)
>7000 38(12.6)
289(95.7)
302(83.2)
24(6.6)
37(10.2)
363(100.0)
Total 209(8.5)
2351(96.2)
2445(77.7)
283(9.0)
420(13.3)
3148(100.0)

A -40
ANNEX IV
Table IV-9: Source of care for illness by different categories of UFHP areas
UFHP areaSource of ServicesA B C Total
Public 44 12.1 40 13.4 52 11.3 136 12.1
Private 294 80.8 248 83.2 392 84.8 934 83.1
UFHP 13 3.6 10 3.4 10 2.2 33 2.9
NGO 13 3.6 - 2 .4 15 1.3
Others - - 6 1.3 6 .5
Sub-Total 364 55.4 298 50.0 462 46.0 1124 49.8
Wait & See andHome care
293 44.6 298 50.0 542 54.0 1133 50.2
Grand Total 657 100.0 596 100.0 1004 100.0 2257 100.0
Table IV-10: Average Expenditure per illness episode by Source of services by differentcategories of UFHP areas
UFHP areaSource of ServicesA B C
Public 164.5 26.8 87.61
Private 87.2 85.5 64.81
UFHP 22.7 15.8 31.5
NGO 86.2 - 5.0
Others - - 1.3
Total 93.9 75.2 65.74

A-39
ANNEX V
Table V-1: Women’s knowledge about the source for getting family planning methods in UFHP areas by Socio-economicgroup
Know source of service Where can one get care for Family planning ?TOTAL
No Yes
Notapplicable Public Private UFHP Other NGO
Urban Categories
A 980(100.0)
20(2.0)
953(97.2)
7(0.7)
380(39.9)
620(65.0)
526(55.2)
231(24.2)
B 887(100.0)
13(1.5)
856(96.5)
18(2.0)
498(58.2)
641(74.9)
354(41.4)
147(17.2)
C 1281(100.0)
15(1.2)
1230(96.0)
36(2.8)
930(75.6)
770(62.6)
527(42.8)
113(9.2)
Total (allcategories)
3148(100.0)
48(1.5)
3039(96.5)
61(1.9)
1808(59.5)
2031(66.8)
1407(46.3)
491(16.2)
Socio-economic group
<=3000 1565(100.0)
24(1.5)
1506(96.2)
35(2.2)
935(62.1)
955(63.4)
710(47.1)
260(17.3)
3001-5000 879(100.0)
16(1.8)
849(96.6)
14(1.6)
486(57.2)
574(67.6)
400(47.1)
166(19.6)
5001-7000 341(100.0)
7(2.1)
326(95.6)
8(2.3)
192(58.9)
242(74.2)
139(42.6)
30(9.2)
>7000 363(100.0)
1(0.3)
358(98.6)
4(1.1)
195(54.5)
260(72.6)
158(44.1)
35(9.8)
Total 3148(100.0)
48(1.5)
3039(96.5)
61(1.9)
1808(59.5)
2031(66.8)
1407(46.3)
491(16.2)

A-40
ANNEX V
Table V-2: Women’s knowledge about family planning methods related service providerswho provides service free of cost by urban categories and socio-economic group
Know a free service provider
“Yes” “No” “Don’t know”
TOTAL
Urban Categories
A 95(9.7)
603(61.5)
282(28.8)
980(100.0)
B 270(30.4)
381(43.0)
236(26.6)
887(100.0)
C 644(50.3)
328(25.6)
309(24.2)
1281(100.0)
Total (allcategories)
1009(32.1)
1312(41.7)
827(26.3)
3148(100.0)
Socio-economic group
<=3000 589(37.5)
577(36.9)
399(25.4)
1565(100.0)
3001-5000 243(27.6)
424(48.2)
212(24.1)
879(100.0)
5001-7000 83(24.3)
141(41.3)
117(34.3)
341(100.0)
>7000 94(25.9)
170(46.8)
99(27.3)
363(100.0)
Total 1009(32.1)
1312(41.7)
827(26.3)
3148(100.0)

A-41
ANNEX V
Table V-3: Source of services for selecting providers for Family Planning by differentNGO category
NGO Category PublicSector
Private UFHP Other NGO Others
A 48 11.7 187 45.6 142 34.6 21 5.1 12 2.9
B 100 22.6 169 38.1 125 28.2 20 4.5 29 6.5
C 159 35.7 144 32.3 104 23.3 9 2.0 30 6.7
Total 307 23.6 500 38.5 371 28.6 50 3.8 71 5.5

A-42
ANNEX V
Table V-4: Source of supplies by type of Family Planning method
Family PlanningMethod
Public SectorN %
PrivateN %
UFHPN %
Other NGON %
OthersN %
TOTALN %
Pill/Condom
Injection
IUD/Norplant
Sterilization
178 58.0
64 20.8
20 6.5
45 14.7
481 96.2
6 1.2
3 .3
10 2.0
161 43.4
207 55.8
3 .8
-
20 3.5
23 5.7
3 2.3
4 2.1
41 7.2
21 5.5
3 2.3
5 2.6
912 70.2
294 22.6
32 2.5
61 4.7
Total 307 23.6 500 38.5 371 28.6 50 3.8 71 5.5 1299 100.0

A-43
ANNEX V
Table V-5: Reasons for selecting providers for Family Planning
Reasons Public SectorN %
PrivateN %
UFHPN %
Other NGON %
OthersN %
TOTALN %
Near to the house 72 15.3 111 16.6 290 45.2 13 16.9 17 19.3 503 25.8
Convenient Time 111 23.6 303 45.4 149 23.2 25 32.5 31 35.2 619 31.8
Well behaved provider 16 3.4 7 1.0 42 6.5 6 7.8 1 1.1 72 3.7Provider provides lotof information
1 0.2 1 0.1 4 0.6 - - - - 6 0.3
Qualified provider 29 6.2 22 3.3 32 5.0 14 18.2 - - 97 5.0
Free service 137 29.1 - - - - 7 9.1 2 2.3 146 7.5
Services are cheap 27 5.7 3 0.4 37 5.8 4 5.2 3 3.4 74 3.8
Privacy maintained 10 2.1 72 10.8 8 1.2 - - 12 13.6 102 5.2
Less Waiting time 1 0.2 11 1.6 11 1.7 1 1.3 3 3.4 27 1.4
The provider is known 10 2.1 14 2.1 18 2.8 4 5.2 5 5.7 51 2.6Not aware of otherfacility
18 3.8 13 1.9 6 0.9 1 1.3 1 1.1 39 2.0
This provider’smethods suits me
25 5.3 109 16.3 18 2.8 2 2.6 12 13.6 166 8.5
Clean Facility 1 0.2 - - 13 2.0 - - - - 14 0.7
Others 10 2.1 2 0.3 14 2.2 - - 1 1.1 27 1.4
TOTAL 471 100.0 668 100.0 642 100.0 77 100.0 77 100.0 1946 100.0

A-44
ANNEX V
Table V-6: Expenditure on Family Planning services by different socio-economic groupsand source of services
Expenditure in Taka for the last Famili Planningservices
Average Taka
No exp 1-10 11-25 25+ WithZero
WithoutZero
HH Expenditure levelLess than 3000
3001-5000
5001-7000
Above 7000
Total
149 27.0
83 21.7
27 22.9
27 16.4
286 23.5
320 58.1
224 58.5
60 50.8
69 41.8
673 55.3
63 11.4
58 15.1
20 16.9
43 26.1
184 15.1
19 3.4
18 4.7
11 9.3
26 15.8
74 6.1
6.4
7.8
8.7
12.9
7.9
8.8
9.9
11.3
15.4
10.4NGO categoryA
B
C
Total
32 8.2
107 26.1
147 35.3
286 23.5
266 68.0
222 54.1
186 44.6
674 55.3
65 16.6
65 15.9
54 12.9
184 15.1
28 7.2
16 3.9
30 7.2
74 6.1
10.0
7.1
6.8
7.9
10.9
9.6
10.5
10.4Source of services
Public
Private
UFHP
Oth NGO
Others
Total
250 83.3
5 1.1
9 2.4
10 22.4
11 18.0
286 23.5
44 14.7
224 51.3
342 92.2
28 57.1
36 59.0
674 55.3
5 1.7
138 31.6
20 5.4
10 20.4
11 18.0
184 15.1
1 .3
70 16.0
-
-
3 4.9
74 6.1
1.1
13.6
7.0
6.6
7.9
7.9
6.5
13.7
7.1
8.5
9.7
10.4

A-45
ANNEX V
Table V-7: Comments on the level of payment made for Family planningservices by different socio-economic groups and by source of service
It was high It was alright It was low AverageFP Cost
HH Expenditure level
Less than 3000
3001-5000
5001-7000
Above 7000
Total
83 20.6
68 22.7
16 17.4
25 18.1
192 20.6
281 69.9
208 69.6
67 72.8
94 68.1
650 69.8
38 9.5
23 7.7
9 9.8
18 13.8
89 9.6
6.39
7.75
8.74
12.91
7.93Source of services
Public
Private
UFHP
NGO
Others
Total
8 16.0
96 22.2
65 17.9
5 13.5
18 36.0
192 20.6
34 68.0
305 70.6
252 69.4
29 78.4
30 60.0
650 69.7
8 16.0
31 7.2
46 12.7
3 8.1
2 4.0
90 9.7
1.09
13.59
6.97
6.59
7.95
7.93

A-46
ANNEX V
Table V-8: Willing to pay for Family Planning services more than what has been paid bydifferent socio-economic groups and by source of service and by NGO category
Will pay moreYes No
HH Expenditure level
Less than 30003001-50005001-7000Above 7000Total
185 46.4151 50.3 55 59.8 95 69.9486 52.4
214 53.6149 49.7 37 40.2 41 30.1441 47.6
Source of services
PublicPrivate
UFHPOther NGOOthers
Total
28 56.0251 58.4171 47.2 19 51.4 18 36.7
487 52.5
22 44.0179 41.6191 52.8 18 48.6 31 63.3
441 47.5Source of services
A
B
C
Total
191 53.4
157 52.3
139 51.5
487 52.5
167 46.6
143 47.7
131 48.5
441 47.5

A-47
ANNEX VI
Table VI-1: Average waiting time in minutes and travel cost and treatment costs in takaby service type in UFHP clinic
Service type Averagewaiting time
AverageTravel cost
AverageTreatment
costPill/Condom 7.20 5.10 17.20
Injection 9.73 3.10 8.17
Other FP 14.40 3.20 13.40
ANC 18.41 4.26 22.13
Maternal Health 14.40 2.90 13.20
Child Health 15.53 6.53 23.16
Child Immunization 27.66 4.37 9.90
Referrals 17.07 4.29 28.68
Others 7.17 3.17 25.83
All 16.57 4.23 17.93

A-48
ANNEX VI
Table VI-2: Will pay more than what is paid by service type in UFHP clinic
Service type Yes(%)
Yes, ifquality/ behaviour
improves( %)
No(%)
Total
Pill/Condom 60.0 - 40.0 10 6.20
Injection 71.4 3.6 25.0 28 17.4
Other FP 100.0 - - 4 2.5
ANC 62.2 5.4 32.4 37 23.0
Maternal Health 62.5 - 37.5 8 5.0
Child Health 78.9 - 21.1 19 11.8
Child Immunization 64.3 - 35.7 28 17.4
Referrals 82.6 4.3 13.0 23 14.3
Others 50.0 25.0 25.0 4 2.5
All 69.6 3.1 27.3 161 100.0

A-49
ANNEX VI
Table VI-3: Average willingness to pay in Taka by service type in UFHP clinic
Service type Averagewillingness
to payPill/Condom 25.00
Injection 15.68
Other FP 26.75
ANC 36.78
Maternal Health 30.88
Child Health 39.47
Child Immunization 22.82

A-50
ANNEX VI
“X” indicates services not provided by respective facilities.
Table V1-4: Services provided by UFHP and NGO facilities
No Services UFHPCategory
A
OtherNGO
Category
A
UFHPCategory
C
OtherNGO
Category
CFamily Planning Services01 Oral Pills02 Condoms03 IUDs X04 Injectables X05 Norplant X X X X06 Vasectomy X X X X07 Tubectomy X X08 Post-partum FP counseling X X X09 Side effects management X X XReproductive Health Services10 Antenatal care (ANC)11 Postnatal Care(PNC)12 TT immunization13 EOC X X X X14 Management of RTI/STD15 STD/RTI counseling16 Infertility diagnosis X X X17 Infertility treatment X X X18 Post- abortion counselingChild Health19 Child immunization20 ARI treatment21 ORS/ Diarrhoea
Treatment22 Breastfeeding counseling23 Vitamin-A-
supplementation24 Nutrition education

A-51

A-52
ANNEX VI
Table V1-5: Laboratory Services provided by UFHP and NGO facilities
No Services UFHPCategory
A
Other NGOCategory
A
UFHPCategory
C
Other NGOCategory
C01 Urine albumin test X02 Urine sugar test X03 Blood Hd test X04 Pregnancy test X05 Blood R/E X X06 Stool R/E X X07 Urine R/E X X08 BT, CT X X09 Platelate count X X10 Occult Blood test X X11 RA test X X X12 HBsAg X X13 VDRL X X14 ASO titre X X
Table V1-6: Registration fee for the facilities
Fee UFHPCategory
A
Other NGOCategory
A
UFHPCategory
C
Other NGOCategory
CRegistration
FeeTk. 5 Tk. 10 Tk. 5 No registration fee

A-53
ANNEX VI
Table VI-7: Staff positions at the facilities
No Staff positions UFHPCategory
A
Other NGOCategory
A
UFHPCategory
C
OtherNGO
Category
C01 Medical Officer 1
Part time 1Also
present
2 1 1
02 Nurse03 FWV 104 Paramedic 4 2 205 Senior Service Promoter 1 106 Service Promoter 3 107 Counselor 2 1 108 Clinic Assistant 109 FP Fieldworker 6 810 Health Fieldworker11 Pharmacist / Druggist12 Accountant / Office
Assistant13 Clerk/Record Keeper14 Receptionist 115 Cleaner / Sweeper16 Community Mobilizer17 Depotholder18 Aya 1 4 119 Guard 1 120 Cleaner 121 Lab. techinicians 1

A-54
ANNEX VII
Table VII-5: Satisfaction with service provided for ANC by different socio-economicgroups and by source of service and by NGO category
EXPHH Enoughinformation
Goodbehavior
Goodprovider
Cleanfacility
Less waitingtime
0000—3000
3001—5000
5001--7000
>7000
311( 82.3 )
200( 79.7 )
97(82.9 )
119( 90.2 )
373( 98.9 )
243( 97.6 )
115( 99.1 )
128( 98.5 )
367(97.6)247
( 99.2 )115
( 99.1 )130
(100.0)
343( 91.5 )
201(82.7 )
99( 85.3 )
113( 85.6 )
310( 81.6 )
211(84.1 )
109( 92.4 )
120(90.2 )
NGO category
A
B
C
156 ( 64.2 )
267 (94.7)
305 (86.2)
238 ( 98.8)
278 (98.6)
344(98.3)
236 (97.9)
281 (99.6)
343 (98.3)
200 (83.0)
266(95.3)
291 (83.9)
215 (88.1)
259 (91.2)
276 (77.7)
By provider
Public
Private
UFHP
Other NGO
Others
216(75.8)216
(94.3)210
(81.7)83
(79.8)3
(75.0)
272(96.1)227
(99.6)254
(100.0)103
(99.0)4
(100.0)
277(98.2)228
(100.0)248
(97.6)103
(99.0)4
(100.0)
238(83.2)219
(94.0)208
(86.3)89
(86.4)3
(75.0)
251(88.1)205
(88.0)202
(78.6)91
(87.5)1
(25.0)

A-55
ANNEX VII
Table VII-2: Satisfaction with service provided for Immunization by different socio-economic groups and by source of service and by NGO category
EXPHH Enoughinformation
Goodbehavior
Goodprovider
Clean facility Less waitstime
0000—3000
3001—5000
5001—7000
>7000
130(71.0)
85(61.6)
37(71.2)
46(74.2)
181(96.8)137
(98.6)51
(96.2)62
(92.5)
179(99.4)130
(99.2)52
(100.0)62
(100.0)
153(86.9)113
(83.1)41
(78.8)49
(79.0)
145(80.1)110
(80.3)44
(83.0)56
(90.3)
NGO Category
A
B
C
75(56.4)127
(77.0)96
(69.6)
132(99.2)165
(100.0)135
(98.5)
128(100.0)
165(100.0)
131(98.5)
102(77.9)152
(92.7)103
(78.0)
98(74.2)137
(84.0)121
(87.1)
By provider
Public
Private
UFHP
Other NGO
Others
135(64.3)
18(90.0)
99(71.7)
45(68.2)
1(50.0)
209(99.5)
20(100.0)
135(98.5)
66(100.0)
2(100.0)
204(99.5)
20(100.0)
133(99.3)
65(100.0)
2(100.0)
167(81.1)
18(90.0)111
(82.8)60
(90.9)1
(100.0)
183(87.6)
17(85.0)117
(84.2)37
(57.8)2
(100.0)

A-56
ANNEX VII
Table VII-3: Satisfaction with service provided for Family Planning by different socio-economic groups and by source of service and by NGO category
EXPHH Enoughinformation
Goodbehavior
Goodprovider
Clean facility Less waitstimes
0000—3000
3001—5000
5001—7000
>7000
267(74.2)173
(73.9)50
(78.1)57
(85.1)
356(98.3)233
(99.6)63
(98.4)66
(95.7)
332(97.1)217
(97.7)61
(100.0)63
(100.0)
273(90.7)162
(87.1)40
(74.1)42
(80.8)
289(86.0)171
(82.2)46
(82.1)51
(89.5)NGO Category
A
B
C
111(52.1)215
(92.3)221
(79.2)
210(99.1)233
(98.7)275
(97.9)
194(97.5)229
(100.0)250
(96.2)
148(77.1)200
(96.6)169
(87.1)
165(82.9)171
(82.6)221
(88.0)By provider
Public
Private
UFHP
Other NGO
Others
225(77.3)
16(76.2)268
(74.0)37
(75.5)1
(50.0)
288(99.0)
21(84.0)359
(98.9)49
(100.0)1
(100.0)
259(95.2)
21(100.0)
346(99.4)
46(100.0)
1(100.0)
187(87.4)
17(81.0)276
(86.8)35
(92.1)2
(100.0)
208(77.6)
16(80.0)301
(92.9)32
(72.7)-

A-57
ANNEX VII
Table VII-4: Satisfaction with service provided for Illness by different socio-economicgroups and by source of service and by NGO category
EXPHH Enoughinformation
Goodbehavior
Goodprovider
Clean facility Less waitstime
0000---3000
3001---5000
5001---7000
>7000
191(80.3)174
(77.0)71
(75.5)107
(84.3)
235(98.7)226
(99.6)92
(98.9)126
(99.2)
234(99.6)224
(99.1)91
(98.9)125
(100.0)
231(98.3)222
(99.6)91
(97.8)124
(100.0)
182(77.1)168
(74.0)74
(79.6)91
(72.8)NGOCategory
A
B
C
155(62.0)135
(89.4)253
(89.1)
247(99.2)151
(99.3)281
(98.9)
246(98.8)152
(100.0)276
(99.6)
248(98.8)150
(100.0)270
(98.5)
190(75.7)
93(62.0)232
(82.9)By provider
Public
Private
UFHP
Other NGO
92(72.4)416
(81.3)26
(81.3)9
(64.3)
123(96.9)510
(99.6)32
(100.0)14
(100.0)
123(100.0)
505(99.2)
32(100.0)
14(100.0)
123(97.6)500
(99.2)32
(100.0)13
(100.0)
75(59.1)407
(80.3)26
(78.8)7
(50.0)

A-58
ANNEX VII
Table VII-5: Correction ratio for adjusting sample population from census population.
A B C TotalCategory
N Ratio N Ratio N Ratio N RatioCensus
# of Household 4500 4500 5994 14994# < 5 yrs 2566 0.57 2271 0.50 3651 0.61 8488 0.57# of Elco 4426 0.98 4388 0.98 5806 0.97 14620 0.98
# of C. pregnant 281 0.06 251 0.06 478 0.08 1010 0.07# of w. Delivered 469 0.10 456 0.10 700 0.12 1625 0.11
# of Elco con. for FP 4145 0.92 4137 0.92 5328 0.89 13610 0.91Sample
# of Household 951 848 1205 3004# < 5 yrs 1071 1.13 924 1.09 1409 1.17 3404 1.13# of Elco 926 0.97 929 1.10 1282 1.06 3137 1.04
# of C. pregnant 161 0.17 151 0.18 280 0.23 592 0.20# of w. Delivered 267 0.28 292 0.34 390 0.32 949 0.32
# of Elco con. for FP 765 0.80 778 0.92 1002 0.83 2545 0.85Correction Ratio
# of Household # < 5 yrs 0.51 0.46 0.52 0.50# of Elco 1.01 0.89 0.91 0.93
# of C. pregnant 0.37 0.31 0.34 0.34# of w. Delivered 0.37 0.29 0.36 0.34
# of Elco con. for FP 1.15 1.00 1.07 1.07

A-59

A-60