health service utilization and the financial burden on ... · health service utilization and the...
TRANSCRIPT

EIP/HSF/DP.06.6
f
th
Health service utilization and the
inancial burden on households in
Vietnam:
e impact of social health insurance
Depart
Cluster "E )
DISCUSSION PAPER NUMBER 6 - 2006
ment "Health System Financing" (HSF)
vidence and Information for Policy" (EIP

World Health Organization 2006 ©
This document is not a formal publication of the World Health Organization (WHO), and all rights are reserved by the Organization. The document may, however, be freely reviewed, abstracted, reproduced or translated, in part or in whole, but not for sale or for use in conjunction with commercial purposes.
This document was written by Ke Xu, Guy Carrin and Ana Mylena Aguilar Rivera from the World Health Organization, Nguyen Thi Kim Phuong from the WHO office in Vietnam, Nguyen Hoang Long from the Ministry of Health, Vietnam and Dorjsuren Bayarsaikhan from the West Pacific Regional Office, WHO, Manila.
This paper was presented in the 2nd International Conference on Health Financing in Developing Countries in Clermont-Ferrand. We are grateful to the participants for their comments, and particularly Prof. Peter Zweifel for his useful suggestions.
The views expressed in documents by named authors are solely the responsibility of those authors.

Health Service Utilization and the Financial Burden on Households in
Vietnam:
The Impact of Social Health Insurance
By
Ke Xu, Guy Carrin, Nguyen Thi Kim Phuong, Nguyen Hoang Long, Dorjsuren Bayarsaikhan, Ana Mylena Aguilar
GENEVA
2006

Abstract Vietnam is a low income country with more 60% of health spending being out-of-pocket payment by households. Social health insurance was introduced in Vietnam in 1993, but it has so far been maintained at a relatively modest scale and mainly covers government and formal sector employees. This paper evaluates the impact of social health insurance on the use of health services and on financial protection in Vietnam. Results indicate that the insurance coverage increased access to public facility services but not to private facility services. The insured are also better protected from large financial burden due to health expenditures than the uninsured. The study suggests that more attention needs to be paid to expanding insurance coverage, setting an appropriate benefit package and involvement by private facilities in the provision of insured health services.
Keywords: social health insurance, health service utilization, financial burden, Vietnam
1

1. Introduction Social health insurance (SHI) as one of the options to organize a health financing system has been instrumental in reaching universal coverage in many developed countries, such as Germany, France, Netherlands, Austria, Luxemburg, Korea and Japan (Carrin, 2002). Above all, a well designed social health insurance scheme improves the access to health care population-wide and protects against the financial burden of paying for medical expenses. Furthermore, compared to private insurance, the compulsory-natured social health insurance can avoid adverse selection and pool the risk not only among the ill and the healthy, but also the poor and the rich. Quite a number of developing countries are interested in SHI as an important mechanism for improving health financing. Some of them have adopted SHI legislation and are proceeding to the implementation phase.
In Asia, a group of developing countries with transitional economies including many former Soviet Union countries, China, Mongolia (Bayarsaikhan, Kwon & Ron, 2005) and Vietnam are particularly keen on developing SHI or variants of it. At the time these countries were still functioning according to the rules of a planned economy, health financing systems in those countries mainly relied on general taxes (Gao, Qian, Tang, Eriksson & Blas, 2002). Health care services were provided through public facilities with nearly no charge at the point of use. Following market-oriented economic reforms, health systems solely funded by government could not maintained. In order to make up the shortage in government funding, user charges became a common practice in public facilities (Ensor & Savelyeva, 1998; Gao et al., 2002). At the same time private health service provision expanded.
As a result of these changes free health care service has become past practice in these countries. Out-of-pocket payments coupled with the rapid increase in medical costs has made the available health services unaffordable to many households. In these circumstances, social health insurance has come to be viewed as an attractive alternative financing mechanism. SHI usually started with formal sector employees in these countries (Saltman, Busse & Figueras, 2004). But quickly they felt the need to expand SHI to the self-employed and the rural population, and to extend SHI membership as well to the poorest. Several SHI systems had to turn again, at least partly, to tax-financing to support enrolment of these groups, and thus became 'hybrid' variants of SHI.
This paper uses Vietnam as a case to analyze the possible impact of SHI on health service utilization and financial risk protection in transitional economies. The experience gained from Vietnam may well benefit other countries' health financing reform efforts. The paper is organized as follows: section two is an overview of the health financing system in Vietnam. It is followed by a description of the methodology and data. In the fourth section we present the results and we conclude in the last section. 2. Overview of health financing system in Vietnam Vietnam is located in southeast of Asia with a population of 81 million in 2003. It is a low income developing country. In 2002, GDP per capita was 423 US dollar. Life
2
expectancy at birth in Vietnam is higher than in most low income countries with 68 years for men and 74 years for women (Saltman et al., 2004; WHO, 2005).
In 1986, the Vietnamese economy underwent a major reform, referred to as Doi Moi, essentially involving a shift from a centrally planned economy to a market economy. Before Doi Moi, the health care system was fully financed by the government and private practice was banned. During 1980s, Vietnam suffered from a severe economic crisis. The health sector was increasingly under pressure. Grass-root production teams which provided financial resources for basic health care system almost collapsed. Government resources were no longer sufficient to respond to the need of the population. Accordingly, in 1989 public hospitals were allowed to charge user fees to patients. In the same year, private health practice was legalized (Saltman et al., 2004; Tat & Barr, 2006) and has since developed rapidly in providing outpatient services. However, the quality of services in private clinics various dramatically (Tuan, Dung, Neu & Dibley, 2005).
Government also recognized that it needed to further share health care costs with the population. In August 1992, it issued a national Health Insurance Decree by Ministerial Decision No. 299/HDBT (Ron, Carrin & Tien, 1998) calling for compulsory health insurance for salaried workers in the public and private sectors. Dependents of the insured are not covered by compulsory insurance. Voluntary membership of the scheme was made available from the start, in an attempt to improve access to health care for the rural population, self-employed, dependents of the insured and students(Carrin, Hollmeyer, Jones, Everard, Ron, Savioli et al. 1999). This Decree was immediately followed by the implementation of health insurance (Sepehri, Chernomas & Akram-Lodhi, 2005) in several provinces, with major focus on the province of Hai Phong in 1992, which had in fact started a pilot scheme in 1989(Carrin, Sergent & Murray, 1993).
In 1993 the population coverage reached about 5% (Vietnam, 2002). Until 2002 social health insurance remained small scale and covered mainly public and formal private sector employees as well as in-school children and students. The members of voluntary scheme are mainly in-school children and university students and at limited pilot scale to other segments of population such as rural population or self-employed in urban areas. By 2002, the total of insured members was about 16% of the total population (Phuong Nguyen & Akal, 2005).
Currently, financial sources for health care are from four channels: general taxation, social health insurance, private prepayment and out-of-pocket payment. In 2002 the total health expenditure was about 5% of GDP of which more than 62% in the form of out-of-pocket payment. Private prepayment is about 9% of total health expenditure. Government spending on health accounts for 29% of national total health expenditure. Of this 90% is from general taxation and 10% from social health insurance contributions (WHO, 2005).
Until late 2002 benefit packages for the insured under the compulsory and voluntary channels varied in terms of benefit ceilings. For the compulsory scheme, both inpatient and outpatient services from public facilities were covered (Sepehri et al., 2005). Yet with a 20% co-payment rate. Voluntary members were offered a limited package only. A limited number of poor people were offered free SHI cards. The
3

main provider payment method was fee-for-service.
Apart from social health insurance, there are also other policies to ensure access to needed care by the poor. For example, in principle the poor and children under six are entitled to free services at public facilities although very often the policy is compromised in practice due to the shortage of funding. In the current health system reform, the government put more emphasis on enlarging social health insurance coverage, particularly to the poor population (Phuong Nguyen & Akal, 2003).
3. Methodology
3.1. Hypothesis
The purpose of this study is to explore the factors influencing health service utilization and catastrophic health expenditure within Vietnam’s health system, particularly the impact of social health insurance. In a health financing system with more than 60% of health spending in the form of out-of-pocket payment, financial barriers impeding access to care and financial catastrophe due to out-of-pocket payment commonly exist across all social economic groups (Wagstaff & Van Doorslaer, 2003). Social health insurance
Social health insurance can remove, to some extent, the financial barrier of access to care. We therefore, expect that the insured will use more services than the uninsured. We assume that the impacts of being insured on the use of health care services vary between public and private facilities as the social health insurance only covered public facility service at the period the data were collected. We expect that an increase in use of services will occur in public facilities.
Household financial burden is distinguished from the cost of health care. A high cost health service may not result in any financial burden for a high income household while even relatively small amounts of expenditure for common illnesses can be financially disastrous for the poor. The household financial burden is measured in terms of a household's capacity to pay rather than an absolute amount of out-of-pocket payment. By definition, a prepayment scheme can reduce a household's financial burden as risks are shared and contributions are pooled across population groups rather than borne exclusively within an individual household. However, health insurance does not automatically eliminate catastrophic spending in practice. One has to check which population groups were enrolled, and what are the health services that are covered by the scheme (benefit package). In another context, that of Kenya, a study concluded that the current form of social health insurance (National Hospital Insurance Fund, NHIF) does not protect a household from catastrophic expenditure. Two reasons were provided in the study. Firstly, the NHIF only covers employees which are the better off population in the country and secondly, the insurance only covers a fraction of the inpatient cost (Xu, James, Carrin & Muchiri, 2006).
As mentioned before, social health insurance in Vietnam covers public and private sector employees; however, the benefit package is much larger compared to the NHIF
4
in Kenya. We assume in Vietnam, that social health insurance reduces the financial burden in general, but we are not certain whether it would reduce the probability of catastrophic expenditure among households.
Other socio-economic factors
Apart from insurance coverage, other factors may also contribute to the use of health care service and the financial burden. Based on the availability of survey data, age, sex, urban/rural locations and income are used as control variables in testing the impact of SHI coverage in this paper. Many studies have shown that higher income groups use more services than the lower income groups (Waters, 2000; Makinen, Waters, Rauch, Almagambetova, Bitran, Gilson et al. 2000; Onwujekwe, 2005). We expect that the results from this study will be consistent with those earlier findings. Also, a similar pattern is assumed to emerge in the case of explaining the financial burden on households
Different age groups are usually associated with a different health care seeking behaviours. Children under five seem consistently to use more services in previous studies ((Rous & Hotchkiss, 2003). However, this is not the case for the elderly (Browna, Pagana & Rodrýguez-Oreggiac, 2005; Volmink, Laubscher & Furman, 1996; Niraula, 1994). As far as the financial burden is concerned, a household with senior members is more likely to face high levels of financial burden but this result does not hold for a household with children under 5 years old. Some studies found that there are differences by gender and among different geographical locations in health care seeking behaviour and financial burden. Results vary depending on the culture, the design of the health system and other unobserved factors (Xu, Evans, Kadama, Nabyonga, Ogwal, Nabukhonzo et al. 2006; Su, Kouyaté & Flessa, 2006).
3.2 Models
Health service utilization
We assume that the impacts of SHI on the use of public and private facilities are different. The variable on use is an unordered categorical variable defined as 0 for not use any facility services, 1 for public facility, 2 for private facility, and 3 for other facility. A multinominal logistic model is applied to analyze health service utilization. The focus of the study is to identify the factors influencing individuals' the health care seeking behaviour upon expressing that illness occurred. The regression model is only applied to the set of individuals who reported illness in the four weeks previous to the survey. The model can be written as
jXRuseRjuse
β===
==)
)10Pr()1Pr(
ln( ( 1 )
where j=1,2,3 representing the three choices of the health service providers: public, private and others; use=0 is the base group who reported illness but did not use any service; X is a vector of explanatory variables including insurance coverage; R=1 is those who reported illness and βj is a vector of coefficients when choosing provider j
.
5

Financial burden
The financial burden of paying for health services is analyzed at the household level. It is measured as a share of out-of-pocket health payment in a household's total capacity to pay. At any given period of time there always be some households that have no spending on health care. The analysis therefore includes all household even though some of them reported zero out-of-pocket health spending.
WHO has used 40% of household's capacity to as the threshold for catastrophic health expenditure (Xu, Evans, Kawabata, Zeramdini, Klavus & Murray, 2003). Different thresholds are also taken by various studies (Berki, 1986; Wyszewianski, 1986). In order to identify the factors associated with high financial burden or catastrophic expenditure, the logit model has been commonly used. The dependant variable is constructed from a continuous variable, the share of out-of-pocket payment in total household capacity to pay. Depending on the cut-off point, a binary variable is created. We argue that when truncating a continuous variable into a binary variable some useful information may be lost. In this study we use a quantile regression model.
Quantile regression was develop by Koenker and Basset (Koenker & Bassett, 1978; Wyszewianski, 1986). Unlike the OLS, the quantile regression model estimates a quantile of the dependant variable. Also, the quantile regression fits the model that minimizes the sum of the absolute. Quantile regression is less sensitive to outliers and it allows exploration of the different impacts of the same set of explanatory variables on the different quantile of the dependent variable (Martins & Pereira, 2004; Winkelmann, 2006).
The quantile regression model can be written as
qiqi Xy µβ += ( 2 )
Where X is a vector of independent variables and βq is the vector of coefficient of the qth percentile of y (0<q<1), and the µ is an error term. The estimator of the qth
quantile regression can be found as a solution to the problem:
⎟⎟⎠
⎞⎜⎜⎝
⎛−−+−= ∑ ∑
> <β β
βββXyi Xyi
iiqi i
XyqXyq: :
)1(minargˆ ( 3 )
In this study the quantiles are set as 0.6, 0.65, 0.7, 0.75, 0.8, 0.85 and 0.9.
3.3. Data and variables
Data
Data used in this study come from the Vietnam Household Living Standard Survey (VLSS) conducted in 1997/1998. The survey is nationally representative with about 6,000 households and more than 28,000 individuals. The VLSS is a multi-purpose survey. Variables used in this study are mainly from health and expenditure sections.
6

Information on self-reported illness, health service utilization and out-of-pocket health spending was collected at the individual level within a four-week period of time prior to the survey. Social and demographic indicators such as age, sex and SHI coverage were also collected at the individual level.
Definition of variables The use of health services For those who has reported illness in the past four weeks prior to the survey, four categories are defined: use public facility services, use private facility services, use other services (home visit or purchasing over-the-counter drugs in a pharmacy) and not use any service.
Household financial burden The household financial burden is measured as a ratio of total out-of-pocket health payments to household's capacity to pay. Out-of-pocket health payments refer to payments made by households at the point of receiving health services. Typically these include hospital bills, doctors’ consultation fees and purchases of medication. Spending on alternative and/or traditional medicine is also included. Transportation cost is excluded from the out of pocket payments because it points to different type of policy options.
Household's capacity to pay It is defined as total household spending net of the subsistence spending or the poverty line. Subsistence spending was set at 226 thousand Dong per person per month (about 17 dollars in 1998). This is estimated based on the food expenditure of the household whose food share of total household expenditure is at the median of the total sample of households (Xu, Aguilar, Carrin & Evans, 2005).
Household income It is proxied by household expenditure. This choice is made based on two considerations: 1. the expenditure data are more stable than transitory income which reflects random shocks; 2, the reported expenditure is more reliable than reported income from a household survey in developing countries (Deaton, 1992). Income quintile dummies were used in the regression. In this way we may capture the non-linear relationship between income and the use of health services and financial burden, Other variables such as age, sex and insurance coverage are at individual level in the regression of health service utilization, but at the household level in the regression of household financial burden. A detailed description of the key variables is provided at table 1.
Insert table 1
4. Results
4.1 Descriptive analysis
The survey shows that 16% of individuals are covered by social health insurance and that insurance coverage is most prevalent in the middle and high income groups, although there are also covered groups such as the retired from public and private
7

sectors and those that receive special support for persons with meritorious services to the revolution, people with disabilities, orphans of veterans and heroes' mothers (Ron et al., 1998).
During a four-week period, about 42% of the population reported some kind of illness among which 53% obtained some treatment in hospitals or clinics, or purchased over-the-counter drugs in pharmacies. On average, a household spent 60 thousand Dong per month (about 4.6 dollars) on health. The data also showed that the higher the income the higher the out-of-pocket spending on health in absolute terms. However, in terms of the financial burden, the out-of-pocket payment as a share of a household capacity to pay, the low income groups bear a much heavier burden than the high income groups. The average burden is 13% while the financial burden in the poorest quintile is 16% and is 7% in the highest quintile (table 2).
Insert table 2
Among those who reported illness, 13% used public facilities, 11% used private facilities, 29% used other services and the remaining group (47%) did not use any service. High income groups are more likely to use services than low income groups when health care need is perceived. The results also confirm that private providers play an important role in providing outpatient health services not only to high income groups but also to the lower income groups (figure 1).
Insert figure 1
Health spending is 60 thousand Dong per month on average, or about 6% of total household monthly expenditure. Of total health spending, 14 thousand Dong is on public and 14 thousand Dong on private facilities. More than half of the spending is on other services, mainly on over-the-counter drugs. Transport costs incurred to access health services is not included in the total out-of-pocket spending. However, for poor households relatively small amounts for common illnesses can be financially disastrous; transport costs for example reached more than 40% of the poor's health spending. It is also interesting to note that the transport cost from home to a private facility (500 dong/4 cents in dollar) is lower than to a government hospital (8,300 Dong/60 cents in dollar) or a community health care center (700 Dong/5cents in dollar).
4.2. Regression results on health service utilization
Results from multinominal logistic regression show that after controlling the factors of income, age, sex and urban/rural locations, SHI coverage does have an impact on people's health care seeking behaviour. As expected, SHI coverage has different impacts when choosing public and private providers. Among those who reported illness, the insured are more likely to choose public facilities. However, insured are less likely to use private facility services. Similarly, the insured are also less likely to use self-treatment (table 3).
Other socio-economic factors also play important roles in the use of health services. In general high income groups use more services than low income groups either from public, private or other providers although the relationship is not linear. Apparently,
8

income plays a more important role in choosing private facility services than choosing public or other facility services. All the income quintiles are statistically significant and the magnitudes of coefficient is greater in private facility services. In public and other facility services, the difference between the 4th and the 5th quintiles is not significant (table 3).
The elder population (above 60 years old) are more likely to use health services from all providers. Children under 5 years old are more likely to use public or private facility services, but less likely to use other facility services (self treatment). Males are less likely to use services than females. Surprisingly, the results also find that people living in an urban area are less likely to use health service than those living in a rural area.
Insert table 3
4.3. Regression results on household financial burden
A quantile regression was applied to the whole sampled households. The cut-off points starts at 60th percentile with every 5 percentile until 90th percentile. For each cut-off point the equivalent household financial burden was also reported (table 4). At the 60th percentile, the household financial burden is about 11%, measured by total out-of-pocket payments as a share of household capacity to pay. At the 90th percentile, the household burden is about 37% which is close to the definition of catastrophic expenditure proposed by WHO which is 40%.
Insert table 4
Results show that given all the other socio-economic indicators, the insured have a lower financial burden than the uninsured. The result holds across all cut-off points. Furthermore, the higher the financial burden the larger the role insurance plays. Figure 2 shows the coefficients in absolute terms from the quantile regression at different cut-off points. Social health insurance coverage reduces household financial burden most significantly when total out-of-pocket payment exceeds 20% of a household capacity to pay, see table 4.
Insert figure 2
Factors including older (above 60 years old) or young (under 5 years old) household members, household size, urban or rural locations, the use of public or private facilities by any member and income are also associated with financial burden. All these factors appear to be more pronounced at a higher quantile than a lower quantile. In terms of income, lower income is associated with a higher financial burden across all quantiles in this study (figure 3). For example, at the 90th quantile the coefficient for the 1st income quintile (q1) is 0.181, 2nd quintile (q2) is 0.148, 3rd quintile (q3) is 0.106 and the 4th quintile (q4) is 0.090. A similar trend is observed at other cut-off points (table 4).
Insert figure 3
9

It can be expected that the financial burden is associated with the use of health services. The study tested especially the use of public or private facility services in comparison with the use other facilities or no use. Results indicate that the use of either public facilities or private facilities is associated with a high financial burden (table 4). Using public facilities does not avoid a higher financial burden because public facilities rely heavily on user charges to recover the recurrent cost.
Households with senior or young members are associated with a higher financial burden, but the coefficient of senior members is much larger than that of young members. This result is observed across all quantiles. A larger household is less likely to have a higher burden compared to a smaller household holding all other variables constant. One of the main reasons is that the household is the basic unit to carry the financial loss of health payment. A larger household (comprising members of several generations) is likely to have more resources to pool in order to cope with the medical bills. Finally, a household located in an urban area is associated with low burden, probably because it is easier to moblize resources and / or to have access low cost services. All the coefficients in a higher quantile are larger than a lower quantile (table 4).
Insert table 4
5. Discussion 5.1. Methodological issues
Before discussing policy implications from this study, some methodological issues need to be considered. Firstly, in the analysis of utilization, the self-reported illness is used as a screening question for further questions on the choice of providers. Self-reported illness is commonly used in may studies because of its consistent relationship with future mortality in many countries (Nicholson, Bobak, Murphy, Rose & Marmot, 2005; Idler & Benyamini, 1997) and its direct link to policy changes, eg. those who didn't perceive the need would not be seeking health care even though the health care service is fully available. Furthermore, some studies have found that self-reported illness is associated with people's expectation of their own health, the reference group they compare themselves with, and the different cultural attitudes (Sen, 2002).
Secondly, the financial burden is measured in relation to a household's capacity to pay which is non-subsistence income (or expenditure). In the regression of financial burden, an endogenous problem may occur by including income quintiles as explanatory variables (Donnell, Van Doorslaer, Rannan-Eliya & Somanathan, 2006). This is because very often a severe illness results not only in high medical bills but also the loss of income. However, the long-term impact of income loss could only be captured in panel data and not in cross-section survey data.
Thirdly, the quantile regression showed that the coefficients at different quantiles have the same sign and the values are similar at higher quantiles. This indicates that the threshold of catastrophic expenditure used in previous studies is not sensitive to the cut-off points.
10
5.2. Policy implications
Despite the methodological qualifications, some important results emerge. This study found that social health insurance makes public health facilities more accessible financially and protects households from financial loss due to out-of-pocket payment. Moreover, the study also showed that many other socio-economic indicators were associated with the uses of health care services and accordingly the financial burden of paying for medical bills. Low income groups are more sensitive to the price of health care services and they are also more likely to experience larger financial burdens. The aging and the young need more health services and they are also more vulnerable to the burden of medical payments. These results can be related to policy considerations in at least three key areas for SHI development: the population coverage, the benefit package and the involvement of private providers in social health insurance.
1. Expand population coverage.
This study showed that those currently insured have easier access to public facilities and are more protected from financial loss. However, the total population covered by SHI is less than 20% of the total population in 2002 and the insured are mostly better-off population, eg. civil servants and well established formal sector employees. Indeed, health insurance compliance in the business sector is still very low because the health insurance scheme in Viet Nam is regulated and administered by government decree rather than Law. The coverage and compliance will increase notably if the government will upgrade this regulatory status, including enforcement of decisions and regulations. In addition, this study found that the low income groups were more sensitive to the cost of health care in deciding whether or not they should go to see a doctor. When they do use health care services, they are more likely to confront a heavy financial burden.
In considering expansion of SHI coverage both better-off and poor population should be included in order to achieve the sustainability of the fund and the equity in coverage. However, in reality the poor are often left behind. The main difficulty is proper identification of the poor. The means test may have leakages as the non-poor may effectively come to benefit from subsidies and exemption schemes. The means test combined with other methods such as age, sex and demographical location can improve the targeting to the disadvantaged population. From this study we could find that the households living in a rural area and with those with senior or young members are associated with a high financial burden, the latter result can be used in poverty identification. A further step in expanding population coverage could be to include dependents of those currently insured.
As a low income developing country, Vietnam is likely to still need more time in order to reach universal coverage. With more than 60% of total national health expenditure from out-of-pocket payment, it is not surprising to see the results in this study indicating a heavy financial burden in all income groups.
Vietnam is fairly well equipped with administrative and health financing organizations to expand SHI coverage to enable the dependants, the poor and the elderly being covered. We would thus expect a continuous progress in population
11

coverage of SHI. However, in the transitional period, other social protection programs such as private health insurance and community-based health insurance may need to be considered. Yet they should be well regulated and fit in the overall health financing strategy of the country, namely, moving from a system based on out-of-pocket payments to one based on prepayment and pooling of resources.
2. Design an appropriate benefit package
An appropriate benefit package is essential to the efficacy and sustainability of any insurance scheme. A benefit package that is as comprehensive as possible is important for the overall compliance of insured members. A smaller package may not be able to protect households effectively from financial loss. A larger package of benefits with a small co-payment requires a higher premium which the insured and the employers including the government may claim is not affordable in Vietnam. Yet, if premiums are not adjusted sufficiently, the out-of-pocket level will remain high and thus continue to result in problems of access. A more generous package may also create moral hazard. In this study we found that the insured use much more services from public facilities than the uninsured. The question of whether the services used by the insured are all necessary is not answered in this study.
3. Involve private providers
We observed from this study that the insured use less private facility services as a result of the fact that the insurance only covers public facility services. However, the study also shows that the private sector plays an important role in providing outpatient services. Even some poor chose to use private facility services. Furthermore, private facilities tend to be more accessible geographically. Thus travel cost to a private facility is smaller than to a public facility.
Giving a greater official role to the private sector in SHI development through contractual arrangement concerning remuneration, working time and quality of care would increase the overall efficiency of health professional in Vietnam. Moreover, it would also respond to people's preference to seek first line care from GPs close to their home. However, the quality of service varied dramatically among the private providers. In order to benefit from such changes, it is necessary to strengthen regulation of public and private providers and to establish effective provider payment mechanisms with incentives to both public and private providers to ensure high quality services.
4. Recent advances in social health insurance
Since 1998 when the study was conducted, the government of Viet Nam has implemented policies to expand population coverage, particularly to the poor population. In 2002 to further extend coverage to the poor, the government further issued Decision 139 –the Establishment of Health Care Fund for The Poor funded from Government central revenues. The fund can be used to either purchase HI card for the poor or directly pay providers for user fees for the poor when they are seeking care. As the effect of this policy, within one year, about 4 million poor (less then 40% of all poor) had been enrolled.(Phuong Nguyen & Akal, 2005). By the end of 2003, the elder population above 99 years old was also covered by health insurance (Phuong
12

Nguyen & Akal, 2003). In 2005, the government issued a new Decree on SHI – Decree 63/2005/NDCP, according to which all the poor enter into compulsory SHI with government full subsidizing their premium; similar principle will be applied to children under 6 years old (Government of Vietnam, 2005).
This Decree also included: removal the co-payment for the most of ambulatory and in-patient care; a gradual inclusion the school children and students into the compulsory channel by 2008; expanded and unified benefit package across voluntary and compulsory SHI schemes; etc. The new Decree also encourages attempts to try different provider payment methods depending on local specific context and negotiation. Private providers are eligible to participate SHI if the quality of their service reaches certain standards.
13

Table 1. Description of selected variables
Variable Note Labels Mean
Dependent variable health service utilization* (not use is the base category) 1, public 2, private 3, others 0, not use household financial burden continuous variable 0.13
Independent variable
in utilization model only age60i* Is the person above 60 years old? 1. yes 0. no 0.16 age5i* Is the person under 5 years old? 1. yes 0. no 0.12 malei* is the person male? 1. yes 0. no 0.45 insi* is the person insured? 1. yes 0. no 0.16 in financial burden model only age60 Is there any member above 60 years old in the
household? 1. yes 0. no 0.35
age5 Is there any member under 5 years old in the household? 1. yes 0. no 0.35 pub Any member used public health facility 1. yes 0. no 0.21 prv Any member used private health facility 1. yes 0. no 0.17 ins Any member covered by health insurance 1. yes 0. no 0.39 hhsize household size continuous variable 4.7
in both models income quintile dummies (q1-q5, q5 is the base category) 1. yes 0. no urban Is this household in an urban area 1. yes 0. no 0.24
14
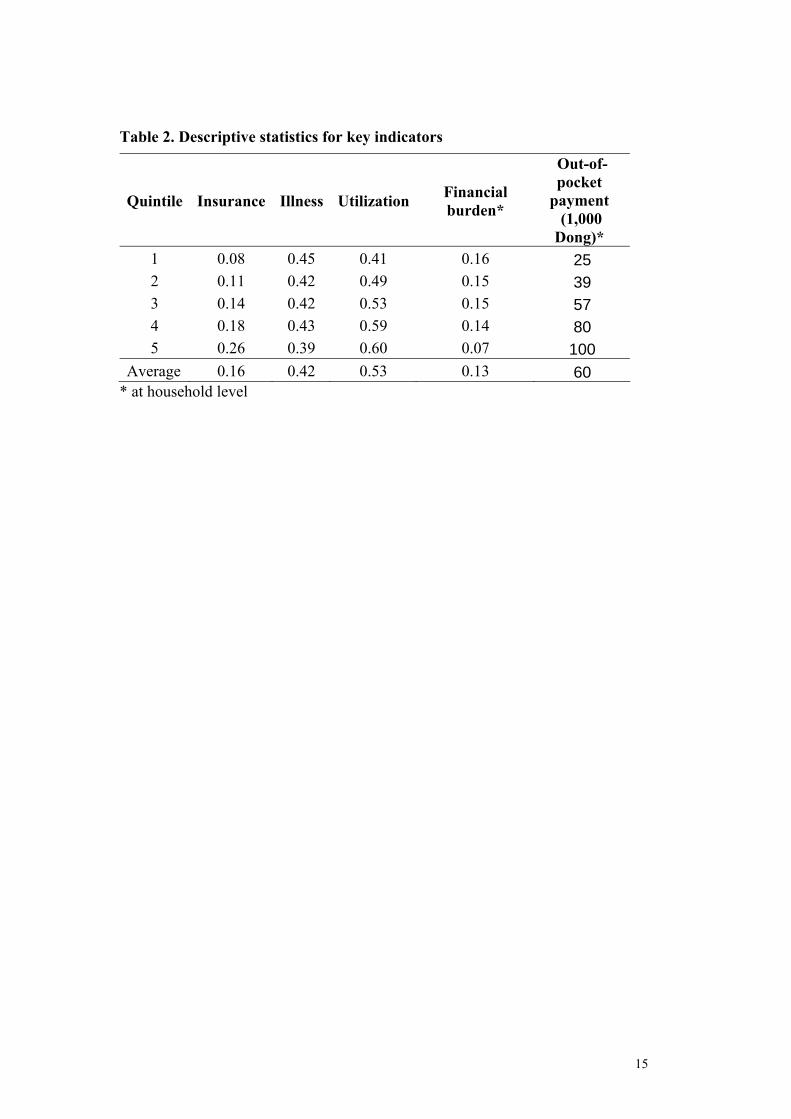
Table 2. Descriptive statistics for key indicators
Quintile Insurance Illness Utilization Financial burden*
Out-of-pocket
payment (1,000 Dong)*
1 0.08 0.45 0.41 0.16 25 2 0.11 0.42 0.49 0.15 39 3 0.14 0.42 0.53 0.15 57 4 0.18 0.43 0.59 0.14 80 5 0.26 0.39 0.60 0.07 100
Average 0.16 0.42 0.53 0.13 60 * at household level
15

Table 3. Factors associated with choice of health service providers (base category = not use any service) Coef. Std. Err. z P>z Public facility insi 0.737 0.070 10.520 0.000 age60i 0.253 0.081 3.140 0.002 age05i 0.292 0.092 3.170 0.002 q1 -0.943 0.108 -8.730 0.000 q2 -0.530 0.101 -5.260 0.000 q3 -0.262 0.094 -2.800 0.005 q4 -0.072 0.088 -0.820 0.412 urban -0.304 0.077 -3.950 0.000 malei -0.076 0.058 -1.300 0.195 _cons -1.067 0.082 -12.940 0.000 Private facility insi -0.500 0.098 -5.090 0.000 age60i 0.331 0.088 3.750 0.000 age05i 0.666 0.088 7.610 0.000 q1 -1.921 0.121 -15.850 0.000 q2 -1.475 0.112 -13.140 0.000 q3 -0.965 0.098 -9.810 0.000 q4 -0.418 0.088 -4.770 0.000 urban -0.490 0.082 -6.000 0.000 malei -0.192 0.063 -3.050 0.002 _cons -0.500 0.080 -6.290 0.000 Other facility insi -0.358 0.066 -5.450 0.000 age60i 0.488 0.059 8.240 0.000 age05i -0.167 0.074 -2.250 0.025 q1 -0.596 0.079 -7.500 0.000 q2 -0.236 0.076 -3.080 0.002 q3 -0.200 0.074 -2.700 0.007 q4 -0.023 0.071 -0.320 0.748 urban -0.142 0.060 -2.360 0.018 malei -0.124 0.044 -2.790 0.005 _cons -0.218 0.065 -3.340 0.001
LR χ2 (27) = 822, Log likelihood = -14230 Prob > chi2 = 0.000
16

Table 4. Summary results from Quantile regression
quantiles 90th 85th 80th 75th 70th 65th 60th (0.37) (0.31) (0.25) (0.21) (0.17) (0.14) (0.11)
age60 0.072 0.065 0.050 0.050 0.045 0.041 0.035 age05 0.019* 0.021 0.018 0.018 0.016 0.013 0.012 pub 0.186 0.192 0.189 0.181 0.166 0.160 0.153 prv 0.216 0.217 0.207 0.206 0.197 0.190 0.175 ins -0.026 -0.029 -0.025 -0.016 -0.012 -0.010 -0.008 hhsize -0.011 -0.011 -0.009 -0.009 -0.009 -0.007 -0.006 urban -0.064 -0.051 -0.039 -0.030 -0.023 -0.017 -0.012 q1 0.181 0.164 0.143 0.135 0.118 0.100 0.083 q2 0.148 0.135 0.113 0.104 0.090 0.082 0.071 q3 0.106 0.078 0.074 0.074 0.069 0.064 0.058 q4 0.090 0.063 0.052 0.049 0.038 0.033 0.024 cons 0.166 0.135 0.110 0.082 0.071 0.050 0.037 Pseudo R2 0.253 0.261 0.261 0.255 0.247 0.236 0.224
Numbers in brackets are the equivalent financial burden. * significant at 0.1 level, all others are significant at 0.05 level.
17

Figure 1. The use of health services
9% 12% 14% 15% 15%6%
7%10%
14% 17%11%
26%
31%29%
28%
29%
13%
30%
0%
10%
20%
30%
40%
50%
60%
1 2 3 4 5 total
quintiles (poor-rich)
perc
enta
ge (%
)
othersprivatepublic
Figure 2. Coefficients of insurance coverage
0.005
0.010
0.015
0.020
0.025
0.030
0.6 0.65 0.7 0.75 0.8 0.85 0.9
quantile
coef
ficie
nts
(abs
olut
e te
rms)
Figure 3. Coefficeints of income quintiles
0.000
0.040
0.080
0.120
0.160
0.200
0.6 0.65 0.7 0.75 0.8 0.85 0.9
quantile
coef
ficie
nts q1
q2q3
q4
18

REFERENCES
Bayarsaikhan,D., Kwon,S., & Ron,A. (2005). Development of social health insurance in Mongolia: Successes, challenges and lessons. International Social Security Review 58(4), 27-44.
Berki,S. (1986). A look at catastrophic medical expenses and the poor. Health Affairs 5(4) 139-145.
Browna,C., Pagana,J., & Rodrýguez-Oreggiac,E. (2005). The decision-making process of health care utilization in Mexico. Health Policy 72 81-91.
Carrin,G. (2002). Social health insurance in developing countries: A continuing challenge. International Social Security Review 55(2).
Carrin,G., Hollmeyer,H., Jones,J., Everard,M., Ron,A., Savioli,L., & Yu,S. (1999). School health insurance as a vehicle for health-promoting schools: recent experience in Vietnam. World Health Organization. Health in Development. Carrin,G., Sergent,F., & Murray,M (1993). Towards a Framework for Health Insurance Development in Hai Phong, Viet Nam. Macroeconomics, Health and Development Series, nr.12. Geneva, WHO. Deaton,A. (1992). Understanding consumption. Oxford: Oxford University Press.
Donnell,O., Van Doorslaer,E., Rannan-Eliya,R., & Somanathan,P. Explaining the incidence of catastrophic expenditures on health care: Comparative evidence from Asia. 2006. EQUITAP Project: Working Paper #5 . Ensor,T., & Savelyeva,L. (1998). Informal payments for health care in the Former Soviet Union: some evidence from Kazakstan. Health Policy and Planning 13(1), 41-49.
Gao,J., Qian,J.C., Tang,S.L., Eriksson,B., & Blas,E. (2002). Health equity in transition from planned to market economy in China. Health Policy and Planning 17 20-29.
Government of Vietnam. Prime Minister's Decree . 63/2005/NDCP. 2005. Idler,E., & Benyamini,Y. (1997). Self-rated health and mortality: A review of twenty-seven community studies. Journal of Health and Social Behavior 38(1), 21-27.
Koenker,R., & Bassett,G. (1978). Regression Qunatiles. Economatrica 46(1), 33-50.
Makinen,M., Waters,H., Rauch,M., Almagambetova,N., Bitran,R., Gilson,L., McIntyre,D., Pannarunothai,S., Prieto,A.L., Ubilla,G., & Ram,S. (2000). Inequalities in health care use and expenditures: empirical data from eight developing countries and countries in transition. Bulletin of the World Health Organization 78(1), 55-65.
Martins,P., & Pereira,P. (2004). Does education reduce wage inequality? Quantile refression evidence from 16 countries. Labour Economics 11 355-371.
19
Nicholson,A., Bobak,M., Murphy,M., Rose,R., & Marmot,M. (2005). Socio-economic influences on self-rated health in Russian men and women - a life course approach. Social Science & Medicine 61(11), 2345-2354.
Niraula,B. (1994). Use of health services in Hill villages in Central Nepal. Health Transition Review 4 151-166.
Onwujekwe,O. (2005). Inequities in healthcare seeking in the treatment of communicable endemic diseases in Southeast Nigeria. Social Science & Medicine 61(2), 455-463.
Phuong Nguyen,T., & Akal,A (2003). Recent advances in social health insurance in Vietnam. World Health Organization. Health Financing Master Plan Technical Paper No.1. Phuong Nguyen,T., & Akal,A. Social Health Insurance - Selected Case Studies from Asia and the Pacific. 2005. WHO - Western Pacific and South-East Asia Region. Ron,A., Carrin,G., & Tien,T. (1998). Viet Nam: The development of national health insurance. International Social Security Review 51(3), 89-103.
Rous,J.J., & Hotchkiss,D.R. (2003). Estimation of the determinants of household health care expenditures in Nepal with controls for endogenous illness and provider choice. Health Economics 12(6), 431-451.
Saltman,R., Busse,R., & Figueras,J. (2004). Social health insurance systems in western Europe. New York: Open University Press.
Sen,A. (2002). Health: perception versus observation - Self reported morbidity has severe limitations and can be extremely misleading. British Medical Journal 324(7342), 860-861.
Sepehri,A., Chernomas,R., & Akram-Lodhi,H. (2005). Penalizing patients and rewarding providers: user charges and health care utilization in Vietnam. Health Policy and Planning 20(2), 90-99.
Su,T., Kouyaté,B., & Flessa,S. (2006). Catastrophic household expenditure for heath care in a low income Society: a study from Nouna District, Burkina Faso. Bulletin of the World Health Organization 84(1), 21-27.
Tat,S., & Barr,D. (2006). Healthcare in the New Vietnam: Comparing patients' satisfaction with outpatient care in a traditional neighborhood clinic and a new, western-style clinic in Ho Chi Minh City. Social Science & Medicine 62 1229-1236.
Tuan,T., Dung,V., Neu,I., & Dibley,M. (2005). Comparative quality of private and public health services in rural Vietnam. Health Policy and Planning 20(5), 319-327.
Vietnam. Health Insurance Statistical Year Book 1993-2002. 2002. Hanoi. Volmink,J., Laubscher,J., & Furman,S. (1996). The SASPREN primary care survey - Who consults the family doctor? South African Medical Journal 86(3), 241-245.
20

Wagstaff,A., & Van Doorslaer,E. (2003). Catastrophe and impoverishment in paying for health care: with applications to Vietnam 1993-1998. Health Economics 12(11), 921-934.
Waters,H. (2000). Measuring equity in access to health care. Social Science & Medicine 51 599-612.
WHO (2005). World Health Report 2005: make every mother and child count. Geneva.
Winkelmann,R. (2006). Reforming health care: Evidence from quantile regressions for counts. Journal of Health Economics 25 131-145.
Wyszewianski,L. (1986). Financially catastrophic and high-cost cases: definitions, distinctions, and their implication for policy formulation. Inquiry 23(4) 382-394.
Xu,K., Aguilar,A., Carrin,G., & Evans,D. (2005). Distribution of health payments and catastrophic expenditures-Methodology. 2005. WHO Health Financing Policy discussion paper. Xu,K., Evans,D., Kadama,P., Nabyonga,J., Ogwal,P., Nabukhonzo,P., & Aguilar,A. (2006). Understanding the impact of eliminating user fees: Utilization and catastrophic health expenditures in Uganda. Social Science & Medicine 62 866-876.
Xu,K., Evans,D., Kawabata,K., Zeramdini,R., Klavus,J., & Murray,C. (2003). Household catastrophic health expenditure: a multicountry analysis. The Lancet 362 111-117.
Xu,K., James,C., Carrin,G., & Muchiri,S. (2006). An empirical model of access to health care, health care expenditure and impoverishment in Kenya: learning from past reforms and lessons for the future. WHO Health Financing Policy discussion paper.
21