healthcare insights · 2019-03-07 · healthcare insights barbec(eu)’d oncology market access –...
TRANSCRIPT

Healthcare Insights
Barbec(EU)’d Oncology Market Access – Part D(EU)x What does EU oncology market access and good southern barbecue have in common? More than you might think! Prices are low, access is slow, and trials are often shredded. In this follow-up article, we re-examine the relationship between US and EU oncology market access to reveal what has changed since 2014.
Greater reimbursement opportunities for innovative therapies in China – an analysis of 2017 national drug price negotiations What is the reimbursement potential in China for an innovative therapy? What can we learn from the recent drug price negotiation that might guide us to be better-prepared for this market?
What sales champions do differently – 4 key success factors What does “success” mean in Pharma, Biotech, and MedTech companies? How does a Sales Champion differentiate themselves from the rest of the pack?
and more...
colourstock.com/cuteimage
A publication for the clients of Simon-Kucher & Partners2018 - Volume 10, Issue 1
INSIDE THIS ISSUE◃
colourbox/-

2 Simon-Kucher & Partners Healthcare Insights | Recent Developments in Global Pricing & Market Access
EXECUTIVE EDITOR Nathan Swilling
ASSOCIATE EDITORS Christopher BarrMadhurima Das Sarah DouglasStephen DunbarCaitlin LyonsChad McAuliffe Madelane Teran Fangting YuMike Zhu
ARTICLE CONTRIBUTORSSteven ChangFan ChenJyoti DevJulia EhrhardtScott HeimKristina JohnsonSeth JordeDavid Lee
GRAPHIC DESIGN Genevieve Solomon
Shansi LiuCaitlin LyonsSteve RosenNathan SwillingSophie WongAcer XuMike Zhu
P&R BRIEFS CONTRIBUTORSTanya LiuMarcela HuffenbaecherMariana TorgalShansi LiuFan ChenJayme LeongShinya KurataNatasha LevyRachel RowbottomRebecca de Rom
SIMON-KUCHER & PARTNERS
COVER STORY
Barbec(EU)’d Oncology Market Access - Part D(EU)x 07 What does EU oncology market access and good southern barbecue have in common? More than you might think!
P&R BRIEFS
US 03 France 03 UK 04 Japan 05 China 05 Brazil 06
FEATURESGreater reimbursement opportunities for innovative therapies in China 13Ask a Payer: Digital Pill Excitement: Do Payers Share the Same Sentiment? 20What Sales Champions Do Differently - 4 Key Success Factors 23About Simon-Kucher & Partners 32
Please send inquiries to: [email protected]
Bonn Office Willy-Brandt-Allee 13 53113 Bonn, Germany +49 0228 / 9843-0
www.simon-kucher.com
Boston Office One Canal Park Cambridge, MA 02141 +1 617 231 4500
CONTENTS

3 Simon-Kucher & Partners Healthcare Insights | Recent Developments in Global Pricing & Market Access
USUS approves first two CAR-T therapiesIn late 2017, the first two CAR-T therapies launched and finally settled the industry’s speculation on how such therapies will be priced. Kymriah (Novartis) and Yescarta (Gilead/Kite Pharma) are $474k and $373k per patient, respectively. Although the access decisions are still play-ing out, both manufacturers have announced their eager-ness to engage in innovative contracting to help optimize access. The launch of these two therapies, with more on the hori-zon, has garnered much excitement. Many of these thera-pies have fast-track or breakthrough status, and have also featured in high-profile, high-dollar deals. For example, Gilead paid $11.9billion for acquisition of Kite Pharma, thereby accessing its asset, Yescarta. However, the excite-ment does not come without concerns. The primary concern revolves around price. Although the therapies are expected to have targeted, small patient pop-ulations, the increasing number of these therapies could still be a strain on health plans’ budgets. These high-cost, curative, short-duration could pose new challenges for payers such as: If higher premiums are needed, how do plans get employers onboard? What if patients die soon after treatment, or the treatment is not successful? What if a patient switches plans shortly after treatment? There has been discussion that payers and manufactur-ers could try to work closely together to implement stag-gered payments and/or pay-for-performance contracts. This could involve new policies at the national level, pan-MCO agreements, and a series of new processes and systems. Novartis has already announced that it has had discussions with CMS for an outcome-based payment for Kymriah. However, currently, it is an announcement of discussions and any agreement and implementation is unknown (despite the contrary being widely reported by news sources). While it will be very tricky for CMS and Novartis to reach an agreement, it will be important to pay close attention as any sort of agreement can set the stage for all other novel cell and gene therapies. The details of any such arrangement is expected to be announced by the CMMI. Public comments on the future direction of
P&R briefs: Recent developments in global pricing & market access
CMMI have been solicited and received, but the details of any specific actions moving forward have not been an-nounced as of the time of writing. ▵
FranceProposed 2018 Social Security Funding Law creates disillusionment in FranceNewly appointed Health Minister Agnès Buzyn’s propos-al for the 2018 Social Security Funding Law (LFSS) has been approved by the French Parliament in December. Ul-timately, the five-year strategy to finance the country’s wel-fare system aims to balance all social security accounts by 2020. Some sections of the proposal, which intends to reduce 3 billion euros of accumulated social security defi-cit by the end of 2018 via changes in healthcare spend-ing, will strongly impact pharmaceutical companies:• Reduced drug budget: In line with recent trends, a
significant share of savings is expected to come from further restricting drug spending, especially through price cuts. As part of a 1.5 billion euro decrease in expenses, the government expects to save 480 million euros by reducing drug prices, 100 million euros by re-ducing medical device tariffs, and 210 million by tight-ening drug price negotiations with industry to secure additional rebates on list prices. In addition, the gov-ernment will promote the use of generics and biosimi-lars, and restrict prescription drug volumes (380 and 320 million euros in expected savings, respectively).
• Decrease of hospital expenses: The restructuring of tariffs in the “liste en sus” (therapies that can be charged directly to the national health insurance in-stead of being covered by hospital DRGs) by applying a unified (instead of individualized) tariff to therapies with comparable efficacy will save up to 390 million euros.
• De-reimbursement of products: Upon re-evaluation by the National Authority for Health in 2018, a number of products are expected to have their medical benefit (SMR) rated insufficient due to limited efficacy in in-dications where more efficacious drugs are available, thus losing reimbursement and saving nearly 200 mil-lion euros.

4 Simon-Kucher & Partners Healthcare Insights | Recent Developments in Global Pricing & Market Access
that the formalised HST threshold could make it more dif-ficult for such drugs to achieve commercially sustainable prices.Prior to launch, GSK highly publicized their pricing phi-losophy, stating the objective of balancing innovation with sustainable value. With a focus on the product pipeline, GSK stated reluctance to set a “prohibitive” price. Strimve-lis’ list price of £522,500 (€594,000) is intended to permit the continued development of new therapies, mostly no-tably metachromatic leukodystrophy and Wiscott-Aldrich syndrome, as well as a platform to manufacture these therapies more cost-efficiently. The NICE HST evaluation committee draft recommenda-tion is driven by: 1. The nature of the condition: ADA–SCID is a rare,
serious, life-threatening and debilitating condition that has severe effects on the lives of people with the con-dition, as well as their families and carers
2. Clinical effectiveness: Improvement in survival and a reconstituted immune system
3. Value for money: With an estimated one patient per year receiving Strimvelis in England, the budget im-pact is significantly below the £20 million/ year thresh-old, and the ICERs for Strimvelis were consistently substantially lower than £100,000 per QALY gained
The committee concluded that although Strimvelis is a high-cost technology and uncertainties in the clinical evi-dence remain, it is likely to provide important clinical ben-efits at a cost that is manageable and value for money in the context of a highly specialised technology.It remains to be seen how NICE will assess gene therapies outside the HST process, for diseases that are not classi-fied as ultra-rare. However, the committee may recognize that the evidence base will also be uncertain for these technologies, and a similar approach to the assessment of regenerative and cell therapies with larger patient num-bers may be applied. It will be extremely difficult for HSTs to qualify for the upper threshold of £300,000, since they will need to demonstrate delivery of 30 additional QALYs to the patient in their lifetime. ▵
Mrs. Buzyn also plans on restructuring public hospital fi-nancing, although implementation details are still to be de-fined.
The current DRG-like system is based on a fee for service (“tarification à l'activité” or “T2A”) designed to cover proce-dures and products (drugs, devices, consumables) tied to a given diagnosis. With the new minister considering that “30% of medical insurance expenses are not appropriate”, the proposal is to progressively replace the existing system with a fee for “care episode” model.
A new single tariff would cover all expenses and health-care professionals, including hospitals and independent profes-sionals, involved in the patient’s care episode. This model aims to incentivize performance, and reduce hospital days as well as avoidable procedures, since additional interven-tions and complications would not be funded. It is inspired by results observed in Sweden in prosthetic hip surgery, where the rate of complications decreased by 26% follow-ing the introduction of such a tariff.The current proposals for cost reduction and structural reforms have come as a letdown to pharmaceutical man-ufacturers in particular, who expected a more growth-ori-ented approach in line with the new administration’s rhet-oric around supporting innovative industry in France. ▵
UKNICE publishes its first draft guidance under the new Highly Specialised Technologies ICER threshold assessment and budget impact testOn October 23rd, 2017, the National Institute for Health and Care Excellence (NICE) published draft guidance recommending GlaxoSmithKline’s Strimvelis. The ex vivo gene therapy treatment is recommended within its mar-keting authorisation, as an option for treating adenosine deaminase deficiency–severe combined immunodefi-ciency (ADA–SCID) when no suitable human leukocyte antigen-matched related stem cell donor is available. Strimvelis was subject to the new sliding incremental cost-effectiveness ratio (ICER) threshold assessment for highly specialised technologies (HSTs) – the threshold varying from £100K-£300k/QALY - and a £20m/year budget im-pact test. This represents the first time that NICE has ap-plied its new cost effectiveness limits for treatments for very rare conditions, since they were outlined in March 2017. At the time of initial publication, lack of rationale for the changes was criticised, along with the suggestion

5 Simon-Kucher & Partners Healthcare Insights | Recent Developments in Global Pricing & Market Access
JapanControversial topics of pilot CEA program to be applied to 13 existing products in April 2018 Japan’s main reimbursement policy panel is currently delib-erating on specific ways to re-price 13 pharmaceutical and medical device products under a pilot cost-effective assess-ment (CEA) program in April 2018. The Central Social In-surance Medical Council, better known as Chuikyo, will be focused on determining whether CEA-based adjustments should be applied to their full National Health Insurance (NHI) prices or to just a portion of their premiums granted at launch.
The NHI prices of seven drugs (Sovaldi, Harvoni, Viekirax, Daklinza, Sunvepra, Opdivo, and Kadcyla) and six medical devices (Kawasumi Najuta Thoracic Stent Graft System, Ac-tiva RC, Vercise DBS System, Brio Dual 8 Neurostimulator, JACC (J-tec Autologous Cultured Cartilage), and Sapien XT) will be impacted by Chuikyo’s 2018 CEA decision.
In Japan, a newly approved medicine is priced by referring to the most comparable drug (when comparable drugs are available). The NHI price of the new drug takes the compara-tor’s daily NHI price as a base price, then adds a correction premium of 5-120% based on its innovativeness, useful-ness, etc. Members of Chuikyo and the Ministry of Finance would like to apply the CEA adjustments to the total NHI price, while the industry prefers to limit the CEA adjustments to the premium portion of the price.
Japan’s Representative of Pharmaceutical Research and Manufacturers of America (PhRMA) pointed out that the premiums given at launch are evidence of clinically superior-ity over comparator drugs. Yet despite their superior clinical performance, these innovative medicines could face price cuts that reduce their prices below their comparators if CEA-based re-pricing is applied to the total NHI price. They argue that pricing uncorrelated to performance would demotivate companies to invest in drug development and cause a lag in Japanese drug pipelines.
Another focus of ongoing CEA debates is whether there should be a price hike for products that demonstrate an excellent cost-effective profile. A vocal Chuikyo payer rep-resentative strongly opposes this idea, while the Federation of Pharmaceutical Manufacturers’ Associations of Japan (FPMAJ) argues that any downward adjustment based on CEAs should be countered by an upward tweak.
To add additional fuel to the debate, the health ministry re-cently revealed that CEA data submitted by the drug makers and re-analyses by third-party experts yielded huge discrep-ancies for some of the existing products under review. De-spite this latest complication, Chuikyo is still aiming to adjust prices of the 13 existing products being evaluated under the pilot CEA program by April 2018.▵
ChinaPolicy revisions to accelerate drug registration and approval in ChinaIn 2017, China’s central government released a series of policy revisions reforming the regulatory approval process to allow for faster and more efficient drug approval. Two of these policy revisions stand out as having the greatest potential to impact multinational corporations: 1. Reform of the clinical trial application process; and2. Fast track approval process for drugs/devices
In the past, the approval process for clinical trials was a sig-nificant barrier for many new therapies to enter the market. The reforms of the application process include:
i. Incentives for the creation of more clinical trial institu-tions (CTIs), which have the regulatory approvals and technical capabilities to undertake drug trials, and es-tablishment of third-party ethics committees to review the CTI practices prior to submission of clinical trial plans to the authorities. This third-party review aims to increase the quality of applications.
ii. Requirement that the regulatory authorities approve clinical trial plans within 60 working days. If no feed-back is provided within this timeframe, manufacturers can assume that the authorities have given de facto consent to the plan as submitted and may proceed with the clinical trial. This rule is intended to prevent potential processing inefficiencies.
iii. The ability to use clinical data obtained from foreign sites of international multi-center clinical trials for ap-plication registration in China, assuming they meet rel-evant Chinese requirements. This is a notable change from the previous requirement of China-specific trial data.
Certain categories of drugs and medical devices are now entitled to apply for fast track approval. Qualified catego-ries include products for diseases that seriously endan-ger life with no alternative therapies, products that meet urgent clinical needs, and products for indications where

6 Simon-Kucher & Partners Healthcare Insights | Recent Developments in Global Pricing & Market Access
there are shortages in product availability. Authorities will approve these products faster if their early and mid-term clinical trial parameters indicate therapeutic efficacy with predictable clinical value.The combination of these two policies is expected to fa-cilitate quicker progress from R&D to clinical trials, and subsequently from trials to market. After implementation, the backlog of approvals has reduced from 22,000 to ap-proximately 8,000 applications. A number of innovative first-in-class therapies, including Entresto, Novartis’ for-mulation for heart failure, Sovaldi, Gilead’s treatment for chronic hepatitis C, and Tagrisso, AstraZenaca’s break-through therapy for metastatic non-small cell lung cancer, have benefited from this reform. ▵
BrazilNew price-setting resolution for biosimilars in BrazilThe price-setting chamber in Brazil (CMED) has published a new resolution defining maximum list price rules for biosimilars after the launch of Remsima (infliximab), the first biosimilar approved via the comparability pathway in Brazil. The price-setting process for Remsima took over a year, highlighting the lack of specific pricing regulation for such products. Although very few biosimilars are cur-rently available, several blockbuster biologics – such as bevacizumab (Avastin) and adalimumab (Humira) – are expected to lose their patents in Brazil by 2020, further stressing the need for a more structured pricing process.According to the new resolution, CMED will set the maxi-mum list price of biosimilars using two key factors: rela-tive therapeutic gains and whether a similar molecule is available within the manufacturer’s portfolio. Similar to standard small molecule drug categories, if biosimilars are deemed to show additional therapeutic benefit – po-tentially due to a new concentration, indication, or form of administration – they will only be subject to international price referencing. However, since the vast majority of bio-similars are expected to simply reproduce the therapeutic benefit of the originator, biosimilar price setting will mainly depend on whether the biosimilar manufacturer already commercializes the same molecule.Companies that already produce and market the biologic have the advantage of only facing internal referencing (av-erage price of the same active substance commercialized by its own manufacturer). This provides the opportunity
for manufacturers of the original product to potentially launch second brands at the same price. On the other hand, if the biosimilar is a new molecule within a com-pany’s portfolio, it is expected to face stricter maximum list price rules – the lowest price between international referencing (lowest price within a basket of 9 reference countries1 plus country of origin) and internal referencing (average local price of the same active substance, weight-ed by sales). Companies who launch faster will face a less crowded market and, consequently, a limited basket of local therapies as price comparators.
With the new resolution, the government aims to increase attractiveness of the biosimilars market and encourage a large number of players to enter the market as quickly as possible. Since biosimilars are likely to play a major role in public tenders, a highly competitive environment will help to push net prices down. Furthermore, the new resolu-tion brings security and clarity for biosimilar pricing and timelines. Unlike small molecule generic drugs, there are no fixed discounts for biosimilars due to higher produc-tion costs and lower economies of scale, leaving room for innovative launch strategies among pharmaceutical companies. In terms of timeline, the resolution provides a faster and more structured process for the price commit-tee to judge upcoming biosimilar cases.At the same time, the implications of the new resolution on the healthcare system are still unclear. Some pricing scenarios described in the resolution have not yet been pressure-tested in real life, highlighting the need for fur-ther monitoring. Moreover, biosimilars are not yet formally categorized in CMED’s pricing legislation (currently con-sidered as “omitted case”), thus the resolution is expected to become a new drug category in the near future. Be-sides several future challenges, the new resolution cer-tainly provides important guidelines for the promising bio-similars market in Brazil. ▵1 Reference countries: Australia, Canada, France, Greece, Italy, New Zealand, Portugal, Spain and USA. Final price can be set if the product is available in at least three reference countries..
Price setting rules for biosimilarswith no additional therapeutic benefit
Lowest of IPR
Lowest between IPRand average local price
Yes
No
Is the biosimilarmanufacturer alsomanufacturer ofthe originator?

7 Simon-Kucher & Partners Healthcare Insights | Features
Barbec(EU)’d Oncology Market Access – Part D(EU)xBy Nathan Swilling, Steven Chang, Jyoti Dev, Acer Xu, and Mike Zhu
Simon-Kucher previously conducted a review of market access outcomes for innovative oncology agents in the EU back in 2014. The findings from that study demonstrated that oncology market access in the EU could be compared to a recipe for preparing Southern style BBQ pulled pork – low, slow, and shredded.
Figure 1: Time from EMA approval to price agreement for France, Germany, Italy and Spain colourbox/-

8 Simon-Kucher & Partners Healthcare Insights | Features
Oncology prices in the EU are low, are very slow in com-ing to an agreement, and manufacturers sometimes find their trials shredded so that different sub-populations are deemed to have different benefits.
As an update to that prior work, Simon-Kucher has again conducted a thorough review of the market access out-comes for innovative oncology products in the EU5 to see if anything has changed in the last few years. Has the price gap between the US and EU started to close as more products launch? Has it become easier to achieve quick market access as payers become used to negotia-tions for these types of products? The answer, it seems, to all of the above questions is a resounding “no.”
Timing of EU market accessIn our previous article, we found that a drug can expect a long wait before reaching most EU markets. While the process in Germany is much faster (with immediate mar-ket access and a negotiated price in the vast majority of cases in one year’s time), the process in the Southern Eu-ropean markets of France, Italy, and Spain can very often take one to two years after EMA approval. There was sig-nificant variability in the amount of time it took for a single drug to reach agreements across different counties, with no visible trend. In this article, we revisit this topic with more data points to investigate how market access timing may have changed in the past few years.
Figure 1 illustrates the time between EMA approval and price agreement in the negotiated markets of France, Ger-many, Italy, and Spain since 2011. Unfortunately for on-cology manufacturers, the trend has continued over the last few years. The period of price negotiation can vary significantly from a few months to almost two years. No clear pattern can be seen across these three countries as there are plenty of examples where each country was the first to come to a negotiated agreement, as well as examples where each country was the last to come to an agreement.
We also investigated how the length of this time period has changed in the past few years. No pattern was ob-served in France, while in Italy and Spain, the observed average market access time appears to have decreased in recent years. However, it is important to note that that several EMA approved drugs since 2015 have not yet reached agreements and are therefore excluded in this analysis. When these more recent therapies finally reach an agreement, the average time will certainly increase.
105 15 25 35 450 20 30 40 50
YervoyZytiga
CaprelsaZelboraf
Jakafi/JakaviInlyta
XalkoriAdcetris
ZaltrapPerjetaBosulifXtandiIclusig
ErivedgePomalyst/Imnovid
StivargaTafinlar
Gilotrif/GiotrifXofigo
KadcylaCometriqMekinist
Gazyva/GazyvaroZydelig
ImbruvicaLynparzaCyramzaZykadia
LenvimaOpdivo
KeytrudaFarydakKyprolisCotellicBlincytoImlygic
TagrissoLonsurf
EmplicitiDarzalex
Cabometyx
2012
2013
2014
2015
2016
2011
months
Figure 1: The time taken to reach a price agreement after EMA ap-proval in France, Germany, Italy and Spain. The year of EMA approval of each drug is shown on the left. At the time of our analysis, the price agreement for certain drugs had not yet been reached in certain countries and hence the country icons for those drugs were omitted on the figure.
With increased public attention on drug prices
in the US and more open access to information, we initially hypothesized that
the price gap between US and EU-5 might have
decreased over time.
“
“

9 Simon-Kucher & Partners Healthcare Insights | Features
EU-5 launch prices versus US launch pricesThe price differences between US and EU was a second topic of focus in our previous article. We had previously found that the EU oncology drug price at launch was on average 30-40% lower than the US WAC price, and that this gap only widened post-launch. We made the same observation when including oncology drugs approved since 2015 (Figure 2). As before, Germany appears to have the lowest prices amongst the EU-5, but there is a significant caveat. All net negotiated agreements in Ger-many are publicly available, so the net price is truly the net price. In France, Italy, and Spain, there are additional confidential agreements that lower the actual net price.
Interestingly, the average price across all products across France, Italy, and Spain is remarkably similar – differing by only a few percentage points. However, there is rath-er unsurprisingly, significant variability when comparing across different drugs. Figure 3 shows the index of aver-age prices in EU-5 markets against US WAC price at the time of first EU-5 agreement, revealing that the price for some drugs could be as low as 15-30% of the US WAC price. However, with a few exceptions, the EU-5 price was always lower than the US price. For the few drugs that achieved a higher launch price in the EU-5 than in the US, the HTA ratings were not superior to the ratings of other drugs we investigated; the reason why these drugs were able to achieve a higher launch price relative to the US price is unclear.
32%
43%
30%32% 31%
-50%
-40%
-30%
-20%
-10%
0%France Germany Italy Spain UK
Figure 2: The overall percent relative discount of the average EU-5 ex-manufacturer price at launch versus the US WAC price at the time of the first EU-5 launch.
Figure 3: The indexed average EU-5 ex-manufacturer price of each drug relative to the US WAC price at the time of first EU-5 launch.
0% 20% 40% 60% 80% 100% 120%BesponsaAlecensa
Venclexta/VenclyxtoNinlaroIbrance
LartruvoOnivyde
CabometyxDarzalexEmplicitiLonsurf
PortrazzaTagrisso
ImlygicBlincytoCotellicKyprolisFarydak
KeytrudaOpdivo
LenvimaZykadia
CyramzaLynparza
ImbruvicaZydelig
Gazyva/ GazyvaroMekinist
CometriqKadcyla
XofigoGilotrif/ Giotrif
StivargaTafinlar
Pomalyst/ImnovidErivedge
IclusigXtandiBosulifPerjetaZaltrap
AdcetrisXalkori
InlytaJakafi/Jakavi
CaprelsaZelboraf
ZytigaYervoy2011
2012
2013
2014
2015
2016
2017
EMA approval year

10 Simon-Kucher & Partners Healthcare Insights | Features
14%
28%
35%38% 39%
45%49%
-60%
-50%
-40%
-30%
-20%
-10%
2011 2012 2013 2014 2015 2016 20170%
Figure 4: The year-by-year percent relative discount of the average EU-5 ex-manufacturer price versus the US WAC price at launch.
Price Trends over TimeWith data from over a 7-year period, we also investigated if there were any noticeable trends in pricing over time. Specifically, we looked into the price gap between the US and EU-5, the price difference between the freely-set and negotiated prices in Germany, and the relationship of prices in France, Italy and Spain relative to the negotiated prices in Germany.
With increased public attention on drug prices in the US and more open access to information, we initially hypothesized that the price gap between US and EU-5 might have decreased over time. However, the opposite trend was observed from our data (Figure 4). The price gap for newly launched oncology drugs between the US and EU-5 has actually consistently widened over the past several years. In 2011-2012, the average EU-5 price was about 20% lower than the US WAC price at the time of first EU-5 launch. By 2016-2017, the average EU-5 and US price gap increased to about 47% when indexed to the US WAC price. This is certainly not great news for pharmaceutical manufacturers thinking about launching in Europe. We believe this trend is due to the continu-ing use of price comparators and HTA assessments that are very common in European markets. In the EU-5, the price of price comparators does not increase over time and thus, the price of newly launched drugs are relatively controlled. On the other hand, oncology drug prices have continued to increase in the US, with new drugs often launched at a premium over their comparators. The com-bination of these two mechanisms has led to the widen-ing of the price gap.
We observed minimal variation over time in the difference between the freely launched price and the eventual ne-gotiated price in Germany (Figure 5). The post-negotiat-ed price is on average at a 20% discount to the freely launched price, with most drugs being within the range of 10%-30% discount. This result suggests that manufactur-ers can generally expect a 10-30% price reduction post-negotiation. Since unreasonably high free-launch prices would set a negative impression before entering negotia-tions and manufacturers would have to pay-back the gov-ernment the price difference for the extended negotiation period if negotiations took more than a year, manufac-turers should set a free-launch price at most about 30% above the anticipated willingness to pay. In addition, man-ufacturers should set a launch price consistent with their international launch strategy since other countries may be referencing the Germany prices during their negotiation.
-60% -40% -20% 0% 20%
LonsurfEmplicitiDarzalex
ImlygicCotellicKyprolisBlincytoMekinistFarydak
KeytrudaOpdivo
LenvimaZykadia
LynparzaCyramza
ImbruvicaZydelig
Gazyva/GazyvaroCometriq
KadcylaXofigo
Gilotrif/GiotrifStivargaTafinlarXtandi
Pomalyst/ImnovidErivedge
IclusigBosulifPerjetaZaltrap
AdcetrisXalkori
InlytaJakafi/Jakavi
ZelborafCaprelsa
ZytigaYervoy
2011
2012
2013
2014
2015
2016
EMA approval year
Figure 5: The percentage discount or premium for the negotiated price versus the free-launch price in Germany.

11 Simon-Kucher & Partners Healthcare Insights | Features
-50% 0% 50% 100% 150%
DarzalexEmplicitiLonsurfBlincytoCotellicKyprolis
KeytrudaOpdivo
LenvimaZykadia
CyramzaLynparza
ImbruvicaZydelig
Gazyva/GazyvaroMekinistKadcyla
XofigoGilotrif/Giotrif
StivargaTafinlar
Pomalyst/ImnovidErivedge
IclusigXtandiBosulifPerjetaZaltrap
AdcetrisXalkori
InlytaJakafi/Jakavi
ZelborafCaprelsa
ZytigaYervoy2011
2012
2013
2014
2015
2016
EMA approval year
Figure 6: The percentage discount or premium of the average France, Italy and Spain prices relative to the post-negotiation Germany price.
21 out of the 27 drugs received a “no benefit” G-BA rating in at least one of the patient sub-groups, demonstrating the willingness of G-BA to “shred” the clinical
trial results and pick out the bits that G-BA
believes to provide no additional value.
“
“
Finally, we found no significant changes in the prices in France, Italy and Spain relative to the post-negotiated price in Germany (Figure 6). According our research, the aver-age price in the three countries was generally 5%-20% higher than the post-negotiated German price. However as mentioned previously, this is due to discounts in Italy, Spain and the UK being hidden in the net price and not reflected in the list prices used for this research. On the other hand, the post-negotiated German ex-manufacturer prices can be considered the true net prices.
“Shredded” clinical trial analysesIn the previous article, we discussed that some HTA agen-cies in Europe looked into patient subpopulations in the clinical trials to identify the subgroups of patients that would derive the most benefit, and consequently, which subgroups would receive less benefit. This practice is still actively being implemented today, especially in Germany. We looked at the oncology drugs that received EMA ap-proval since 2011 and 46 of them have undergone G-BA evaluations. Of the 46 drugs, 27 of them (59%) have more than one patient subgroup evaluation for a single indica-tion. These subgroup analyses were likely not intended by the manufacturers. Furthermore, 21 out of the 27 drugs (78%) received a “no benefit” G-BA rating in at least one of the patient subgroups (Figure 7), demonstrating the willingness of G-BA to “shred” the clinical trial results and pick out the bits that G-BA believes to provide no addi-tional value.
Figure 7: G-BA assessments for oncology drugs launched since 2011. A total of 46 oncology drugs have been evaluated by the G-BA since 2011; 27 of them have more than one subgroup evaluation for a single indication. Out of those 27 drugs, 21 of them received a “no benefit” rating in at least one subgroup.
All evaluations
Only 1 >1 (singleindication)
19 27
Subgroupsn = 46
6
21
Drugs with >1 subgroups
All subgroupswith better than
>=1 subgroup
“no benefit”ratingn = 27
12 Simon-Kucher & Partners Healthcare Insights | Features
Conclusion For oncology products, the European market remains less rewarding to pharmaceutical manufacturers than the US market due to the long negotiation period, much lower prices relative to the US, and dissected clinical tri-als looking at sub-populations. It is also noteworthy that the price gap between US and EU has increased over the years and will continue to grow. Given that many of the EU-5 countries are increasingly using HTA assessments to understand the additional benefit to patient subpopula-tions and to determine economic savings, pharmaceuti-cal manufacturers will need to be realistic regarding the added value of their new products in order to determine achievable prices. Innovative products will still be reward-ed, but “me-too” products with incremental improvements can expect long waits for market access and lower price potentials. ▵
For correspondence related to this article, please contact Nathan Swilling at [email protected].
Pharmaceutical manufacturers will need to be realistic
regarding the added value of their new
products in order to determine achievable
prices
“
“
colourbox/-

13 Simon-Kucher & Partners Healthcare Insights | Features
Greater reimbursement opportunities for innovative therapies in China An analysis of 2017 national drug price negotiations By Steve Rosen, Fan Chen, Shansi Liu, Caitlin Lyons
The recent national drug price negotiations in China and subsequent national reimbursement drug list (NRDL) inclusion for select innovative medications have opened the door to new marketing and reimbursement possibilities
colourbox/-

14 Simon-Kucher & Partners Healthcare Insights | Features
The negotiations seem to be ushering in a new era where manufacturers are operating in a larger reimbursed mar-ket and Chinese patients are offered cost relief. Simon-Kucher analyzed the negotiation results, and identified insights and key learnings for manufacturers.
Growing reimbursement opportnity for innovative drugs Marketing high-cost, innovative drugs in the Chinese mar-ket has been a long-standing struggle for manufacturers given low patient out-of-pocket (OOP) potential and re-imbursement challenges. Innovative drugs are typically launched in China without reimbursement, which means manufacturers typically rely on patients to pay OOP for their product for at least three to five years after launch before achieving reimbursement.
The Ministry of Human Resources and Social Security (MoHRSS), China’s government authority responsible for reimbursement decisions, has only updated the NRDL twice in the last ten years, once in 2009 and again eight years later in February 2017. The 2017 edition of the NRDL contains 2,535 drugs, including 1,297 Western medicines1. The updates were based on votes from na-tional expert committees consisting of clinical, pharma-ceutical, HEOR, and pharmacoeconomics experts.
Following the February 2017 update, the MoHRSS con-ducted price negotiations with the manufacturers of 44 patented or exclusively-supplied drugs which are higher cost but offer high clinical value. In July, the government announced that 36 drugs passed the negotiation and are all listed on NRDL Tier B with a 10-20% patient co-pay. On average, these products took a 44% price cut compared to their previous tender price. Among these 36 drugs, 31 are Western drugs and 5 are TCMs2.
1 Western Medicines: medicines that are NOT traditional Chinese medicines. 2 TCM = Traditional Chinese medicines, which include a broad range of medicine practices sharing common concepts which have been developed in China and are based on a tradition of more than 2,000 years, including various forms of herbal medicine, acupuncture, mas-sage (Tui na), exercise (qigong), and dietary therapy
MoHRSS negotiation structure and implications for manufacturersManufacturers have historically had low visibility into the process and timeline for selecting products to enter MoHRSS negotiations. The 2017 national drug price ne-gotiations provided increased clarity and transparency into the negotiation process, which is separated into three phases:
1. Pre-selection of drugs for negotiation: The drugs that participate in the negotiation are selected by roughly 4,000 individuals nation-wide who are experts in clinical and pharmaceutical medicine, medical insur-ance, and pharmacoeconomics. Historically, manu-facturers have not been able to proactively apply to participate in price negotiations.
2. Set negotiation target price: The MoHRSS sets up two independent groups to evaluate the appropri-ate target price for negotiations: the Pharmacoeco-nomics Evaluation Group and the Reimbursement Funding Capacity Group. The groups determine one target price following separate evaluations of a given product’s clinical and economic profile. The entire process is highly confidential and manufacturers are not given insight into the government’s negotiation target price.
3. Negotiations with manufacturers: There are two possible scenarios that can unfold during the nego-tiation phase. In one scenario, the price the manu-facturer offers exceeds the government’s pre-set negotiation target price by more than 15%, causing the negotiation to cease and fail. In the second sce-nario, the price offered is ≤15% above the govern-ment’s target price, allowing manufacturers to enter into the negotiation. The final negotiated price that the manufacturer and MoHRSS agree upon cannot exceed the government’s original target price.

15 Simon-Kucher & Partners Healthcare Insights | Features
The confidential nature of the negotiations creates many unknowns: if and when a drug can participate in the ne-gotiation, what negotiation target price the government will set, and whether the negotiation will be successful. The uncertainty around time to negotiation means that manufacturers must carefully consider whether they will pursue a low list price strategy (to pursue wide adoption) or a higher list price strategy combined with a patient as-sistance program (PAP). These strategies could have dif-ferent effects on product uptake and future price potential in China.
What are Patient Assistance Programs (PAPs)?Patient assistance programs (PAPs) are funding mecha-nisms commonly used in China by manufacturers of in-novative therapies to maintain a high list price at launch while reducing patient OOP and encouraging uptake. There are mainly two charities that work with manufactur-ers to provide discounted drugs to patients. Most PAPs in China are designed as a “Buy X, Get Y free” offering.
Manufacturers may want to maintain a high list price for a number of reasons. For example, keeping a high list price is beneficial if the manufacturer is planning an indication expansion into a disease area with a higher willingness to pay. China does not allow indication-based pricing, so if the manufacturer initially launches at a low price and ex-pands into an indication with a higher willingness to pay, they will not capture the higher price potential in the new indication.
Onc
olog
y dr
ugs
atte
nded
neg
otia
tion
Adm
inis
trat
ion
Spec
ifica
tion
China price before negotiation
Chi
na p
rice
post
ne
gotia
tion
(in U
SD)
Taiw
an
reim
burs
emen
t am
ount
(in
USD
)
US
WAC
pric
e (in
USD
)
Fran
ce C
EP
publ
ic p
rice
(in U
SD)
Tend
er p
rice
(in U
SD)
Chi
na P
AP d
esig
n im
plem
ente
d be
fore
neg
otia
tion
PAP
net p
rice*
(lo
wer
limit)
(in
USD
)
Herceptin IV 20ml, 440mg /bottle 3,195 Buy 6 cycles, get 8 cycles free
1,558 1,124 1,920 4,252 1,101
Avastin IV 4ml, 100mg /bottle 765 Buy 4 months, free thereafter
425 295 297 759 248
MabThera/Rituxan
IV 10ml, 100mg /bottle 505 Buy 4 cycles, get 4 cycles free
265 357 266 869 130
Tarceva Oral 150mg/pill 68 Buy 4 months, get 8 months free
25 29 36 261 69
Nexavar Oral 200mg/pill 57 Buy 3 months, free thereafter
31 30 30 137 29
Zytiga Oral 250mg/pill 45 Buy 4 cycles, get 6 cycles free
19 21 23 78 26
Revlimid Oral 10mg/pill 325 Buy 3 cycles, get 9 cycles free
84 128 NA 608 170
Table 1: List price, PAP price, and reimbursement price for oncology drugs vs. other list prices
Exchange rates: 1 CNY = 0.1478 USD, 1 EUR = 1.0917 USD, 1 TWD = 0.0328 USD; Simon-Kucher analysis*For oncology drugs, PFS was used to calculate the length of usage. The calculation of PAP net price is based on the assumption that patients would take full advantage of the PAP, therefore, the PAP net price represents a lower limit of the possible net prices.

16 Simon-Kucher & Partners Healthcare Insights | Features
Onc
olog
y dr
ugs
atte
nded
neg
otia
tion
China price per unit before negotiation
Chi
na p
rice
per u
nit
post
neg
otia
tion
(in U
SD)
% c
hang
e fr
om P
AP
net p
rice
to p
rice
afte
r neg
otia
tion
Tender price (in USD)
China PAP design before negotiation
PAP net price* (lower limit) (in USD)
Revlimid 325 Buy 3 cycles, get 9 cycles free 84 128 +53%
MabThera/Rituxan
505 Buy 4 cycles, get 4 cycles free 265 357 +35%
Tarceva 68 Buy 4 months, get 8 months free 25 29 +17%
Lang Mu (conbercept)
994 Buy 2 injections, get 1 free 663 820 +24%
Zytiga 45 Buy 4 cycles, get 6 cycles free 19 21 +14%
Brilinta 1.62 Buy 9 boxes, get 3 boxes free 1.21 1.25 +3%
Table 2: Branded products that negotiated a higher NRDL reimbursement price than the PAP net price
Exchange rates: 1 CNY = 0.1478 USD*For oncology drugs, PFS was used to calculate the length of usage. The calculation of PAP net price is based on the assumption that patients would take full advantage of the PAP, therefore, the PAP net price represents a lower limit of the possible net prices.
The role of PAPs in the negotiationsLet’s take a closer look at select oncology products to il-lustrate the role of PAPs in negotiations. The PAPs offered by the seven oncologics listed in Table 1 provided a 47% discount to patients on average, with discounts ranging from 25% to 56%. The majority of these programs were designed as “Buy X, Get Y Free,” while a few (Avastin and Nexavar) were structured as a “Buy X, Get the rest Free” program.
Avastin reduced its price the most during the negotiation, reporting a 31% decline compared to its PAP net price. MabThera/Rituxan, Tarceva, Zytiga, and Revlimid all ne-gotiated prices that were up to 14-53% higher than their PAP net prices, as seen in Table 2. Given the limited 10-20% patient OOP copay for products listed on NRDL Tier B, oncology patients using these therapies are expected to see their OOP cost drop 60-80%.
As shown in Table 2, only 2 other therapies with PAPs in place were able to negotiate a price that was higher than their PAP net price. There were only 7 other therapies with PAPs that were successful in the negotiations, however their negotiated prices were below their PAP net price
Comparing the negotiated price with prices in Taiwan, France and the US, prices for all oncologics with PAPs were all very close to the list price in Taiwan, with the ex-ception of Herceptin (Figure 1). This result is in line with a trend identified by some policy experts that the Chinese government may reference drug prices of surrounding countries/regions when evaluating reimbursement prices for drugs in China.

17 Simon-Kucher & Partners Healthcare Insights | Features
-100%
0%
100%
200%
300%
400%
500%
700%
Herceptin Avastin MabThera/Rituxan
Tarceva Nexavar Zytiga Revlimid
Comparison of china post-negotiation price with France/US/Taiwan prices
France CEP public priceTaiwan reimbursement amountUS WAC priceChina PAP net price before negotiationChina list price before negotiation
China priceafter negotiation
Comparison of China post-negotiation price with France/US/Taiwan prices
Exchange rates: 1 CNY = 0.1478 USD, 1 EUR = 1.0917 USD, 1 TWD = 0.0328 USD; Simon-Kucher analysis
Figure 1
Selection for reimbursement negotiationsCurrent trends indicate that innovative drugs are gener-ally not evaluated for addition to the NRDL for at least 3-5 years after launch. Among the negotiation drugs, only Zytiga (launched in China in 2015) achieved reimburse-ment within 3 years. However, skepticism as to whether this trend will continue generates manufacturer concerns about profitability and uptake in the market at launch for innovative therapies. Manufacturers can neither apply nor petition for listing on the NRDL, but instead government committees determine which products will be reviewed. Driving volume and stakeholder awareness of an innova-tive therapy are the primary ways to gain attention which, in turn, could encourage the committees to consider or recommend an innovative therapy for review earlier than less publicized products.
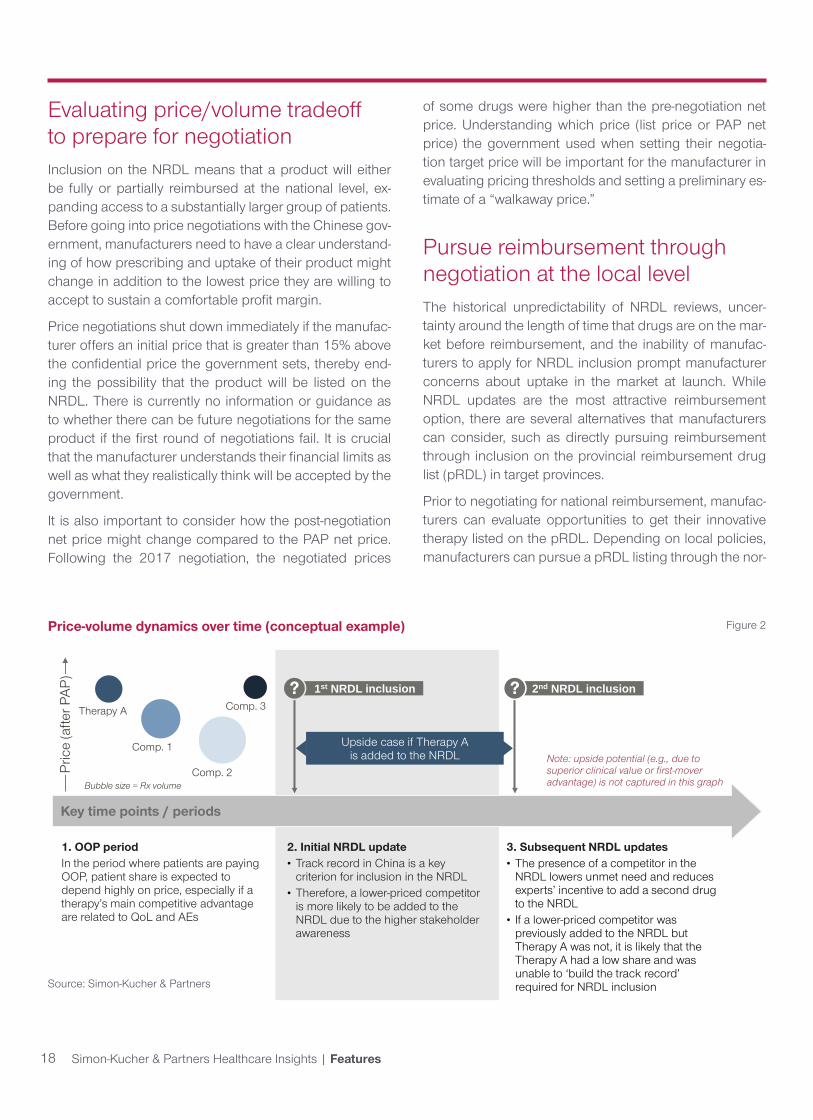
Manufacturers must consider not only their efforts to drive uptake and stakeholder awareness, but also the presence of competitors. The existence of competitor therapies is
particularly important during the period when patients are paying OOP, as shown in Figure 2. Lower-priced competi-tor products with clinical efficacy that is equivalent to the higher-priced Therapy A are likely to have higher uptake and, thereby, higher awareness. Moreover, first movers can potentially take substantial volume with achievable price, meaning the late-comer drugs might be faced with a big hurdle in breaking into the market. This poses a chal-lenge to the manufacturer since primary considerations when selecting products to include in the NRDL are track record and volume. Lower-priced competitors are likely to have a more-established track record and higher volume, barring any differences in efficacy. Therefore, manufac-turers should fully develop not only their launch pricing strategy but they should also consider how they will react if competitors also launch in the space. If a manufacturer is prepared to react to changes in the competitive land-scape, they may be able to preserve their chance at a list-ing on the NRDL.
18 Simon-Kucher & Partners Healthcare Insights | Features
1st NRDL inclusion
1. OOP periodIn the period where patients are payingOOP, patient share is expected todepend highly on price, especially if atherapy’s main competitive advantageare related to QoL and AEs
Key time points / periods
Note: upside potential (e.g., due to superior clinical value or first-mover advantage) is not captured in this graph
Therapy A
Comp. 1
Comp. 2
Comp. 3
Bubble size = Rx volume
Pric
e (a
fter P
AP)
2. Initial NRDL update• Track record in China is a key
criterion for inclusion in the NRDL • Therefore, a lower-priced competitor
is more likely to be added to theNRDL due to the higher stakeholderawareness
3. Subsequent NRDL updates• The presence of a competitor in the
NRDL lowers unmet need and reducesexperts’ incentive to add a second drugto the NRDL
• If a lower-priced competitor waspreviously added to the NRDL butTherapy A was not, it is likely that theTherapy A had a low share and wasunable to ‘build the track record’required for NRDL inclusion
? 2nd NRDL inclusion?
Upside case if Therapy Ais added to the NRDL
Evaluating price/volume tradeoff to prepare for negotiationInclusion on the NRDL means that a product will either be fully or partially reimbursed at the national level, ex-panding access to a substantially larger group of patients. Before going into price negotiations with the Chinese gov-ernment, manufacturers need to have a clear understand-ing of how prescribing and uptake of their product might change in addition to the lowest price they are willing to accept to sustain a comfortable profit margin.
Price negotiations shut down immediately if the manufac-turer offers an initial price that is greater than 15% above the confidential price the government sets, thereby end-ing the possibility that the product will be listed on the NRDL. There is currently no information or guidance as to whether there can be future negotiations for the same product if the first round of negotiations fail. It is crucial that the manufacturer understands their financial limits as well as what they realistically think will be accepted by the government.
It is also important to consider how the post-negotiation net price might change compared to the PAP net price. Following the 2017 negotiation, the negotiated prices
of some drugs were higher than the pre-negotiation net price. Understanding which price (list price or PAP net price) the government used when setting their negotia-tion target price will be important for the manufacturer in evaluating pricing thresholds and setting a preliminary es-timate of a “walkaway price.”
Pursue reimbursement through negotiation at the local levelThe historical unpredictability of NRDL reviews, uncer-tainty around the length of time that drugs are on the mar-ket before reimbursement, and the inability of manufac-turers to apply for NRDL inclusion prompt manufacturer concerns about uptake in the market at launch. While NRDL updates are the most attractive reimbursement option, there are several alternatives that manufacturers can consider, such as directly pursuing reimbursement through inclusion on the provincial reimbursement drug list (pRDL) in target provinces.
Prior to negotiating for national reimbursement, manufac-turers can evaluate opportunities to get their innovative therapy listed on the pRDL. Depending on local policies, manufacturers can pursue a pRDL listing through the nor-
Source: Simon-Kucher & Partners
Price-volume dynamics over time (conceptual example) Figure 2
19 Simon-Kucher & Partners Healthcare Insights | Features
mal inclusion process or through negotiations. This would help the manufacturer drive awareness, achieve higher reimbursement, and access more patients. Manufactur-ers can strategically choose which provinces they would try to achieve a pRDL listing in to achieve optimal patient and provider awareness as well as uptake. This height-ened provincial awareness and uptake could drive greater knowledge of the therapy at the national level as well.
The Chinese government has been working to provide better and more affordable healthcare services to Chi-nese patients for over a decade, and the 2017 NRDL ne-gotiation is only part of this effort to expand access to healthcare and innovative therapies. The opportunities for Western manufacturers to be involved in the Chinese market are growing, and the increased clarity around re-imbursement negotiations from the 2017 NRDL update will enable manufacturers to be better-prepared when launching therapies in the Chinese market and entering reimbursement negotiations.
Potential for China launches to change pricing dynamics in AsiaDue to data requirements, launches in China have histori-cally occurred after launches in other major markets such as Korea, Taiwan and Australia as well as the US and Eu-rope. These products were also infrequently added to the NRDL. However, with recent changes to the CFDA approv-al and a robust domestic market of innovative drug devel-opment, it is likely that first-launches in China and more frequent NRDL inclusions will be a reality. Since NRDL ne-gotiations are public, neighboring countries which do not currently price reference China may in fact look to negotia-tions in China as part of their domestic reimbursement ap-proval process. In addition, manufacturers must balance the potential volume tradeoff in China: negotiating lower prices in China with reimbursement to unlock higher vol-umes may offset higher prices and smaller volumes across Asia. Additionally, the decision to seek reimbursement in China may have higher stakes. Manufacturers must care-fully consider two questions. First, can they afford to not offer a meaningful price cut to be on the NRDL and con-tinue competing against NRDL-added competitors as a self-pay drug with a PAP? If they enter negotiations and an agreement cannot be made, when would the manufac-turer have the chance to negotiate again? ▵
Special thanks to Dr. Fangting Yu for providing additional insights and expertise throughout the development of this article, and also thanks to Madhurima Das, Adrien Gaussen, Kendra Jin and Jayme Leong for helping with data collection and analysis.
For correspondence related to this article, please contact Steve Rosen at [email protected].
Manufacturers must balance the potential
volume tradeoff in China: negotiating
lower prices in China with reimbursement to unlock higher volumes
may offset higher prices and smaller
volumes across Asia
“
“
20 Simon-Kucher & Partners Healthcare Insights | Features
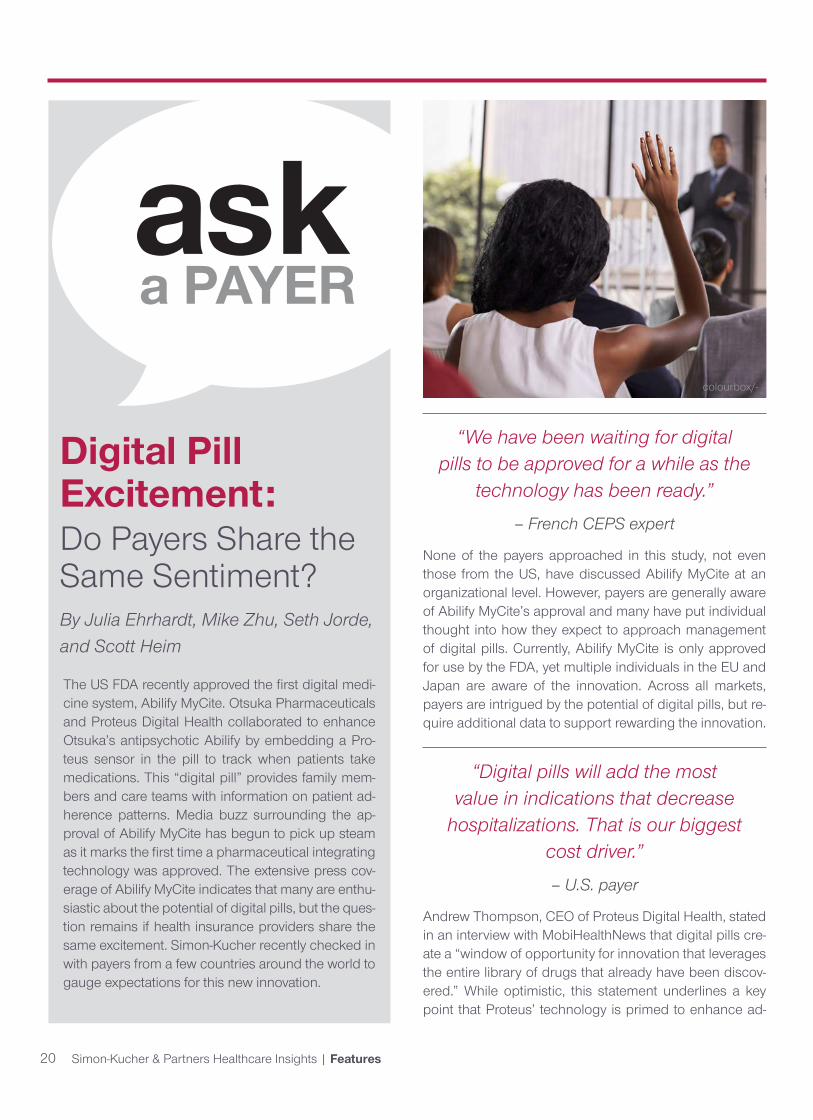
ask a PAYER
“We have been waiting for digital pills to be approved for a while as the
technology has been ready.”– French CEPS expert
None of the payers approached in this study, not even those from the US, have discussed Abilify MyCite at an organizational level. However, payers are generally aware of Abilify MyCite’s approval and many have put individual thought into how they expect to approach management of digital pills. Currently, Abilify MyCite is only approved for use by the FDA, yet multiple individuals in the EU and Japan are aware of the innovation. Across all markets, payers are intrigued by the potential of digital pills, but re-quire additional data to support rewarding the innovation.
“Digital pills will add the most value in indications that decrease
hospitalizations. That is our biggest cost driver.” – U.S. payer
Andrew Thompson, CEO of Proteus Digital Health, stated in an interview with MobiHealthNews that digital pills cre-ate a “window of opportunity for innovation that leverages the entire library of drugs that already have been discov-ered.” While optimistic, this statement underlines a key point that Proteus’ technology is primed to enhance ad-
Digital Pill Excitement:Do Payers Share the Same Sentiment?By Julia Ehrhardt, Mike Zhu, Seth Jorde, and Scott Heim
The US FDA recently approved the first digital medi-cine system, Abilify MyCite. Otsuka Pharmaceuticals and Proteus Digital Health collaborated to enhance Otsuka’s antipsychotic Abilify by embedding a Pro-teus sensor in the pill to track when patients take medications. This “digital pill” provides family mem-bers and care teams with information on patient ad-herence patterns. Media buzz surrounding the ap-proval of Abilify MyCite has begun to pick up steam as it marks the first time a pharmaceutical integrating technology was approved. The extensive press cov-erage of Abilify MyCite indicates that many are enthu-siastic about the potential of digital pills, but the ques-tion remains if health insurance providers share the same excitement. Simon-Kucher recently checked in with payers from a few countries around the world to gauge expectations for this new innovation.
colourbox/-

21 Simon-Kucher & Partners Healthcare Insights | Features
herence for existing drugs across a wide range of indica-tions. When probed for which indications payers believe digital pills could provide the greatest impact, payers com-monly stated both diabetes and transplant immunology.
Drugs for these indications have two characteristics in common. First, they require regular usage, often multiple times per day, to be effective. Second, when patients miss doses, they frequently end up in the hospital ER, or even the ICU. Thus, it is clear that digital pills will derive their highest value in indications where adherence is para-mount, and where the consequences of non-adherence are most dire.
“Will it matter if someone takes Abilify MyCite for one year and they have
improved adherence? I also want to see the clinical or economic benefit of that
improvement.” – U.S. payer
Intuitively, digital pills appear to be an obvious benefit to payers. According to a review in the Annals of Internal Medicine, medication non-adherence results in $100-$289 billion in additional annual cost to the U.S. health-care system. However, payers require clear evidence demonstrating the benefits of digital pills in order to re-ward the innovation. For a subset of payers, a significant adherence improvement is enough to demonstrate value.
This may prove difficult to achieve in a clinical trial set-ting, where adherence rates tend to be much higher than in the real world. That said, for most payers adherence improvement is not enough to reward digital pills since they question whether adherence improvement translates into improved outcomes — which is what they really care about. Instead, these payers require an improvement in clinical outcomes (e.g., reduction in cardiac events) or a reduction in healthcare resource utilization (e.g., reduc-tion in hospitalizations).
In the case of Abilify MyCite, this could mean reduced hospitalizations or fewer ICU stays. These data require-ments are not easy to satisfy and may limit the reimburse-ment potential for digital pills.
“Digital pills can clearly be used in the context of performance-based
contracting or risk-sharing contracts.” – French CEPS expert
Given these burdensome requirements from payers, there may be an opportunity to demonstrate the value of digital pills through innovative contracting. Continued ad-vancements in data collection have given these contracts a bit of a renaissance in payers’ eyes. Payers expressed a willingness to engage in innovative contracts tied to ad-herence (for those who find adherence to be enough) or
Freq
uenc
y of
men
tion
by in
dica
tion
Diabetes
Transplantimmunology
Epilepsy
High cholesterol
Hypertension
Digital pill evidence requirements(% of payers)
27%
73%
Adherence
Clinical outcomes/health care resourceutilization

22 Simon-Kucher & Partners Healthcare Insights | Features
clinical outcomes/healthcare resource utilization. In such a contract, digital pills could likely achieve a price premi-um over non-digitally enabled drugs in its class. However, the manufacturer would owe a rebate to payers should the product fail to meet defined endpoints.
“If [digital pills] improved outcomes or decreased other medical costs, we would embrace them. You would be
crazy not to.” – U.S. payer
Even if manufacturers are able to fulfill the significant data requirements asked for by payers, will payers follow through on their intention to reward these innovations? Companion diagnostics for high-cost therapies may serve as a relevant analog in attempting to answer this ques-tion. Clinical data supporting many of these products has enabled more targeted prescribing of these high cost therapies. Yet, not all payers have demonstrated a willing-ness to substantially reward companion diagnostics as they struggle to quantify the value of these innovations. Therefore, manufacturers should be skeptical of any pay-er promises to reward digital pills. Innovative contracting could be a solution to this dilemma by tying payers and manufacturers to contractual agreements that force each side to hold up their end of the bargain. ▵
For correspondence related to this article, please contact Julia Ehrhardt at [email protected].
Do you have any key BUSINESS QUESTIONSkeeping you up at night?
What about topics you and your colleagues just cannot agree on?
If you do, Simon-Kucher may have a solution:
ask a PAYER
We want to know what YOU want to knowWe want to get a glimpse into what PAYERS are thinking
Please respond to [email protected] with any questions that you want answered but don’t have the time, resources or connections to ask yourself.
Simon-Kucher will select 1-2 questions to investigate with our payer panel and the next iteration of our pub-lication, Healthcare Insights, will bring the answers straight to your inbox.

23 Simon-Kucher & Partners Healthcare Insights | Features
What Sales Champions Do Differently4 Key Success Factors By David Lee, Sophie Wong, Kristina Johnson
Even after years of overall prosperity for Pharma, Biotech, and MedTech companies, the bar is continuously being raised for what it means to be “successful” in these industries. As revenue targets rise year after year, it becomes increasingly difficult to continue achieving success in such a competitive environment. This begs the question: What are successful companies doing?
colourbox.com/Ivelin Radkov

24 Simon-Kucher & Partners Healthcare Insights | Features
We surveyed a sample of 200 senior life science sales executives from a breadth of pharmaceutical, biotech, and medical technology companies across the US and EU (Figure 1). The healthcare companies covered a span of thera-peutic areas ranging from oncology to dermatology, and medical technologies from in-vitro technologies to hospital supplies (Figure 2). We characterized the Sales Champions, those who hit their revenue targets last year, and identi-fied what they did that led to success.
Figure 1: Demographics
Figure 2: Subsector/therapeutic area breakdown
Medical technology
Single use devices 16%
Active implantable devices 12%
Anesthetic and respiratory devices 12%
Reusable instruments 12%
Electromechanical medical equipment 11%
Diagnostic and therapeutic radiation technology 9%
Non-active implantable devices 9%
In-vitro diagnostics 5%
Ophthalmic and optical technology 5%
Technical aids for the disabled 5%
Hospital hardware 2%
Dental technology 2%
Pharmaceutical / Biotech
Oncology 21%
Infectious diseases 18%
Immunology 18%
Cardiology 11%
Respiratory 10%
Neuroscience 7%
Dermatology 7%
Opthalmology 5%
Hematology 2%
Cell therapy 1%
Title % of respondentsBusiness Unit Head
Regional Sales Manager1
VP of Sales
CEO
Country Sales ManagerCountry General Manager(with sales responsibility)
43%22%
17%9%
6%3%
10%
Covering key stakeholderswith sales responsibility
<$100M
Company annual revenue (USD)
45% 45%
$1B or above$100M-$999M
Equal representation oflife science industries
Geographical representationfrom US and EU5
50%
Medical Technology companies100
USA
UKSpainFranceGermanyItaly
Pharmaceutical/Biotech companies100
10%each

25 Simon-Kucher & Partners Healthcare Insights | Features
Key questionsWhat differentiates a Sales Champion from the rest of the pack? We explored the following key questions to identify and prioritize the most important factors that drive year-over-year sales growth.
• What opportunities do companies who are reaching and exceeding their revenue targets prioritize?
• Which challenges do they care about (Figure 3)?• Where do they spend their time and resources? Four notable areas offer the most opportunity for other companies to improve performance and company phi-losophy to realize greater sales growth: Focusing on key market trends, prioritizing high-value customers, optimiz-ing sales rep time, and investing in customer retention.
Figure 3: Companies that hit annual revenue targets face different challenges than those that do not
A successful launch depends heavily on an effective stakeholder engagement strategy
“ “
Challenge Performance Rating
Prioritizing customer segments
Aligning territories and allocating resources
Selling products to new and existing customers
Maintaining customers over time
Fully realizing potential of existing customers
Adjusting territory allocation to secure further market potential
Investment in new growth markets / opportunities
Focusing resources on high growth products / markets
Balancing sales representative time between selling and non-selling activities
3 4 5 6 7Poorly
Performance
Company hit annual revenue target in 2016: Neutral Slightly well Well Excellent
Did NOT hit targetHit target
26 Simon-Kucher & Partners Healthcare Insights | Features
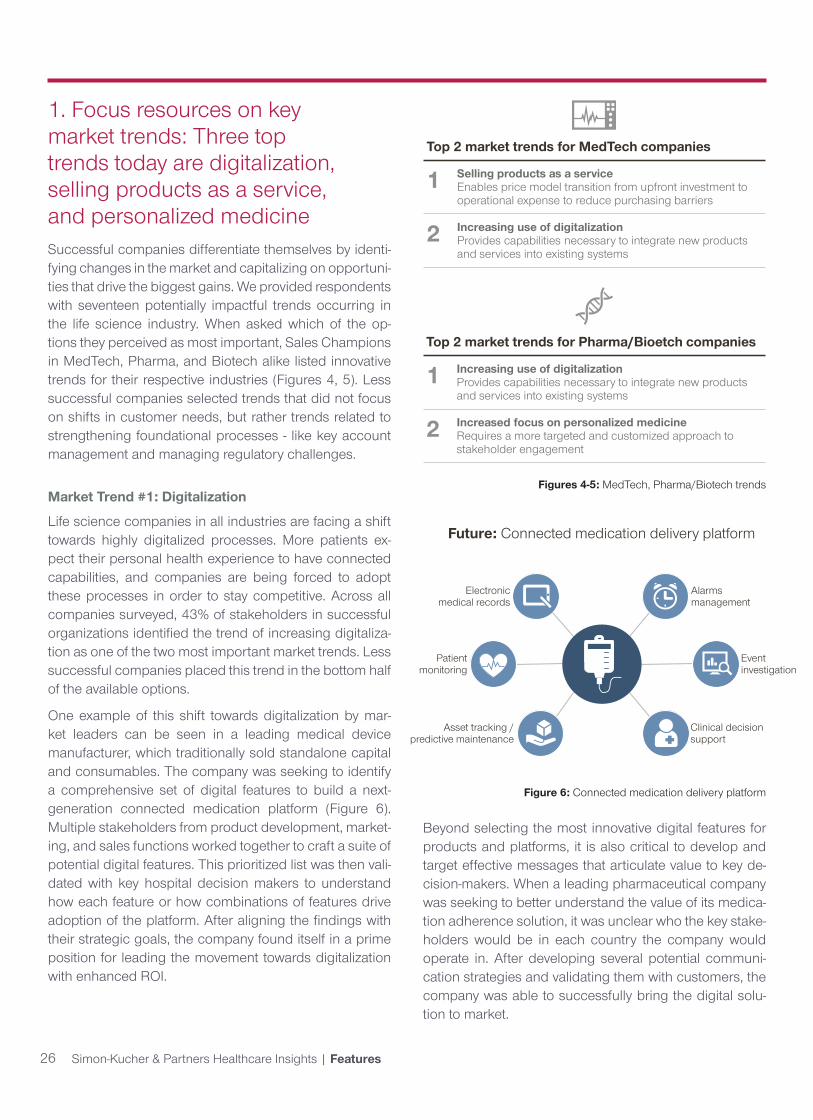
1. Focus resources on key market trends: Three top trends today are digitalization, selling products as a service, and personalized medicine Successful companies differentiate themselves by identi-fying changes in the market and capitalizing on opportuni-ties that drive the biggest gains. We provided respondents with seventeen potentially impactful trends occurring in the life science industry. When asked which of the op-tions they perceived as most important, Sales Champions in MedTech, Pharma, and Biotech alike listed innovative trends for their respective industries (Figures 4, 5). Less successful companies selected trends that did not focus on shifts in customer needs, but rather trends related to strengthening foundational processes - like key account management and managing regulatory challenges.
Market Trend #1: Digitalization
Life science companies in all industries are facing a shift towards highly digitalized processes. More patients ex-pect their personal health experience to have connected capabilities, and companies are being forced to adopt these processes in order to stay competitive. Across all companies surveyed, 43% of stakeholders in successful organizations identified the trend of increasing digitaliza-tion as one of the two most important market trends. Less successful companies placed this trend in the bottom half of the available options.
One example of this shift towards digitalization by mar-ket leaders can be seen in a leading medical device manufacturer, which traditionally sold standalone capital and consumables. The company was seeking to identify a comprehensive set of digital features to build a next-generation connected medication platform (Figure 6). Multiple stakeholders from product development, market-ing, and sales functions worked together to craft a suite of potential digital features. This prioritized list was then vali-dated with key hospital decision makers to understand how each feature or how combinations of features drive adoption of the platform. After aligning the findings with their strategic goals, the company found itself in a prime position for leading the movement towards digitalization with enhanced ROI.
Figures 4-5: MedTech, Pharma/Biotech trends
Figure 6: Connected medication delivery platform
Beyond selecting the most innovative digital features for products and platforms, it is also critical to develop and target effective messages that articulate value to key de-cision-makers. When a leading pharmaceutical company was seeking to better understand the value of its medica-tion adherence solution, it was unclear who the key stake-holders would be in each country the company would operate in. After developing several potential communi-cation strategies and validating them with customers, the company was able to successfully bring the digital solu-tion to market.
Top 2 market trends for MedTech companies
1 Selling products as a serviceEnables price model transition from upfront investment to operational expense to reduce purchasing barriers
2 Increasing use of digitalizationProvides capabilities necessary to integrate new products and services into existing systems
Top 2 market trends for Pharma/Bioetch companies
1 Increasing use of digitalizationProvides capabilities necessary to integrate new products and services into existing systems
2 Increased focus on personalized medicineRequires a more targeted and customized approach to stakeholder engagement
Asset tracking /predictive maintenance
Electronicmedical records
Future: Connected medication delivery platform
Patientmonitoring
Clinical decisionsupport
Alarms management
Event investigation

27 Simon-Kucher & Partners Healthcare Insights | Features
Market Trend #2: Selling products as a service (or solution selling)
One strong pressure felt specifically by many medical technology companies is the need to sell products as a service or solution selling. In addition to using solution selling as a way to escape price wars, sales leaders report an increased focus on health economics, creating a need for outcomes-based contracting with MedTech providers (Figure 7). For successful MedTech companies, this is even more fundamental as a market trend than digitaliza-tion. 46% of successful MedTech companies consider in-corporating solution selling into their business and sales models as a top trend. The transition to solution selling is viewed as an important opportunity to create value for customers. It enables price model transition from upfront investment to operational expense, reducing purchasing barriers.
Examples of solution selling are often seen in companies that offer both capital and consumables. One laboratory diagnostics company had challenges with selling analyz-ers that required an upfront capital investment, offering separate service contracts and pricing reagents without a direct link to quality of outcomes. The company devel-oped a strategy for performance-based contracting and pricing focused on reportable results delivered within a pre-defined turn-around time. With this new outcomes-based agreement, customers were more willing to adopt
Figure 7: Increased focus on health economics is creating a need for outcomes based contracting in solution selling
the platform because they felt protected against potential risks (e.g., quality, etc.) and that the total cost of owner-ship decreased due to the shift from high capital costs to direct costs.
Market Trend #3: Personalized medicine
For Pharma and Biotech, the leading trend is personal-ized medicine. Disease manifestation is varied, so treat-ment approaches should be, as well. Successful Pharma and Biotech companies agree that this is one of the top 2 trends that demands attention and investment, second only to increasing digitalization.
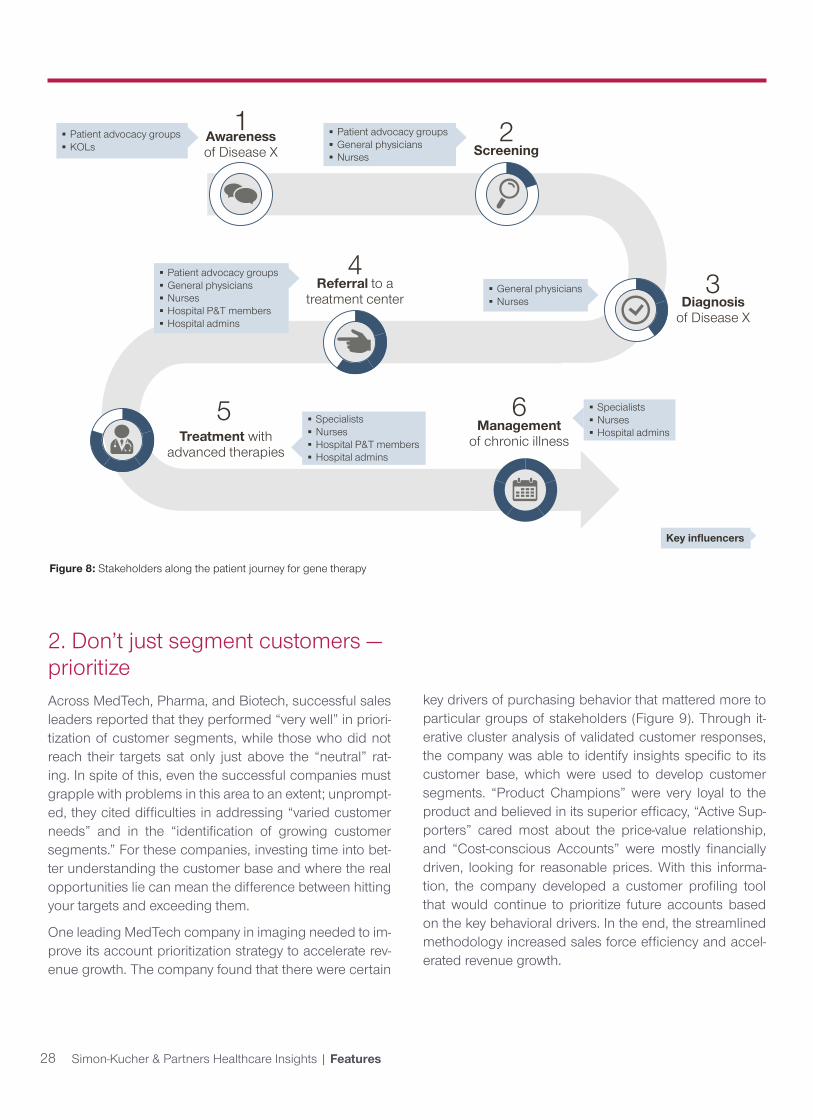
Within personalized medicine, gene therapy has been a rapidly growing space. As much as gene therapy is a customized solution for patients, companies should also think about a customized approach for engaging key stakeholders along the patient journey. A successful launch depends heavily on an effective stakeholder en-gagement strategy (Figure 8). The patient journey begins with disease awareness and continues through the stages of screening, diagnosis, referrals, treatment, and manage-ment. For example, one rapidly growing biotech company invested in developing a sales approach designed to tar-get each of the stakeholders along the patient journey. The company knew that without awareness and support along the entire chain, the product would not be able to achieve broad adoption.
54%Yes
46%No
26%
46%
28%
Moderate
Strong
Weak
Do you perceive increased focus on health economics & cost effectiveness as an opportunity?
Opportunity
? Are value claims supported by outcome based contracting and risk sharing important for solution selling? ?
83%Yes
17%No
11%
41%
48%
Somewhat
Very
Slightly
Important
28 Simon-Kucher & Partners Healthcare Insights | Features
Figure 8: Stakeholders along the patient journey for gene therapy
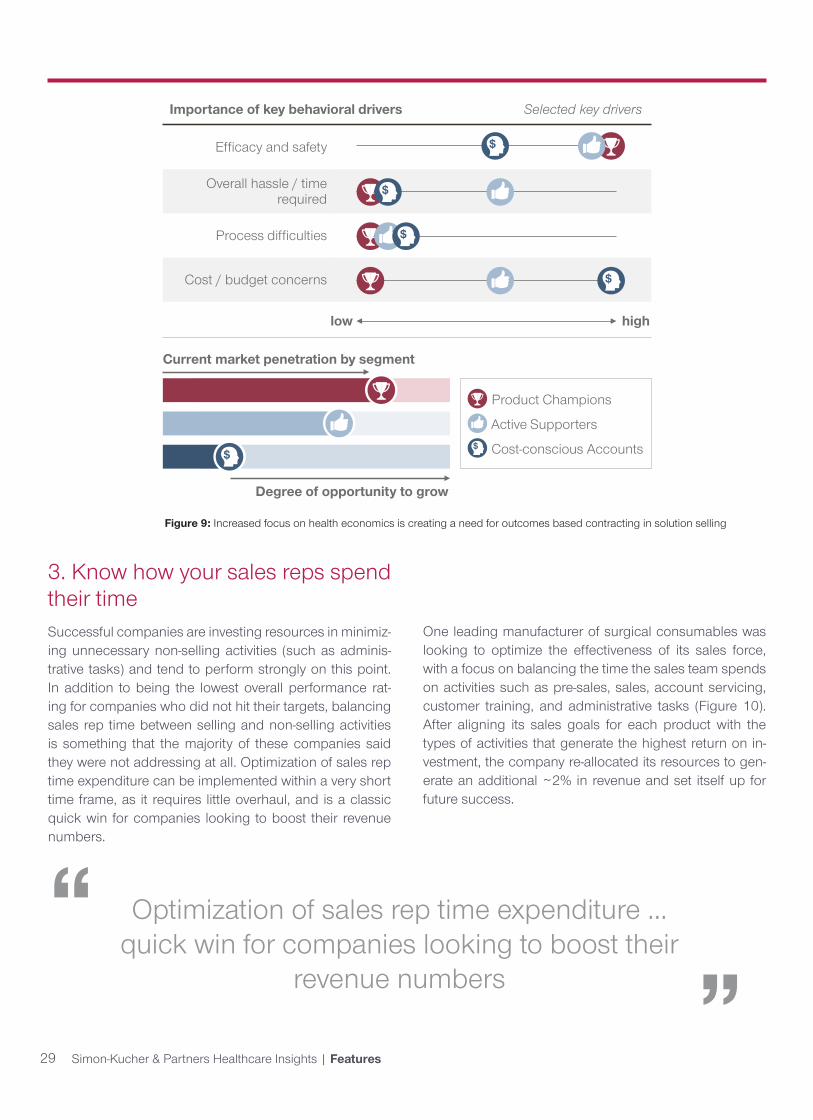
2. Don’t just segment customers —prioritizeAcross MedTech, Pharma, and Biotech, successful sales leaders reported that they performed “very well” in priori-tization of customer segments, while those who did not reach their targets sat only just above the “neutral” rat-ing. In spite of this, even the successful companies must grapple with problems in this area to an extent; unprompt-ed, they cited difficulties in addressing “varied customer needs” and in the “identification of growing customer segments.” For these companies, investing time into bet-ter understanding the customer base and where the real opportunities lie can mean the difference between hitting your targets and exceeding them.
One leading MedTech company in imaging needed to im-prove its account prioritization strategy to accelerate rev-enue growth. The company found that there were certain
key drivers of purchasing behavior that mattered more to particular groups of stakeholders (Figure 9). Through it-erative cluster analysis of validated customer responses, the company was able to identify insights specific to its customer base, which were used to develop customer segments. “Product Champions” were very loyal to the product and believed in its superior efficacy, “Active Sup-porters” cared most about the price-value relationship, and “Cost-conscious Accounts” were mostly financially driven, looking for reasonable prices. With this informa-tion, the company developed a customer profiling tool that would continue to prioritize future accounts based on the key behavioral drivers. In the end, the streamlined methodology increased sales force efficiency and accel-erated revenue growth.
Screening
Referral to a treatment center
Treatment with advanced therapies
Diagnosisof Disease X
Awareness of Disease X
1 2
34
5
Patient advocacy groups KOLs
Patient advocacy groups General physicians Nurses
General physicians Nurses
Patient advocacy groups General physicians Nurses Hospital P&T members Hospital admins
Specialists Nurses Hospital P&T members Hospital admins
Specialists Nurses Hospital admins
Key influencers
Managementof chronic illness
6
29 Simon-Kucher & Partners Healthcare Insights | Features
Figure 9: Increased focus on health economics is creating a need for outcomes based contracting in solution selling
Importance of key behavioral drivers
Efficacy and safety
Overall hassle / time required
Process difficulties
Cost / budget concerns
low high
$
$
$
$
Product Champions
Active Supporters
Cost-conscious Accounts$
Current market penetration by segment
Degree of opportunity to grow
$
Selected key drivers
3. Know how your sales reps spend their timeSuccessful companies are investing resources in minimiz-ing unnecessary non-selling activities (such as adminis-trative tasks) and tend to perform strongly on this point. In addition to being the lowest overall performance rat-ing for companies who did not hit their targets, balancing sales rep time between selling and non-selling activities is something that the majority of these companies said they were not addressing at all. Optimization of sales rep time expenditure can be implemented within a very short time frame, as it requires little overhaul, and is a classic quick win for companies looking to boost their revenue numbers.
Optimization of sales rep time expenditure ... quick win for companies looking to boost their
revenue numbers
“ “
One leading manufacturer of surgical consumables was looking to optimize the effectiveness of its sales force, with a focus on balancing the time the sales team spends on activities such as pre-sales, sales, account servicing, customer training, and administrative tasks (Figure 10). After aligning its sales goals for each product with the types of activities that generate the highest return on in-vestment, the company re-allocated its resources to gen-erate an additional ~2% in revenue and set itself up for future success.

30 Simon-Kucher & Partners Healthcare Insights | Features
Figure 10: Balancing selling time
Pre sales Sales Account servicing
Customer training Other Avg time
per product
Product 1 4% 7% 7% 3% 1% 22%
Product 2 3% 5% 7% 2% <1% 18%
Product 3 1% 3% 7% 1% 1% 14%
Product 4 3% 4% 3% 3% <1% 13%
Product 5 3% 4% 3% 2% <1% 12%
Product 6 1% 1% 5% 1% <1% 9%
Product 7 1% 2% 2% 1% <1% 7%
Product 8 1% 1% 1% 1% <1% 5%
Avg time per activity
17% 30% 35% 14% 4%
moderate heavylight
Workload assessment keyExample: Product 5 workload is considered too high across activities
Sales rep activities
Prod
ucts
For Pharma and Biotech, leading manufacturers typically have sales teams focused on one product for one or two indications, depending on the size of the market and the nature of its dynamics. Here, the important criterion to evaluate is the effectiveness of each stakeholder call (Fig-ure 11). The sales team may be detailing physicians, pur-chasing admins, and/or KOLs, and it is critical to spend time effectively in terms of quantity and duration of calls. One example is from a leading pharmaceutical company facing increasing competition. Its blockbuster drug had
enjoyed clinical and financial success since its release, but it was beginning to compete with a new wave of treat-ments that endangered its market position. Along with ter-ritory realignment and redefining roles and responsibili-ties of the sales team, the company reallocated resources based on the optimal number of calls that would activate a customer. Moreover, customers were prioritized such that the selling time could be tailored to each stakeholder to maximize returns.

31 Simon-Kucher & Partners Healthcare Insights | Features
Figure 11: Balancing selling time
4. Invest in customer retention, not just acquisition Successful companies invest in retention of customers, and thus they are able to capitalize on much more of their customers’ lifetime value down the line. Unprompted, the most commonly cited challenge for companies that did not hit their annual targets was maintaining custom-ers over time. Customer retention received the second lowest overall performance rating for these respondents compared with performance on other sales challenges. Regardless of how well sales reps can acquire new cus-tomers, if a steady flow of existing customers continues to defect to competitors, the net amount of customers will stagnate or even decline.
To successfully maintain customers over time, companies must invest in understanding their customers and closely monitor any changes in behavior or perception that might occur. One MedTech service provider developed a cus-tomer segmentation and retention strategy that ensured there were targeted approaches for each prioritized seg-ment. Then, marketing and sales budgets were allocat-ed such that more valuable customers received more resources. This comprehensive methodology reduced churn rates by ~28%.
0
5
10
15
20
25
30
35
40
45
50
0 5 10 15 20 25 30 35 40
MRO
I
Calls per physician per year
MROI = Revenue return / cost per call
Sales response curves for segments A and B
Segment A
Segment B
Calls to segment A yield more revenue return than to segment B Different segments
require different call activity so the call plan should always be tailored to the segment
Return from making additional calls diminishes
For correspondence related to this article, please contact David Lee at [email protected].
A leading Pharma manufacturer with a blockbuster drug aimed to minimize disruption of its customer relationships while ensuring team efficiency and maximum revenue growth. After running a number of potential scenarios, the company ultimately used an innovative territory alignment and resource allocation methodology that protected these key accounts while exceeding growth targets by ~5%.
Future outlookOverall, Sales Champions continue to achieve revenue targets year over year by: (1) Focusing on key market trends, like digitalization, solution selling, and personal-ized medicine, (2) Prioritizing customers and not just seg-menting them, (3) Keeping track of how sales reps spend their time, and (4) Investing in customer retention. Taking a page out of the Sales Champion playbook may give you the edge you need in 2018 and beyond. ▵
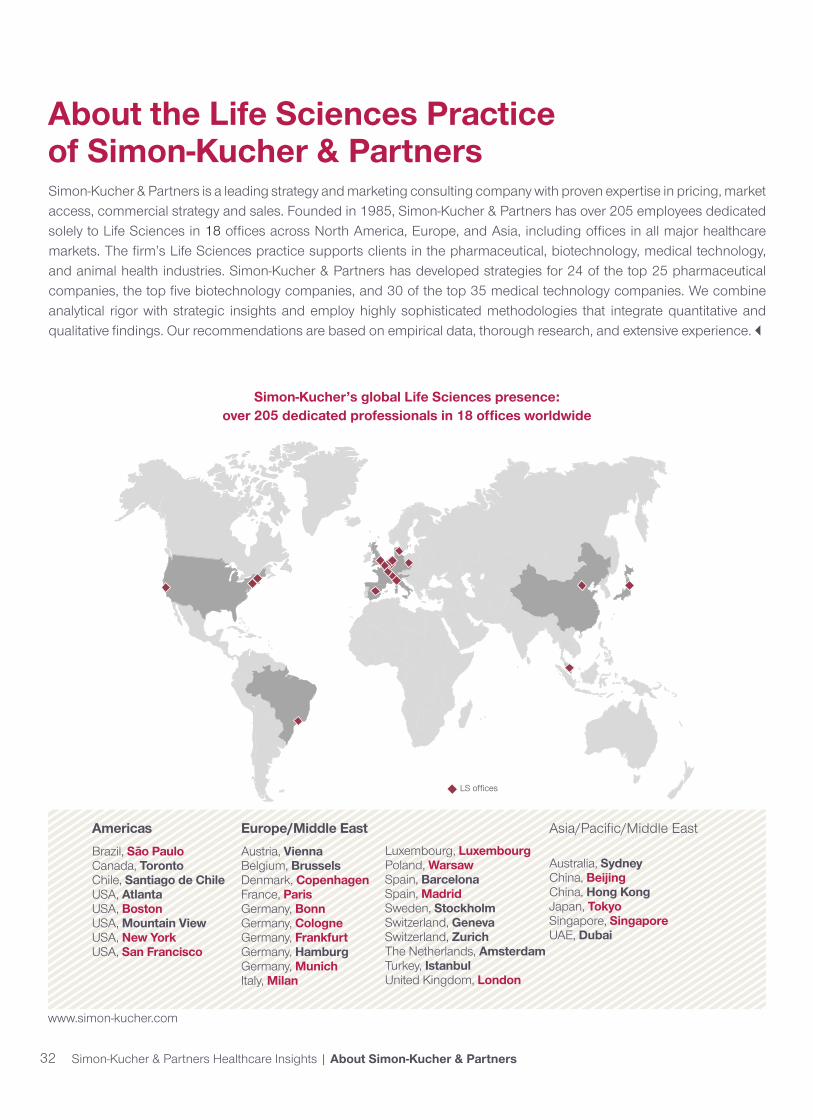
32 Simon-Kucher & Partners Healthcare Insights | About Simon-Kucher & Partners
Simon-Kucher’s global Life Sciences presence: over 205 dedicated professionals in 18 offices worldwide
About the Life Sciences Practice of Simon-Kucher & PartnersSimon-Kucher & Partners is a leading strategy and marketing consulting company with proven expertise in pricing, market access, commercial strategy and sales. Founded in 1985, Simon-Kucher & Partners has over 205 employees dedicated solely to Life Sciences in 18 offices across North America, Europe, and Asia, including offices in all major healthcare markets. The firm’s Life Sciences practice supports clients in the pharmaceutical, biotechnology, medical technology, and animal health industries. Simon-Kucher & Partners has developed strategies for 24 of the top 25 pharmaceutical companies, the top five biotechnology companies, and 30 of the top 35 medical technology companies. We combine analytical rigor with strategic insights and employ highly sophisticated methodologies that integrate quantitative and qualitative findings. Our recommendations are based on empirical data, thorough research, and extensive experience. ▵
LS offices
www.simon-kucher.com
AmericasBrazil, São PauloCanada, TorontoChile, Santiago de ChileUSA, AtlantaUSA, BostonUSA, Mountain ViewUSA, New YorkUSA, San Francisco
Europe/Middle EastAustria, ViennaBelgium, BrusselsDenmark, CopenhagenFrance, ParisGermany, BonnGermany, CologneGermany, FrankfurtGermany, HamburgGermany, MunichItaly, Milan
Luxembourg, LuxembourgPoland, WarsawSpain, BarcelonaSpain, MadridSweden, StockholmSwitzerland, GenevaSwitzerland, Zurich The Netherlands, AmsterdamTurkey, IstanbulUnited Kingdom, London
Asia/Pacific/Middle East
Australia, SydneyChina, BeijingChina, Hong KongJapan, TokyoSingapore, SingaporeUAE, Dubai