healthcare services & technology market update - march 2021
TRANSCRIPT

HEALTHCARE SERVICES & TECHNOLOGYMarket Update
March 2021

Healthcare Services & Technology Market Update
Healthcare Services & Technology Industry Practice
Page | 2
As of February 28, 2021.
Kojo AppentengManaging DirectorTechnology(630) [email protected]
Chip BierbaumManaging DirectorPharma Services(917) [email protected]
Todd HeglundManaging DirectorTechnology & Services(646) [email protected]
Jim HesburghManaging DirectorServices(917) [email protected]
Patrick KrauseManaging DirectorServices(415) [email protected]
The healthcare services and technology landscape is constantly shifting, drivenby changes in regulations, reimbursement, and advancements in technology.
Stifel’s Healthcare Services & Technology team works to stay abreast of thesechanges. Via years of experience, relationships, and recent mandates, our teamprovides thought leadership across a board range of healthcare sub-sectors,which is complemented by the firm’s comprehensive set of strategic and financialproducts.
Stifel’s Healthcare Services & Technology Team
Select Recent Transactions
Sector Coverage
M&AAdvisory
Equity Capital Raising
Debt CapitalRaising
FairnessOpinions
Restructuring Advisory
Product Offering
Labs Infusion Sites Physical Therapy Post-Acute Care
Alternate Site Autism General Psychology Mental Health Substance Abuse
Behavioral Health Healthcare Technology Data Analytics Digital Health Software/SaaS Tech-enabled Services
Managed Care PBMs TPAs Worker’s Compensation
Payor Services Clinical Trials Manufacturing Marketing Supply Chain
Pharma Services Physician Groups Dental Services Hospital-Based Multi-Site Veterinary Services

Healthcare Services & Technology Market Update
Notable Data Driving Market Dynamics
Page | 3
Source: Commonwealth Fund, December 2020, Baseline Week March 1-7.
Market Observations – Meaningful Pivot to Tele-Solutions During Pandemic
Tele-solutions were rapidly adopted during the onset of the pandemic, giving providers a new means to connect with patients as in-person visits dropped rapidly due to lock-down restrictions for non-life threatening patient care episodes
As the pandemic has dragged on, tele-consultants have leveled off in-terms of their overall percentage of patient encounters, but are still significantly higher than pre-pandemic levels speaking to an increased adoption of tele-solutions as a convenient way for patients to seek care
Among major specialties, behavioral health has shown a marked increase in the use of tele-solutions, which may point to a longer-term shift in how patients connect with their providers
Telemedicine Visits as a Percentage of Baseline
Virtual Patient Encounters as a Percentage of Total Encounters
0%
5%
10%
15%
20%
1 6 11 16 21 26 31 36 41 46 51 0% 20% 40% 60%
Behavioral health
Endocrinology
Neurology
Rheumatology
Gastroenterology
Anesthesiology
Pulmonology
Adult primary care
Pediatrics
Allergy/Immunology
Oncology
Urgent care
Cardiology
Urology
Physical medicine & rehab
Dermatology
Surgery
Obstetrics/Gynecology
Orthopedics
Otolaryngology
Podiatry
Ophthalmology
Week

Healthcare Services & Technology Market Update
Notable Data Driving Market Dynamics
Page | 4
Source: Commonwealth Fund, December 2020, Baseline Week March 1-7.
Market Observations – Meaningful Pivot to Tele-Solutions During Pandemic
Outpatient visits per week began to stabilize towards the end of 2020, despite an increase in COVID-19 cases during the winter months
This is in line with the pattern over the previous four years (blue line) indicating that the number of visits usually increases during winter months
Percentage Change in Visits by Specialty Against Baseline
Percentage Change in Patient Visits Against Baseline
(75%)
(50%)
(25%)
0%
25%
1 6 11 16 21 26 31 36 41 46 51
Typical-year trend 2020 Visits(30%) (20%) (10%) 0%
Rheumatology
Obstetrics/Gynecology
Adult Primary Care
Endocrinology
Oncology
Urology
Behavioral Health
Surgery
Orthopedics
Allergy/Immunology
Ophthalmology
Podiatry
Neurology
Gastroenterology
Cardiology
Dermatology
Physical Medicine & Rehab
Otolaryngology
Pulmonology
Pediatrics

Healthcare Services & Technology Market Update
Notable Events and Trends
Page | 5
Source: Bloomberg, FactSet, CapIQ, Mergermarket, Allied Market Research.
Healthcare Services News
COVID-19 Relief - The President signed into law a $1.9 trillion COVID-19 relief package with several provisions beneficial to insurers and providers. The package provides for a significant expansion to the Affordable Care Act (“ACA”), meaningfully extending coverage to Americans. It also includes funds aimed at addressing the healthcare needs of rural communities, and makes permanent the relaxation of some telehealth reimbursement policies. Notably, the bill does not provide relief on Medicare loans or extend the moratorium on Medicare sequestration
Telehealth claims were up 28x nationally in December, when compared with claims in pre-COVID-19 December 2019, with behavioral health conditions continuing as the top remote diagnosis for the month, a new analysis of privately billed medical claims shows
New Opportunities for Value-Based Care with HHS Finalization of Stark Law, Anti-Kickback Statute, and Civil Monetary Penalties Law Reforms - The Department of Health and Human Services (“HHS”), in collaboration with the Centers for Medicare & Medicaid Services (“CMS”) and the Office of the Inspector General (“OIG”), issued two final rules clarifying certain regulatory terms and adding and amending exceptions and safe harbors to accommodate “value” transactions under the Anti-Kickback Statute (“AKS”), the federal Physician Self-Referral Law (the “Stark Law”), and the Civil Monetary Penalties Law (the “CMP Law”)
Healthcare Technology News
Digital therapeutics market continues its outsized growth. Demand for global digital therapeutics is at an all-time high due to the increase in adoption of mobile technology and AI, with recent estimates by Allied Market Research suggesting a global TAM of $13.8B by 2027 up from $2.8B in 2019
Consolidation in payor technologies. Increasing consolidation as payor-focused technology companies look to leverage their own data and expertise to improve existing technologies, grow their own capabilities and expand reach into new markets and geographies tohelp drive better outcomes in the healthcare market
Healthcare software companies shifting to data analytics. COVID-19 has accelerated the need for predictive analytics across the healthcare landscape, resulting in the proliferation of analytics platforms designed to reveal paths of improvement in patient care quality, clinical data, diagnostics and business management

Healthcare Services & Technology Market Update
Notable Recent Deal Activity
Page | 6
Note: Enterprise Value (“EV”) defined as equity value plus debt less cash.Source: Company press releases, Bloomberg, FactSet, CapitalIQ, Mergermarket.
November 2020 – February 2021 Transaction Highlights
Date Target Acquiror Target Description Sector Deal Metrics
2/10/21 Provides pain management services in the specializing in treating acute and chronic pain HCS Not disclosed
2/09/21 Management Buyout Provides emergency medicine and hospitalist services HCS EV: $0.5B
2/08/21 Offers behavioral healthcare services HCS Not disclosed
2/01/21 A dental partnership organization, provides dental practice management services HCS EV: $1.0B
EV / LTM EBITDA : 10.0x
1/19/21 OB/GYN Group Provides health care services for women HCS Not disclosed
1/21/21 Provides healthcare solutions by utilizing portfolio of services, sensors, and software HCIT EV: $0.9B
EV / LTM Revenue : 7.0x
1/11/21 Provides ear, nose, and throat specialty care HCS Not disclosed
1/06/21 Develops and provides cloud-based software solutions for the senior care industry HCIT EV: $4.0B
EV / LTM Revenue : 10.0x
1/06/21 Provides data and analytics-driven solutions HCITEV: $13.8B
EV / LTM Revenue : 5.7xEV / LTM EBITDA: 15.1x

Healthcare Services & Technology Market Update
Notable Recent Deal Activity (cont.)
Page | 7
Note: Enterprise Value (“EV”) defined as equity value plus debt less cash.Source: Company press releases, Bloomberg, FactSet, CapitalIQ, Mergermarket.
November 2020 – February 2021 Transaction Highlights
Date Target Acquiror Target Description Sector Deal Metrics
1/05/21 Arlington ENT Associates Provides health care services for adults and children HCS Not disclosed
1/05/21 Virginia Dermatology and Skin Surgery Center
Provides dermatology and skin surgery services HCS Not disclosed
1/04/21 Provides healthcare management services in the United States HCS
EV: $3.2BEV / LTM Revenue : 0.4xEV / LTM EBITDA: 15.6x
12/22/20 Provides urgent care services HCS Not disclosed
12/17/20 Operates physical rehabilitation therapy centers HCS Not disclosed
12/10/20 Operates behavioral healthcare facilities HCS Not disclosed
11/18/20 Provides cost containment solutions HCITEV: $3.7B
EV / LTM Revenue : 5.4xEV / LTM EBITDA: 20.5x
11/12/20Provides remote cardiac monitoring, remote blood glucose monitoring, centralized core
laboratory servicesHCIT
EV: $2.9BEV / LTM Revenue : 6.7xEV / LTM EBITDA: 26.6x
Healthcare Services & Technology Market Update
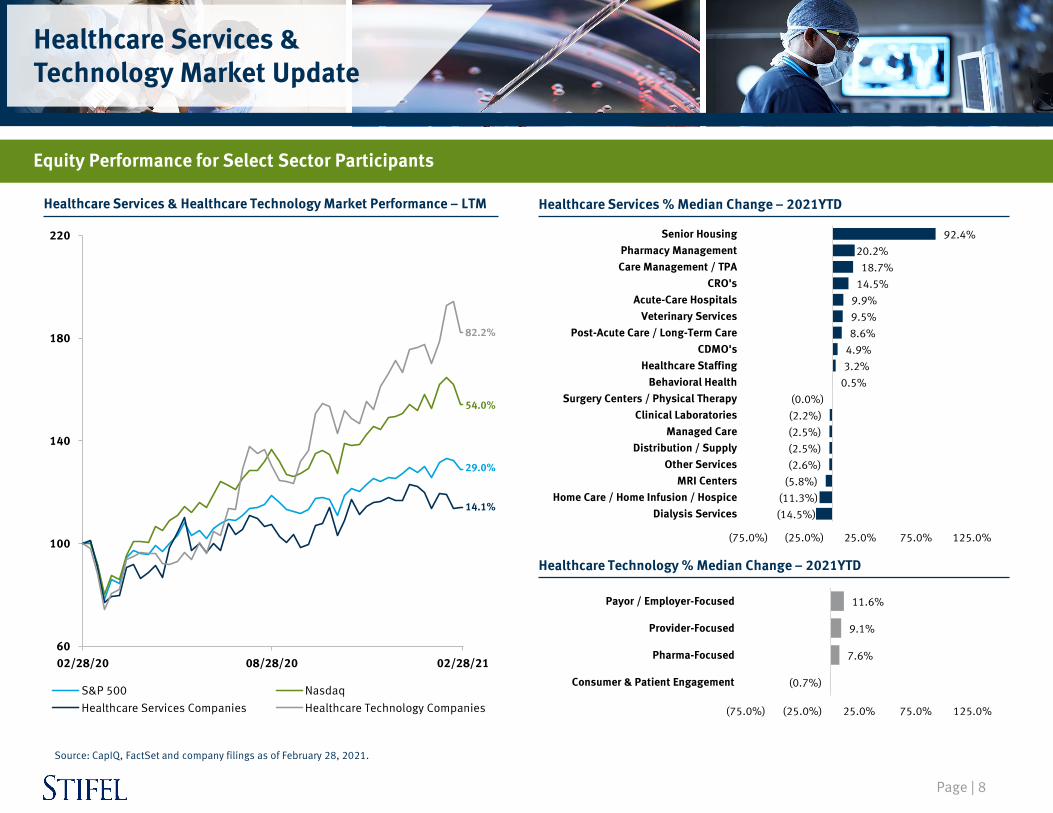
Equity Performance for Select Sector Participants
Page | 8
Healthcare Services % Median Change – 2021YTDHealthcare Services & Healthcare Technology Market Performance – LTM
Source: CapIQ, FactSet and company filings as of February 28, 2021.
Healthcare Technology % Median Change – 2021YTD
60
100
140
180
220
02/28/20 08/28/20 02/28/21
S&P 500 NasdaqHealthcare Services Companies Healthcare Technology Companies
(14.5%)(11.3%)
(5.8%)(2.6%)(2.5%)(2.5%)(2.2%)(0.0%)
0.5%3.2%4.9%8.6%9.5%9.9%14.5%18.7%
20.2%92.4%
(75.0%) (25.0%) 25.0% 75.0% 125.0%
Dialysis ServicesHome Care / Home Infusion / Hospice
MRI CentersOther Services
Distribution / SupplyManaged Care
Clinical LaboratoriesSurgery Centers / Physical Therapy
Behavioral HealthHealthcare Staffing
CDMO'sPost-Acute Care / Long-Term Care
Veterinary ServicesAcute-Care Hospitals
CRO'sCare Management / TPAPharmacy Management
Senior Housing
(0.7%)
7.6%
9.1%
11.6%
(75.0%) (25.0%) 25.0% 75.0% 125.0%
Consumer & Patient Engagement
Pharma-Focused
Provider-Focused
Payor / Employer-Focused
29.0%
54.0%
14.1%
82.2%
Healthcare Services & Technology Market Update
Page | 9
Healthcare Services 2021E Revenue GrowthHealthcare Services 2021E Revenue Multiples
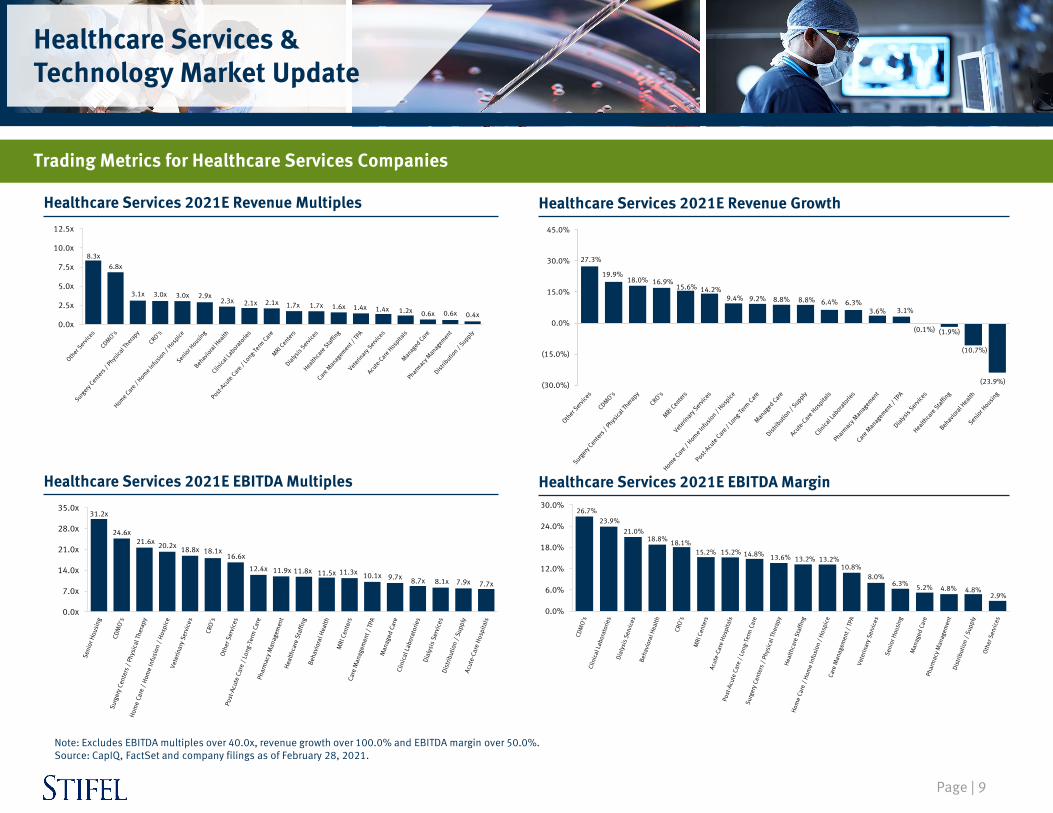
Note: Excludes EBITDA multiples over 40.0x, revenue growth over 100.0% and EBITDA margin over 50.0%.Source: CapIQ, FactSet and company filings as of February 28, 2021.
Healthcare Services 2021E EBITDA MarginHealthcare Services 2021E EBITDA Multiples
31.2x
24.6x21.6x 20.2x 18.8x 18.1x
16.6x
12.4x 11.9x 11.8x 11.5x 11.3x 10.1x 9.7x 8.7x 8.1x 7.9x 7.7x
0.0x
7.0x
14.0x
21.0x
28.0x
35.0x
8.3x6.8x
3.1x 3.0x 3.0x 2.9x2.3x 2.1x 2.1x 1.7x 1.7x 1.6x 1.4x 1.4x 1.2x 0.6x 0.6x 0.4x
0.0x
2.5x
5.0x
7.5x
10.0x
12.5x
27.3%
19.9%18.0% 16.9%
15.6% 14.2%9.4% 9.2% 8.8% 8.8% 6.4% 6.3%
3.6% 3.1%
(0.1%) (1.9%)
(10.7%)
(23.9%)(30.0%)
(15.0%)
0.0%
15.0%
30.0%
45.0%
26.7%23.9%
21.0%18.8% 18.1%
15.2% 15.2% 14.8% 13.6% 13.2% 13.2%10.8%
8.0%6.3% 5.2% 4.8% 4.8%
2.9%
0.0%
6.0%
12.0%
18.0%
24.0%
30.0%
Trading Metrics for Healthcare Services Companies

25.1%21.5%
9.4%7.8%
0.0%
10.0%
20.0%
30.0%
40.0%
50.0%
Consumer & PatientEngagement
Pharma-Focused Payor / Employer-Focused Provider-Focused
Healthcare Services & Technology Market Update
Page | 10
Healthcare Technology 2021E Revenue GrowthHealthcare Technology 2021E Revenue Multiples
Note: Excludes EBITDA multiples over 40.0x, revenue growth over 100.0% and EBITDA margin over 50.0%.Source: CapIQ, FactSet and company filings as of February 28, 2021.
Healthcare Technology 2021E EBITDA MarginHealthcare Technology 2021E EBITDA Multiples
17.5x 16.2x14.8x
11.7x
0.0x
5.0x
10.0x
15.0x
20.0x
25.0x
Pharma-Focused Payor / Employer-Focused
Consumer & PatientEngagement
Provider-Focused
19.0x
12.5x
7.8x
3.7x
0.0x
6.0x
12.0x
18.0x
24.0x
30.0x
Pharma-Focused Consumer & PatientEngagement
Payor / Employer-Focused Provider-Focused
28.1%
21.9%
17.3%
(7.2%)(10.0%)
0.0%
10.0%
20.0%
30.0%
40.0%
Payor / Employer-Focused
Pharma-Focused Provider-Focused Consumer & PatientEngagement
Trading Metrics for Healthcare Technology Companies

Disclosure
This presentation and the information contained herein is confidential and has been prepared exclusively for the benefit and internal use of the Stifel client to whom it is directly addressed and delivered (including such client’s subsidiaries, the “Company”). In connection with the preparation and provision of these materials, Stifel has relied upon and assumed, without independent investigation or verification, the accuracy and completeness of all financial and other information that was made available, supplied, or otherwise communicated to Stifel by or on behalf of the Company and other publicly available information, and Stifel expressly disclaims any responsibility for, or liability in connection with, such information or the Company’s use of these materials. Any analyses of any potential strategic alternatives or transactions that may be available to the Company reflected in these materials (and the other contents hereof) are preliminary and are subject to the assumptions and qualifications set forth herein, as well as further review and modification by Stifel. Any valuation ranges or other estimates are solely illustrative and do not purport to be valuation advice in respect of the Company or any other entity (including any potential counterparty to any strategic alternative or transaction) and should not be relied upon as such. Any such advice would only be provided pursuant to an engagement letter or other definitive written agreement entered into between the Company and Stifel. These materials are necessarily based upon economic, market, financial and other conditions as they exist on, and on the information made available to us as of, the date of these materials, and subsequent developments may affect the analyses (if any), information or other contents in these materials. These materials do not contain advice in any respect as to the legal, regulatory, tax or accounting consequences of any potential strategic alternatives or transactions on the Company or the Company’s shareholders, and it is the responsibility of such parties to obtain advice on such matters from other qualified professionals. It is understood that these materials are solely for the information of, and directed to, the Company and its Board of Directors in their evaluation of potential strategic alternatives or a transaction and are not to be viewed as definitive or to be relied upon by any shareholder of the Company or any other person or entity. These materials are not intended to, and do not, constitute a valuation of the Company or any other party (including, without limitation, the price or consideration that may be offered or paid in any potential transaction, or in any of the other terms thereof), a fairness opinion, or a recommendation to the Company as to how the Company, its Board of Directors or shareholders should vote or act with respect to any potential strategic alternatives or transactions, and are provided for informational purposes only. Any identification of, or discussion regarding, any third parties in these materials does not purport to indicate the interest or receptiveness of any such party to a strategic alternative or transaction with the Company. Any such indication of interest, and the potential terms of any such transaction, can only be ascertained through substantive negotiations with such third parties Stifel cannot and will not guarantee the successful consummation of any potential strategic alternative or transaction referenced herein. In addition, the Company should be aware that in the ordinary course of Stifel’s business, it may have had confidential discussions with financial investors or with parties in the Company’s industry group (including competitors) regarding strategic alternatives, including potential transactions. Such discussions may have focused on specific companies and/or presented illustrative data concerning possible transactions involving such companies, which may include the Company. These materials are confidential and are not to be published, quoted or referred to, in whole or in part, in any registration statement, prospectus or proxy statement, or in any other document used in connection with the offering or sale of securities or to seek approval for any potential strategic alternatives or transactions, nor shall these materials be used for any other purposes, without Stifel’s express written consent. All transaction announcements included herein appear as a matter of record only. Dollar volume for securities offerings represents full credit to underwriter. Stifel is a full-service securities firm which may be engaged at various times, either directly or through its affiliates, in various activities including, without limitation, securities trading, investment management, financing and brokerage activities and financial advisory services for companies, governments and individuals. In the ordinary course of these activities, which may conflict with the interests of the Company, Stifel and its affiliates from time-to-time may (i) effect transactions for its own account or the accounts of its customers and hold long or short positions in debt or equity securities or other financial instruments (or related derivative instruments) of the Company or other parties which may be the subject of any engagement or transaction involving the Company; (ii) hold discussions with and provide information to clients, potential clients and other entities regarding various market and strategic matters (including potential strategic alternatives), which entities may include potential counterparties to a transaction or strategic alternative involving the Company, and which matters may have included a possible transaction with the Company; and/or (iii) perform various investment banking, financial advisory and other services for other clients and customers who may have conflicting interests with respect to the Company.
Independence of ResearchStifel prohibits its employees from directly or indirectly offering a favorable research rating or specific price target, or offering to change a rating or price target, as consideration or inducement for the receipt of business or for compensation.
Basis of PresentationReferences herein to “Stifel” collectively refer to Stifel, Nicolaus & Company, Incorporated and other affiliated broker-dealer subsidiaries of Stifel Financial Corp. References herein to “Stifel Financial” refer to Stifel Financial Corp. (NYSE: SF), the parent holding company of Stifel and such other affiliated broker-dealer subsidiaries. Unless otherwise indicated, information presented herein with respect to the experience of Stifel also includes transactions effected and matters conducted by companies acquired by Stifel (including pending acquisitions publicly announced by Stifel), or by Stifel personnel while at prior employers
Stifel, Nicolaus & Company, Incorporated | Member SIPC & NYSE | www.stifel.com