healthy city hands-on training ventura 1.28.11
TRANSCRIPT
A Resource for all of California
Information + action for social change
Hands-on Training
A National civil rights POLICY/ ACTION TANK
Healthy City is a project of…
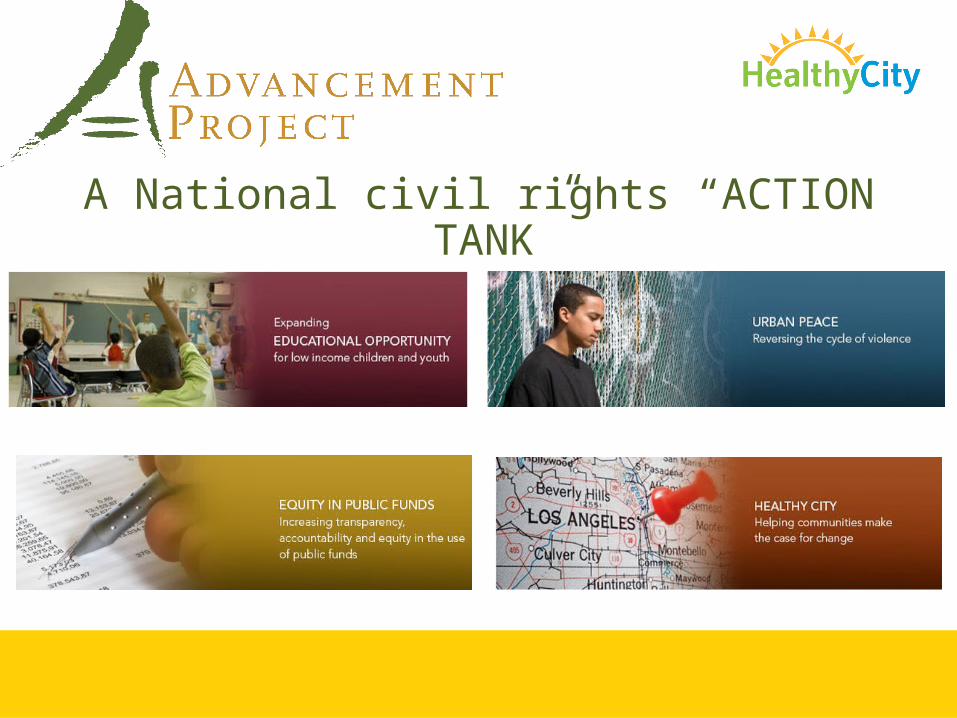
A National civil rights “ACTION TANK”

…is an information + action resource that unites rigorous research, community voices and innovative technologies
to solve the root causes of social inequity
DIRECT TECHNICAL SUPPORT TO:
COMMUNITY ORGSFOUNDATIONSGOVERNMENT
COMMUNITY RESEARCH LAB
Training community groups to lead and sustain action-oriented research &
technology projects
ONLINE MAPPING TECHNOLOGYwww.HealthyCity.org
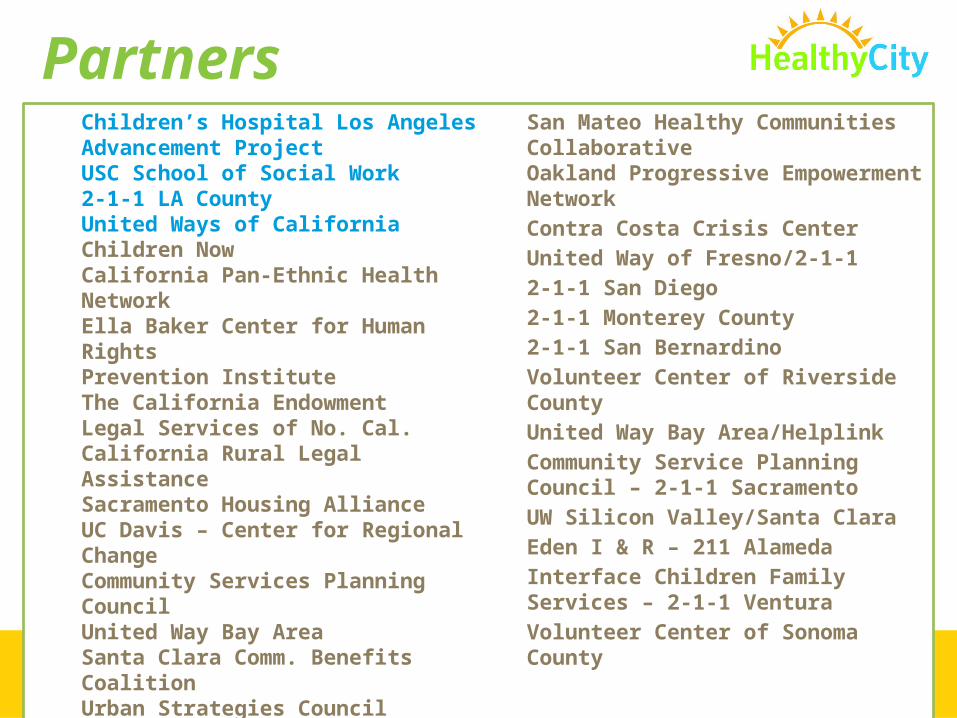
PartnersChildren’s Hospital Los AngelesAdvancement ProjectUSC School of Social Work 2-1-1 LA CountyUnited Ways of CaliforniaChildren NowCalifornia Pan-Ethnic Health NetworkElla Baker Center for Human RightsPrevention InstituteThe California EndowmentLegal Services of No. Cal.California Rural Legal AssistanceSacramento Housing AllianceUC Davis – Center for Regional ChangeCommunity Services Planning CouncilUnited Way Bay AreaSanta Clara Comm. Benefits CoalitionUrban Strategies CouncilSan Mateo Healthy Communities CollaborativeOakland Progressive Empowerment Network
Contra Costa Crisis CenterUnited Way of Fresno/2-1-12-1-1 San Diego2-1-1 Monterey County2-1-1 San BernardinoVolunteer Center of Riverside CountyUnited Way Bay Area/HelplinkCommunity Service Planning Council – 2-1-1 SacramentoUW Silicon Valley/Santa Clara Eden I & R – 211 AlamedaInterface Children Family Services – 2-1-1 VenturaVolunteer Center of Sonoma County

Mapping Data Provides Visual Evidence for…
• Community Issues & Needs• Community Knowledge• Coordination• Locating Assets and Gaps• Planning • Policy/Advocacy

Visual evidence that is clear, easy to understand, and dramatic…

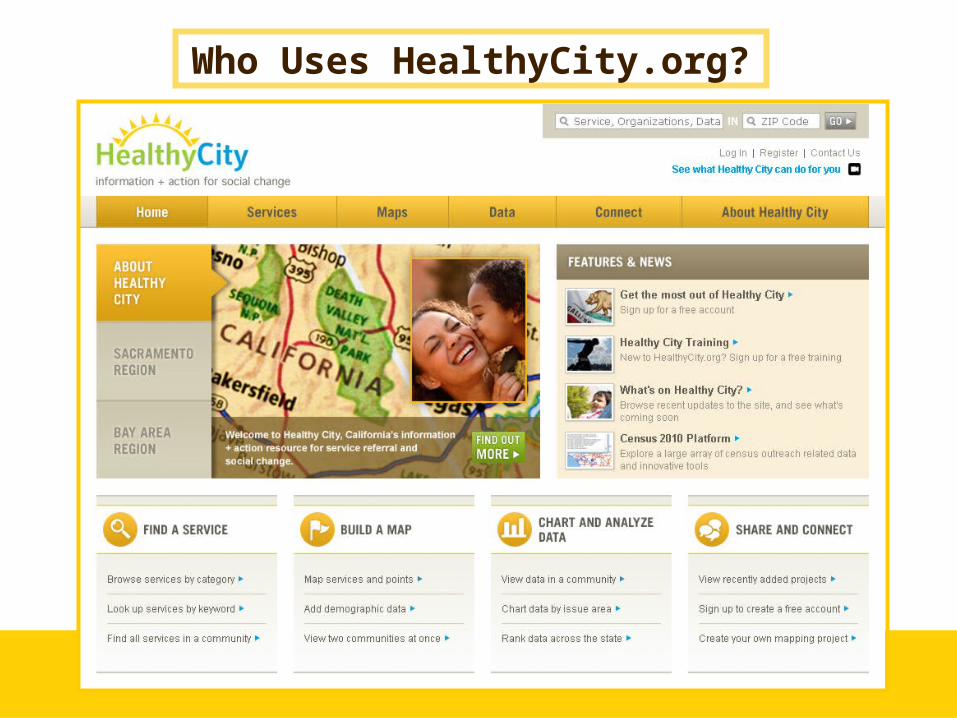
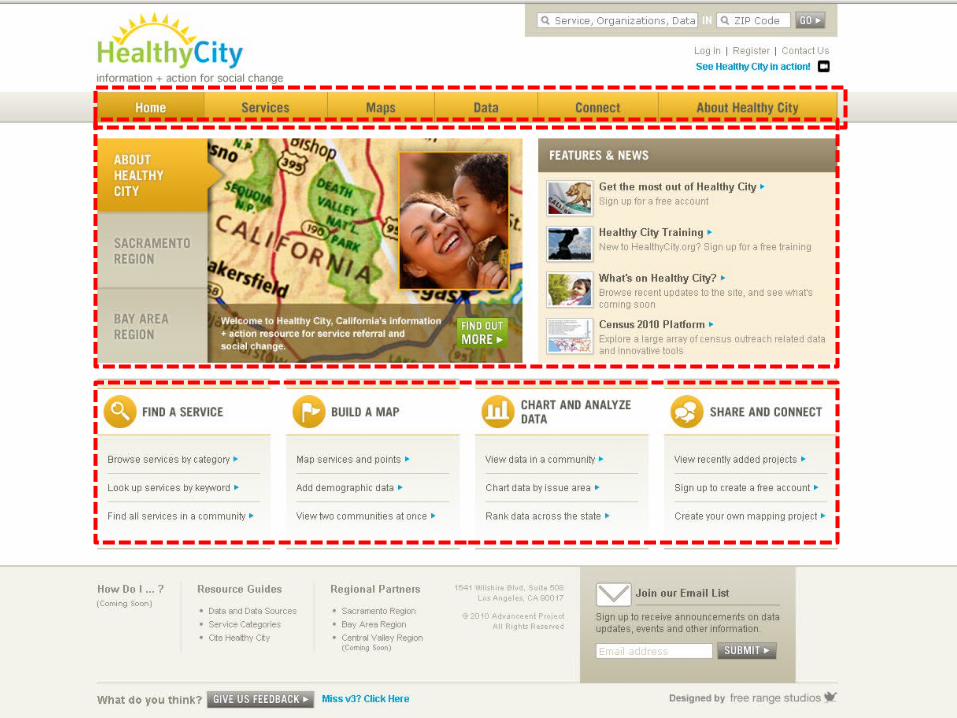
HealthyCity.orgWebsite
Service Provider
Case Manager
Policy Advocate
Funder
Community Organizer
Researcher
Who Uses HealthyCity.org?
Grant Writer
…to fuel social change and improve our communities
What’s on HealthyCity.org?
Oh, the Data You’ll See!
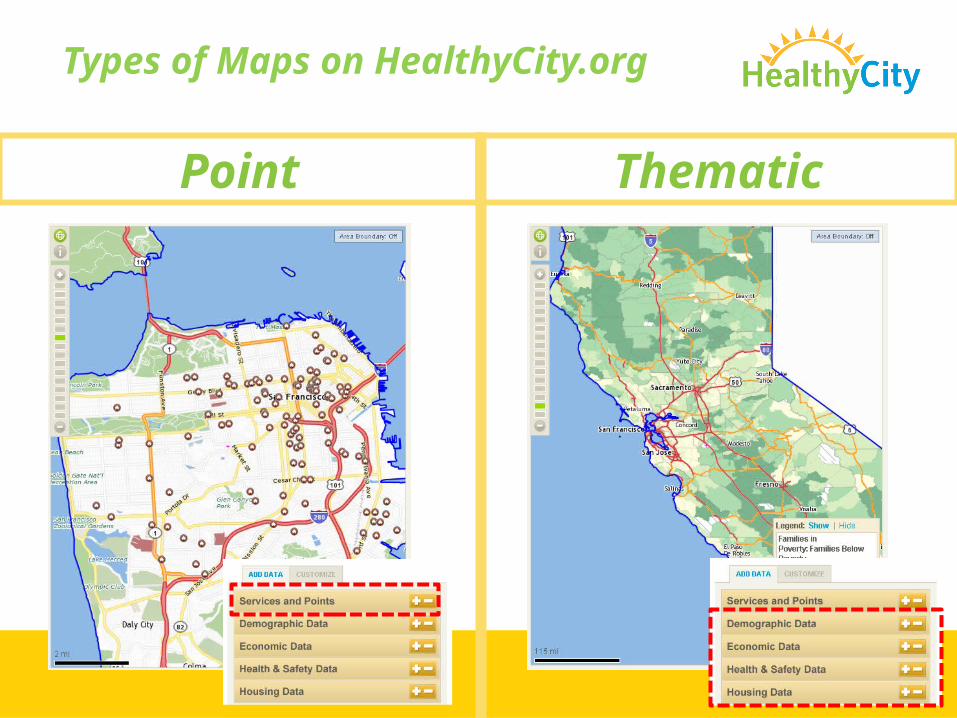
Types of Maps on HealthyCity.org
Point Thematic

Social Service data from 2-1-1
Over 30,000Service sites across California
(Includes: Basic Needs, Legal Services, Education, Health Care, Employment, and
many other Community Services)
Name SourceSocial Services 211s
Nonprofits IRS 990 Center for Nonprofit Management in Southern California
Schools Public & Private California Department of Education
WIC Agencies & Vendors Network for a Healthy California
Hospitals (OSHPD) OSHPD
Head Start Agencies California Head Start Association
Child Care Department of Social Services Community Care Licensing Division
Alcohol Department of Alcoholic Beverage Control
EPA Environmental Protection Agency
Grocery DeLormeFQHC U.S. Department of Health and Human
Services Health Resources and Services Administration
Banks DeLormeCheck Cashing Businesses DeLorme
Services & Points
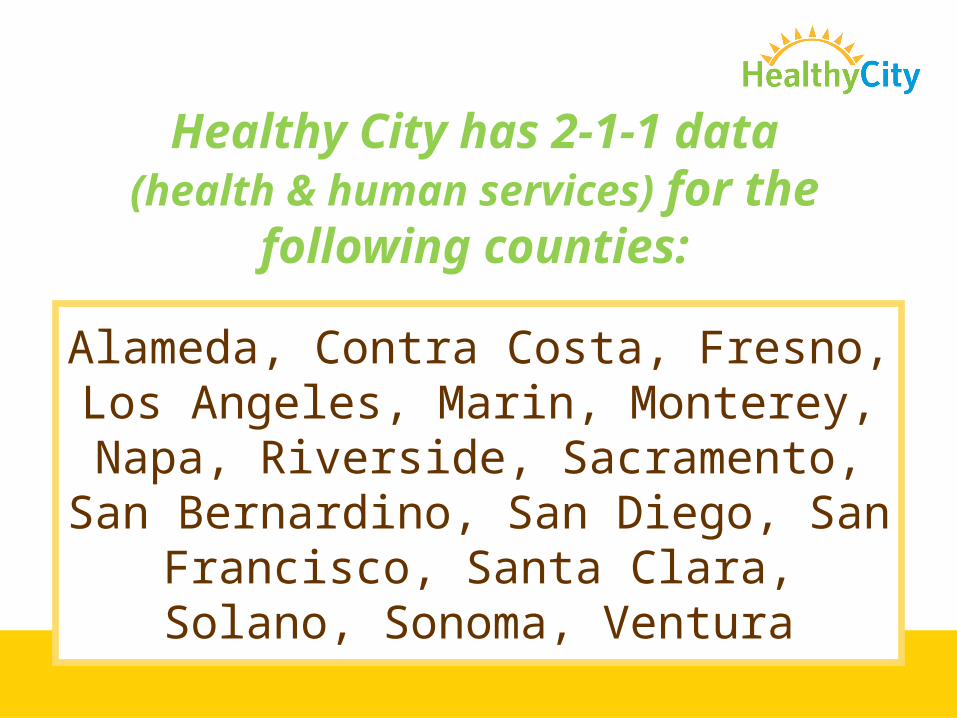
Healthy City has 2-1-1 data (health & human services) for the
following counties:
Alameda, Contra Costa, Fresno, Los Angeles, Marin, Monterey, Napa,
Riverside, Sacramento, San Bernardino, San Diego, San Francisco, Santa Clara, Solano, Sonoma, Ventura
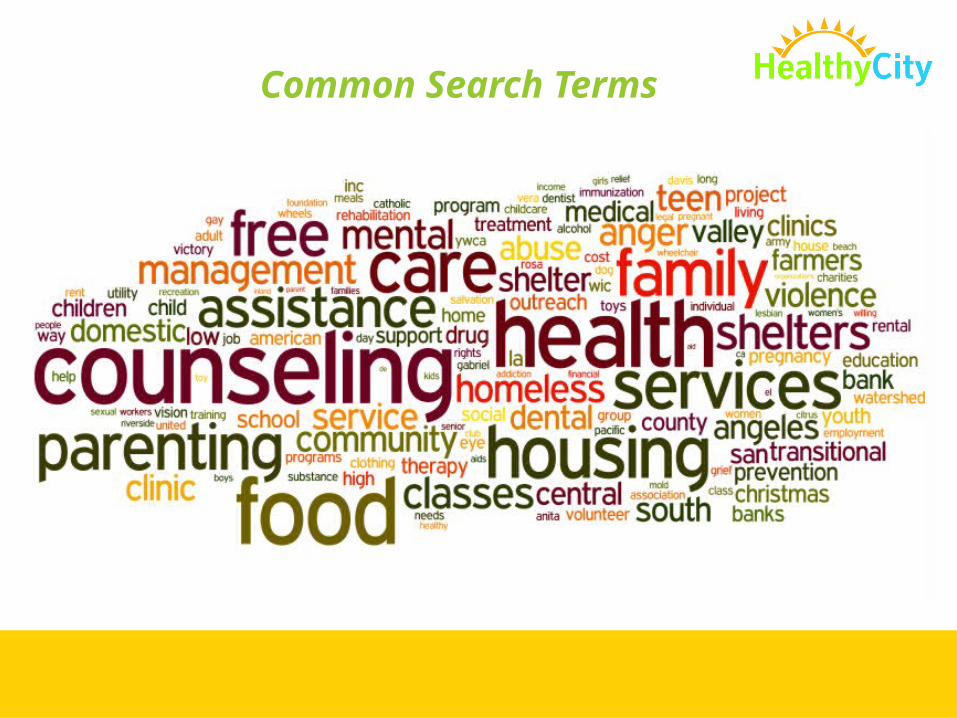
Common Search Terms

Community Data
Population Characteristics – Age, Ethnicity, Educational
Attainment, etc.Civic ParticipationChild WelfareChild Care & Early EducationIncome & PovertyEmploymentNonprofit InfrastructureEnvironment & Land Use
Health – Birth, Prenatal & Child
Health - Conditions, Disease & Injury
Health – DeathsHealth - Insurance & accessHealth – Physical Activity &
NutritionNeighborhood & CommunityCrime & Public SafetyHousing
Over 2500 variables
Multiple years of data
More datasets coming soon

Today you will learn how to:
1. Find a Service using the detailed health and human service database of 211s and other sources
2. Map community data along with other points of interest for policy & advocacy work
3. Analyze demographic, health and socioeconomic data using charts & tables
4. Learn about the Account features that enable you to Tell your Story
You can save and share anything you
create while logged in
GET STARTED!
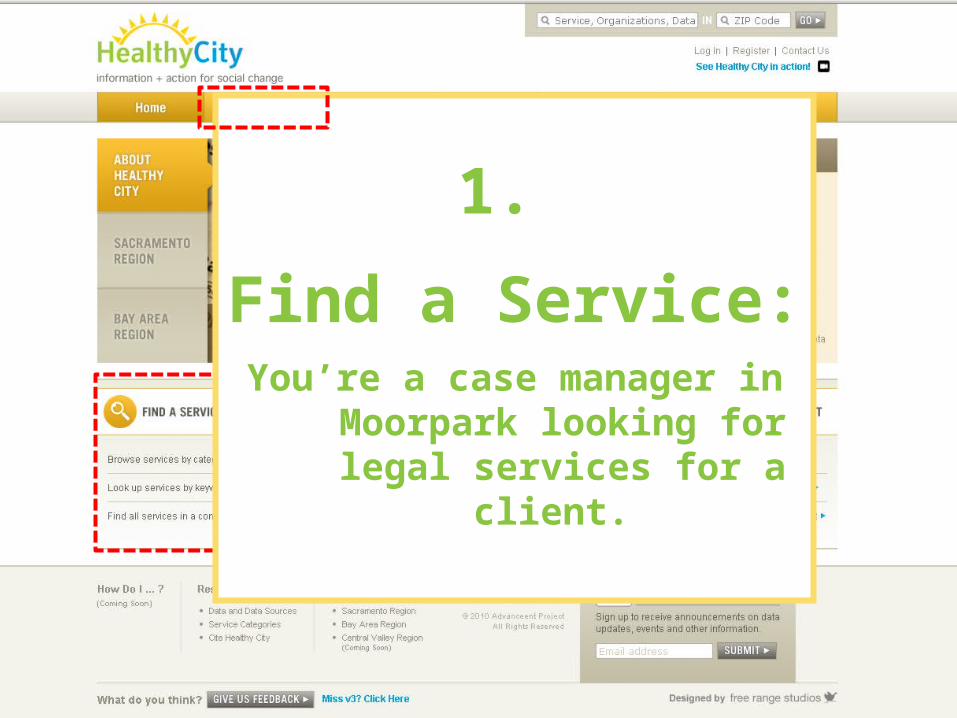
1.
Find a Service:You’re a case manager in
Moorpark looking for legal services for a client.

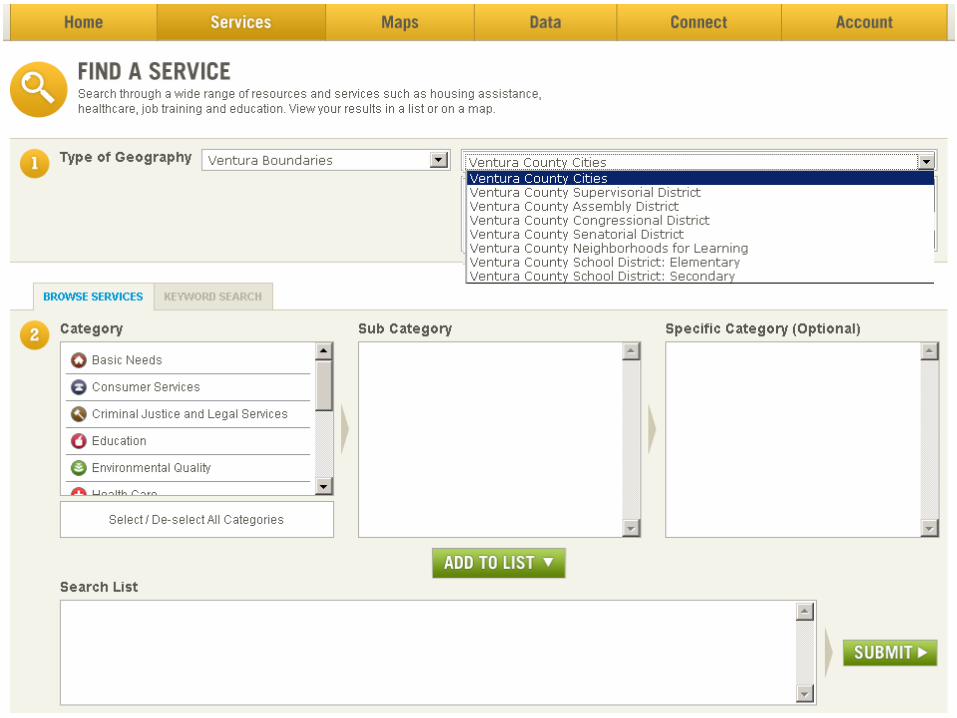

*Look for Legal Services

*Look for Legal Services
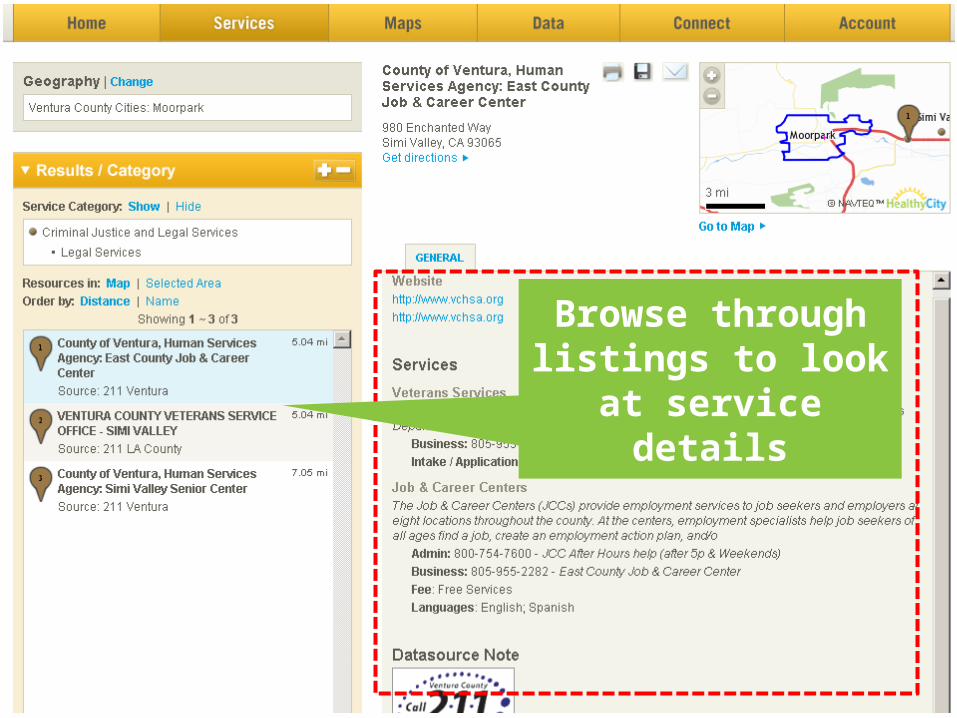
Browse through listings to look
at service details

You can get directions for
your client

SAVE this list for future reference
EMAIL a link to this list of services
PRINT list of services

Extensive CDE school data


Your Turn:
Find counseling services near your office (use address/intersection).
Hint: Select Mental Health Care and Substance Abuse Services
OR…Use the KEYWORD SEARCH tab and type “counseling”;
then select categories that you want to “ADD TO LIST”

Resource Guides Available:
Click on • Service Categories
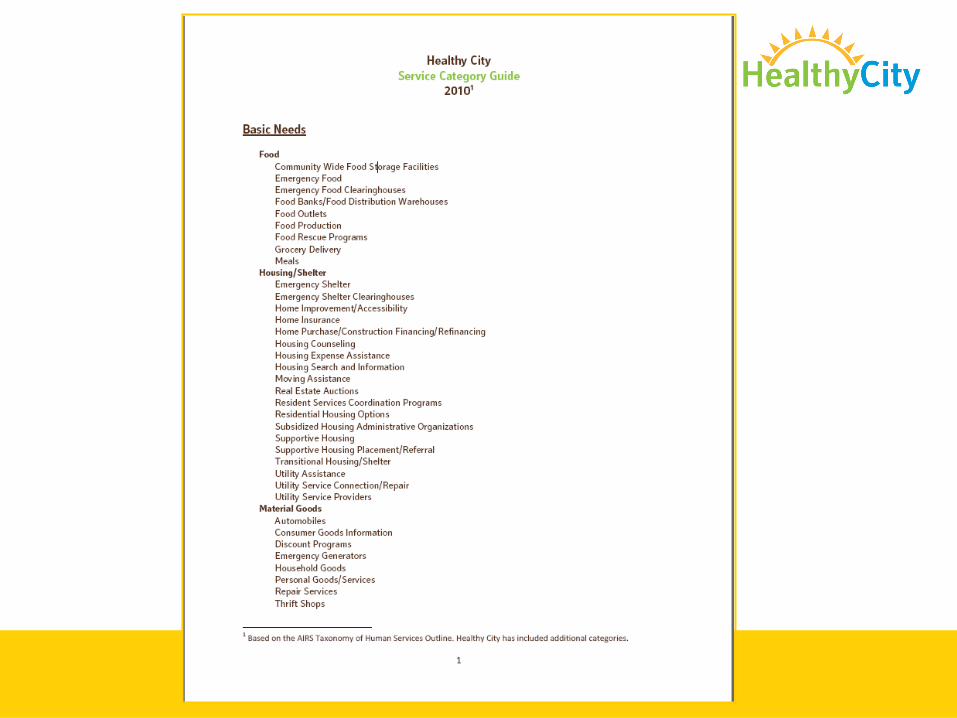
Finding a Service
Questions?

You can save and share anything you
create while logged in
GET STARTED!
2.
Map community data along with other points of interest for policy & advocacy work

Click on Change to select your geography
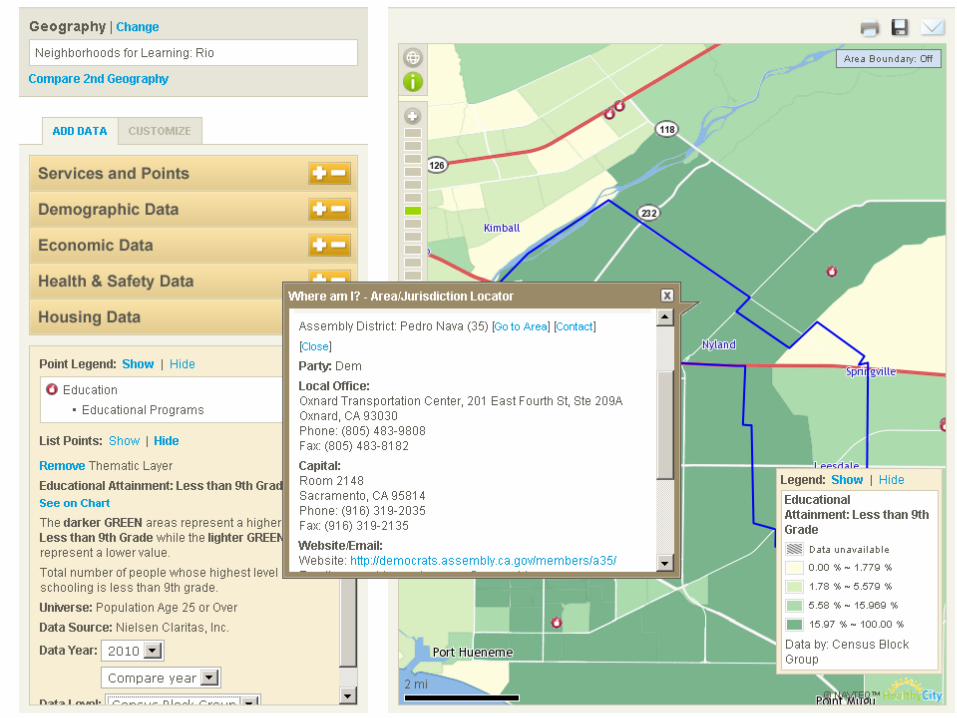
What is the educational attainment level in my community?
Where are the educational assets?

What is the educational attainment level in my community?
Where are the educational assets?
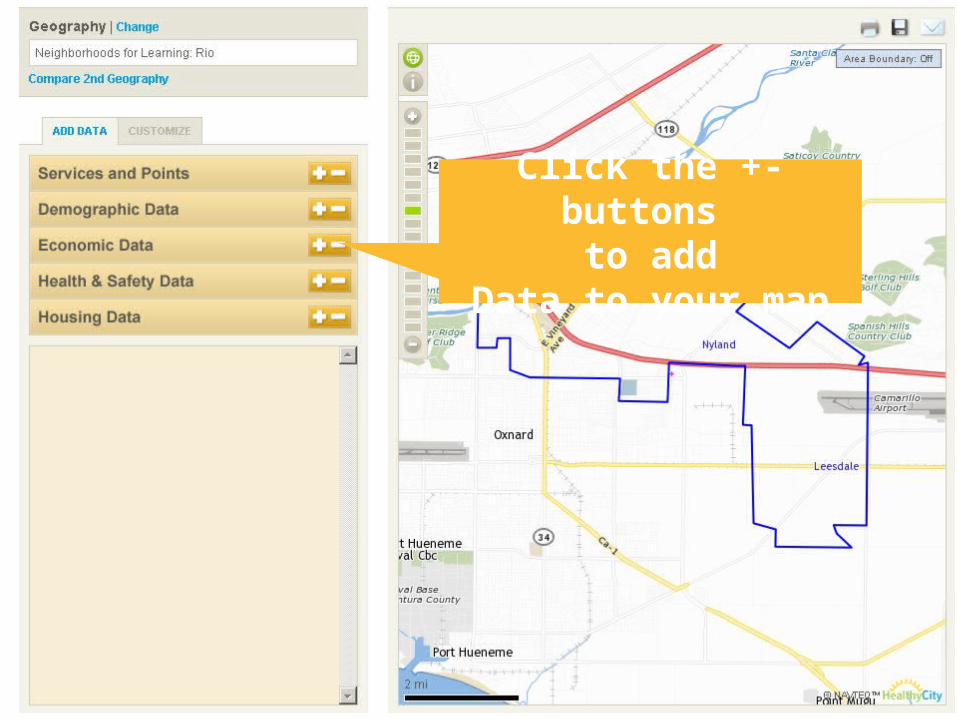
Click the +- buttons to add
Data to your map


Change the geography at which data is
displayed

Find local support services
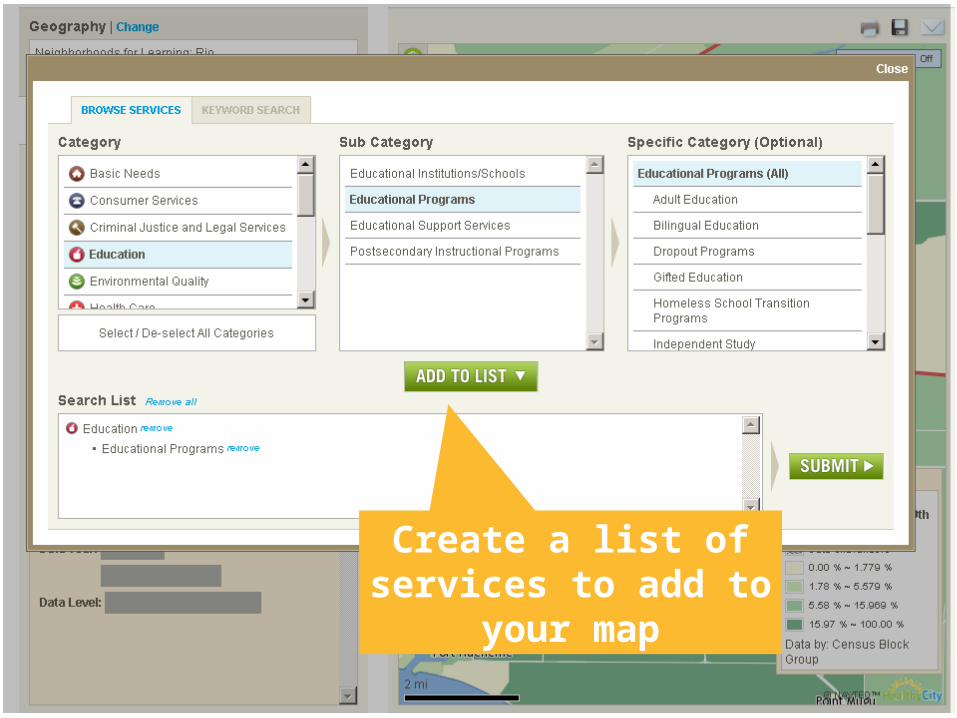
Create a list of services to add to
your map


Add boundary labels like ZIP or city
CUSTOMIZE your map:
Change the display of data
Compare your region to another geography
Other Map Room Features

Your Turn:
1. Map Educational Attainment level (Less than 9th grade) in your neighborhood
2. Then add Educational Programs
Hint: Click on Show next to List Points to make
points interactive

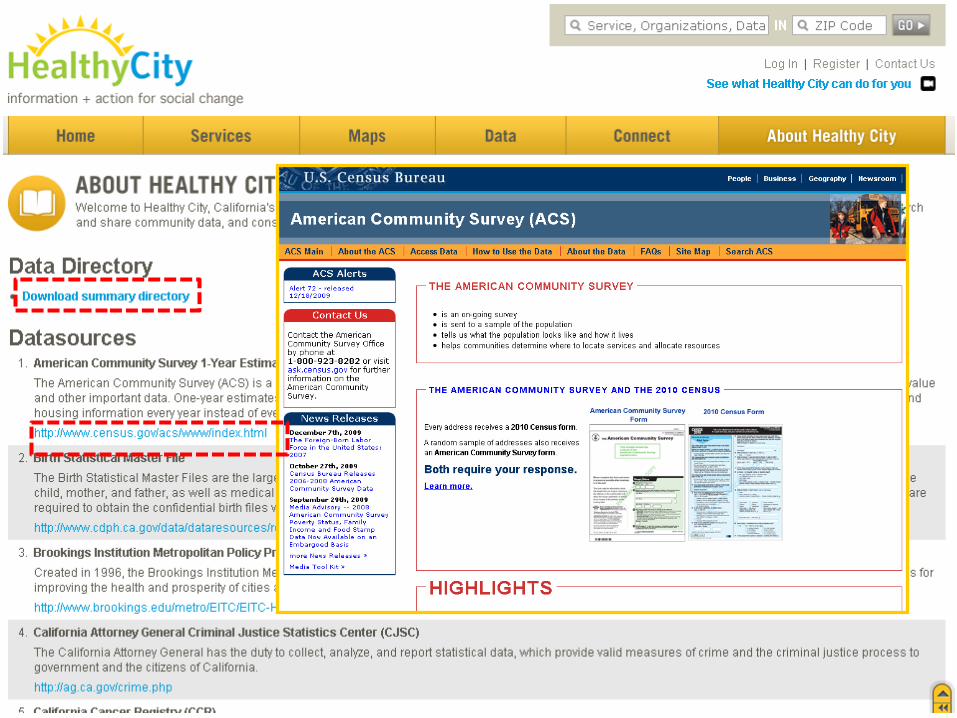
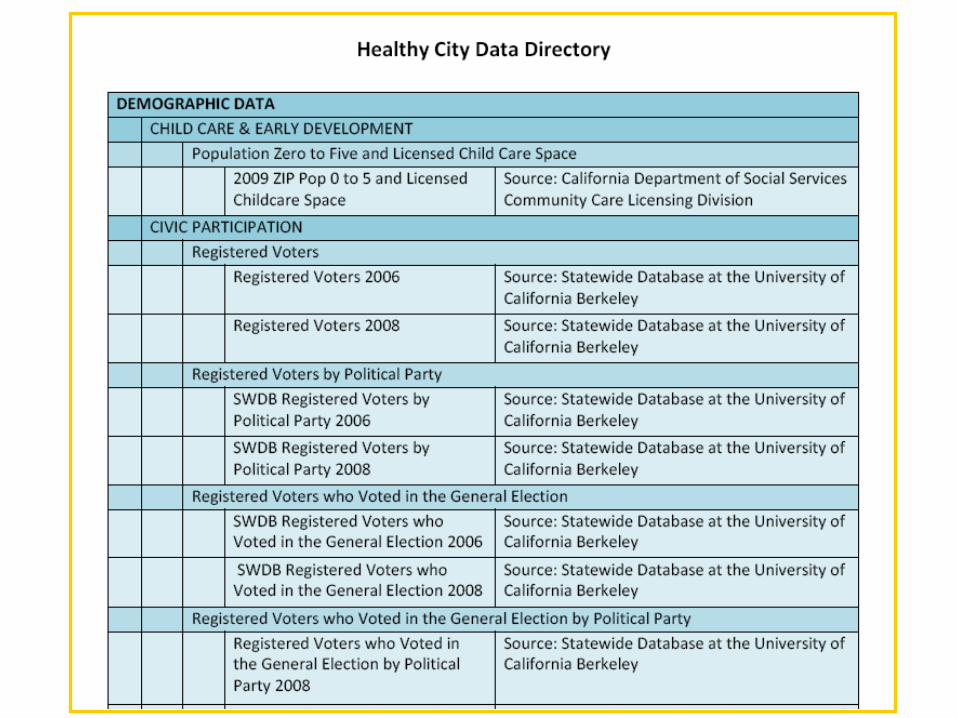
Learn about our data sources

Mapping community data
Questions?

3.
Analyze demographic, health and socioeconomic data using
charts & tables

In LA County, what is the percentage of Renters v. Owners?


SCROLL DOWN to
select Housing
Data


Of the Housing Units in L.A. County:
55.81 % are Owner Occupied
44.19% are Renter Occupied
How does this compare to the
County of Ventura?
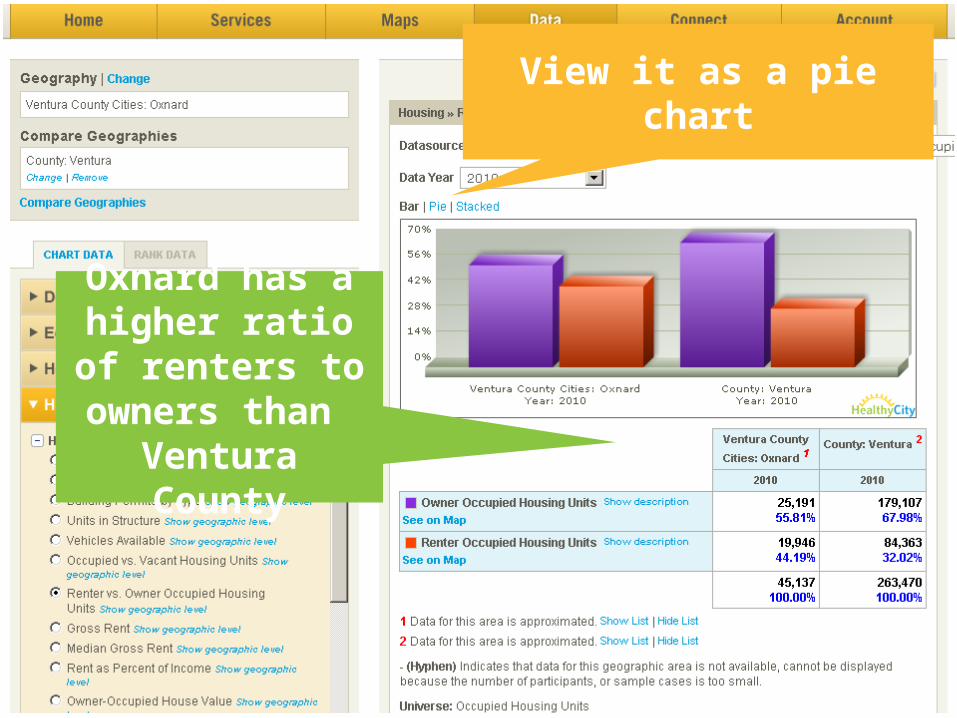
Oxnard has a higher ratio of
renters to owners than
Ventura County
View it as a pie chart


Your Turn:
1. What is the percentage of births to teen mothers in your ZIP?
2. How do births by mother’s age in your ZIP compare to the state of California?
Hint: Health & Safety Data > Birth, Prenatal & Child >
Births by Mother’s Age (see data for “Mother less than 20 years old”)
Grabbing a Stat using charts and tables
Questions?

4.
Learn about advanced features

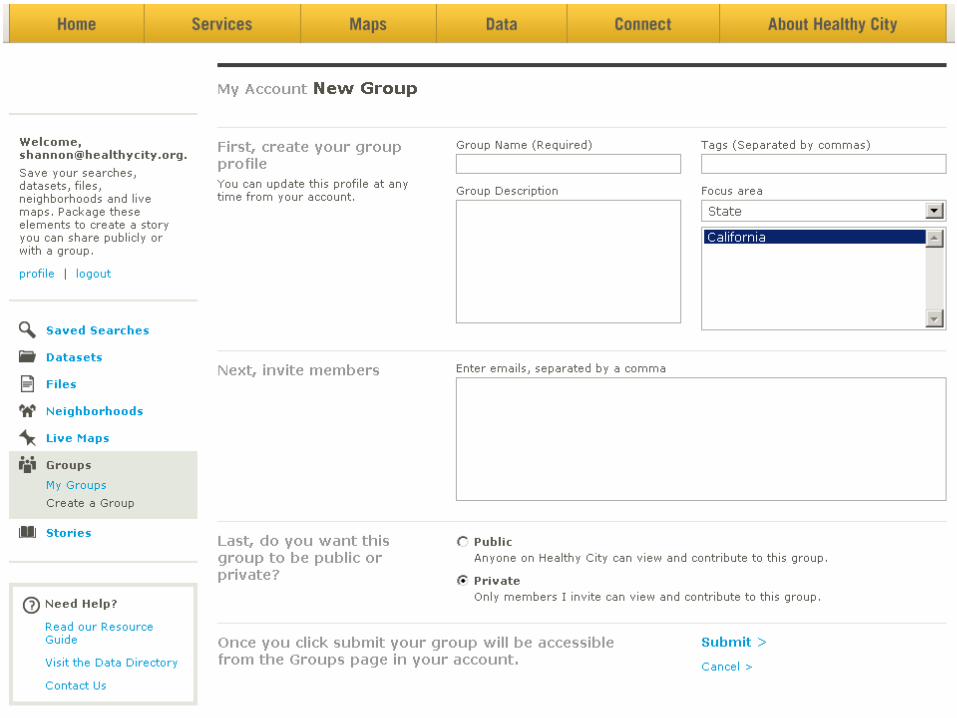
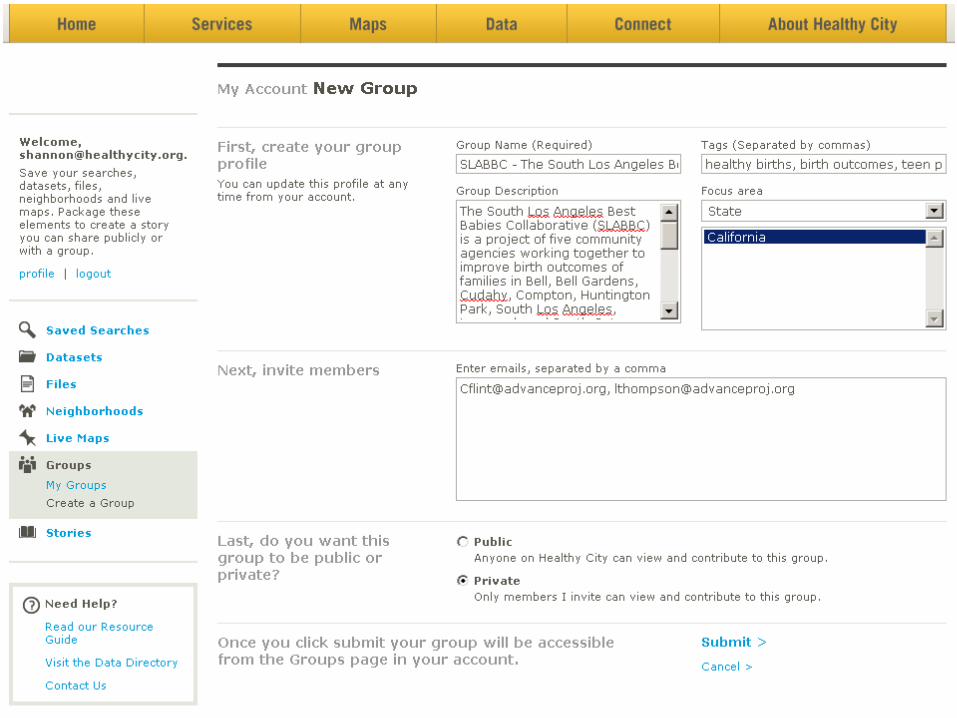
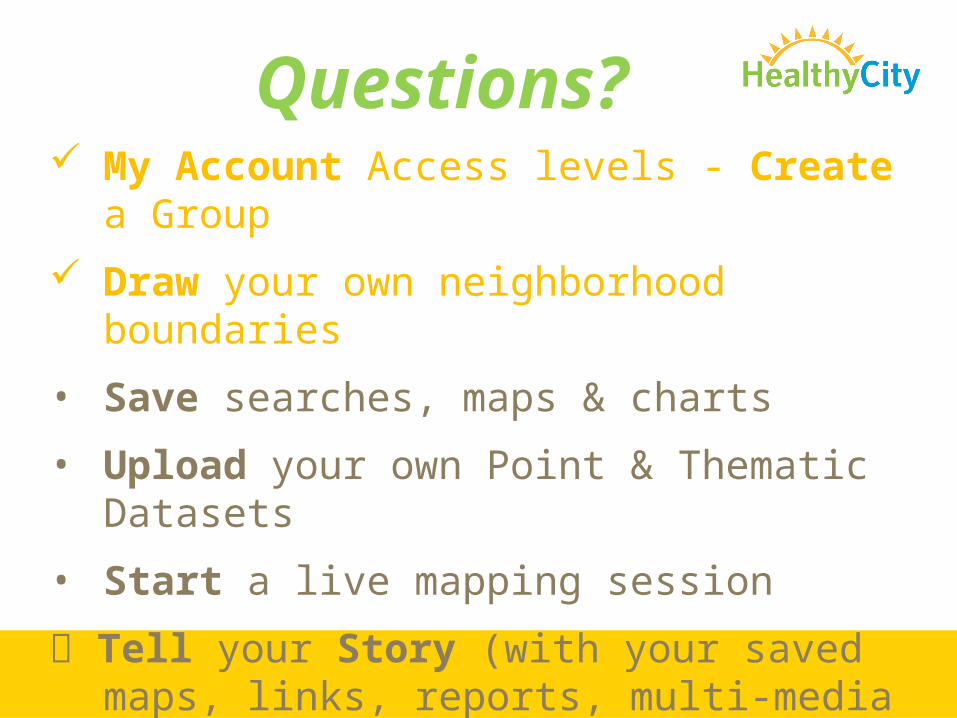
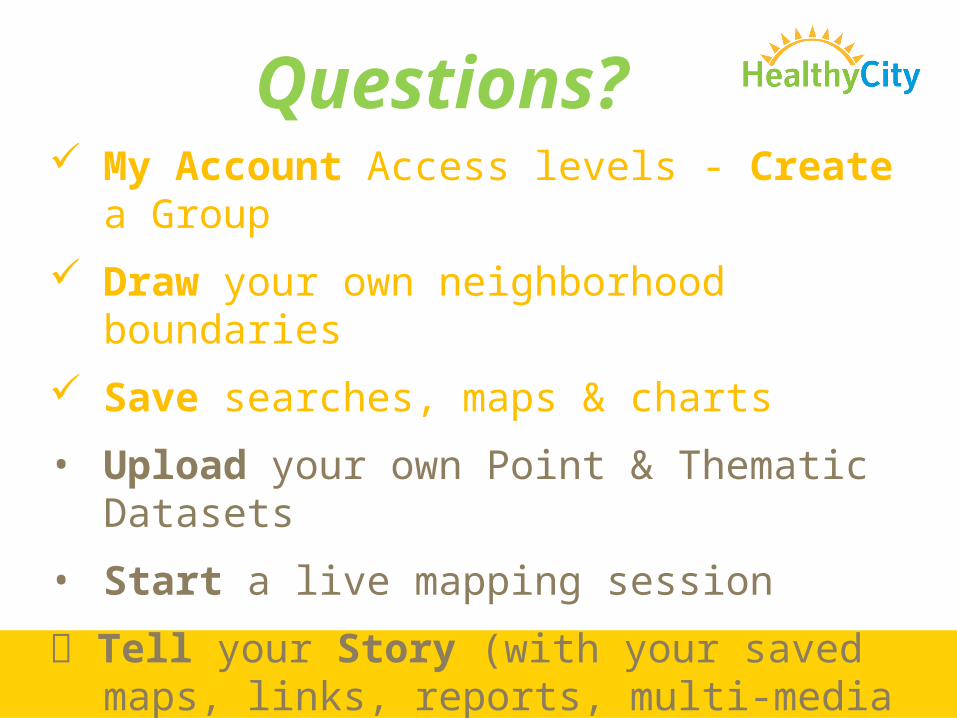
• My Account Access levels - Create a Group
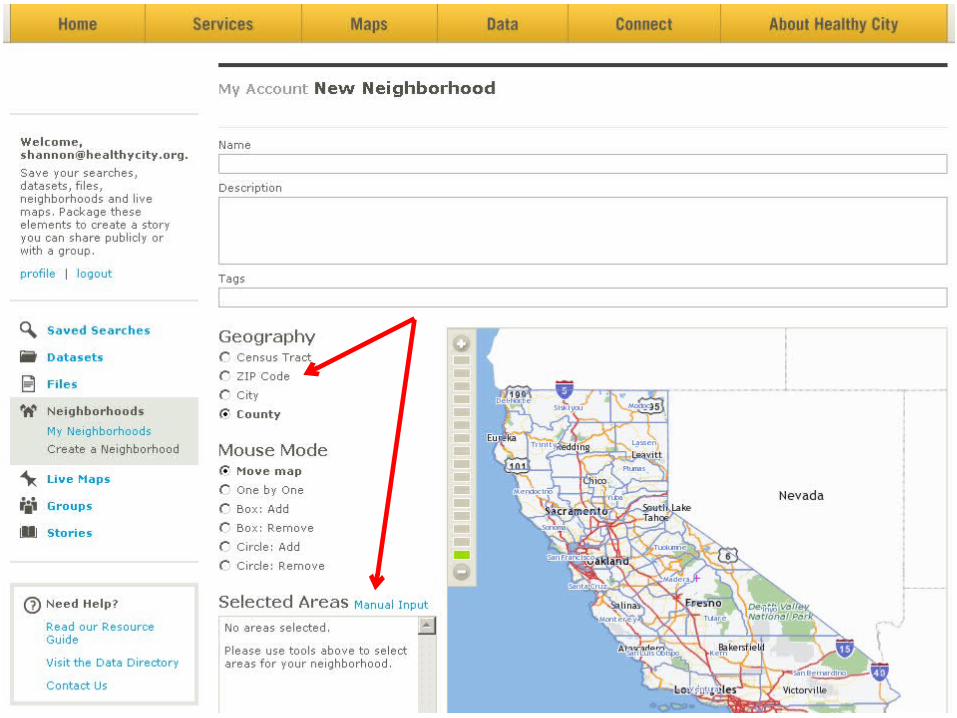
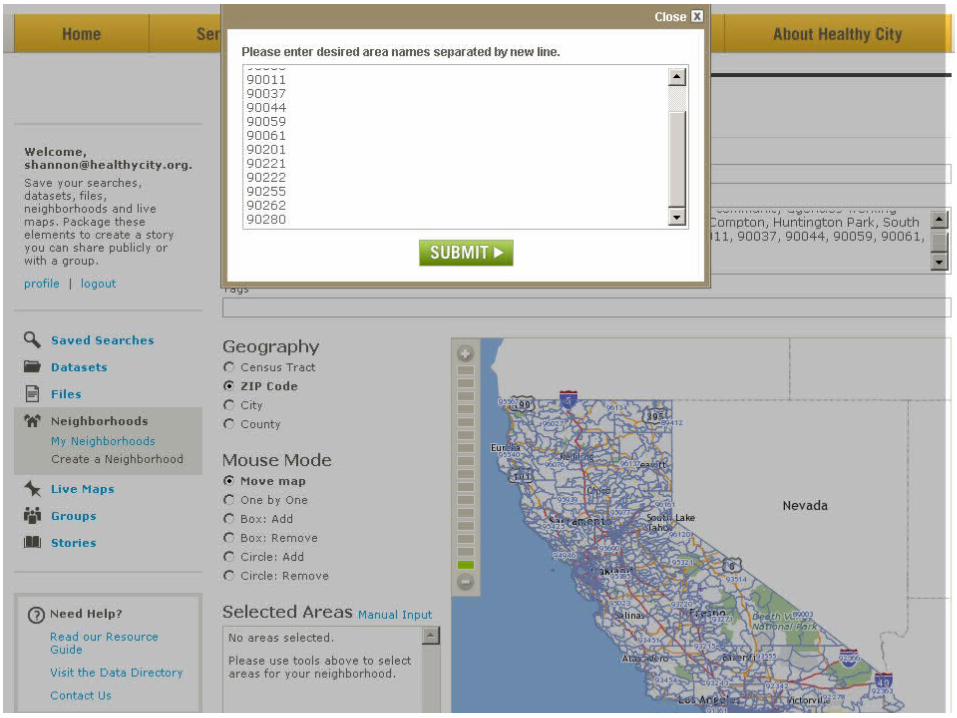
• Draw your own neighborhood boundaries
• Save searches, maps & charts
• Upload your own Point & Thematic Datasets
• Start a live mapping session
Tell your Story (with your saved maps, links, reports, multi-media and more)
4. Learn about the My Account and Share & Connect and features
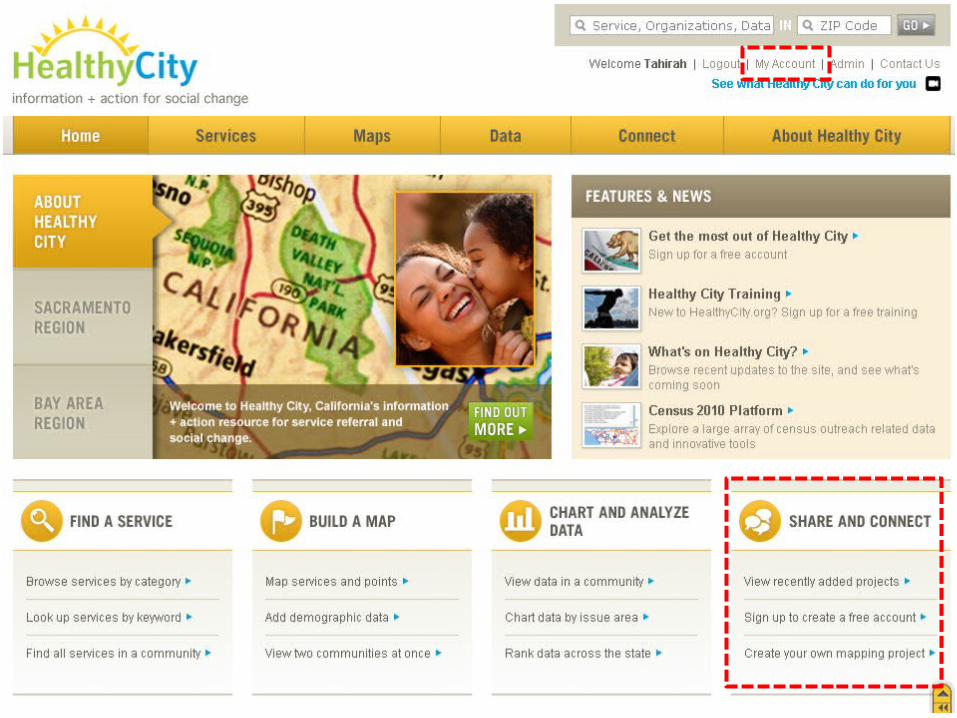

My Account
Share &Connect

Create any element (neighborhood, map, story, etc.)
Keep it PRIVATEshare with a GROUP
or or make it PUBLIC

My Account > Create a Group


Your turn:
Log in to your Account

Questions? My Account Access levels
• Draw your own neighborhood boundaries
• Save searches, maps & charts
• Upload your own Point & Thematic Datasets
• Start a live mapping session
Tell your Story (with your saved maps, links, reports, multi-media and more)

My Account > Draw your own neighborhood boundaries


Hover over title to: View it on a map, Edit boundary, or Open & change profile details

Your turn:
Create a neighborhood boundary by choosing 2 – 5 cities or ZIPs
Questions? My Account Access levels - Create a Group
Draw your own neighborhood boundaries
• Save searches, maps & charts
• Upload your own Point & Thematic Datasets
• Start a live mapping session
Tell your Story (with your saved maps, links, reports, multi-media and more)

Save a Map (using your new boundary)


Your turn:
Create a map using your new neighborhood boundary.
Map an indicator of interest Save your map
Questions? My Account Access levels - Create a Group
Draw your own neighborhood boundaries
Save searches, maps & charts
• Upload your own Point & Thematic Datasets
• Start a live mapping session
Tell your Story (with your saved maps, links, reports, multi-media and more)
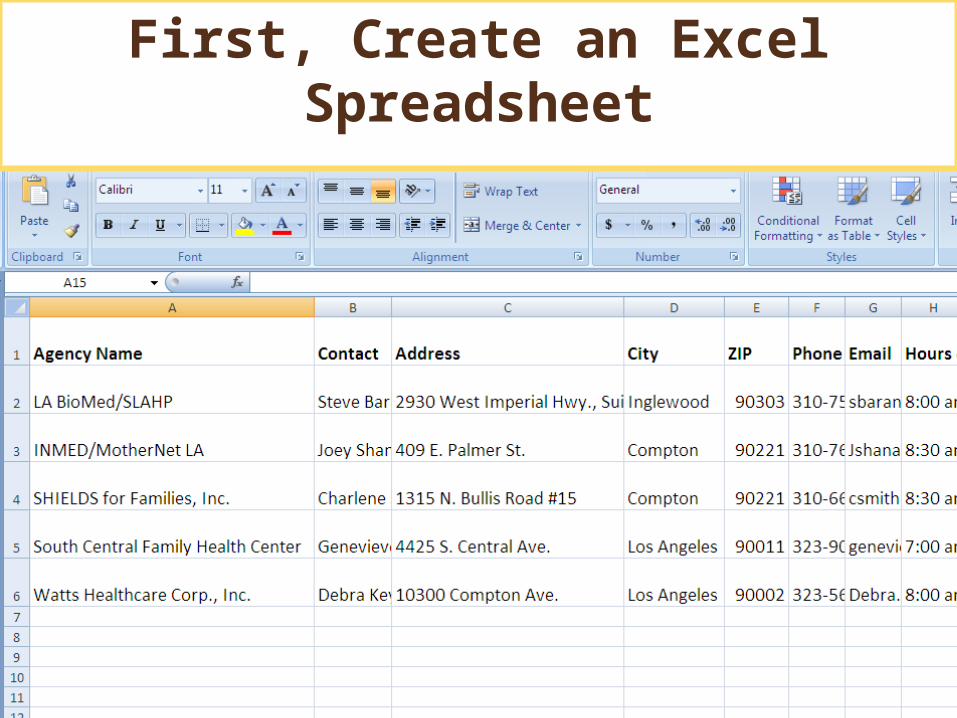
First, Create an Excel Spreadsheet
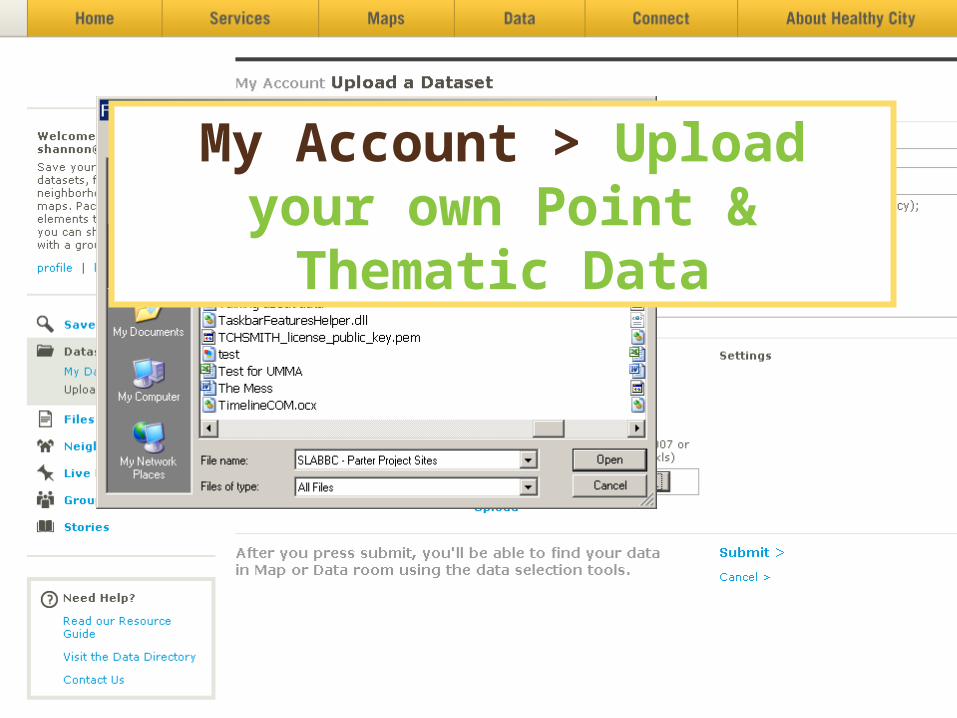
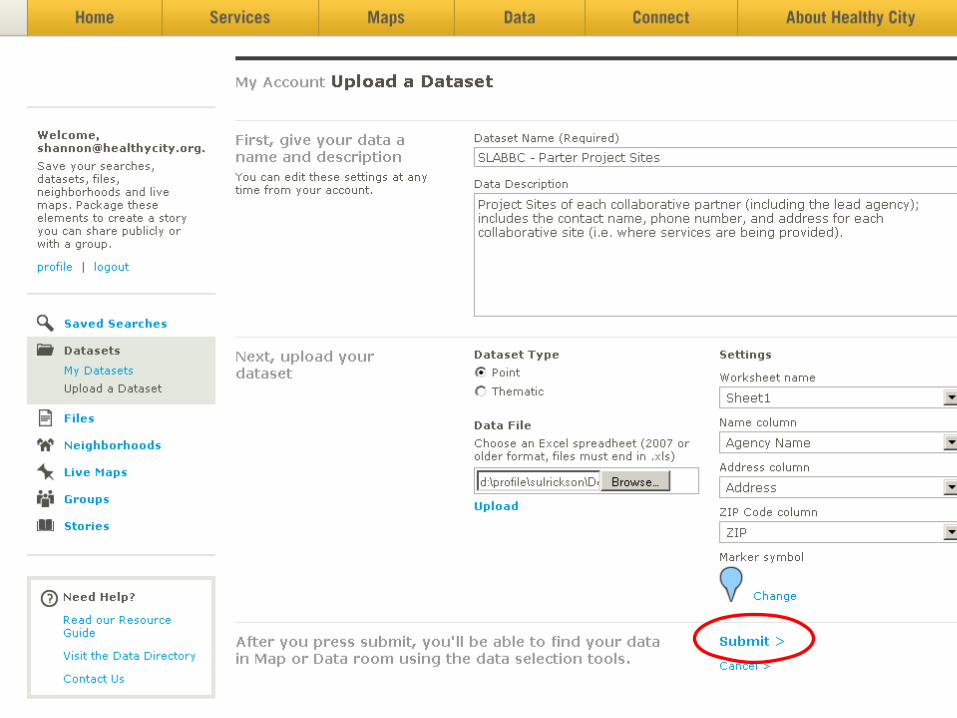
My Account > Upload your own Point & Thematic Data


Your turn:
Create an Excel sheet with 2 – 3 addresses you know.
Upload the spreadsheet to your account
Questions? My Account Access levels - Create a Group
Draw your own neighborhood boundaries
Save searches, maps & charts
Upload your own Point & Thematic Datasets
• Start a live mapping session
Tell your Story (with your saved maps, links, reports, multi-media and more)

A Live Map enables multiple people to :
• Draw and drop points, lines, and shapes on a shared map
• Attach photos & video
Start Live Mapping Sessions
(with Pictures, Video & Audio)

Questions? My Account Access levels - Create a Group
Draw your own neighborhood boundaries
Save searches, maps & charts
Upload your own Point & Thematic Datasets
Start a live mapping session
Tell your Story (with your saved maps, links, reports, multi-media and more)

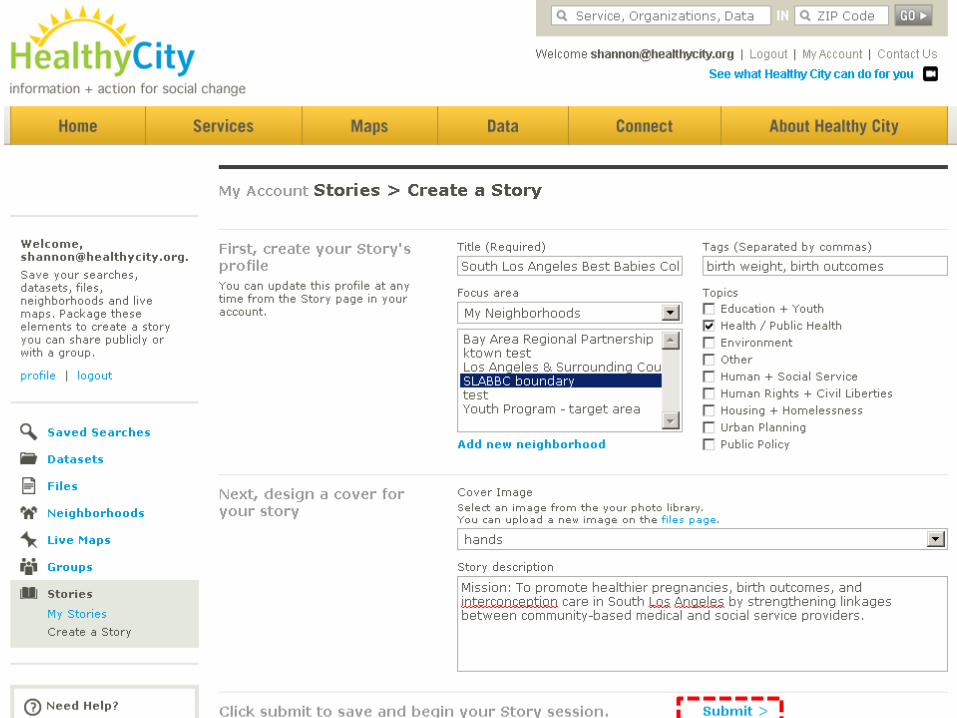
Create a Story to:Promote your initiative or highlight your work!
Package your saved maps, live mapping sessions, reports, multi-media and more into a “story” that you can share
Tell your Story


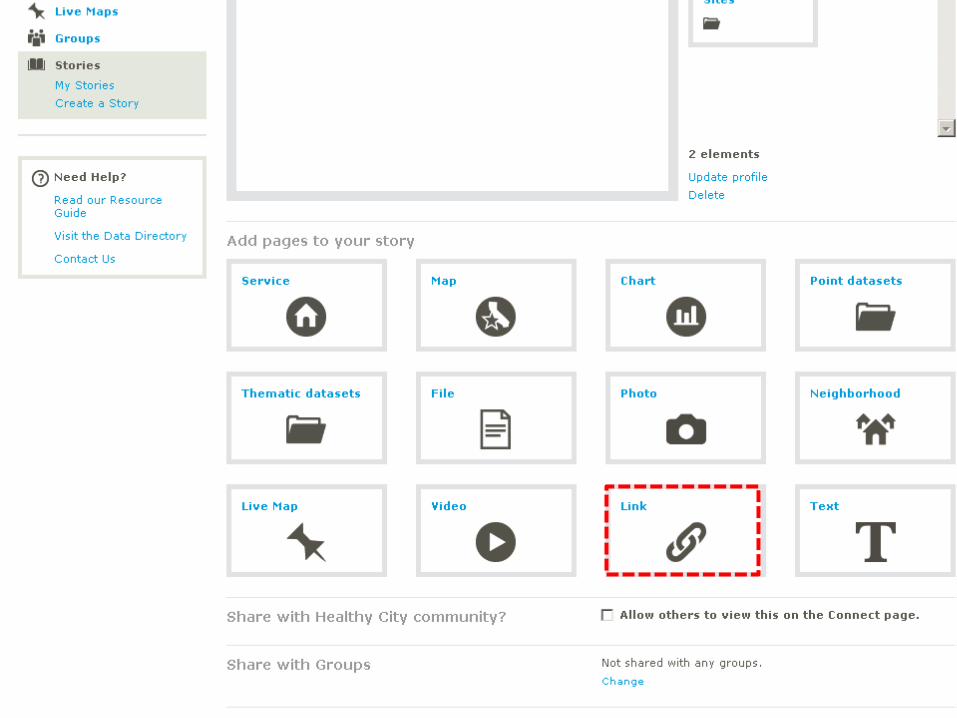
Start adding pages to your Story


You’ve added your pages,
Now share your story!
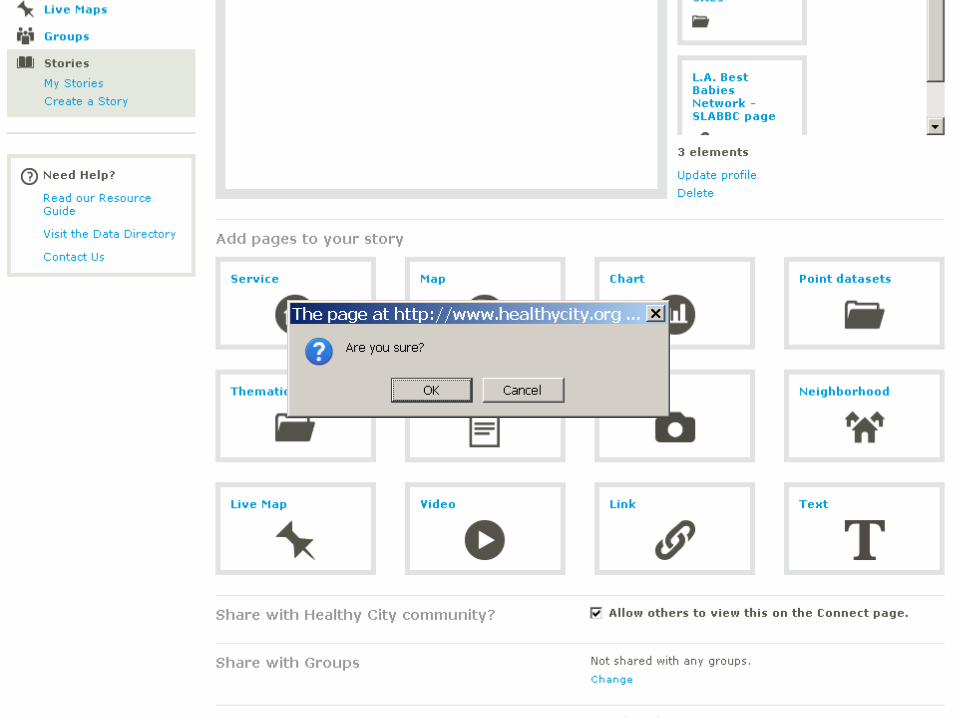

Share and Search Stories (& more) Statewide


Mission: To promote healthier pregnancies, birth outcomes, and interconception care in South Los Angeles by strengthening linkages between community-based medical and social service providers.

Your turn:
Create a Story Title it: “<your name>’s story”
o Add a saved mapo Add a resource
(use your own website or http://www.healthycity.org)
Questions? My Account Access levels - Create a Group
Draw your own neighborhood boundaries
Save searches, maps & charts
Upload your own Point & Thematic Datasets
Start a live mapping session
Tell your Story (with your saved maps, links, reports, multi-media and more)

Advanced Features…
Questions?


Help is Available:
Click on • Healthy City User
Guideor
• FAQs

Thank You!https://www.surveymonkey.com/s/HCtraining