healthy marin partnership advancing equity 2019
TRANSCRIPT

HEALTHY MARIN PARTNERSHIP ADVANCING EQUITY 20192019 Marin County Community Health Assessment

Acknowledgments On behalf of Healthy Marin Partnership (HMP) and the Community Health Needs
Assessment/Community Health Assessment (CHNA/CHA) Subcommittee, we want to
thank all of the individuals who contributed to the development and completion of the
2019 CHA.
Thank you, specifically, to the members of our community, leaders in our community-
based organizations, and key representatives from programs across the county who
shared their knowledge and feedback through key informant interviews, group
interviews, and focus groups. Individuals from a variety of disciplines came together to
prioritize our community’s health needs, lending their time and expertise, for which we
are extremely grateful. We would also like to thank the two consultants whose work so
greatly contributed to this document: Harder+Company, for leading HMP through the
CHNA process with excellent facilitation and data collection and analysis; and Raimi &
Associates, for leading the thorough Marin County Health and Human Services strategic
planning process from 2016 through 2019, resulting in the valuable data incorporated
into this report.
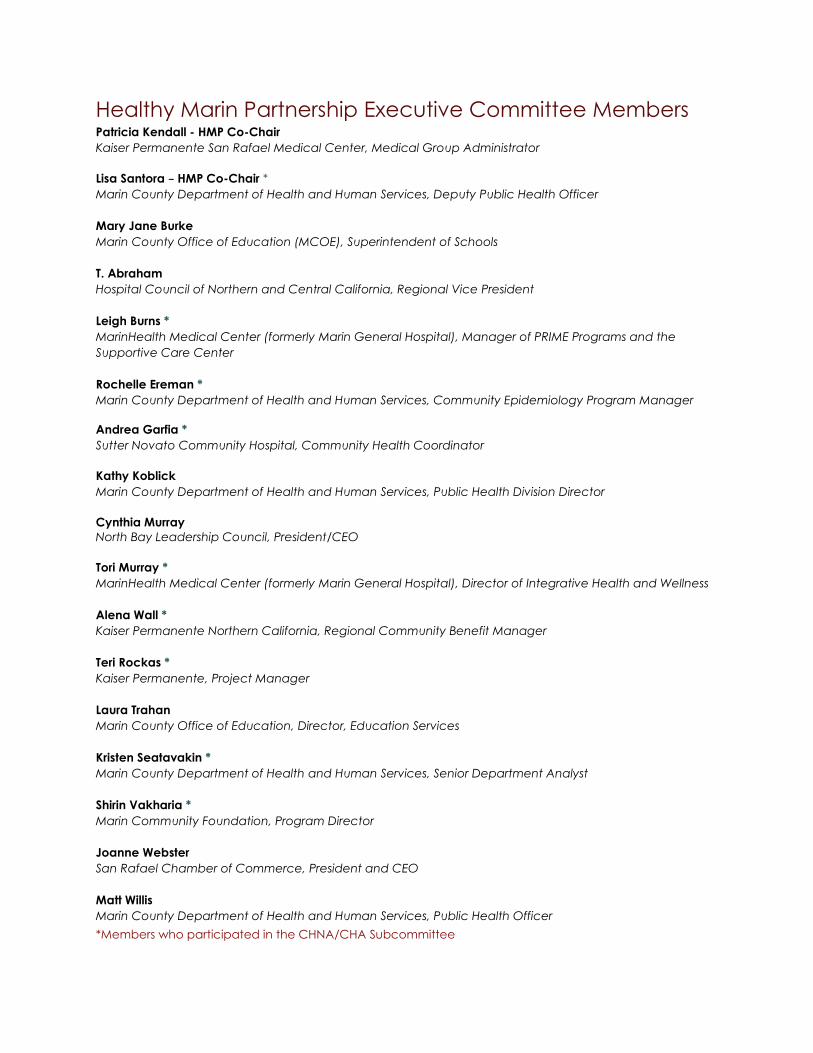
Healthy Marin Partnership Executive Committee Members Patricia Kendall - HMP Co-Chair
Kaiser Permanente San Rafael Medical Center, Medical Group Administrator
Lisa Santora – HMP Co-Chair *
Marin County Department of Health and Human Services, Deputy Public Health Officer
Mary Jane Burke
Marin County Office of Education (MCOE), Superintendent of Schools
T. Abraham
Hospital Council of Northern and Central California, Regional Vice President
Leigh Burns *
MarinHealth Medical Center (formerly Marin General Hospital), Manager of PRIME Programs and the
Supportive Care Center
Rochelle Ereman *
Marin County Department of Health and Human Services, Community Epidemiology Program Manager
Andrea Garfia *
Sutter Novato Community Hospital, Community Health Coordinator
Kathy Koblick
Marin County Department of Health and Human Services, Public Health Division Director
Cynthia Murray
North Bay Leadership Council, President/CEO
Tori Murray *
MarinHealth Medical Center (formerly Marin General Hospital), Director of Integrative Health and Wellness
Alena Wall *
Kaiser Permanente Northern California, Regional Community Benefit Manager
Teri Rockas *
Kaiser Permanente, Project Manager
Laura Trahan
Marin County Office of Education, Director, Education Services
Kristen Seatavakin *
Marin County Department of Health and Human Services, Senior Department Analyst
Shirin Vakharia *
Marin Community Foundation, Program Director
Joanne Webster
San Rafael Chamber of Commerce, President and CEO
Matt Willis
Marin County Department of Health and Human Services, Public Health Officer
*Members who participated in the CHNA/CHA Subcommittee

HMP CHA Summary Report
4
Contents Acknowledgements…................................................................................................................ 2
Healthy Marin Partnership Executive Committee Members…............................................... 3
Introduction & Background….................................................................................................... 5
Purpose of a Community Assessment….............................................................................. 6
About Healthy Marin Partnership…...................................................................................... 8
History of HMP…................................................................................................................. 8
How Advancing Equity Contributes to a Community's Health….......................................... 11
Understanding Social Determinants of Health…................................................................ 13
Road to Equity…..................................................................................................................... 14
Community Health Assessment (CHA) Process and Methodology…................................... 17
About Marin County…........................................................................................................... 18
Demographic Profile of Marin County Residents…............................................................ 19
Socioeconomic Data….................................................................................................... 21
Priority Health Needs Overview….............................................................................................. 27
Next Steps….................................................................................................................................. 34
Organizing Community Resources to Respond to Identified Needs…............................. 35
Community Health Improvement Planning Process…........................................................ 35
Appendix….................................................................................................................................... 36
Appendix: Secondary data sources and dates…............................................................... 37

Introduction & Background
Purpose of a Community Health Assessment
About Healthy Marin Partnership
History of HMP
IN T
HIS
SEC
TIO
N

HMP CHA Summary Report
6
Introduction & Background
Purpose of a Community Health Assessment A community health assessment (CHA) is a systematic
examination of the overall health status of a given
population. This data is used to inform organizations about
their community’s current health needs and perceived
issues, as well as to identify significant factors affecting local
health outcomes. The information can also help in the
development of a Community Health Improvement Plan
(CHIP) by justifying how and where resources should be
allocated to best meet community needs.
Benefits of a Community Health Assessment include:
• Improved communication and collaboration
between organizations and the community
• Increased knowledge about public health and the
interconnectedness of local activities
• Strengthened partnerships within state and local
public health systems
• Identification of system gaps to address in quality improvement efforts
• Establishment of performance baselines to use in preparation for accreditation
• Identification of benchmarks for public health practice improvements1
A CHIP is an action-oriented plan for addressing the most significant issues identified by
community partners during the CHA process. The objective of both the CHA and CHIP is
to align and leverage resources, initiatives, and programs in an efficient and outcomes-
based manner to improve local health.
In addition to preparing all agencies and organizations to work together with shared
goals, the CHA is a required activity for organizations in the health and social sectors.
First, with the passage of SB 697 in 1994, the State of California mandated that not-for-
profit hospitals conduct a community health needs assessment every three years. Later,
the federal Patient Protection and Affordable Care Act (ACA), enacted on March 23,
2010, included new requirements for nonprofit hospitals to meet in order to maintain
their tax-exempt status; these new regulations, described in section 501(r) of the Internal
Revenue Code, include a requirement that all nonprofit hospitals must conduct a
community health needs assessment (CHNA) and develop an implementation strategy
(IS) every three years.2
1 CDC Public Health Professionals Gateway <https://www.cdc.gov/publichealthgateway/cha/plan.html> 2 IRS Federal Register Vol. 79 No. 250 <http://www.gpo.gov/fdsys/pkg/FR-2014-12-31/pdf/2014-30525.pdf>
For the purposes of this
report, the initial
process HMP
completed with
hospitals will be
referred to as the
CHNA (Community
Health Needs
Assessment); this report
itself will be referred to
as the CHA
(Community Health
Assessment) to
differentiate it, given
the additional data
collection and
processes involved.

HMP CHA Summary Report
7
The CHA is also required for all health departments that are pursuing or maintaining
Public Health Department Accreditation through the Public Health Accreditation Board
(PHAB). Marin County Department of Health and Human Services’ Public Health division
is currently working toward accreditation.

HMP CHA Summary Report
8
About Healthy Marin Partnership Healthy Marin Partnership (HMP) is a collaborative of local agencies, organizations, and
individuals dedicated to improving the health and well-being of all Marin residents. HMP
recognizes the importance of taking a comprehensive view to understand community
health needs and acknowledges the critical advantage of working collectively to
address these needs and to advance health equity. HMP is a convener of local
communities, organizations, agencies, and policymakers seeking to explore strategies
that can enable everyone in Marin to live a healthier life. This report provides a
summary of the 2019 Community Health Assessment results, which are intended to
guide the work of Healthy Marin Partnership and our partners over the next three years
and serve as a foundation to inform community action in addressing priority health
needs.
History of HMP Healthy Marin Partnership (HMP) was formed in 1995 in response to SB 697, a California
law requiring all not-for-profit hospitals to complete a community health needs
assessment every three years. As explained above, this requirement became a national
mandate with the passing of the Affordable Care Act (ACA) in 2010. In Marin, all
hospitals teamed with United Way Bay Area and Marin County Health and Human
Services to conduct one assessment. We were soon joined by the Marin County Office
of Education, the Marin Community Foundation, and other community stakeholders.
This partnership has extended well beyond the original requirement and founding
members, and together we work toward building a healthier community.
Since 1995, HMP has
addressed health
concerns in Marin County
by identifying focus areas
based on results from the
CHNA. Over the years,
HMP has reprioritized
focus areas and activities
to address emerging
issues such as access to
medical care and health
insurance for children,
asthma and infectious
disease prevention, and environmental changes, while integrating new evidence-
based strategies and frameworks, such as adverse childhood experiences (ACEs) and
trauma-informed care. Throughout that time, substance misuse and abuse, nutrition,
and physical activity have remained key priority areas.
Access/Health Insurance
Youth Wellness
Asthma
Immunizations
Nutrition and Physical Activity
Alcohol Use
Tobacco Use
Access to Health Care
Breast Health
Access to Health Care
Healthy Eating and Active Living
Mental Health
Substance Abuse
Obesity and Diabetes
Access to Health Care
Mental Health
Substance Misuse and Abuse

HMP CHA Summary Report
9
Twenty years of community health needs assessments have greatly improved residents’
health by yielding specific, implementable strategies. These robust needs assessments
continue to ensure that our hospitals, health department, and partners have the
information needed to identify root causes underlying health conditions across our
county. HMP has continued to make sustainable progress in improving the health of
Marin County residents by relying on data to inform decisions, establishing consensus
among stakeholder and community members on focus areas, and identifying and
supporting the need for environmental and systems changes.

HMP CHA Summary Report
10
Healthy Marin Partnership Timeline
CORE FOCUS
ACHIEVEMENTS &
SUSTAINED WORK
CORE WORK
1995 Community Assessment and
Report Card Triennial Needs
Assessment
Core Assessment
Planning Group
Children’s Health
Initiative
Peer Summit
Play Fair & Fun Fest
Community Health
Collaboratives
Convened 1st Leaders
Table of Festival
Organizers
Community Focus
Groups to Identify
Community
Conditions
Health in All Policies &
Stakeholder Forums
Key Informant
Interviews &
Countywide Focus
Group Meetings
Countywide
Implementation
Planning
RxSafe Marin
HEAL 2.0
Whole Person Care
1996 Access/Health Insurance for
All Marin County Children
Youth Wellness
Marin County Fair – Play Fair
1999 Asthma, Immunizations
2002 Healthy Choices Earlier in Life
Action Plan
✓ Nutrition & Activity
✓ Alcohol Use
✓ Tobacco Use
2003-
2006
Collective
Responsibility/Focusing on
Environmental Changes
2007-
2009
Connect with “Champions” of
Important Marin Health
Initiatives (Aging, Breast
Cancer, Cardiac Disease,
Chronic Conditions)
Strengthen Results-Based
Accountability
Community Resource &
Convener
2010-
2011
Root Cause – Social
Determinants of Health (Equity
Focus)
2012-
2014
HEAL Countywide Planning
CHNA and Implementation
Plan
2015-
2018
Mental Health/Substance
Abuse
Access to Care
Whole Person Care
2019-
Present
TBD ADVANCING
EQUITY
STAYING THE
COURSE
TURNING THE
CURVE
TAKING ACTION
MAKING
PROGRESS

Understanding Social Determinants of Health
Road to Equity
How Advancing Equity Contributes to a
Community’s Health IN
TH
IS S
EC
TIO
N

HMP CHA Summary Report
12
How Advancing Equity Contributes to a Community’s
Health HMP believes everyone in Marin should have the opportunity to live a long, healthy life
regardless of income, education, location, race, gender, or ethnic background. These
factors and others are referred to as social determinants of health. Racism, intentional
and unintentional, is a driving force negatively impacting the social determinants of
health and is a barrier to health equity. HMP uses the CHNA/CHA process as an
opportunity to analyze community conditions that result in poor health, explaining how
they affect an individual’s health.
Marin County’s ranking as one of the healthiest counties in California3 correlates with
our top rank in the state in median per capita income, reflecting the association of
affluence with health. In deepening our analysis of the community’s health needs, we
have identified equity gaps by race, ethnicity, and zip code. In 2017, Marin had the
highest level of racial and ethnic inequities of all California counties.4 These inequities
are the result of historic and pervasively inequitable systems, including exclusionary
policies and practices. The county’s population is nearly three-quarters White, a relative
lack of racial and ethnic diversity that further exacerbates the equity divide.
For people of color in Marin, inequities mean less access to opportunity, which, in turn, is
associated with poor health outcomes. For example, a key indicator of success is
participation in a pre-K education program. Latinx children in Marin are less likely to
enroll in pre-K programs than Whites (35% vs. 85%5). In addition, only 5% of White
students do not graduate from high school, in comparison to 18% of Black/African-
American students.6 Median household income in Marin in 2017 was $113,908, while
median income data over a five-year period (2013-2017) indicates median income for
Black/African-American households is around half of that, at $60,849.7
3 County Health Rankings & Roadmaps, Robert Wood Johnson Foundation <http://www.countyhealthrankings.org> 4 RaceCounts.org (2017) <https://www.racecounts.org/> 5 Marin Kids Action Guide 2017 <https://www.marinkids.org/wp-content/uploads/2017/03/MarinKids-Action-Guide14.pdf
> 6 Racecounts.org: Data source: California Department of Public Health Death Master File, California Department of
Finance population estimates (2007-2011, 2006-2010) 7 We recognize that uppercasing of names of racial and ethnic groups may make some readers uncomfortable. Racial
and ethnic categories are historically contingent, socially constructed, and flawed. For both clarity and consistency,
however, we decided to capitalize all names of racial and ethnic demographic categories in this report.

HMP CHA Summary Report
13
Understanding Social Determinants of Health Social determinants of health are conditions in
the environments in which people are born,
live, learn, work, play, worship, and age that
affect a wide range of health, functioning, and
quality-of-life outcomes and risks. Conditions
(e.g., social, economic, and physical) in these
various environments and settings (e.g., school,
church, workplace, and neighborhood) have
been referred to as “place.”8 In addition to the
more material attributes of “place,” the
patterns of social engagement and sense of
security and well-being are also affected by
where people live. Resources that enhance
quality of life can have a significant influence
on population health outcomes. Examples of
these resources include safe and affordable
housing, access to education, public safety,
availability of healthy foods, local emergency
services, local health services, and
environments free of life-threatening toxins.
Understanding the relationship between
how population groups experience “place”
and the impact of “place” on health is
fundamental to addressing the social
determinants of health—including both
social and physical determinants.9
The U.S government’s Healthy People 2020
defined a “place-based” organizing
framework that includes five key areas:
Economic Stability, Education, Social and
Community Context, Health and Health
8 The Institute of Medicine. Disparities in Health Care: Methods for Studying the Effects of Race, Ethnicity, and SES on
Access, Use, and Quality of Health Care, 2002 9 Healthy People 2020 https://www.healthypeople.gov/2020/topics-objectives/topic/social-determinants-of-health#five
KEY DETERMINANTS EXAMPLES
Economic Stability
Employment
Food Insecurity
Housing Instability
Poverty
Education
Early Childhood Education
and Development
Enrollment in Higher
Education
High School Graduation
Language and Literacy
Social and
Community Context
Civic Participation
Discrimination
Incarceration
Social Cohesion
Health and
Health Care
Access to Health Care &
Mental Health
Access to Primary Care
Health Literacy
Quality Health Care
Neighborhood and
Built Environment
Access to Foods that Support
Healthy Eating Patterns
Crime and Violence
Environmental Conditions
Quality of Housing

HMP CHA Summary Report
14
Care, and Neighborhood and Built Environment.10 Examples of these key determinants
are listed in the table above.
Guided by the framework suggested by the social determinants of health and by the
focus and findings of the 2016 CHNA in Marin County, the 2019 CHA process continues
the strong emphasis on identifying and addressing health inequities.
Road to Equity As part of its strategic planning process, in 2017 the Marin County Department of Health
and Human Services assembled 10 focus groups including a total of 144 residents from
across Marin. The aim was to identify needs for vulnerable populations and gather
feedback, from clients and eligible non-clients, about barriers to accessing social,
behavioral health, recovery, and public health programs and services Marin HHS
provides. The findings from HHS’s strategic planning efforts are woven into the 2019
CHA where applicable.
The vulnerable populations represented included people with limited English
proficiency, people of color, people who are homeless, undocumented immigrants,
transition-age youth, and older adults. The majority, 69% of the 82 participants
representing vulnerable populations, reported a household income of $39,999 or less.11
Key findings from these focus groups:
1. Affordable housing in Marin County. Participants emphasized several issues
associated with housing in Marin, including high cost of rent, lack of available
affordable housing options, and overcrowding in units.
2. High cost of living relative to wages. Participants identified a discrepancy
between low incomes and the high cost of living in Marin.
3. Eligibility gap for those who do not qualify for services but are in need of
assistance. Many individuals and families are struggling with Marin’s high cost of
living but are not eligible to receive services because of income thresholds or
citizenship status.
4. Benefits are not enough to cover basic needs. Participants noted that some
public assistance benefits (such as Medi-Cal, General Assistance, subsidized child
care, CalFresh) are not enough to meet their housing, food, transportation, and
other basic living expenses.
5. Lack of transportation. Participants who do not drive or own a car say Marin’s
dearth of public transit options makes it difficult to access services, healthy food,
and jobs.
10 ibid. 11 Marin HHS Focus Group Findings, July 2017

HMP CHA Summary Report
15
6. Insufficient mental health and substance abuse resources. Participants
identified a need for additional support for residents struggling with psychological or
substance use issues, particularly those nearing a point of crisis.
7. Lack of affordable child care and difficulty accessing subsidized services.
Participants described wait lists of more than two years for subsidized child care,
which makes it challenging for parents to hold a job.
8. Priority needs identified by specific populations:
a. Populations with Limited English Proficiency – Language translation needed
when receiving or applying for services. (Vietnamese and Spanish)
b. Undocumented Immigrants – Health care insurance coverage for adults.
c. Older Adults – Solutions for isolation and increased supportive services.

16
Community Health Assessment (CHA)
Process and Methodology
About Marin County
Demographic Profile of Marin County Residents
Socioeconomic Data
IN T
HIS
SEC
TIO
N

17
Community Health Assessment (CHA) Process and
Methodology
The 2019 HMP CHA process was informed by the collaboration with area hospitals on
the CHNA; however, the CHA also incorporated data from the HHS strategic planning
process conducted by Raimi & Associates, along with additional secondary data
collected after the 2018 CHA/CHNA Community Prioritization event, to deepen
understanding of inequities within key areas of concern. The initial process included
collecting and compiling information from many different sources to assess all aspects
of health in Marin County. The top health needs were identified by review and analysis
of existing data and input from key informants and residents, from both the HHS
strategic planning 2017 focus groups and the 2017 interviews.
This Community Health Assessment incorporates data from existing secondary resources
as well as analysis of primary data collected from community residents and key
stakeholders. Harder+Company used the Kaiser Permanente CHNA Data Platform
(http://www.chna.org/kp) to review 130 indicators from publicly available data sources
such as American Community Survey (ACS) and County Health Rankings. Other data
sources beyond those in the CHNA Data Platform also helped provide a more in-depth
understanding of Marin’s health issues (e.g., California Healthy Kids Survey, Marin
County Point in Time Homeless Count and Survey, and Commission on Aging: Housing
Report). As mentioned above, additional secondary data sources were reviewed and
incorporated into this HMP report after the Community Prioritization event and will differ
from the hospital reports. Again, this step was taken in order to include more recent
data and varied sources, to achieve a deeper analysis of inequities. For details on
specific sources and dates of the data used, please see Appendix: Secondary data
sources and dates.
Data sources included:
Analysis of over 130 health indicators from publicly available data sources such as the Kaiser
Permanente CHNA Data Platform, the American Community Survey, and the County Health
Rankings.
Interviews with 31 key informants from various sectors with expertise in local health needs,
including leaders who work in health care, education, community services, older adult care,
youth development, and homeless services, among others.
In addition to the 10 focus groups included in HHS strategic planning efforts outlined in “Road
to Equity,” above, three additional focus groups involving 22 Marin community members were
convened. Participants included youth served by the Marin County Youth Court program in
San Rafael, LGBT community members served by the Spahr Center in San Rafael, and parent
members of the District English Language Learners Advisory Council of San Rafael City Schools.
Data analysis identified 10 key health needs for Marin County. Healthy Marin Partnership
then organized over 30 stakeholders representing diverse sectors, including public
health and health care, early childhood education, community-based organizations,
local business partners, and local government. These stakeholders participated in the

18
Community Prioritization event in December of 2018. This event was a community
meeting to review key data for each identified health need and prioritize these based
on three criteria:
Severity: Severity of need demonstrated in data and interviews. Potential to cause death or extreme or
lasting harm. Data significantly varies from state benchmarks. Magnitude/scale of the need, where
magnitude refers to the number of people affected.
Clear Disparities or Inequities: Health need disproportionately impacts specific subpopulations based
on geography, age, gender, race/ethnicity, or sexual orientation.
Impact: The ability to create positive change regarding this issue, including potential for prevention,
addressing existing health problems, mobilizing community resources, and the ability to affect several
health issues simultaneously.
About Marin County Marin County is just north of San Francisco by way of the Golden Gate Bridge. The
county includes large areas of open space, including national protected areas (such
as Muir Woods National
Monument), state and local
protected areas (such as those
managed by Marin County
Department of Parks and Open
Space), and state parks (such
as Mount Tamalpais).
Much of Marin’s population
lives along the Highway 101
corridor, creating an urban
environment in the eastern-
central part of the county and
a more rural environment along
the coast and the Highway 1
corridor in West Marin.
Marin has consistently been
ranked as one of the healthiest
counties in California,
according to the Robert Wood
Johnson Foundation’s County
Health Rankings. For nine out of the past 10 years, Marin has held the top spot on this list.
Although there is much to celebrate regarding the positive health outcomes in our
county, there are clear inequities indicating that not all Marin County residents are able
to achieve positive health outcomes. Healthy Marin Partnership is committed to
identifying and addressing these inequities to ensure ALL of Marin’s residents are able to
live the healthiest life possible.

19
Demographic Profile of Marin County Residents
TOTAL POPULATION
260,814
Population by Age
Marin County is home to 260,814
residents.13 With a median age of 46.114
and a high percentage of older adults,
Marin County is one of the “oldest”
counties in the Bay Area. Persons over
the age of 60 are estimated to number
72,684, comprising 28%15 of the county’s
total population; by 2030, persons over
60 will account for at least 33% of the
population. Statewide, persons over 60
account for 18% of the population.16
An aging population presents unique
health challenges that call for particular
strategies and solutions. The 2016 Marin
County Area Agency on Aging (AAA)
Older Adult Needs Assessment identified
six top concerns among respondents:
falls, dementia, economic security, elder
abuse, end-of-life planning, and feeling
isolated or depressed.17
12 U.S. Census Bureau, Population Estimates Program
(PEP), ACS 13 Ibid. 14 Ibid.
Youth 19 and under make up 22% of
Marin’s population. Due to the high cost
of living in Marin, families with young
children face significant challenges.
Almost one-fourth (23%) of Marin
children are living at or below 199% of
the federal poverty level ($50,000 for a
family of four). Families are finding they
need to make difficult decisions
between paying for housing, paying for
food, and paying for quality child care
and education for their children. It is
important for us as a community to
support and empower our young
families by advocating for well-paying
jobs for parents and ensuring affordable
quality educational opportunities for all
children in Marin.
15 American Community Survey 2017 16 Area Plan for Aging 2016-2020 FY 2018/2019 Update 17 Ibid.
Population by Gender 12
Female 51%
Male 49%
0-19
years
22%
20 to 60
years
50%
60 and
over
28%
Population by Age

20
Population by Race
Although the majority of its residents identify as White, Marin County is becoming an
increasingly diverse community. As we plan interventions to improve our population’s
health outcomes, it is imperative to take into consideration the historic factors that have
shaped the health inequities of our diverse populations.
Marin County Population by Race and Ethnicity, 2012-2017
White, NH Hispanic/Latinx
Asian, NH 2 or More Races, NH
Black/African American, NH Some Other Race, NH
American Indian/Alaska Native, NH Native Hawaiian/Pacific Islander, NH

21
Socioeconomic Data
Poverty in Marin While Marin ranks among the top counties in
the country in terms of economic wealth and
community resources, not all people in Marin
have access to or benefit from these riches,
according to residents participating in our
data- collection. Geographically, a starkly
uneven distribution of education,
employment, and wage outcomes is evident,
with the Canal region, Marin City, and West
Marin facing the greatest barriers to
economic security.
To be effective in reducing inequities, we
need to understand historic factors that have
shaped them throughout the county. Marin
City, where the county’s largest number of
Black/African-Americans live, and San
Rafael’s Canal district, a majority-Latinx
neighborhood, are examples. While residents
in both communities demonstrate great
resiliency and strength, social and structural
factors have created pronounced inequities
along racial and ethnic lines.
In the 1940s, the federal government
constructed residential developments in Marin City to house workers for the Sausalito-
based Marinship shipyard, created to build ships and tankers for World War II. Thousands
of Black/African- American workers moved for this purpose from the Midwest and the
South to Marin. When World War II ended, many Marinship Corporation workers lost their
jobs. Most of Marin City’s White residents relocated—but for Black/African-American
residents, racially discriminatory laws and policies severely limited housing and
employment opportunities elsewhere.18 19 Over decades, unequal educational
opportunities, unjust application of law enforcement, insufficient access to health care,
and inadequate access to healthy food, along with broad and overarching overt and
covert racial discrimination, correlated with poor health outcomes.20
18 (2015) “History of Marin City.” Marin City Community Development Corporation. https://www.marincitycdc.org/marin-
city-history/ 19 Crispell, M. (2015) Marin City: Historic African-American Enclave at Risk. UC-Berkeley Center for Community Innovation. https://www.urbandisplacement.org/sites/ default/files/marin_city_final.pdf
20 2012-2016 American Community Survey.
413 417293
1,021 1,082
1,974
0
500
1000
1500
2000
2500
<100% FPL 100-250% FPL 250-500% FPL
Co
un
t
Poverty Status by Ethnicity,
2013-2017, Marin County
Hispanic Not Hispanic
15.7%
48.1%
30.6%
8.1%
13.1%
11.9%
24.7%
10.7%
20.4%
13.3%
18.5%
18.8%
0.0% 20.0% 40.0% 60.0% 80.0%
Asian/PI
Black
Other
White
Percent of Racial Group in Poverty
Level
Poverty Status by Race,
2013-2017, Marin County
<100% FPL 100-250% FPL 250-500% FPL

22
San Rafael’s Canal area began as an industrial and residential neighborhood in the
1950s and 1960s, with small housing units in multifamily buildings. The neighborhood’s
population is increasingly Latinx, with families living here for relatively lower rents and
proximity to jobs often involving manual labor. Lack of access to resources like preschool
education, adequate housing, nutritious food, and health care coverage contribute to
poor health and other detrimental outcomes. While employment rates are high, many
low-wage jobs do not offer critical benefits like paid sick leave nor many opportunities
to advance.21 22 In addition, increasing numbers of Canal area residents are from Central
American countries where violence is prevalent, increasing the likelihood that many
suffer from effects of trauma and adverse childhood experiences. The systemic
marginalization of Latinx communities in Marin—due to overcrowded housing, low pay,
federal immigration policies, or lack of culturally appropriate behavioral health care,
among other factors—contributes to poor health outcomes.
While racial and economic segregation are not unique to Marin, they
perpetuate inequities for people of color by dictating where people can
live and limiting long-term social and economic mobility. Residential
segregation restricts residents’ social and professional networks, denying
them relationships and knowledge needed to advance professionally.23 The
cumulative and continued effects of structural racism in the county and
21 Crispell, M. (2015) Canal: An Immigrant Gateway in San Rafael at Risk. UC-Berkeley Center for
Community Innovation. http://iurd.berkeley.edu/uploads/Canal_FINAL. pdf
22 Burd-Sharps, S and Lewis, K. (2012) A Portrait of Marin:Marin County Human Development Report 2012. American Human
Development Project of the Social Science Research Council. http://www.measureofamerica.org/ docs/APOM_Final-
SinglePages_12.14.11.pdf
23 Andrews, R, Casey, M, Hardy, BL, and Logan, TD. (2017) “Location Matters: Historical Racial Segregation and Intergenerational Mobility.” http://www.bradleyhardy.com/ wp-content/uploads/2017/06/ACHL_full_ manuscript_052617.pdf
281215
688
250307
98
699
395451
116
1142
558
0
200
400
600
800
1000
1200
0-18 19-25 26-65 65+
Co
un
t
Age Group
Poverty Status by Age Group, 2013-2017, Marin County
<100% FPL 100-250% FPL 250-500% FPL

23
throughout the U.S. have shaped our communities and resulted in specific
negative effects felt by many residents of color today.
In Marin, 8.08% of the population lives below 100% of the federal poverty level (FPL);
however, this number does not tell the true story of poverty in Marin. For a better
picture, we need to consider the Self-Sufficiency Standard.
The Self-Sufficiency Standard calculates cost of living by measuring how much money is
required to meet one’s basic needs for housing, food, transportation, medical care,
child care, and taxes, without any public subsidies such as welfare or food stamps.
According to the Self-Sufficiency Standard Tool for California, a family of four with two
young children must have an annual income of $102,223 to be able to make ends
meet in Marin County.24 The 2019 federal poverty guidelines state that a family of four
lives in poverty if yearly income is under $25,750.25
To afford day-to-day living in Marin County, you
need about four times that amount each year.
Median Income
The median income in Marin County in 2017 was
calculated at $113,908.26 Median income is a
helpful indicator of a community’s economic
health but does not present the whole picture: a
high median income can mask wide disparities in
income levels among residents. These divides are
particularly stark along lines of race/ethnicity and
citizenship status.
Unemployment Rate
Marin County had the third-lowest
unemployment rate (2.4%) in the state of
California in 2019, according to the California
Employment Development Department.27
However, when you look at the rates over time
and by race, you recognize that unemployment
is disproportionately affecting certain populations.
24 https://insightcced.org/tools-metrics/self-sufficiency-standard-tool-for-california/ 25 https://aspe.hhs.gov/poverty-guidelines 26 https://datausa.io/profile/geo/marin-county-ca/ 27 https://www.labormarketinfo.edd.ca.gov/cgi/databrowsing/localAreaProfileQSResults.asp?selectedarea=Marin+County
&selectedindex=21&menuChoice=localAreaPro&state=true&geogArea=0604000041
$112,819
$60,849
$96,831
$47,826
$0
$20,000
$40,000
$60,000
$80,000
$100,000
$120,000
White Black Asian Other
Do
llars
Median Household Income by
Race, 2013-2017, Marin
County
4.1%
9.3%
6.3%
3.9%
0.0%
2.0%
4.0%
6.0%
8.0%
10.0%
Asian/PI Black Other White
Pe
rce
nt
Unemployment by Race,
2013-2017, Marin County

24
Housing
In 2017, the median property value in Marin County grew
to $1.01 million from the previous year’s value of
$974,600. Approximately 64% of housing units in Marin
were owner occupied in 2017, and 36% were occupied
by renters.28
The fair market rental rate for a two-bedroom apartment
in Marin was $3,121 in 2018. To pay that would have
required an annual household income of $124,840, or
the equivalent of 5.5 full-time jobs at minimum wage.29
Homelessness
As of 2019, 1,034 Marin County residents were experiencing homelessness. With the
implementation of the Whole Person Care program, the number of chronic homeless
residents in Marin has decreased from 1,309 individuals in 2015 and is expected to
continue to decrease.30
28 https://datausa.io/profile/geo/marin-county-ca/ 29 National Low-Income Housing Coalition 30 Marin County Homeless County & Survey Comprehensive Report 2019
64%18%
15% 2%
Population Experiencing
Homelessness by Race,
2017, Marin County
White Other Black Asian
124 121
784
88
0
500
1000
Under 18 18-24 25-59 60+
Co
un
t
Population Experiencing
Homelessness by Age
Group, 2017, Marin County

25
Education by Race and Ethnicity
While some education
outcomes are higher for Marin
County residents when
compared to the rest of
California, disparities—
particularly among English
language learners,
Black/African-Americans, and
Latinx students—indicate that
educational equality is a high
concern in the county. Latinx
children in Marin are less likely
to enroll in pre-K education, a
key indicator of success, than
Whites (35% vs. 85%31).
Among White third graders, 76% demonstrate English and language arts proficiency
compared to just 32% of Latinx students and 27% of Black/African-Americans.32 In
mathematics, 73% of White third graders are proficient compared to 28% of Latinx
students and 31% of Black/African-Americans.33
These disparities are present in both achievement outcomes (e.g., reading/math
proficiency) and educational attainment (e.g., college attendance). For example, 96%
of Asians and 95% of Whites graduated from high school, compared to 86% of Latinx
and 82% of Black/African-Americans.
Population Without Health Insurance
In Marin County, approximately 5.2% of the
population has no health insurance. For youth
aged 18 and under the percentage of uninsured
individuals is 1.3% compared to 5.6% for residents
above the age of 18.
Having health insurance is important for several
reasons. No one plans to get sick or hurt, but most
people need medical care at some point. Health
insurance covers these costs and offers many
other important benefits. People who have health
insurance seek medical advice and receive
treatment before a minor issue becomes life-threatening. Uninsured people receive less
31 Marin Kids Action Guide 2017 <https://www.marinkids.org/wp-content/uploads/2017/03/MarinKids-Action-Guide14.pdf
> 32 California Healthy Kids Survey, Marin County Elementary Main Report 2017-18. Healthy People 2020. Retrieved from
http://www.healthymarin.org/indicators/index/dashboard?alias=hp2020 33 Ibid.
5.2%
94.8%
Health Insurance
Coverage Status,
2013-2017, Marin
County
Uninsured Insured

26
medical care and less timely care, they have worse health outcomes, and lack of
insurance is a financial burden for them and their families. When minor problems
escalate, uninsured patients often need to seek care in the most expensive setting—
hospital emergency departments. Treating preventable illness through emergency
departments is contrary to sound health policy.
Insurance status is another area where racial disparities exist in Marin. Hispanic or Latinx
community members are less than 16% of the total population of Marin County but
account for almost half of the uninsured population.34
34 2013-2017 American Community Survey.
6.0%3.0%
36.5%54.5%
Uninsured Residents by
Race,
2013-2017, Marin County
Asian/PI Black Other White
48.4%51.6%
Uninsured Residents by
Ethnicity, 2013-2017, Marin
County
Hispanic/Latinx Not Hispanic

27
Priority Health Needs Overview

28
Priority Health Needs Overview The following summaries of the 10 health needs that emerged as top concerns during
the CHA/CHNA process indicate that Marin County stakeholders prioritize addressing
the social determinants of health in order to build a healthier and stronger community.
The order of the health needs reflects the final prioritization of needs identified by the
process described above; see the “Community Health Assessment (CHA) Process and
Methodology” section for the criteria used.
PRIORITIZED
RANK
HEALTH NEED
1 Economic Security
2 Education
3 Mental Health and Substance Use
4 Access to Care
5 Housing and Homelessness
6 Healthy Eating and Active Living
7 Maternal and Infant Health
8 Violence and Injury Prevention
9 Oral Health
10 Social Connection

29
Ec
on
om
ic S
ec
urity
•Importance:•Economic security means having the financial resources, public supports, and career and educational opportunities that are necessary to live your fullest life.
•Data Snapshot•45% of Marin County residents spend more than 30% of their income on rent3
•Median household income for White families is twice as high as the median household income of Black/African-American and Latinx families3
•25% of Latinx children in Marin County live below the federal poverty level3
•The unemployment rate for Black/African-American residents is three times higher than for White residents. The rate for Latinx residents is one and a half times higher than for White residents3
Ed
uc
atio
n
•Importance:•Education attainment is a primary factor that influences an individual's health. It can both shape the economic opportunities that impact health outcomes and inform people about how to achieve a healthy lifestyle.
•Data Snapshot•25% of Marin 3-to-5-year-olds are not enrolled in preschool2
•78% of Asian students, 76% of White students, 33% of Latinx students, and 28% Black/African-American students met third-grade proficiency standards in math and reading19
•The rate Marin students drop out of high school has increased over the past few years, from 1% of students in the 2014-15 school year to 6% in the 2016-17 school year19
•Only 68% of Latinx residents have obtained at least a high school diploma, compared to 98% of White, 93% of Asian, and 85% of Black/African-American residents3
98% 93%85%
68%
0%
20%
40%
60%
80%
100%
White Asian Black/AA Latinx
Residents with a High School Diploma or Higher, 2012-16
“In Marin County, we have the largest
income gap between rich and poor—and
White and people of color—in the entire
state.” – Focus Group Participant
“Education level is one of the biggest social
determinants of health…Because if they don't
have that, they won't be able to get a decent
job, or live in a decent place, or be civically
engaged to keep the community strong.” –
Key Informant

30
Me
nta
l H
ea
lth
an
d S
ub
sta
nc
e U
se
•Importance:• Mental health and substance use has a major impact on individuals, families, and communities. The effects of mental health and substance abuse are cumulative, contributing to costly social, physical, mental, and public health problems.
•Data Snapshot:• 26% of adults in Marin report needing help with mental, emotional, or substance abuse problems8
• 30% of auto fatalities in Marin involve alcohol-impaired driving14
• The suicide rate in Marin is 66% higher (16.4/100,000 people) than the state average (10.9/100,000 people)15
• Drug overdose is the number-one cause of accidental death in the county in people under 65 years of age15
• 29% of Latinx, 19% of Asian and Black/African-American, and 18% of White seventh graders reported feeling chronic sadness or hopelessness feelings in the past 12 months10
Ac
ce
ss t
o C
are
•Importance:• Access to comprehensive, quality health care services is important for promoting and maintaining health, preventing and managing disease, reducing unnecessary disability and premature death, and achieving health equity for all Americans.
•Data Snapshot:• In Marin, 92% of adults ages 18-64 have health insurance and 98% of children have health insurance7, 1
• 94% of Asian, 93% of White, 80% of Latinx, and 52% of Black/African-American residents have a usual source of health care7
• 13% of adults in Marin reported delaying or having difficulty accessing health care that they felt they needed8
• People who recently gave birth and were covered by Medi-Cal were less likely to have a pre-pregnancy usual source of care (64%) than those with private insurance (89%). Medi-Cal beneficiaries were also less likely to have prenatal care during their first trimester (86%) than those with private insurance (99%)13
“There is still the stigma of mental health
and substance abuse. In many communities,
the concept of mental health is so foreign or
not even part of their culture.” – Key
Informant
“If you are a person who has economic
insecurity, you have to think whether it's
worth it to take the day off, or just muscle it
back and say, ‘It's not that severe anyway.’ ”
– Key Informant
18%
19%
19%
29%
White
Asian
Black/AA
Latinx
Seventh Graders Reporting Sadness or Hopeless Feelings in the Past Year by
Race, 2017-18 School Year
0%20%40%60%80%
100%
Usual Source of Pre-pregnancy Care
Prenatal Care in 1stTrimester
Care Utilization by Insurance Type, 2013-2015
Medi-Cal Private

31
Ho
usi
ng
an
d H
om
ele
ssn
ess
•Importance:•When an indiviudal experiences barriers to housing, the ability to lead a healthy, productive life is severely affected.
•Data Snapshot• 19% of homeless residents in Marin are under 25 years old21
• Black/African-American residents are 17% of the homeless population in Marin, but only 2.2% of the total county population21
• 23% of Marin residents have severe housing problems, which include overcrowding, high housing costs, lack of kitchen, or lack of plumbing facilities14
• Only 25% of Black/African-American and Latinx residents are homeowners, compared to 66% of White residents2
He
alth
y E
atin
g a
nd
Ac
tiv
e L
ivin
g
•Importance:•Healthy lifestyle choices, including the food we eat and how much we exercise, greatly affect the rates of chronic conditions, such as cardiovascular disease, stroke, and cancer.
•Data Snapshot:• In 2017, 10 million meals were missed by residents in Marin24
• 14% of Marin children live in homes that experience food insecurity at some point during the year16
• 41% of Black/African-American, 40% of Latinx, 23% of Asian, and 15% of White Marin fifth graders are obese17
• Only 27% of 12-to-17-year-olds get the recommended number of servings of vegetables daily7
1.2x 1.4x
“It's cheaper to go to McDonald's than it is
to go to Whole Foods. And if you're
working for 12 to 14 hours a day, how are
you gonna go out and take an hour-and-a-
half walk?” – Key Informant
15%
23%
40%
41%
0% 10% 20% 30% 40% 50%
White
Asian
Latinx
Black/AA
Fifth Graders Who Are Obese by Race, 2017-18 School Year
“The fact is that Marin as a whole sees
homelessness as a failing of the person
experiencing homelessness and not a failing
of the society that allowed them to become
homeless. I think that really creates
barriers.” – Key Informant
19%
81%
Youth Homelessness in Marin County, 2019
Under 25 25+

32
Ma
tern
al a
nd
In
fan
t H
ea
lth
•Importance:• The well-being of mothers, infants, and children determines the health of the next generation and can predict future public health challenges for families, communities, and the health care system.
•Data Snapshot:• Between 2008 and 2017, 10% of Black/African-American infants were born preterm, compared to 8% of Latinx and White infants and 7% of Asian infants20
• Between 2013 and 2015, 74% of Latinx mothers were living at or below the federal poverty line, compared to 17% of White and 5% of Asian mothers13
• 11% of Black/African-American newborns, 7% of Asian newborns, 6% of Latinx newborns, and 6% of White newborns were low birth weight between 2008 and 201720
• 1 in 10 women who recently gave birth in Marin County report postpartum depression symptoms13
Vio
len
ce
an
d In
jury
Pre
ve
ntio
n
•Importance:• Beyond their immediate health consquences, injuries and violence have a significant impact on everyone, contributing to early death, disability, poor mental health, high medical costs, and lost worker productivity.
•Data Snapshot:• Falls are the number one cause of accidental death for seniors in Marin County22
• Marin County’s rate of bicycle-involved collisions that result in bicyclist injury or death is 1.6 times higher than the state rate11
• Within Marin, the city of San Rafael has the highest rate of domestic violence calls4
• Asian and Black/African-American students in Marin are more likely to report bullying or harassment (40% and 43%, respectively) than Asian and Black/African-American students in California overall (30% and 35%, respectively), while White and Asian students were less likely to report bullying in Marin than in the rest of the state9“I think with the high cost of living, it also
affects the lack of child care, not having
qualified people who can take care of your
children while you work two jobs.” – Key
Informant
“The biggest crime in Marin County is
domestic violence. And VOWA, the Violence
Against Women Act, they actually say that
if you could cure poverty, you could have
many things cured, including things like
domestic violence.” – Key Informant
9x higher
Marin, 1.3x higher
6%
6%
7%
11%
White
Latinx
Asian
Black
Low Birth Weight Infants by Race, 2008-17, Marin County
21%24%
40%43%
WhiteLatinxAsianBlack
Students Reporting Being Bullied in School by Race, Marin County and
California, 2013-15

33
Ora
l H
ea
lth
•Importance:• The impact of untreated oral health conditions disproportionately affects the most vulnerable populations and contributes to such conditions as cardiovascular disease and poor pregnancy and birth outcomes.
•Data Snapshot•56% of adults in Marin have dental insurance8
•In 2016, only 22% of Medi-Cal-eligible adults in Marin had an annual dental visit23
•Between 2012 and 2016, Marin had a 30% higher age-adjusted rate of oral cavity and pharynx cancer (13.13/100,000) than the statewide age-adjusted rate (10.04/100,000)6
•In 2016, only 65% of incoming kindergarten students had a dental screening through the Kindergarten Oral Health Assessment5 S
oc
ial C
on
ne
ctio
n
•Importance:• Social connections can directly impact mental health, and their influence on lifestyle has important consequences for physical health.
•Data Snapshot:• 71% of white junior high and high school students reported a high level of school connectedness, compared to 65% of Asian students, 53% of Latinx students, and only 40% of Black/African-American students9
• 49% of White, 39% of Asian, 32% Latinx, and 27% of Black/African-American students strongly agree that they have a caring relationship with an adult at school9
• In Marin, the percentage of seniors living alone is 35% higher than the rest of the state3
• 44% of Marin commuters drive alone to work and commute for longer than 30 minutes14
• Between 2015 and 2017, Marin’s suicide rate was 18% higher than the state average22
“I know it's a long history of more than 100
years of why dental services are separate
from medical health, so it's very political,
but we need to see it as one thing. When
people don't have good dental hygiene, it
can affect their other health needs.” - Key
Informant
“They’re self-medicating because, in Marin
County, there is an epidemic of loneliness. I
know it’s a huge problem in the senior
community and I see it in our kids too.” –
Key Informant
13.13
10.04
0
2
4
6
8
10
12
14
Marin CA
Rat
e p
er 1
00
,00
0
Age-adjusted Rate in Oral Cancer, 2012-2016, Marin and CA
30%
higher
12.710.4
0
5
10
15
Marin CA
Rat
e p
er 1
00
,00
0
Age-Adjusted Suicide Death Rate, 2015-2017, Marin County and
California
18%
highe
r

34
Next Steps
Organizing Community Resources to Respond to Identified Needs
Community Health Improvement Process
IN T
HIS
SEC
TIO
N

35
Next Steps Organizing Community Resources to Respond to Identified Needs
Marin County has a broad range of community-based organizations, government
departments and agencies, hospital and clinic partners, and other community groups
already engaged in addressing many of the health needs identified by this assessment.
HMP envisions a countywide, population health approach, to further align intervention
efforts among stakeholders and address priority health needs together.
Although the CHA/CHNA process did identify some community resources available to
address each prioritized health need, the CHIP process will further identify these
resources and highlight gaps to be addressed.
In addition, Marin County Health and Human Services’ Office of Aging and Adult
Services maintains an Information and Assistance telephone line at 415-457-INFO (4636)
and an online Community Resource Guide listing services and resources available to
county residents, at https://www.marinhhs.org/community-resource-guide to help older
adults, persons with disabilities, and their caregivers with information about and referrals
to services and resources.
Community Health Improvement Planning Process HMP will be conducting the Community Health Improvement Planning Process through
June 2020. If you are interested in participating in or learning more about this process,
please contact Kristen Seatavakin, senior department analyst with Marin County
Department of Health and Human Services’ Division of Public Health, at

36
Appendix Secondary data sources and dates
i. Secondary sources from the CHNA Data Platform
ii. Additional sources

37
Appendix: Secondary data sources and dates
i. Secondary sources from the CHNA Data Platform Source Dates
1. American Community Survey 2012-2016
2. American Housing Survey 2011-2013
3. Area Health Resource File 2006-2016
4. Behavioral Risk Factor Surveillance System 2006-2015
5. Bureau of Labor Statistics 2016
6. California Department of Education 2014-2017
7. California EpiCenter 2013-2014
8. California Health Interview Survey 2014-2016
9. Center for Applied Research and Environmental Systems 2012-2015
10. Centers for Medicare & Medicaid Services 2015
11. Climate Impact Lab 2016
12. County Business Patterns 2015
13. County Health Rankings 2012-2014
14. Dartmouth Atlas of Health Care 2012-2014
15. Decennial Census 2010
16. EPA National Air Toxics Assessment 2011
17. EPA Smart Location Database 2011-2013
18. Fatality Analysis Reporting System 2011-2015
19. FBI Uniform Crime Reports 2012-2014
20. FCC Fixed Broadband Deployment Data 2016
21. Feeding America 2014
22. FITNESSGRAM® Physical Fitness Testing 2016-2017
23. Food Environment Atlas (USDA) & Map the Meal Gap (Feeding
America) 2014
24. Health Resources and Services Administration 2016
25. Institute for Health Metrics and Evaluation 2014
26. Interactive Atlas of Heart Disease and Stroke 2012-2014
27. Mapping Medicare Disparities Tool 2015
28. National Center for Chronic Disease Prevention and Health Promotion 2013
29. National Center for Education Statistics-Common Core of Data 2015-2016
30. National Center for Education Statistics–EDFacts 2014-2015
31. National Center for HIV/AIDS, Viral Hepatitis, STD, and TB Prevention 2013-2014
32. National Environmental Public Health Tracking Network 2014
33. National Flood Hazard Layer 2011
34. National Land Cover Database 2011 2011
35. National Survey of Children’s Health 2016
36. National Vital Statistics System 2004-2015
37. Nielsen Demographic Data (PopFacts) 2014
38. North America Land Data Assimilation System 2006-2013
39. Opportunity Nation 2017
40. Safe Drinking Water Information System 2015
41. State Cancer Profiles 2010-2014
42. U.S. Drought Monitor 2012-2014
43. USDA–Food Access Research Atlas 2014

38
ii. Additional sources
Source Dates
1. American Association of Retired Persons 2012
2. Area Agency on Aging Marin County Plan 2016-2020
3. Behavioral Risk Surveillance Task Force 2017
4. Brown University, Diversity and Disparities Project 2010
5. California Department of Education, California Physical Fitness
Report 2014-2015
6. California Department of Education, School Level Data Files 2014-2015
7. California Department of Public Health 2010-2012
8. California Department of Public Health, Kindergarten Assessment
Results 2013-2015
9. California Health Interview Survey 2014-2015
10. California Healthy Kids Survey 2017-2018
11. California Office of Traffic Safety (OTS) 2016
12. California Oral Health Reporting 2008-2010
13. Centers for Disease Control 2013
14. Centers for Disease Control and Prevention 2008-2017
15. Commission on Aging, Housing Report 2018
16. County Business Patterns 2015
17. Insight Center 2012
18. Kidsdata.org, California Dept. of Justice, Criminal Justice Statistics
Center 2016
19. Marin Community Clinic 2013-2015
20. Marin County Human Development Report 2012
21. Marin County Oral Health Report 2014
22. Marin County Point in Time Homeless Count and Survey 2015
23. Marin Independent Journal 2015
24. MarinKids 2015
25. Maternal and Infant Health Assessments, California Department of
Public Health 2013-2015
26. National Cancer Institute 2011-2015
27. National Survey of Children’s Exposure to Violence 2015
28. National Vital Statistics System 2016
29. The California Pregnancy-Associated Mortality Review, California
Department of Public Health 2002-2007
30. U.S. Census Bureau (Economic Census) 2012
31. UCLA Newsroom 2006
32. Uniform Crime Reporting Statistics, U.S. Department of Justice 2012
33. USC Dornsife, Center for the Study Immigrant Integration 2016

39
iii. Priority Health Needs Overview Sources
1. American Community Survey (1-year estimate) 2017
2. American Community Survey (5-year estimate) 2012-2016
3. American Community Survey (5-year estimate) 2013-2017
4. CA Department of Justice Portal 2017
5. CA Kindergarten Oral Health Assessment 2016
6. California Cancer Registry 2012-2016
7. California Health Interview Survey 2015-2016
8. California Health Interview Survey 2016-2017
9. California Healthy Kids Survey 2015-2017
10. California Healthy Kids Survey 2017-2018
11. California State Highway Patrol 2015
12. CDC Birth Certificate Data 2008-2017
13. CDPH Maternal and Infant Health Assessment Survey 2013-2015
14. County Health Rankings 2019
15. EpiCenter, CDPH Vital Statistics Master File 2016
16. Feeding America 2017
17. FitnessGram, CA Department of Education 2018
18. Healthymarin.org, from County Health Rankings 2013-2017
19. Kidsdata.org, from CA Department of Education 2016
20. Marin County Birth Certificate Data 2008-2017
21. Marin County Point in Time Count 2019
22. Marin County Vital Records 2019
23. Medi-Cal Dental Services Division Data 2016
24. SF Marin Food Bank Missing Meals Report 2019

40
Healthy Marin Partnership Working Together to Create a Healthier Community
99 Montecillo Road
San Rafael, California 94903 w
ww.HealthyMarinPartnership.org
Phone: 415.492.6311
To receive additional copies of this report, or to download an electronic copy,
visit www.HealthyMarinPartnership.org.
© 2
01
9 H
ea
lth
y M
arin
Pa
rtn
ers
hip
De
sig
n: SP
IN M
ED
IA
Co
ve
r Ill
ust
ratio
n: N
ich
ola
s W
ilto
n