hear more, do more, be more - gn group · gn store nord a/s . hear more, do more, be more . gn...
TRANSCRIPT

GN Store Nord A/S
Hear More, Do More, Be More GN Group – Annual Report 2017

2 Management's report ⋅ Contents Contents
GN Group – Annual Report 2017
Management’s report 2017 at a glance 3 Global reach, local presence 4 Business model and strategy 5 Business areas and brands 6 Chairman's foreword 7 Consolidated financial highlights 9 Group performance 2017 10 Financial outlook 12 GN Hearing 15 GN Audio 22 GN accolades and awards 29 Corporate responsibility 30 Risk management 32 Shareholder information 37 Corporate governance 39 Board of Directors 43 Executive Management 45
Additional financial information 46 Q4 financial highlights 47 Quarterly financial highlights 48 Quarterly reporting by segment 49 Q4 segment disclosures 50 Financial statements Consolidated - Financial statements 2017 51 Parent company - Financial statements 2017 101 Statement by the Executive Management and the Board of Directors 113 Independent auditors’ report 114
Contents Our investment case Through relentless execution of our 2017 – 2019 strategy “Hear More, Do More, Be More”, we create shareholder value by commercializing our core competencies within sound processing in attractive markets.
GN Hearing Leader in customer-driven innovation in hearing aids based on unique sound processing systems and leading-edge wireless 2.4 GHz technology • Focused business model – dedicated wholesale
manufacturer, refraining from vertical integration
• Attractive market growth driven by sustainable megatrends in a consolidated industry with attractive profit margins
• Profitability in line with the best manufacturers in the industry
GN Audio The world’s leading supplier of Unified Communications headsets driven by customer-focused commercialization of a state-of-the-art product portfolio • Double digit mid- to long-term Call Center & Of-
fice (CC&O) market growth driven by sustainable market trends
• The core business operates in a consolidated industry with high barriers to entry
• Attractive operating margin and return on invested capital
Front page: Via an app on their smartphone, users of ReSound LiNX 3D™ hearing aids can request assistance for remote fine-tuning of their hearing aid settings as they experience a hearing difficulty – wherever they are.

3 Management's report ⋅ 2017 at a glance Contents
GN Group – Annual Report 2017
Revenue of DKK
9.6bn +11% vs 2016
EBITA of DKK
1.7bn
+10% vs 2016
Cash conversion
65% In line with industry peers
Share buybacks and dividends
DKK
1.4bn +6% vs 2016
Revenue split by region
EPS development (DKK)
4.154.61 4.79
7.348.07
0.0
1.0
2.0
3.0
4.0
5.0
6.0
7.0
8.0
9.0
2013 2014 2015 2016 2017
2017 at a glance
34%
48%
18%
Europe
North America
Rest of World

4 Management's report ⋅ Global reach, local presence Contents
GN Group – Annual Report 2017
Global reach, local presence The GN Group develops and manufactures innovative and intelligent audio solutions that are marketed and sold in around 100 countries across the world
Research & Development Manufacturing Sales and distribution
GN has R&D centers in Denmark, the United States, the Netherlands and China.
The Group commands a unique blend of leading expertise in the human ear, sound and speech, wireless tech-nologies, user-friendly software and miniaturization. GN annually invests more than 8% of its revenue in research and develop-ment.
GN has its central manufacturing sites for hearing aids in China, Malaysia and Denmark. Regional
manufacturing centers are located in the United States, Great Britain and Malaysia. GN’s headsets are produced by care-fully selected manufacturers in China, and most components are sourced from suppliers in Asia. GN Audio works with a small number of tier-one manufacturers supported by more than 100 sub-suppliers.
GN’s hearing aids are sold in around 100 countries across the world. GN has its own organization in 30
countries and operates via partners and distributors in another 70 coun-tries. GN’s headsets are sold via distributors and retailers in some 80 countries around the world. One global distribution partner is responsible for optimizing lead-time to the final customer, delivering from three regional warehouses in the United States, the Netherlands and Hong Kong.

5 Management's report ⋅ Business model and strategy Contents
GN Group – Annual Report 2017
Business model and strategy The GN Group’s lean and agile business model – along with its strategic focus on Innovation, Commercial and People Excellence – positions the Group strongly to seize the multiple business opportunities driven by global megatrends
Attractive megatrends A growing and aging world population as well as personal communication trends offer opportunities for intelligent audio solutions in industries with currently low penetration rates.
Making Life Sound Better GN is a global leader in intelligent audio solutions that let you hear more, do more and be more than you ever thought possible – with unique R&D competencies within medical, professional and consumer audio solutions.
Strategic agility - attractive shareholder returns A lean business model, with no owned retail, ensures a strong position in relation to future distribution trends. Resilient cash generation driving attractive shareholder returns.
2017 – 2019 Strategy
Synergistic M&A Merger and acquisition activities to support channel access, commercial excellence and technology leadership as well as to streamline activities.
Strong partnerships Strong track record of strategic partnerships with leading channels, customers and adjacent industry leaders.
Innovation Excellence GN’s sound technologies and ex-perience are directed at consist-ently developing unmatched user benefits. This strict innovation fo-cus has ensured multiple industry firsts by GN.
Commercial Excellence Commercial execution is continuously improved by expanding in the open market, strengthening partnerships, sharing best practices, going digital and engaging users.
People Excellence A series of programs strengthens strategy execution, leadership and people development across GN.
HEARMORE
DOMORE
BEMORE

6 Management's report ⋅ Business areas and brands Contents
GN Group – Annual Report 2017
Medical grade hearing devices and solutions
Professional and consumer audio solutions
GN’s history of producing industry-first sound solutions and pioneering advancements in technology include: 5th generation 2.4 GHz technology in hearing aids for direct connectivity; 3rd generation Binaural Directionality for leading natural sound; the world’s first Made for iPhone hearing aids with direct stereo sound streaming; the world’s first cloud-based remote fine-tuning solution; award winning apps providing optimal user experience and satisfaction.
GN’s professional headsets and speakerphone solutions are engineered to help businesses to be even more productive and to deliver supreme sound and great battery life to users for whom calls, music and media consumption are important. GN Audio created the world’s leading headset solution for office businesses, the world’s first active-noise-cancelling microphone, the world’s first Bluetooth headset and the world’s first wireless sports headphones with integrated heart-rate monitor, to name a few.
ReSound is the most innovative pre-mium hearing solution on the market, combining innovative design, user ex-perience and leading technology – all based on deep audiological insight and understanding of hearing aid users.
Jabra provides the most technically ad-vanced headset and speakerphone so-lutions, based on unique sound capabil-ities, engineered to fit the purpose for which they will be used.
Beltone provides high-quality personal-ized hearing care along with technically optimal hearing aids and solutions.
VXi and Blueparrott are best-in-class headset solutions delivering value, ex-cellence and innovation to contact cen-ters, offices and mobile professionals.
Interton delivers essential solutions de-signed to provide people with hearing impairment with a value based, afford-able hearing aid that is easy to use.
Audigy Group offers best-in-class business and performance manage-ment solutions to hearing care practices.
GN’s technology is founded in world-leading expertise in the human ear, sound, wireless tech-nology and miniaturization, linking deep insight and knowledge from the hearing aid and the headset industries – all under one roof. GN’s R&D spans a wide range of disciplines, including acoustics, signal processing, neurosci-ence, human-computer interaction, artificial intelligence, audiology, and engineering.
Business areas and brands The GN Group has a unique portfolio of hearing aids and headset solutions. The expertise behind our current range of innovative products gives GN multiple opportunities to develop new attractive intelligent audio solutions for many uses

7 Management's report ⋅Chairman's foreword Contents
GN Group – Annual Report 2017
Technology is rapidly changing our world, our businesses, and our everyday lives. The smartphone only just turned ten and life without one is already unthinkable to millions of people. Every fourth online search is now voice initiated. Over 30 mil-lion Americans have voice-activated speakers in their homes. Who would have seriously believed this just a few years ago. Today’s reality is that technology develops exponentially, not linearly. This is the reality in which GN must operate. GN’s vision is to be the leader in intelligent audio solutions that transform lives through the power of sound. Within our area of core expertise – sound processing – we intend to con-tinue to take the lead in major technology shifts. We see opportunities for huge advances in the years ahead. We will seize those opportunities with focused investments in both incremental and radical innovation. Major technology breakthroughs in 2017 In 2017, GN Hearing launched such a technology shift with the introduction of cloud-based remote fine-tuning in hearing aids. With ReSound LiNX 3D™ and Beltone Trust™ hearing aids, remote fine-tuning takes personalization to a whole new level, greatly benefitting hearing aid users and hearing care professionals. Personalization is a significant technology trend across multiple businesses, and we have only just seen the beginning within intelligent audio solutions. In GN Audio, technology leadership is distinctly demonstrated by the Jabra Evolve series of professional communications headsets. GN Audio has emerged as the world’s undisputed no. 1 solution provider for office businesses – more than 85 of the Global Fortune 100 corporations are Jabra customers. In 2017, the portfolio of professional products was further strengthened with the Jabra Speak 710 speakerphone and the Jabra Evolve 75 and 75e headsets – all fortifying GN Audio’s leadership in the attractive professional market. Short-term execution and long-term success We are approaching half-time in our current strategy period – the Hear More, Do More, Be More Strategy 2017 – 2019. We are very confident that we will deliver as planned and com-municated. At the same time, GN’s strategy sets up the com-pany for long-term success. The core pillars of the strategy
are to continue our leadership in innovation, to propel the company into being a leader in commercial excellence, and to excel in growing a winning organization. Innovation Excellence: An insistent focus on responding to the true needs of our customers and the users of our products and services permeates our idea and development processes. In 2017, we have further enhanced our product development and innovation processes to deliver an even higher degree of user benefits and uniquely value-adding solutions. This enables us to move faster from prototype to production and to continuously add new features to our products, so we can respond swiftly to trends in the market and to the needs of our customers. Those needs are also at the core of our collaborative work with external researchers and partners. In these partnerships, we explore the next radical innovation – such as the application of machine learning.
Leading major technology shifts
GN Hearing: Another industry-first with remote fine-tuning in hearing aids GN Audio: Jabra Evolve series is the world’s no. 1 in professional headsets
Chairman's foreword
”GN will continue to invest in technology
shifts that change the lives of people”
Per Wold-Olsen Chairman of the
Board

8 Management's report ⋅Chairman's foreword Contents
GN Group – Annual Report 2017
Commercial Excellence: To effectively support our ambitious growth agenda, we are rolling out a new sales methodology backed by a comprehensive hands-on training program for our sales teams, in order to enhance how we engage with cus-tomers and drive stronger partner relations and sales perfor-mance. Other commercial initiatives aim at tightening rela-tionships and collaboration with business partners, key ac-counts and key opinion leaders, and streamline brand man-agement. Implementation of these initiatives are well under-way. People Excellence: Our ability to attract, retain and develop talent throughout the world is crucial for our continued success. During 2017, we invested significant resources and efforts in leadership development. In addition, we revitalized our talent management process to provide our leaders with better tools to actively develop our talents, and promote opportunities for moving to new roles within GN. Financial performance and outlook In 2017, GN delivered financial results in accordance with our communicated guidance: Organic growth in GN Hearing of more than 6% and an EBITA margin of 20.5%. GN Audio had a particularly strong year with organic growth of 10% - sur-passing even the upgraded organic growth guidance set out in our Q3 report - and an EBITA margin of 18.2%. Our financial targets for the strategy period 2017 – 2019 stand firm. Geopolitical and technological resilience GN has established a solid footprint in key countries around the world, not only with sales offices, but also with other core functions. North America accounts for close to half of the Group’s revenue, and we view the United States as a home base with R&D, manufacturing, a large sales force, close to 1,500 branded store fronts, and many strong partnerships. China has grown to become another important market for GN, which is reflected in our strong local presence with R&D, manufacturing and sales. This enables GN to better seize im-portant opportunities in this attractive market. GN also has a strong local presence throughout Asia and in its core Euro-pean markets and continues to deepen our positions, ensuring rapid time-to-market with products. Strategic agility is crucial to GN, also in terms of geographical footprint. Our setup enables us to swiftly adapt to changes in the world political and economic landscapes. This is part of our heritage throughout the past 148 years, managing the company safely through two world wars, several regional wars, revolutions, economic recessions, the Cold War as well as multiple technological, trade and geopolitical changes.
Investing in technology for the future Looking into the future, we are certain to face even more radi-cal changes, especially in terms of what technology can do for people. One such change is emerging in the U.S. market for hearing aids, where a new over-the-counter category will be introduced to address the fact that 24 million Americans remain untreated for hearing loss. The precise nature of the new regulations from the U.S. Food and Drug Administration is not yet known, but if it makes business sense, GN will be ready to leverage its competencies within medical devices and consumer electronics synergistically. Likewise, GN recently announced GN FalCom, a revolutionary intelligent communication solution with unparalleled noise management for defense and security forces. The pioneering and patented hearing protection solution – leveraging GN’s unique leading competencies within intelligent audio solutions in both GN Hearing and GN Audio – offers the user a communication headset which is comfortable, highly durable and protects the user against high volume noise while allowing the user to clearly identify important sound in 360 degrees. This initiative is a successful result of corporate level investments made through GN’s Strategy Committee guided initiatives to explore opportunities outside of, but related to, GN’s existing business areas. Constantly transforming to seize new opportunities GN long ago started the transition from being a hardware company to building strong capabilities within software development. We will continue and accelerate this transformation. In a longer perspective, GN will continue to invest in technology shifts that change the lives of the hearing-impaired and of people in need of headsets for convenient communication. Our current core research expertise spans a wide range of disciplines, including sound and signal processing, acoustics, neuroscience, human-computer interaction, artificial intelligence, and audiology. Today, we all have a computer in our pockets that connects us to anybody and any data, anywhere, anytime. Already now, our hearing aids hold more computing power than it took to land the first man on the moon. Who knows what tomorrow brings? To reach our ambitious goals – both short-term financial goals and long-term strategic goals – we continue to rely on our more than 5,000 employees and leaders around the world. On behalf of the GN Board of Directors, I sincerely thank all for their great contributions that lay the groundwork for GN’s current and future success.
Per Wold-Olsen Chairman of the Board

9 Management's report ⋅Consolidated financial highlights Contents
GN Group – Annual Report 2017
DKK million 2013 2014 2015 2016 2017
GN Hearing (excl. GN Otometrics) Continuing operations Revenue 3,636 3,892 4,526 5,156 5,615 Revenue growth 6% 7% 16% 14% 9% Organic growth 10% 8% 9% 6% 6% Gross profit margin* 65.8% 68.8% 67.4% 69.0% 69.4% EBITA* 775 833 921 1,062 1,153 EBITA margin* 21.3% 21.4% 20.3% 20.6% 20.5% EBITA reported* 671 833 921 1,062 1,153 ROIC (EBITA/Invested capital) 14% 16% 16% 17% 17% Free cash flow excl. company acquisitions and divestments 50 368 456 704 866 Cash conversion (free cash flow excl. company acquisitions and divestments/EBITA) 7% 44% 50% 66% 75%
GN Audio Revenue 2,612 2,871 3,229 3,495 3,970 Revenue growth 11% 10% 12% 8% 14% Organic growth 18% 11% 2% 7% 10% Gross profit margin 52.7% 53.6% 52.6% 52.7% 53.2% EBITA* 472 521 540 597 721 EBITA margin* 18.1% 18.1% 16.7% 17.1% 18.2% ROIC (EBITA/Invested capital) 65% 57% 47% 41% 46% Free cash flow excl. company acquisitions and divestments 178 340 271 523 481 Cash conversion (free cash flow excl. company acquisitions and divestments/EBITA) 38% 65% 50% 88% 67%
GN Store Nord Continuing operations Revenue 6,248 6,763 7,755 8,651 9,585 Revenue growth 8% 8% 15% 12% 11% Organic growth 13% 9% 6% 6% 8% Gross profit margin* 60.3% 62.4% 61.2% 62.4% 62.7% EBITA* 1,217 1,196 1,383 1,583 1,744 EBITA margin* 19.5% 17.7% 17.8% 18.3% 18.2% EBITA reported* 1,113 1,196 1,383 1,583 1,744 Operating profit (loss) reported 1,050 1,132 1,149 1,445 1,558 Financial items, net (81) (80) (138) (52) (60) Profit (loss) before tax reported 968 1,057 1,016 1,395 1,504 Effective tax rate 28% 29% 26% 22% 25% Profit (loss) for the year reported 695 749 747 1,086 1,122
Total assets 8,963 10,229 11,176 12,835 11,737 Consolidated equity 5,330 5,667 5,764 5,620 4,783
ROIC (EBITA/Invested capital) 20% 19% 20% 20% 20% Earnings per share, basic (EPS) from continuing operations 4.15 4.61 4.79 7.34 8.07 Earnings per share, fully diluted (EPS diluted) from continuing operations 4.11 4.57 4.77 7.32 8.02
Investments in property, plant and equipment (114) (95) (171) (106) (103) Free cash flow excl. company acquisitions and divestments 96 561 607 1,179 1,134 Cash conversion (free cash flow excl. company acquisitions and divestments/EBITA) 9% 47% 44% 74% 65%
Continuing and discontinued operations Equity ratio 59.5% 55.4% 51.6% 43.8% 40.8% Net interest-bearing debt 1,113 1,631 2,212 3,377 3,035 Net interest-bearing debt (period-end)/EBITDA 0.9 1.1 1.4 1.9 1.6 Payout ratio 18% 19% 20% 16% 16% Share buybacks** 787 877 1,162 1,272 1,372
Outstanding shares, end of period (thousand) 164,740 159,592 152,254 143,471 136,443 Average number of outstanding shares, fully diluted (thousand) 168,891 163,619 156,734 148,361 139,968 Treasury shares, end of period (thousand) 8,589 8,429 9,937 11,317 9,241 Share price at the end of the period 133 135 125 146 201 Market capitalization 21,910 21,513 19,032 20,990 27,357
* EBITA: Excluding Gain (Loss) on divestments of operations, etc. and amortization of acquired intangible assets but including amortization of development projects and software developed in-house. (GH Hearing in 2013 excluding SMART restructuring costs)
** Including buybacks as part of the share based incentive programs
Consolidated financial highlights
10 Management's report ⋅ Group performance 2017 Contents
GN Group – Annual Report 2017
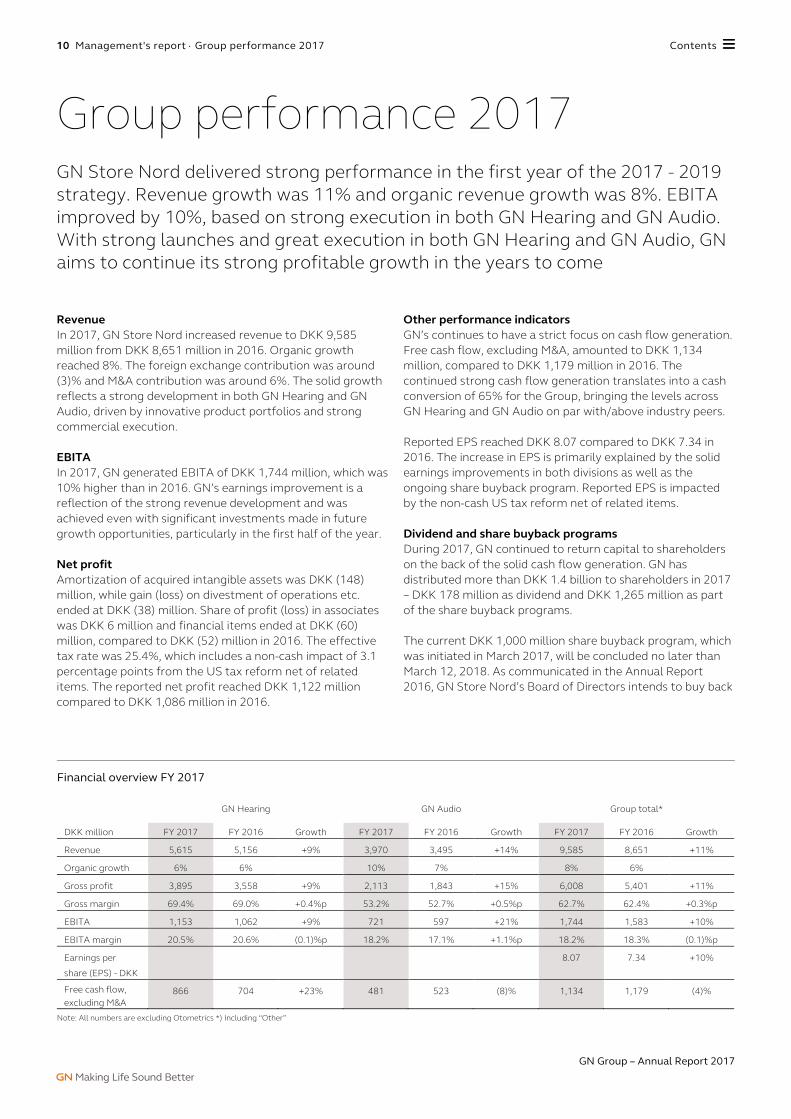
Revenue In 2017, GN Store Nord increased revenue to DKK 9,585 million from DKK 8,651 million in 2016. Organic growth reached 8%. The foreign exchange contribution was around (3)% and M&A contribution was around 6%. The solid growth reflects a strong development in both GN Hearing and GN Audio, driven by innovative product portfolios and strong commercial execution. EBITA In 2017, GN generated EBITA of DKK 1,744 million, which was 10% higher than in 2016. GN’s earnings improvement is a reflection of the strong revenue development and was achieved even with significant investments made in future growth opportunities, particularly in the first half of the year. Net profit Amortization of acquired intangible assets was DKK (148) million, while gain (loss) on divestment of operations etc. ended at DKK (38) million. Share of profit (loss) in associates was DKK 6 million and financial items ended at DKK (60) million, compared to DKK (52) million in 2016. The effective tax rate was 25.4%, which includes a non-cash impact of 3.1 percentage points from the US tax reform net of related items. The reported net profit reached DKK 1,122 million compared to DKK 1,086 million in 2016.
Other performance indicators GN’s continues to have a strict focus on cash flow generation. Free cash flow, excluding M&A, amounted to DKK 1,134 million, compared to DKK 1,179 million in 2016. The continued strong cash flow generation translates into a cash conversion of 65% for the Group, bringing the levels across GN Hearing and GN Audio on par with/above industry peers. Reported EPS reached DKK 8.07 compared to DKK 7.34 in 2016. The increase in EPS is primarily explained by the solid earnings improvements in both divisions as well as the ongoing share buyback program. Reported EPS is impacted by the non-cash US tax reform net of related items. Dividend and share buyback programs During 2017, GN continued to return capital to shareholders on the back of the solid cash flow generation. GN has distributed more than DKK 1.4 billion to shareholders in 2017 – DKK 178 million as dividend and DKK 1,265 million as part of the share buyback programs. The current DKK 1,000 million share buyback program, which was initiated in March 2017, will be concluded no later than March 12, 2018. As communicated in the Annual Report 2016, GN Store Nord’s Board of Directors intends to buy back
Group performance 2017 GN Store Nord delivered strong performance in the first year of the 2017 - 2019 strategy. Revenue growth was 11% and organic revenue growth was 8%. EBITA improved by 10%, based on strong execution in both GN Hearing and GN Audio. With strong launches and great execution in both GN Hearing and GN Audio, GN aims to continue its strong profitable growth in the years to come
Financial overview FY 2017
GN Hearing GN Audio Group total*
DKK million FY 2017 FY 2016 Growth FY 2017 FY 2016 Growth FY 2017 FY 2016 Growth
Revenue 5,615 5,156 +9% 3,970 3,495 +14% 9,585 8,651 +11%
Organic growth 6% 6% 10% 7% 8% 6%
Gross profit 3,895 3,558 +9% 2,113 1,843 +15% 6,008 5,401 +11%
Gross margin 69.4% 69.0% +0.4%p 53.2% 52.7% +0.5%p 62.7% 62.4% +0.3%p
EBITA 1,153 1,062 +9% 721 597 +21% 1,744 1,583 +10%
EBITA margin 20.5% 20.6% (0.1)%p 18.2% 17.1% +1.1%p 18.2% 18.3% (0.1)%p
Earnings per
share (EPS) - DKK
8.07 7.34 +10%
Free cash flow, excluding M&A
866 704 +23% 481 523 (8)% 1,134 1,179 (4)%
Note: All numbers are excluding Otometrics *) Including “Other”

11 Management's report ⋅ Group performance 2017 Contents
GN Group – Annual Report 2017
shares worth DKK 3 billion during GN’s 2017 - 2019 strategy period, subject to approvals by Annual General Meetings. The Board of Directors will propose to pay out DKK 1.25 per share in dividend for the fiscal year 2017 (equivalent to a total dividend of DKK 182 million), compared to DKK 1.15 per share last year and equivalent to an increase of 9%. Capital structure As communicated on GN’s Capital Markets Day in September 2016, GN is targeting a net interest-bearing debt of one to two times EBITDA. At the end of 2017, the net interest-bearing debt amounted to DKK 3,035 million, corresponding to 1.6 times EBITDA.
Claim against Plantronics Inc. In 2012, GN Audio filed suit against Plantronics for attempted monopolization of the distributors’ market in the United States. During the discovery phase, GN Audio learned of alleged intentional document destruction. A hearing on the matter was held on May 18, 2016, and on July 6, 2016, the Court issued a sanctions motion ordering Plantronics to pay USD 3 million to GN Audio in punitive damages as well as reasonable fees and costs incurred in connection with the discovery dispute. Furthermore, the Court reserved the right to issue additional evidentiary sanctions. On October 18, 2017, a jury in the Federal District Court of Delaware ruled in favor of Plantronics as the jury did not find that Plantronics’ behavior in the market had been unlawful. GN has decided to appeal the ruling.

12 Management's report ⋅ Financial outlook Contents
GN Group – Annual Report 2017
As part of GN’s strategy for 2017 - 2019, GN provided financial targets on various levels of the Group. The financial outlook for 2018 is closely linked to the targets provided in the strategy:
• For GN Hearing, organic growth is expected to be more than 6% and the EBITA margin is expected to be more than 20%
• For GN Audio, organic growth is expected to be more than 7% and the EBITA margin is expected to be more than 17%
• For GN Store Nord, the effective tax rate for 2018 is ex-pected to be around 22%
• EBITA in “Other” is expected to be around DKK (135) mil-lion, reflecting continued research activities on a corporate level
In 2018, GN Store Nord targets a double digit increase in earnings per share (EPS).
GN Hearing Financial guidance 2018 GN Hearing expects continued solid revenue growth in 2018. Organic growth is expected to be more than 6%. As outlined in the strategy for 2017 - 2019, GN Hearing will execute strongly on the three cornerstones of the strategy, Innovation Excellence, Commercial Excellence and People Excellence, which will contribute to solid growth in 2018. The EBITA margin is expected to be above 20% in 2018. GN Hearing will continue to invest in future growth opportunities in 2018, as described in the strategy for 2017 - 2019.
Market projections In the 2017 – 2019 strategy, GN Hearing estimates market growth to be around 4 - 6% in volumes with ASP decline of around 1 - 2% annually. For 2018, GN Hearing expects market growth to be within this range and to be broad based across all the three reporting regions: North America, Europe and Rest of World. GN Audio Financial guidance 2018 In 2018, GN Audio expects to deliver more than 7% organic growth and to continue the solid growth momentum experienced during 2017, based on strong execution of the initiatives launched under the 2017 – 2019 strategy. GN Audio expects the EBITA margin to be more than 17% in 2018 and to continue to benefit from operational leverage on the back of expected revenue growth and improved product mix, however partly offset by investments in future growth opportunities. Market projections The Call Center & Office (CC&O) market is projected to maintain strong growth rates driven by the increasing penetration of Unified Communications (UC) solutions tailored to the new generations’ working culture as well as seamless integration between applications and devices. The consumer Bluetooth mono headset market is expected to continue to decline. It is expected that the market for Bluetooth stereo headset solutions will show a positive trend again in 2018, including in the important sub segments such as neckband, sport and true wireless.
Financial outlook GN Store Nord is entering the second year of the Hear More, Do More, Be More strategy 2017 - 2019 with the ambition to continue to deliver strong profitable growth. GN continues to be well-positioned, in both GN Hearing and GN Audio, to benefit from attractive market conditions
Financial guidance 2018*
Organic revenue growth EBITA margin Effective tax rate
GN Hearing > 6% > 20%
GN Audio > 7% > 17%
Other (DKK million) ~ (135)
GN Store Nord ~ 22%
* Based on foreign exchange rates as of February 1, 2018

13 Management's report ⋅ Financial outlook Contents
GN Group – Annual Report 2017
Other activities and tax EBITA in “Other” is expected to be around DKK (135) million in 2018 (DKK (130) million in 2017). The costs are primarily related to shared functions servicing both GN Hearing and GN Audio. Furthermore, GN will also continue to actively research and explore business opportunities with the aim to explore future business opportunities outside the current area of operation
in GN Hearing and GN Audio, leveraging on the core knowledge and competencies of the Group. The intelligent communication solution for defense and security forces announced on January 30, 2018 is a successful example of the portfolio of research projects aimed at leveraging GN’s unique, leading competencies within intelligent audio solutions in both hearing aids and headsets. As announced in the 2017 – 2019 strategy, GN expects an effective tax rate around 22% for the period, which also is expected to be the level in 2018.
Forward-looking statements The forward-looking statements in this annual report reflect GN Store Nord’s management’s current expectations of certain future events and financial results. Statements regarding the future are inherently subject to risks and uncertainties which may result in material deviations from expectations. Furthermore, some of these expectations are based on assumptions regarding future events which may prove incorrect. Factors that may cause actual results to deviate materially from expectations in-clude – but are not limited to – general economic developments and developments in the financial markets, technological de-velopments, changes and amendments to legislation and regulations governing GN’s markets, changes in the demand for GN's products, competition, fluctuations in sub-contractor supplies and developments in ongoing litigation (including but not lim-ited to class action and patent infringement litigation in the United States). For more information, see the "Management's re-port" and "Risk management” elsewhere in this annual report. This annual report should not be considered an offer to sell se-curities in GN.

14 Management's report ⋅ Financial outlook Contents
GN Group – Annual Report 2017
No limits Taking hearing care to a whole new level
In April 2017, GN Hearing unveiled the revolutionary ReSound LiNX 3D™ hearing aids, taking Smart Hearing to new levels to enable people with hearing loss to hear more, do more and be more anywhere in life. This enables an entirely new hearing care experience. Hear more than you ever thought possible: ReSound LiNX 3D is the best for speech recognition, gives a clear and natural sense of the sounds around you and in complex listening situations makes sure you can focus on what you want without being cut off from your surroundings. Enhanced hearing and fitting experience: ReSound Smart Fit™ software optimizes the way hearing care professionals can provide hearing care, allowing them to spend less time on fitting, so they can spend more time improving client experience and keeping their business running at its best. Hearing care wherever you are: From an app users have direct access to their hearing care professional. They can request assistance for remote fine-tuning of their hearing aid settings as they experience a hearing difficulty – night or day – no need to remember how to describe the listening situation next time they are at the clinic. The hearing care professional can make the fine-tuning remotely in the office – at any time convenient – and transfer the new settings to the user. This provides a vastly better hearing experience for the user. These breakthroughs are developed with audiological insights and the latest advancements in technology to bring more convenience and efficiency than ever before to users and hearing care professionals.
15 Management's report ⋅ GN Hearing Contents
GN Group – Annual Report 2017
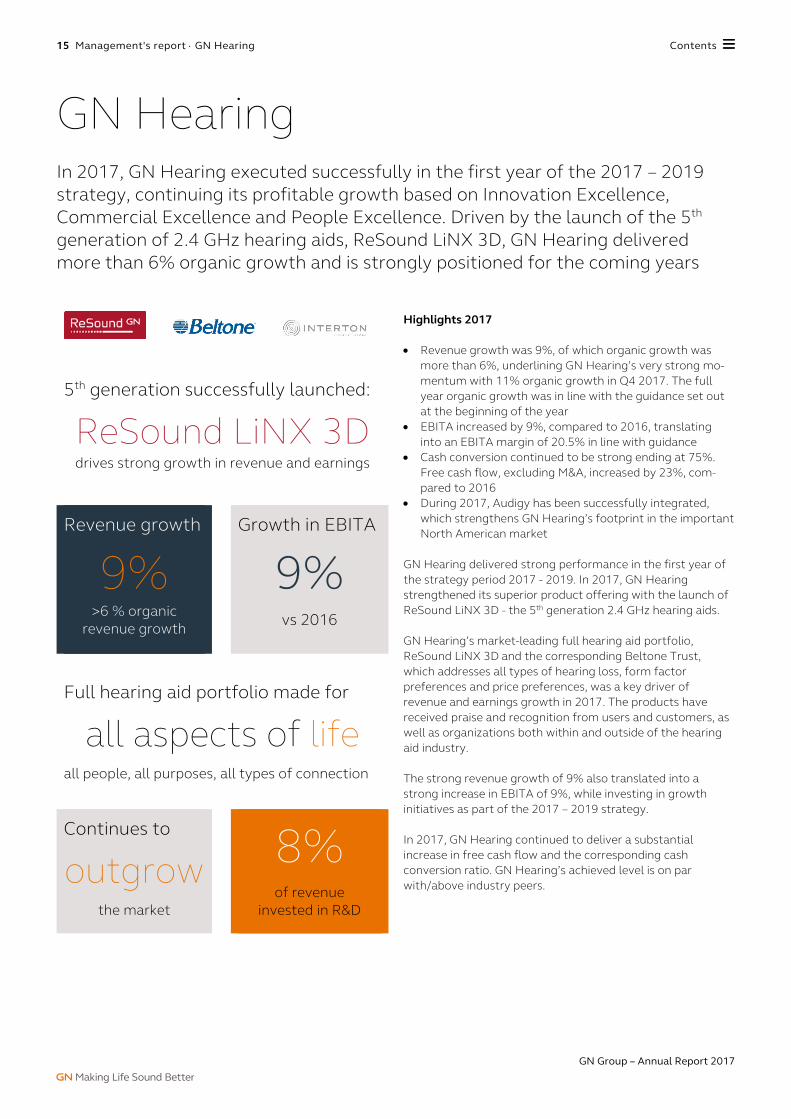
5th generation successfully launched:
ReSound LiNX 3D drives strong growth in revenue and earnings
Revenue growth
9% >6 % organic
revenue growth
Growth in EBITA
9%
vs 2016
Full hearing aid portfolio made for
all aspects of life all people, all purposes, all types of connection
Continues to
outgrow the market
8%
of revenue invested in R&D
Highlights 2017
• Revenue growth was 9%, of which organic growth was more than 6%, underlining GN Hearing’s very strong mo-mentum with 11% organic growth in Q4 2017. The full year organic growth was in line with the guidance set out at the beginning of the year
• EBITA increased by 9%, compared to 2016, translating into an EBITA margin of 20.5% in line with guidance
• Cash conversion continued to be strong ending at 75%. Free cash flow, excluding M&A, increased by 23%, com-pared to 2016
• During 2017, Audigy has been successfully integrated, which strengthens GN Hearing’s footprint in the important North American market
GN Hearing delivered strong performance in the first year of the strategy period 2017 - 2019. In 2017, GN Hearing strengthened its superior product offering with the launch of ReSound LiNX 3D - the 5th generation 2.4 GHz hearing aids. GN Hearing’s market-leading full hearing aid portfolio, ReSound LiNX 3D and the corresponding Beltone Trust, which addresses all types of hearing loss, form factor preferences and price preferences, was a key driver of revenue and earnings growth in 2017. The products have received praise and recognition from users and customers, as well as organizations both within and outside of the hearing aid industry. The strong revenue growth of 9% also translated into a strong increase in EBITA of 9%, while investing in growth initiatives as part of the 2017 – 2019 strategy. In 2017, GN Hearing continued to deliver a substantial increase in free cash flow and the corresponding cash conversion ratio. GN Hearing’s achieved level is on par with/above industry peers.
GN Hearing In 2017, GN Hearing executed successfully in the first year of the 2017 – 2019 strategy, continuing its profitable growth based on Innovation Excellence, Commercial Excellence and People Excellence. Driven by the launch of the 5th generation of 2.4 GHz hearing aids, ReSound LiNX 3D, GN Hearing delivered more than 6% organic growth and is strongly positioned for the coming years

16 Management's report ⋅ GN Hearing Contents
GN Group – Annual Report 2017
Experience hearing
Highly successful launch for GN Hearing
Since the launch on April 29, GN Hearing has been exe-cuting on the global rollout of ReSound LiNX 3D and the corresponding Beltone Trust. These groundbreak-ing hearing aids are based on GN Hearing’s 5th genera-tion 2.4 GHz wireless technology and 3rd generation Binaural Directionality. The global campaign has been GN Hearing’s most suc-cessful launch ever. ReSound LiNX 3D is now available in all major countries around the world, and in Novem-ber 2017 was also launched through the important Veterans Affairs channel in the United States. A cornerstone in such a campaign is the yearly EUHA International Congress of Hearing Aid Acousticians and trade fair, which in 2017 took place in Nuremberg, Ger-many. More than 135 companies were represented in the exhibition space, and EUHA attracts hearing care professionals from the entire world. To enable visitors to experience the vast possibilities of GN Hearing’s new family of products, our ReSound ex-hibition booth at EUHA included a special sound demo experience tour – and it drew long lines of visitors queu-ing up for this unique hearing experience.

17 Management's report ⋅ GN Hearing Contents
GN Group – Annual Report 2017
Revenue Revenue reached DKK 5,615 million in 2017. Revenue growth was 9% with organic growth at more than 6%, which is in line with the guidance for the year. The foreign exchange development had a negative impact on revenue by around (2)%, while the M&A contribution was around 4%. Earnings and other financial highlights GN Hearing’s gross profit for 2017 reached DKK 3,895 million, which was 9% higher than in 2016. The gross margin increased to 69.4% from 69.0% in 2016. EBITA increased to DKK 1,153 million in 2017 from DKK 1,062 million in 2016, equivalent to a growth rate of 9%. The EBITA margin ended at 20.5% - in line with the guidance for the year. Free cash flow, excluding M&A, for 2017 was DKK 866 million, equaling a cash conversion of 75%, compared to DKK 704 million in 2016. This represents an increase of 23% driven by a continued focus on working capital optimization and strict control of balance sheet items. Business highlights
Product introductions Staying true to the vision to become the leader in intelligent audio solutions, GN Hearing began shipping the ground-breaking ReSound LiNX 3D in April 2017, starting with the world’s largest hearing aid market, the United States. With the introduction of ReSound LiNX 3D and the ReSound Smart Fit™ software, an entirely new hearing care experience is made possible. These breakthroughs are developed with audiological insights and the latest advancements in technology to provide more convenience and efficiency than ever before.
ReSound LiNX 3D offers unprecedented benefits to hearing aid users and to hearing care professionals across three key dimensions – sound quality, efficient and convenient fitting and ground-breaking remote fine-tuning:
Sound quality – hear more than you ever thought possible With ReSound LiNX 3D – GN Hearing’s 5th generation 2.4 GHz wireless technology and 3rd generation Binaural Directionality – hearing aid users experience excellent sound quality and will hear more than they ever thought possible. ReSound LiNX 3D delivers clear, natural sound, exceptional speech understanding and the best sense of where sounds are coming from. Users will experience 360-degree audibility and awareness in quiet and speech-only situations, improved hearing in noise when speech is in the front and optimized audibility of surrounding sounds. Studies show that, compared to premium hearing aids from competing brands, ReSound LiNX 3D:
• is up to 50% better at identifying speech across various en-vironments
• enables users to hear up to 80% more of the sounds around them and
• enables users to understand up to 40% more speech in noise
An enhanced fitting experience Together with audiologists, GN Hearing has developed a more efficient and intuitive fitting software, which simplifies the process where the hearing care professional fits and adjusts the hearing aid to the user’s needs. This faster and more convenient wireless fitting saves time for both the user and the hearing care professional. This gives hearing care professionals more time for valuable user counselling. A new Smart app allows users to easily personalize and control their
Revenue distribution
EBITA development DKK million
Note: Excluding Otometrics and SMART restructuring costs
25%
55%
20%
Europe
North America
Rest of World775
833
921
1,062
1,153
600
700
800
900
1,000
1,100
1,200
2013 2014 2015 2016 2017

18 Management's report ⋅ GN Hearing Contents
GN Group – Annual Report 2017
sound at any time on-the-go directly from a smartphone (iPhone, Apple Watch and selected Android models). The Smart app empowers users to take even more control of their hearing experience through a built-in guidance and coaching feature, and gives users direct access to their hearing care professional for efficient optimization without the need for an appointment in a clinic.
Hearing care wherever you are ReSound LiNX 3D is the only device with complete remote fine-tuning capabilities that allows users to stay in touch with their hearing care professional wherever they are and to receive hearing care and new settings via the cloud without having to schedule and travel for a clinic appointment. The unique cloud integration enables hearing care professionals to stay connected with users no matter where they are. Users can share feedback about any hearing difficulty as the situation occurs, rather than having to remember it and try to describe it at a later visit to the clinic. Hearing care professionals will have the freedom to offer follow-up services remotely – saving time for both themselves and users, thus creating opportunities for even higher user satisfaction. During the annual AudiologyNow! Convention (AAA) in the United States, GN Hearing conducted the world’s first transatlantic remote fine-tuning of a hearing aid. The remote fine-tuning was performed on a user’s hearing aid in Denmark from a meeting room in Indianapolis in the United States in front of a live audience of analysts and investors. The remote fine-tuning was made possible with GN Hearing’s new ReSound Assist™ remote fine-tuning technology as well as its 5th generation 2.4 GHz wireless technology hearing aids, the new ReSound Smart 3D app™, and the new intuitive and convenient ReSound Smart Fit™ software. ReSound LiNX 3D – and the corresponding Beltone Trust – has now been launched in all primary markets around the world with a full product family in the Top and Plus performance levels.
New rechargeable and super power solutions In August 2017, GN Hearing announced a rechargeable solution for ReSound LiNX 3D. This solution has all of the benefits of ReSound LiNX 3D, now combined with the all-day power of a rechargeable battery. With overnight charging, users will experience the advantage of all-day power, without the need to change batteries. In addition, users will save time and effort with less impact on the environment, giving them freedom, convenience and confidence. In August 2017, GN Hearing also announced ReSound ENZO 3D™, which brings the benefits of ReSound LiNX 3D to people with severe to profound hearing loss. ReSound ENZO 3D is the smallest and most powerful super power hearing aid
available. Clinical trials have documented that ReSound ENZO 3D provides 60% more clarity of the sounds around users and 60% better speech understanding in noise. ReSound ENZO 3D can be combined with a Made for iPhone compatible Cochlear system to form the most attractive bimodal hearing solution.
New branded launch in Costco In the summer of 2017, ReSound Forte™ was launched in the branded category of Costco’s hearing aid business. The new, exceptionally strong product offering allows GN Hearing to increase its share in the branded category where there is good potential for profitable growth in years to come. The launch allows GN Hearing to further leverage the strong brand recognition of its main brand, ReSound. In 2015, and in the first part of 2016, GN Hearing was the supplier of the private label brand in Costco (Kirkland Signature).
Otometrics divestment completed On January 3, 2017, the divestment of Otometrics to Natus Medical was completed following the fulfillment and achievement of all necessary conditions and regulatory approvals. The divestment further strengthens GN Hearing’s focus and strategic direction. Audigy successfully integrated 2017 saw the successful integration of Audigy Group, acquired in 2016. Audigy has strengthened GN Hearing’s footprint in the important North American market. Fortified position in Veterans Affairs GN Hearing has fortified its position as the second-largest supplier in the U.S. Veterans Affairs channel in 2017. GN Hearing continues to benefit from a sustained and focused effort in the channel, supported by a market-leading product portfolio. In November 2017, GN Hearing introduced ReSound LiNX 3D in the Veterans Affairs channel, providing veterans in the United States with optimum audiological benefits. At the end of 2017, GN Hearing’s market share (measured in value) reached 19.4%, which is in line with the level at the end of 2016. In particular, GN Hearing has improved its relative position in the important Receiver-in-Canal (RIC) segment, increasing its market share (measured in units) from 24% by the end of 2016 to 28% by the end of 2017.
Cochlear The Smart Hearing Alliance, a co-development and co-commercialization partnership between GN Hearing and Cochlear, announced in October 2015, has proven successful again in 2017 with commercial introductions of bimodal hearing solutions combining GN Hearing’s hearing aids with Cochlear’s implant systems.

19 Management's report ⋅ GN Hearing Contents
GN Group – Annual Report 2017
Freedom
"An improvement on all levels"
Bo Vestergaard is head of the high performance center at the Danish Canoe and Kayak Federation. He suffered from hearing loss since the age of one: “I got my first set of hearing aids when I was eight, but didn’t use them, because I wanted my peers to think I was like them. So they just sat in my school bag until I was 28 and got a job. I have an active career as a rower, I was on the national team and I was a trainer. One of the things I wanted with new hearing aids was to be able to wear them dur-ing athletic activities. The biggest advantage with ReSound LiNX 3D is noise reduction, directionality and speech recognition. I hear a lot more speech now, and I can more clearly hear who is speaking and where they are speaking from. It gives me a totally new opportunity for a better dialogue with my teammate out on the water. With my new ReSound hearing aids, I experience im-provement on all levels and in every way. I’m not so tired in the evenings anymore because I don’t use as much energy concentrating on hearing what’s being said. Now I just sit back, relax and soak it in.”

20 Management's report ⋅ GN Hearing Contents
GN Group – Annual Report 2017
Beltone network In 2017, the development of the Beltone network has been encouraging. Beltone is a strong and recognized brand in the United States hearing aid market, and it is GN Hearing’s goal, as part of the ambitious strategy for 2017 - 2019, to further strengthen Beltone in order to build the network for the future. This initiative is focused on transformational growth as well as building a culture of continuous improvement and achieving even stronger brand awareness.
Marketing In the 2017 – 2019 strategy, GN Hearing has declared Commercial Excellence a key driver for success. The focus areas for marketing are to drive significantly increased market share in the open market through innovative new product launches and initiatives, further strengthening of partnerships with key accounts around the world, and to drive successful digital transformation. A disciplined and deepened understanding of customer and consumer needs and behaviors has allowed for differentiated value-driven programs and campaigns. The creation of a separate Digital Transformation organization will enable the necessary development in the area of e-commerce, business management and lead generation.
Operations GN Hearing is constantly aiming to optimize the production setup and to make it even more cost-efficient. The main manufacturing facilities for GN Hearing are located in Denmark, the United States, China and Malaysia.
Market development The long-term market growth expectation remain unchanged. In the 2017 – 2019 strategy, GN Hearing estimates market growth to be around 4 - 6% in volumes with ASP decline of around 1 - 2% annually. In 2017, the market growth was estimated to be within this range. The global hearing aid market size is estimated at around 15 million units in 2017.
ReSound LiNX 3D – an entirely new hearing experience

21 Management's report ⋅ GN Hearing Contents
GN Group – Annual Report 2017
"When FaceTime was introduced, all consumers needed was a Wi-Fi or a cellular signal to experience the world of their loved ones, whether they were ten or ten thousand miles away. Few at the time would have associated hearing care with innovation, but it was only a few years later when GN Hearing launched the first Made for iPhone hearing aid. Recently, GN Hearing took a quantum leap in innovation with the launch of comprehensive remote fine-tuning, or tele-audi-ology. I have to admit that at first even I was skeptical. How could my patients receive the same level of care remotely as they would if they were present in my office? This hesitation, however, quickly waned. The ReSound Smart Fit software was easy to use, and the ReSound Assist was convenient for both me and my patients, leading to a better hearing care ex-perience and greater patient satisfaction. Still, I can understand why other hearing care professionals might remain hesitant to embrace the new technology. As audiologists, we pride ourselves on the personal counselling and relationships we develop with patients through office visits. But in the same way as FaceTime was not an attempt to replace physical interactions, tele-audiology is not an attempt to replace person-to-person contact with patients. Instead, in the way FaceTime connects us to loved ones when we are away, remote fine-tuning provides an opportunity to connect directly with an audiologist when there otherwise would not be one. Moreover, remote fine-tuning is sometimes
preferable to office visits as it allows us to fit our patients in real environments, rather than the ones simulated in a clinic. While today’s patients are more and more interested in how technology can give them greater control over their lives, they also still rely on our expertise as trained professionals to achieve optimal hearing outcomes. With tele-audiology, patients get the best of both worlds: They can feel close to their audiologist without having to sacrifice time or convenience. We as professionals can spend our time in the clinic on valuable counselling. For years, experts have been telling us that tele-medicine is the future of caretaking. GN Hearing brought comprehensive tele-audiology to hearing care and with it the future of our field. ReSound LiNX 3D has proven that remote assistance can increase patient satisfaction, provide real-life feedback, and optimize how we run our businesses.”
Tele-audiology helps hearing aid users live in the present Thumper Johnson is Director of Audiology at Mid-Kansas Ear, Nose & Throat Associates, and an avid user of GN Hearing’s new remote fine-tuning feature. She explains how this helps both her patients and her business
Audiologist Thumber Johnson (right) is thrilled with the benefits offered by remote-fine-tuning.
Remote fine-tuning is highly appreciated by hearing care professionals
Source: GN Hearing survey among 31 hearing care professionals in the U.S., UK, FR, DE, NL, IN, DK, CH and AUS who have experience fitting patients with ReSound LiNX 3D and have used ReSound Remote Assist.
Offer a better service and take better care of patientsThe remote service enables me to deliver the best fit within a shorter time frameThe remote service helps me understand my client’s sound experience outside the clinicThe client feels more involved in the fitting experience with the remote service than without
94%81%90%
Willingness to recommend the serviceI would recommend using this service to others 100%
Improve the hearing experience and sound qualityThe remote service helps my client get a better hearing experienceThe remote service helps me provide a better sound quality for my clientThe remote service reduces the amount of in-office appointments
94%87%81%
0% 20% 40% 60% 80% 100%

22 Management's report ⋅ GN Audio Contents
GN Group – Annual Report 2017
Excellent business performance
10% organic growth vs 2016
Revenue growth
14% vs 2016
Growth in EBITA
21% vs 2016
No 1 in Unified
Communications
EBITA margin 18.2%
vs 17.1% in 2016
Fastest growing company
in the professional headset market
Highlights 2017
• Revenue growth was 14%, of which organic growth was 10%
• EBITA increased by 21% to DKK 721 million, equivalent to an EBITA margin of 18.2%, compared to 17.1% in 2016
• Continued strong cash conversion of 67%, compared to 88% in 2016
• New product launches in the Jabra Speak and Jabra Evolve families fortify GN Audio’s leadership in the attractive CC&O market
• Successful integration of VXi Corporation has strengthened GN Audio’s position in the important North American market
GN Audio executed successfully on the 2017 – 2019 strategy – Hear More, Do More, Be More. In 2017, GN Audio delivered strong growth in both revenue and EBITA margin. The development was the result of a leading product portfolio and best-in-class commercialization. Following a successful 2017, GN Audio is well-positioned to take advantage of the current strong momentum and stay ahead of competition. In the enterprise business targeting the global Call Center & Office (CC&O) market, GN Audio achieved very significant growth throughout 2017 with double-digit organic growth in all regions. This was particularly driven by the Unified Communications (UC) segment. GN Audio gained further market share on the back of its leading product portfolio and continued strong execution across the organization. In the consumer market, GN Audio continued to take important steps toward repositioning the consumer business. A key milestone in the year was the broad success of Jabra Elite Sport, which has shown a tremendous impact in the market and already positioned Jabra as the second-largest player in the global market for true wireless earbuds. GN Audio’s strategy for 2017 - 2019: Hear More, Do More, Be More was announced in September 2016. It builds on three cornerstones: Innovation Excellence, Commercial Excellence and People Excellence. This will be the foundation for GN Audio’s continued strong profitable growth.
GN Audio During 2017, GN Audio further strengthened its world-leading position in the attractive CC&O market. Strong performance across regions and channels with strong new product launches, a favorable product mix and the successful integration of VXi Corporation led to 10% organic growth, outperforming the updated 2017 guidance of “more than 7%”

23 Management's report ⋅ GN Audio Contents
GN Group – Annual Report 2017
Elite Engineered for purpose
Jabra research shows that daily usage of headphones by frequent users focuses on calls (58%), music (53%) and voice control (35%). With the new Elite family of products, Jabra sets the industry bar for voice and mu-sic quality headphones. Jabra Elite is engineered to meet the needs of users looking not only for outstanding music quality, but also for strong voice capability, whether they are making calls or increasingly using voice assistants, such as Alexa, Siri or Google Now. In January 2018, Jabra launched at CES, the global con-sumer electronics trade show that takes place every year in Las Vegas, three new products; Jabra Elite 45e, Jabra Elite 65t and Jabra Elite Active 65t. Jabra Elite Active 65t (see picture) is engineered for active users who want a true wireless voice and music experience while working out; Jabra Elite 65t is engineered for the best true wireless voice and music experience; Jabra Elite 45e is engineered for the best voice and music experience.

24 Management's report ⋅ GN Audio Contents
GN Group – Annual Report 2017
Revenue In 2017, revenue reached DKK 3,970 million, compared to DKK 3,495 million in 2016. Revenue growth was 14% with organic growth at 10%. The foreign exchange development had an impact of around (2)% on revenue, while the M&A contribution was around 6%. The revenue growth in Q4 2017 was driven by strong performance in the CC&O business across regions and channels. The continued strong growth reflects the strength of GN Audio’s innovative world-leading product portfolio as well as strong execution on its commercial excellence initiatives in all regions. As a result of the strong performance, GN Audio continues to strengthen its leading position in the attractive CC&O market. The organic growth of 10% in GN Audio exceeded the original guidance of “more than 6%”, as communicated in the Annual Report for 2016, as well as the updated financial guidance of “more than 7%”, as communicated in the Q3 2017 report. Earnings and other financial highlights In 2017, the gross profit increased by 15% to DKK 2,113 million. The gross margin was up from 52.7% in 2016 to 53.2% in 2017. GN Audio’s EBITA of DKK 721 million in 2017 represents an increase of 21%.
The EBITA margin reached 18.2%, compared to 17.1% in 2016, thus exceeding the financial guidance of “more than 17%” for 2017. Strict focus on cash conversion continued with a strong cash conversion of 67% for the year. The free cash flow excluding M&A of DKK 481 million in 2017. Business highlights During the year, GN Audio has emphasized The Power of Conversation. The campaign was launched to highlight GN Audio’s ability to empower people with the right headset technology for their needs, which can significantly boost their productivity, improve customer relations and drive efficiency. GN Audio is persistently investing in sales and marketing in order to continue to deliver attractive revenue growth. Throughout 2017, the CC&O market conditions were favo-rable and solid as expected, driven in particular by the Unified Communications market. GN Audio expects that the market for UC solutions will expand in the coming years from mostly covering large enterprises to also reaching small and medium-sized enterprises. In recent years, GN Audio has performed well delivering intelligent audio solutions to larger corporations implementing UC solutions.
Revenue distribution
EBITA development DKK million
46%
39%
15%
Europe
North America
Rest of World472
521540
597
721
300
350
400
450
500
550
600
650
700
750
2013 2014 2015 2016 2017

25 Management's report ⋅ GN Audio Contents
GN Group – Annual Report 2017
Evolve'd
Engineered for Unified Communications
September 2017 saw the global announce-ment of the world’s first Unified Communica-tions (UC) certified professional wireless ear-buds: Jabra Evolve 75e. Combining Skype for Business certification, active noise cancellation (ANC), a host of the professional features of the Jabra Evolve series, and a wearing style popular with mobile office workers, these earbuds deliver calls and music with battery life that lasts all day long. This offers our channel partners a new oppor-tunity to acquire and expand their revenue streams in the UC market. Jabra Evolve 75e has been engineered with all the benefits of the class-leading Evolve series, now in an earbud design to help drive penetra-tion and expand UC adoption.

26 Management's report ⋅ GN Audio Contents
GN Group – Annual Report 2017
Product launches in the important office segment
Jabra Speak 710 In March 2017, GN Audio launched Jabra Speak 710, the newest member of the Jabra Speak Series, which has been a highly successful product family for GN Audio. Jabra Speak 710 is a premium portable speakerphone with amazing sound for conference calls and music, designed for both professional and personal use. Users can now integrate their Apple Siri® and Google Now™ smartphone digital assistants with the push of a button. Jabra Speak 710 can connect wirelessly with another Jabra Speak 710 device for an immersive sound for stereo music and multimedia presentations, or it can simply expand the room coverage for conference calls.
Jabra Evolve 75 In May 2017, Jabra further strengthened its CC&O UC portfolio with the launch of Jabra Evolve 75. With this product Jabra further extends is most successful product family, Jabra Evolve. Jabra Evolve 75 combines all the most popular features of the series: wireless, active noise cancellation (ANC), busylight, design and sound quality, and has been extremely successful both in terms of sales and user feedback.
Jabra Evolve 75e In September 2017, GN Audio again extended its Jabra Evolve range of headsets for professional use with the Jabra Evolve 75e, UC-enabled Bluetooth stereo earbuds. With this product GN Audio was the first to introduce an earbud version with ANC and busylight into the office. Thus, GN Audio brings a familiar consumer design into a pro-fessional environment which still includes all the winning characteristics of the Jabra Evolve range: wireless freedom, great sound, UC compatibility, ANC and busylight.
Fortifying UC leadership Since the launch in 2014, the Jabra Evolve product range has been engineered to enable focus and distraction-free working. Research shows that the majority of today’s flexible workers (78%) say that their personal productivity at the office is impacted by noise. With the launches in the Jabra Speak and Jabra Evolve franchises, Jabra fortifies its leadership in the UC and personal speaker space and has been able to deliver market-leading growth rates. Focusing on key pain points with UC decision-makers, the Jabra Evolve and Jabra Speak series are designed and positioned to meet a demand for higher office productivity and UC adoption.
Announcing Jabra Elite franchise for consumers In September 2017, GN Audio announced the consumer wireless earbuds Jabra Elite 25e, the newest addition to the audio-on-the-go category, where conversation and media/music consumption is a key driver for purchase. Jabra Elite 25e offers a better design for in-ear stereo neckbands, one charge to last all day and improved core sound quality and voice experience. In January 2018, Jabra introduced three new products in the Jabra Elite franchise, Jabra Elite 45e, Jabra Elite 65t and Jabra Elite Active 65t, all drawing on GN’s long-standing audio, headset and hearing aid expertise. Each new Elite product contains unique microphone configurations to ensure users will always be heard, whether speaking while indoor or out in the street. Other business highlights
Strategy 2017 - 2019: Hear More, Do More, Be More In September 2016, at GN’s Capital Markets Day, GN Audio announced its strategy for the coming three-year period. To ensure strategy execution – particularly within Commercial and Innovation Excellence – a platform approach is being
2017 saw three new products in the important office segment
Jabra Speak 710 Jabra Evolve 75 Jabra Evolve 75e

27 Management's report ⋅ GN Audio Contents
GN Group – Annual Report 2017
implemented across the professional and consumer businesses and products. A combined product management function covering both the professional and consumer segments and a unified distribution sales organization will enable maximum utilization of technology, product and brand investments, as well as address changing partner and distribution patterns. GN Audio’s financial targets for 2017 - 2019 are to deliver 6 - 9% organic revenue growth per year (CAGR) and an EBITA margin of 17 - 19%.
VXi Corporation The integration of U.S. based VXi Corporation, which was acquired in October 2016, has progressed as planned, and the company is now fully integrated in GN Audio. The acquisition has strengthened GN Audio’s presence in the important North American market, where VXi enables access to new attractive segments, leveraging VXi’s best-in-class expertise within communication in high-noise environments.
R&D Throughout 2017, GN Audio’s product development focused on cementing Jabra’s position as the world leader within professional headsets through the core competencies of wireless technology and intelligent audio solutions. As exemplified by the recent launches of Jabra Speak 710, Jabra Evolve 75, Jabra Evolve 75e and the upgraded Jabra Elite Sport, the innovation in headsets and earbuds continued with high pace, based on extensive research into customer needs and sharp focus on delivering outstanding user benefits. In recent years, software has become increasingly important in the development of intelligent headsets and earbuds. The distinctive functionalities of directional microphones that eliminate background noise and apps used for sport coaching are examples of software technology that is critically important for delivering user benefits. Software is also an important contributor in delivering an excellent sound experience as exemplified by products like the Jabra Elite franchise.
Operations Carefully selected subcontractors manufacture all of GN Audio’s hardware, and components are sourced from trustworthy suppliers. GN Audio is working with a small number of tier-one manufacturers, supported by more than 100 sub-suppliers, in order to produce the comprehensive variety of products in the portfolio. To optimize lead-time, GN Audio maintains a regional presence at three regional warehouses located in the United States, the Netherlands and Hong Kong. The global distribution of GN Audio’s products is handled by one partner responsible for the entire process – from leaving the factories via warehouses to the final delivery to the specific customer. Market development Following significant investments in the further expansion of UC software deployment during 2016, the overall CC&O market showed solid growth rates again in 2017, and the market continues to develop favorably. GN Audio expects that the market trend will continue beyond 2017, creating a solid foundation for continued growth. Long-term growth in the CC&O market is supported by the expected further adoption of UC, driven by proliferation of software-based desktop communications clients, productivity benefits, including hands-free communications and an efficient work environment with a growing number of open workspaces.

28 Management's report ⋅ GN Audio Contents
GN Group – Annual Report 2017
True wireless The #1 advanced sports earbuds
Since the launch in late 2016, Jabra Elite Sport has been widely recognized in the media for its market leading position. They are engineered to be the most technically advanced true wireless sports earbuds* Today, Jabra Elite Sport is still the most technically advanced, true wireless sports earbuds available on the market. They are a true training aid which are wa-terproof (IP67 rating) and delivers freedom of move-ment, ground-breaking in-ear fitness analysis, strong battery life and delivers premium audio quality for calls and music for anyone who wants to work out. The state-of-the-art earbuds without wires have been a hit with consumers world-wide. Jabra Elite Sport during 2017 became the no 1 sell-ing true wireless sports earbuds in the United States*. Jabra continue to push the boundaries of what is possible. Mid-year upgrades for Jabra Elite Sport which delivered 50% more battery life along with a fresh new Lime Green Gray color have strengthened our position.
*June 2017. See facts on Jabra.com/commercial-claims dk
29 Management's report ⋅ GN accolades and awards Contents
GN Group – Annual Report 2017
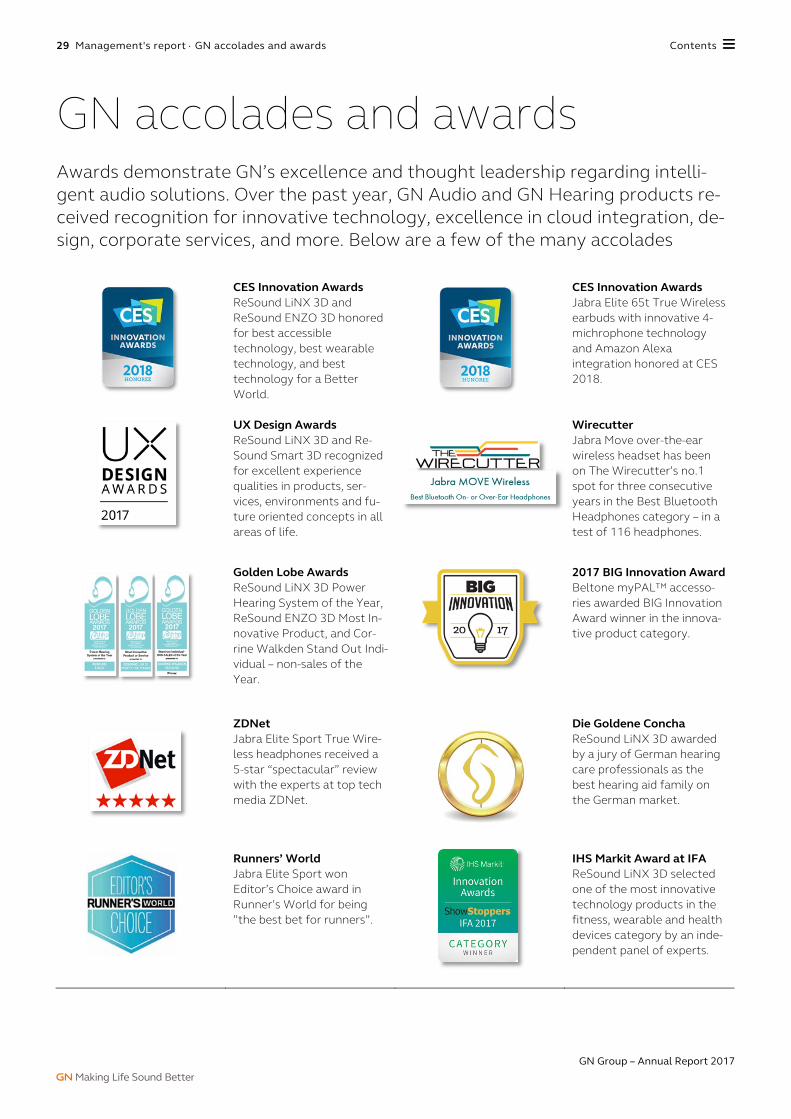
GN accolades and awards
CES Innovation Awards ReSound LiNX 3D and ReSound ENZO 3D honored for best accessible technology, best wearable technology, and best technology for a Better World.
CES Innovation Awards Jabra Elite 65t True Wireless earbuds with innovative 4-michrophone technology and Amazon Alexa integration honored at CES 2018.
UX Design Awards ReSound LiNX 3D and Re-Sound Smart 3D recognized for excellent experience qualities in products, ser-vices, environments and fu-ture oriented concepts in all areas of life.
Wirecutter Jabra Move over-the-ear wireless headset has been on The Wirecutter’s no.1 spot for three consecutive years in the Best Bluetooth Headphones category – in a test of 116 headphones.
Golden Lobe Awards ReSound LiNX 3D Power Hearing System of the Year, ReSound ENZO 3D Most In-novative Product, and Cor-rine Walkden Stand Out Indi-vidual – non-sales of the Year.
2017 BIG Innovation Award Beltone myPAL™ accesso-ries awarded BIG Innovation Award winner in the innova-tive product category.
ZDNet Jabra Elite Sport True Wire-less headphones received a 5-star “spectacular” review with the experts at top tech media ZDNet.
Die Goldene Concha ReSound LiNX 3D awarded by a jury of German hearing care professionals as the best hearing aid family on the German market.
Runners’ World
Jabra Elite Sport won Editor’s Choice award in Runner’s World for being ”the best bet for runners”.
IHS Markit Award at IFA ReSound LiNX 3D selected one of the most innovative technology products in the fitness, wearable and health devices category by an inde-pendent panel of experts.
Awards demonstrate GN’s excellence and thought leadership regarding intelli-gent audio solutions. Over the past year, GN Audio and GN Hearing products re-ceived recognition for innovative technology, excellence in cloud integration, de-sign, corporate services, and more. Below are a few of the many accolades

30 Management's report ⋅ Corporate responsibility Contents
GN Group – Annual Report 2017
Human & labor rights
Responsible sourcing GN requires all its suppliers to comply with GN’s Code of Con-duct, which covers bribery, human and labor rights (child la-bor, wages, working hours) and safety. It is essential for GN to ensure that no violations of such rights occur. GN continually assesses its suppliers and monitors their compliance through supplier self-assessments, performance monitoring, audits and site visits. In 2017, GN performed 70 audits at suppliers. Most findings were related to CSR and Quality, including working hours, health & safety issues in production and manufacturing pro-cess control. GN is in constructive dialogue with suppliers, where a non-conformity case has been raised, in order to en-sure implementation of required remedial actions.
Qualification of new suppliers When we engage with a new supplier, we follow a strict quali-fication process to ensure that the new supplier can live up to our standards and requirements. This includes:
1. Initial screening 2. Competence screening 3. Evaluation 4. Qualification 5. Performance monitoring
Repetitive work All jobs in GN’s own manufacturing facilities are reviewed and rated for potential health & safety related concerns. Repetitive work is mitigated through task rotation to vary work positions as well as prolonged break times for particularly exposed employees. All sites have managers with direct health & safety responsibility to ensure operator safety.
Occupational health & safety We acknowledge that suppliers may implement occupational health & safety standards in a less stringent manner than at GN’s own sites. Therefore, we have a strong focus on ensur-ing compliance with our occupational health & safety require-ments, both when onboarding new suppliers and partners as well as through regular supplier audits.
Compliance
Business ethics GN’s Ethics Guide, anti-corruption policies, Codes of Conduct and other internal guidelines outline the requirements for how GN operates and describe the responsibilities and ethical standards expected of all employees and relevant business partners. Relevant employees electronically sign off on their compliance within specific areas and take GN’s e-learning courses within anti-corruption and competition compliance on a regular basis.
Whistleblower system GN’s whistleblower hotline, Alertline, is available in 27 countries and 21 languages and is independently managed by a third party. In 2017, GN received eight reports within the scope of issues which can be reported through the hotline. The allegations were primarily fraud against GN, conflict of interest/corrupt practices and lack of business integrity. All relevant cases was investigated, and appropriate remediating and disciplinary actions were taken where relevant. Product safety
Materials and substances To avoid harmful materials and substances in products, materials and components undergo thorough testing during the development phase. GN complies with the ROHS 2 directive as well as other local and international legislation. In addition, both GN Hearing and GN Audio have implemented the REACH regulation. GN Hearing’s medical devices are developed under a highly regulated quality system complying with ISO 13485 and FDA 21CFR 820 CGMP as well as other national standards, which are used by GN Hearing to control a number of product standards and processes.
Animal testing Hearing aids are classified as medical devices and all materials and components that are in contact with human skin must fulfil all relevant biocompatibility requirements. This requires testing of the relevant material/components for cytotoxicity, skin sensitization and irritation, and includes animal testing to some extent. GN Hearing’s policy is to always try to minimize the amount of testing required by
Corporate responsibility GN is committed to acting in a responsible manner throughout our entire value chain and in all business matters. We consider this crucial to managing a sustainable successful global business and essential for reaching our long-term strategic goals

31 Management's report ⋅ Corporate responsibility Contents
GN Group – Annual Report 2017
setting up tests and test schemes in the most efficient way. All animal tests used by GN Hearing are performed by contract laboratories.
Conflict minerals Conflict minerals (gold, tantalum, tungsten and tin) originat-ing from mines controlled by military groups in the Demo-cratic Republic of Congo and nine adjacent countries have been widely reported to be the major driver of violence in Central Africa. We have, therefore, implemented a group-wide policy to avoid conflict minerals from these mines in GN products. By the end of 2017, GN has achieved 100% data coverage on validating the smelters identified and used in our supply chain as conflict-free. Environment and climate GN’s products are by nature small. A typical hearing aid weighs between 2 and 6 grams, while headsets, including base station and power supplies, weigh between 10 and 550 grams. Due to the nature and character of our business, our environmental and climate impact is assessed to be low. However, GN is committed to minimizing its impact through responsible planning and execution of activities.
Energy and water consumption In 2017, several initiatives were taken by our manufacturing facilities to minimize energy consumption, including installation of electrical lighting sensors, conversion of lamps to LED and upgrading of high power equipment, such as exhaust systems and pumps. Water consumption at GN’s manufacturing facilities is very limited. Initiatives to reduce water consumption include employee awareness training, water consumption control and installation of water-reducing toilets.
Waste For all production lines, GN has set a threshold for acceptable waste levels. If waste exceeds this, it triggers a production stop and corrective actions will be implemented. Most of our waste is very small in quantity. All our manufacturing facilities use licensed disposal contractors that properly dispose waste, which may include plastic, chemicals, paint, scrap parts, etc. Some waste is re-used (e.g. boxes and plastic) via recycling operations. Other waste, such as electronics, is processed for re-use.
Certifications GN Audio’s repair center in China and its suppliers are certified under the ISO 14001 environmental management system. In addition, preliminary work was commenced in 2017 to have GN manufacturing facilities certified under ISO 14001. A number of GN Audio’s headsets for professional work environments are TCO Certified (an third-party sustainability certification for IT products), combining requirements for corporate responsibility at the
manufacturing facilities, user safety and ergonomic design as well as minimal environmental impact for both the product and its production during its entire life cycle. Citizenship
Hearing aid project in South Africa In South Africa, GN in 2017 continued to contribute to the overall hearing health. Under a multi-year program, South Africans with limited financial resources and difficult living conditions are eligible to receive free hearing aids donated by GN. In 2017, a total of 469 new hearing aids were provided to and fitted on eligible patients. All have their new hearing aids professionally fitted by an audiologist. The program initially covered two provinces, but has been extended to cover all nine provinces.
Partnering with HAMAP In 2017, GN Audio entered into a partnership with HAMAP, a non-governmental organization that works to improve the life and health of some of the world’s most vulnerable people. GN Audio contributes in helping close to 90,000 people gain access to clean drinking water, basic sanitation and education, emphasizing GNs commitment to improve living conditions globally.
Supporting research to improve treatment GN Hearing co-sponsors the research activity of the Centre for Acoustic-Mechanical Micro Systems (CAMM) at the Technical University of Denmark (DTU). The research focuses on optimization of micromechanics and acoustics in hearing aids. GN Hearing co-sponsors The Centre for Applied Hearing Research (CAHR) with focus on the origin, nature and consequences of hearing impairment. CAHR has more than 45 academics and is recognized as a world-leading research institution GN Hearing co-sponsors a research project on Better hEAring Rehabilitation (BEAR), which is carried out by a consortium of hospital clinics, universities and hearing aid manufacturers, to document the effect of current clinical practices, develop new diagnostic methods for creating more customized solutions for patients and establish new guidelines for improved clinical practices. So far, approximately 2,000 patients have been enrolled in the project. More information on GN’s responsibility activities GN’s Communication on Progress report to the United Nations Global Compact outlines GN’s full corporate responsibility activities and is available on http://www.gn.com/-/media/Files/Document-Download-Center/Corporate-responsibility/COP2017.pdf. The report represents GN’s mandatory account for corporate responsibility according to §99a in the Danish Financial Statement Act.

32 Management's report ⋅ Risk management Contents
GN Group – Annual Report 2017
Facilitated and supported by GN’s strategic risk management function, new risks are identified and assessed on a regular basis by key employees and management teams across the entire value chain. The global management teams in GN Hearing and GN Audio subsequently evaluate the most significant risks together in order to determine whether any additional or different actions should be taken to reduce such risks or potentially turn these into opportunities. At least once a year, the risks assessed to be the most material are reported to and discussed with the Audit Committee and subsequently the Board of Directors.
The process is linked to other key planning processes, such as budgeting and strategy planning, in order to ensure that key risks are proactively managed on different time horizons. The overall aim of this integrated approach to risk management is to enable GN to reap the rewards of more coordinated, informed and intelligent risk-taking. The main risks associated with GN’s business and the main initiatives taken to manage them are outlined below.
Main risks associated with GN’s businesses
Research and development Operations Marketing and sales
Regulatory risk
Intellectual property rights
Information security
Human resources
Financial risk
Risk management Operating in business environments characterized by constant innovation and change, our proactive and systematic approach to risk management is a valuable tool in our continuous efforts to stay ahead of new developments and win in to-morrow’s marketplace
B C
D
E
F
G
H
A

33 Management's report ⋅ Risk management Contents
GN Group – Annual Report 2017
Risk Characteristics Mitigating actions
A Research and development
In a world where exciting new technologies, such as voice computing and artificial intelligence, continue to develop at an unprecedented speed, the potential for disruptive innovation and transformation within our playing field is greater than ever. While this entails previously unthinkable opportunities for development of new GN products and services, it also entails a key competitive risk in case we fail to turn the application of new technologies into better experiences and tangible benefits for the users of our offerings.
As part of our continuous and relentless focus on Innovation Excellence, we have made important adjustments to our product innovation and development process during 2017. These adjustments enable faster time-to-market, more agility and adaptability to change during the development process, and further enhance our ability to deliver new intelligent audio solutions which are truly driven by our insights into the current and future needs of the users of our products and services. Further, GN’s Strategy Committee oversees the technological development and initiates any necessary activities to ensure that GN at all times maintains its technology leadership in relevant areas.
B Operations
GN Hearing and GN Audio both rely on their global supply chains for the timely delivery of critical materials and components, which must meet our high quality standards. Failure of any of our key suppliers to provide agreed deliverables may negatively affect our ability to accommodate demand for GN products or result in safety issues.
To ensure that appropriate risk mitigation plans are always in place for critical materials and components, GN has developed a set of tools to quantify the financial exposure to a long-term interruption of supplies from all key suppliers. This helps us determine whether additional measures must be taken to bring the risk down to the acceptable level. Where possible and feasible, GN targets to pursue a dual sourcing strategy to ensure that GN is able to source the same type of component from at least two different suppliers. For some unique suppliers, other measures are taken to reduce the risk, such as higher inventory buffers, dual sets of production equipment or other initiatives.
C Marketing and sales
GN Hearing GN Hearing generates a significant part of its revenue from partnerships with a number of leading channels who occasionally put their business up for tender. This means that GN Hearing is exposed to the risk of losing business as these are re-tendered.
This risk is reduced by working closely with our partners on continuously strengthening these partnerships and integrating our products and services in partners’ customer journey. Accordingly, we will stay focused on meeting the needs and demands of our partners and provide them with superior added benefits.

34 Management's report ⋅ Risk management Contents
GN Group – Annual Report 2017
Risk Characteristics Mitigating actions
C Marketing and sales (continued)
GN Audio GN Audio’s professional business continued its strong momentum in 2017 and further consolidated its position as the world’s leading supplier of intelligent audio solutions for office businesses. However, the attractive growth rates also entail a risk that new competitors will enter the market and challenge GN Audio’s position.
GN Audio continually works to build on and expand its world-leading position by developing new, innovative and unique solutions based on deep insights into new trends and developments in user preferences, purchasing patterns, technology and other key factors shaping customer needs and demands.
D Regulatory risk
In the U.S. market for hearing aids, a new over-the-counter category will be introduced. At present, the precise scope and timing of implementation is not yet known, and it consequently also remains uncertain what overall effect this will have on GN and the hearing aid industry. New players may enter the market in this category, and we may see some downward pressure on prices. On the other hand, it is also likely to help increase the share of hearing-impaired people acquiring a hearing aid and thus increase the total market size.
If it makes business sense, GN will be ready to leverage our unique combination of compe-tencies within medical devices and consumer electronics to develop an over-the-counter offering. Additionally, we firmly believe that our strategy to refrain from owning retail outlets, in combination with our continued development of strong strategic partner-ships, makes us less exposed to risks arising from the introduction of an over-the counter category than hearing aid manufacturers who are vertically integrated, as we will be more agile and resilient.
On May 25, 2018, a new EU regulation governing the protection of personal data (the General Data Protection Regulation – or GDPR) comes into effect. Although many countries already have legislation in place requiring companies to handle personal data securely, the new regulation introduces certain new rights for individuals that companies hold data about (data subjects), and new obligations on companies handling such data. Failure to comply could potentially result in significant fines and/or negatively affect trust in GN among data subjects.
Throughout 2017, GN continued and intensi-fied its already ongoing effort to ensure that GN handles all personal and other data in a secure manner and will be ready for the new regulation. We finalized the already initiated GDPR compliance review and identified spe-cific areas where various types of controls around our IT systems, business processes and associated data flows need to be further strengthened. For these areas, a plan for the required activities and mitigating actions was prepared and execution on the plan is well underway.
In February 2019, the transition period for the Quality System standard EN ISO 13485:2016 expires and quality systems of all R&D and manufacturing sites have to comply with the new standard. The standard is the basis for CE-marking products according to the 93/42/EEC Medical Device Directives giving access to the EU markets, the Canadian market as well as many other countries where the standard is a pre requisition to enter the market.
GN Hearing plans to re-certify the entire organization where applicable to the ISO as well as to the Canadian program during 2018, and prepare for the new Medical Device Regulations that will come into force in 2020.

35 Management's report ⋅ Risk management Contents
GN Group – Annual Report 2017
Risk Characteristics Mitigating actions
E Intellectual property rights
As GN operates globally in highly innovative industries and with increased focus on con-nectivity and software, there is a risk that our freedom to operate is restrained by third-party patents, including patent hold-ups or hold-outs, preventing commercialization of certain products or solutions or forcing GN to pay royalty.
During 2017, GN continued to strengthen its patent portfolio and optimize key processes related to intellectual property rights. The objective is to protect our freedom to operate within current and future innovation spaces and to defend ourselves in case of patent in-fringement claims being brought against GN.
F Information security
GN’s business depends to a large and increasing degree on reliable and secure IT systems. Failure to adequately protect the IT infrastructure and key systems against the risk of security incidents could potentially lead to unavailability of services, unintended disclosure of business-critical confidential data or sensitive personal data, which may negatively affect GN’s competitive position, damage its reputation and/or result in fines.
GN continuously minimizes these risks through a wide range of measures, such as technical security controls, various process controls and internal employee awareness campaigns based on its information security policy framework. During 2017, GN further strengthened its information security organi-zation and governance as well as its specific defenses in order to ensure that GN stays on top of the constantly evolving threat land-scape.
G Human resources
The competition for talent in our industry has intensified during the past few years. Our ability to deliver strong results, to success-fully execute on our strategy and to build a sustainable organization for the future will be at risk if we are not able to attract, retain and grow the right talent on an ongoing basis. In addition, our ability to deliver on our ambi-tious strategic objectives will be at risk if we fail to ensure that the entire global organiza-tion is fully aligned behind our strategy and that this translates into flawless strategy exe-cution.
GN’s clearly defined people strategy sets the direction for successfully growing a winning organization. This includes a rigorous talent management process that we further refined and streamlined during 2017. This ensures that we have the right talent in the right positions and clear action plans for our talents, enabling us to create a pipeline of technical and leadership talent for the future. During 2017, the majority of all global leaders across GN have completed our new and ambitious leadership development program, which closely links the development of the individual leader with the implementation of our strategy.

36 Management's report ⋅ Risk management Contents
GN Group – Annual Report 2017
Risk Characteristics Mitigating actions
H Financial risk
Due to the nature of the operations, investments and financing activities, GN is exposed to a number of financial risks. GN has centralized the handling of these financial risks except for commercial credit risk, which is managed by the Group’s operating businesses. The financial risks are managed in accordance with the overall financial risk management guidelines set out in GN’s treasury policy. Based on the current revenue and cost composition, the anticipated primary foreign exchange exposures for GN in 2018 are mainly arising from USD and JPY, where a 5% decrease of the respective currency before any impact from hedging would lead to a EBITA reduction of DKK60m (USD) or DKK 10m (JPY), whereas other currencies on a stand-alone basis would not have a material impact. In addition, GN has a significant exposure to EUR in-flows in both GN Hearing and GN Audio, which historically has been pegged to the DKK. The exposure is, however, largely hedged via bank loans, which are mainly denominated in EUR. GN’s net interest-bearing debt has decreased during 2017 to DKK 3,035 million mainly driven by strong cash generation from normal operations. GN’s loans are long-term with maturities from 2020 to 2022 with variable interest based on short term EURIBOR and CIBOR reference rates.
GN has hedged a substantial part of the expected EBITA contribution in the material trading currencies for the next 12 months across both GN Hearing and GN Audio. GN is also monitoring the combined impact of minor trading currencies and hedges those on a case-by-case basis. To mitigate the cash-flow risk from rising interest rates on its variable debt, GN has concluded interest rate derivatives to swap a substantial proportion of the floating debt. To mitigate potential liquidity or refinancing risks GN has access to a Revolving Credit Facility, which was largely undrawn as of 31 December 2017. Please refer to note 4.2 for further information about financial risks.
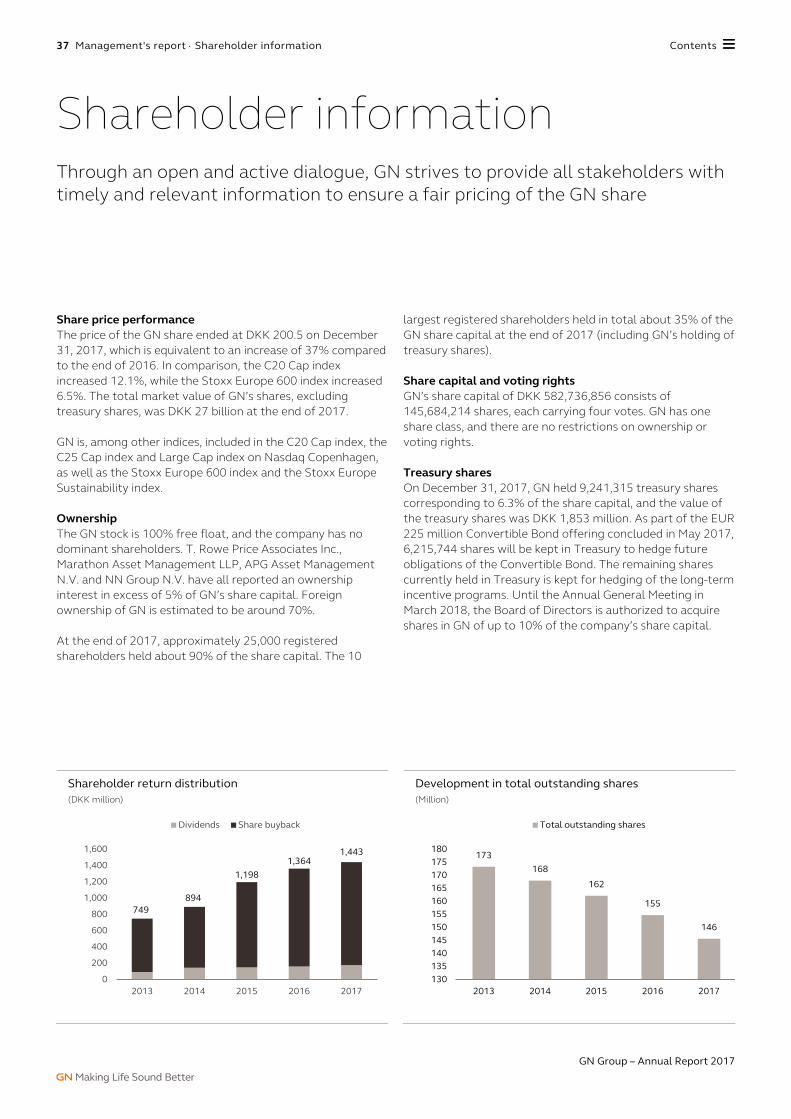
37 Management's report ⋅ Shareholder information Contents
GN Group – Annual Report 2017
Share price performance The price of the GN share ended at DKK 200.5 on December 31, 2017, which is equivalent to an increase of 37% compared to the end of 2016. In comparison, the C20 Cap index increased 12.1%, while the Stoxx Europe 600 index increased 6.5%. The total market value of GN’s shares, excluding treasury shares, was DKK 27 billion at the end of 2017. GN is, among other indices, included in the C20 Cap index, the C25 Cap index and Large Cap index on Nasdaq Copenhagen, as well as the Stoxx Europe 600 index and the Stoxx Europe Sustainability index. Ownership The GN stock is 100% free float, and the company has no dominant shareholders. T. Rowe Price Associates Inc., Marathon Asset Management LLP, APG Asset Management N.V. and NN Group N.V. have all reported an ownership interest in excess of 5% of GN’s share capital. Foreign ownership of GN is estimated to be around 70%. At the end of 2017, approximately 25,000 registered shareholders held about 90% of the share capital. The 10
largest registered shareholders held in total about 35% of the GN share capital at the end of 2017 (including GN’s holding of treasury shares). Share capital and voting rights GN’s share capital of DKK 582,736,856 consists of 145,684,214 shares, each carrying four votes. GN has one share class, and there are no restrictions on ownership or voting rights. Treasury shares On December 31, 2017, GN held 9,241,315 treasury shares corresponding to 6.3% of the share capital, and the value of the treasury shares was DKK 1,853 million. As part of the EUR 225 million Convertible Bond offering concluded in May 2017, 6,215,744 shares will be kept in Treasury to hedge future obligations of the Convertible Bond. The remaining shares currently held in Treasury is kept for hedging of the long-term incentive programs. Until the Annual General Meeting in March 2018, the Board of Directors is authorized to acquire shares in GN of up to 10% of the company’s share capital.
Shareholder information Through an open and active dialogue, GN strives to provide all stakeholders with timely and relevant information to ensure a fair pricing of the GN share
Shareholder return distribution (DKK million)
Development in total outstanding shares (Million)
749894
1,1981,364
1,443
0
200
400
600
800
1,000
1,200
1,400
1,600
2013 2014 2015 2016 2017
Dividends Share buyback
173168
162
155
146
130135140145150155160165170175180
2013 2014 2015 2016 2017
Total outstanding shares

38 Management's report ⋅ Shareholder information Contents
GN Group – Annual Report 2017
Dividend policy and share buyback programs GN’s overall financial target is to deliver a competitive shareholder return through a combination of dividend payments and share price appreciation. GN aims to pay out a dividend corresponding to 15 - 25% of the annual net profit and to distribute additional excess cash to shareholders through share buyback programs. Dividend payments and share buybacks are subject to, among other things, cash requirements to support the ongoing operations, strategic opportunities and the company’s capital structure. It is GN’s target to maintain a capital structure consisting of equity and debt with the net interest-bearing debt amounting to between one to two times EBITDA. At the Annual General Meeting in 2018, the Board of Directors will propose to pay out a total dividend of DKK 182 million (equivalent to DKK 1.25 per share and 16% of the 2017 net profit) in respect of the 2017 financial year, compared to DKK 178 million in 2016 (equivalent to DKK 1.15 per share and 16% of the 2016 net profit). Incentive programs By the end of 2017, the total number of outstanding warrants in GN Hearing was 15,193 (2.4% of the share capital in GN Hearing equivalent to approximately 1.9% of the share capital in GN Store Nord). The total number of outstanding warrants in GN Audio was 9,232 (2.6% of the share capital in GN Audio equivalent to approximately 1.1% of the share capital in GN Store Nord). Investor relations policy As part of GN’s investor relations activities, an active dialogue is pursued with existing and potential shareholders as well as with financial analysts. GN ensures that relevant and timely information is provided to the financial community to ensure that the GN share is fairly priced. This is accomplished
through information continually announced to the market as company announcements, combined with investor meetings, conferences and presentations of the company’s interim and annual results. Following the release of interim and annual results, GN con-ducts roadshows where the Executive Management and the investor relations team inform investors and financial analysts about the recent developments in the company. GN is currently covered by 28 sell-side analysts who continually re-lease analyst research reports on GN and the industry dynamics. A full list of the analysts covering GN can be found on the website www.gn.com/Investor GN has a four-week silent period prior to publication of a financial report. During these silent periods, which can be found on www.gn.com/Investor, any communication with stakeholders is restricted. GN’s website – www.gn.com – contains historic and current information about GN, including company announcements, current and historic share price data, investor presentations and annual and interim reports. In 2017, the finance magazine Institutional Investor awarded GN as the best IR team across European Medtech. The rankings are based on 1,622 investors and 971 sell-side analyst votes across 31 sectors. Among other things, the companies are evaluated on their company and business knowledge, their quality of written material as well timely responses to requests. The investor relations team can be contacted at: [email protected]
Share price development vs peers*
Financial calendar for 2018
Event Date
Annual General Meeting March 13, 2018 at GN headquarters
Interim Report Q1 2018 May 2, 2018
Interim Report Q2 2018 August 22, 2018
Interim Report Q3 2018 November 15, 2018
* Index : 30-12-2016 = 100 Read company announcements on www.gn.com
90
100
110
120
130
140
150
160
12/30/2016
GN Sonova William Demant
29-12-2017
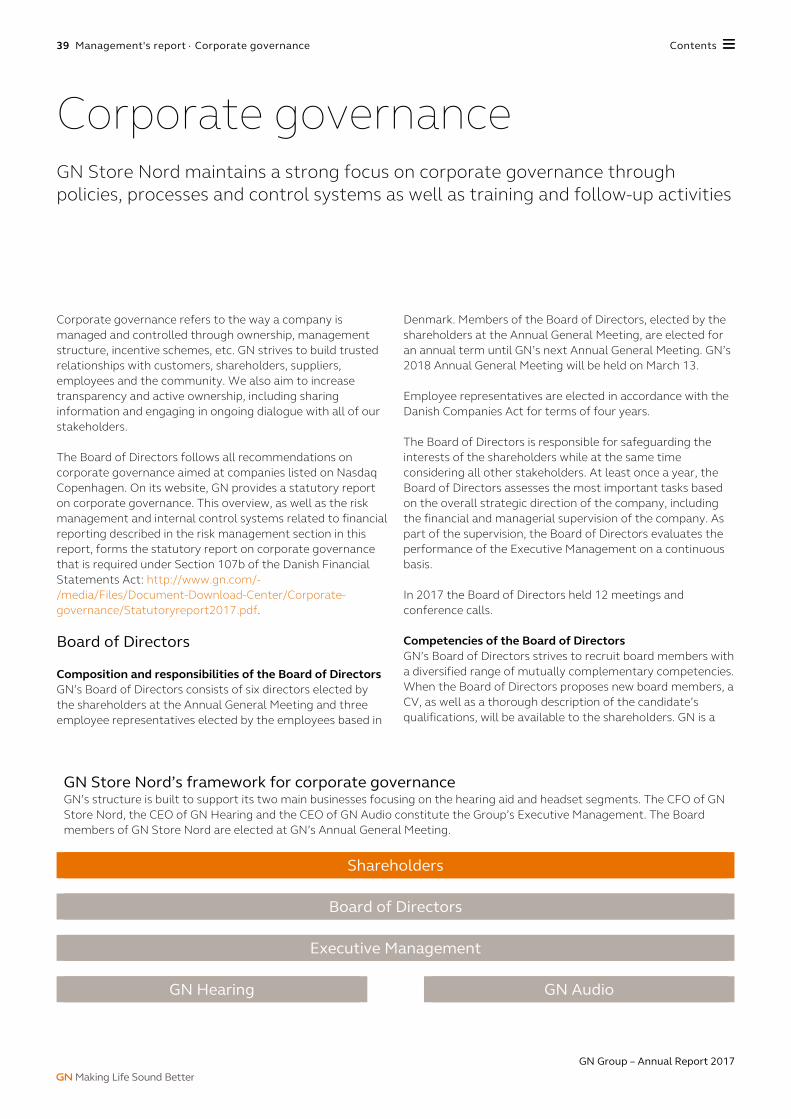
39 Management's report ⋅ Corporate governance Contents
GN Group – Annual Report 2017
Corporate governance refers to the way a company is managed and controlled through ownership, management structure, incentive schemes, etc. GN strives to build trusted relationships with customers, shareholders, suppliers, employees and the community. We also aim to increase transparency and active ownership, including sharing information and engaging in ongoing dialogue with all of our stakeholders. The Board of Directors follows all recommendations on corporate governance aimed at companies listed on Nasdaq Copenhagen. On its website, GN provides a statutory report on corporate governance. This overview, as well as the risk management and internal control systems related to financial reporting described in the risk management section in this report, forms the statutory report on corporate governance that is required under Section 107b of the Danish Financial Statements Act: http://www.gn.com/-/media/Files/Document-Download-Center/Corporate-governance/Statutoryreport2017.pdf. Board of Directors Composition and responsibilities of the Board of Directors GN’s Board of Directors consists of six directors elected by the shareholders at the Annual General Meeting and three employee representatives elected by the employees based in
Denmark. Members of the Board of Directors, elected by the shareholders at the Annual General Meeting, are elected for an annual term until GN’s next Annual General Meeting. GN’s 2018 Annual General Meeting will be held on March 13. Employee representatives are elected in accordance with the Danish Companies Act for terms of four years. The Board of Directors is responsible for safeguarding the interests of the shareholders while at the same time considering all other stakeholders. At least once a year, the Board of Directors assesses the most important tasks based on the overall strategic direction of the company, including the financial and managerial supervision of the company. As part of the supervision, the Board of Directors evaluates the performance of the Executive Management on a continuous basis. In 2017 the Board of Directors held 12 meetings and conference calls. Competencies of the Board of Directors GN’s Board of Directors strives to recruit board members with a diversified range of mutually complementary competencies. When the Board of Directors proposes new board members, a CV, as well as a thorough description of the candidate’s qualifications, will be available to the shareholders. GN is a
GN Store Nord’s framework for corporate governance GN’s structure is built to support its two main businesses focusing on the hearing aid and headset segments. The CFO of GN Store Nord, the CEO of GN Hearing and the CEO of GN Audio constitute the Group’s Executive Management. The Board members of GN Store Nord are elected at GN’s Annual General Meeting.
Shareholders
Board of Directors
Executive Management
GN Hearing GN Audio
Corporate governance GN Store Nord maintains a strong focus on corporate governance through policies, processes and control systems as well as training and follow-up activities

40 Management's report ⋅ Corporate governance Contents
GN Group – Annual Report 2017
global company and to successfully develop and maintain this position in the marketplace, GN is dependent upon global expertise and experience at the board level. The Board of Directors is a diversified group in terms of global experience, functional competencies and industry background, which ensures that it can fulfill its obligations. Board members possess expertise within medtech, innovation, product development, online marketing and commercialization, as well as thorough understanding of financial and human resource matters and in-depth knowledge of GN’s business. The composition of the Board is a mix of board members with executive positions and professional board members of both genders, as well as Danish and international profiles. This composition is deemed to provide a good balance between knowledge, competencies, experience and availability for a substantial workload. At the end of 2017, the Board of Directors carried out its annual self-evaluation. This encompassed the achievements of the Board as well as those of the chairman and the individual Board members. The evaluation is carried out in a systematic way and is based on well-defined criteria. The key area of continued focus for the Board of Directors’ self-evaluation is the identification of necessary updates of the organizational development, the recruiting, training and education of staff in line with the company’s new strategy. Diversity and talent management The Board of Directors believes that diversity strengthens any governing body and acknowledges the importance of diversity in general, including diversity of gender, nationality and competencies. In 2017, the Board of Directors reached its goal to see two women out of six elected for the Board by the end of 2017. As communicated in last year’s annual report, the Board of Directors aims to have three female board members by the end of 2020. Currently, women fill 19% of the company’s senior management positions. This development is the result of dedicated efforts since GN’s diversity policy was established in 2014, when women filled 14% of the company’s senior management positions – an increase in actual numbers of 31%. At the top leadership level – called the Global Management Teams – women leaders now constitute 14% in GN Audio (11% in 2014) and 25% in GN Hearing (0% in 2014). GN had aimed for 25% women in senior management positions in 2017. It is still management’s firm goal to reach this target during the implementation of the 2017 - 2019 strategy, and GN will continue to strengthen efforts to build a pipeline of future female candidates. For members of the
Global Management Teams, it will be part of their personal bonus programs in 2018 to achieve a goal of one third of their senior leaders being women. Furthermore, to achieve our goals, we ensure that diversity – encompassing gender, nationality, competencies, etc. – is an integral part of GN’s yearly talent review and succession planning process, of talent development practices, recruitment procedures, leadership development programs and mentor programs. Accordingly, in GN’s graduate program more than half are women, and in GN’s mentor program 47% of the mentees are women – both constituting an over-representation of women compared to the gender distribution in the company as a whole. Finally, the wording and visual identity in recruitment activities on social media and other channels are ongoing designed to best attract female candidates, and when external recruiters or headhunters are used, it is GN’s requirement that viable female candidates are presented for any position. Remuneration GN pursues a policy of offering the Board of Directors and the Executive Management remuneration that is competitive with industry peers and other global companies to attract and retain competent professional leaders of the businesses and members of the Board of Directors. Remuneration of the Executive Management is based on a fixed base salary plus a target bonus of 50% of the base salary with a potential to underperform or outperform the target leading to an effective potential bonus range of 0 - 100% of the base salary. In addition, Executive Management is offered to be part of GN Store Nord’s Long-Term Incentive Program. The grant range is between 50-100% with a target grant of 75% of their base salary in Black-Scholes value. The company does not make pension contributions for members of the Executive Management, and the Executive Management has severance and change-of-control agreements in line with Danish market practice. The company has a fixed termination notice of 12 months if given by the company and six months if given by a member of the Executive Management. Members of the Board of Directors receive fixed remuneration. They are not awarded share options, nor do they participate in other incentive programs. Board members, Executive Management and senior management are encouraged to buy and own shares in GN. Board committees Chairmanship The Chairman and the Deputy Chairman form the chairmanship of the Board. The chairmanship prepares and organizes the work of the Board of Directors with a view to

41 Management's report ⋅ Corporate governance Contents
GN Group – Annual Report 2017
ensure that the Board performs its tasks, duties and responsibilities in an efficient and responsible manner. The chairmanship also performs preparatory tasks for and advise the Board in relation to inter alia: business strategy, implementation of strategy, business development, budget and projects, and performs in-depth business reviews of selected areas. Audit Committee According to its charter, the Audit Committee, among other things, assists the Board of Directors in relation to the accounting and control environment, the integrity of the company’s financial reports and engagements with external auditors. The Audit Committee also carries out ongoing assessments of the company’s financial and business risks. In 2017, the Committee continued to deploy GN’s internal controls framework which, among other things, build on increased education and financial reporting process tracking. In addition, the committee reviewed the whistleblower reporting system, main accounting principles, tax strategy and compliance and key risks (including identified supplier risks), etc. In 2017, the Audit Committee held five meetings. Remuneration Committee According to its charter, the Remuneration Committee assists the Board of Directors in matters and decisions concerning remuneration of the Executive Management and senior employees, and in ensuring that the general remuneration policies reflect an appropriate balance. Resolutions on remuneration recommended by the Remuneration Committee and adopted by the Board of Directors are in line with the guidelines for incentive pay, as approved by the Annual General Meeting and by the Board. The 2017 remuneration policy for the Executive Management is based on the remuneration guidelines and takes into account the corporate governance recommendations of Nasdaq Copenhagen and the requirements of the Danish Companies Act. In 2017, the Remuneration Committee supervised and reviewed the remuneration policy, salary, bonus, long-term incentive process and results. It also reviewed warrant grants, talent development and succession planning process and results. Moreover, a set of new GN company values and leadership principles were revised and approved by the Board. In 2017, the Remuneration Committee held seven meetings. Strategy Committee As an innovation-driven company, it is vital for GN to maintain and further enhance the technological core capabilities of the Group of today, and even more importantly of tomorrow. Investments in a number of exploratory research projects aim at discovering potential
future business opportunities that are outside GN Hearing’s and GN Audio’s immediate areas of operation, leveraging core knowledge and competencies of GN. In 2017, the Strategy Committee supervised a series of existing projects as well as new projects to explore technological innovations within the broader technology space. In 2017, the Strategy Committee held nine meetings. Nomination Committee According to its charter, the Nomination Committee advises and makes recommendations to the Board of Directors in relation to the skills that the Board of Directors and the Executive Management must have to best perform their tasks. In 2017, primary activities included a review of the general competencies necessary to be represented on the Board. Based on this analysis and a review of the competency profiles of the individual Board members, the committee concluded that all necessary competencies are represented in the current composition of the Board. The structure, size and diversity of the Board was also reviewed and found to meet all governance requirements as well as the requirements of GN. The committee also reviewed the latest developments in good corporate governance and performed succession planning for the Board. In 2017, the Nomination Committee held two meetings. Internal audit function In accordance with its charter, the Audit Committee annually considers the need for an internal audit function. Based on the recommendations of the Audit Committee, the Board of Directors determines whether the internal control environment is adequate. During 2017, GN’s financial control department continued the strengthening of its internal procedures for controller visits, including implementation of financial reporting tracking, which further supports the financial compliance and internal control environment. The Board of Directors’ assessment, which is based on the company’s size and the organization of the finance department, is that there is no need to establish an internal audit function at this time. Compliance Business ethics GN’s commitment to business ethics and compliance with international regulation and internal policies is anchored in our Ethics Guide, our Code of Conducts and other internal policies and guidelines. These outline the fundamental

42 Management's report ⋅ Corporate governance Contents
GN Group – Annual Report 2017
requirements for how GN operates and describe the responsibilities and ethical standards expected of all employees and relevant business partners. To ensure and document employees’ familiarity with the Ethics Guide and key policies at all times, relevant employees electronically sign off on their compliance within specific areas and take GN’s e-learning courses within anti-corruption and competition compliance on a regular basis. This is supplemented with face-to-face compliance training for selected groups of employees conducted based on needs and requests. Whistleblower system GN’s whistleblower hotline, the GN Alertline, is available in 27 countries and 21 languages and is independently managed by a third party. The hotline can be used by employees as well as external parties to report a concern or perceived misconduct via the internet (at gnstorenord.alertline.eu) or via one of the local Alertline phone numbers. The system is an important tool to ensure that allegations of illegal or unethical conduct can be reported in a confidential and easy way. It also ensures that concerns or issues can be immediately addressed. All complaints are treated with confidentiality, and GN will not discharge, demote, suspend, threaten, harass or in any other way discriminate against an employee due to any lawful action(s) taken by the employee with respect to good faith reporting of complaints or participation in a related investigation, as outlined in our non-retaliation policy. In 2017, GN received eight reports within the scope of issues which can be reported through the hotline. The allegations were primarily fraud against GN, business integrity, conflict of interest/corrupt practices and lack of business integrity. All
relevant cases have been investigated, and appropriate remediating as well as disciplinary actions were taken where relevant Shareholders GN aims for transparency and active ownership toward shareholders through an open and active dialogue by ongoing communication with our shareholders at the Annual General Meeting and through investor presentations, newsletters, conference calls, the company website, webcasts, interim reports, the annual report, company announcements and media outreach activities. GN services national, as well as international investors, and ensures a continuous dialogue with shareholders, whether existing or potential, as well as equity analysts. On the company’s website, www.gn.com, detailed material on the interests of the shareholders can be found. GN’s shares are 100% free float, and shareholders have the ultimate authority over the company and exercise their right to make decisions at the Annual General Meeting where they also approve the annual report and elect board members and the independent auditor. For more information, please see the shareholder section on pages 37-38. Notices for the Annual General Meeting GN sends notices to convene Annual General Meetings by email. Thus, we encourage all registered shareholders to sign up at the investor portal with their email addresses and check the box labeled “subscribe/unsubscribe” in the field “Notice for the Annual General Meeting”. Shareholders will then receive the notice by email in the future.

43 Management's report ⋅ Board of Directors Contents
GN Group – Annual Report 2017
Board of Directors
Per Wold-Olsen
(Chairman) MBA. Formerly president with Merck & Co., Inc., Inter-continental Division, USA. Chairman since 2008.
William E. Hoover, Jr. (Deputy Chairman) MBA. Formerly with McKinsey & Company for 30 years. Deputy chairman since 2008.
Wolfgang Reim Ph.D. in physics. Professional board member and self-employed consultant within the medical industry.
Carsten Krogsgaard Thomsen M.Sc. (Economics). CFO, NNIT A/S.
Board positions Chairman of the Boards of GN Audio A/S and GN Hearing A/S. Chairman of the Board of Medicines for Malaria Venture and member of the Boards of Gilead Sciences Inc. and Novo A/S.
Chairman of the Boards of ReD Associates and the GN Store Nord Foundation. Deputy chairman of the Boards of GN Audio A/S and GN Hearing A/S. Member of the Boards of Danfoss A/S, Lego Foundation and Neopost SA.
Chairman of the boards of D.O.R.C. B.V. and Ondal Medical Systems GmbH. Member of the boards of Elekta AB, GN Audio A/S, GN Hearing A/S and Dermalumics S.L.
Member of the Boards of GN Audio A/S, GN Hearing A/S and SKAKO A/S.
Special competencies Extensive global leadership expertise and knowledge of the healthcare industry. Brings a unique set of capa-bilities and values to the Board of GN Store Nord within marketing and product development as well as com-mercialization of innovation. Also possesses in-depth knowledge of the U.S. market as well as emerging markets.
In-depth knowledge from working with the largest in-dustrial and high-tech com-panies in the Nordic region within strategy, organization and M&A. Experienced with supply chain/operations and has practical experience in helping Nordic multinationals rapidly scale up in emerging markets, especially in China and India.
Global leadership experience from the healthcare industry and special knowledge in the areas of business process reengineering, innovation management, global sourcing and supply chain management. Contributes to the Board with extensive M&A understanding.
Extensive expertise within finance, accounting, auditing, risk management, IT, M&A, post-merger integration and initial public offerings (IPO), as well as bond and hybrid capital financing from executive positions in both the public and private sectors.
Board member since 2008 2007 2008 2008
Term 2017/2018 2017/2018 2017/2018 2017/2018
Considered independent Yes Yes Yes Yes
Nationality Norwegian American German Danish
Year of birth 1947 1949 1956 1957
No. of GN shares 224,884 156,500 51,000 18,387
Total remuneration 2017 (DKK)
1,850,000 1,225,000 900,000 750,000
Chairmanship
Audit Committee Nomination Committee
Remuneration Committee
Strategy Committee
GN Hearing A/S Board GN Audio A/S Board
C
C
C
C
C DC
C DC

44 Management's report ⋅ Board of Directors Contents
GN Group – Annual Report 2017
Employee elected members
Hélène Barnekow M.Sc. (International Business). CEO, Telia Sweden.
Ronica Wang MBA (Business Administration), B.A.Sc. (Industrial Engineering). Co-founder & Global Managing Director, The InnoGrowth Group Ltd.
Leo Larsen M.Sc. (Electrical Engineering) and a diploma in business administration and international trade. Senior Director, Audio Research, GN Audio.
Morten Andersen B.Sc. (Mechanical Engineering). VP, Component Manufacturing in Operations, GN Hearing.
Nikolai Bisgaard M.Sc. (Electrical Engineering). VP, External Relations, GN Hearing.
Member of the Boards of GN Audio A/S and GN Hearing A/S.
Member of the Boards of GN Audio A/S and GN Hearing A/S. Member of the Boards of Pandora A/S and Ho-telbeds Group.
Unique capabilities within general commercial management and marketing, including go-to-market, branding, communications, product management and channel management from the mobile communications and IT sector.
In-depth experience in build-ing global brands, business transformation, distribution and sales channel manage-ment, digital strategy and ecommerce platforms in B2C and professional B2B2C in-dustries especially in Asia re-gion and in the FMCG, con-sumer health, electronics, af-fordable luxury, and retail sectors .
2013 2015 2007 2011 2006
2017/2018 2017/2018 2014/2018 2014/2018 2014/2018
Yes Yes
Swedish Hong Kong Danish Danish Danish
1964 1962 1959 1963 1951
8,900 4,850 1,137 1,230 570
600,000 600,000 250,000 250,000 250,000
Please visit www.gn.com for more elaborate descriptions of the board members’ competencies and management duties.
Chairman
Deputy chairman
Board member
C
DC

45 Management's report ⋅ Executive Management Contents
GN Group – Annual Report 2017
Executive Management
Anders Hedegaard
President & CEO, GN Store Nord & GN Hearing
Marcus Desimoni CFO, GN Store Nord & GN Hearing
René Svendsen-Tune President & CEO, GN Store Nord & GN Audio
Member of the Executive Management since
2014 2016 2015
Year of birth 1960 1968 1955
No. of GN shares 12,190 5,000 73,000
Board positions
Member of the Board of Orphazyme A/S. -
Deputy Chairman of the Board of NKT Holding A/S. Member of the Board of Nil-fisk Danmark A/S.

46 Management's report ⋅ Additional financial information Contents
GN Group – Annual Report 2017
Additional financial information 2017
Additional financial information Q4 financial highlights 47 Quarterly financial highlights 48 Quarterly reporting by segment 49 Q4 segment disclosures 50

47 Management's report ⋅ Q4 financial highlights Contents
GN Group – Annual Report 2017
GN Hearing Revenue In Q4 2017, GN Hearing delivered 8% revenue growth. Organic growth was 11%. The foreign exchange development contributed negatively with around 4% and M&A contribution was around 1%. The revenue in Q4 2017 reached DKK 1,497 million, compared to DKK 1,389 million in Q4 2016. The organic growth in Q4 2017 reflects the strong momentum generated by ReSound LiNX 3D across regions and channels. Geographically, North America was a significant growth driver primarily driven by strong performance in the US commercial market, but also important market share gains in Veterans Affairs driven by ReSound LiNX 3D. Rest of World continued to perform strongly, yet again with strong double digit growth in several important markets including China and Distributor Sales. In Europe, GN Hearing continued to gain market share in several important markets, including Spain and the Benelux region. Earnings and other financial highlights GN Hearing’s gross profit increased by 8% to DKK 1,074 million in Q4 2017. The gross margin reached 71.7%, versus 71.6% in Q4 2016, primarily explained by the strong business execution and launch momentum, but to some degree off set by country mix exemplified by the strong revenue growth in China. EBITA in Q4 2017 for GN Hearing was DKK 396 million. versus DKK 361 million in Q4 2016. The reported EBITA margin in Q4 2017 reached 26.5%, versus 26.0% in Q4 2016. The strong earnings growth is driven by the positive revenue development and solid control of cost development. In Q4 2017, free cash flow excl. M&A reached DKK 260 million equal to a cash conversion of 66% compared to free cash flow excl. M&A of DKK 107 million (30% cash conversion) in Q4 2016.
GN Audio Revenue In Q4 2017, GN Audio delivered 6% revenue growth. Organic growth was 12%. The foreign exchange development contributed negatively with around 6% and M&A contribution was negligible. The revenue in Q4 2017 was DKK 1,180 million compared to DKK 1,118 million in Q4 2016. In Q4 2017, GN Audio’s CC&O business continued to deliver double digit organic growth and market share gains across regions and channels. The market-leading organic growth reflects GN Audio’s ability to seize current market opportunities with its world-leading product portfolio, reallocate resources and execute on its Commercial Excellence initiatives. Earnings and other financial highlights In Q4 2017, GN Audio’s gross profit increased by 7% to DKK 640 million. This translated into a gross margin of 54.2%, which was around 1 percentage point higher than Q4 2016. A favorable divisional mix drove the solid development as CC&O continued the solid growth. In Q4 2017, GN Audio’s EBITA reached DKK 271 million equivalent to an EBITA margin of 23.0%. This is an increase of 0.4 percentage points versus Q4 2016. The margin improvement reflects the gross margin improvement. GN Audio’s free cash flow excl. M&A was DKK 108 million in Q4 2017, compared to DKK 206 million in Q4 2016. The cash conversion in Q4 2017 ended at 40%, versus 81% in Q4 2016.
Q4 financial highlights

48 Financial statements ⋅ Quarterly financial highlights Contents
GN Group – Annual Report 2017
Q4 Q4 Full year Full year 2017 2016 2017 2016 DKK million (unaud.) (unaud.) GN Hearing (excl. GN Otometrics) Continuing operations Revenue 1,497 1,389 5,615 5,156 Revenue growth 8% 10% 9% 14% Organic growth 11% 1% 6% 6% Gross profit margin 71.7% 71.6% 69.4% 69.0% EBITA* 396 361 1,153 1,062 EBITA margin 26.5% 26.0% 20.5% 20.6% ROIC (EBITA/Average invested capital) 17% 17% 17% 17% Free cash flow excl. company acquisitions and divestments 260 107 866 704 Cash conversion (free cash flow excl. company acquisitions and divestments/EBITA) 66% 30% 75% 66% GN Audio Revenue 1,180 1,118 3,970 3,495 Revenue growth 6% 11% 14% 8% Organic growth 12% 6% 10% 7% Gross profit margin 54.2% 53.3% 53.2% 52.7% EBITA* 271 253 721 597 EBITA margin 23.0% 22.6% 18.2% 17.1% ROIC (EBITA/Average invested capital) 46% 41% 46% 41% Free cash flow excl. company acquisitions and divestments 108 206 481 523 Cash conversion (free cash flow excl. company acquisitions and divestments/EBITA) 40% 81% 67% 88% GN Store Nord Continuing operations Revenue 2,677 2,507 9,585 8,651 Revenue growth 7% 10% 11% 12% Organic growth 11% 3% 8% 6% Gross profit margin 64.0% 63.4% 62.7% 62.4% EBITA* 632 593 1,744 1,583 EBITA margin 23.6% 23.7% 18.2% 18.3% Profit (loss) before tax 539 545 1,504 1,395 Effective tax rate 31.0% 20.6% 25.4% 22.2% ROIC (EBITA/Average invested capital) 20% 20% 20% 20% Earnings per share (EPS) from continuing operations 2.71 2.99 8.07 7.34 Earnings per share from continuing operations, fully diluted (EPS diluted) 2.69 2.98 8.02 7.32 Free cash flow excl. company acquisitions and divestments 291 363 1,134 1,179 Cash conversion (free cash flow excl. company acquisitions and divestments/EBITA) 46% 61% 65% 74% Equity ratio 40.8% 43.8% 40.8% 43.8% Net interest-bearing debt 3,035 3,377 3,035 3,377 Net interest-bearing debt (period-end)/EBITDA 1.6 1.9 1.6 1.9 Payout ratio 0% 0% 16% 16% Share buybacks** 254 493 1,372 1,272 Outstanding shares, end of period (thousand) 136,443 143,471 136,443 143,471 Average number of outstanding shares, fully diluted (thousand) 138,223 145,385 139,968 148,361 Share price at the end of the period 201 146 201 146 Market capitalization 27,357 20,990 27,357 20,990 ROIC and NIBD/EBITDA are calculated based on reported EBITA and EBITDA for the latest four quarters
* Excluding Gain (loss) on divestments of operations, etc. and amortization of acquired intangible assets but including amortization of development projects and software developed in-house.
** Incl. buybacks as part of share based incentive programs
Quarterly financial highlights

49 Financial statements ⋅ Quarterly reporting by segment Contents
GN Group – Annual Report 2017
Quarterly reporting by segment Q1 Q2 Q3 Q4 Q1 Q2 Q3 Q4 2016 2017 2016 2016 2016 2016 2017 2017 2017 2017 Total Total DKK million (unaud.) (unaud.) (unaud.) (unaud.) (unaud.) (unaud.) (unaud.) (unaud.) Income statement Revenue GN Hearing 1,218 1,265 1,284 1,389 1,376 1,415 1,327 1,497 5,156 5,615 GN Audio 720 824 833 1,118 857 978 955 1,180 3,495 3,970 Total 1,938 2,089 2,117 2,507 2,233 2,393 2,282 2,677 8,651 9,585 Organic growth GN Hearing 11% 10% 5% 1% 4% 5% 6% 11% 6% 6% GN Audio 4% 9% 9% 6% 8% 12% 9% 12% 7% 10% Total 8% 9% 6% 3% 5% 7% 7% 11% 6% 8% Gross profit GN Hearing 818 840 906 994 938 975 908 1,074 3,558 3,895 GN Audio 371 435 441 596 441 519 513 640 1,843 2,113 Total 1,189 1,275 1,347 1,590 1,379 1,494 1,421 1,714 5,401 6,008 Gross profit margin GN Hearing 67.2% 66.4% 70.6% 71.6% 68.2% 68.9% 68.4% 71.7% 69.0% 69.4% GN Audio 51.5% 52.8% 52.9% 53.3% 51.5% 53.1% 53.7% 54.2% 52.7% 53.2% Total 61.4% 61.0% 63.6% 63.4% 61.8% 62.4% 62.3% 64.0% 62.4% 62.7% Expensed development costs GN Hearing (116) (118) (117) (103) (103) (107) (104) (99) (454) (413) GN Audio (50) (68) (55) (44) (64) (59) (61) (57) (217) (241) Other * (3) - (1) (2) (8) (17) (14) (17) (6) (56) Total (169) (186) (173) (149) (175) (183) (179) (173) (677) (710) Selling and distribution costs and administrative expenses etc. GN Hearing (477) (483) (552) (530) (590) (613) (547) (579) (2,042) (2,329) GN Audio (231) (252) (247) (299) (274) (292) (273) (312) (1,029) (1,151) Other * (15) (18) (18) (19) (20) (20) (16) (18) (70) (74) Total (723) (753) (817) (848) (884) (925) (836) (909) (3,141) (3,554) EBITA GN Hearing 225 239 237 361 245 255 257 396 1,062 1,153 GN Audio 90 115 139 253 103 168 179 271 597 721 Other * (18) (18) (19) (21) (28) (37) (30) (35) (76) (130) Total 297 336 357 593 320 386 406 632 1,583 1,744 EBITA margin GN Hearing 18.5% 18.9% 18.5% 26.0% 17.8% 18.0% 19.4% 26.5% 20.6% 20.5% GN Audio 12.5% 14.0% 16.7% 22.6% 12.0% 17.2% 18.7% 23.0% 17.1% 18.2% Total 15.3% 16.1% 16.9% 23.7% 14.3% 16.1% 17.8% 23.6% 18.3% 18.2% Depreciation and software amortization GN Hearing (25) (26) (29) (29) (28) (28) (28) (28) (109) (112) GN Audio (9) (9) (10) (9) (9) (9) (9) (8) (37) (35) Other * (8) (8) (7) (8) (7) (8) (9) (10) (31) (34) Total (42) (43) (46) (46) (44) (45) (46) (46) (177) (181) EBITDA GN Hearing 250 265 266 390 273 283 285 424 1,171 1,265 GN Audio 99 124 149 262 112 177 188 279 634 756 Other * (10) (10) (12) (13) (21) (29) (21) (25) (45) (96) Total 339 379 403 639 364 431 452 678 1,760 1,925 EBITA 297 336 357 593 320 386 406 632 1,583 1,744 Amortization of acquired intangible assets (22) (25) (30) (32) (35) (40) (34) (39) (109) (148) Gain (loss) on divestment of operations etc. (1) (1) - (27) 1 - (1) (38) (29) (38) Operating profit (loss) 274 310 327 534 286 346 371 555 1,445 1,558 Share of profit (loss) in associates - - - 2 - - 6 - 2 6 Financial items, net (5) (7) (49) 9 (31) - (13) (16) (52) (60) Profit (loss) before tax 269 303 278 545 255 346 364 539 1,395 1,504 Tax on profit (loss) (66) (75) (56) (112) (56) (78) (81) (167) (309) (382) Profit (loss) 203 228 222 433 199 268 283 372 1,086 1,122 Balance sheet Development projects GN Hearing 754 759 769 798 816 833 834 859 798 859 GN Audio 233 238 251 267 273 274 279 300 267 300 Total 987 997 1,020 1,065 1,089 1,107 1,113 1,159 1,065 1,159 Inventories GN Hearing 378 396 435 425 412 394 392 382 425 382 GN Audio 224 237 260 290 291 314 384 329 290 329 Total 602 633 695 715 703 708 776 711 715 711 Trade receivables GN Hearing 1,219 1,207 1,142 1,177 1,176 1,138 1,063 1,121 1,177 1,121 GN Audio 690 758 814 1,005 781 906 881 990 1,005 990 Other * 1 - - 1 - - 1 - 1 - Total 1,910 1,965 1,956 2,183 1,957 2,044 1,945 2,111 2,183 2,111 Net working capital GN Hearing 943 834 739 726 841 793 704 671 726 671 GN Audio 485 463 454 500 465 496 514 469 500 469 Other * (93) (68) (84) (88) (113) (117) (78) (55) (88) (55) Total 1,335 1,229 1,109 1,138 1,193 1,172 1,140 1,085 1,138 1,085 Free cash flow excl. company acquisitions and di-vestments GN Hearing 47 279 271 107 86 267 253 260 704 866 GN Audio 29 160 128 206 78 131 164 108 523 481 Other * (49) (25) (24) 50 (22) (53) (61) (77) (48) (213) Total 27 414 375 363 142 345 356 291 1,179 1,134 Acquisitions and divestments of companies (33) (54) (606) (187) 683 (11) (5) (9) (880) 658 Free cash flow (6) 360 (231) 176 825 334 351 282 299 1,792
* "Other" comprises Group Functions, GN Ejendomme and eliminations. All numbers excluding Otometrics

50 Financial statements ⋅ Q4 segment disclosures Contents
GN Group – Annual Report 2017
Income statements GN Hearing GN Audio Other** Consolidated total Q4 Q4 Q4 Q4 Q4 Q4 Q4 Q4 2017 2016 2017 2016 2017 2016 2017 2016 (DKK million) (unaud.) (unaud.) (unaud.) (unaud.) (unaud.) (unaud.) (unaud.) (unaud.) Continuing operations Revenue 1,497 1,389 1,180 1,118 - - 2,677 2,507 Production costs (423) (395) (540) (522) - - (963) (917) Gross profit 1,074 994 640 596 - - 1,714 1,590 Expensed development costs (99) (103) (57) (44) (17) (2) (173) (149) Selling and distribution costs (479) (476) (273) (239) - - (752) (715) Management and administrative expenses (102) (54) (33) (56) (18) (19) (153) (129) Other operating income and costs, net 2 - (6) (4) - - (4) (4) EBITA* 396 361 271 253 (35) (21) 632 593 Amortization of acquired intangible assets (35) (29) (4) (3) - - (39) (32) Gain (loss) on divestment of operations etc. - (27) (38) - - - (38) (27) Operating profit (loss) 361 305 229 250 (35) (21) 555 534 Share of profit(loss) in associates - 2 - - - - - 2 Financial items (3) 22 (4) (7) (9) (6) (16) 9 Profit (loss) before tax 358 329 225 243 (44) (27) 539 545 Tax on profit (loss) (76) (76) (108) (47) 17 11 (167) (112) Profit (loss) for the period from continuing operations 282 253 117 196 (27) (16) 372 433 Discontinued operations Profit (loss) for the period from discontinued operations (8) (59) - - - - (8) (59) Profit (loss) for the period 274 194 117 196 (27) (16) 364 374
Cash flow statement GN Hearing GN Audio Other** Consolidated total Q4 Q4 Q4 Q4 Q4 Q4 Q4 Q4 2017 2016 2017 2016 2017 2016 2017 2016 (DKK million) (unaud.) (unaud.) (unaud.) (unaud.) (unaud.) (unaud.) (unaud.) (unaud.) Operating activities before changes in working capital 507 387 253 269 (25) (13) 735 643 Cash flow from changes in working capital 1 (22) 39 19 (27) 22 13 19 Cash flow from operating activities excluding financial items and tax 508 365 292 288 (52) 9 748 662 Cash flow from investing activities: Development projects (75) (83) (45) (34) - - (120) (117) Other (94) (120) (14) (186) (33) 10 (141) (296)
Cash flow from operating and investing activities before financial items and tax 339 162 233 68 (85) 19 487 249 Tax and financial items (88) (76) (125) (45) 8 31 (205) (90) Cash flow from operating and investing activities (free cash flow) 251 86 108 23 (77) 50 282 159 Free cash flow excl. company acquisitions and divestments 260 90 108 206 (77) 50 291 346
2016 figures incl. GN Otometrics
Additional information GN Hearing GN Audio Other** Consolidated total Q4 Q4 Q4 Q4 Q4 Q4 Q4 Q4 2017 2016 2017 2016 2017 2016 2017 2016 (DKK million) (unaud.) (unaud.) (unaud.) (unaud.) (unaud.) (unaud.) (unaud.) (unaud.) Revenue distributed geographically Europe 24% 28% 46% 46% 0% 0% 34% 36% North America 55% 52% 40% 40% 0% 0% 48% 46% Rest of World 21% 20% 14% 14% 0% 0% 18% 18% Incurred development costs (122) (137) (76) (56) (17) (2) (215) (195) Capitalized development costs 75 83 45 34 - - 120 117 Amortization and depreciation of development costs*** (52) (49) (26) (22) - - (78) (71) Expensed development costs (99) (103) (57) (44) (17) (2) (173) (149) EBITDA 424 390 279 262 (25) (13) 678 639 Depreciation and software amortization (28) (29) (8) (9) (10) (8) (46) (46) EBITA* 396 361 271 253 (35) (21) 632 593 EBITA margin* 26.5% 26.0% 23.0% 22.6% N/A N/A 23.6% 23.7% Number of employees, end of period ~4.350 ~4.275 ~1.075 ~1.050 ~150 ~75 ~5.575 ~5.400
* Excluding Gain (loss) on divestments of operations, etc. and amortization of acquired intangible assets but including amortization of development projects and software developed in-house.
** "Other" comprises Group Functions, GN Ejendomme and eliminations
*** Does not include amortization of acquired intangible assets, cf. the definition of EBITA
2016 figures excluding GN Otometrics
Q4 segment disclosures

51 Financial Statements ⋅ Consolidated Contents
GN Group – Annual Report 2017
Section 1 Basis of preparation Overview of the financial accounting policies in general and an introduction to Management's key accounting estimates and judgments. 1.1 General accounting policies 56 1.2 Significant accounting estimates and
judgments 58 1.3 Non-IFRS measures 59
Section 2 Results of the year Insights into the results for the year, including operating segments, employee costs and taxes. 2.1 Segment disclosures 60 2.2 Geographical information 66 2.3 Staff Costs 66 2.4 Tax 67 2.5 Income statement classified by function 69
Section 3 Operating assets and liabilities Insights into the assets that form the basis for the activities in GN Store Nord, and the related liabilities. Most of these are included in invested capital and some in net working capital. 3.1 Intangible assets 70 3.2 Property, plant and equipment 73 3.3 Depreciation, amortization and impairment 74 3.4 Other non-current assets 75 3.5 Inventories 76 3.6 Trade receivables 77 3.7 Other payables 77 3.8 Provisions 78
Section 4 Capital structure and financing items Insight into GN Store Nord's capital structure and financial items as well as financial risks. 4.1 Outstanding shares and treasury shares 79 4.2 Financial risks and financial instruments 80 4.3 Liabilities from financing activities 84 4.4 Financial income and expenses 85
Section 5 Other disclosures Statutory notes and other disclosures. 5.1 Acquisition and divestment of companies and
operations 86 5.2 Discontinued operations 88 5.3 Remuneration of the Board of Directors and
Executive Management 89 5.4 Incentive plans 91 5.5 Pension obligations 94 5.6 Contingent assets and liabilities 95 5.7 Associates 96 5.8 Other non-cash adjustments and
reconciliation of cash and cash equivalents 97 5.9 Lease obligations 97 5.10 Fees to auditors appointed at the annual
general meeting 98 5.11 Related parties 98
Financial statements 2017 Content
Consolidated financial statements Consolidated income statement and statement of comprehensive income 52 Consolidated balance sheet at December 31 53 Consolidated statement of cash flow 54 Consolidated statement of equity 55
Notes to the consolidated financial statements

52 Financial Statements ⋅ Consolidated Contents
GN Group – Annual Report 2017
Consolidated income statement DKK million Note 2017 2016 Continuing operations Revenue 2.2 9,585 8,651 Production costs 2.3, 3.3, 3.5 (3,577) (3,250) Gross profit 6,008 5,401 Development costs 2.3, 3.3 (710) (677) Selling and distribution costs 2.3, 3.3 (2,913) (2,564) Management and administrative expenses 2.3, 3.3, 5.10 (635) (579) Other operating income and costs, net (6) 2 EBITA*) 1,744 1,583 Amortization of acquired intangible assets 2.5, 3.3 (148) (109) Gain (loss) on divestment of operations etc. 5.1 (38) (29) Operating profit (loss) 1,558 1,445 Share of profit (loss) in associates 5.7 6 2 Financial income 4.4 159 184 Financial expenses 4.4 (219) (236) Profit (loss) before tax 1,504 1,395 Tax on profit (loss) 2.4 (382) (309) Profit (loss) for the year from continuing operations 1,122 1,086 Discontinued operations Profit (loss) for the year from discontinued operations 5.2 61 (53) Profit (loss) for the year 1,183 1,033 Earnings per share (EPS) 4.1 Earnings per share (EPS) 8.51 6.98 Earnings per share, fully diluted (EPS diluted) 8.45 6.96 Earnings per share (EPS) from continuing operations Earnings per share (EPS) from continuing operations 8.07 7.34 Earnings per share from continuing operations, fully diluted (EPS diluted) 8.02 7.32 * Excluding Gain (loss) on divestments of operations etc. and amortization of acquired intangible assets but including amortization of development projects and software developed in-house.
Consolidated statement of comprehensive income DKK million Note 2017 2016 Profit (loss) for the year 1,183 1,033 Other comprehensive income Items that will not be reclassified to profit or loss Actuarial gains (losses) 15 (5) Tax relating to this item of other comprehensive income 2.4 (4) 1 Items that may be reclassified subsequently to profit or loss Adjustment of cash flow hedges 4.2 110 (42) Foreign exchange adjustments, etc. (802) 198 Tax relating to these items of other comprehensive income 2.4 7 (3) Other comprehensive income for the year, net of tax (674) 149 Total comprehensive income for the year 509 1,182

53 Financial Statements ⋅ Consolidated Contents
GN Group – Annual Report 2017
Consolidated balance sheet at December 31 DKK million Note 2017 2016 Assets Intangible assets 3.1 6,244 6,521 Property, plant and equipment 3.2 486 508 Investments in associates 5.7 17 27 Deferred tax assets 2.4 344 443 Other non-current assets 3.4, 4.2 984 1,094 Total non-current assets 8,075 8,593 Inventories 3.5 711 715 Trade receivables 3.6, 4.2 2,111 2,183 Tax receivables 57 14 Other receivables 4.2 257 231 Cash and cash equivalents 526 178 Total current assets 3,662 3,321 Assets held for sale 5.2 - 921 Total assets 11,737 12,835 Equity and Liabilities Share capital 583 619 Other reserves (2,871) (2,097) Proposed dividends for the year 182 178 Retained earnings 6,889 6,920 Total equity 4,783 5,620 Bank loans and issued bonds 4.2, 4.3 3,508 3,527 Pension obligations 5.5 45 66 Provisions 3.7 183 248 Deferred tax liabilities 2.4 440 430 Other non-current liabilities 4.2, 4.3 315 325 Total non-current liabilities 4,491 4,596 Bank loans 4.2, 4.3 53 55 Trade payables 4.2 605 642 Tax payables 84 72 Provisions 3.7 332 289 Other payables 3.8 1,389 1,350 Total current liabilities 2,463 2,408 Liabilities directly associated with assets held for sale 5.2 - 211 Total equity and liabilities 11,737 12,835

54 Financial Statements ⋅ Consolidated Contents
GN Group – Annual Report 2017
Consolidated statement of cash flow DKK million Note 2017 2016 Operating activities Operating profit (loss) from continuing operations 1,558 1,445 Operating profit (loss) from discontinued operations - (55) Operating profit (loss) 1,558 1,390 Depreciation, amortization and impairment 632 666 Other non-cash adjustments 5.8 106 1 Cash flow from operating activities before changes in working capital 2,296 2,057 Change in inventories (8) (92) Change in receivables (159) 12 Change in trade payables and other payables 193 94 Total changes in working capital 26 14 Cash flow from operating activities before financial items and tax 2,322 2,071 Interest and dividends, etc., received 27 32 Interest etc. paid (114) (115) Tax paid, net (350) (185) Cash flow from operating activities 1,885 1,803 Investing activities Investments in intangible assets, excluding development projects 3.1 (181) (127) Development projects 3.1 (396) (481) Investments in property, plant and equipment 3.2 (103) (115) Investments in other non-current assets (229) (201) Disposal of intangible assets and property, plant and equipment 1 25 Disposal/repayment of other non-current assets 157 214 Acquisition of companies/operations 5.1 (94) (880) Divestment of companies/operations 5.2 752 - Cash flow from investing activities (93) (1,565) Cash flow from operating and investing activities (free cash flow) 1,792 238 Financing activities Increase of long-term loans - 1,228 Increase/(decrease) of short-term loans 4.3 (2) 11 Decrease of long-term loans 4.3 (1,616) - Net proceeds from issue of bond-with-warrant units (convertible bond) 4.3 1,560 - Net proceeds from warrant units issued with bonds 4.3 76 - Paid dividends (161) (149) Share-based payment (exercised) 70 67 Purchase/sale of treasury shares (1,372) (1,272) Other adjustments (13) (50) Cash flow from financing activities (1,458) (165) Net cash flow 334 73 Cash and cash equivalents, beginning of period 207 132 Adjustment foreign currency, cash and cash equivalents (15) 2 Cash and cash equivalents, end of period 5.8 526 207

55 Financial Statements ⋅ Consolidated Contents
GN Group – Annual Report 2017
Consolidated statement of equity -
Other reserves
DKK million Share
capital*
Foreign exchange
adjustments Hedging
reserve Treasury
shares
Proposed dividends
for the year Retained earnings
Total equity
Balance sheet total at December 31, 2015 649 (726) (27) (1,360) 161 7,067 5,764 Profit (loss) for the period - - - - - 1,033 1,033 Actuarial gains (losses) - - - - - (5) (5) Adjustment of cash flow hedges - - (42) - - - (42) Foreign exchange adjustments, etc. - 198 - - - - 198 Tax relating to other comprehensive income - (12) 9 - - 1 (2) Total comprehensive income for the year - 186 (33) - - 1,029 1,182 Reduction of share capital (30) - - 1,036 - (1,006) - Share-based payment (granted) - - - - - 22 22 Share-based payment (exercised) - - - 99 - (32) 67 Tax related to share-based incentive plans - - - - - 6 6 Purchase/sale of treasury shares - - - (1,272) - - (1,272) Proposed dividends for the year* - - - - 178 (178) - Paid dividends - - - - (149) - (149) Dividends, treasury shares - - - - (12) 12 - Balance sheet total at December 31, 2016 619 (540) (60) (1,497) 178 6,920 5,620 Profit (loss) for the period - - - - - 1,183 1,183 Actuarial gains (losses) - - - - - 15 15 Adjustment of cash flow hedges - - 110 - - - 110 Foreign exchange adjustments, etc. - (802) - - - - (802) Tax relating to other comprehensive income - 31 (24) - - (4) 3 Total comprehensive income for the year - (771) 86 - - 1,194 509 Reduction of share capital (36) - - 1,193 - (1,157) - Fair value of warrants issued with bonds (proceeds) - - - - - 76 76 Share-based payment (granted) - - - - - 22 22 Share-based payment (exercised) - - - 90 - (20) 70 Tax related to share-based incentive plans - - - - - 19 19 Purchase/sale of treasury shares - - - (1,372) - - (1,372) Proposed dividends for the year** - - - - 182 (182) - Paid dividends - - - - (161) - (161) Dividends, treasury shares - - - - (17) 17 - Balance sheet total at December 31, 2017 583 (1,311) 26 (1,586) 182 6,889 4,783 * The nominal value of all shares outstanding is DKK 4.00 (2016 DKK 4.00) per share
**Equivalent to DKK 1.25 per share (2016: DKK 1.15 per share)

56 Financial Statements ⋅ Consolidated Contents
GN Group – Annual Report 2017
In the annual report the notes are grouped in sections. Each note includes the accounting policies and significant accounting estimates applicable to the relevant notes. The description of the accounting policies in the notes is part of the complete description of GN Store Nord’s accounting policies. The notes are grouped in these five sections: Section 1 Basis of preparation Section 2 Results for the year Section 3 Operating assets and liabilities Section 4 Capital structure and financing items Section 5 Other disclosures New or revised EU endorsed accounting standards and interpretations are described in addition to how these changes are expected to impact the financial performance and reporting of the GN Store Nord Group.
1.1 General accounting policies The annual report of GN Store Nord for 2017 has been prepared in accordance with International Financial Reporting Standards (IFRS) as adopted by the EU and the Danish disclosure requirements for annual reports of listed companies. The annual report has been prepared in accordance with the historical cost convention, as modified by the revaluation of available-for-sale financial assets and derivative financial instruments at fair value. Adoption of new and revised accounting standards GN Store Nord has adopted all the relevant new and revised International Financial Reporting Standards and IFRIC Interpretations effective as of January 1, 2017. The new and revised Standards and Interpretations did not affect recognition and measurement materially nor did they result in any material changes to disclosures in the notes. Apart from these minor changes, the annual report is presented in accordance with the accounting policies applied in previous years’ annual reports. Accounting standards not yet adopted A number of new standards, amendments to standards and interpretations are effective for annual periods beginning after January 1, 2017, or have not yet been adopted by the EU, and have not been applied in preparing this annual report. Those, which may be relevant to GN Store Nord, are the following:
IFRS 16 Leases IFRS 16 applies to periods beginning on or after January 1, 2019. The effects of the standard have not yet been analyzed in detail and the financial impact of the new standard will depend on the lease agreements in effect at the time of adoption. However, it is expected
that EBITA will increase with the so-called implicit lease interest rate. This is due to lease payments from operating leases that will be replaced by depreciation included above EBITA and a calculated interest included in financial items. EBITDA is therefore also expected to increase with an amount equal to the operating lease payments.
Net Interest Bearing Debt is expected to increase with the present value of recognized lease liabilities. Invested capital is expected to increase with the value of the lease assets measured initially as the present value of the recognized leasing liabilities. Return on invested capital is expected to be affected slightly negative as the return on the leased assets to be included in invested capital, in the form of an increase in EBITA with the implicit lease interest rate, are expected to be lower than GN Store Nord's ROIC. The ratio NIBD/EBITDA is expected to increase slightly as NIBD is expected to increase more than EBITDA compared to the current ratio between NIBD and EBITDA.
Free cash flow is expected to increase as the major part of the lease payments will be included under financing activities instead of under operating activities.
IFRS 9 - Financial Instruments IFRS 9 applies to annual periods beginning on or after January 1, 2018. IFRS 9 addresses the classification and measurement of finan-cial assets and liabilities and introduces new rules for hedge account-ing and a new impairment model for financial assets. GN Store Nord has reviewed the group’s financial assets and liabilities which resulted in a minor impact on recognition and measurement from implement-ing IFRS 9. As described below the total effect as of January 1, 2018 will be that Loans to dispensers and ownership interests will increase DKK 10 million and, due to a related effect on deferred tax, equity will increase DKK 7 million. GN Store Nord’s use of hedge accounting will not be affected by implementing IFRS 9 and neither will the ac-
Section 1 Basis of preparation

57 Financial Statements ⋅ Consolidated Contents
GN Group – Annual Report 2017
counting for financial liabilities. The disclosures regarding classifica-tion of certain financial assets will change as financial assets will be classified as measured at either cost or fair value. Ownership interests in unlisted enterprises in which GN Store Nord does not exercise significant influence, and derivative financial instru-ments related to such, are currently measured at cost. After the im-plementation of IFRS 9, ownership interests will be measured at fair value. It will be decided upon initial recognition on an instrument-by-instrument basis whether the ownership interests will be measured at fair value through profit or loss or at fair value through other compre-hensive income. Derivative financial instruments on ownership inter-ests will be measured at fair value through profit or loss. Going for-ward the income statement will be affected by changes in the fair value of the derivative financial instruments and by changes in the fair value of selected ownership interests. As of January 1, 2018 the value of ownership interests and derivative financial instruments re-lated to such will increase by DKK 22 million. Dispenser loans and trade receivables will continue to be measured at amortized cost. When measuring loss allowances, GN Store Nord will apply the sim-plified approach on trade receivables and record lifetime expected credit losses on all trade receivables. GN Store Nord will measure loss allowances on dispenser loans equal to 12-month expected credit losses, if the credit risk has not increased significantly since initial recognition. If the credit risk has increased significantly, the loss al-lowance will be measured at an amount equal to lifetime expected credit losses. As of January 1, 2018 the loss allowances on Loans to dispensers will increase DKK 12 million. IFRS 7 will require additional disclosures in the Annual Report 2018. IFRS 15 - Revenue from Contracts with Customers IFRS 15 applies to annual periods beginning on or after January 1, 2018. IFRS 15 introduces a five-step model for recognizing revenue from contracts with customers. During 2017, GN Store Nord has per-formed an analysis of contracts with customers and concluded, that revenue recognition will not be impacted significantly from imple-menting IFRS 15. GN Store Nord currently recognizes revenue when the risk and rewards of ownership of the products are transferred to the customer. After the implementation of IFRS 15 revenue will be recognized when control of the products has been transferred to the customer. Based on the analysis of contracts with customers this will not change the timing of revenue recognition. According to current practice the value of extended warranties are recognized over the extended warranty period. After the implementa-tion of IFRS 15 the transaction price in a sales transaction will be allo-cated to the promised goods and services based on stand-alone sell-ing prices and revenue will be recognized when (or as) GN Store Nord satisfies the performance obligations. This will not affect the revenue recognition of extended warranties. When goods are sold with a right of return, a refund liability (contract liability) and a right to the re-turned products (contract asset) will be recognized as a provision and a current asset, respectively. As this is in line with current practice, it will not result in any changes to the balance sheet.
The new standard will require additional disclosures regarding reve-nue recognition in the Annual Report and i.e. opening and closing bal-ances of contract liabilities, as well as revenue recognized during the year from changes in contract liabilities, are expected to be disclosed in a new note. GN Store Nord’s current disaggregation of revenue in segments and geography will not change due to the implementation of IFRS 15.
GN Store Nord will adopt the mentioned standards and interpretations as of the effective dates. Consolidated Financial Statements The consolidated financial statements relate to the parent company, GN Store Nord, and the enterprises in which GN Store Nord directly or indirectly holds more than 50% of the voting rights or where it, in some other way, has the power to govern the financial and operating policies of an enterprise. GN Store Nord and its subsidiaries are referred to as the Group. Group companies are listed on page 99. Enterprises that are not subsidiaries, but where GN Store Nord holds between 20% and 50% of the voting rights and over which it exercises significant influence, but where it does not have power to govern the financial and operating policies, are considered associates. When assessing whether GN Store Nord exercises control or significant influence, potential voting rights that are substantive and options on acquisition of additional ownership interests are taken into account. The consolidated financial statements are prepared as a consolidation of the financial statements of the parent company and those of the individual subsidiaries, all of which are presented in accordance with the Group’s accounting policies. Intra-group income and expenses, shareholdings, intra-group balances and dividends, and realized and unrealized gains and losses on intra-group transactions are eliminated. On consolidation, the carrying amount of shares held by the parent company in subsidiaries is set off against the subsidiaries’ equity. Foreign Currency Translation Functional Currency and Presentation Currency Financial statement items for each of the reporting enterprises in the Group are measured using the currency used in the primary financial environment in which the reporting enterprise operates. Transactions denominated in other currencies than the functional currency are considered transactions denominated in foreign currencies. The consolidated financial statements are presented in Danish kroner (DKK), which is the functional currency and presentation currency of the parent company. Translation of Transactions and Balances On initial recognition, transactions denominated in foreign currencies are translated to the functional currency at the exchange rates at the transaction date. Foreign exchange differences arising between the exchange rates at the transaction date and at the date of payment are recognized in the income statement as financial income or financial expenses. Receivables, payables and other monetary items denominated in foreign currencies are translated at the exchange rates at the balance sheet date. The difference between the

58 Financial Statements ⋅ Consolidated Contents
GN Group – Annual Report 2017
exchange rates at the balance sheet date and at the date at which the receivable or payable arose or was recognized in the latest annual report is recognized in the income statement as financial income or financial expenses. Translation of Subsidiaries On recognition in the consolidated financial statements of foreign entities with another functional currency than GN Store Nord’s presentation currency, the income statements are translated at the exchange rates at the transaction date, and the balance sheet items are translated at the exchange rates at the balance sheet date. An average exchange rate for the month is used as the exchange rate at the transaction date to the extent that this does not significantly distort the presentation of the underlying transactions. Foreign exchange differences arising on translation of the opening balance of equity of such enterprises at the exchange rates at the balance sheet date and on translation of the income statements from the exchange rates at the transaction date to the exchange rates at the balance sheet date are recognized in other comprehensive income. Foreign exchange adjustment of balances with foreign entities that are considered part of the investment in the entity are recognized in other comprehensive income in the consolidated financial statements under a separate translation reserve. Cash Flow Statement The cash flow statement is presented using the indirect method based on the operating profit (loss). The cash flow statement shows the cash flow from operating, investing and financing activities for the year and the year’s changes in cash and cash equivalents as well as the cash and cash equivalents at the beginning and end of the year. The cash flow effect of acquisitions and disposals of enterprises is shown separately in cash flows from investing activities. Cash flow from acquired enterprises is recognized in the cash flow statement from the acquisition date. Cash flow from disposed of enterprises is recognized up until the disposal date. Cash flow from operating activities comprises cash flow from the year’s operations adjusted for non-cash operating items and changes in working capital. Working capital comprises current assets excluding items stated as cash and cash equivalents and excluding tax receivable, as well as current liabilities excluding bank loans, tax payable and provisions.
Cash flow from investing activities comprises payments in connection with acquisitions and disposals of enterprises and activities, acquisitions and disposals of intangible assets, property, plant and equipment and other non-current assets and acquisitions and disposals of securities that are not included in cash and cash equivalents. Cash flow from financing activities comprises changes in the size or composition of the share capital and related costs as well as the raising of loans, repayment of interest-bearing debt, acquisition and disposal of treasury shares and payment of dividends to shareholders. Cash and cash equivalents comprise cash and short-term marketable securities with a term of three months or less and are subject to an insignificant risk of changes in value.
1.2 Significant accounting estimates and judgments The recognition of certain items of income and expenses and the determination of the carrying amount of certain assets and liabilities implies making accounting estimates and judgments. Significant accounting estimates and judgments comprise revenue recognition, computation of amortization, depreciation and impairment, useful lives and remaining useful lives of non-current assets. Furthermore, recognition of pension obligations and similar non-current obligations, provisions, contingent assets and liabilities as well as measurement of investment in associates requires significant accounting estimates and judgments. The estimates used are based on assumptions, which by Management are deemed reliable, but by nature are associated with uncertainty. The assumptions may be incomplete or incorrect, and unexpected events or circumstances may arise. Accordingly, the Company is subject to risks and uncertainties that may lead to a situation where actual results differ from estimates. A description of significant accounting estimates and judgments is included in the relevant notes:
Estimate/Judgment Section Revenue recognition 2.1 Segment disclosures Measurement of deferred tax 2.4 Tax Recognition and measurement of goodwill and development projects 3.1 Intangible assets Loans to dispensers and ownership interests 3.4 Other non-current assets Measurement of inventories 3.5 Inventories Measurement of trade receivables 3.6 Trade receivables Measurement of provisions 3.7 Provisions
Recognition of contingent assets and liabilities 5.5 Contingent liabilities, other financial liabilities and contingent assets

59 Financial Statements ⋅ Consolidated Contents
GN Group – Annual Report 2017
1.3 Non-IFRS measures This Annual Report includes financial measures which are not defined by IFRS. These measures are included because they are used to analyze and manage the business and to provide GN Store Nord’s management and stakeholders with useful information on the group’s financial position, performance and development. Please refer to Key ratio definitions for a definition of the measures.

60 Financial Statements ⋅ Consolidated Contents
GN Group – Annual Report 2017
2.1 Segment disclosures
Income statement 2017
DKK million GN Hearing GN Audio Other GN Eliminations Consolidated
total Continuing operations External revenue 5,615 3,970 - - 9,585 Internal revenue - - 171 (171) - Revenue 5,615 3,970 171 (171) 9,585 Production costs (1,720) (1,857) - - (3,577) Gross profit 3,895 2,113 171 (171) 6,008 Expensed development costs (413) (241) (56) - (710) Selling and distribution costs (1,953) (960) - - (2,913) Management and administrative expenses (377) (184) (245) 171 (635) Other operating income and costs, net 1 (7) - - (6) EBITA* 1,153 721 (130) - 1,744 Amortization of acquired intangible assets (132) (16) - - (148) Gain (loss) on divestment of operations etc. - (38) - - (38) Operating profit (loss) 1,021 667 (130) - 1,558 Share of profit (loss) in associates 6 - - - 6 Financial income 206 68 127 (242) 159 Financial expenses (232) (75) (154) 242 (219) Profit (loss) before tax 1,001 660 (157) - 1,504 Tax on profit (loss) (234) (190) 42 - (382) Profit (loss) for the year from continuing operations 767 470 (115) - 1,122 Discontinued operations Profit (loss) for the year from discontinued operations 61 - - - 61 Profit (loss) for the year 828 470 (115) - 1,183 Impairment losses and reversals regarding intangible assets and property, plant and equipment recognized in the income statement (3) (1) - - (4)
Transactions between segments are based on market terms. Eliminations in the income statement concern internal revenue, intersegment rent, management fee and interest.
Other segment disclosures 2017
DKK million GN Hearing GN Audio Other GN Eliminations Consolidated
total Incurred development costs (468) (269) (56) - (793) Capitalized development costs 264 132 - - 396 Amortization and depreciation (209) (104) - - (313) Expensed development costs (413) (241) (56) - (710) EBITDA** 1,265 756 (96) - 1,925 Depreciation and software amortization (112) (35) (34) - (181) EBITA* 1,153 721 (130) - 1,744 * Excluding Gain (Loss) on divestments of operations etc. and Amortization of acquired intangible assets but including amortization of development projects and software developed in-house.
** Excluding Gain (Loss) on divestments of operations etc. but including Amortization of development projects.
Section 2 Results of the year

61 Financial Statements ⋅ Consolidated Contents
GN Group – Annual Report 2017
2.1 Segment disclosures (Continued) Income statement 2016
DKK million GN Hearing GN Audio Other GN Eliminations Consolidated
total Continuing operations External revenue 5,156 3,495 - - 8,651 Internal revenue - - 59 (59) - Revenue 5,156 3,495 59 (59) 8,651 Production costs (1,598) (1,652) - - (3,250) Gross profit 3,558 1,843 59 (59) 5,401 Expensed development costs (454) (217) (6) - (677) Selling and distribution costs (1,706) (858) - - (2,564) Management and administrative expenses (341) (168) (129) 59 (579) Other operating income and costs, net 5 (3) - - 2 EBITA* 1,062 597 (76) - 1,583 Amortization of acquired intangible assets (103) (6) - - (109) Gain (loss) on divestment of operations etc. (29) - - - (29) Operating profit (loss) 930 591 (76) - 1,445 Share of profit (loss) in associates 2 - - - 2 Financial income 257 72 123 (268) 184 Financial expenses (274) (59) (171) 268 (236) Profit (loss) before tax 915 604 (124) - 1,395 Tax on profit (loss) (224) (113) 28 - (309) Profit (loss) for the year from continuing operations 691 491 (96) - 1,086 Discontinued operations Profit (loss) for the year from discontinued operations (53) - - - (53) Profit (loss) for the year 638 491 (96) - 1,033 Impairment losses and reversals regarding intangible assets and property, plant and equipment recognized in the income statement (27) (1) - - (28) Transactions between segments are based on market terms. Eliminations in the income statement concern internal revenue, intersegment rent, management fee and interest. Other segment disclosures 2016
DKK million GN Hearing GN Audio Other GN Eliminations Consolidated
total Incurred development costs (503) (254) (6) - (763) Capitalized development costs 269 126 - - 395 Amortization and depreciation (220) (89) - - (309) Expensed development costs (454) (217) (6) - (677) EBITDA** 1,171 634 (45) - 1,760 Depreciation and software amortization (109) (37) (31) - (177) EBITA* 1,062 597 (76) - 1,583 * Excluding Gain (Loss) on divestments of operations etc. and Amortization of acquired intangible assets but including amortization of development projects and software developed in-house.
** Excluding Gain (Loss) on divestments of operations etc. but including Amortization of development projects.

62 Financial Statements ⋅ Consolidated Contents
GN Group – Annual Report 2017
2.1 Segment disclosures (Continued) Balance sheet 2017
DKK million GN Hearing GN Audio Other GN Eliminations Consolidated
total Assets Goodwill 3,339 640 - - 3,979 Development projects 859 300 - - 1,159 Other intangible assets 797 116 193 - 1,106 Property, plant and equipment 235 78 173 - 486 Loans to dispensers and ownership interests 755 - - - 755 Other non-current assets 490 101 1 (2) 590 Total non-current assets 6,475 1,235 367 (2) 8,075 Inventories 382 329 - - 711 Trade receivables 1,121 990 - - 2,111 Receivables from subsidiaries* - 578 423 (1,001) - Tax receivables 67 19 - (29) 57 Other receivables 178 30 49 - 257 Cash and cash equivalents 157 104 265 - 526 Total current assets 1,905 2,050 737 (1,030) 3,662 Total assets 8,380 3,285 1,104 (1,032) 11,737 Equity and Liabilities Equity 5,254 2,228 (2,699) - 4,783 Bank loans and issued bonds - - 3,508 - 3,508 Pension obligations and deferred tax 233 77 177 (2) 485 Provisions 171 12 - - 183 Other non-current liabilities 315 - - - 315 Total non-current liabilities 719 89 3,685 (2) 4,491 Bank loans 38 4 11 - 53 Trade payables 222 350 33 - 605 Amounts owed to subsidiaries* 1,001 - - (1,001) - Tax payables 101 9 3 (29) 84 Provisions 257 75 - - 332 Other current liabilities 788 530 71 - 1,389 Total current liabilities 2,407 968 118 (1,030) 2,463 Total equity and liabilities 8,380 3,285 1,104 (1,032) 11,737 *Net amount Eliminations in the balance sheet concern tax and intercompany balances.

63 Financial Statements ⋅ Consolidated Contents
GN Group – Annual Report 2017
2.1 Segment disclosures (Continued) Cash flow statement 2017
DKK million GN Hearing GN Audio Other GN Eliminations Consolidated
total Cash flow from operating activities before changes in working capital 1,541 851 (96) - 2,296 Cash flow from changes in working capital 47 (12) (9) - 26 Cash flow from operating activities before financial items and tax 1,588 839 (105) - 2,322 Cash flow from investing activities: Development projects (264) (132) - - (396) Other investing activities 428 (43) (82) - 303 Cash flow from operating and investing activities before financial items and tax 1,752 664 (187) - 2,229 Tax and financial items (228) (183) (26) - (437) Cash flow from operating and investing activities (free cash flow) 1,524 481 (213) - 1,792 Revenues are in all material respects related to sale of goods; hearing aid instruments, DKK 5,615 million (2016 DKK 5,156 million) and headsets and other audio solutions, DKK 3,970 million (2016 DKK 3,495 million)

64 Financial Statements ⋅ Consolidated Contents
GN Group – Annual Report 2017
2.1 Segment disclosures (Continued) Balance sheet 2016
DKK million GN Hearing GN Audio Other GN Eliminations Consolidated
total Assets Goodwill 3,661 711 - - 4,372 Development projects 798 267 - - 1,065 Other intangible assets 854 149 81 - 1,084 Property, plant and equipment 262 71 175 - 508 Loans to dispensers and ownership interests 865 - - - 865 Other non-current assets 567 209 - (77) 699 Total non-current assets 7,007 1,407 256 (77) 8,593 Inventories 425 290 - - 715 Trade receivables 1,177 1,005 1 - 2,183 Receivables from subsidiaries* - 2,229 - (2,229) - Tax receivables 49 8 - (43) 14 Other receivables 171 51 9 - 231 Cash and cash equivalents 114 64 - - 178 Total current assets 1,936 3,647 10 (2,272) 3,321 Assets held for sale 921 - - - 921 Total assets 9,864 5,054 266 (2,349) 12,835 Equity and Liabilities Equity 6,802 3,961 (5,143) - 5,620 Bank loans - - 3,527 - 3,527 Pension obligations and deferred tax 293 101 179 (77) 496 Provisions 238 9 1 - 248 Other non-current liabilities 325 - - - 325 Total non-current liabilities 856 110 3,707 (77) 4,596 Bank loans - 8 47 - 55 Trade payables 245 380 17 - 642 Amounts owed to subsidiaries* 681 - 1,548 (2,229) - Tax payables 43 63 9 (43) 72 Provisions 222 67 - - 289 Other current liabilities 804 465 81 - 1,350 Total current liabilities 1,995 983 1,702 (2,272) 2,408 Liabilities directly associated with assets held for sale 211 - - - 211 Total equity and liabilities 9,864 5,054 266 (2,349) 12,835 *Net amount Eliminations in the balance sheet concern tax and intercompany balances.

65 Financial Statements ⋅ Consolidated Contents
GN Group – Annual Report 2017
2.1 Segment disclosures (Continued) Cash flow statement 2016
DKK million GN Hearing GN Audio Other GN Eliminations Consolidated
total Cash flow from operating activities before changes in working capital 1,397 712 (52) - 2,057 Cash flow from changes in working capital (32) 36 10 - 14 Cash flow from operating activities before financial items and tax 1,365 748 (42) - 2,071 Cash flow from investing activities: Development projects (355) (126) - - (481) Other investing activities (878) (207) 1 - (1,084) Cash flow from operating and investing activities before financial items and tax 132 415 (41) - 506 Tax and financial items (186) (75) (7) - (268) Cash flow from operating and investing activities (free cash flow) (54) 340 (48) - 238
Accounting policies Segment Information GN Store Nord’s management has identified GN Hearing and GN Audio as the reportable segments in the Group. GN Hearing is operating within the hearing instrument industry, primarily producing and selling hearing instruments and products related hereto. GN Audio a leading supplier of headsets and speakerphone solutions for professional use, and consumer headsets and earbuds for calls, music and media consumption. Segment information is based on the Group’s Accounting Policies. In the Group, segment performance is evaluated on the basis of EBITA as defined under key ratio definitions. Segment revenue and expense and segment assets and liabilities comprise items directly attributable to a segment and items that can be allocated to a segment on a reasonable basis. Other GN primarily reflects cost from Group Functions, including new business opportunities and research projects under the supervision of the GN Store Nord Strategy Committee, which are outside the reportable segments in the Group. Furthermore, unallocated balance sheet items are included. Revenue Revenue from sale of goods and rendering of services is recognized in the income statement provided that delivery and transfer of risk to the buyer has taken place before year-end and that the income can be reliably measured and is expected to be received. Extended warranties are separated from the sale of goods and recognized on a straight-line basis over the term of the contract. The value of extended warranties that are not separately priced is estimated. Revenue is measured excluding VAT, taxes and granted cash and quantity discounts in relation to the sale and expected returns of goods. The portion of goods sold that is expected to be returned is determined based on historical product returns data. Production Costs Production costs comprise costs, including depreciation and salaries, incurred in generating the revenue for the year. Production costs include direct and indirect costs for raw materials and consumables, wages and salaries, maintenance and depreciation and impairment of production plant and costs and expenses relating to the operation, administration and management of factories. Also included are inventory write-downs. Development Costs Development costs comprise costs, salaries, and depreciation of operating assets and equipment directly or indirectly attributable to the Group’s development activities. Furthermore, amortization and write-down of capitalized development projects are included. Selling and Distribution Costs Selling and distribution costs comprise costs relating to the sale and distribution of products and services, including salaries, sales commissions, advertising and marketing costs, depreciation and impairment, etc. Also included are losses on trade receivables.

66 Financial Statements ⋅ Consolidated Contents
GN Group – Annual Report 2017
2.1 Segment disclosures (Continued) Management and Administrative Expenses Management and administrative expenses comprise expenses incurred for management and administration. Administrative expenses include office expenses, depreciation and impairment, etc. Other Operating Income and Costs, net Other operating income and costs comprise items secondary to the principal activities of the enterprises
Significant accounting estimates Revenue Recognition Significant accounting estimates and judgments involve determining the portion of expected returns of goods as well as the amount of discounts and rebates. The portion of goods sold that is expected to be returned is estimated based on historical product returns data
2.2 Geographical information Revenue
Intangible assets and property, plant and equipment
DKK million 2017 2016 2017 2016 Denmark 227 225 2,111 2,039 Rest of Europe 2,982 2,777 358 367 North America 4,615 4,045 4,029 4,378 Rest of World 1,761 1,604 232 245 Consolidated Total 9,585 8,651 6,730 7,029
Revenues are attributed to countries on the basis of the customers location. Intangible assets and property, plant and equipment are attributed based on the physical location of the assets. Only the US (included under the headline North America) represents a material single country.
2.3 Staff Costs DKK million 2017 2016 Wages, salaries and remuneration (2,478) (2,271) Pensions (108) (93) Other social security costs (302) (260) Share-based payments (22) (22) Total (2,910) (2,646) Included in: Production costs and change in payroll costs included in inventories (470) (403) Development costs (443) (453) Selling and distribution costs (1,612) (1,414) Management and administrative expenses (385) (376) Total (2,910) (2,646) Average number of employees 5,500 5,225 Number of employees, year-end 5,575 5,400 For information regarding the remuneration of the Board of Directors and Executive Management, please refer to note 5.3 Remuneration of the Board of Directors and Executive Management.

67 Financial Statements ⋅ Consolidated Contents
GN Group – Annual Report 2017
2.4 Tax Tax on profit (Loss) DKK million 2017 2016 Tax on profit (loss) Current tax for the year (306) (315) Deferred tax for the year 10 (2) Effect of change in income tax rates (102) 5 Withholding tax - (1) Adjustment to current tax with respect to prior years (6) 14 Adjustment to deferred tax with respect to prior years 22 (10) Total (382) (309) Reconciliation of effective tax rate Danish tax rate 22.0% 22.0% Effect of tax rates in foreign jurisdictions 1.0% 4.1% Non-taxable income (0.6)% (0.4)% Non-deductible expenses 0.9% 2.2% Utilization of previously not recognized tax assets (1.5)% (5.4)% Unrecognized tax assets 0.0% 0.1% Withholding tax 0.0% 0.1% Effect of change in income tax rates 6.8% (0.4)% Share of profit (loss) in associates (0.1)% (0.1)% Adjustment of tax with respect to prior years (1.1)% (0.3)% Other (2.0)% 0.5% Effective tax rate 25.4% 22.4% Effective tax rate, continuing operations 25.4% 22.2% Effective tax rate, discontinued operations 12.6% 15.9% Tax relating to other comprehensive income Actuarial gains (losses) (4) 1 Adjustment of cash flow hedges (24) 9 Foreign exchange adjustments, etc. 31 (12) Total 3 (2)

68 Financial Statements ⋅ Consolidated Contents
GN Group – Annual Report 2017
2.4 Tax (Continued) Deferred Tax DKK million 2017 2016 Deferred tax, net Deferred tax at January 1, net 13 11 Adjustment with respect to prior years 22 (10) Effect of change in income tax rates (102) 5 Addition of deferred tax on acquisition of enterprises (7) (60) Deferred tax for the year recognized in profit (loss) for the year 10 (2) Deferred tax for the year recognized in other comprehensive income for the year 7 (8) Tax related to share-based incentive plans 10 - Foreign exchange adjustments (49) 15 Deferred tax for the year recognized in assets and liabilities held for sale - 62 Deferred tax at December 31, net (96) 13 Deferred tax is recognized in the balance sheet as follows: Deferred tax assets 344 448 Deferred tax liabilities (440) (497) Assets held for sale - (5) Liabilities directly associated with assets held for sale - 67 Deferred tax at December 31, net (96) 13 Deferred tax, net relates to: Intangible assets (420) (443) Property, plant and equipment 26 26 Other securities 11 105 Current assets 57 66 Current liabilities 6 4 Intercompany liabilities 7 (1) Tax loss carryforwards 189 224 Retaxation (127) (152) Provisions 78 200 Other 77 (16) Total (96) 13 Tax value of unrecognized tax assets Tax loss carryforwards 78 149 Other tax assets 31 34 Unrecognized tax assets at December 31 109 183 Unrecognized tax assets are based on the Group's expectations to the future utilization of the tax assets. A number of tax loss carryforwards expire between 2018-2033. Deferred tax, net includes DKK 30 million expected to be utilized within 12 months. Repatriation of retained earnings from certain foreign subsidiaries, however not planned or expected in the foreseeable future, may trigger withholding tax liabilities up to DKK 23 million.
Accounting policies Tax on Profit (Loss) for the year The parent company is jointly taxed with all Danish subsidiaries. The current Danish corporation tax is allocated between the jointly taxed companies in proportion to their taxable income. The jointly taxed companies are taxed under the on-account tax scheme. Tax for the year comprises current tax and changes in deferred tax for the year. The tax expense relating to the profit (loss) for the year is recognized in the income statement, and the tax expense relating to amounts recognized in other comprehensive income is recognized in other comprehensive income.

69 Financial Statements ⋅ Consolidated Contents
GN Group – Annual Report 2017
2.4 Tax (Continued) Current tax payable is recognized in current liabilities and deferred tax is recognized in non-current liabilities. Tax receivable is recognized in current assets and deferred tax assets are recognized in non-current assets. Deferred tax Deferred tax assets, including the tax base of tax loss carryforwards, are recognized at the expected value of their utilization, either as a set-off against tax on future income or as a set-off against deferred tax liabilities in the same legal tax entity and jurisdiction. Deferred tax is measured using the balance sheet liability method on all temporary differences between the carrying amount and the tax base of assets and liabilities. Deferred tax is not recognized on goodwill unless this is deductible for tax purposes. Deferred tax is measured according to the tax rules and at the tax rates applicable in the respective countries at the balance sheet date when the deferred tax is expected to crystallize as current tax. The change in deferred tax as a result of changes in tax rates is recognized in the income statement. If a tax deduction on computation of the taxable income in Denmark or in foreign jurisdictions is obtained as a result of share-based payment programs, the tax benefit for the deduction is recognized directly in the balance sheet. Deferred tax assets are subject to annual impairment tests and are recognized only to the extent that it is probable that the assets will be utilized
Significant accounting estimates Deferred tax Management has made judgments in determining the Company’s valuation of tax, deferred tax assets and deferred tax liabilities and the extent to which deferred tax assets are recognized. GN Store Nord recognizes deferred tax assets only to the extent that it is probable that taxable profit will be available against which the temporary differences and unused tax losses can be utilized
2.5 Income statement classified by function The group presents the income statement based on a classification of costs by function. However, in order to present EBITA* in the income statement, which is the measure of profit used by management, amortization of acquired intangible assets are separated from the individual functions and presented as a separate line item. If amortization of acquired intangible assets are allocated to the individual line items by function the income statement will present as follows: DKK million 2017 2016 Revenue 9,585 8,651 Production costs (3,577) (3,250) Gross profit 6,008 5,401 Development costs (738) (703) Selling and distribution costs (3,033) (2,647) Management and administrative expenses (635) (579) Other operating income and costs, net (6) 2 Gain (loss) on divestment of operations etc. (38) (29) Operating profit (loss) 1,558 1,445 In the above income statement amortization of acquired intangible assets has been allocated to func-tions as follows: Development costs (28) (26) Selling and distribution costs (120) (83) Amortization of acquired intangible assets (148) (109) * Excluding Gain (loss) on divestments of operations etc. and amortization of acquired intangible assets but including amortization of development projects and software developed in-house.

70 Financial Statements ⋅ Consolidated Contents
GN Group – Annual Report 2017
3.1 Intangible assets
DKK million Goodwill
Development projects,
developed in-house Software
Patents and rights Other Total
Cost at January 1 4,372 2,773 632 417 1,331 9,525 Additions on company acquisitions 64 - - - 149 213 Additions - 396 93 - 88 577 Disposals (2) (1) (19) - (18) (40) Foreign exchange adjustments (455) - (15) (20) (137) (627) Cost at December 31 3,979 3,168 691 397 1,413 9,648 Amortization and impairment at January 1 - (1,708) (418) (293) (585) (3,004) Amortization - (302) (58) (28) (117) (505) Disposals - 2 15 - 6 23 Impairment - (1) - - (3) (4) Foreign exchange adjustments - - 14 20 52 86 Amortization and impairment at December 31 - (2,009) (447) (301) (647) (3,404) Carrying amount at December 31, 2017 3,979 1,159 244 96 766 6,244 Cost at January 1 3,606 3,312 581 389 824 8,712 Additions on company acquisitions 788 2 5 4 463 1,262 Additions - 481 72 106 84 743 Disposals (4) (467) (13) - (66) (550) Transferred to assets held for sale (149) (555) (19) (86) (16) (825) Foreign exchange adjustments 131 - 6 4 42 183 Cost at December 31 4,372 2,773 632 417 1,331 9,525 Amortization and impairment at January 1 - (2,128) (355) (266) (494) (3,243) Amortization - (340) (63) (27) (82) (512) Disposals - 460 9 - 3 472 Impairment - (9) (18) - (1) (28) Transferred to assets held for sale - 309 13 5 3 330 Foreign exchange adjustments - - (4) (5) (14) (23) Amortization and impairment at December 31 - (1,708) (418) (293) (585) (3,004) Carrying amount at December 31, 2016 4,372 1,065 214 124 746 6,521 GN Store Nord has not capitalized any borrowing costs in the current or preceding periods as non-current assets are not financed with debt. Impairment of development projects relates to projects for which the sales forecasts cannot justify the capitalized value. The carrying amount of development projects and software in progress amount to DKK 774 million (2016: DKK 918 million). GN has a contractual commitment to invest DKK 28 million in intangible assets at December 31, 2017. Goodwill Additions during the year of DKK 64 million mainly relate to the acquisition of equity shares in hearing instrument chains and distributors cf. note 5.1 Acquisition and divestment of companies and operations. Management has performed an impairment test of the carrying amount of goodwill at December 31, 2017. The impairment test covered the Group's cash-generating units (CGU) to which the carrying amount of goodwill is allocated. Due to changes in GN Audio’s organization and management reporting in 2017, including an increasingly joint organizational set-up throughout the value chain and increased cross selling, the cash flows of the former CGUs Mobile Headsets and Contact Center & Office Headsets are no longer considered independent and GN Audio is considered one CGU.
Section 3 Operating assets and liabilities

71 Financial Statements ⋅ Consolidated Contents
GN Group – Annual Report 2017
3.1 Intangible assets (Continued)
Carrying amount
of goodwill Pre-tax
discount rate Weighted average
cost of capital 2017 2016 2017 2016 2017 2016 Cash-generating units: GN Hearing 3,339 3,661 8 7 7 6 GN Audio 640 - 11 - 9 - Contact Center & Office Headsets - 486 - 11 - 9 Mobile Headsets - 225 - 13 - 11 Total 3,979 4,372 In the impairment test, the discounted future cash flows of each CGU (the value in use) were compared with the carrying amounts. Future cash flows are based on the budget for 2018, market forecasts for 2019 - 2022, strategy plans, etc. approved by the Board of Directors. Budgets and strategy plans are based on specific assumptions for the individual CGU regarding sales, operating profit, working capital, investments in non-current assets, etc. The calculations apply expected growth in the terminal period of 2.5% p.a. GN Hearing constitutes the vast majority of the carrying amount of the goodwill. From 2018 – 2022 the annual growth in the hearing aid market is expected to be around 4-6% in volumes with ASP decline of around 1-2% annually. The GN Hearing segment expects to deliver organic growth above the market growth. The market growth in the hearing aid industry is driven by four main factors:
• The demographic trends including the increased number of elderly people, • Increased prevalence of hearing loss due to the increasing noise in the environment, • Increased penetration rates as more people with a hearing loss will use hearing aids in the future, and • Increased use of two hearing aids instead of only one, which is relatively common today.
The expected revenue growth in the GN Hearing segment is based on the current differentiated product offering with unique wireless technology as well as future product launches. The EBITA margin is expected to be maintained at a competitive level based on continued efficiencies in manufacturing as well as a strict approach to operating costs. Based on the impairment test and related assumptions, management has not identified any goodwill impairment at December 31, 2017. Development projects and software In-progress and completed development projects comprise development and design of hearing instruments, headsets and other hands free audio solutions. Most development projects are expected to be completed in 2018 and 2019, after which product sales and marketing can be commenced. Management performs at least one annual impairment test of the carrying amount of recognized development costs. The recoverable amount is assessed based on sales forecasts. In Management's assessments, the recoverable amount exceeds the carrying amount at December 31, 2017. Software comprises development, design and test of production and planning software and reporting systems, business intelligence etc. Implementation of these systems is expected to optimize internal procedures and processes. In 2017, management assessed that the expected useful lives were reflected in the carrying amounts at December 31, 2017. Patents and rights Patents and rights primarily comprise acquired patents and rights. The most significant patents and rights relate to technologies for the development of new hearing instruments for GN Hearing and rights to the use of certain technologies for development of headsets. Other The Group's other intangible assets comprise DKK 487 million (2016: DKK 466 million) related to customer lists, DKK 105 million (2016: DKK 127 million) related to trademarks and DKK 173 million (2016: DKK 153 million) related to supply agreements.

72 Financial Statements ⋅ Consolidated Contents
GN Group – Annual Report 2017
3.1 Intangible assets (Continued)
Accounting policies Goodwill At the acquisition date goodwill is recognized in the balance sheet at cost as described under Business combinations. Subsequently, goodwill is measured at cost less accumulated impairment losses. Goodwill is not amortized but is tested for impairment at least once a year. The carrying amount of goodwill is allocated to the Group’s cash-generating units at the acquisition date. Identification of cash-generating units is based on how management monitor the operation in the management reporting. As a result of the integration of acquired enterprises in the existing group, Management assesses that the smallest cash-generating units to which the carrying amount of goodwill can be allocated are: GN Hearing and GN Audio. Development projects, Software, Patents, Licenses and Other Intangible Assets Intangible assets are measured at cost less accumulated amortization and impairment. Amortization is provided on a straight-line basis over the expected useful lives of the assets. When changing the depreciation period or the residual value, the effect on the depreciation is recognized prospectively as a change in accounting estimates. Amortization and impairment is recognized in the income statement as production costs, development costs, distribution costs and administrative expenses. The expected useful lives are as follows: Completed development projects 1-5 years Software 1-7 years Patents, licenses, trademarks and other intellectual property rights up to 20 years Development projects that are clearly defined and identifiable, where the technical utilization degree, sufficient resources and a potential future market or development opportunities in the Company is evidenced, and where GN Store Nord intends to produce, market or use the project, are recognized as intangible assets if it is probable that costs incurred will be covered by future earnings. The cost of such development projects includes direct wages, salaries, materials and other direct and indirect costs attributable to the development projects. Amortization and write-down of such capitalized development projects are started at the date of completion and are included in development costs. Other development costs are recognized in the income statement as incurred. Gains or losses on the disposal of intangible assets are determined as the difference between the selling price less selling costs and the carrying amount at the disposal date, and are recognized in the income statement as other operating income or other operating costs, respectively. Impairment of Goodwill and in-progress development projects Goodwill is subject to at least one annual impairment test, initially before the end of the acquisition year. Similarly, in-progress development projects are tested for impairment at least annually. The carrying amount of goodwill is tested for impairment together with the other non-current assets in the cash-generating unit to which the goodwill is allocated. Goodwill is written down to the recoverable amount if the carrying amount is higher than the computed recoverable amount. The recoverable amount is computed as the present value of the expected future net cash flows from the enterprises or activities to which the goodwill is allocated. Recognition of impairment losses in the income statement An impairment loss is recognized if the carrying amount of an asset or its cash-generating unit exceeds the recoverable amount of the asset or the cash-generating unit. Impairment of goodwill is recognized in a separate line item in the income statement. Impairment of goodwill is not reversed
Significant accounting estimates Goodwill Determining whether goodwill is impaired requires a comparison of the recoverable amount with the carrying amount. The recoverable amount is determined as the net present value of the future cash flows expected to arise from the cash generating unit to which goodwill is allocated.

73 Financial Statements ⋅ Consolidated Contents
GN Group – Annual Report 2017
3.1 Intangible assets (Continued) Development projects Development projects are measured at cost less accumulated amortization and impairment. An impairment test is performed of the carrying amount of recognized development projects. The impairment test is based on assumptions regarding strategy, product life cycle, market conditions, discount rates and budgets, etc., after the project has been completed and production has commenced. If market-related assumptions etc., are changed, development projects may have to be written down. Management examines and assesses the underlying assumptions when determining whether or not the carrying amount should be written down. In addition, management continuously assess the useful lives of its products to ensure that amortization of development projects reflects the useful lives
3.2 Property, plant and equipment
DKK million
Factory and office buildings
Leasehold improve-
ments Plant and
machinery
Operating assets and equipment
Leased plant and
equipment
Assets under
construc-tion Total
Cost at January 1 418 160 688 369 6 21 1,662 Additions on company acquisitions - - - 9 - - 9 Additions 8 14 29 16 - 36 103 Disposals - (10) (15) (26) (1) - (52) Transfers - - 25 - - (25) - Foreign exchange adjustments (4) (10) (13) (27) (1) (1) (56) Cost at December 31 422 154 714 341 4 31 1,666 Depreciation and impairment at January 1 (167) (122) (557) (305) (2) - (1,153) Depreciation (16) (13) (68) (25) (1) - (123) Disposals 1 10 11 26 1 - 49 Foreign exchange adjustments 2 9 12 24 - - 47 Depreciation and impairment at December 31 (180) (116) (602) (280) (2) - (1,180) Carrying amount at December 31, 2017 242 38 112 61 2 31 486 Cost at January 1 410 160 744 367 6 12 1,699 Additions on company acquisitions - 2 3 9 - - 14 Additions 11 8 48 25 1 22 115 Disposals (1) (5) (78) (14) (2) - (100) Transfers - 5 5 3 - (13) - Discontinued operations - (11) (35) (24) - - (70) Foreign exchange adjustments (2) 1 1 3 - - 3 Cost at December 31 418 160 688 369 5 21 1,661 Depreciation and impairment at January 1 (154) (121) (586) (301) (3) - (1,165) Depreciation (15) (11) (69) (30) (1) - (126) Disposals 1 4 76 10 2 - 93 Discontinued operations - 7 23 18 - - 48 Foreign exchange adjustments 1 (1) (1) (2) - - (3) Depreciation and impairment at December 31 (167) (122) (557) (305) (2) - (1,153) Carrying amount at December 31, 2016 251 38 131 64 3 21 508 GN Store Nord has not capitalized any borrowing costs in the current or preceding periods as non-current assets are not financed with debt.
Accounting policies Property, plant and Equipment Land and buildings, plant and machinery and fixtures and fittings, other plant and equipment are measured at cost less accumulated depreciation and impairment losses. Cost comprises the purchase price and costs of materials, components, suppliers, direct wages and salaries and indirect production costs until the date when the asset is available for use. Liabilities related to dismantling and removing the asset and restoring the site on which the asset is located are added to the cost. Where individual components of an item of property, plant and equipment have different useful lives, they are accounted for as separate items, which are depreciated separately.

74 Financial Statements ⋅ Consolidated Contents
GN Group – Annual Report 2017
3.2 Property, plant and equipment (Continued) Depreciation is provided on a straight-line basis over the expected useful lives of property, plant and equipment. The expected useful lives are as follows: Buildings and installations (land is not depreciated) 10-50 years Leasehold improvements 5-20 years Plant and machinery 1-7 years Operating assets and equipment 2-7 years The basis of depreciation is calculated as the residual value of the asset less impairment losses. The residual value is determined at the acquisition date and reassessed annually. If the residual value exceeds the carrying amount, depreciation is discontinued. When changing the depreciation period or the residual value, the effect on the depreciation is recognized prospectively as a change in accounting estimates. Depreciation and impairment is recognized in the income statement as production costs, development costs, distribution costs and administrative expenses. Expenses for repairs and maintenance of property, plant and equipment are included in the income statement. Gains or losses on disposal or scrapping of an item of property, plant and equipment are determined as the difference between the sales price reduced by costs related to dismantling and removing the asset, selling costs and costs related to restoring the site on which the asset is located and the carrying amount. Gains or losses are recognized in the income statement as Other operating income or Other operating costs, respectively
3.3 Depreciation, amortization and impairment DKK million 2017 2016 Depreciation, amortization and impairment for the year of property, plant and equipment and intangible assets are recognized in the income statement as follows: Production costs (72) (71) Development costs (313) (309) Selling and distribution costs (25) (31) Management and administrative expenses (74) (65) Amortization of acquired intangible assets (148) (109) Discontinued operations - (81) Total (632) (666) Amortization of intangible assets is recognized in the income statement as follows: Production costs (1) (2) Development costs (303) (299) Selling and distribution costs (8) (15) Management and administrative expenses (48) (39) Amortization of acquired intangible assets (145) (109) Discontinued operations - (48) Total (505) (512) Impairment of intangible assets is recognized in the income statement as follows: Development costs (1) (2) Amortization of acquired intangible assets (3) - Discontinued operations - (26) Total (4) (28)

75 Financial Statements ⋅ Consolidated Contents
GN Group – Annual Report 2017
3.4 Other non-current assets DKK million 2017 2016 Loans to dispensers of GN Hearing products 613 635 Ownership interests 142 230 RAP, SIP and DCP* 219 208 Owed by associates 1 2 Other 9 19 Total 984 1,094 GN Hearing's assessment of credit risk associated with non-current loans to dispensers depends primarily on change in payment behavior and current economic conditions. Before a loan is extended the creditworthiness of the individual dispenser is analyzed. No individual dispenser accounts for more than 10% of total non-current loans to dispensers. *RAP (Retirement Advantage Plan) and SIP (Savings and Investment Plan) are programs in which customers earn funds based on purchases made. DCP (Deferred Compensation Plan) is a program in which management in certain foreign subsidiaries may choose to defer compensation. The amounts invested by the Group on behalf of customers and management are recognized in Other non-current assets. The Group’s liabilities related to the programs are recognized in Other non-current liabilities at DKK 227 million (2016: DKK 230 million).
Accounting policies Loans to dispensers Loans to dispensers and other receivables are measured at amortized cost less write-down for foreseen bad debt losses. Ownership Interests and savings plans Ownership interests between 20% and 50% in unlisted enterprises in which GN Hearing does not exercise significant influence on the financial and operating policies are recognized under non-current assets at cost and are subsequently measured at cost if a reliable measurement of the fair value cannot be made. The savings plans RAP, SIP and DCP are measured at fair value. Impairment of Other non-current assets The carrying amount of Other non-current assets is subject to an annual impairment test for indications of impairment. When there is an indication that assets may be impaired, the recoverable amount of the asset is determined. The recoverable amount is the higher of an asset's fair value less expected costs to sell and its value in use. Value in use is the present value of the future cash flows expected to be derived from an asset or the cash-generating unit to which the asset belongs. Recognition of impairment losses in the income statement An impairment loss is recognized if the carrying amount of an asset or its cash-generating unit exceeds the recoverable amount of the asset or the cash-generating unit. Impairment losses are recognized in the income statement under the respective functions. Impairment losses of Ownership interests are recognized under financial expenses in the income statement. Impairment of other assets is reversed only to the extent of changes in the assumptions and estimates underlying the impairment calculation. Impairment is only reversed to the extent that the asset’s new carrying amount does not exceed the carrying amount of the asset after amortization had the asset not been impaired
Significant accounting estimates Financial support arrangements GN Store Nord grants loans to dispensers and acquires ownership interests in dispensers. The agreements are typically comprehensive, complex and cover several aspects of the relationship between the parties. Management assesses the recognition and classification of income and expenses for each of these agreements, including whether the agreement has an embedded supply agreement or represent a discount on future sales. Management also assesses whether current economic conditions and changes in customers' payment behavior could indicate impairment of the outstanding balances. Ownership interest which are not measured at fair value are subject to an annual impairment test for indications of impairment. When there is an indication that assets may be impaired, the recoverable amount of the asset is determined
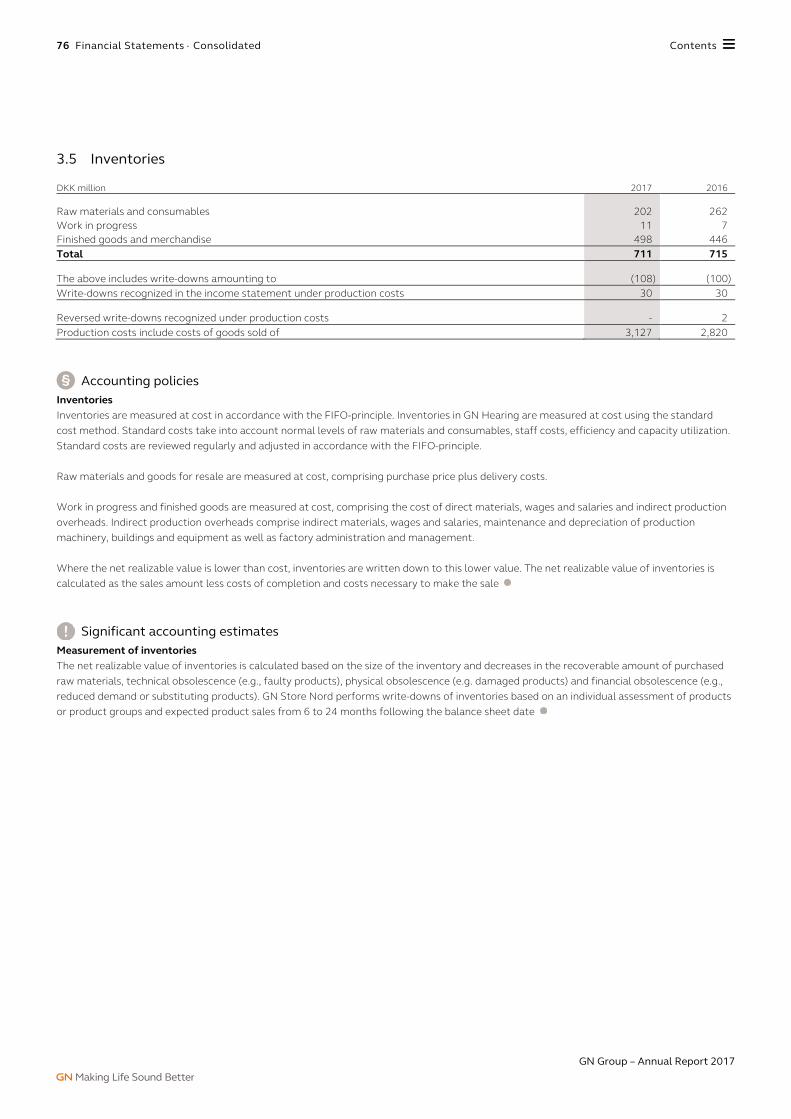
76 Financial Statements ⋅ Consolidated Contents
GN Group – Annual Report 2017
3.5 Inventories DKK million 2017 2016 Raw materials and consumables 202 262 Work in progress 11 7 Finished goods and merchandise 498 446 Total 711 715 The above includes write-downs amounting to (108) (100) Write-downs recognized in the income statement under production costs 30 30 Reversed write-downs recognized under production costs - 2 Production costs include costs of goods sold of 3,127 2,820
Accounting policies Inventories Inventories are measured at cost in accordance with the FIFO-principle. Inventories in GN Hearing are measured at cost using the standard cost method. Standard costs take into account normal levels of raw materials and consumables, staff costs, efficiency and capacity utilization. Standard costs are reviewed regularly and adjusted in accordance with the FIFO-principle. Raw materials and goods for resale are measured at cost, comprising purchase price plus delivery costs. Work in progress and finished goods are measured at cost, comprising the cost of direct materials, wages and salaries and indirect production overheads. Indirect production overheads comprise indirect materials, wages and salaries, maintenance and depreciation of production machinery, buildings and equipment as well as factory administration and management. Where the net realizable value is lower than cost, inventories are written down to this lower value. The net realizable value of inventories is calculated as the sales amount less costs of completion and costs necessary to make the sale
Significant accounting estimates Measurement of inventories The net realizable value of inventories is calculated based on the size of the inventory and decreases in the recoverable amount of purchased raw materials, technical obsolescence (e.g., faulty products), physical obsolescence (e.g. damaged products) and financial obsolescence (e.g., reduced demand or substituting products). GN Store Nord performs write-downs of inventories based on an individual assessment of products or product groups and expected product sales from 6 to 24 months following the balance sheet date

77 Financial Statements ⋅ Consolidated Contents
GN Group – Annual Report 2017
3.6 Trade receivables DKK million 2017 2016 Trade receivables 2,111 2,183 Total 2,111 2,183 Trade receivables have the following maturities: Nor due, nor impaired 1,749 1,751 Overdue, but not impaired: Due 30 days or less 175 136 Due more than 30 days but less than 90 days 90 124 Due more than 90 days 97 172 Total 2,111 2,183 Write-downs, which are included in total trade receivables, have developed as follows: Write-downs at January 1 (97) (112) Write-downs made during the year (38) (60) Realized during the year 10 30 Reversed write-downs 3 32 Transferred to assets held for sale - 14 Foreign exchange adjustments 4 (1) Write-downs at December 31 (118) (97) Total write-downs of DKK 118 million are included in trade receivables at the end of 2017 (2016: DKK 97 million). In 2017 no material write-downs have been recognized regarding individual receivables (2016: no material write-downs have been recognized regarding individual receivables). GN Store Nord's assessment of credit risk associated with individual receivables depends primarily on aging, change in customer payment behavior, current economic conditions etc. as described in significant accounting estimates. Based on past experience, GN Store Nord believes that no write-down is necessary in respect of trade receivables not past due. No security has been pledged to GN Store Nord for trade receivables.
Accounting policies Trade receivables are measured at amortized cost less write-down for foreseen bad debt losses. Write-down for bad debt losses is based on an individual assessment of each receivable and at portfolio level
Significant accounting estimates Measurement of trade receivables If a customer’s financial condition deteriorates, further write-downs may be required in future periods. In assessing the adequacy of write-downs for bad debt losses, Management specifically analyzes receivables, including doubtful debts, concentrations of credit risk, credit ratings, current economic conditions and changes in customers’ payment behavior
3.7 Other payables DKK million 2017 2016 Employee costs payable 490 427 Bonuses and discounts to customers 447 377 Other 452 546 Total 1,389 1,350

78 Financial Statements ⋅ Consolidated Contents
GN Group – Annual Report 2017
3.8 Provisions
DKK million Warranty provisions
Other provisions Total
Provisions at January 1 132 405 537 Additions 117 255 372 Consumed (89) (230) (319) Reversed (2) (31) (33) Foreign exchange adjustments (10) (32) (42) Provisions at December 31, 2017 148 367 515 Which is presented in the consolidated balance sheet as: Non-current liabilities 53 130 183 Current liabilities 95 237 332 Provisions at December 31, 2017 148 367 515 Warranty provisions concern products sold. The warranty provision covers any defects in design, materials and workmanship for a period of 1-4 years from delivery and completion. Other provisions primarily include earn-outs of DKK 123 million (2016: DKK 178 million). The remaining items in other provisions primarily include obligations to take back hearing aids and headsets sold, obligations regarding onerous contracts and property leases and provisions for legal disputes.
Accounting policies Provisions Warranty provisions are recognized as the underlying goods and services are sold based on warranty costs incurred in previous years and expectations of future costs. Other provisions primarily comprise onerous contracts and return obligations related to sold products. Provisions are recognized when, as a result of events before or at the balance sheet date, the Group has a legal or a constructive obligation and it is probable that there may be an outflow of resources embodying economic benefits to settle the obligation. On measurement of provisions, the costs required to settle the liability are discounted if the effect is material to the measurement of the liability. A provision for onerous contracts is recognized when the expected benefits to be derived by the Group from a contract are lower than the unavoidable costs of meeting its obligations under the contract (onerous contracts). A provision for onerous contracts is recognized e.g. when the Company has entered a binding legal agreement for the purchase of components from suppliers that exceeds the benefits from the expected future use of the components and the Company can only sell the components at a loss
Significant accounting estimates Provisions Warranty provisions are recognized based on historical and future warranty costs related to the Group’s products. Future warranty costs may differ from past practices and the level of costs. The amount recognized as a provision is Management’s best estimate of the expenses required to settle the obligation. In accordance with GN Store Nord’s business policy, some products are supplied with a right of return. Provisions for future returns of goods are recognized based on historical product returns data. The probability of future returns may differ from past practices. At December 31, 2017, the carrying amount of provisions with respect to obligations to take back goods was DKK 125 million (2016: DKK 115 million). Agreement has been made with a number of the suppliers that the suppliers purchase components for the production of hearing instruments, headsets and audiologic diagnostics equipment based on sales estimates prepared by GN Store Nord. To the extent that GN Store Nord's actual purchases from suppliers are lower than sales estimates, GN Store Nord will be under an obligation to purchase any remaining components from the suppliers. Management assesses sales estimates on an ongoing basis, and to the extent that component inventories at suppliers are not expected to be used, GN Store Nord recognizes a provision for onerous purchase contracts

79 Financial Statements ⋅ Consolidated Contents
GN Group – Annual Report 2017
4.1 Outstanding shares and treasury shares
Out- standing
shares (thou-sands)
Treasury shares (thou-sands)
Total number
of shares (thou-sands)
Nominal value
of out- standing
shares (DKK thou-
sands)
Nominal value of treasury
shares (DKK thou-
sands)
Nominal value of
total shares
(DKK thou-
sands)
Treasury shares
as a percent-
age of share
capital Number/value of shares at January 1, 2017 143,471 11,317 154,788 573,884 45,269 619,153 7.3% Purchase of ownership interest in subsidiaries 681 (681) - 2,724 (2,724) - Shares acquired/sold by GN Store Nord A/S (7,709) 7,709 - (30,836) 30,836 - Shares cancelled - (9,104) (9,104) - (36,416) (36,416) Number/value of shares at December 31, 2017 136,443 9,241 145,684 545,772 36,965 582,737 6.3% The treasury shares had a market value of DKK 1,853 million at December 31, 2017 (2016: DKK 1,656 million). The total cost of acquired treasury shares in 2017 was DKK 1,372 million (2016: DKK 1,272 million). Treasury shares have been acquired under the share buyback program and in order to hedge the warrant based long-term incentive program as well as obligation under the warrant units issued during the year. Shares thousand 2017 2016 Weighted average number of outstanding shares 138,980 147,967 Dilutive effect of share based payment with positive intrinsic value – average for the period 988 394 Diluted weighted average number of shares 139,968 148,361 DKK million Profit (loss) for the year used for the calculation of earnings per share 1,183 1,033 Dilutive effect of profit (loss) for the year - - Profit (loss) for the year used for the calculation of diluted earnings per share 1,183 1,033
Accounting policies Earnings per Share and Diluted Earnings per Share Earnings per share (EPS) is calculated by dividing the profit for the year after tax by the weighted average number of shares outstanding in the year. Diluted earnings per share is calculated by increasing the weighted average number of shares outstanding by the number of additional ordinary shares that would be outstanding if potentially dilutive shares were issued. The dilutive effect of outstanding share based payment is calculated using the Treasury Stock method. Equity Dividends The expected dividend payment for the year is disclosed as a separate item in equity. Proposed dividends are recognized as a liability at the date they are adopted by the Annual General Meeting (declaration date). Additional paid-in capital Additional paid-in capital includes amounts exceeding the nominal share capital paid in by shareholders in relation to capital increases and gains/losses on the sale of treasury shares. This reserve forms part of GN’s distributable reserves. Hedging reserve The hedging reserve includes the accumulated net change in the fair value of hedging transactions qualifying for hedge accounting.
Section 4 Capital structure and financing items

80 Financial Statements ⋅ Consolidated Contents
GN Group – Annual Report 2017
4.1 Outstanding shares and treasury shares (Continued) Treasury Shares Treasury shares are recognized at cost. Gains and losses on disposal of own shares are calculated as the difference between the purchase price measured in accordance with the FIFO-principle and the selling price. Gains or losses are recognized directly in retained earnings. Dividends received from treasury shares are recognized directly in retained earnings. Capital reductions from the cancellation of treasury shares are deducted from the share capital at an amount corresponding to the nominal value of the shares. Foreign exchange adjustments The translation reserve in the consolidated financial statements comprises foreign exchange differences arising on translation of financial statements of foreign subsidiaries from their functional currencies into the presentation currency used by GN Store Nord (DKK) and foreign exchange adjustments of balances considered to be part of the total net investment in foreign entities
4.2 Financial risks and financial instruments Foreign currency risk GN Store Nord has exposure towards foreign currencies in connection with commercial transactions. The overall objective of hedging GN Store Nord's currency exposure is to reduce the short-term impact of exchange rate fluctuations on earnings and cash flow, thereby increasing the predictability of the financial results. GN Store Nord hedges significant currency risk, which in 2017 has been future income (long positions) in the USD, GBP, CAD and JPY and future expenses in the CNY. Expected cash flows are continually assessed using budget and sales forecasts. GN Store Nord has not raised loans or placed surplus cash in foreign currency unless it has mitigated currency exposure. GN Store Nord has balance sheet items denominated in USD, including most of its goodwill. Those balance sheet items can result in foreign exchange rate gains and losses from the revaluation. At year-end a hypothetical increase of 5% in the USD/DKK and CNY/DKK exchange rates would affect the Income Statement and Other Comprehensive Income as outlined in the table below: DKK million 2017 2016 Income statement (52) (29) Other Comprehensive Income (41) (44) The sensitivity analysis comprises cash and cash equivalents, current receivables, trade payables, current and non-current loans, current intercompany balances and derivative exchange rate instruments as of December 31, 2017. The effects of a change in foreign exchange rates related to these items would be included in financial items in the income statement. A change in the derivative exchange rate instruments used for hedging would be included in Other Comprehensive Income if Hedge Accounting is applied in accordance with IAS39, otherwise in Financial income. Interest rate risk GN Store Nord has swapped a large part of the variable interest rate exposure on bank loans into fixed rates through interest rate swaps. The fair value of the interest rate swaps are determined using forward interest rates and can be categorized as level 2 (observable inputs) in the fair value hierarchy. Currently, 50% of the drawn debt as of December 31, 2017 is fixed with a majority of the loans having more than one year to maturity. The market value of the interest rate swaps will increase with DKK 42 million for every 100 bps parallel increase in the underlying fixed interest rates. An increase of variable interest rates on the bank loans of 1 percentage point increase before considering the mitigating effect of the interest rate swaps would result in a net increase in the annual interest expenses of DKK 17.2 million. The interest rate on the issued bonds is fixed with a zero coupon. As the bonds are subsequently measured at amortized cost the value of the bonds and the effective interest rate does not change after initial recognition despite changes in the market interest rate. Funding, liquidity and capital structure In May 2017 GN Store Nord issued EUR 225 million convertible bonds consisting of Bond-with-Warrant Units. The Bond-with-Warrant Units consists of senior unsecured zero coupon bonds due 2022 with detachable unsecured warrants expiring 2022. The bonds have a denomination of EUR 100,000 per Bond.

81 Financial Statements ⋅ Consolidated Contents
GN Group – Annual Report 2017
4.2 Financial risks and financial instruments (Continued) Initially 6,215,744 treasury shares are underlying the warrant units and those treasury shares will be kept to hedge the future obligations of GN Store Nord under the warrant units. The bonds carry no interest and will be redeemed at par at maturity, unless redeemed or purchased and cancelled earlier under their terms. Any Unit holder may, at any time until 2022, exercise a warrant unit and require GN to redeem the corresponding bond at its principal amount. GN does not expect to issue any new shares upon exercise of warrant units, but will deliver up to 6,215,744 shares currently held in treasury, based on the initial strike price (DKK 269.4609), which is subject to adjustment from time to time upon certain customary events (anti-dilution clauses). The proceeds from the sale of these treasury shares at the initial strike price will amount to DKK 1,675 million corresponding to the nominal amount of the issued bonds of EUR 225 million at the exchange rate at the time of pricing of DKK/EUR 7.444. The proceeds from the issued bond with warrant units has been used for general corporate purposes including refinancing of existing debt facilities, repurchase of shares and for financing of growth opportunities. At December 31, 2017, GN Store Nord had an equity ratio of 40.8% (2016: 43.8%) and net interest-bearing debt of DKK 3,035 million (2016: DKK 3,404 million). GN Store Nord's long term capital structure policy (net debt up to a maximum of two times EBITDA) remains unchanged. As of December 31, 2017 GN Store Nord had undrawn borrowing facilities of DKK 1,776 million (2016: DKK 1,576 million). GN Store Nord aims to pay out a dividend corresponding to 15-25% of the annual net results and will initiate share buyback programs when deemed appropriate subject to the authorization by the shareholders at the Annual General Meeting. Retained earnings, which are available for distribution from the GN Store Nord Parent company amount to DKK 2,617 million (2016 DKK 4,059 million) Financial credit risk Surplus cash positions in GN Store Nord’s subsidiaries are re-circulated back to the parent company as soon as possible, and cash is mainly held in current accounts or as short-term money market deposits. Cash positions are primarily held with banks through which GN Store Nord conducts its day-to-day banking business and which have a satisfactory rating with Moody’s and Standard & Poor’s. GN Store Nord has a policy of never having an exposure to a single financial counterparty of more than 2.5% of that party’s capital and reserves. GN Store Nord had cash and cash equivalents of DKK 526 million at December 31, 2017 (2016: DKK 178 million). GN Store Nord has established policies for credit risk management related to customers including the use of credit rating agencies. Assessment of credit risks related to customers is further described in note 3.6 Trade receivables and note 3.4 Other non-current assets. Specification of net interest-bearing debt DKK million 2017 2016 Cash and cash equivalents 526 178 Bank loans and issued bonds, non-current liabilities (3,508) (3,527) Bank loans, current liabilities (53) (55) Total (3,035) (3,404)

82 Financial Statements ⋅ Consolidated Contents
GN Group – Annual Report 2017
4.2 Financial risks and financial instruments (Continued) Contractual maturity analysis for financial liabilities
DKK million Less than one
year Between one
and five years More than five
years Total 2017 Issued bonds - 1,577 - 1,577 Long-term bank loans 74 1,857 - 1,931 Other long-term payables - 240 - 240 Short-term bank loans 53 - - 53 Trade payables 605 - - 605 Total non-derivative financial liabilities 732 3,674 - 4,406 Derivative financial liabilities - 25 - 25 Total financial liabilities 732 3,699 - 4,431 2016 Long-term bank loans 74 3,453 - 3,527 Other long-term payables - 247 - 247 Short-term bank loans 55 - - 55 Trade payables 642 - - 642 Total non-derivative financial liabilities 771 3,700 - 4,471 Derivative financial liabilities 42 38 - 80 Total financial liabilities 813 3,738 - 4,551 The maturity analysis is based on non-discounted cash flows. Categories of financial assets and liabilities The financial assets and liabilities presented in the balance sheet can be grouped in the following categories: DKK million 2017 2016 Derivative financial instruments included in Other receivables 49 - Derivative financial instruments included in ownership interests, cf. note 3.4 - 33 Financial assets held for trading 49 33 Ownership interests and RAP, SIP, DCP, cf. note 3.4 361 405 Financial assets available-for-sale 361 405 Trade receivables 2,111 2,183 Other receivables 257 231 Other receivables, non-current 614 637 Loans and receivables 2,982 3,051 Issued bonds 1,577 - Bank loans, non-current 1,931 3,527 Other long-term payables 240 247 Bank loans 53 55 Trade payables 605 642 Financial liabilities measured at amortized cost 4,406 4,471 Derivative financial instruments included in Other payables 25 80 Financial liabilities measured at fair value 25 80 The fair value of issued bonds (zero coupon) amounted to DKK 1,603 million at December 31, 2017. For other financial assets and liabilities, the fair value is approximately equal to the carrying amount. GN Store Nord's bank loans carry floating interest rates and are primarily funded based on short term EURIBOR rates.

83 Financial Statements ⋅ Consolidated Contents
GN Group – Annual Report 2017
4.2 Financial risks and financial instruments (Continued) Derivative financial instruments Exchange rate instruments and interest rate swaps 2017 2016
DKK million Contract
amount, net Fair value, as-
sets Fair value, lia-
bilities Contract
amount, net Fair value, as-
sets Fair value, liabil-
ities USD 920 38 - 1,017 - 54 JPY 121 8 - 170 5 1 GBP 109 1 - 234 12 - CAD 75 1 - 101 - 4 CNY 98 1 - 136 - - EUR* 1,741 - 25 2,409 - 38 Total 3,064 49 25 4,067 17 97 * Interest rate swaps denominated in EUR.
All exchange rate instruments mature within 12 months from the balance sheet date. The interest rate swaps mature between 2 and 3 years from the balance sheet date. Fair value adjustments of cash flow hedges DKK million 2017 2016 Fair value adjustment for the year recognized in Other comprehensive income 142 (39) Reclassified from equity to revenue during the year (32) (5) Reclassified from equity to production costs during the year - 3 Reclassified from equity to selling and distribution costs during the year - (1) Adjustment of cash flow hedges in Other comprehensive income 110 (42) Fair value adjustment of cash flow hedges recognized in financial items (12) - The gains and losses on cash flow hedges recognized in Other comprehensive income as of December 31, 2017 will be recognized in the income statement in the period during which the hedged forecasted transaction affects the income statement. In 2017 net gains on derivative financial instruments related to ownership interests of DKK 0 million were recognized in financial items (2016: DKK 87 million). At the end of 2017 the fair value of the derivative financial instruments related to ownership interests were estimated to DKK 0 million (2016: DKK 33 million). Fair value hierarchy The fair value of the exchange rate instruments and interest rate swaps are determined using quoted forward exchange rates and forward interest rates, respectively at the balance sheet date and can be categorized as level 2 (observable inputs) in the fair value hierarchy. When measuring the fair value of the derivative financial instruments related to ownership interests, as described below, this is determined by calculating the difference between the fair value of the dispensers and the agreed purchase price of the dispensers. The fair value of the dispensers are determined using cash flow projections from financial forecasts covering a five year period. The key inputs used are sales growth in units, average selling prices and expected growth in the terminal period. The fair value is sensitive to the assumed key inputs and can be categorized as level 3 (unobservable inputs) in the fair value hierarchy.
Accounting policies Derivative Financial Instruments Derivative financial instruments are initially and subsequently recognized in the balance sheet at fair value, except for derivative financial instruments related to ownership interests in dispensers of GN Hearing products. Such instruments are only measured at fair value when exercise is considered highly probable and sufficient information for a fair value measurement is available. In other instances, the cost of the derivative financial instruments related to unquoted ownership interests is considered the best estimate of the fair value. Positive and negative fair values of derivative financial instruments are recognized as other receivables and payables, respectively, and set-off of positive and negative values is only made when GN Store Nord has the right and the intention to settle several financial instruments net. Fair values of derivative financial instruments are computed on the basis of market data and generally accepted valuation methods.

84 Financial Statements ⋅ Consolidated Contents
GN Group – Annual Report 2017
4.2 Financial risks and financial instruments (Continued) Changes in the fair value of derivative financial instruments designated as and qualifying for recognition as a hedge of the fair value of a recognized asset or liability are recognized in the income statement together with changes in the value of the hedged asset or liability as far as the hedged portion is concerned. Changes in the portion of the fair value of derivative financial instruments designated as and qualifying as a cash flow hedge that is an effective hedge of changes in the value of the hedged item are recognized in other comprehensive income. If the hedged transaction results in gains or losses, amounts previously recognized in other comprehensive income are transferred from equity to the same item as the hedged item. For derivative financial instruments that do not qualify for hedge accounting, changes in fair value are recognized in the income statement under financial items. Financial Liabilities Amounts owed to credit institutions, finance lessors and banks are recognized at the date of borrowing at fair value of the proceeds received less transaction costs paid. In subsequent periods, the financial liabilities are measured at amortized cost, corresponding to the capitalized value using the effective interest rate. Accordingly, the difference between the proceeds and the nominal value is recognized in the income statement over the term of the loan. Issued bond with warrant units are initially recognized at fair value less related transaction costs. The fair value of the bonds is estimated by calculating the present value of all contractual future cash flows using an interest rate for a bond with similar credit risk and duration as the issued bonds, but without the attached warrants. The difference between the fair value and the proceeds is considered to be the value of the warrants and is recognized in equity. The equity component is not re-measured subsequently. After initial recognition the bonds are measured at amortized cost using the effective interest method. In case the bonds are redeemed before maturity, the difference between the carrying amount at amortized cost and the principal amount will be recognized as a loss in financial expenses. Other liabilities, comprising trade payables, amounts owed to group enterprises and associates as well as other payables, are measured at amortized cost
4.3 Liabilities from financing activities
DKK million Bank loans Issued bonds Other non-cur-
rent liabilities Bank loans,
current Total Liabilities at January 1 3,527 - 325 55 3,907 Cash flows (1,599) 1,560 (17) (2) (58) Foreign exchange adjustments 3 4 7 - 14 Non-cash interest expenses - 13 - - 13 Liabilities at December 31, 2017 1,931 1,577 315 53 3,876 The total cash proceeds from the issue of bonds of DKK 1,636 million include DKK 76 million recognized in equity as fair value of warrant units issued (proceeds).

85 Financial Statements ⋅ Consolidated Contents
GN Group – Annual Report 2017
4.4 Financial income and expenses DKK million 2017 2016 Financial Income: Interest income* 17 26 Financial income, other 37 29 Fair value adjustments of derivative financial instruments - 87 Foreign exchange gain 105 42 Total 159 184 Financial expenses: Interest expenses* (59) (59) Financial expenses, other (71) (81) Fair value adjustments of derivative financial instruments and impairments (39) (75) Foreign exchange loss (50) (21) Total (219) (236)
*Interest income and expenses from financial assets and liabilities at amortized cost. GN Store Nord has not included borrowing costs in the cost price of non-current assets as these are not financed with debt. Fair value adjustments of derivative financial instruments and impairments include an impairment loss of DKK 27 million related to Loans to dispensers of GN Hearing products (2016: DKK 75 million) and fair value adjustments at DKK 12 million related to interest rate swap transferred from other comprehensive income.
Accounting policies Financial Income and Expenses Financial income and expenses comprise interest income and expense, costs of permanent loan facilities, gains and losses on securities, receivables, payables and transactions denominated in foreign currencies, credit card fees, amortization and impairment of financial assets and liabilities, etc. Also included are realized and unrealized gains and losses on derivative financial instruments that are not designated as hedges. Borrowing costs that are directly attributable to the construction or production of a qualifying asset form part of the cost of that asset. Other borrowing costs are recognized as an expense. A qualifying asset is an asset that necessarily takes a substantial period of time to get ready for its intended use

86 Financial Statements ⋅ Consolidated Contents
GN Group – Annual Report 2017
5.1 Acquisition and divestment of companies and operations Acquisitions During 2017, GN Hearing acquired a number of minor hearing instrument chains and distributors, primarily in the US. These acquisitions all strengthen GN Hearing's sales and distribution channels and the goodwill related to the acquisitions are mainly attributable to this. In July 2016, GN Hearing acquired 100% of the US based company Audigy, a leading provider of business and performance management solutions to independent hearing care practices, and in October 2016, GN Audio acquired the US based company VXi Corporation, a leading innovative US based manufacturer of professional headset solutions. Fair value at acquisition date DKK million 2017 Audigy VXi Other 2016 Identifiable assets acquired, liabilities assumed and consideration transferred Non-current assets 9 22 10 7 39 Current assets 6 47 40 1 88 Non-current liabilities (11) (14) (12) (18) (44) Current liabilities (5) (57) (99) - (156) Fair value of identified net assets (1) (2) (61) (10) (73) Goodwill 64 614 124 50 788 Other intangible assets 149 146 120 208 474 Consideration transferred 212 758 183 248 1,189 Fair value of assets transferred (116) - - (175) (175) Payable consideration (13) Contingent consideration - (158) - (1) (159) Cash consideration paid 83 600 183 72 855 Goodwill relating to the above transactions is allocated to the cash-generating units GN Hearing with DKK 64 million (2016: DKK 664 million) and GN Audio DKK 0 million (2016: DKK 124 million). In 2017, GN Hearing paid out DKK 11 million (2016: DKK 25 million) in contingent considerations related to prior years’ acquisitions. The payments were mainly related to the acquisition of Audigy Group. An adjustment of DKK 21 million has been recognized as financial income in the income statement, mainly related to Audigy acquisition. DKK million 2017 2016 The share of revenue and profit (loss) for the year from the acquisition date can be specified as follows: Revenue 105 310 EBIT 5 12 Profit (loss) for the year 3 6 Acquired operations if they had been owned throughout the year: Revenue 129 630 EBIT 6 38 Profit (loss) for the year 4 27
Section 5 Other disclosures

87 Financial Statements ⋅ Consolidated Contents
GN Group – Annual Report 2017
5.1 Acquisition and divestment of companies and operations (Continued) Divestments etc. In 2017 GN Hearing divested a number of minor hearing instrument distributors primarily in the US. Other adjustments relate to a legal dispute. In 2017 this relates to the Plantronics legal case. DKK million 2017 2016 Non-current assets (3) (3) Current assets - (2) Disposed net assets (3) (5) Fair value of assets received 3 2 Gain (loss) on divestment of operations - (3) Other adjustments (38) (26) Gain (loss) on divestment of operations etc. (38) (29)
Accounting policies Business Combinations Enterprises acquired or formed during the year are recognized in the consolidated financial statements from the date of acquisition or formation. The acquisition date is the date when the parent company effectively obtains control of the acquired enterprise. Enterprises disposed of are recognized in the consolidated income statement until the disposal date. The comparative figures are not restated for acquisitions. For acquisitions of new enterprises in which the parent company is able to exercise control over the acquired enterprise, the purchase method is used. The acquired enterprises’ identifiable assets, liabilities and contingent liabilities are measured at fair value at the acquisition date. Identifiable intangible assets are recognized if they are separable or arise from a contractual right. Deferred tax on revaluations is recognized. Any excess of the cost over the fair value of the identifiable assets, liabilities and contingent liabilities acquired is recognized as goodwill under intangible assets. Goodwill is not amortized but is tested at least annually for impairment. The first impairment test is performed within the end of the acquisition year. Upon acquisition, goodwill is allocated to the cash-generating units, which subsequently form the basis for the impairment test. Goodwill and fair value adjustments in connection with the acquisition of a foreign entity with another functional currency than the presentation currency used by GN Store Nord are treated as assets and liabilities belonging to the foreign entity and translated into the foreign entity’s functional currency at the exchange rate at the transaction date. The cost of a business combination comprises the fair value of the consideration agreed upon. When a business combination agreement provides for an adjustment to the cost of the combination contingent on future events, the amount of that adjustment is included in the cost of the combination if the adjustment is probable and can be measured in a reliable manner. Subsequent changes to contingent considerations are recognized in the income statement. If uncertainties regarding measurement of identifiable assets, liabilities and contingent liabilities exist at the acquisition date, initial recognition will take place on the basis of preliminary fair values. If identifiable assets, liabilities and contingent liabilities are subsequently determined to have different fair value at the acquisition date than first assumed, goodwill is adjusted up until twelve months after the acquisition. The effect of the adjustments is recognized in the opening balance of equity and the comparative figures are restated accordingly When acquiring a controlling interest in steps, GN Store Nord assesses the fair value of the acquired net assets at the time control is obtained. At such time, interests acquired previously are also adjusted to fair value. The difference between the fair value and the carrying amount is recognized in the income statement. Acquisition of additional equity interest after a business combination is not accounted for using the acquisition method, but rather as equity transactions. Disposals of equity interest while retaining control are also accounted for as equity transactions. Transactions resulting in a loss of control result in a gain or loss being recognized in the income statement. When acquiring less than 100% of the shares in a company, GN Store Nord recognizes the goodwill on a transaction-by-transaction basis or as a proportion of goodwill in accordance with GN Store Nord’s ownership interest

88 Financial Statements ⋅ Consolidated Contents
GN Group – Annual Report 2017
5.2 Discontinued operations On September 25, 2016 GN Hearing and Natus Medical Incorporated (hereafter “Natus”) entered into an agreement whereby ownership of GN Otometrics is transferred from GN Hearing to Natus. The divestment will further strengthen GN Hearing’s focus and strategic direction as a dedicated hearing instrument company, with GN Hearing being in a unique position to continue to deliver industry leading growth and profitability. The total consideration payable by Natus was USD 145 million which has been settled in cash on a debt and cash free basis. Closing of the transaction took place on January 3, 2017. GN Otometrics develops, manufactures and markets computer-based audiological, otoneurologic, vestibular instrumentation and sound rooms under the Madsen, Aurical, Hortmann and ICS brand names. GN Otometrics was part of the reportable segment GN Hearing. Since September 30, 2016 GN Otometrics has been classified as a disposal group held for sale and as discontinued operations. As of January 1, 2017 GN Otometrics is no longer included in the consolidated financial statements of the GN Group. The carrying amounts of assets and liabilities disposed of and the gain on divestment were: DKK million 2017 Intangible assets (494) Property, plant & equipment (22) Receivables (665) Inventories (142) Cash and cash equivalents (30) Payables 624 Deferred tax 62 Interest-bearing liabilities 2 Disposed net assets (665) Directly attributable transaction related costs (57) Cash consideration received 1,065 Paid capital increase in divested associated company of GN Otometrics (288) Gain on divestment of GN Otometrics before tax and reclassifications from equity 55 Reclassification of reserve for foreign exchange adjustments 15 Income tax expense on gain from the sale of GN Otometrics (9) Gain on divestment of GN Otometrics 61 Profit (loss) for the year from discontinued operations 61 The net cash flow effect of the divestment of GN Otometrics can be specified as follows: DKK million 2017 Cash consideration received 1,065 Paid capital increase in divested associated company of GN Otometrics (288) Received payment of receivables from GN Otometrics associated company 61 Directly attributable transaction related costs (57) Cash and cash equivalents disposed of (29) Net cash flow from divestment of GN Otometrics 752 As part of the divestment of GN Otometrics a capital increase of DKK 288 million has been paid to GN Otometrics' associated company Audiology Systems Inc. Earnings per share (EPS) from discontinued operations 2017 2016 Earnings per share (EPS) from discontinued operations 0.44 (0.36) Earnings per share from discontinued operations, fully diluted (EPS diluted) 0.43 (0.36) DKK million 2016 GN Otometrics Revenue 686 Expenses (749) Profit/(loss) before tax from discontinued operations (63) Tax 10 Profit/(loss) for the period from discontinued operations (53)

89 Financial Statements ⋅ Consolidated Contents
GN Group – Annual Report 2017
5.2 Discontinued operations (Continued)
Accounting policies Discontinued operations Assets and liabilities classified as held for sale are presented separately as items in the balance sheet. A disposal group qualifies as discontinued operation if it is a component of an entity that either has been disposed of, or is classified as held for sale, and:
• Represents a separate major line of business or geographical area of operations • Is part of a single coordinated plan to dispose of a separate major line of business or geographical area of operations; or • Is a subsidiary acquired exclusively with a view to resale
Discontinued operations are excluded from the results of continuing operations and are presented as a single amount as profit or loss after tax from discontinued operations in the income statement.
5.3 Remuneration of the Board of Directors and Executive Management Remuneration to Executive Management and other key management personnel can be specified as follows:
2017 2016
DKK million Fixed salary Bonus
Share-based
payments Total Fixed salary Bonus
Share-based
payments Total Anders Hedegaard, CEO of GN Hearing (6.4) (4.0) (2.3) (12.7) (6.2) (5.1) (2.1) (13.4) René Svendsen-Tune, CEO of GN Audio (6.0) (5.4) (2.3) (13.7) (5.7) (3.3) (1.4) (10.4) Marcus Desimoni, CFO of GN Store Nord from Feb-ruary 15, 2016 (4.6) (2.8) (1.8) (9.2) (5.4) (2.6) (1.0) (9.0) Anders Boyer, CFO of GN Store Nord until February 14, 2016 - - - - (0.6) (0.5) - (1.1) Total (17.0) (12.2) (6.4) (35.6) (17.9) (11.5) (4.5) (33.9) Other key management personnel (2.2) (0.8) (0.2) (3.2) (3.3) (0.4) (0.1) (3.8) Total (2.2) (0.8) (0.2) (3.2) (3.3) (0.4) (0.1) (3.8) Incentive plans The Group's warrant-based long-term incentive program is specified and described in note 5.4 Incentive plans. Executive Management and Board of Directors Remuneration The total remuneration of the Executive Management is based on the “General Guidelines for Incentive Pay to Management”, as adopted at GN´s Annual General Meeting. Total salary (Fixed salary & Bonus) of the Executive Management, excluding a sign-on bonus of DKK 1.9 to the CFO of GN Store Nord in 2016, increased by 6% or DKK 1.7 million from 2016 to 2017. The remuneration of the Executive Management is based on: A fixed base salary. Participation in GN Store Nord’s warrant-based long-term incentive program. A yearly bonus plan with a target bonus of 50% of the base salary with a potential to underperform or outperform the target leading to an effective potential bonus range between 0 - 100% of the base salary. The Executive Management´s bonus is based on three parameters in light of the Group's focus areas: • Anders Hedegaard’s bonus is subject to the performance of GN Hearing’s EBITA, GN Hearing’s revenue and individual performance targets. • René Svendsen-Tune’s bonus is subject to the performance of GN Audio’s EBITA, GN Audio’s revenue and individual performance targets. • Marcus Desimoni’s bonus is subject to the performance of GN Store Nord’s EBITA, GN Store Nord’s revenue and individual performance
targets.

90 Financial Statements ⋅ Consolidated Contents
GN Group – Annual Report 2017
5.3 Remuneration of the Board of Directors and Executive Management (Continued) The Group does not make pension contributions for members of the Executive Management. Executive Management has severance agreements and change-of-control agreements on market terms. Members of the Board of Directors receive a fixed remuneration as approved by the shareholders at the Annual General Meeting on March 14, 2017. The fixed remuneration is based on GN Store Nord´s corporate governance structure in which an audit committee, a strategy committee, a remuneration committee and a nomination committee have been established. Further, the appointed board members of GN Store Nord also serve on the Board of Directors of GN Hearing A/S and GN Audio A/S. GN Store Nord A/S GN Hearing A/S Chairman 750 Chairman 250 Deputy Chairman 500 Deputy Chairman 175 Other Board members 250 Other Board members 100 Remuneration Committee Chairman 300 Remuneration Committee, other members 150 Audit Committee Chairman 300 Audit Committee, other members 150 Strategy Commitee Chairman 300 GN Audio A/S Strategy Commitee other members 150 Chairman 250 Nomination Commitee Chairman 150 Deputy Chairman 175 Nomination Commitee other members 75 Other Board members 100 DKK thousand 2017 2016 Per Wold-Olsen (Chairman) 1,850 1,850 William E. Hoover, Jr. (Deputy chairman) 1,225 1,225 Wolfgang Reim 900 900 Carsten Krogsgaard Thomsen 750 750 Helene Barnekow 600 600 Ronica Wang 600 600 Leo Larsen 250 250 Morten Andersen 250 250 Nikolai Bisgaard 250 250 Total Board of Directors remuneration 6,675 6,675 In addition to the remuneration, members of the Board of Directors who are not Danish residents are entitled to a fixed travel allowance in connection with participation in board meetings in Denmark. For European-based board members the allowance amounts to DKK 22,000 per meeting and for Non-European based board members the allowance amounts to DKK 45,000 per meeting. In 2016, a company owned by a member of the Board of Directors received a fee of DKK 4.7 million for consultancy work related to a specific project. The project was finalized in 2016, and the company has not been contracted for any projects in 2017.

91 Financial Statements ⋅ Consolidated Contents
GN Group – Annual Report 2017
5.4 Incentive plans Warrants programs GN Store Nord has a warrant-based long-term incentive program whereby the Executive Management and other senior employees are granted warrants linked to shares in GN Hearing or GN Audio. For members of Executive Management the grant size can vary between 50-100% of their base salary. Warrants granted will vest the day after the release of GN Store Nord's annual report in the third year after the grant. Vested warrants may be exercised during a four-week period opening each quarter of the third, fourth and fifth year after allocation. The quarterly four-week window will open following the release of an external Valuation Report concerning the value of the shares of GN Hearing and GN Audio. Warrants vest when a set of overperformance criteria are met: The share value of GN Store Nord has increased and the share value of GN Hearing and GN Audio has outperformed a peer group index of competitors and industry indices during the same time period, as defined by the Board of Directors of GN Hearing and GN Audio, respectively. Warrants are granted at no consideration. The exercise price for the warrants is based on the average share price for GN Store Nord in the five days following the release of the annual report in the year in which the relevant warrants are allocated. Warrants program, GN Hearing
Executive
Management Other
employees Total
Average exercise
price Outstanding warrants at January 1, 2016 929 12,604 13,533 21,901 Warrants granted during the year 1,276 4,908 6,184 26,945 Warrants exercised during the year - (2,875) (2,875) 16,045 Warrants forfeited during the year/corrections - (1,892) (1,892) 25,569 Outstanding warrants at December 31, 2016 2,205 12,745 14,950 24,649 Warrants granted during the year 968 4,428 5,396 30,624 Warrants exercised during the year (118) (2,680) (2,798) 18,957 Warrants forfeited during the year/corrections (117) (2,238) (2,355) 26,452 Outstanding warrants at December 31, 2017 2,938 12,255 15,193 27,540 Grant date market value of warrants granted in 2017 4 18 22 Market value of outstanding warrants at December 31, 2017 20 95 115 Average share price at exercise: DKK 33,784 (2016: DKK 26,453) Outstanding warrants in GN Hearing by grant date are shown below.
Grant date
Executive Management
Other employees Total
% of GN Hearing
A/S
Number of exercisable
warrants Exercise
price Years to
expiry
Market value in
DKK million March 2012 - 69 69 0.0% 69 11,084 0.0 2 March 2013 - 742 742 0.1% 742 19,270 0.9 13 November 2013 - 65 65 0.0% 65 24,290 0.9 1 March 2014 - 505 505 0.1% 505 24,711 1.9 6 March 2015 694 2,836 3,530 0.6% - 26,729 2.9 23 August 2015 - 50 50 0.0% - 23,807 2.9 - November 2015 - 125 125 0.0% - 24,896 2.9 1 March 2016 1,276 3,600 4,876 0.8% - 26,936 3.9 36 August 2016 - 68 68 0.0% - 27,797 3.9 - November 2016 - 211 211 0.0% - 26,932 3.9 2 March 2017 968 3,837 4,805 0.8% - 30,451 4.9 31 May 2017 - 69 69 0.0% - 35,873 4.9 - August 2017 - 35 35 0.0% - 39,391 4.9 - December 2017 - 43 43 0.0% - 36,177 4.9 - Outstanding warrants at December 31, 2017 2,938 12,255 15,193 2.4% 1,381 115

92 Financial Statements ⋅ Consolidated Contents
GN Group – Annual Report 2017
5.4 Incentive plans (Continued) Warrants program, GN Audio
Executive
Management Other
employees Total
Average exercise
price Outstanding warrants at January 1, 2016 538 6,836 7,374 24,555 Warrants granted during the year 1,192 2,875 4,067 22,507 Warrants exercised during the year - (1,201) (1,201) 17,211 Warrants forfeited during the year/corrections - (533) (533) 25,596 Outstanding warrants at December 31, 2016 1,730 7,977 9,707 24,549 Warrants granted during the year 666 2,208 2,874 28,934 Warrants exercised during the year - (971) (971) 17,755 Warrants forfeited during the year/corrections - (2,378) (2,378) 24,728 Outstanding warrants at December 31, 2017 2,396 6,836 9,232 26,587 Grant date market value of warrants granted in 2017 3 11 14 Market value of outstanding warrants at December 31, 2017 26 73 99 Average share price at exercise: DKK 32,134 (2016: DKK 22,204) Outstanding warrants in GN Audio by grant date are shown below.
Grant date Executive
Management Other
employees Total
% of GN Audio
A/S
Number of exercisable
warrants Exercise
price Years to
expiry
Market value in
DKK million March 2013 - 98 98 0.0% 98 17,797 0.8 2 March 2015 538 1,902 2,440 0.7% - 30,600 2.8 18 March 2016 1,192 2,570 3,762 1.1% - 22,495 3.8 49 August 2016 - 58 58 0.0% - 23,308 3.8 1 March 2017 666 2,152 2,818 0.8% - 28,794 4.8 29 May 2017 - 9 9 0.0% - 36,781 4.8 - December 2017 - 47 47 0.0% - 35,824 4.8 - Outstanding warrants at December 31, 2017 2,396 6,836 9,232 2.6% 98 99

93 Financial Statements ⋅ Consolidated Contents
GN Group – Annual Report 2017
5.4 Incentive plans (Continued) Valuation model and assumptions The market value of the warrants has been calculated using the principles of the Black & Scholes option pricing model. The market value of the outstanding warrants at the balance sheet date is calculated on the basis of underlying market prices on the final business day of the year, whereas the market value of warrants granted during the year is based on the underlying market prices at the grant date. The following assumptions were applied for the calculation of the market value at the balance sheet date and at the grant date of warrants: Assumptions 2017 year end Grant date 2017 2016 year end Grant date 2016 GN Hearing GN Audio GN Hearing GN Audio GN Hearing GN Audio GN Hearing GN Audio 161 161 134 134 195 195 142 142 209 Share price GN Store Nord 200 200 198 198 146 146 137 85% 43% 85% 38% 84% 46% 84% 38% 87% Share of GN Store Nord market value 85% 45% 85% 45% 86% 40% 86% 30,451 28,794 26,936 22,495 35,873 36,781 27,797 23,308 39,391 Share price 36,256 36,219 36,177 35,824 28,471 24,674 26,932 20% 30% 22% 27% 21% 28% 22% 29% 21% Volatility 20% 31% 21% 30% 20% 30% 21% Dividend per share - - - - - - - - (0.10)% (0.10)% 0.00% 0.00% (0.10)% (0.10)% (0.40)% (0.40)% (0.20)% Risk-free interest rate 0.00% 0.00% (0.30)% (0.30)% 0.00% 0.00% (0.20)% 0.9 0.9 0.8 0.8 1.9 5.7 5.7 1.8 1.8 5.7 5.7 2.9 2.9 5.5 5.5 2.8 2.8 5.2 3,9 3.9 5.2 3.8 3.8 Expected term (years) 4.9 4.9 4.9 4.9 4.8 4.8 5.0 In the calculation of market value, the share of market value and volatility is estimated by external experts.
Accounting policies Incentive plans The Executive Management and a number of key employees are included in share-based payment plans (equity-settled plans). For equity-settled programs, the warrants are measured at the fair value at the grant date and recognized in the income statement as a staff cost of the respective functions over the vesting period. The counter item is recognized in equity. On initial recognition, an estimate is made of the number of warrants expected to vest. This estimate is subsequently revised for changes in the number of warrants expected to vest. Accordingly, recognition is based on the number of warrants that are ultimately vested. The fair value of granted warrants is estimated using the Black & Scholes option pricing model. Vesting conditions are taken into account when estimating the fair value of the warrants
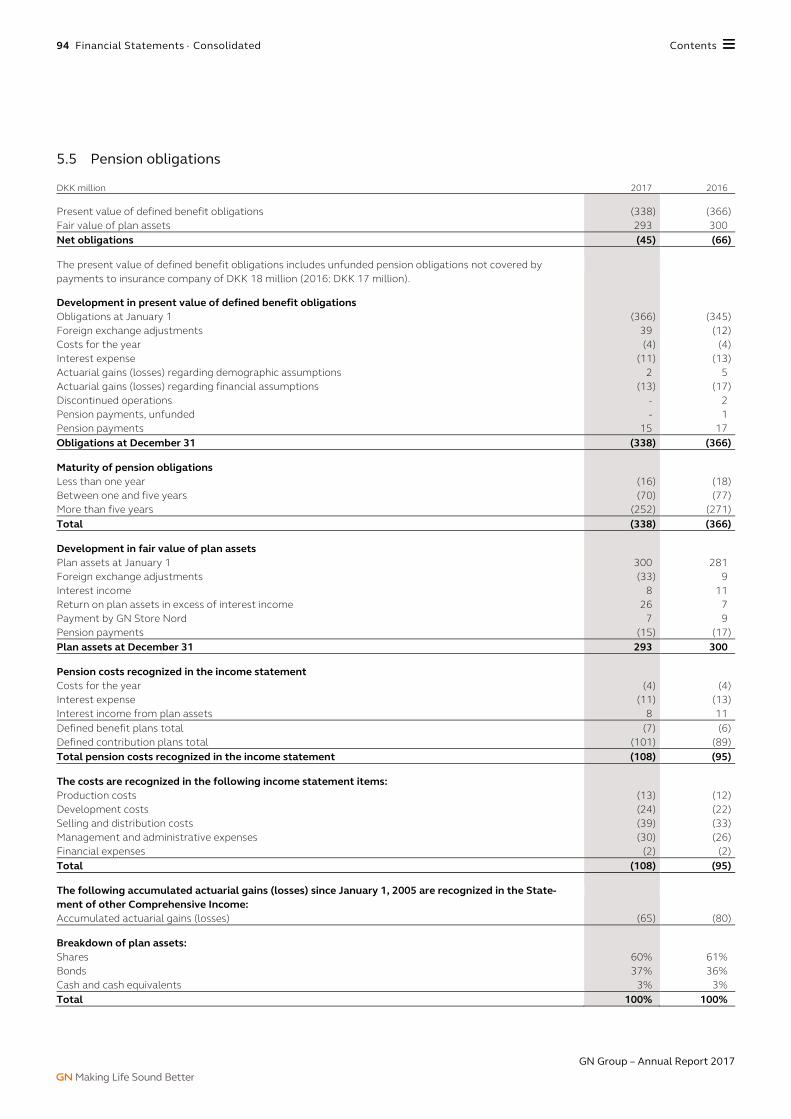
94 Financial Statements ⋅ Consolidated Contents
GN Group – Annual Report 2017
5.5 Pension obligations DKK million 2017 2016 Present value of defined benefit obligations (338) (366) Fair value of plan assets 293 300 Net obligations (45) (66) The present value of defined benefit obligations includes unfunded pension obligations not covered by payments to insurance company of DKK 18 million (2016: DKK 17 million). Development in present value of defined benefit obligations Obligations at January 1 (366) (345) Foreign exchange adjustments 39 (12) Costs for the year (4) (4) Interest expense (11) (13) Actuarial gains (losses) regarding demographic assumptions 2 5 Actuarial gains (losses) regarding financial assumptions (13) (17) Discontinued operations - 2 Pension payments, unfunded - 1 Pension payments 15 17 Obligations at December 31 (338) (366) Maturity of pension obligations Less than one year (16) (18) Between one and five years (70) (77) More than five years (252) (271) Total (338) (366) Development in fair value of plan assets Plan assets at January 1 300 281 Foreign exchange adjustments (33) 9 Interest income 8 11 Return on plan assets in excess of interest income 26 7 Payment by GN Store Nord 7 9 Pension payments (15) (17) Plan assets at December 31 293 300 Pension costs recognized in the income statement Costs for the year (4) (4) Interest expense (11) (13) Interest income from plan assets 8 11 Defined benefit plans total (7) (6) Defined contribution plans total (101) (89) Total pension costs recognized in the income statement (108) (95) The costs are recognized in the following income statement items: Production costs (13) (12) Development costs (24) (22) Selling and distribution costs (39) (33) Management and administrative expenses (30) (26) Financial expenses (2) (2) Total (108) (95) The following accumulated actuarial gains (losses) since January 1, 2005 are recognized in the State-ment of other Comprehensive Income: Accumulated actuarial gains (losses) (65) (80) Breakdown of plan assets: Shares 60% 61% Bonds 37% 36% Cash and cash equivalents 3% 3% Total 100% 100%

95 Financial Statements ⋅ Consolidated Contents
GN Group – Annual Report 2017
5.5 Pension obligations (Continued) At the balance sheet date the actuarial calculations for the prevailing American defined benefit plan are based on a discount rate of 4% (2016: 4%). A 25 basis point decrease in the discount rate will result in a DKK 7 million increase in the defined benefit obligation and a 25 basis point increase will result in a DKK 8 million decrease in the defined benefit obligation. Defined contribution plans The Group has pension commitments regarding certain groups of employees in Denmark and abroad. Pension plans are generally defined contribution plans. The pension plans are funded by current payments to independent pension funds and insurance companies, which are responsible for payment of the pension benefits. When contributions to defined contribution plans have been paid, the Group has no further commitments to present or former employees. Contributions to defined contribution plans are recognized in the income statement when they are due. Defined benefit plans The Group has an American pension plan, which is not covered by payments to insurance companies but is partly off-set by the fair value of reserved pension funds. At July 1, 2003, the pension plan was frozen, meaning that employees covered by the plan will continue to be entitled to the pension payments earned up to this date. However, employees will not earn further pension payments. Other plans The Group has no other pension obligations or similar obligations to its employees.
Accounting policies Pensions Contributions to defined contribution plans are recognized in the income statement in the period to which they relate and any contributions outstanding are recognized in the balance sheet as other payables. Defined benefit plans are subject to an annual actuarial estimate of the present value of future benefits under the defined benefit plan. The present value is determined on the basis of assumptions about the future development in variables such as salary levels, interest rates, inflation and mortality. The present value is determined only for benefits earned by employees from their employment with the Group. The actuarial present value less the fair value of any plan assets is recognized in the balance sheet under pension obligations. Pension costs for the year are recognized in the income statement based on actuarial estimates and financial expectations at the beginning of the year. Any difference between the expected development in plan assets and the defined benefit obligation and actual amounts results in actuarial gains or losses. Actuarial gains or losses are recognized in other comprehensive income
5.6 Contingent assets and liabilities DKK million 2017 2016 Guarantees 72 15 Outstanding Lawsuits and disputes GN Store Nord and its subsidiaries and associates are parties to various lawsuits, including various cases involving patent infringements. The outcome of cases pending is not expected to be of material importance to the Group’s financial position. Guarantees The majority of guarantee’s is related to an associated company's bank credit facility. Security The Group has not pledged any assets as security in the present or prior financial years. Purchase obligations GN Store Nord has agreed with a number of suppliers that the suppliers will purchase components for the production of hearing instruments and headsets based on sales estimates prepared by GN Store Nord. To the extent that GN Store Nord's sales estimates exceed actual purchases from suppliers, GN Store Nord is under an obligation to purchase any remaining components from the suppliers.

96 Financial Statements ⋅ Consolidated Contents
GN Group – Annual Report 2017
5.6 Contingent assets and liabilities (Continued) Management assesses sales estimates on an ongoing basis. To the extent that component inventories at suppliers exceed the volumes expected to be used, GN Store Nord recognizes a provision for onerous purchase contracts. Claim against Plantronics Inc. In 2012, GN Audio filed suit against Plantronics for attempted monopolization of the distributors’ market in the United States. During the discovery phase, GN learned of alleged intentional document destruction. A hearing on the matter was held on May 18, 2016, and on July 6, 2016, the Court issued a sanctions motion ordering Plantronics to pay USD 3 million to GN Audio in punitive damages as well as reasonable fees and costs incurred in connection with the discovery dispute. Furthermore, the Court reserved the right to issue additional evidentiary sanctions, and to instruct the jury that it may draw an adverse inference that emails destroyed by Plantronics would have been favorable to GN Audio's case and/or unfavorable to Plantronics' defense. On 18 October 2017, a jury in the Federal District Court, Delaware, ruled in favor of Plantronics and did not find that Plantronics’ behavior in the market had been unlawful. GN has decided to appeal the ruling. Apart from the above, management is not aware of any matter that could be of material importance to the Group's financial position. For information on lease obligations, please refer to note 5.9 Lease obligations
Significant accounting estimates Provisions, Contingencies and Lawsuits GN Store Nord’s Management assesses provisions, contingent assets and contingent liabilities and the likely outcome of pending or threatened lawsuits on an ongoing basis. The outcome depends on future events that are by nature uncertain. In assessing the likely outcome of lawsuits and tax disputes, etc., Management bases its assessment on external legal assistance and decided cases
5.7 Associates Investments in associates DKK million 2017 2016 Aggregated financial information for associates is provided below: Revenue 146 119 Profit (loss) for the year after tax (11) 6 Total assets 160 97 Total liabilities 124 48 Total share of profit (loss) for the year after tax 6 2 Total share of net assets 10 15 Transactions with associates comprise sale of goods of DKK 19 million (2016: DKK 61 million) and sale of services of DKK 0 million (2016: DKK 22 million) on normal commercial terms and conditions. Group companies are listed on page 99.
Accounting policies Investments in Associates in the Consolidated Financial Statements On acquisition of investments in associates, the purchase method is used, cf. Business Combinations. In the consolidated financial statements investments in associates are recognized according to the equity method. Investments in associates are measured at the proportionate share of the enterprises’ net asset values calculated in accordance with the Group’s accounting policies minus or plus the proportionate share of unrealized intra-group profits and losses and plus the carrying amount of goodwill. Profit (Loss) from Investments in Associates The proportionate share of the profit (loss) after tax of the individual associates is recognized in the income statement of the Group after elimination of the proportionate share of intra-group profits (losses)

97 Financial Statements ⋅ Consolidated Contents
GN Group – Annual Report 2017
5.8 Other non-cash adjustments and reconciliation of cash and cash equivalents DKK million 2017 2016 Share-based payment (granted) 22 22 (Gain) loss on divestment of operations - 3 Provision for bad debt, inventory write-downs, etc. 36 18 Adjustment of provisions 48 (42) Total 106 1 Reconciliation of cash and cash equivalents, end of period DKK million 2017 2016 Cash and cash equivalents, continuing operations 526 178 Cash and cash equivalents, discontinued operations - 29 Total 526 207
5.9 Lease obligations DKK million 2017 2016 Future lease obligations are distributed as follows: Operating leases: Less than one year 141 132 Between one and five years 212 241 More than five years 71 89 Total 424 462 Operating leases primarily relate to lease of property on market terms in Denmark, the United States and the United Kingdom. The remaining lease terms are between one and fifteen years. Operating leases include rental obligations related to properties in Denmark in the amount of DKK 14 million (2016: DKK 9 million). DKK 0 million (2016: DKK 1 million) of the rental obligation in Denmark is provided for in the balance sheet in connection with vacating the premises. Lease payments recognized in the income statement relating to operating leases amount to DKK 165 million (2016: DKK 140 million).
Accounting policies Rental and Lease Matters Leases that do not meet the criteria for classification as a financial asset are treated as operating leases. Operating lease payments are recognized in the income statement over the term of the lease

98 Financial Statements ⋅ Consolidated Contents
GN Group – Annual Report 2017
5.10 Fees to auditors appointed at the annual general meeting DKK million 2017 2016 Audit fees (7) (6) Total (7) (6) Other assistance: Other assurance related services (5) (6) Tax assistance and advice (2) (2) Other services (1) - Total (8) (8) Total (15) (14) Consolidated audit fees include DKK 3 million (2016: DKK 3 million) to Ernst & Young P/S. Consolidated other assistance includes DKK 7 million (2016: DKK 6 million) to Ernst & Young P/S, primarily related to other assurance related services in connection with the divestment of GN Otometrics, tax and accounting advisory services related to bonds issued as well as financial due diligence work.
5.11 Related parties Please refer to note 12 Related party transactions in the parent company financial statements.

99 Financial Statements ⋅ Consolidated Contents
GN Group – Annual Report 2017
Companies in the GN Group Domicile Currency Ownership % Share capital GN Store Nord A/S Denmark DKK 582,736,856 GN Ejendomme A/S Denmark DKK 100 10,625,000 GN Audio A/S Denmark DKK 100 34,103,000 GN Audio Australia Pty Ltd. Australia AUD 100 2,500,000 GN Áudio Brasil Importacão & Comércio Ltda. Brazil BRL 100 407,820 GN Netcom (Canada), Inc. Canada CAD 100 1,000 GN Audio (China) Ltd. China USD 100 8,000,000 GN Audio Logistic (Xiamen) Ltd. China USD 100 500,000 GN Audio (Shanghai) Co., Ltd. China CNY 100 15,481,000 GN Audio France SA France EUR 100 80,000 GN Audio Germany GmbH Germany EUR 100 51,129 GN Audio Hong Kong Limited Hong Kong HKD 100 2,000,000 GN Audio India Private Limited India INR 100 40,000,000 GN Audio Italia s.r.l. Italy EUR 100 10,200 GN Audio Japan Ltd. Japan JPY 100 10,000,000 GN Audio Benelux B.V. Netherlands EUR 100 18,000 GN Audio Singapore Pte. Ltd. Singapore SGD 100 700,000 GN Audio Spain, S.A. Spain EUR 100 60,111 GN Audio Sweden AB Sweden SEK 100 5,100,000 GN Audio UK Ltd. United Kingdom GBP 100 100,000 GN Audio USA Inc. USA USD 100 35,900,000 GN Hearing A/S Denmark DKK 100 63,787,900 GN Hearing Australia Pty. Ltd. Australia AUD 100 4,000,002 GN Hearing Austria GmbH Austria EUR 100 500,000 GN Hearing Brazil Brazil BRL 100 1,019,327 GN Hearing Care Canada Ltd. Canada CAD 100 8,435,000 5837946 Manitoba, Ltd. Canada CAD 100 10,000 810720 Alberta, Ltd. Canada CAD 100 50,000 GN ReSound Shanghai Ltd. China CNY 100 20,491,300 GN ReSound China Ltd. China CNY 100 34,000,000 GN GROC Ltd. China CNY 100 4,138,493 GN Hearing Czech Republic spol. s r.o Czech Republic CZK 100 102,000 Interton Danmark A/S Denmark DKK 100 500,000 Beltone Europe Holdings ApS Denmark DKK 100 200,000 Dansk Hørecenter ApS Denmark DKK 100 130,000 GN Hearing Finland Oy/Ab Finland EUR 100 55,502 GN Hearing SAS France EUR 100 285,957 GN Hearing GmbH Germany EUR 100 296,549 GN ReSound GmbH Hörtechnologie Germany EUR 100 2,162,253 GN Hearing India Private Limited India INR 100 20,983,210 GN Hearing S.r.l. Italy EUR 100 181,190 GN Hearing Japan K.K Japan JPY 100 499,000,000 GN Hearing Korea., Ltd Korea KRW 100 205,030,000 GN Hearing (Malaysia) Sdn Bhd Malaysia RM 100 500,000 GN Hearing Benelux B.V. Netherlands EUR 100 680,670 GN Hearing New Zealand Limited New Zealand NZD 100 2,000,000 GN Hearing Norway AS Norway NOK 100 2,000,000 GN Hearing RUS LLC Russia RUB 100 10,000 GN Hearing Pte. Ltd. Singapore SGD 100 1,740,000 Interton Slovakia S.R.O Slovakia SLK 85 170,000 GN Hearing Care S.A. Spain EUR 100 66,110 GN Hearing Sverige AB Sweden SEK 100 100,000 GN Hearing Switzerland AG Switzerland CHF 100 500,000 GN Hearing UK Ltd United Kingdom GBP 100 7,376,000 GN US Holdings Inc. USA USD 100 34,000,000 GN Hearing Care Corporation USA USD 100 190,000 GN ReSound Holdings, Inc. USA USD 100 0 Beltone Holdings II Inc. USA USD 100 30 Beltone Holdings III, Inc. USA USD 100 30 Beltone Holdings IV, Inc. USA USD 100 30 Beltone Holdings V, Inc. USA USD 100 30 Beltone Hearing Care Foundation USA USD 100 0 Beltone Corporation USA USD 100 30 American Hearing Systems, LLC USA USD 100 1,000 Audio Electronics Inc. USA USD 100 0 Audigy Group, LLC USA USD 100 0 Audigy Medical LLC USA USD 100 0 Audigy Venture LLC USA USD 100 0 Associates Audio Nova S.R.L. Romania RON 49 1,000 Himpp A/S Denmark DKK 11 1,800,000 HIMSA A/S Denmark DKK 25 1,000,000 HIMSA II A/S Denmark DKK 17 600,000 Himsa II K/S Denmark DKK 15 3,250,000 K/S Himpp Denmark DKK 9 140,703,360 Note: A few minor companies have been omitted from the list.

100 Financial Statements ⋅ Consolidated Contents
GN Group – Annual Report 2017
In this annual report the following financial terms are used: Operating profit (loss) Profit (loss) before tax and financial items. EBITDA Operating profit (loss) before depreciation and impairment of property, plant and equipment, amortization and impairment
of intangible assets, except development projects, impairment of goodwill and gains (losses) on divestment of operations etc. but includes amortization of development projects.
EBITA Operating profit (loss) before amortization and impairment of acquired intangible assets, impairment of goodwill and gains
(losses) on divestment of operations etc. but includes amortization of development projects. Convertible Bond EUR 225 million senior unsecured zero coupon bonds due 2022 with detachable unsecured warrant units expiring 2022,
refer to note 4.2 Financial Risk. Non-IFRS measures The use of non-IFRS measures is explained in note 1.3 Non-IFRS measures and 2.5 Income statement classified by function. Key Ratio Definitions Organic growth = Absolute organic sales growth
Sales in comparative period
Organic growth is a measure of growth excluding the impact of acquisitions, divestments and foreign exchange
adjustments from year-on-year comparisons. Net working capital (NWC) = Inventories + receivables + other operating current assets - trade payables - other operating current liabilities Net interest bearing debt (NIBD) = Bank loans and issued bonds - Cash and cash equivalents Dividend payout ratio = Total dividend
Profit (loss) for the year
Gross margin = Gross profit
Revenue
EBITA margin = EBITA
Revenue
ROIC (Return on invested capital including goodwill)
= EBITA Average invested capital including goodwill
Invested capital = NWC + property, plant and equipment and intangible assets + loans to dispensers of
GN Hearing products + ownership interests – provisions Cash conversion = Free cash flow excl. company acquisitions and divestments
EBITA
Return on equity (ROE) = Profit (loss) for the year
Average equity of the Group
Equity ratio = Equity of the Group
Total assets
Earnings per share, basic (EPS) = Profit (loss) for the year
Average number of shares outstanding
Earnings per share, fully diluted (EPS diluted)
= Profit (loss) for the year Average number of shares outstanding, fully diluted
Market capitalization Number of shares outstanding x share price at the end of the period Outstanding shares Number of shares listed - treasury shares
101 Financial Statements ⋅ Parent company Contents
GN Group – Annual Report 2017
Notes – Income statement 1 Staff costs 106 2 Depreciation, amortization and impairment 106 3 Fees to auditors appointed at the annual
general meeting 106 4 Financial income and expenses 107 5 Tax 107 6 Intangible assets 108
Notes – Balance sheet 7 Investments in subsidiaries 108 8 Deferred tax 109 9 Contingent assets and liabilities 109
Notes – Other disclosures 10 Financial instruments and financial risk 109 11 Outstanding shares and treasury shares 110 12 Related party transactions 111 13 Other non-cash adjustments 111 14 Liabilities from financing activities 111 15 Accounting policies 112
Parent company Financial statements 2017
Financial statements Income statement and statement of comprehensive income 102 Balance sheet at December 31 103 Statement of cash flow 104 Statement of equity 105
Notes to the parent financial statements

102 Financial Statements ⋅ Parent company Contents
GN Group – Annual Report 2017
Income statement DKK million Note 2017 2016 Revenue 129 20 Gross profit 129 20 Development costs (56) (6) Management and administrative expenses 1,2,3 (194) (79) Operating profit (loss) (121) (65) Share of profit after tax in subsidiaries 7 1,290 1,120 Financial income 4 122 114 Financial expenses 4 (148) (162) Profit (loss) before tax 1,143 1,007 Tax on profit (loss) 5 40 26 Profit (loss) for the year 1,183 1,033 Proposed profit appropriation/distribution of loss Transferred to reserve for net revaluation according to the equity method 1,290 (2,880) Retained earnings (289) 3,735 Proposed dividends for the year 182 178 1,183 1,033
Statement of comprehensive income DKK million 2017 2016 Profit (loss) for the year 1,183 1,033 Other comprehensive income Items that will not be reclassified subsequently to profit or loss Other changes in equity in subsidiaries 11 (4) Other comprehensive income Items that may be reclassified subsequently to profit or loss Adjustment of cash flow hedges 19 (19) Tax relating to this item of other comprehensive income (3) 4 Foreign exchange adjustments, etc. (802) 198 Other changes in equity in subsidiaries 101 (30) Comprehensive income for the year 509 1,182

103 Financial Statements ⋅ Parent company Contents
GN Group – Annual Report 2017
Balance sheet at December 31 DKK million Note 2017 2016 Assets Intangible assets 6 192 81 Investments in subsidiaries 7 7,542 10,833 Amounts owed by subsidiaries 10 1,191 766 Total non-current assets 8,925 11,680 Other receivables 10 47 7 Cash and cash equivalents 265 - Total current assets 312 7 Total assets 9,237 11,687 Equity and liabilities Share capital 583 619 Other reserves (15) (583) Proposed dividends for the year 182 178 Retained earnings 4,033 5,406 Total equity 4,783 5,620 Bank loans and issued bonds 10, 14 3,508 3,527 Deferred tax liabilities 8 171 174 Total non-current liabilities 3,679 3,701 Bank loans 10, 14 11 47 Trade payables 10 30 13 Tax payables 2 9 Amounts owed to subsidiaries 10, 14 665 2,218 Other payables 67 79 Total current liabilities 775 2,366 Total equity and liabilities 9,237 11,687

104 Financial Statements ⋅ Parent company Contents
GN Group – Annual Report 2017
Statement of cash flow DKK million Note 2017 2016 Operating activities Operating profit (loss) (121) (65) Depreciation, amortization and impairment 23 20 Other non-cash adjustments 13 - (6) Cash flow from operating activities before changes in working capital (98) (51) Change in receivables (39) 1 Change in trade payables and other payables 21 7 Total changes in working capital (18) 8 Cash flow from operating activities before financial items and tax (116) (43) Interest and dividends, etc. received 4,010 102 Interest paid (68) (156) Tax paid, net 28 46 Cash flow from operating activities 3,854 (51) Investing activities Investments in intangible assets (134) (5) Disposal of intangible assets - 13 Amounts owed by subsidiaries (425) - Cash flow from investing activities (559) 8 Cash flow from operating and investing activities (free cash flow) 3,295 (43) Financing activities Increase of long-term loans - 1,231 Increase of short-term loans - 233 Decrease of long-term loans 14 (1,599) - Decrease of short-term loans and amounts owed to subsidiaries 14 (1,534) - Net proceeds from issue of bond-with-warrant units (convertible bonds) 14 1,636 - Paid dividends (161) (149) Purchase/sale of treasury shares (1,372) (1,272) Cash flow from financing activities (3,030) 43 Net cash flow 265 - Cash and cash equivalents, beginning of period - - Cash and cash equivalents, end of period 265 -

105 Financial Statements ⋅ Parent company Contents
GN Group – Annual Report 2017
Statement of equity
Other reserves
DKK million Share capital*
Additional paid-in capital
Hedging reserve
Treasury shares
Reserve according
to the equity
method
Proposed dividends
for the year
Retained earnings
Total equity
Balance sheet total at December 31, 2015 649 207 (13) (1,360) 3,630 161 2,490 5,764 Profit (loss) for the period - - - - (2,880) - 3,913 1,033 Adjustment of cash flow hedges - - (19) - - - - (19) Other changes in equity in subsidiaries - - - - (28) - - (28) Foreign currency translation adjustments of in-vestments in subsidiaries etc. - - - - 198 - - 198 Tax relating to other comprehensive income - - 4 - (6) - - (2) Total comprehensive income for the year - - (15) - (2,716) - 3,913 1,182 Reduction of the share capital (30) (207) - 1,036 - - (799) - Other changes in equity in subsidiaries - - - - 22 - - 22 Purchase of ownership interests in subsidiaries by payment in treasury shares - - - 99 - - (32) 67 Tax related to share-based incentive plans - - - - 6 - - 6 Purchase/sale of treasury shares - - - (1,272) - - - (1,272) Proposed dividends for the year* - - - - - 178 (178) - Paid dividends - - - - - (149) - (149) Dividends, treasury shares - - - - - (12) 12 - Balance sheet total at December 31, 2016 619 - (28) (1,497) 942 178 5,406 5,620 Profit (loss) for the period - - - - 1,290 - (107) 1,183 Adjustment of cash flow hedges - - 19 - - - - 19 Other changes in equity in subsidiaries - - - - 106 - - 106 Foreign currency translation adjustments of in-vestments in subsidiaries etc. - - - - (802) - - (802) Tax relating to other comprehensive income - - (3) - 6 - - 3 Total comprehensive income for the year - - 16 - 600 - (107) 509 Reduction of the share capital (36) - - 1,193 - - (1,157) - Value of warrants issued with bonds - - - - - - 76 76 Other changes in equity in subsidiaries - - - - 22 - - 22 Purchase of ownership interests in subsidiaries by payment in treasury shares - - - 90 - - (20) 70 Tax related to share-based incentive plans - - - - 19 - - 19 Purchase/sale of treasury shares - - - (1,372) - - - (1,372) Proposed dividends for the year* - - - - - 182 (182) - Paid dividends - - - - - (161) - (161) Dividends, treasury shares - - - - - (17) 17 - Balance sheet total at December 31, 2017 583 - (12) (1,586) 1,583 182 4,033 4,783 * The nominal value of all shares outstanding is DKK 4.00 (2016 DKK 4.00) per share
**Equivalent to DKK 1.25 per share (2016: DKK 1.15 per share)
The reserve according to the equity method includes foreign exchange adjustments of DKK (1,311) million (2016 DKK (540) million).
Retained earnings, which are available for distribution from the Parent Company amounts to DKK 2,617 million (2016 DKK 4,059 million).

106 Financial Statements ⋅ Parent company Contents
GN Group – Annual Report 2017
1 Staff costs DKK million 2017 2016 Wages, salaries and remuneration (94) (62) Pensions (9) (5) Total (103) (67) Executive Management remuneration can be specified as follows: Marcus Desimoni, CFO of GN Store Nord* (7.4) (8.0) Anders Boyer, CFO of GN Store Nord until February 14, 2016* - (1.1) Total (7.4) (9.1) Staff costs are included in Management and administrative expenses. Board of Directors remuneration (5.0) (5.0) Average number of employees 144 79 Number of employees, year-end 148 82
*) Does not include share based payments.
For information regarding Executive Management and Board of Directors remuneration please refer to note 5.3 in the consolidated financial statements.
2 Depreciation, amortization and impairment Amortization and impairment of intangible assets of DKK 23 million, are recognized in the Income Statement as Management and administrative expenses (2016: DKK 20 million).
3 Fees to auditors appointed at the annual general meeting DKK million 2017 2016 Audit fees (1) (1) Total (1) (1) Other assistance: Other assurance related services (5) (5) Tax assistance and advice (1) (1) Other services (1) - Total (7) (6) Total (8) (7) Other assistance is described in note 5.10 in the consolidated financial statements.

107 Financial Statements ⋅ Parent company Contents
GN Group – Annual Report 2017
4 Financial income and expenses DKK million 2017 2016 Financial income Interest income from subsidiaries* 51 75 Interest income from bank balances* 12 25 Financial income, other 3 2 Foreign exchange gain 56 12 Total 122 114 Financial expenses Interest expense to subsidiaries* (60) (86) Interest expenses on bank loans and issued bonds (52) (56) Financial expenses, other (18) (14) Fair value adjustments of derivative financial instruments and impairments (12) - Foreign exchange loss (6) (6) Total (148) (162) *Interest income and expenses from financial assets and liabilities at amortized cost.
5 Tax DKK million 2017 2016 Tax on profit (loss) Current tax for the year 39 18 Deferred tax for the year (7) 5 Adjustment to current tax in respect of prior years (2) 2 Adjustment to deferred tax in respect of prior years 10 1 Total 40 26 Reconciliation of effective tax rate Danish tax rate 22.0% 22.0% Non-deductible expenses 0.1% 0.1% Adjustment of tax with respect to prior years (0.8)% 0.0% Share of profits (loss) in subsidiaries (24.8)% (24.5)% Other 0.0% (0.2)% Effective tax rate (3.5)% (2.6)% In 2017, the parent company paid preliminary taxes of DKK 218 million in Danish corporation tax for the year (2016 DKK 166 million).

108 Financial Statements ⋅ Parent company Contents
GN Group – Annual Report 2017
6 Intangible assets
DKK million
Development projects, devel-oped in-house Software Total
Cost at January 1 - 168 168 Additions 74 60 134 Cost at December 31 74 228 302 Amortization and impairment at January 1 - (87) (87) Amortization - (23) (23) Amortization and impairment at December 31 - (110) (110) Carrying amount at December 31, 2017 74 118 192 Cost at January 1 - 188 188 Additions - 5 5 Disposals - (25) (25) Cost at December 31 - 168 168 Amortization and impairment at January 1 - (79) (79) Amortization - (20) (20) Disposals - 12 12 Amortization and impairment at December 31 - (87) (87) Carrying amount at December 31, 2016 - 81 81 GN Store Nord has not capitalized any borrowing costs in the current or preceding periods as non-current assets are not financed with debt.
7 Investments in subsidiaries DKK million 2017 2016 Cost at January 1 5,891 5,824 Additions, capital contribution 70 67 Other adjustments (2) - Cost at December 31 5,959 5,891 Value adjustment at January 1 4,942 3,630 Share of profit after tax in subsidiaries 1,290 1,120 Foreign currency translation adjustments (802) 198 Direct equity postings in subsidiaries 153 (6) Dividends received (4,000) - Value adjustments at December 31 1,583 4,942
Carrying amount at December 31 7,542 10,833 Group companies are listed on page 99.

109 Financial Statements ⋅ Parent company Contents
GN Group – Annual Report 2017
8 Deferred tax DKK million 2017 2016 Deferred tax, net Deferred tax at January 1, net (174) (180) Adjustment in respect of prior years 10 1 Deferred tax for the year recognized in profit (loss) for the year (7) 5 Deferred tax at December 31, net (171) (174) Deferred tax, net relates to: Intangible assets (26) (18) Retaxation (127) (152) Provisions (20) (5) Other 2 1 Total (171) (174)
9 Contingent assets and liabilities Please refer to note 5.6 Contingent liabilities in the consolidated financial statements. The company is jointly taxed with all Danish subsidiaries. The company is jointly and severally liable with the other companies in the joint taxation for Danish corporate taxes and withholding taxes on dividend, interests and royalties within the joint taxation.
10 Financial instruments and financial risk Contractual maturity analysis for financial liabilities
DKK million Less than one year
Between one and five years
More than five years Total
2017 Issued bonds - 1,577 - 1,577 Long-term bank loans 74 1,857 - 1,931 Short-term bank loans 11 - - 11 Trade payables 30 - - 30 Amounts owed to subsidiaries - 665 - 665 Total non-derivative financial liabilities 115 4,099 - 4,214 Derivative financial liabilities - 25 - 25 Total financial liabilities 115 4,124 - 4,239 2016 Long-term bank loans 74 3,453 - 3,527 Short-term bank loans 47 - - 47 Trade payables 13 - - 13 Amounts owed to subsidiaries - 2,218 - 2,218 Total non-derivative financial liabilities 134 5,671 - 5,805 Derivative financial liabilities - 38 - 38 Total financial liabilities 134 5,709 - 5,843 The maturity analysis is based on non-discounted cash flows.

110 Financial Statements ⋅ Parent company Contents
GN Group – Annual Report 2017
10 Financial instruments and financial risk (Continued) Categories of financial assets and liabilities DKK million 2017 2016 Other receivables 47 7 Receivables from subsidiaries 1,191 766 Loans and receivables 1,238 773 Issued bonds 1,577 - Bank loans, non-current 1,931 3,453 Bank loans 11 121 Trade payables 30 13 Amounts owed to subsidiaries 665 2,218 Financial liabilities measured at amortized cost 4,214 5,805 Derivative financial instruments included in Other payables 25 38 Financial liabilities measured at fair value 25 38 The fair value of issued bonds (zero coupon) amounted to DKK 1,603 million at December 31, 2017. For other financial assets and liabilities, the fair value is approximately equal to the carrying amount. GN Store Nord's bank loans carry floating interest rates and are primarily funded based on short term EURIBOR rates. Derivative financial instruments Cash flow hedges, interest rate swap 2017 2016
Contract
amount, net Fair value,
assets Fair value,
liabilities Contract
amount, net Fair value,
assets Fair value,
liabilities EUR* 1,741 - 25 2,409 - 38 Total 1,741 - 25 2,409 - 38 * Interest rate swaps denominated in EUR
GN has hedged future interest rates with interest rate swaps. The fair value of the interest rate swaps is determined using forward interest rates and can be categorized as level 2 (observable inputs) in the fair value hierarchy. DKK million 2017 2016 Fair value adjustment for the year recognized in Other comprehensive income 19 (19)
11 Outstanding shares and treasury shares For information regarding outstanding shares and treasury shares please refer to note 4.1 Outstanding shares and treasury shares in the consolidated financial statements. Funding, liquidity and capital structure is managed at Group level, please refer to note 4.2 Financial risk and financial instruments in the consol-idated financial statements.

111 Financial Statements ⋅ Parent company Contents
GN Group – Annual Report 2017
12 Related party transactions GN Store Nord A/S' related parties exercising significant influence comprise members of the Board of Directors and the Executive Management and senior employees and their family members. In addition, related parties comprise group enterprises and associates over which GN Store Nord A/S exercises control or significant influence. Group companies are listed on page 99. Board of Directors, Executive Management and Senior Employees Management remuneration and incentive plans are described in notes 5.3 Remuneration of the board of directors and executive management and 5.4 Incentive plans in the consolidated financial statements. Group enterprises and associates Trade with group enterprises and associates comprised: DKK million 2017 2016 Sale of services to group enterprises 227 133 Lease income from group enterprises 13 14 Sale of intangible assets - 13 Purchase of services from group enterprises (58) (27) Lease costs paid to group enterprises (16) (15) Purchase of intangible assets - (5) Transactions with group enterprises are eliminated in the consolidated financial statements in accordance with GN Store Nord's Accounting Policies. Purchase of products and services are bought from group enterprises on normal commercial terms and conditions. The parent company's balances with group enterprises at December 31, 2017 are recognized in the balance sheet. Interest income and expenses with respect to group enterprises are disclosed in note 4. Further, balances with group enterprises comprise trade balances related to the purchase and sale of goods and services. Sale of services to group enterprises consists of facility services, canteen services, management fee and IT costs. Purchase of services from group enterprises mainly consists of facility services and canteen services. Furthermore, the parent company has purchased development services on market terms from subsidiaries related to the exploring research projects undertaken in GN Other. No transactions have been carried out with the Board of Directors, the Executive Management, senior employees, major shareholders or other related parties, apart from remuneration disclosed in notes 5.3 Remuneration of the Board of Directors and Executive Management and 5.4 Incentive plans in the consolidated financial statements.
13 Other non-cash adjustments DKK million 2017 2016 Adjustment of provisions - (6) Total - (6)
14 Liabilities from financing activities
DKK million Bank loans Issued bonds Bank loans,
current Amounts owed to subsidiaries Total
Liabilities at January 1 3,527 - 47 2,218 5,792 Cash flows (1,599) 1,560 (36) (1,498) (1,573) Foreign exchange adjustments 3 4 - (55) (48) Non-cash interest expenses - 13 - - 13 Liabilities at December 31, 2017 1,931 1,577 11 665 4,184
The total cash proceeds from the issue of bonds of DKK 1,636 million include DKK 76 million posted to equity as value of warrants.

112 Financial Statements ⋅ Parent company Contents
GN Group – Annual Report 2017
15 Accounting policies The financial statements for 2017 of the parent company, GN Store Nord A/S have been prepared in accordance with International Financial Reporting Standards as adopted by the EU and Danish disclosure requirements for annual reports of listed companies. The financial statements have been prepared in accordance with the historical cost convention, as modified by the revaluation of available-for-sale financial assets and derivative financial instruments at fair value. The accounting policies for the financial statements of the parent company are unchanged from the last financial year and are the same as for the consolidated financial statements with the following additions.
Supplementary accounting policies for the parent company Investments in subsidiaries Revenue in the parent company primarily relates to services rendered to GN Group companies during the year. Investments in subsidiaries are accounted for using the equity method whereby the investment is initially recognized at cost and adjusted thereafter for the post-acquisition change in the share of the subsidiaries net assets. The share of the subsidiaries profit or loss, less unrealized intra-Group profits, is included in the income statement of the parent company and the share of the subsidiaries other comprehensive income is included in other comprehensive income of the parent company. Received dividends reduce the carrying amount of the investments in subsidiaries. To the extent net profit in subsidiaries exceeds declared or proposed dividends from such companies, net revaluation of investments in subsidiaries is transferred to Net revaluation reserve under Equity according to the equity method. Managements report Parent company The GN Parent Company reports GN Corporate level activities and investments into GN Hearing and GN Audio. Revenue in 2017 grew DKK 109 million, primarily due to changes in Group Functions. Costs increased during the year due to the increased activities related to research initiatives at Corporate level and changes in Group Functions. The GN Parent Company applies the equity method for recognizing share of profit and investments in subsidiaries and profit for the year and total equity developed in line with the Group’s overall development. Cash flow from operations was positively impacted by dividends received in the total amount of DKK 4,010 million in 2017 (2016: DKK 102 million).

113 Management's report ⋅Statement by the Executive Management and the Board of Directors Contents
GN Group – Annual Report 2017
Today, the Executive Management and the Board of Directors have discussed and approved the GN Store Nord A/S Annual Report 2017. The annual report has been prepared in accordance with International Financial Reporting Standards as adopted by the EU and additional disclosure requirements in the Danish Financial Statements Act. In our opinion the consolidated financial statements and the parent company financial statements give a true and fair view of the group's and the parent company's assets, liabilities and financial position on December 31, 2017 and of the results of
the group's and the parent company's operations and cash flows for the financial year January 1 - December 31, 2017. Further, in our opinion the management's report includes a fair review of the development and performance of the group's and the parent company's business and financial condition, the profit for the year and of the group's and the parent company's financial position, together with a description of the principal risks and uncertainties that the group and the parent company face. We recommend that the annual report for 2017 be approved at the Annual General Meeting.
Statement by the Executive Management and the Board of Directors
Ballerup, February 7, 2018
Executive Management
Anders Hedegaard CEO, GN Store Nord & GN Hearing
René Svendsen-Tune CEO, GN Store Nord & GN Audio
Marcus Desimoni CFO, GN Store Nord & GN Hearing
Board of Directors
Per Wold-Olsen Chairman
William E. Hoover, Jr. Deputy chairman
Wolfgang Reim
Ronica Wang Hélène Barnekow Carsten Krogsgaard Thomsen
Leo Larsen Nikolai Bisgaard Morten Andersen

114 Management's report ⋅Independent auditor’s report Contents
GN Group – Annual Report 2017
To the shareholders of GN Store Nord A/S Opinion We have audited the consolidated financial statements and the parent company financial statements of GN Store Nord A/S for the financial year 1 January – 31 December 2017, which comprise income statement, statement of comprehen-sive income, balance sheet, statement of changes in equity, cash flow statement and notes, including accounting policies, for the Group and the Parent Company. The consolidated fi-nancial statements and the parent company financial state-ments are prepared in accordance with International Financial Reporting Standards as adopted by the EU and additional re-quirements of the Danish Financial Statements Act.
In our opinion, the consolidated financial statements and the parent company financial statements give a true and fair view of the financial position of the Group and the Parent Com-pany at 31 December 2017 and of the results of the Group's and the Parent Company's operations and cash flows for the financial year 1 January – 31 December 2017 in accordance with International Financial Reporting Standards as adopted by the EU and additional requirements of the Danish Financial Statements Act.
Our opinion is consistent with our long-form audit report to the Audit Committee and the Board of Directors.
Basis for opinion We conducted our audit in accordance with International Standards on Auditing (ISAs) and additional requirements ap-plicable in Denmark. Our responsibilities under those stand-ards and requirements are further described in the "Auditor's responsibilities for the audit of the consolidated financial statements and the parent company financial statements" (hereinafter collectively referred to as "the financial state-ments") section of our report. We believe that the audit evi-dence we have obtained is sufficient and appropriate to pro-vide a basis for our opinion.
Independence We are independent of the Group in accordance with the In-ternational Ethics Standards Board for Accountants' Code of Ethics for Professional Accountants (IESBA Code) and addi-tional requirements applicable in Denmark, and we have ful-filled our other ethical responsibilities in accordance with these rules and requirements.
To the best of our knowledge, we have not provided any pro-hibited non-audit services as described in article 5(1) of Regu-lation (EU) no. 537/2014.
Appointment of auditor We were initially appointed as auditor of GN Store Nord A/S before 1995, and accordingly, we have to resign as auditor of the company at the general meeting in 2021 at the latest. We have been re-appointed annually at the general meeting for a total consecutive period of more than 23 years up to and in-cluding the financial year 2017.
Key audit matters Key audit matters are those matters that, in our professional judgement, were of most significance in our audit of the fi-nancial statements for the financial year 2017. These matters were addressed during our audit of the financial statements as a whole and in forming our opinion thereon. We do not provide a separate opinion on these matters. For each matter below, our description of how our audit addressed the matter is provided in that context.
We have fulfilled our responsibilities described in the "Audi-tor's responsibilities for the audit of the financial statements" section, including in relation to the key audit matters below. Accordingly, our audit included the design and performance of procedures to respond to our assessment of the risks of material misstatement of the financial statements. The re-sults of our audit procedures, including the procedures per-formed to address the matters below, provide the basis for our audit opinion on the financial statements.
Accounting for financial support arrangements The Group has entered into financial support arrangements with certain of its dispensers, primarily in the US. The arrange-ments include providing financial support through loans and acquiring ownership interests.
Financial support arrangements were significant to our audit as the total carrying amount of DKK 755 million in loans and ownership interests at 31 December 2017 is material to the consolidated financial statements and because the account-ing treatment includes judgements based on facts, circum-stances and management assumptions. The arrangements are complex by nature as they often combine or link multiple elements of the commercial relationship with the dispenser. Areas of judgement include assessing the individual compo-nents of the arrangements, the classification of the invest-ments and the recoverability of assets (impairment testing).
Additional details on financial support arrangements are pro-vided in section 3.4 of the consolidated financial statements.
Our procedures in relation to the audit of financial support ar-rangements included:
• Assessing group accounting policies for compliance with IFRS.
Independent auditor’s report

115 Management's report ⋅Independent auditor’s report Contents
GN Group – Annual Report 2017
• Evaluating Management’s classification of investments and of the individual components of the financial support arrangements against a sample of underlying contracts and supporting documentation.
• Examining the principles for amortisation of supply agree-ments classified as intangible rights and recognition of any prepaid discounts against revenue against a sample of un-derlying contracts and supporting documentation.
• In respect of recoverability of the financial support ar-rangements, we examined payment histories and impair-ment tests prepared by Management as well as obtained external confirmations of the outstanding balances for se-lected loan arrangements.
Recognition and measurement of capitalised development costs The Group capitalises development costs in accordance with IFRS, which prescribes capitalisation when certain criteria are met. Recognition and measurement of capitalised develop-ment costs were significant to our audit because the balance of DKK 1,159 million at 31 December 2017 is material to the consolidated financial statements and because the criteria for capitalisation and impairment testing are subject to judge-ment and estimates based on Management’s assumptions, in-cluding consideration of anticipated technological develop-ments within the audio and hearing care industry.
Additional details on capitalised development costs are pro-vided in section 3.1 of the consolidated financial statements.
Our procedures in relation to the audit of recognition and measurement of capitalised development costs included:
• Assessing group accounting policies for compliance with IFRS and on a sample basis testing available documenta-tion to consider whether the criteria for capitalisation were met.
• Testing on a sample basis the effectiveness of the Group’s controls over capitalisation of development costs.
• Testing of the key assumptions applied by Management by means of comparison with business plans, historic per-formance and Management’s assumptions regarding strategy, product life cycle, anticipated technological de-velopments, market expectations and discount rates for selected development projects.
Revenue recognition Revenue is recognised when the risks and rewards of the un-derlying products have been transferred to the customer and is measured taking account of incentives, returns and rebates earned by dispensers and customers. Due to the multitude and variety of contractual terms across the Group’s markets, the estimation of incentives, returns and rebates is considered complex and therefore significant to our audit.
Additional details on revenue recognition are provided in sec-tion 2.1 of the consolidated financial statements.
Our procedures in relation to revenue recognition included:
• Considering the appropriateness of the Group’s revenue recognition accounting policies, including those relating to incentives, returns and rebates and assessing compli-ance with IFRS.
• Testing on a sample basis the effectiveness of the Group’s controls over correct timing of revenue recogni-tion.
• Testing on a sample basis that incentives, returns and re-bates have been recognised in the consolidated income statement in the correct period.
• Verifying selected sales transactions taking place at ei-ther side of the balance sheet date as well as credit notes issued after the year-end date to supporting documenta-tion and assessing whether those transactions were rec-ognised in the correct period and in accordance with the applicable sales contracts.
• Applying data analytics to identify and test revenue jour-nal entries on a sample basis.
Statement on the Management's review Management is responsible for the Management's review.
Our opinion on the financial statements does not cover the Management's review, and we do not express any form of as-surance conclusion thereon.
In connection with our audit of the financial statements, our responsibility is to read the Management's review and, in do-ing so, consider whether the Management's review is materi-ally inconsistent with the financial statements or our knowledge obtained during the audit, or otherwise appears to be materially misstated.
Moreover, it is our responsibility to consider whether the Man-agement's review provides the information required under the Danish Financial Statements Act.
Based on the work we have performed, we conclude that the Management's review is in accordance with the financial statements and has been prepared in accordance with the re-quirements of the Danish Financial Statements Act. We did not identify any material misstatement of the Management's review.
Management's responsibilities for the financial statements Management is responsible for the preparation of consoli-dated financial statements and parent company financial statements that give a true and fair view in accordance with International Financial Reporting Standards as adopted by the EU and additional requirements of the Danish Financial Statements Act and for such internal control as Management determines is necessary to enable the preparation of financial statements that are free from material misstatement, whether due to fraud or error.

116 Management's report ⋅Independent auditor’s report Contents
GN Group – Annual Report 2017
In preparing the financial statements, Management is respon-sible for assessing the Group's and the Parent Company's abil-ity to continue as a going concern, disclosing, as applicable, matters related to going concern and using the going concern basis of accounting in preparing the financial statements un-less Management either intends to liquidate the Group or the Parent Company or to cease operations, or has no realistic al-ternative but to do so.
Auditor’s responsibilities for the audit of the financial statements Our objectives are to obtain reasonable assurance about Our objectives are to obtain reasonable assurance as to whether the financial statements as a whole are free from material misstatement, whether due to fraud or error, and to issue an auditor's report that includes our opinion. Reasonable assur-ance is a high level of assurance, but is not a guarantee that an audit conducted in accordance with ISAs and additional re-quirements applicable in Denmark will always detect a mate-rial misstatement when it exists. Misstatements can arise from fraud or error and are considered material if, individually or in the aggregate, they could reasonably be expected to in-fluence the economic decisions of users taken on the basis of the financial statements.
As part of an audit conducted in accordance with ISAs and ad-ditional requirements applicable in Denmark, we exercise pro-fessional judgement and maintain professional scepticism throughout the audit. We also:
• Identify and assess the risks of material misstatement of the financial statements, whether due to fraud or error, design and perform audit procedures responsive to those risks and obtain audit evidence that is sufficient and ap-propriate to provide a basis for our opinion. The risk of not detecting a material misstatement resulting from fraud is higher than for one resulting from error, as fraud may involve collusion, forgery, intentional omissions, mis-representations or the override of internal control.
• Obtain an understanding of internal control relevant to the audit in order to design audit procedures that are ap-propriate in the circumstances, but not for the purpose of expressing an opinion on the effectiveness of the Group's and the Parent Company's internal control.
• Evaluate the appropriateness of accounting policies used and the reasonableness of accounting estimates and re-lated disclosures made by Management.
• Conclude on the appropriateness of Management's use of the going concern basis of accounting in preparing the financial statements and, based on the audit evidence obtained, whether a material uncertainty exists related to events or conditions that may cast significant doubt on the Group's and the Parent Company's ability to con-tinue as a going concern. If we conclude that a material uncertainty exists, we are required to draw attention in our auditor's report to the related disclosures in the fi-nancial statements or, if such disclosures are inadequate,
to modify our opinion. Our conclusions are based on the audit evidence obtained up to the date of our auditor's report. However, future events or conditions may cause the Group and the Parent Company to cease to continue as a going concern.
• Evaluate the overall presentation, structure and contents of the financial statements, including the note disclo-sures, and whether the financial statements represent the underlying transactions and events in a manner that gives a true and fair view.
• Obtain sufficient appropriate audit evidence regarding the financial information of the entities or business activi-ties within the Group to express an opinion on the consol-idated financial statements. We are responsible for the direction, supervision and performance of the group au-dit. We remain solely responsible for our audit opinion.
We communicate with those charged with governance re-garding, among other matters, the planned scope and timing of the audit and significant audit findings, including any signif-icant deficiencies in internal control that we identify during our audit.
We also provide those charged with governance with a state-ment that we have complied with relevant ethical require-ments regarding independence, and to communicate with them all relationships and other matters that may reasonably be thought to bear on our independence, and where applica-ble, related safeguards.
From the matters communicated with those charged with governance, we determine those matters that were of most significance in the audit of the consolidated financial state-ments and the parent company financial statements of the current period and are therefore the key audit matters. We describe these matters in our auditor's report unless law or regulation precludes public disclosure about the matter or when, in extremely rare circumstances, we determine that a matter should not be communicated in our report because the adverse consequences of doing so would reasonably be expected to outweigh the public interest benefits of such communication.
Copenhagen, February 7, 2018 ERNST & YOUNG Godkendt Revisionspartnerselskab CVR no. 30 70 02 28 Torben Bender Jens Thordahl Nøhr State Authorised State Authorised Public Accountant Public Accountant MNE no. 21332 MNE no. 32212

117 Management's report ⋅ Contents
GN Group – Annual Report 2017
GN Store Nord A/S
Lautrupbjerg 7 2750 Ballerup Denmark Co. reg. no 24257843 +45 45 75 00 00 [email protected] gn.com