heat and mass transfer modeling in vacuum insulation ... · heat and mass transfer modeling in...
TRANSCRIPT
HEAT AND MASS TRANSFER MODELING IN VACUUM INSULATION PANELS,TOWARDS LONG TERM THERMAL PERFORMANCE SIMULATION
Mathias Bouquerel1,2, Thierry Duforestel1, Dominique Baillis 2 and Frédéric Kuznik2
1EDF R&D, Moret-sur-Loing, France2INSA-LYON, Villeurbanne, France
ABSTRACTA Vacuum Insulation Panel is a very efficient thermalinsulation system for buildings, but its durability hasto be carefully examinated to ensure a long term per-formance. Heat and mass transfer models for VIPsare detailed in this paper: the parallel fluxes model forthermal conductivity, the sorption-diffusion and dualmode models for gas permeation. The limits of theSorption-Diffusion model are illustrated thanks to ex-perimental data. Long term simulations are conductedbased on these models. They show a long term behav-ior hard to predict from short term expriments if themass transfer mechanisms are not well understood.
INTRODUCTIONThe thermal insulation system called Vacuum Insula-tion Panel (VIP) is a very promising technology to de-crease the energy used for buildings’ heating and cool-ing. Conventional insulation materials use static airconfined in a macroporous material (fibers, foams...)to get a thermal conductivity around 30-40 mW/(m.K).In a VIP, the pressure of the gaseous phase is decreaseduntil a required vacuum level, and the apparent con-ductivity decreases as well, thanks to the gas confine-ment. The low pressure is maintained with an airthightand water tight envelope (see Fig. 1). A total conduc-tivity as low as 5 mW/(m.K) has been measured onpanels built from nanoporous silica and multilayer Al-coated polymer foils (Simmler et al., 2005).
Figure 1: Constitution of a VIP (Tenpierik et al., 2007)
The high level of thermal performance must be consid-ered together with the issue of durability. Heat trans-fer modeling can predict the apparent conductivity asa function of external and internal physical conditions,mostly internal pressure and humidity. Mass modelingis needed to predict the evolution of these conditions,which is a rather big challenge for the lifetime predic-
tion of these systems.
HEAT TRANSFER MODELINGHeat transfer in the core material
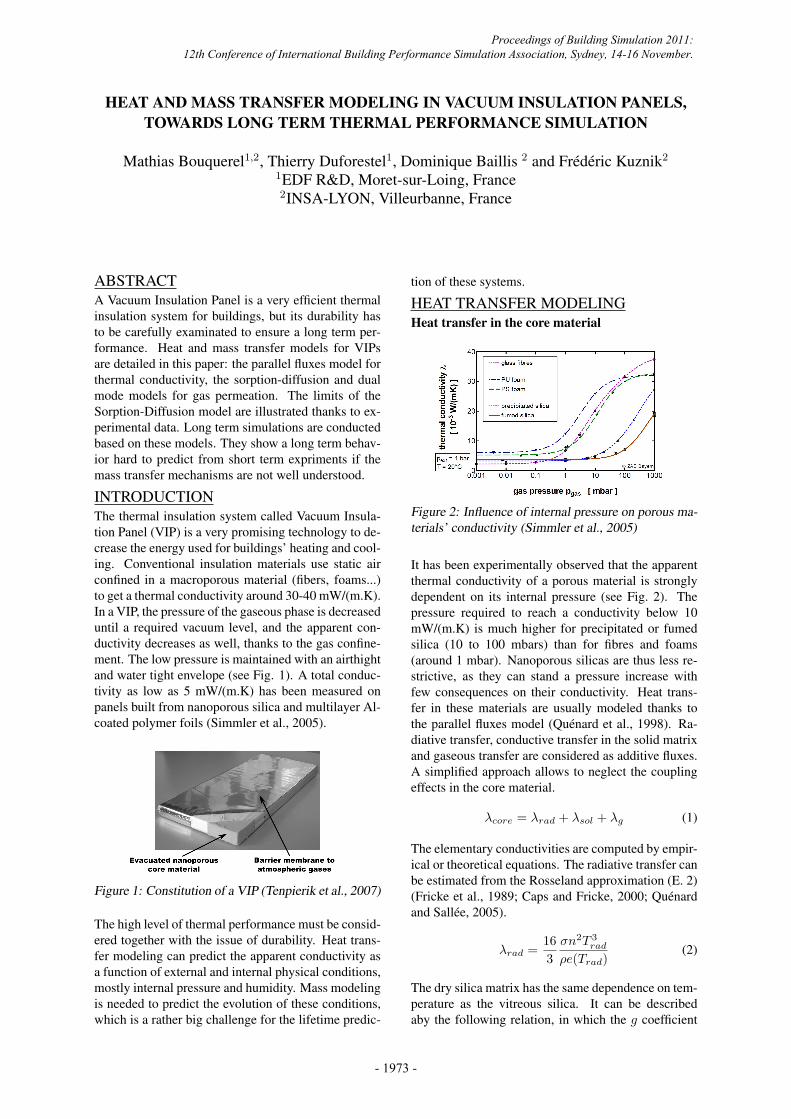
Figure 2: Influence of internal pressure on porous ma-
terials’ conductivity (Simmler et al., 2005)
It has been experimentally observed that the apparentthermal conductivity of a porous material is stronglydependent on its internal pressure (see Fig. 2). Thepressure required to reach a conductivity below 10mW/(m.K) is much higher for precipitated or fumedsilica (10 to 100 mbars) than for fibres and foams(around 1 mbar). Nanoporous silicas are thus less re-strictive, as they can stand a pressure increase withfew consequences on their conductivity. Heat trans-fer in these materials are usually modeled thanks tothe parallel fluxes model (Quénard et al., 1998). Ra-diative transfer, conductive transfer in the solid matrixand gaseous transfer are considered as additive fluxes.A simplified approach allows to neglect the couplingeffects in the core material.
λcore = λrad + λsol + λg (1)
The elementary conductivities are computed by empir-ical or theoretical equations. The radiative transfer canbe estimated from the Rosseland approximation (E. 2)(Fricke et al., 1989; Caps and Fricke, 2000; Quénardand Sallée, 2005).
λrad =16
3
σn2T
3rad
ρe(Trad)(2)
The dry silica matrix has the same dependence on tem-perature as the vitreous silica. It can be describedaby the following relation, in which the g coefficient
Proceedings of Building Simulation 2011: 12th Conference of International Building Performance Simulation Association, Sydney, 14-16 November.
- 1973 -

has been experimentaly determined between 0.001 and0.0025 (Scheuerpflug et al., 1992; Caps et al., 2001).
λsol,dry(T ) = gλsil(T ) = g[(−8, 5.10−12
)T4
+ (2, 1.10−8
)T3 − (1, 95.10
−5)T
2+ 0, 00883T ]
(3)
The water adsorbed at the surface of the silica has astrong influence on the matrix conductivity. Some ex-periments have shown a linear dependence betweenthe mass water content u (kgwater/kgsilica) and theadditionnal conductivity (Quénard and Sallée, 2005;Schwab et al., 2005a; Heinemann, 2008):
∂λsol
∂u= B (4)
The Knudsen number Kn = L/δ in a nanoporous sil-ica is close to 1 at atmospheric pressure: mean poresize (δ=100 nm) and mean free path of air molecules(L=75 nm at 300k and 1 bar) are in the same order ofmagnitude. The gaseous heat transfer is reduced, evenmore when the pressure decreases and Kn increasesin the meantime. Kanager (Kaganer, 1969) and otherauthors afterwards (Quénard and Sallée, 2005; Frickeet al., 2006) have used the Knudsen relation:
λg =λ
0g(T )
1 + 2βKn
(5)
λ0g
is the conductivity of non confined air, and β valueis 1.5. The mean free path can be calculated from
L =κBT√2πd2
gp
(6)
Eq. (5) can thus be written in a more convenient way:
λg(T, pint) =λ
0g(T )
1 +p1/2(T )
pint
(7)
p1/2(T ) is a fitting pressure corresponding to half ofthe non confined conductivity.
Membrane thermal bridgeThe membrane on the edge of the panel creates a ther-mal bridge. The total conductivity of the panel can bewritten as the sum of the core material conductivityλcore and an additive apparent conductivity λmemb.
λtot = λcore + λmemb (8)
Two membrane families are considered for VIPs inbuilding application. The AF membranes are lami-nated aluminium foils, typically between 5 and 10 µm
thickness, protected on each side by a polymer thinfoil (PE, PET). The MF membranes are multilayer Al-coated foils, typically made from two or three poly-mer foils (PE, PET) coated with aluminium (20 to100 nm thick), and glued to form a sandwich mem-brane. Their structures are illustrated on Fig. 3. In
moderate temperature and humidity, the barrier prop-erties of both kinds of membranes are close (Schwabet al., 2005b). In Tab. 1, the relative increase of thetotal conductivity of a panel due to the membrane isreported (Ghazi Wakili et al., 2004; Schwab et al.,2005e). These results have been obtained for a 1 m
2
and 2 cm thick square panel. The use of a MF envelopeleads to a limited conductivity increase, around 20%,whereas the increase for AF envelopes varies between100 and 200%.
Figure 3: AF and MF membranes
Table 1: Relative increase of VIP’s thermal conduc-
tivity due to the membrane thermal bridge (panel size
100x100x2cm)
Data set AF envelopes MF envelopesexperimental +96% +13% +19%
numerical +82% +210% +0% +28%
Considering the thermal approach, MF envelopes aremuch more efficient. Obviously the AF membranesare penalized since they induce a heat transfer as im-portant as the one through the core material. The ques-tion of the MF long term barrier properties should beconsidered precisely, to get a garantee that these en-velopes can be used in building applications.
Total apparent conductivity, ageing processThe total apparent conductivity of a VIP is:
λtot(T, pint, u) =16
3
σn2T
3rad
ρe(Trad)+ gλsil(T ) + Bu
+λ
0g(T )
1 +p1/2(T )
pint
+ λmemb(T ) (9)
Tab. 2 and 3 give indicative values for the parametersand elementary conductivities, for T=293K, pint =
1 mbar and u < 0.01%.
Table 2: Indicative parameters for Eq. (9)
(ρe)/n2
g B p1/2
[m−1
] [adim.] [W/(m.K.%)] [mbar]11 000 2.2× 10
−310
−3600
The temperature, internal pressure and humidity arethe key parameters that influence the conductivity. Butchanges of these parameters have different timescales,causes and effects. Temperature changes are bounded
Proceedings of Building Simulation 2011: 12th Conference of International Building Performance Simulation Association, Sydney, 14-16 November.
- 1974 -

Table 3: Elementary conductivities [mW/(m.K)]
λrad λsol λg λmemb
0.7 3.0 0.04 1
and mostly due to the weather and the heating or cool-ing system in the buildings. Internal pressure and hu-midity changes are due to the mass transfer through thebarrier membrane, from the external environment tothe panel internal core. The gas transmission rates canbe very low, around 10
−13kg/(m
2·s) for dry air and10
−11kg/(m
2·s) for water vapor, but they are stronglyinfluenced by the temperature and humidity and can bemuch higher (Schwab et al., 2005b).Mass transfers occur until an equilibrium is reachedfor pressure and humidity. In this case the vacuum in-sulation panel has totally lost its super insulation prop-erties, so it must happen long time after the end of theservicelife. It is possible to separarate the influence ofvariables, that is the temperature which has an instan-taneous and not ageing effect, and internal pressureand humidity that are the main factors of thermal per-formance deterioration (Simmler and Brunner, 2005;Schwab et al., 2005c). The prediction of the ther-mal conductivity increase is possible if a mass transfermodel for the barrier membrane is coupled with theheat transfer model, to estimate the internal pressureand humidity changes in time.
MASS TRANSFER MODELINGThe mass transfer process through membranes are notknown in details for two main reasons: these mate-rials are multilayers, and the gas transmission ratesare so small that the limits of metrology capacities arereached in most cases (Simmler et al., 2005).
SD model: linear Sorption and Diffusion
Figure 4: Gas transport through the membrane
The model of linear sorption and diffusion is usuallyused for the transport of pure gas through a homoge-neous and dense polymer foil between two gaseousphases (see Fig. 4) (Wijmans and Baker, 1995). Thediffusion of the gas i inside the membrane creates asurfacic flux Ji, which can be written according toFick’s Law, for the 1D problem, as:
Ji = −Di
∂ci
∂x(10)
The diffusion coefficient Di is dependent on thegas/polymer couple. The sorption at the mem-brane/gas interface depends on Henry’s Law, whichassumes a proportionnality between the concentra-tion in the membrane and the partial pressure in thegaseous phase at given temperature. The solubility co-efficient Si depends also on the gas/polymer couple.
ci = Sipi (11)
The coefficients Di and Si are assumed to be only de-pendent on the gas/polymer couple and the tempera-ture, according to the Arrhenius equation:
Di = D0iexp(−E
D
a/(RT )) (12)
Si = S0i
exp(−HS/(RT )) (13)
For an isothermal and steady state configuration,Fick’s Law can be integrated between the interfacesof the membrane (thickness l), so that the mass flowrate is a function of the pressure difference:
Ji = Di
ci,1 − ci,2
l= Di
Si(pi,1 − pi,2)
l(14)
The permeability Pei (intrinsic property of an equiv-alent homogeous material) and the permeance Πi (in-trinsic property of the membrane) can be calculated:
Pei = DiSi = Pe0iexp(−(E
D
a+ HS)/(RT ))
(15)
Πi =DiSi
l= Π
0iexp(−(E
D
a+ HS)/(RT ))
(16)
The surfacic flux Ji can then be expressed as:
Ji = −Pei
l∆pi (17)
Ji = −Πi∆pi (18)
The activation energy of the permeability and perme-ance is given by:
EP
a= E
D
a+ HS (19)
DM model: Dual Mode sorption and diffusion
The linear SD model is usually applied to mass trans-fer in elastomers. For semi-crystalline thermoplasticslike PE, PET or PP, an other model has been devel-oped, called the Dual Mode model (Kanehashi and Na-gai, 2005; Lin and Chung, 2001; Islam and Buschatz,2002). The principle is that a second sorption modeand a second diffusion mode are added to Henry’ssorption and the fickian diffusion. The additional sorp-tion mode follows the Langmuir adsorption model,and is responsible of a "Langmuir concentration" cH :
cH =c�H
bpi
1 + bpi
(20)
Proceedings of Building Simulation 2011: 12th Conference of International Building Performance Simulation Association, Sydney, 14-16 November.
- 1975 -

c�H
and b are respectively the Langmuir capacity andaffinity parameters. The total concentration is the sumof Langmuir’s concentration and Henry’s concentra-tion cD = SD pi (Eq. (11)):
ci = cD + cH (21)
The diffusion is still assumed to be linear, but witha different coefficient: DD for Henry’s concentrationand DH for Langmuir’s concentration. The surfacicmass flow rate is thus:
Ji =DDSD
l(pi,1 − pi,2) (22)
+DH
l
�c�H
bpi,1
1 + bpi,1− c
�H
bpi,2
1 + bpi,2
�(23)
If pi,2 << pi,1, then the equation is simpler:
Ji =1
l
�DDSDpi,1 +
DHc�H
bpi,1
1 + bpi,1
�(24)
Coupled Dual Mode model
Both SD and DM models detailed above consider eachgas flow as an independent phenomenon, with no cou-pling between gases which are transported through themembrane. The dual mode model has been adapted toinclude a coupling effect. This is assumed to only oc-cur on Langmuir’s mode, for which the different gasescompete for the same sorption sites (Koros, 1980;Banerjee and Lipscomb, 1994). For a binary mixtureof gases i and j, Langmuir’s concentration is:
ci,H =c�i,H
bipi
1 + bipi + bjpj
(25)
The surfacic flux is then equal to:
Ji =DDSD
l(pi,1 − pi,2) (26)
+DH
l
�c�i,H
bipi,1
1 + bipi,1 + bjpj,1−
c�i,H
bipi,2
1 + bipi,2 + bjpj,2
�
(27)
If pi,2 << pi,1 and pj,2 << pj,1, the equation is sim-pler:
Ji =1
l
�DDSDpi,1 +
DHc�i,H
bipi,1
1 + bipi,1 + bjpj,1
�(28)
AGEING MODELING AND LIMITSUsual hypothesesSo far, mass transfer modeling applied to VIPs’ ageinghas been based on the linear sorption/diffusion model(Simmler et al., 2005; Schwab et al., 2005d,c; Simm-ler and Brunner, 2005). The hypotheses commonly as-sumed can be listed as follows:
1. Internal and external gaseous phases are binarymixtures of dry air and water vapor (ideal gases)
2. The total gas transmission rate GTRtot of eachgas is the sum of the panel faces’ contributionGTRsurf (dependent on the area A and the sur-face flow rate Jsurf ) and the edges’ contributionGTRlin (dependent on the perimeter P and thelinear flow rate Jlin).
GTRtot = GTRsurf+GTRlin = AJsurf+PJlin
(29)3. The mass flow rates follows the linear SD model
Jsurf = −Πsurf∆pi (30)Jlin = −Πlin∆pi (31)
4. Permeances are independent of the gas composi-tion
5. Permeances are only dependent on the tempera-ture (Arrhenius equation)
Πi = Π0iexp(−E
P
a/(RT ) (32)
ZAE Bayern data identification
An ageing experiment on VIPs has been conducted ina German laboratory, ZAE Bayern, in order to measurethe barrier properties of different membranes (Schwabet al., 2005b). Three membranes have been tested:an aluminium laminated foil AF, and two multilayermembranes, MF1 (low quality) and MF2 (high qual-ity). Two square panel dimensions have been testedfor each membrane, sized 10x10x2 cm3 and 20x20x2cm3, and put in climatic rooms with different temper-atures and humidities (see Tab. 4) during 300 days.
Table 4: Configurations of the climatic rooms
Climatic Temperature Relative Water vaporRoom Humidity pressure
1 25 °C 45 % RH 1400 Pa2 45 °C 16 % RH 1400 Pa3 65 °C 6 % RH 1400 Pa4 25 °C 75 % RH 2350 Pa5 45 °C 75 % RH 7100 Pa
Mass and pressure have been regularly recorded. Fromthese data, water vapor and dry air transmission rates(WVTR and ATR) have been calculated by the labora-tory team, considering that mass increase is only dueto water income, and that the internal pressure is thesum of the dry air partial pressure and the water vaporpartial pressure. The water vapor pressure is calcu-lated from the water content and the linearized sorp-tion isotherm of core material.Duforestel and Kherrouf (2010) have developed amore accurate method to compute water and dry airflow rates, based on an equation system involvinggaseous dry air pressure, water vapor pressure, and thelinearized sorption isotherm. The identification of theWVTR and ATR by this method has shown that the
Proceedings of Building Simulation 2011: 12th Conference of International Building Performance Simulation Association, Sydney, 14-16 November.
- 1976 -

water vapor pressure is indeed not negligible in the to-tal internal pressure, but also that the dry air mass isnot negligible in the total mass increase (see few re-sults in Tab. 5), which never taken into account.
Table 5: Dry air and water vapor participation in mass
flow and pressure increase
CR Size air in total pvap in ptot
[cm2] mass flow, AF increase, MF21 6.3% 10.3%2 22.3% 12.3%3 10x10 24.3% 6.6%4 4.7% 59.5%5 3.6% 49.2%
Faces and edges contributions in the total mass flowrates are computed from Eq. (29) and the measure-ments on the two panel sizes. For dry air, the surfacemass flow rate appears to be negligible or slightly neg-ative: it is thus assumed that Jsurf = 0 and Jlin,i =
GTRtot,i/P . Concerning water vapor, the behavioris different for each membrane. For the AF envelope,the mass transfer occurs only through the faces for lowhumidity (<45% RH) and through the edges for highhumidity (75 % RH). For the MF envelopes, the flowmay be only through faces, only through edges, or dueto both parts of the envelope. Depending on the case,one of the following equations is used:
Jsurf,i = GTRtot,i/A (33)Jlin,i = GTRtot,i/P (34)
Jsurf,i =(A20GTRtot,i,10 −A10GTRtot,i,20)
(A20P10 −A10P20)
(35)
Jlin,i =(P20GTRtot,i,10 − P10GTRtot,i,20)
(P20A10 − P10A20)(36)
The permeances associated to these mass flow rates arecomputed from Eq. (30) and (31). Measurements ofthe rooms 1-2-3 (constant vapor pressure) are used tocompute the activation energies, thanks to a the linearregression of Eq. (32):
EΠa
= − ∂ ln(Πi)
∂(1/RT )(37)
Illustration of the common approach limitsThe Fig. 5 plots the influence of the relative humidityon the dry air linear permeance, at constant tempera-ture for AF, MF1 and MF2 membranes, and for bothsize panels. The value of the permeance is stronglychanged with humidity: the increase between low andhigh humidity is between 0 and +50% at 25 °C, andbetween 0 and +150% at 45 °C. This coupling is nottaken into account in the hypotheses listed above.For the MF membranes, the permeance to water vaporis influenced by relative humidity in a stronger way(see Fig. 6). A +45 to +1000% increase is observed on
Figure 5: Relative humidity and dry air permeance
this membrane property when the humidity is shiftedfrom the low to the high value.From those observations on Fig. 5 and 6, it is clearthat mass transfer has to be considered as a coupledphenomenon, and that the linear SD model with a con-stant permeance for each gas is not able to reproduceexperimental facts. The humidity has a main role isthe phenomenon. The influence of dry air pressurecould not be evaluated since all measurements havebeen made at atmospheric pressure.
(a) Surface Permance
(b) Linear PermanceFigure 6: Relative humidity and water vapor perme-
ance
The influence of temperature may also be questioned.Activation energies identified with Eq. (37) are listedin Tab. 6, with their correlation coefficients R
2. Fordry air, regressions give good results in term of orderof magnitude, consistency between both panel sizes,and correlation coefficients. For water vapor however,these three criteria are fairly bad.An alternative model has been tested, which assumesthat the relative humidity gradient is the drive for wa-ter vapor flow instead of the partial pressure gradient,
Proceedings of Building Simulation 2011: 12th Conference of International Building Performance Simulation Association, Sydney, 14-16 November.
- 1977 -
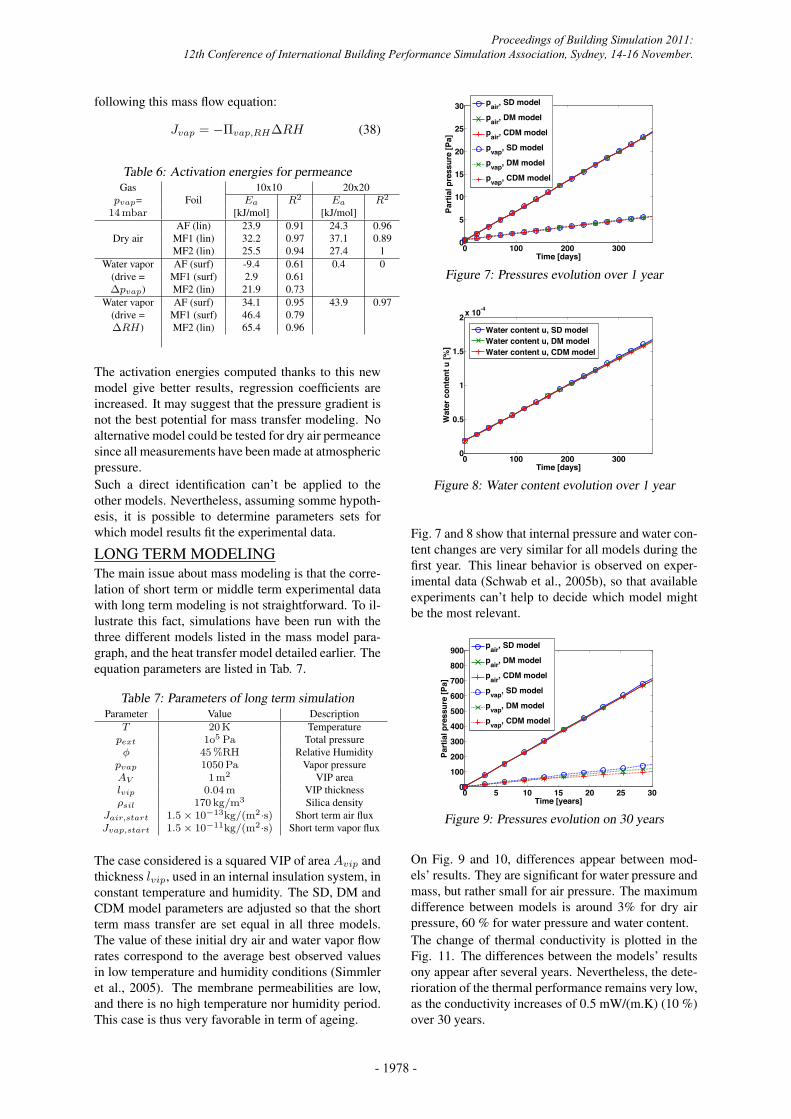
following this mass flow equation:
Jvap = −Πvap,RH∆RH (38)
Table 6: Activation energies for permeance
GasFoil
10x10 20x20pvap= Ea R
2Ea R
2
14 mbar [kJ/mol] [kJ/mol]
Dry airAF (lin) 23.9 0.91 24.3 0.96
MF1 (lin) 32.2 0.97 37.1 0.89MF2 (lin) 25.5 0.94 27.4 1
Water vapor AF (surf) -9.4 0.61 0.4 0(drive = MF1 (surf) 2.9 0.61∆pvap) MF2 (lin) 21.9 0.73
Water vapor AF (surf) 34.1 0.95 43.9 0.97(drive = MF1 (surf) 46.4 0.79∆RH) MF2 (lin) 65.4 0.96
The activation energies computed thanks to this newmodel give better results, regression coefficients areincreased. It may suggest that the pressure gradient isnot the best potential for mass transfer modeling. Noalternative model could be tested for dry air permeancesince all measurements have been made at atmosphericpressure.Such a direct identification can’t be applied to theother models. Nevertheless, assuming somme hypoth-esis, it is possible to determine parameters sets forwhich model results fit the experimental data.
LONG TERM MODELINGThe main issue about mass modeling is that the corre-lation of short term or middle term experimental datawith long term modeling is not straightforward. To il-lustrate this fact, simulations have been run with thethree different models listed in the mass model para-graph, and the heat transfer model detailed earlier. Theequation parameters are listed in Tab. 7.
Table 7: Parameters of long term simulation
Parameter Value DescriptionT 20 K Temperature
pext 1o5Pa Total pressure
φ 45 %RH Relative Humiditypvap 1050 Pa Vapor pressureAV 1 m
2 VIP arealvip 0.04 m VIP thicknessρsil 170 kg/m
3 Silica densityJair,start 1.5× 10
−13kg/(m
2·s) Short term air fluxJvap,start 1.5× 10
−11kg/(m
2·s) Short term vapor flux
The case considered is a squared VIP of area Avip andthickness lvip, used in an internal insulation system, inconstant temperature and humidity. The SD, DM andCDM model parameters are adjusted so that the shortterm mass transfer are set equal in all three models.The value of these initial dry air and water vapor flowrates correspond to the average best observed valuesin low temperature and humidity conditions (Simmleret al., 2005). The membrane permeabilities are low,and there is no high temperature nor humidity period.This case is thus very favorable in term of ageing.
0 100 200 3000
5
10
15
20
25
30
Time [days]
Part
ial p
ress
ure
[Pa]
pair, SD model
pair, DM model
pair, CDM model
pvap, SD model
pvap, DM model
pvap, CDM model
Figure 7: Pressures evolution over 1 year
0 100 200 3000
0.5
1
1.5
2 x 10⁻⁴
Time [days]
Wat
er c
onte
nt u
[%]
Water content u, SD modelWater content u, DM modelWater content u, CDM model
Figure 8: Water content evolution over 1 year
Fig. 7 and 8 show that internal pressure and water con-tent changes are very similar for all models during thefirst year. This linear behavior is observed on exper-imental data (Schwab et al., 2005b), so that availableexperiments can’t help to decide which model mightbe the most relevant.
0 5 10 15 20 25 300
100
200
300
400
500
600
700
800
900
Time [years]
Part
ial p
ress
ure
[Pa]
pair, SD model
pair, DM model
pair, CDM model
pvap, SD model
pvap, DM model
pvap, CDM model
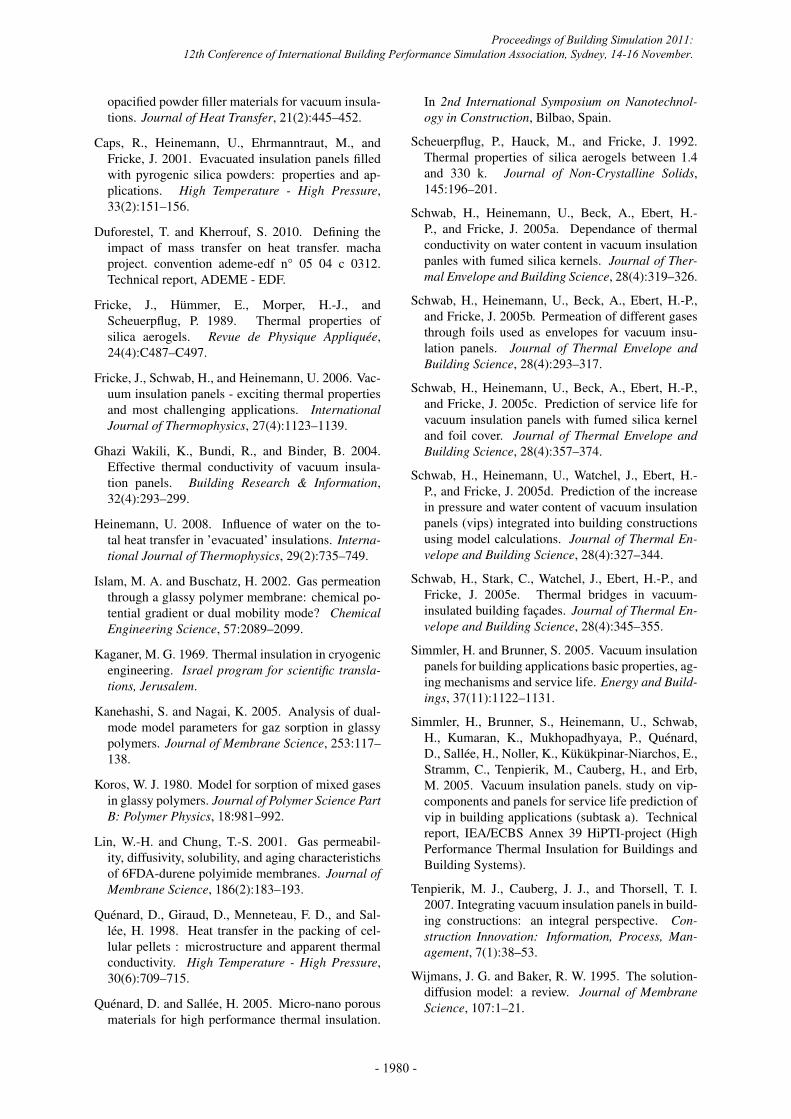
Figure 9: Pressures evolution on 30 years
On Fig. 9 and 10, differences appear between mod-els’ results. They are significant for water pressure andmass, but rather small for air pressure. The maximumdifference between models is around 3% for dry airpressure, 60 % for water pressure and water content.The change of thermal conductivity is plotted in theFig. 11. The differences between the models’ resultsony appear after several years. Nevertheless, the dete-rioration of the thermal performance remains very low,as the conductivity increases of 0.5 mW/(m.K) (10 %)over 30 years.
Proceedings of Building Simulation 2011: 12th Conference of International Building Performance Simulation Association, Sydney, 14-16 November.
- 1978 -

0 5 10 15 20 25 300
1
2
3
4
5 x 10⁻³
Time [years]
Wat
er c
onte
nt u
[%]
Water content u, SD modelWater content u, DM modelWater content u, CDM model
Figure 10: Water content evolution on 30 years
0 5 10 15 20 25 304.6
4.7
4.8
4.9
5
5.1
5.2 x 10⁻³
Time [years]
Tota
l the
rmal
con
duct
ivity
λλ λλto
t [W/(m
².K)]
λλλλtot, SD model
λλλλtot, DM model
λλλλtot, CDM model
Figure 11: Total conductivity evolution on 30 years
CONCLUSIONA VIP is a very efficient thermal insulation system,able to increase building energy efficiency without us-ing too much space. But its durability is based on itsability to prevent a vacuum degradation and a humid-ity increase. A semi-empirical heat transfer model canbe used to predict the thermal conductivity as a func-tion of temperature, internal pressure and water con-tent. Nevertheless, the Sorption/Diffusion model, amass transfer model commonly used for gas perme-ation through membranes, has not yet proved its abilityto reproduce with a decent accuracy the real behaviorof laminated and metallized barrier membranes. Alter-native models could be develop but there is a lack ofexperimental data to examine their relevance.The influence of humidity and temperature on the gaspermeation rates is so strong that, for building appli-cations that involve such conditions, a realistic masstransfer model is necessary to garantee the effectivethermal efficiency over the whole VIP’s service-life.The exploration of new models that are able to takeinto account the temperature influence as well as thecoupling effect between dry air and water vapor trans-fers is needed to ensure the developement of VIPs’technology.
REFERENCESBanerjee, T. and Lipscomb, G. G. 1994. Mixed gas
sorption in elastic solids. Journal of Membrane Sci-
ence, 96:241–258.
Caps, R. and Fricke, J. 2000. Thermal conductivity of
Table 8: NOMENCLATURE
Symbole Unit DescriptionA m
2 AreaATR kg/s Air Transmission Rate
B W/(m·K·%) Water conductivity coefficientb 1/Pa Langmuir affinity coefficientc kg/m
3 ConcentrationD m
2/s Diffusion coefficient
dg m Gas molecule efficient diameterEa kJ/mol Activation energye m
2/kg Specific extinction coefficient
g adim. Solid conduction coefficientHs kJ/mol Sorption enthalpie
GTR kg/s Gas Transmission RateJlin kg/(m·s) Linear mass flow rate
Jsurf kg/(m2·s) Surface mass flow rate
Kn adim. Knudsen numberκb J/K Boltzmann constantL m Mean Free Pathl m Thicknessn adim. Index of refractionP m Perimeter
Pelin kg/(s·Pa) Linear permeabilityPesurf kg/(m·s·Pa) Surface permeability
p Pa PressureR J/(K·mol) Ideal gas constantS kg/(m
3·Pa) Solubility coefficientT K Temperatureu % Water content
WV TR kg/s Water Vapor Transmission Rateβ adim. Knudsen equation parameterλ W/(m·K) Thermal conductivityρ kg/m
3 Densityσ W/(m
2·K4) Stefan-Boltzmann constant
δ m Characteristic pore sizeφ %RH Relative Humidity
Πlin kg/(m·s·Pa) Linear permeanceΠsurf kg/(m
2·s·Pa) Surface permeanceair Dry aircap Langmuir capacitycore Core materialD Henry’s mode
dry Dryg GasH Langmuir’s modei Gas i
int Internalj Gas j
lin Linearrad Radiativesil Silicasol Solid
surf Surfacestart Short term valuetot Totalvap Water vaporvip Vacuum Insulation Panel
Proceedings of Building Simulation 2011: 12th Conference of International Building Performance Simulation Association, Sydney, 14-16 November.
- 1979 -
opacified powder filler materials for vacuum insula-tions. Journal of Heat Transfer, 21(2):445–452.
Caps, R., Heinemann, U., Ehrmanntraut, M., andFricke, J. 2001. Evacuated insulation panels filledwith pyrogenic silica powders: properties and ap-plications. High Temperature - High Pressure,33(2):151–156.
Duforestel, T. and Kherrouf, S. 2010. Defining theimpact of mass transfer on heat transfer. machaproject. convention ademe-edf n° 05 04 c 0312.Technical report, ADEME - EDF.
Fricke, J., Hümmer, E., Morper, H.-J., andScheuerpflug, P. 1989. Thermal properties ofsilica aerogels. Revue de Physique Appliquée,24(4):C487–C497.
Fricke, J., Schwab, H., and Heinemann, U. 2006. Vac-uum insulation panels - exciting thermal propertiesand most challenging applications. International
Journal of Thermophysics, 27(4):1123–1139.
Ghazi Wakili, K., Bundi, R., and Binder, B. 2004.Effective thermal conductivity of vacuum insula-tion panels. Building Research & Information,32(4):293–299.
Heinemann, U. 2008. Influence of water on the to-tal heat transfer in ’evacuated’ insulations. Interna-
tional Journal of Thermophysics, 29(2):735–749.
Islam, M. A. and Buschatz, H. 2002. Gas permeationthrough a glassy polymer membrane: chemical po-tential gradient or dual mobility mode? Chemical
Engineering Science, 57:2089–2099.
Kaganer, M. G. 1969. Thermal insulation in cryogenicengineering. Israel program for scientific transla-
tions, Jerusalem.
Kanehashi, S. and Nagai, K. 2005. Analysis of dual-mode model parameters for gaz sorption in glassypolymers. Journal of Membrane Science, 253:117–138.
Koros, W. J. 1980. Model for sorption of mixed gasesin glassy polymers. Journal of Polymer Science Part
B: Polymer Physics, 18:981–992.
Lin, W.-H. and Chung, T.-S. 2001. Gas permeabil-ity, diffusivity, solubility, and aging characteristichsof 6FDA-durene polyimide membranes. Journal of
Membrane Science, 186(2):183–193.
Quénard, D., Giraud, D., Menneteau, F. D., and Sal-lée, H. 1998. Heat transfer in the packing of cel-lular pellets : microstructure and apparent thermalconductivity. High Temperature - High Pressure,30(6):709–715.
Quénard, D. and Sallée, H. 2005. Micro-nano porousmaterials for high performance thermal insulation.
In 2nd International Symposium on Nanotechnol-
ogy in Construction, Bilbao, Spain.
Scheuerpflug, P., Hauck, M., and Fricke, J. 1992.Thermal properties of silica aerogels between 1.4and 330 k. Journal of Non-Crystalline Solids,145:196–201.
Schwab, H., Heinemann, U., Beck, A., Ebert, H.-P., and Fricke, J. 2005a. Dependance of thermalconductivity on water content in vacuum insulationpanles with fumed silica kernels. Journal of Ther-
mal Envelope and Building Science, 28(4):319–326.
Schwab, H., Heinemann, U., Beck, A., Ebert, H.-P.,and Fricke, J. 2005b. Permeation of different gasesthrough foils used as envelopes for vacuum insu-lation panels. Journal of Thermal Envelope and
Building Science, 28(4):293–317.
Schwab, H., Heinemann, U., Beck, A., Ebert, H.-P.,and Fricke, J. 2005c. Prediction of service life forvacuum insulation panels with fumed silica kerneland foil cover. Journal of Thermal Envelope and
Building Science, 28(4):357–374.
Schwab, H., Heinemann, U., Watchel, J., Ebert, H.-P., and Fricke, J. 2005d. Prediction of the increasein pressure and water content of vacuum insulationpanels (vips) integrated into building constructionsusing model calculations. Journal of Thermal En-
velope and Building Science, 28(4):327–344.
Schwab, H., Stark, C., Watchel, J., Ebert, H.-P., andFricke, J. 2005e. Thermal bridges in vacuum-insulated building façades. Journal of Thermal En-
velope and Building Science, 28(4):345–355.
Simmler, H. and Brunner, S. 2005. Vacuum insulationpanels for building applications basic properties, ag-ing mechanisms and service life. Energy and Build-
ings, 37(11):1122–1131.
Simmler, H., Brunner, S., Heinemann, U., Schwab,H., Kumaran, K., Mukhopadhyaya, P., Quénard,D., Sallée, H., Noller, K., Kükükpinar-Niarchos, E.,Stramm, C., Tenpierik, M., Cauberg, H., and Erb,M. 2005. Vacuum insulation panels. study on vip-components and panels for service life prediction ofvip in building applications (subtask a). Technicalreport, IEA/ECBS Annex 39 HiPTI-project (HighPerformance Thermal Insulation for Buildings andBuilding Systems).
Tenpierik, M. J., Cauberg, J. J., and Thorsell, T. I.2007. Integrating vacuum insulation panels in build-ing constructions: an integral perspective. Con-
struction Innovation: Information, Process, Man-
agement, 7(1):38–53.
Wijmans, J. G. and Baker, R. W. 1995. The solution-diffusion model: a review. Journal of Membrane
Science, 107:1–21.
Proceedings of Building Simulation 2011: 12th Conference of International Building Performance Simulation Association, Sydney, 14-16 November.
- 1980 -