heat transfer augmentation in solar air heater using delta-shaped obstacles mounted on the absorber...
TRANSCRIPT
This article was downloaded by: [Linnaeus University]On: 17 October 2014, At: 08:05Publisher: Taylor & FrancisInforma Ltd Registered in England and Wales Registered Number: 1072954 Registeredoffice: Mortimer House, 37-41 Mortimer Street, London W1T 3JH, UK
International Journal of SustainableEnergyPublication details, including instructions for authors andsubscription information:http://www.tandfonline.com/loi/gsol20
Heat transfer augmentation in solar airheater using delta-shaped obstaclesmounted on the absorber plateAdisu Bekele a , Manish Mishra a & Sushanta Dutta aa Department of Mechanical and Industrial Engineering , IndianInstitute of Technology Roorkee , Roorkee-247667, IndiaPublished online: 05 Jul 2011.
To cite this article: Adisu Bekele , Manish Mishra & Sushanta Dutta (2013) Heat transferaugmentation in solar air heater using delta-shaped obstacles mounted on the absorber plate,International Journal of Sustainable Energy, 32:1, 53-69, DOI: 10.1080/14786451.2011.598637
To link to this article: http://dx.doi.org/10.1080/14786451.2011.598637
PLEASE SCROLL DOWN FOR ARTICLE
Taylor & Francis makes every effort to ensure the accuracy of all the information (the“Content”) contained in the publications on our platform. However, Taylor & Francis,our agents, and our licensors make no representations or warranties whatsoever as tothe accuracy, completeness, or suitability for any purpose of the Content. Any opinionsand views expressed in this publication are the opinions and views of the authors,and are not the views of or endorsed by Taylor & Francis. The accuracy of the Contentshould not be relied upon and should be independently verified with primary sourcesof information. Taylor and Francis shall not be liable for any losses, actions, claims,proceedings, demands, costs, expenses, damages, and other liabilities whatsoever orhowsoever caused arising directly or indirectly in connection with, in relation to or arisingout of the use of the Content.
This article may be used for research, teaching, and private study purposes. Anysubstantial or systematic reproduction, redistribution, reselling, loan, sub-licensing,systematic supply, or distribution in any form to anyone is expressly forbidden. Terms &Conditions of access and use can be found at http://www.tandfonline.com/page/terms-and-conditions
International Journal of Sustainable Energy, 2013Vol. 32, No. 1, 53–69, http://dx.doi.org/10.1080/14786451.2011.598637
Heat transfer augmentation in solar air heater usingdelta-shaped obstacles mounted on the absorber plate
Adisu Bekele, Manish Mishra* and Sushanta Dutta
Department of Mechanical and Industrial Engineering, Indian Institute of Technology Roorkee,Roorkee-247667, India
(Received 3 May 2011; final version received 13 June 2011)
An experimental investigation has been carried out to study the heat transfer augmentations by using delta-shaped obstacles mounted on the absorber surface of an air heater duct with an aspect ratio 6:1 resemblingthe conditions close to solar air heaters. The experiment encompasses the Reynolds number ranging from3400 to 28,000, obstacle longitudinal pitch (Pl/e) varying from 3
2 to 112 and relative obstacle height (e/H)
varying from 0.50 to 0.75, while relative obstacle transverse pitch (Pt/b) = 73 and the angle of attack of
flow on obstacle = 90◦ are kept constant during the whole experimentation. The maximum heat transferaugmented by using an obstacle-mounted duct was 3.6 times higher compared with a smooth duct undersimilar geometrical and flow conditions. A numerical analysis using FLUENT software has also been donefor further observation of heat transfer behaviour near the obstacles.
Keywords: solar air heater; obstacle; heat transfer augmentation; friction factor
Nomenclature
AC area of absorber plate (m2)
b base of obstacles (m)Cp specific heat of air (J/kg K)Dh equivalent hydraulic diameter of the air passage (m)e obstacle height (m)e/H relative obstacle heightf friction factorfo friction factor in the obstacle ductfs friction factor in a smooth ducth convective heat transfer coefficient (W/m2k)H duct height (m)k thermal conductivity of air (W/mK)L test section duct length (m)m mass flow rate of air (kg/s)Nu Nusselt number
*Corresponding author. Email: [email protected]
© 2013 Taylor & Francis
Dow
nloa
ded
by [
Lin
naeu
s U
nive
rsity
] at
08:
05 1
7 O
ctob
er 2
014
54 A. Bekele et al.
Nuo Nusselt number of the obstacle ductNus Nusselt number of the smooth ductPr Prandtl number�P pressure drop across the test section (Pa)Pl longitudinal space between rows of obstacles (m)Pt transverse distance between two obstacles (m)Pl/e relative obstacle longitudinal pitchPt/b relative obstacle transversal pitchRe Reynolds numberSt Stanton numberSto Stanton number of the obstacle ductSts Stanton number of the smooth ductTf average temperature of air (K)Tai bulk mean temperature of air at inlet (K)Tao bulk mean temperature of air at outlet (K)Tp average temperature of plate (K)W duct width (m)ρ density of air (kg/m3)
1. Introduction
The thermal efficiency of solar air heaters (SAHs) has been found to be generally poor because oftheir inherent low heat transfer capability between the absorber plate and air flowing in the duct,which increases the absorber plate temperature, leading to higher heat losses to the environmentresulting in low thermal efficiency of such collectors. Low heat transfer coefficients result fromthe poor thermal conductivity of air.
The main applications of SAHs are space heating and drying. The SAHs occupy an importantplace among solar heating systems because of the minimal use of materials.
In order to make the SAHs economically viable, their thermal efficiency needs to be improvedby enhancing the heat transfer coefficient, which can be achieved by creating a fully turbulentflow in these systems and minimizing the heat loss with appropriate pressure drop.
There are different factors affecting the SAH efficiency, e.g. collector length, collector depth,type of absorber plate, glass cover plate, wind speed, etc. (Kabeel and Mecarik 1998).
In order to increase the thermal performance of SAH, various designs with different shapesand dimensions of the air flow passage in flat plate-type solar air collectors have been developedin the literature (Dipprey and Sabersky 1963, Hollands and Shewan 1981, Choudhury and Garg1991, Hachemi 1995, Hegazy 2000, Yeh et al. 2000, Moummi et al. 2004).
The shape factor of the absorber plate is the most important parameter in the design of any typeof SAH. Increasing the absorber plate shape area will increase the heat transfer of the flowingair. On the other hand, it will also increase the pressure drop in the collector; this increases therequired power consumption to pump the air flow crossing the collector (Kabeel and Mecarik1998). The conventional SAHs are generally improved by means of various augmentation tech-niques with emphasis on several types of surface enhancements. Augmented surfaces can createone or more combinations of the following conditions that are favourable for the increase in heattransfer rate with an undesirable rise of friction: (1) interruption of boundary layer developmentand increasing turbulence intensity; (2) increase in heat transfer area and (3) generating of vortexand/or secondary flows (Nattawoot et al. 2010). Another method of improving the thermal per-formance of SAH is by the introduction of obstacles in the dynamic air vein of the collector whichcreates a turbulent flow and hence enhances the thermal energy exchange by convection and the
Dow
nloa
ded
by [
Lin
naeu
s U
nive
rsity
] at
08:
05 1
7 O
ctob
er 2
014
International Journal of Sustainable Energy 55
maximal extraction of the absorber energy can be obtained at the cost of higher increased pressuredrop. Esen (2008) compared the experimental results between SAH supplied with obstacles andthose without obstacles for the case of the double-flow SAHs and thus the influences of obstaclestypes, mass flow rate of air and the level of absorber plates in duct, on the energetic and exer-getic efficiencies of the SAHs were examined. Further, Ozgen et al. (2009) studied the thermalperformance of double-flow SAHs in which aluminium cans of different arrangements were usedas obstacle. This method substantially improves the collector efficiency by increasing the fluidvelocity and enhances the heat transfer coefficient between the absorber plate and air. The choiceof the geometrical shapes of the obstacles to be used has to satisfy some criteria as the form andthe disposition of the obstacles affect the air flow during its trajectory. The obstacles ensure a goodair flow over the absorber plate, create the turbulence and reduce the dead zones in the collector.
In the present work, the effect of relative obstacles height and relative obstacles longitudinalpitch on thermal performance of SAH with surface-mounted delta-shaped obstacles over a widerange of Reynolds number was investigated experimentally with further numerical analysis of heattransfer behaviour near obstacles. In addition, the thermal performances of SAH with surface-mounted obstacles were compared with those of smooth one.
2. Experimental programme
2.1. Experimental set-up
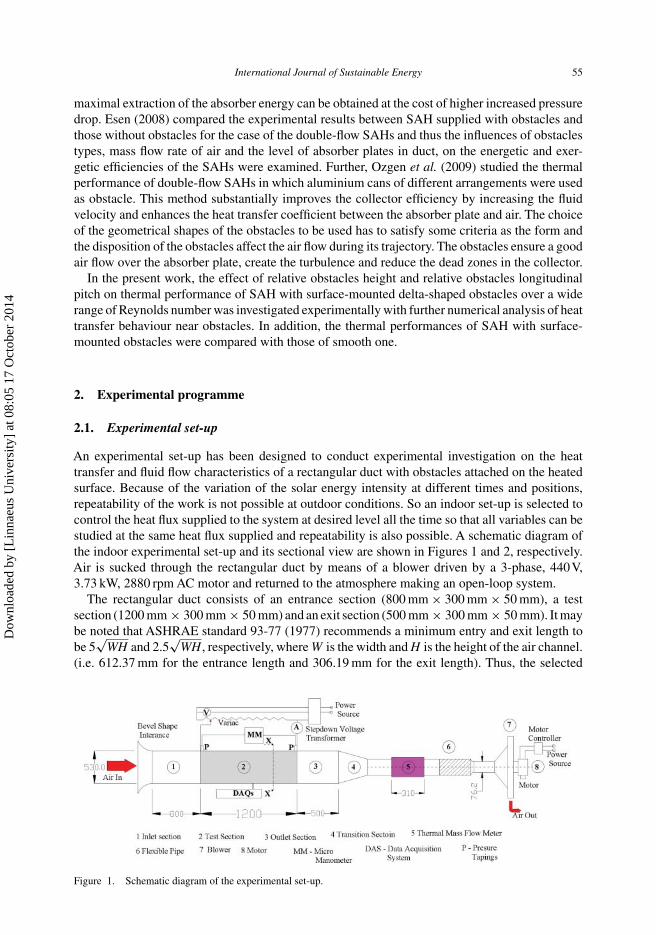
An experimental set-up has been designed to conduct experimental investigation on the heattransfer and fluid flow characteristics of a rectangular duct with obstacles attached on the heatedsurface. Because of the variation of the solar energy intensity at different times and positions,repeatability of the work is not possible at outdoor conditions. So an indoor set-up is selected tocontrol the heat flux supplied to the system at desired level all the time so that all variables can bestudied at the same heat flux supplied and repeatability is also possible. A schematic diagram ofthe indoor experimental set-up and its sectional view are shown in Figures 1 and 2, respectively.Air is sucked through the rectangular duct by means of a blower driven by a 3-phase, 440V,3.73 kW, 2880 rpm AC motor and returned to the atmosphere making an open-loop system.
The rectangular duct consists of an entrance section (800 mm × 300 mm × 50 mm), a testsection (1200 mm × 300 mm × 50 mm) and an exit section (500 mm × 300 mm × 50 mm). It maybe noted that ASHRAE standard 93-77 (1977) recommends a minimum entry and exit length tobe 5
√WH and 2.5
√WH , respectively, where W is the width and H is the height of the air channel.
(i.e. 612.37 mm for the entrance length and 306.19 mm for the exit length). Thus, the selected
Figure 1. Schematic diagram of the experimental set-up.
Dow
nloa
ded
by [
Lin
naeu
s U
nive
rsity
] at
08:
05 1
7 O
ctob
er 2
014
56 A. Bekele et al.
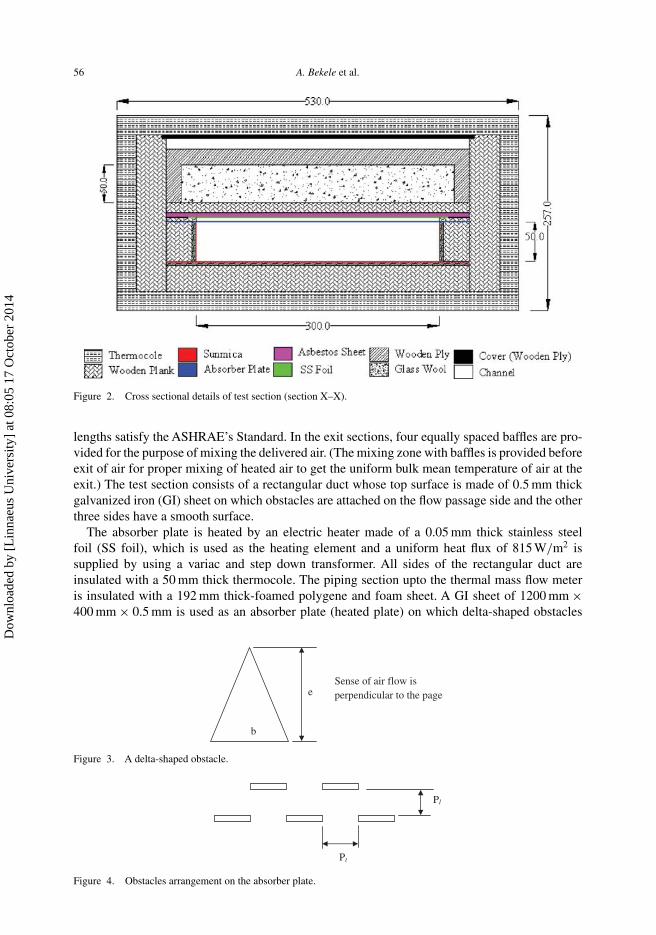
Figure 2. Cross sectional details of test section (section X–X).
lengths satisfy the ASHRAE’s Standard. In the exit sections, four equally spaced baffles are pro-vided for the purpose of mixing the delivered air. (The mixing zone with baffles is provided beforeexit of air for proper mixing of heated air to get the uniform bulk mean temperature of air at theexit.) The test section consists of a rectangular duct whose top surface is made of 0.5 mm thickgalvanized iron (GI) sheet on which obstacles are attached on the flow passage side and the otherthree sides have a smooth surface.
The absorber plate is heated by an electric heater made of a 0.05 mm thick stainless steelfoil (SS foil), which is used as the heating element and a uniform heat flux of 815 W/m2 issupplied by using a variac and step down transformer. All sides of the rectangular duct areinsulated with a 50 mm thick thermocole. The piping section upto the thermal mass flow meteris insulated with a 192 mm thick-foamed polygene and foam sheet. A GI sheet of 1200 mm ×400 mm × 0.5 mm is used as an absorber plate (heated plate) on which delta-shaped obstacles
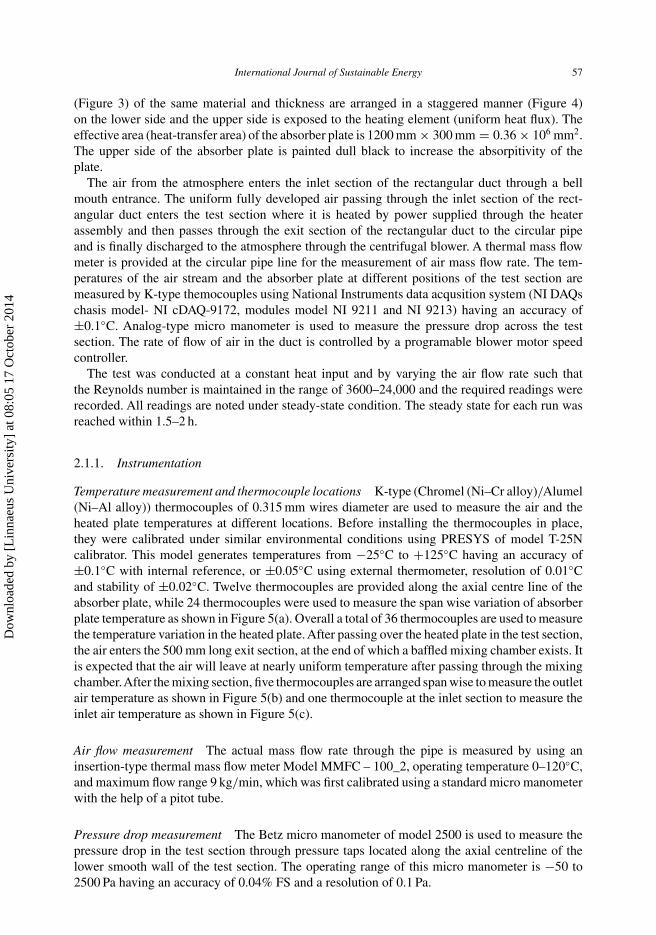
b
eSense of air flow is perpendicular to the page
Figure 3. A delta-shaped obstacle.
Pl
Pt
Figure 4. Obstacles arrangement on the absorber plate.
Dow
nloa
ded
by [
Lin
naeu
s U
nive
rsity
] at
08:
05 1
7 O
ctob
er 2
014
International Journal of Sustainable Energy 57
(Figure 3) of the same material and thickness are arranged in a staggered manner (Figure 4)on the lower side and the upper side is exposed to the heating element (uniform heat flux). Theeffective area (heat-transfer area) of the absorber plate is 1200 mm × 300 mm = 0.36 × 106 mm2.The upper side of the absorber plate is painted dull black to increase the absorpitivity of theplate.
The air from the atmosphere enters the inlet section of the rectangular duct through a bellmouth entrance. The uniform fully developed air passing through the inlet section of the rect-angular duct enters the test section where it is heated by power supplied through the heaterassembly and then passes through the exit section of the rectangular duct to the circular pipeand is finally discharged to the atmosphere through the centrifugal blower. A thermal mass flowmeter is provided at the circular pipe line for the measurement of air mass flow rate. The tem-peratures of the air stream and the absorber plate at different positions of the test section aremeasured by K-type themocouples using National Instruments data acqusition system (NI DAQschasis model- NI cDAQ-9172, modules model NI 9211 and NI 9213) having an accuracy of±0.1◦C. Analog-type micro manometer is used to measure the pressure drop across the testsection. The rate of flow of air in the duct is controlled by a programable blower motor speedcontroller.
The test was conducted at a constant heat input and by varying the air flow rate such thatthe Reynolds number is maintained in the range of 3600–24,000 and the required readings wererecorded. All readings are noted under steady-state condition. The steady state for each run wasreached within 1.5–2 h.
2.1.1. Instrumentation
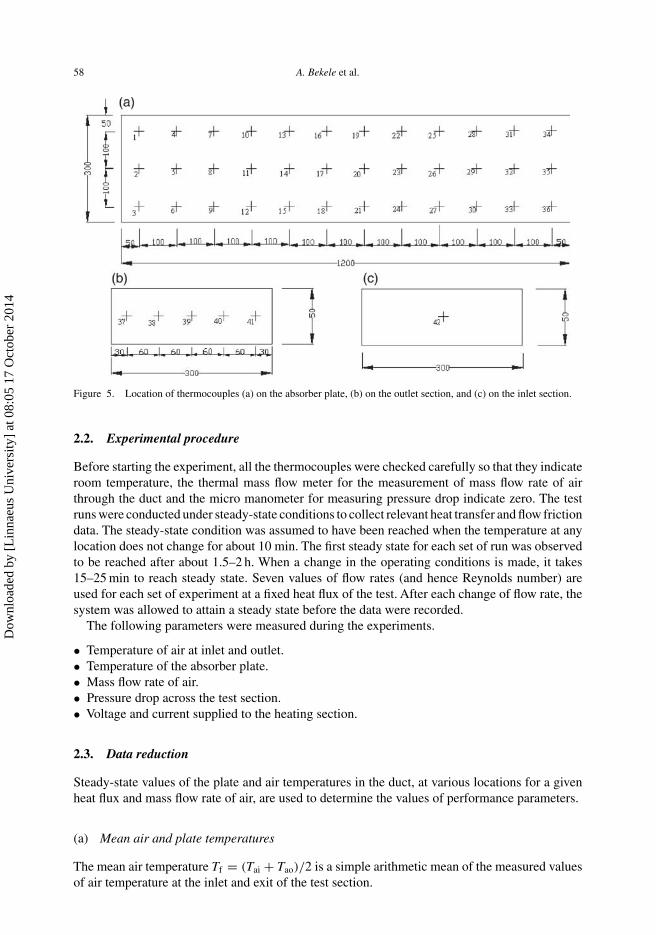
Temperature measurement and thermocouple locations K-type (Chromel (Ni–Cr alloy)/Alumel(Ni–Al alloy)) thermocouples of 0.315 mm wires diameter are used to measure the air and theheated plate temperatures at different locations. Before installing the thermocouples in place,they were calibrated under similar environmental conditions using PRESYS of model T-25Ncalibrator. This model generates temperatures from −25◦C to +125◦C having an accuracy of±0.1◦C with internal reference, or ±0.05◦C using external thermometer, resolution of 0.01◦Cand stability of ±0.02◦C. Twelve thermocouples are provided along the axial centre line of theabsorber plate, while 24 thermocouples were used to measure the span wise variation of absorberplate temperature as shown in Figure 5(a). Overall a total of 36 thermocouples are used to measurethe temperature variation in the heated plate. After passing over the heated plate in the test section,the air enters the 500 mm long exit section, at the end of which a baffled mixing chamber exists. Itis expected that the air will leave at nearly uniform temperature after passing through the mixingchamber.After the mixing section, five thermocouples are arranged span wise to measure the outletair temperature as shown in Figure 5(b) and one thermocouple at the inlet section to measure theinlet air temperature as shown in Figure 5(c).
Air flow measurement The actual mass flow rate through the pipe is measured by using aninsertion-type thermal mass flow meter Model MMFC – 100_2, operating temperature 0–120◦C,and maximum flow range 9 kg/min, which was first calibrated using a standard micro manometerwith the help of a pitot tube.
Pressure drop measurement The Betz micro manometer of model 2500 is used to measure thepressure drop in the test section through pressure taps located along the axial centreline of thelower smooth wall of the test section. The operating range of this micro manometer is −50 to2500 Pa having an accuracy of 0.04% FS and a resolution of 0.1 Pa.
Dow
nloa
ded
by [
Lin
naeu
s U
nive
rsity
] at
08:
05 1
7 O
ctob
er 2
014
58 A. Bekele et al.
Figure 5. Location of thermocouples (a) on the absorber plate, (b) on the outlet section, and (c) on the inlet section.
2.2. Experimental procedure
Before starting the experiment, all the thermocouples were checked carefully so that they indicateroom temperature, the thermal mass flow meter for the measurement of mass flow rate of airthrough the duct and the micro manometer for measuring pressure drop indicate zero. The testruns were conducted under steady-state conditions to collect relevant heat transfer and flow frictiondata. The steady-state condition was assumed to have been reached when the temperature at anylocation does not change for about 10 min. The first steady state for each set of run was observedto be reached after about 1.5–2 h. When a change in the operating conditions is made, it takes15–25 min to reach steady state. Seven values of flow rates (and hence Reynolds number) areused for each set of experiment at a fixed heat flux of the test. After each change of flow rate, thesystem was allowed to attain a steady state before the data were recorded.
The following parameters were measured during the experiments.
• Temperature of air at inlet and outlet.• Temperature of the absorber plate.• Mass flow rate of air.• Pressure drop across the test section.• Voltage and current supplied to the heating section.
2.3. Data reduction
Steady-state values of the plate and air temperatures in the duct, at various locations for a givenheat flux and mass flow rate of air, are used to determine the values of performance parameters.
(a) Mean air and plate temperatures
The mean air temperature Tf = (Tai + Tao)/2 is a simple arithmetic mean of the measured valuesof air temperature at the inlet and exit of the test section.
Dow
nloa
ded
by [
Lin
naeu
s U
nive
rsity
] at
08:
05 1
7 O
ctob
er 2
014
International Journal of Sustainable Energy 59
The mean plate temperature can be found from weighted average of the temperature of all platethermocouples. Tp = ∑n
i=1 Tpi/n, where n is the number of thermocouples on the absorber plate.
(b) Velocity of air through duct
The velocity of air flowing through the duct is calculated from the knowledge of mass flow rateand area of flow as
V = m
ρWH. (1)
(c) Equivalent hydraulic diameter
The hydraulic diameter of the rectangular section of the duct is defined as
Dh = 4(W · H)
2(W + H). (2)
(d) Reynolds number
The Reynolds number of air flow in the duct is calculated from
Re = VDh
v= ρVDh
μ, (3)
where v is the kinematic viscosity and μ the dynamic viscosity.
(e) Heat transfer coefficient
Steady-state values of the plate and air temperatures in the duct at various locations were used todetermine the values of useful parameters, namely heat supplied to the air ‘Qu’ and heat transfercoefficient ‘h’ calculated as
Qu = mCp(Tao − Tai), (4)
where m is directly measured by using the thermal mass flow meter
h = Qu
Ap(Tp − Tf), (5)
where Ap is the effective heat transfer area of the absorber plate.
(f) Nusselt number and Stanton number
The convective heat transfer coefficient is then used to obtain the Nusselt number, Nu, as
Nu = hDh
k, (6)
St = Nu
Re · Pr, (7)
where k is the thermal conductivity of air and Pr is the Prandtl number.
Dow
nloa
ded
by [
Lin
naeu
s U
nive
rsity
] at
08:
05 1
7 O
ctob
er 2
014
60 A. Bekele et al.
(g) Friction factor
The friction factor is determined from the measured values of pressure drop, (�P), across the testsection length
f = 2(�P)Dh
4ρLV 2or f = 2(�P)ρDh
4LG2, (8)
where G = m/WH is the mass velocity of air.
(h) Uncertainty
An experimentally measured value may differ from its true value due to the presence of randomerrors. Uncertainty is the possible value of the error. Thus, it is desirable to describe uncertainty ina measurement and to estimate as to how these individual uncertainties propagate in the calculatedresult.
From the analysis of uncertainties in the measurements by various instruments (Kline andMcClintock 1953), the maximum uncertainties in the calculated values of various parameters areas follows:
Reynolds number, Re = 0.0279 = 2.79%.Useful heat gain, Qu = 0.0444 = 4.44%.Heat transfer coefficient, h = 0.046 = 4.6%.Nusselt number, Nu = 0.046 = 4.6% .Stanton number, St = 0.047 = 4.7% .Friction factor, f = 1.84%.
2.4. Validity test for the smooth duct
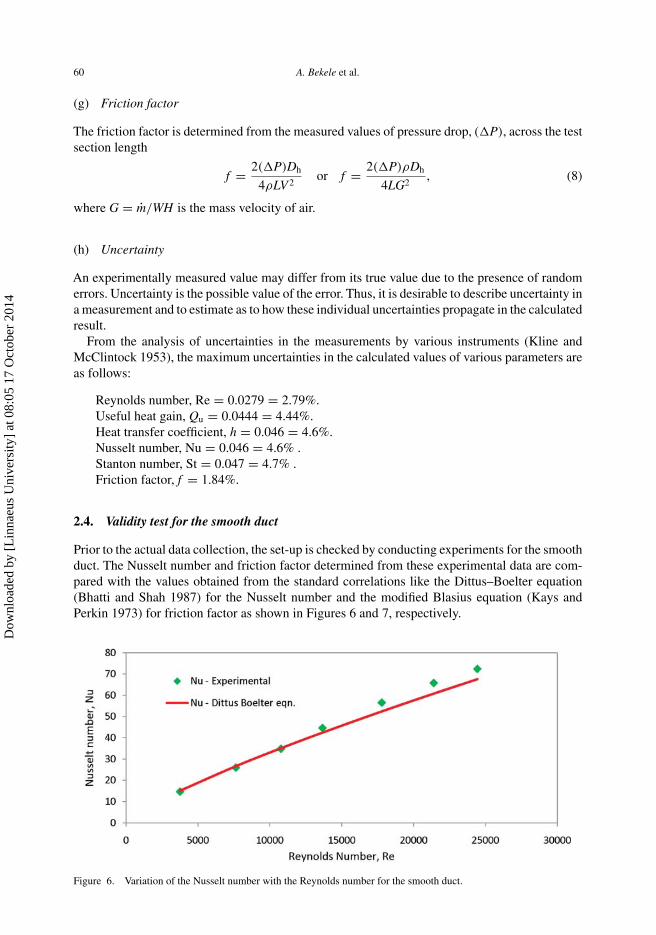
Prior to the actual data collection, the set-up is checked by conducting experiments for the smoothduct. The Nusselt number and friction factor determined from these experimental data are com-pared with the values obtained from the standard correlations like the Dittus–Boelter equation(Bhatti and Shah 1987) for the Nusselt number and the modified Blasius equation (Kays andPerkin 1973) for friction factor as shown in Figures 6 and 7, respectively.
Figure 6. Variation of the Nusselt number with the Reynolds number for the smooth duct.
Dow
nloa
ded
by [
Lin
naeu
s U
nive
rsity
] at
08:
05 1
7 O
ctob
er 2
014
International Journal of Sustainable Energy 61
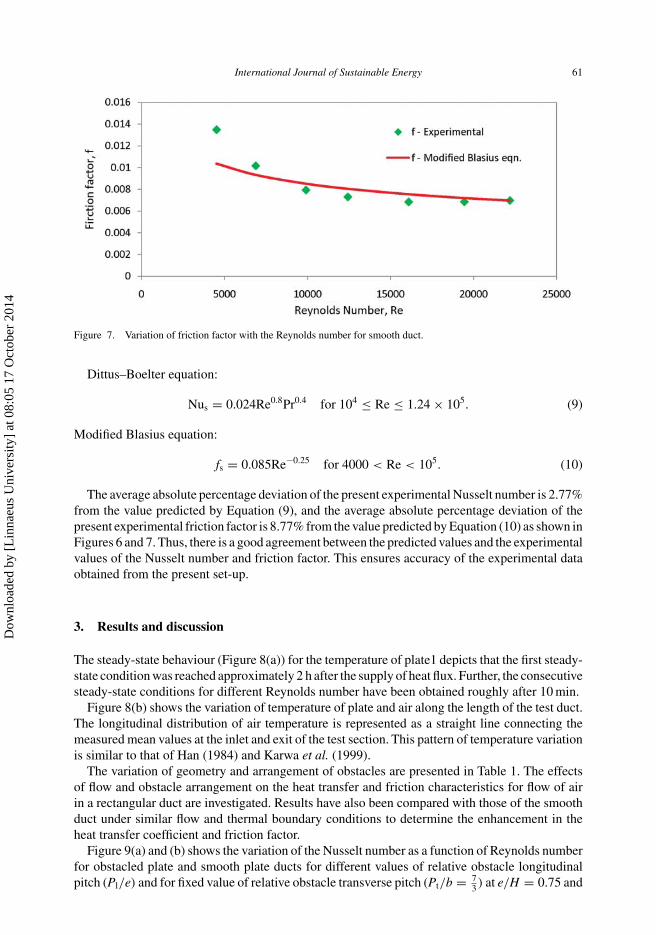
Figure 7. Variation of friction factor with the Reynolds number for smooth duct.
Dittus–Boelter equation:
Nus = 0.024Re0.8Pr0.4 for 104 ≤ Re ≤ 1.24 × 10⁵. (9)
Modified Blasius equation:
fs = 0.085Re−0.25 for 4000 < Re < 105. (10)
The average absolute percentage deviation of the present experimental Nusselt number is 2.77%from the value predicted by Equation (9), and the average absolute percentage deviation of thepresent experimental friction factor is 8.77% from the value predicted by Equation (10) as shown inFigures 6 and 7. Thus, there is a good agreement between the predicted values and the experimentalvalues of the Nusselt number and friction factor. This ensures accuracy of the experimental dataobtained from the present set-up.
3. Results and discussion
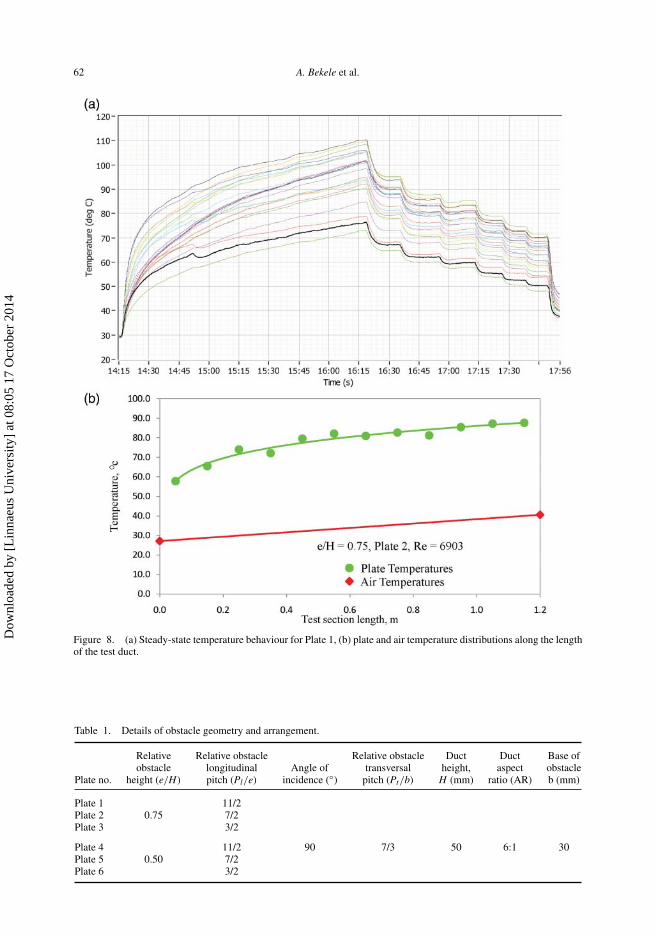
The steady-state behaviour (Figure 8(a)) for the temperature of plate1 depicts that the first steady-state condition was reached approximately 2 h after the supply of heat flux. Further, the consecutivesteady-state conditions for different Reynolds number have been obtained roughly after 10 min.
Figure 8(b) shows the variation of temperature of plate and air along the length of the test duct.The longitudinal distribution of air temperature is represented as a straight line connecting themeasured mean values at the inlet and exit of the test section. This pattern of temperature variationis similar to that of Han (1984) and Karwa et al. (1999).
The variation of geometry and arrangement of obstacles are presented in Table 1. The effectsof flow and obstacle arrangement on the heat transfer and friction characteristics for flow of airin a rectangular duct are investigated. Results have also been compared with those of the smoothduct under similar flow and thermal boundary conditions to determine the enhancement in theheat transfer coefficient and friction factor.
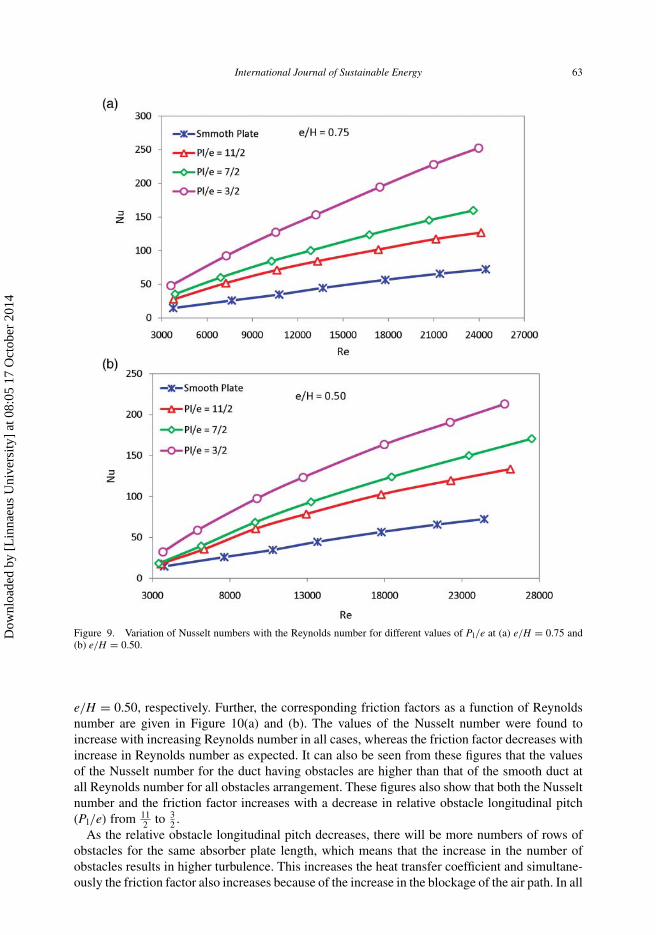
Figure 9(a) and (b) shows the variation of the Nusselt number as a function of Reynolds numberfor obstacled plate and smooth plate ducts for different values of relative obstacle longitudinalpitch (Pl/e) and for fixed value of relative obstacle transverse pitch (Pt/b = 7
3 ) at e/H = 0.75 and
Dow
nloa
ded
by [
Lin
naeu
s U
nive
rsity
] at
08:
05 1
7 O
ctob
er 2
014
62 A. Bekele et al.
Figure 8. (a) Steady-state temperature behaviour for Plate 1, (b) plate and air temperature distributions along the lengthof the test duct.
Table 1. Details of obstacle geometry and arrangement.
Relative Relative obstacle Relative obstacle Duct Duct Base ofobstacle longitudinal Angle of transversal height, aspect obstacle
Plate no. height (e/H) pitch (Pl/e) incidence (◦) pitch (Pt/b) H (mm) ratio (AR) b (mm)
Plate 1 11/2Plate 2 0.75 7/2Plate 3 3/2
Plate 4 11/2 90 7/3 50 6:1 30Plate 5 0.50 7/2Plate 6 3/2
Dow
nloa
ded
by [
Lin
naeu
s U
nive
rsity
] at
08:
05 1
7 O
ctob
er 2
014
International Journal of Sustainable Energy 63
Figure 9. Variation of Nusselt numbers with the Reynolds number for different values of Pl/e at (a) e/H = 0.75 and(b) e/H = 0.50.
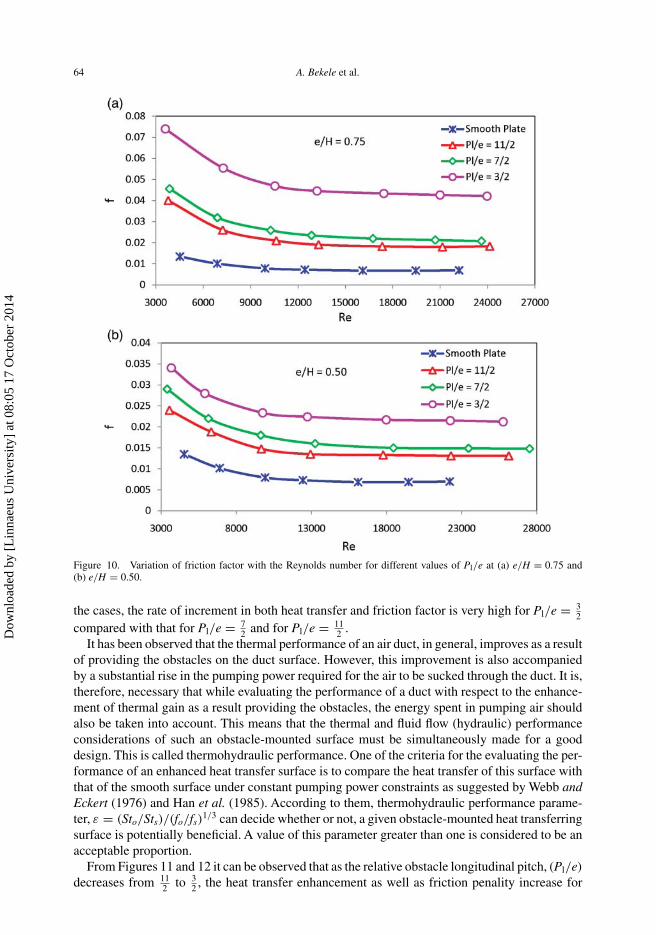
e/H = 0.50, respectively. Further, the corresponding friction factors as a function of Reynoldsnumber are given in Figure 10(a) and (b). The values of the Nusselt number were found toincrease with increasing Reynolds number in all cases, whereas the friction factor decreases withincrease in Reynolds number as expected. It can also be seen from these figures that the valuesof the Nusselt number for the duct having obstacles are higher than that of the smooth duct atall Reynolds number for all obstacles arrangement. These figures also show that both the Nusseltnumber and the friction factor increases with a decrease in relative obstacle longitudinal pitch(Pl/e) from 11
2 to 32 .
As the relative obstacle longitudinal pitch decreases, there will be more numbers of rows ofobstacles for the same absorber plate length, which means that the increase in the number ofobstacles results in higher turbulence. This increases the heat transfer coefficient and simultane-ously the friction factor also increases because of the increase in the blockage of the air path. In all
Dow
nloa
ded
by [
Lin
naeu
s U
nive
rsity
] at
08:
05 1
7 O
ctob
er 2
014
64 A. Bekele et al.
Figure 10. Variation of friction factor with the Reynolds number for different values of Pl/e at (a) e/H = 0.75 and(b) e/H = 0.50.
the cases, the rate of increment in both heat transfer and friction factor is very high for Pl/e = 32
compared with that for Pl/e = 72 and for Pl/e = 11
2 .It has been observed that the thermal performance of an air duct, in general, improves as a result
of providing the obstacles on the duct surface. However, this improvement is also accompaniedby a substantial rise in the pumping power required for the air to be sucked through the duct. It is,therefore, necessary that while evaluating the performance of a duct with respect to the enhance-ment of thermal gain as a result providing the obstacles, the energy spent in pumping air shouldalso be taken into account. This means that the thermal and fluid flow (hydraulic) performanceconsiderations of such an obstacle-mounted surface must be simultaneously made for a gooddesign. This is called thermohydraulic performance. One of the criteria for the evaluating the per-formance of an enhanced heat transfer surface is to compare the heat transfer of this surface withthat of the smooth surface under constant pumping power constraints as suggested by Webb andEckert (1976) and Han et al. (1985). According to them, thermohydraulic performance parame-ter, ε = (Sto/Sts)/(fo/fs)1/3 can decide whether or not, a given obstacle-mounted heat transferringsurface is potentially beneficial. A value of this parameter greater than one is considered to be anacceptable proportion.
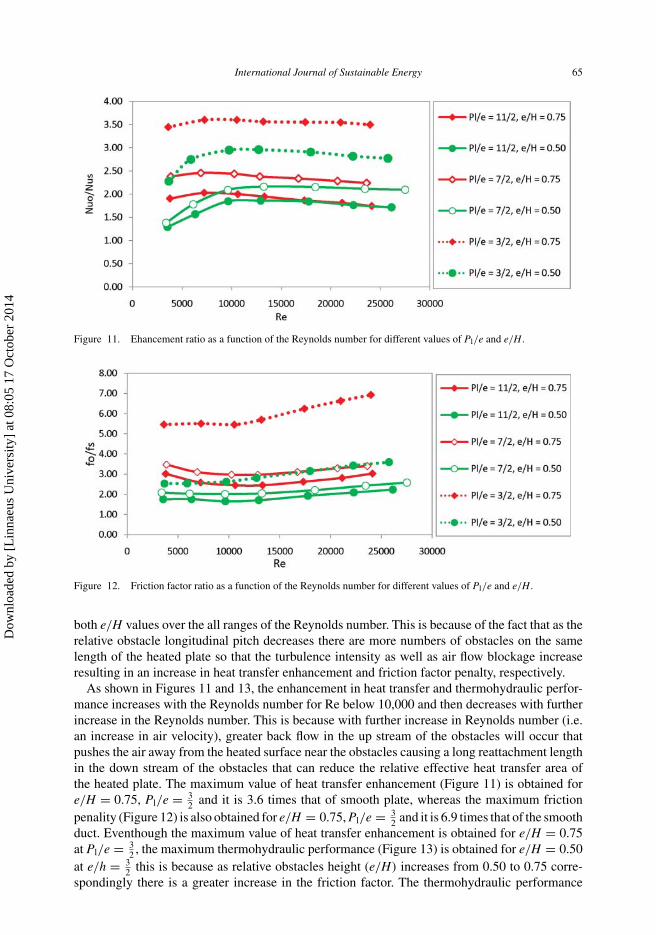
From Figures 11 and 12 it can be observed that as the relative obstacle longitudinal pitch, (Pl/e)decreases from 11
2 to 32 , the heat transfer enhancement as well as friction penality increase for
Dow
nloa
ded
by [
Lin
naeu
s U
nive
rsity
] at
08:
05 1
7 O
ctob
er 2
014
International Journal of Sustainable Energy 65
Figure 11. Ehancement ratio as a function of the Reynolds number for different values of Pl/e and e/H.
Figure 12. Friction factor ratio as a function of the Reynolds number for different values of Pl/e and e/H.
both e/H values over the all ranges of the Reynolds number. This is because of the fact that as therelative obstacle longitudinal pitch decreases there are more numbers of obstacles on the samelength of the heated plate so that the turbulence intensity as well as air flow blockage increaseresulting in an increase in heat transfer enhancement and friction factor penalty, respectively.
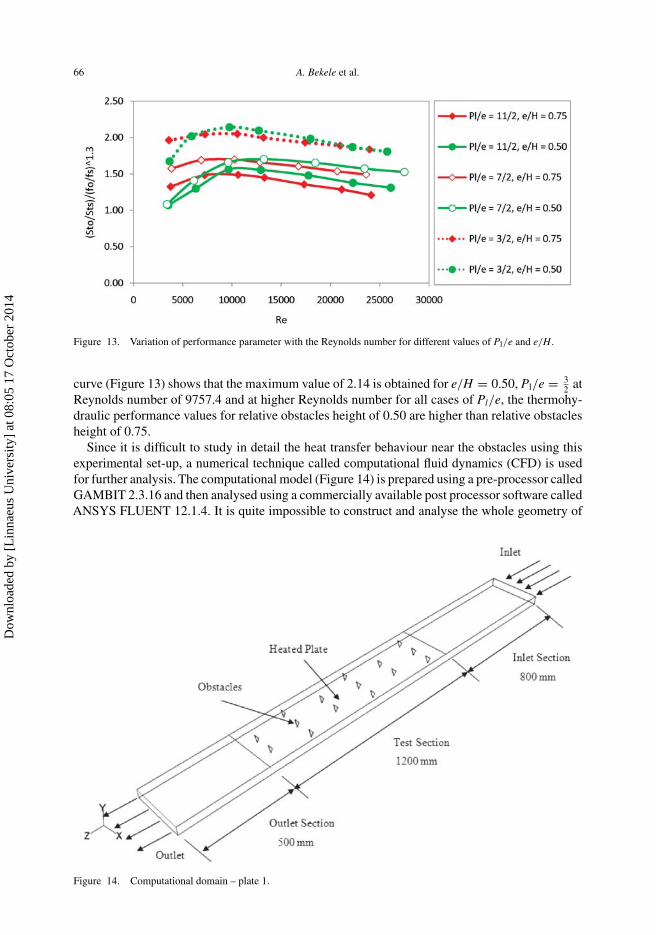
As shown in Figures 11 and 13, the enhancement in heat transfer and thermohydraulic perfor-mance increases with the Reynolds number for Re below 10,000 and then decreases with furtherincrease in the Reynolds number. This is because with further increase in Reynolds number (i.e.an increase in air velocity), greater back flow in the up stream of the obstacles will occur thatpushes the air away from the heated surface near the obstacles causing a long reattachment lengthin the down stream of the obstacles that can reduce the relative effective heat transfer area ofthe heated plate. The maximum value of heat transfer enhancement (Figure 11) is obtained fore/H = 0.75, Pl/e = 3
2 and it is 3.6 times that of smooth plate, whereas the maximum frictionpenality (Figure 12) is also obtained for e/H = 0.75, Pl/e = 3
2 and it is 6.9 times that of the smoothduct. Eventhough the maximum value of heat transfer enhancement is obtained for e/H = 0.75at Pl/e = 3
2 , the maximum thermohydraulic performance (Figure 13) is obtained for e/H = 0.50at e/h = 3
2 this is because as relative obstacles height (e/H) increases from 0.50 to 0.75 corre-spondingly there is a greater increase in the friction factor. The thermohydraulic performance
Dow
nloa
ded
by [
Lin
naeu
s U
nive
rsity
] at
08:
05 1
7 O
ctob
er 2
014
66 A. Bekele et al.
Figure 13. Variation of performance parameter with the Reynolds number for different values of Pl/e and e/H.
curve (Figure 13) shows that the maximum value of 2.14 is obtained for e/H = 0.50, Pl/e = 32 at
Reynolds number of 9757.4 and at higher Reynolds number for all cases of Pl/e, the thermohy-draulic performance values for relative obstacles height of 0.50 are higher than relative obstaclesheight of 0.75.
Since it is difficult to study in detail the heat transfer behaviour near the obstacles using thisexperimental set-up, a numerical technique called computational fluid dynamics (CFD) is usedfor further analysis. The computational model (Figure 14) is prepared using a pre-processor calledGAMBIT 2.3.16 and then analysed using a commercially available post processor software calledANSYS FLUENT 12.1.4. It is quite impossible to construct and analyse the whole geometry of
Figure 14. Computational domain – plate 1.
Dow
nloa
ded
by [
Lin
naeu
s U
nive
rsity
] at
08:
05 1
7 O
ctob
er 2
014
International Journal of Sustainable Energy 67
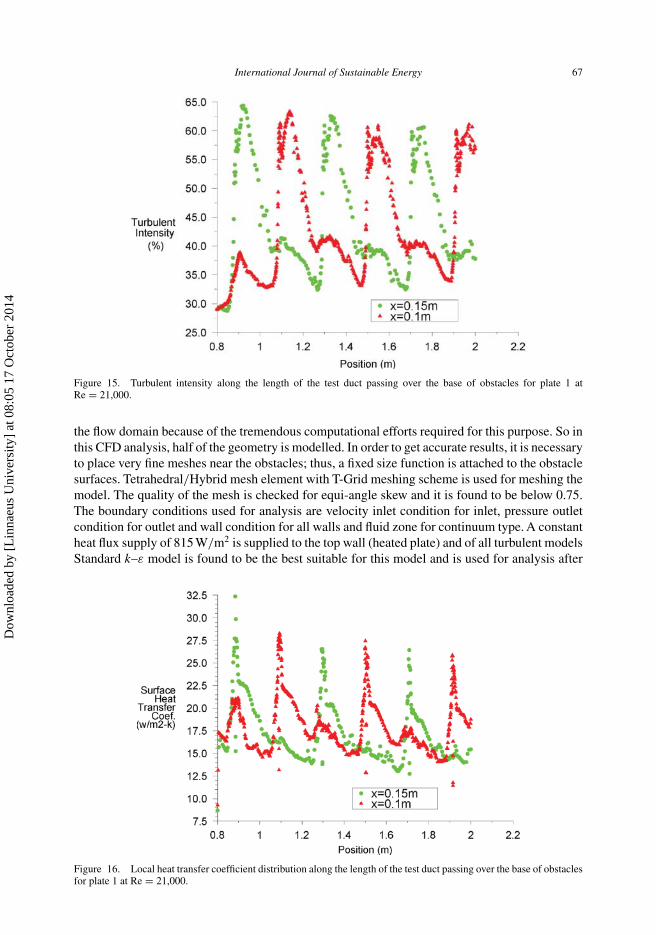
Figure 15. Turbulent intensity along the length of the test duct passing over the base of obstacles for plate 1 atRe = 21,000.
the flow domain because of the tremendous computational efforts required for this purpose. So inthis CFD analysis, half of the geometry is modelled. In order to get accurate results, it is necessaryto place very fine meshes near the obstacles; thus, a fixed size function is attached to the obstaclesurfaces. Tetrahedral/Hybrid mesh element with T-Grid meshing scheme is used for meshing themodel. The quality of the mesh is checked for equi-angle skew and it is found to be below 0.75.The boundary conditions used for analysis are velocity inlet condition for inlet, pressure outletcondition for outlet and wall condition for all walls and fluid zone for continuum type. A constantheat flux supply of 815 W/m2 is supplied to the top wall (heated plate) and of all turbulent modelsStandard k–ε model is found to be the best suitable for this model and is used for analysis after
Figure 16. Local heat transfer coefficient distribution along the length of the test duct passing over the base of obstaclesfor plate 1 at Re = 21,000.
Dow
nloa
ded
by [
Lin
naeu
s U
nive
rsity
] at
08:
05 1
7 O
ctob
er 2
014
68 A. Bekele et al.
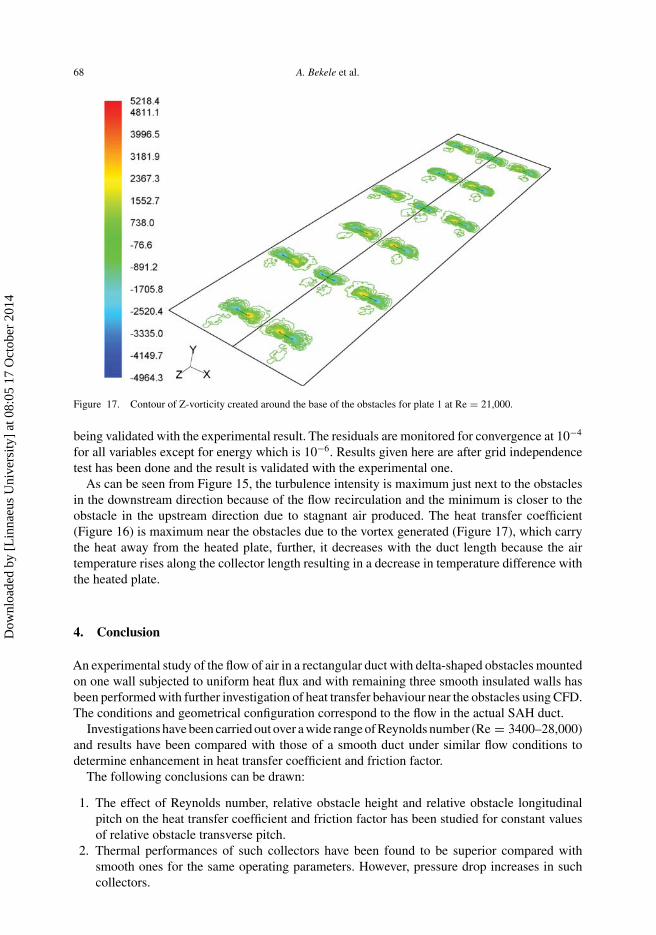
Figure 17. Contour of Z-vorticity created around the base of the obstacles for plate 1 at Re = 21,000.
being validated with the experimental result. The residuals are monitored for convergence at 10−4
for all variables except for energy which is 10−6. Results given here are after grid independencetest has been done and the result is validated with the experimental one.
As can be seen from Figure 15, the turbulence intensity is maximum just next to the obstaclesin the downstream direction because of the flow recirculation and the minimum is closer to theobstacle in the upstream direction due to stagnant air produced. The heat transfer coefficient(Figure 16) is maximum near the obstacles due to the vortex generated (Figure 17), which carrythe heat away from the heated plate, further, it decreases with the duct length because the airtemperature rises along the collector length resulting in a decrease in temperature difference withthe heated plate.
4. Conclusion
An experimental study of the flow of air in a rectangular duct with delta-shaped obstacles mountedon one wall subjected to uniform heat flux and with remaining three smooth insulated walls hasbeen performed with further investigation of heat transfer behaviour near the obstacles using CFD.The conditions and geometrical configuration correspond to the flow in the actual SAH duct.
Investigations have been carried out over a wide range of Reynolds number (Re = 3400–28,000)and results have been compared with those of a smooth duct under similar flow conditions todetermine enhancement in heat transfer coefficient and friction factor.
The following conclusions can be drawn:
1. The effect of Reynolds number, relative obstacle height and relative obstacle longitudinalpitch on the heat transfer coefficient and friction factor has been studied for constant valuesof relative obstacle transverse pitch.
2. Thermal performances of such collectors have been found to be superior compared withsmooth ones for the same operating parameters. However, pressure drop increases in suchcollectors.
Dow
nloa
ded
by [
Lin
naeu
s U
nive
rsity
] at
08:
05 1
7 O
ctob
er 2
014
International Journal of Sustainable Energy 69
3. Obstacles longitudinal pitch and blockage height strongly affect the flow pattern and hencethe performance of the duct.
4. The maximum enhancement in the Nusselt number values compared with that of smooth ductis obtained for e/H = 0.75, Pl/e = 3
2 and is of the order of 3.6.5. The maximum overall thermal performance of value 2.14 is obtained for e/H = 0.50,
Pl/e = 32 at Reynolds number of 9757.4 and at higher Reynolds number for all cases of
Pl/e, the thermohydraulic performance values for relative obstacles height of 0.50 are higherthan the relative obstacles height of 0.75; therefore, the relative obstacles height of 0.50 isrecommended for such systems than the relative obstacles height of 0.75.
6. The obstacle geometry shows an appreciable heat transfer enhancement at Reynolds numberaround 10,000.
7. In general, it can be said that the enhancement of heat transfer for any arrangement of obstacleson the plate surface is caused due to the increased turbulence and the vortex generated dueto the recirculation and secondary flow of air produced along the obstacles increases the heattransfer from the heated plate to the moving air.
8. The numerical computation of the physical object is also done for the better understandingof the heat transfer behaviour near the obstacles.
References
ASHRAE STANDARD 93-86, 1977. Methods of testing to determine the thermal performance of solar collectors.ASHRAE: New York.
Bhatti, M.S., and Shah, R.K., 1987. Turbulent and transition flow convective heat transfer. In: S. Kakac, R.K. Shah, andW. Aung, eds. Handbook of single-phase convective heat transfer. New York: John Wiley and Sons.
Choudhury, C., and Garg, H.P., 1991. Design analysis of corrugated and flat plate solar air heaters. Renewable Energy, 1(5/6), 595–607.
Dipprey, D. P. and Sabersky, R. H., 1963. Heat and momentum transfer in smooth and rough tubes at various Prandtlnumbers. International Journal of Heat and mass Transfer, 6, 329–353.
Esen, H., 2008. Experimental energy and exergy analysis of a double-flow solar air heater having different obstacles onabsorber plates. Building and Environment 43, 1046–1054.
Hachemi, A., 1995. Thermal performance enhancement of solar air heaters, by fan-blown absorber plate with rectangularfins. International Journal of Energy Research, 19 (7), 567–578.
Han, J.C., 1984. Heat transfer and friction in a channel with two opposite rib roughened walls. International Journal ofHeat Transfer, 106, 774–781.
Han, J.C., Park, J.S., and Lei, C.K., 1985. Heat transfer enhancement in channel with turbulene promoters. Transactionsof the ASME Journal of Engineering for Gas Turbine and Power, 107, 628–635.
Hegazy, A.A., 2000. Performance of flat plate solar air heaters with optimum channel geometry for constant/variable flowoperation. Energy Conversion and Management, 41 (4), 401–417.
Hollands, K.G.T., and Shewan, E.C., 1981. Optimization of flow passage geometry for air-heating, plate-type solarcollectors. Transactions of ASME, Journal of Solar Energy Engineering, 103, 323–330.
Kabeel, A.E. and Mecarik, K.K., 1998. Shape optimization for absorber plates of solar air collector. Renewable Energy,13 (1), 121–131.
Karwa, R., Solanki, S.C., and Saini, J.S., 1999. Heat transfer coefficient and friction factor correlation for the transitionalflow regime in rib roughened rectangular ducts. International Journal of Heat and Mass Transfer, 42, 1597–1615.
Kays, W.M. and Perkin, H., 1973. Forced convection internal flow in ducts. In: W.M. Rohsenow and I.V. Hartnett, eds.Handbook of heat transfer. New York: McGraw-Hill, Section 7.
Kline, S.J. and McClintock, F.A., 1953. Describe uncertainties in single sample experiments. Mechanical Engineering,75, 3–8.
Moummi, N, Ali, S.Y., Moummi, A., and Desmons, J.Y., 2004. Energy analysis of a solar air collector with rows of fins.Renewable Energy, 29 (13), 2053–2064.
Nattawoot, D., Chompookham, T., and Promvonge, P., 2010. Thermal enhancement in a solar air heater channel usingrectangular winglet vortex generators. PEA-AIT international conference on energy and sustainable development:issues and strategies (ESD 2010), 2–4 June 2010, Chang Mai, Thailand.
Ozgen, F., Esen, M., Esen, H., 2009. Experimental investigation of thermal performance of a double-flow solar air heaterhaving aluminium cans. Renewable Energy, 34, 2391–2398.
Webb, R.L. and Eckert, E.R.G., 1976. Application of rough surface to heat exchanger design. International Journal ofHeat and Mass Transfer, 15, 1647–1658.
Yeh, H.M., Ho, C.D., and Lin, C.Y., 2000. Effect of collector aspect ratio on the collector efficiency of upward type baffledsolar air heaters. Energy Conversion and Management, 41 (9), 971–981.
Dow
nloa
ded
by [
Lin
naeu
s U
nive
rsity
] at
08:
05 1
7 O
ctob
er 2
014