heat transfer investigations in micro-channel...
TRANSCRIPT

15th Int Symp on Applications of Laser Techniques to Fluid Mechanics Lisbon, Portugal, 07-10 July, 2008
-1-
Heat transfer investigations in micro-channel flows
Vânia Silvério*,1, António L.N. Moreira
1, Viriato Semião
1
C. Nunes de Carvalho2, Guilherme Lavareda
2, Pedro Parreira
2 and Ana Amaral
3
1: Department of Mechanical Engineering, Instituto Superior Técnico, Av. Rovisco Pais 1049-001 Lisbon, Portugal
2: DCM/ICEMS, Faculty of Sciences and Technology, New University Lisbon, Qta. Torre, 2829-516 Caparica, Portugal
3: ICEMS, Department of Physics, Instituto Superior Técnico, Av. Rovisco Pais 1049-001 Lisbon, Portugal
Abstract Experiments were conducted to investigate transfer of heat and momentum of fluid flowing through horizontal micro-channels with square cross section (Dh= 195 and 522µm) and 100mm length. The flow was set up by a syringe pump in borosilicate glass tubes heated by an electrical conductive transparent film of InOx deposited in the channel outer wall, which allowed establish a constant axially and longitudinally uniform heat flux boundary layer at the same time that it provided optical access to the inner flow. Experimental horizontal single and two-phase flow images are presented. The single-phase liquid flow experiments encompassed measurements of longitudinal distribution of temperature and pressure drop, complemented by velocity measurements of the inner flow with a Microscopic Particle Image Velocimetry (µPIV) system. The discrepancy between the PIV measurements and the predicted 2D velocity distributions (White, 1974) is less than 1% near the center and increases to 12.6% for the measurements closest to the wall for non-heated channels. Integration of the µPIV 2D flow fields to compute the volumetric flow rate where within 4.12% of the volumetric flow rate established by the syringe pump. Results obtained for diabatic flows presented a decrease of the mean velocity gradient near the wall, and an increase at the channel middle plane with the heat flux increase. CFD simulation results fitted well with the relation proposed by Martinelli and Viktorov (2009). The qualitative the two-phase flow results show good agreement with flow patterns well accepted for conventional horizontal circular cross section channels.
1. Introduction
Systems miniaturization in diverse applications, either industrial or laboratorial, raises the need to
better comprehend the scale effects induced on convective heat transfer inside micro-tubes. Several
reviews related to mini-channel and micro-channel heat transfer, pressure drop, critical heat flux,
flow instabilities and flow patterns are available in the literature (Bertsch et al., 2008) and all agree
that there is no uniformity in the experimental data.
Despite the extensive body of literature reported on these effects, experimental results are often
influenced or even masked by several phenomenon, such as viscous dissipation (Morini and Spiga,
2007), axial conduction along the walls (Lelea, 2007), the validity of the slip-flow model (Kudussi
and Çetegen, 2007) caused by molecular interactions at the surface-fluid interface (Meinhart, 2007)
and/or by surface roughness effects (Hrnjak and Tu, 2007, Croce et al., 2007), or experimental
uncertainties associated with channel dimensions (Steinke and Kandlikar, 2006), pumping power
(Husain and Kim, 2008), pressure drop (Ngoma and Erchiqui, 2007), entrance and exit effects
(Gamrat et al., 2005), thermal boundary conditions (Horiuchi and Dutta, 2004) or variation of fluid
properties (Liu et al., 2007). Limited spaces for small probes, small flow rates, heat transfer rates
and temperature differences that are difficult to measure accurately or are masked by the electronic
noise are probably the major foundations of inconsistency. Also the channels manufacture and
sealing introduce dimensional uncertainties and surface roughness (Agarwal 2006).
Many heat transfer design methods exist for fluid vaporization inside macrochannels, but these have
been found to not be suitable to the small dimensions found in microscale. Mechanistic heat transfer
models to describe evaporation and condensation inside micro-channels are scarse and many studies
are adiabatic two-phase flow experiments, i.e. liquid and gas flowing in the same channel without
heating, generated by a gas injector or liquid-vapor mixer. The resulting flow pattern and bubble

15th Int Symp on Applications of Laser Techniques to Fluid Mechanics Lisbon, Portugal, 07-10 July, 2008
-2-
characteristics are probably imposed or influenced by the design of the injector or mixer.
The work reported in the present paper is part of a major experimental study concerned with the
fundamentals on single and two-phase heat transfer inside micron sized tubes. The methodology
combines temperature and pressure drop measurements with high speed visualization and velocity
distributions obtained with a Microscopic Particle Image Velocimeter (µPIV) to quantitatively characterize flow patterns and phenomena associated with single-phase and phase transition inside
micro-channels.
2. Description of the experiments The experimental apparatus is schematically shown in Fig. 1. A syringe pump NE-1000 from New
Era Pump Systems, Inc®, with a Syringe B-D Perfusion 50/60mL (Inner Diameter, ID 27.12mm)
supplies a constant mass flux of liquid (uncertainty, u = ±1%) at room temperature. Instantaneous
temperatures along the channel wall are measured with unsheated fine gage 25µm Outter Diameter,
OD, k-type thermocouples from Omega (u < ± 2%), attached along the channel outer wall with a non-conductive thermal glue (Cooler Master
® PTK-002, thermal conductivity, k > 4.5W.m
-1.K
-1) to
ensure a quick and reliable response and to minimize electrical conductance effects which would
disturb the measurements. Thermocouples are also inserted at the inlet/outlet stagnation chambers.
The ambient temperature is measured with a 1mm OD K-type thermocouple from Omega, placed
near the channel inlet. Pressure losses are measured with two ECO1 pressure transducers from Wika
(pressure, p = 0-4bar, u < ± 0.5%), located at the inlet and outlet stagnation chambers, respectively.
Fig. 1 Schematic of the a) flow delivery system; b) µPIV system and c) high speed visualization system
The micro-channels are made of very smooth borosilicate glass from Vitrocom®, USA, with
rectangular and square cross sections as shown in the sample photo of Fig. 2 obtained with the
Hitachi S_2400 scanning electronic microscope. Though these images are not used to quantify the
amplitude of roughness, EDS (energy dispersive spectroscopy) elemental analysis show that all the
tubes used in the experiments have similar chemical composition (Fig. 3). Multi Image V2.1
software and Matlab® is used to assess the shape of the cross section and to accurately measure the
inner and outer dimensions of the channels (±4.4%).
Fig. 2 SEM image of C_500 (Dh=543µm), S_200 (Dh=196µm) and C_200 (Dh=192µm) cross sections. The tubes are externally coated with a thin transparent film of Indium Oxide (InOx) to provide
a)
b)
c)

15th Int Symp on Applications of Laser Techniques to Fluid Mechanics Lisbon, Portugal, 07-10 July, 2008
-3-
heating by Joule effect at the same time it allows optical access to the inner flow. A similar method
has been employed by Yen et al. (2006) who made use of a tin-doped indium oxide (ITO) and silver
sputtered in pyrex micro-tubes. ITO films exhibit low resistivity and high transmittance in the
visible range of the spectrum, which make them useful as transparent electrodes in of many devices
such as liquid crystal displays (LCDs), plasma displays or solar cells. But their properties have been
extensively reported to be sensitive to the techniques and parameters of deposition, as well as to
post-deposition treatments, e g., Abe and Ishiyama (2006), Yamada et al. (1998). Moreover, Sn
doping in InOx thin films deposited at room temperature deteriorates the properties of the film (e g.,
Dekkers et al., 2006) and the addition of silver gives a large negative temperature coefficient of
resistivity, e g., Subrahmanyam and Barik (2006). Therefore, films would be too thin and difficult to
control during the process of deposition to achieve the required highest temperature.
The suitability of the optical properties of the InOx deposit to obtain fluorescence measurements, as
well of its chemical stability to provide accurate thermal boundary conditions are the main keys for
the evaluation. Most transparent conductors consist of metal oxides that possess both good electrical
conductivity and transparency in the visible and near infrared (IR) regions of the electromagnetic
spectrum. If transparent conductors /semiconductors thin films can be deposited at room
temperature, transparent electronic devices can be laid upon any type of substrates, from glass to
flexible polymers (Liu et al. 2002). In the present work InOx deposition is made by radio frequency
plasma enhanced reactive thermal evaporation (rf-PERTE) at low substrate temperature (<100ºC).
Details of the method and of the resulting relevant film properties are reported by Nunes de
Carvalho et al. (2008). Only a summary is given here to contextualize the accuracy of the thermal
boundary conditions. The source material (indium metal) is evaporated at steady state in the
presence of oxygen, inside a glass chamber in vacuum (∼10-4 mbar) at low substrate temperature; the formation of the metal oxide layer is basically a condensation process of metal oxide vapor at
the outer surface of the tube, which is placed horizontally 10cm apart. Rotation of the micro-tube
guarantees uniformity of the film thickness around the perimeter of the tubes and, therefore, of the
electrical resistance. Even though, the thermocouples connected to the outer surface of the tubes are
randomly lined and, therefore, any potential relation which would arise with the position of the tube
in the evaporation chamber is statistically damped.
a) b) Fig. 3 EDS elemental analysis of a) borosilicate glass channel outer wall b) InOx thin film deposit at the outer wall and
corresponding surface SEM images
SEM investigations of the undoped InOx films deposited on different substrates showed a strong
correlation between the nanoscopic features of the films surface and their macroscopic properties
such as visible optical transmittance and electrical conductivity.
Fig. 4 shows the variation of specular transmittance spectra with substrate for undoped InOx films
deposited by rf-PERTE at room temperature. Transmittance spectra of bare substrates are shown for
comparison. The InOx visible transmittance does not vary significantly as a function of substrates,
showing that transmittance is not strongly related to the film surface morphology variations
observed. In overall, all the undoped InOx films show relatively high values of visible transmittance
(around 81%) and the highest loss of visible transmittance by the substrates is obtained for PET
(Polyethylene terephthalate polymer resin) substrates due to their less smooth surface morphology,

15th Int Symp on Applications of Laser Techniques to Fluid Mechanics Lisbon, Portugal, 07-10 July, 2008
-4-
inducing this characteristic to the InOx films deposited on them. (Parreira et al., 2008)
Fig. 4 Variation of specular transmittance spectra as a
function of substrates (Alkali Free (AF) glass, Fused
Silica (FS) and Polyethylene terephthalate polymer resin
(PET)) for undoped InOx films deposited by rf-PERTE at
room temperature. (Parreira et al., 2008)
Fig. 5 Conductivity vs temperature for undoped InOx
films deposited by rf-PERTE at room temperature on AF
glass and polymer (PET) substrates (Parreira et al., 2008)
Moreover, the thin transparent film shows good chemical stability in the range of temperatures up to
70ºC, therefore indicating that the thermal boundary condition approximates a constant wall heat
flux condition. Fig. 5 shows the electrical conductivity as a function of substrate for undoped InOx
films deposited by rf- PERTE at room temperature on polymer (PET) and AF glass, the two most
representative substrates. The undoped InOx thin film presents a conductor behavior. The deposit on
AF glass show an electrical conductivity of about σ25°C=1100(Ω.cm)-1. Electrical contacts are achieved by means of electrically conductive silver containing acrylic paint,
Elecolit® 340 (sheet resistance < 0.001Ω.cm) and heating is provided by a direct current
(GEN150-5, from TDK-Lambda, u < ±0.14%). Furthermore, temperature measurements made in the absence of inner flow, showed a constant value along the tube wall, which gives a clear
indication that the thermal boundary condition approximates a constant heat flux condition (u <
±0.6%).
The experiments were conducted with distilled water, H2O (IST Inorganic Chemistry Lab),
methoxy-nonafluorobutane, C4F9OCH3 (HFE7100, 99.5%, 3MTM) and methanol, CH3OH (99.8%,
BDH) with thermophysical properties listed in Table 1 at 25ºC.
Table 1. Thermophysical properties of the working fluids
Fluid
H2O (Lemon et al., 2005)
CH3OH (Lide, 2004)
C4F9OCH3 (3M)
ρ [kg.m-3] 1000 788 1488
µ x1004 [kg.m-1s-1] 8.9 5.6 5.7
σ x1003 [kg.s-2] 72.8 22.3 13.6
α x1008 [m2.s-1] 15 10.4 3.9
k x1003 [W.m
-1.K
-1] 607.1 203.3 68.8
cp [J.kg-1.ºC
-1] 4182 2481 1177
Tb [ºC] 100 65 61
hfg [kJ.kg-1] 2260 1158 126
Two-phase flow patterns in the channels were obtained with simultaneous measurements of

15th Int Symp on Applications of Laser Techniques to Fluid Mechanics Lisbon, Portugal, 07-10 July, 2008
-5-
temperature, pressure drop and visualization using a Phantom V4.2 high speed camera from Vision
Research® connected to the acquisition system (Phantom Camera Control Version: 9.0.640.0-C
PhCon:640), which triggerd and controled the camera and stored the captured images (Fig. 1c). For
the experiments, a resolution of 512x32pixel2 (pixel size 22µm) @ 3000fps was employed. All high
speed visualization images were obtained with a Melles Griot microscopic lens with magnification
M=6.3 and numerical aperture NA=0.20. The flow was illuminated with a light source, provided by
a 1250W spotlight, placed in front of the camera, but behind the channel. Moreover, to homogenize
and to reduce the loss of light through scattering a diffusing glass was placed between the light
source and the channel. The incident light deflects at the vapor-liquid interface, resulting in a
darkening at these positions as described by Hsieh et al. (1997).
Temperature and pressure data were acquired by the National Instruments acquisition system at a
frequency of 100Hz. All the results are post processed with a Matlab ® code to determine all the
desired parameters.
The µPIV system (Fig. 1b) uses an inverted Leica DM ILM epi-fluorescent microscope and a
Flowsense®_ 2M CCD (charge coupled device) camera from Dantec Dynamics to record 1µm
average diameter nile red fluorescent tracing particles from Invitrogen® with an image field of
1600x1186 pixel2 (pixel size 7.41µm) at a maximum rate of 15Hz and 8/10-bit intensity resolution.
The particles are illuminated via a dual Nd:YAG laser New Wave_Solo II-15 emitting at λ=532nm with a repetition rate of 15Hz. The time delay between laser pulses is set between 100 and 500µs in which the particles have a maximum displacement of ¼ of the interrogation area length. An
epi-fluorescent prism/filter cube is used to filter wavelengths lower than λ=575nm (particles wavelength emission) to prevent the influence of background noise. The field is magnified with an
air-immersion N PLAN objective lens with magnification M=40 and numerical aperture NA=0.55.
FlowManager® V4.0 from Dantec Dynamics is used in acquisition, calculus and post processing of
the data as well as in the correlation and validation algorithms. Synchronization is assured by
National Instruments hardware. µPIV measurements were performed only in the square section micro-channels to minimize light distortion effects, as pressure and temperature measurements were performed with square and
circular cross section channels.
In pressure and temperature data reduction, the flow is assumed laminar, incompressible, steady and
fully developed (either hydrodynamically and/or thermally), gravity forces are ignored and the
fluids are considered Newtonian. Momentum and heat transfer data are obtained and processed as in
Silvério and Moreira (2008). The Poiseuille number, f.Re, for fully developed laminar flow of an
incompressible fluid through a stationary smooth circular cross section is 64 and is 56.92 for square
cross sections. The Reynolds number µ
ρ hm DueR
..= is defined with the hydraulic diameter Dh
=4ACS/P and the bulk velocity CSm Amu ⋅= ρ& (µ is dynamic viscosity, ρ is the specific weight, m&
is the mass flux and ACS is the channel cross section area. The Darcy friction factor f is then defined
as
2
21 .. m
h
u
D
dz
dpf
ρ−= (1)
To obtain the pressure drop (dp) along the channel longitudinal distance z, pressure measurements
are performed at the inlet and outlet plenums, as shown in Fig. 1a). The entrance and exit effects are
eliminated making use of two channels with different lengths (100mm and 50mm), but with the
15th Int Symp on Applications of Laser Techniques to Fluid Mechanics Lisbon, Portugal, 07-10 July, 2008
-6-
same entrance and exit conditions, as in Celata et al. (2006).
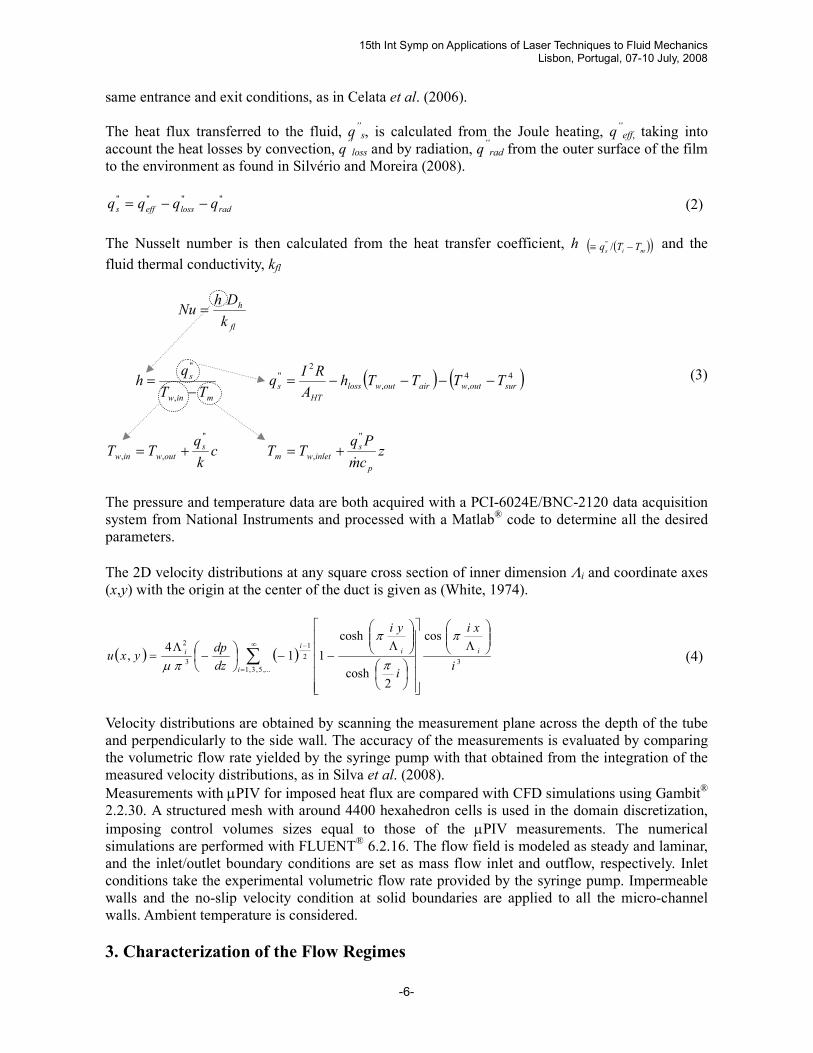
The heat flux transferred to the fluid, q”s, is calculated from the Joule heating, q
”eff, taking into
account the heat losses by convection, q”loss and by radiation, q
”rad from the outer surface of the film
to the environment as found in Silvério and Moreira (2008).
""""
radlosseffs qqqq −−= (2)
The Nusselt number is then calculated from the heat transfer coefficient, h ( )( )mis TTq −≡ /" and the
fluid thermal conductivity, kfl
( ) ( )
zcm
PqTTc
k
qTT
TTTThA
RIq
TT
qh
k
DhNu
p
sinletwm
soutwinw
suroutwairoutwloss
HT
s
minw
s
fl
h
&
"
,
"
,,
44
,,
2"
,
"
+=+=
−−−−=−
=
=
(3)
The pressure and temperature data are both acquired with a PCI-6024E/BNC-2120 data acquisition
system from National Instruments and processed with a Matlab® code to determine all the desired
parameters.
The 2D velocity distributions at any square cross section of inner dimension Λi and coordinate axes
(x,y) with the origin at the center of the duct is given as (White, 1974).
( ) ( )∑∞
=
−
Λ
Λ−−
−Λ
=,...5,3,1
32
1
3
2cos
2cosh
cosh
114
,i
iii
i
i
xi
i
yi
dz
dpyxu
π
π
π
πµ
(4)
Velocity distributions are obtained by scanning the measurement plane across the depth of the tube
and perpendicularly to the side wall. The accuracy of the measurements is evaluated by comparing
the volumetric flow rate yielded by the syringe pump with that obtained from the integration of the
measured velocity distributions, as in Silva et al. (2008).
Measurements with µPIV for imposed heat flux are compared with CFD simulations using Gambit® 2.2.30. A structured mesh with around 4400 hexahedron cells is used in the domain discretization,
imposing control volumes sizes equal to those of the µPIV measurements. The numerical simulations are performed with FLUENT
® 6.2.16. The flow field is modeled as steady and laminar,
and the inlet/outlet boundary conditions are set as mass flow inlet and outflow, respectively. Inlet
conditions take the experimental volumetric flow rate provided by the syringe pump. Impermeable
walls and the no-slip velocity condition at solid boundaries are applied to all the micro-channel
walls. Ambient temperature is considered.
3. Characterization of the Flow Regimes

15th Int Symp on Applications of Laser Techniques to Fluid Mechanics Lisbon, Portugal, 07-10 July, 2008
-7-
Two-phase flow in circular conventional size channels has been considered by numerous
investigators. Studies focus on both horizontal and vertical orientations, as well as inclined
orientations. Flow patterns are identified and the transitions between flow patterns are defined,
primarily from visual observations. As such, the determination is somewhat subjective and the
simultaneous measure of pressure drop and temperature with high speed visualization is necessary
to the characterization of flow pattern transitions and flow pattern maps.
Fig. 6 shows examples of images of flow patterns obtained experimentally for a horizontal circular
cross section channel with Dh=543µm, heated by a uniform low heat flux and fed with methanol just below saturation temperature. Representative of five different flow pattern types are presented
according to generally accepted definitions adapted from Collier and Thome (1994) and described
below.
Bubbly flow occurs when the gas or vapor phase is distributed as discrete bubbles in a continuous
liquid phase. The size of bubbles does not approach the diameter of the channel and bubbles tend to
travel in the upper half of the channel. The intermittent flow that occurs at low gas flow rates and
moderate liquid rate is described as plug flow. In this regime, liquid plugs, free entrained gas
bubbles, are separated by zones of elongated gas bubbles. When the gas velocity is increased in a
plug flow, the liquid slugs become aerated and contain small bubbles (slug flow). The flow is more
chaotic compared with plug flow and the interface between gas and liquid is not as clearly defined.
For wavy flow, as the gas velocity is increased, waves are formed on the liquid-gas interface, and
tend to travel in the direction of the flow. This flow pattern corresponds to stratified wavy flow.
When higher gas flow rates cause the liquid to form a film on the tube wall (the film at the bottom
of the tube may be thicker than the film at the top) it is named annular flow.
Single-phase liquid flow Bubbly flow
Plug flow Slug flow
Wavy flow Annular flow
Single-phase vapor flow
Fig.6 Schematic of flow patterns encountered in conventional horizontal two-phase flow during evaporation (Collier
and Thome, 1994) and experimental flow patterns in internal horizontal micro-channel flow heated by a uniform heat
flux. Methanol, Channel C_500 (Dh = 543µm), 17µL.s-1 ≤ Q ≤ 170µL.s-1, Tm,inlet = 28ºC, 6kW.m
-2 ≤ q
”s ≤ 22 kW.m
-2.
The optical method for two-phase flow characterization in micro-channels is being applied to
determine the frequency of bubbles, the coalescence rate of these bubbles and their lengths as well
as their mean two-phase vapor velocity. Qualitative and quantitative measurements will then

15th Int Symp on Applications of Laser Techniques to Fluid Mechanics Lisbon, Portugal, 07-10 July, 2008
-8-
contribute to a better understanding of single and two-phase flow inside micro-channels.
In the present paper, only single-phase liquid flow is addressed.
4. Objectives The main goal of the analysis is to assess the suitability of the experimental methodology to identify
and characterize the interfacial effects of fluid flow inside micron sized channels. The experiments
consider the use of borosilicate micro-channels of square cross section with hydraulic diameters of
195µm (S_200) and 522µm (S_500), coated with a transparent metallic film to provide a constant wall heat flux at the same time it provides optical access for the use of visualization and laser
diffraction techniques. Velocity measurements are reported for inlet volumetric flow rates of 31, 230
and 306µL.s-1 and heat fluxes from about 3 to 20kW.m-2. Averaged velocity distributions are
calculated from the µPIV data. Particular attention is paid here to the construction of a dedicated experimental facility which allows
the use of optical diagnostic and flow visualization techniques, namely µPIV, which provides a valuable asset to assess the flow behavior, as it allows resolving the whole field (Wereley and
Meinhart, 2005) by scanning the measurement plane across the channel depth, (Santiago et al.
1998).
5. Results and Discussion The application of analytical correlations usually well established for the single-phase liquid friction
factor and the Nusselt number at the “macroscale” (represented with a dashed line in Fig. 7 and 8)
show significant deviations to low Reynolds numbers in microscale flows.
Fig. 7 depicts the friction coefficient, f, for water as a function of the Reynolds number calculated
with viscosity at room temperature for square cross section, for five different hydraulic diameters
ranging from 50µm to 522µm. The results show that scale effects are significant in smaller Dh
channels, where friction in the water flows clearly deviates from the classical laminar theory for Re
< 100.
H2O Square
0.01
0.10
1.00
10.00
100.00
1 10 100 1000 10000
Re
fDarcy
f = 56.92/Re
S_500
S_300
S_200
S_100
S_050
Fig. 7 Friction factor variation for distilled water in square
cross section channels. 50µm ≤ Dh ≤522µm. ---- f.Re=constant
Fig. 8 Variation of the Nusselt number with the
Reynolds number in fully developed flows. Channel
S_300; q”eff ≈ 5000Wm-2; - water; - HFE7100; -
methanol
In Fig. 8, the average Nu is plotted against the Reynolds number for three fluids, water, methanol
and HFE7100. The straight lines represent the Nu analytical value of 3.61 predicted by the laminar
theory. The variations from “macroscale” are evident for all the fluids (water, methanol and
HFE7100) for lower Reynolds numbers.
These deviations are attributed to the lowering of the interfacial activity associated to the
0
2
4
6
8
0 50 1000 1500 2000
Re
Nu
H2O, 5069W.m-2
HFE7100, 4461W.m-2
CH3OH, 5075W.m-2
Nu = 3.61

15th Int Symp on Applications of Laser Techniques to Fluid Mechanics Lisbon, Portugal, 07-10 July, 2008
-9-
hydrophobic character of the channel internal wall induced by air pockets entrapped within the
walls asperities (Silvério et al., 2009), as observed by Moreira et al. (2007) and by Bonaccurso et al.
(2002) in the flow of water in micro-tubes of glass.
5.1. Velocity measurements Velocity measurements have been performed in water and methanol flows established in square
cross section channels. Measurements are obtained far from the distance required for the flow to
attain 99% of the fully developed centerline velocity, as given by 0.056Re.Dh, (Spurk and Aksel,
2008), such that the flow is surely fully developed. This is confirmed by comparing the mean
velocity profiles taken at downstream locations (Fig. 9). The flow is not expected to vary in the
streamwise direction across the length of the PIV image, unless there are spatial variations caused
by surface roughness effects. The velocity fields are measured at several horizontal planes over the
channel height (y direction).
The data plotted in Figures 9, 10 and 11 are obtained with a time delay of 20µs between image pairs. Regarding the optimization of the signal-to-noise ratio, a time delay between laser pulses ranging
from 100 to 300µs and a repetition rate of 15Hz are used to have a maximum particles displacement of approximately ¼ of the interrogation area extent. The PIV interrogation regions used here each
contain an average of five particles (8.28µL particles to 1mL of deionized water corresponding to a concentration of 2.31x10
8particles.mL
-1). This concentration of seed particles is small enough that
any two-phase effects are considered negligible, and the working fluid can be considered a
single-phase fluid.
Fig. 9 Velocity vector field at five different downstream
locations.
Fig. 10 Velocity vector field inside the S_200
micro-channel for Re=10 at the horizontal plane height
y=40µm overlapping the micro-channel image. Axial distance, z0=28.21mm
The time average correlation algorithm is applied over 100 correlation maps (Meinhart et al., 2000).
The lens used in the experiments has M=40 and NA=0.55, which corresponds to a
depth-of-correlation value of 6.5µm (Silva et al., 2008b). In other words, particles up to ±3.25µm in front or behind the object plane may be enough in focus to be included in the measured velocity.
Fig. 10 shows the velocity vector field in the S_200 square cross-section borosilicate glass
micro-channel with an InOx thin film deposited on the channel outer wall, acquired at ambient
temperature. The mass flow inlet value was set to a value of 1.91x10⁻⁶kg.s
-1 that corresponds to the
volumetric flow rate of 115µL.min-1. The measurement volume is located 156µm from the bottom wall (40µm from the horizontal midplane). The Reynolds number of these flows based on hydraulic diameter and area-averaged velocity is 10.

15th Int Symp on Applications of Laser Techniques to Fluid Mechanics Lisbon, Portugal, 07-10 July, 2008
-10-
The interrogation regions for the measurements shown in Fig. 11 were 64 by 64 pixels with a 50%
overlap in both the horizontal and vertical directions. Hence, a distance between individual vectors
of 5.92 x 5.92µm2 was attained and measurements were found to be within 5.92µm of each wall.
The consistency of vectors along the streamwise direction shows the fully developed flow.
Fig. 11 Comparison between the measured velocity
profile for S_200 micro-channel for Re=10 at the
horizontal plane height y=40µm (), and the analytical solution from equation 4 ().
0 20 40 60 80 100 120 140 160 180 200 220 240 260 280 300 320 340 360 380 400 420 440 460 480 500 520 540 560 580µm
0
20
40
60
80
100
120
140
160
180
200
220
240
260
280
300
320
340
360
380
400
420
µm
Image size: 1600×1186 (0,0), 8-bits (frame 1)
Burs t#; rec#: 1; 1 (1), Date: 02-05-2008, Time: 10:58:17:000
Analog inputs : 0.000; 0.000; 0.000; 0.0000 20 40 60 80 100 120 140 160 180 200 220 240 260 280 300 320 340 360 380 400 420 440 460 480 500 520 540 560 580µm
0
20
40
60
80
100
120
140
160
180
200
220
240
260
280
300
320
340
360
380
400
420
µm
Image size: 1600×1186 (0,0), 8-bits (frame 1)
Burs t#; rec#: 1; 1 (1), Date: 02-05-2008, Time: 12:00:11:000
Analog inputs: 0.000; 0.000; 0.000; 0.000
Fig. 12 Example of a clean channel wall (left) and a
contaminated wall with particle agglomerates (right).
The discrepancy between the PIV measurements and the velocities predicted by equation (4) is less
than 1% near the center and increases to 12.6% for the measurements closest to the wall. The
under-prediction of velocity for distances from ¼ of the channel to the wall is probably due to
near-wall measurement effects. The hydrodynamic interactions between the particle and the wall
and background reflections from the wall overshadow particle images (Fig. 12). In addition to the
challenges of understanding and predicting the flow behavior, understanding and predicting the
response of the particles adds considerable complexity.
Although the InOx thin film has an average visible transmittance of approximately 81%, it does not
contribute in a significant manner to the overall error registered near the wall. The major
contributors are the shape of the channel and particle agglomerates. The square channel has rounded
exterior corners (Fig. 2) that can induce distortion near the walls (Jenkins and White, 1981) while
particles agglomerates forming close to the walls will contribute for the error in measurements due
to their higher intensity emission. Techniques to improve PIV image interrogation near stationary
interfaces are discussed by Theunissen et al. (2008).
A similar experimental methodology was employed to obtain the velocity profiles for the methanol
flow in the S_300 channel. The profiles are plotted in Fig. 13 for two different Reynolds numbers.
Fig. 13 Velocity profiles obtained for methanol flow in S_300 at Re=10 and Re=14.
15th Int Symp on Applications of Laser Techniques to Fluid Mechanics Lisbon, Portugal, 07-10 July, 2008
-11-
For comprehensiveness, it was also matched up the volumetric flow rate yielded by the integration
of the µPIV 2D flow fields (Fig. 14b) against that derived for the syringe pump used in the experiments. In this case, the volumetric flow rate predicted using the velocity profile
measurements were within 4.12% of the volumetric flow rate established by the syringe pump. It is
to note that the uncertainty associated with the volumetric flow rate imposed by the syringe pump is
of the order of 1.00%.
Based on the analytical results from equation (4), the ratio maximum velocity at the channel
midplane umax to mean velocity um for the square channels is found to be 2.57.
a) b)-100
-500
50100
0
100
200
0
50
100
x [µµµµm]y [µµµµm]
u [mm/s]
Fig. 14 Integration of 2D velocity profiles for water flow in S_200, Re=10 a) attained from the analytical solution from eq.
4 and b) measured with µPIV.
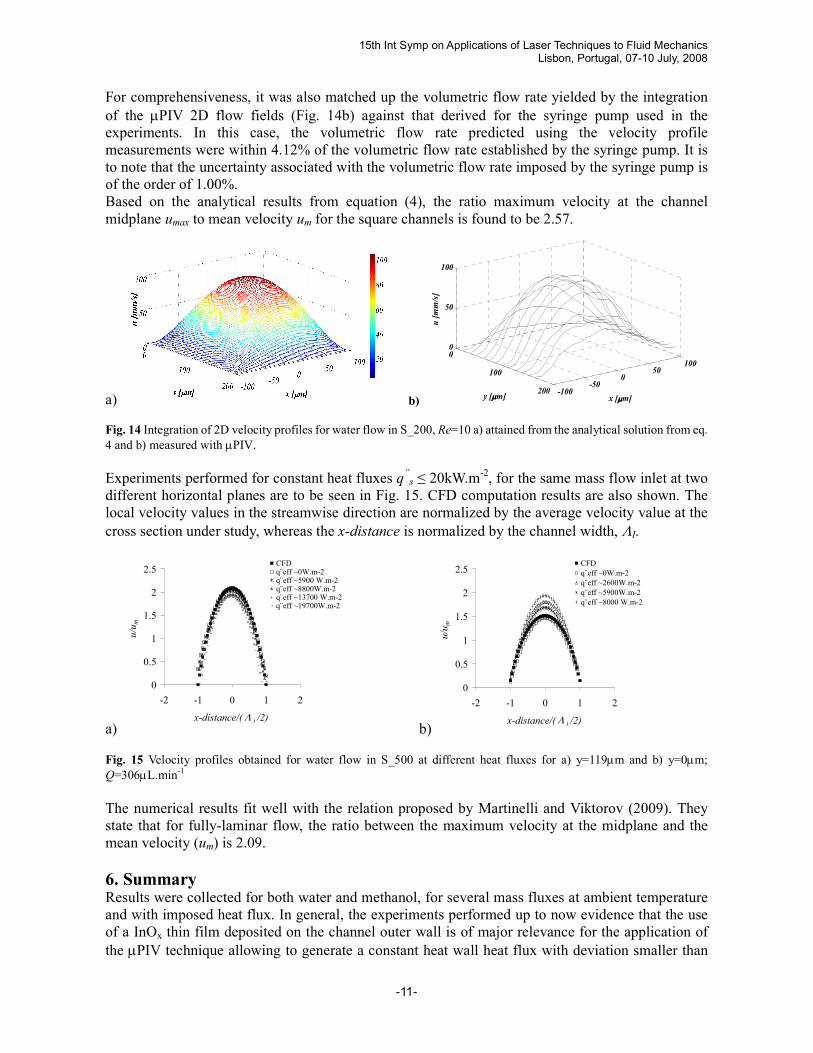
Experiments performed for constant heat fluxes q”s ≤ 20kW.m
-2, for the same mass flow inlet at two
different horizontal planes are to be seen in Fig. 15. CFD computation results are also shown. The
local velocity values in the streamwise direction are normalized by the average velocity value at the
cross section under study, whereas the x-distance is normalized by the channel width, ΛI.
a)
0
0.5
1
1.5
2
2.5
-2 -1 0 1 2
x-distance/(Λ i /2)
u/u
m
CFDq¨eff ~0W.m-2q¨eff ~5900 W.m-2q¨eff ~8800W.m-2q¨eff ~13700 W.m-2q¨eff ~19700W.m-2
b)
0
0.5
1
1.5
2
2.5
-2 -1 0 1 2
x-distance/(Λ i /2)
u/u
m
CFD
q¨eff ~0W.m-2
q¨eff ~2600W.m-2
q¨eff ~5900W.m-2
q¨eff ~8000 W.m-2
Fig. 15 Velocity profiles obtained for water flow in S_500 at different heat fluxes for a) y=119µm and b) y=0µm; Q=306µL.min-1
The numerical results fit well with the relation proposed by Martinelli and Viktorov (2009). They
state that for fully-laminar flow, the ratio between the maximum velocity at the midplane and the
mean velocity (um) is 2.09.
6. Summary Results were collected for both water and methanol, for several mass fluxes at ambient temperature
and with imposed heat flux. In general, the experiments performed up to now evidence that the use
of a InOx thin film deposited on the channel outer wall is of major relevance for the application of
the µPIV technique allowing to generate a constant heat wall heat flux with deviation smaller than

15th Int Symp on Applications of Laser Techniques to Fluid Mechanics Lisbon, Portugal, 07-10 July, 2008
-12-
0,6% at the same time that it allows keeping high levels of transmittance (≈81%). Deviations of the velocity measurements are estimated to be smaller than 1% at the channel
midplane, increasing to about 13% near the walls for non heated S_200. By integrating µPIV 2D flow velocity fieds, showed results were within 4.12% of the volumetric flow rate established by the
syringe pump.
Velocity distributions are further analyzed based on computational predictions performed with
Fluent® for the heated flow and the experimental data is found to be in fairly good agreement with
calculated values. The results show a decrease of the mean velocity gradient at the tube wall with
the heat flux, in detriment of an increase at the middle plane. Overall, the combination of simultaneous measurements of temperature, pressure and the flow velocity profiles in well defined homogeneous transparent channel walls with or without heat transfer is a major asset to assist in the comprehension of fluid flow behavior in microscale flows.
General qualitative agreement was found between experimental two-phase flow patterns
encountered in horizontal circular cross section micro-channels and larger circular channels. In
addition to the usual inertia, viscous and pressure forces present in single-phase flow, two-phase
flows are also affected by interfacial tension forces, the wetting characteristics of the liquid on the
tube wall, and the exchange of momentum between the liquid and the vapor phases in the flow. Quantitative agreement is to be evaluated and two-phase flow patterns, pattern transitions and pattern maps are potentially developed using the experimental facility described above.
7. References Abe Y, Ishiyama N (2006) Titanium-doped indium oxide films prepared by D.C. magnetron
sputtering using ceramic target. J. Mater. Sci 41:7580-7584
Agarwal A (2006) Heat transfer and pressure drop during condensation of refrigerants in
micro-channels. Dissertation, Georgia Institute of Technology
Bertsch S, Groll EA, Garimella SV (2008) Review and comparative analysis of studies on saturated
flow boiling in small channels. Cooling Technologies Research Center, Purdue Libraries pp 1-54
Bonaccurso E, Kappl M, Butt H-J (2002) Hydrodynamic force measurements: boundary slip of
water on hydrophilic surfaces and electrokinetic effects. Physical Review Letters 88(7):076103
Celata GP, Cumo M, Marconi V, McPhail SJ, Zummo G (2006) Microtube liquid single-phase heat
transfer in laminar flow. Int. J. Heat and Mass Transfer 49: 3538-3546
Collier JG, Thome JR (1994) Convective boiling and condensation. 3rd Ed. Oxford University Press,
NY, pp 8-32
Croce G, D’Agaro P, Nonino C (2007) Three-dimensional roughness effect on micro-channel heat
transfer and pressure drop. International Journal of Heat and Mass Transfer 50:5249–5259
Dekkers JM, Rijnders G, Blank DH (2006) Role of Sn doping in In2O3 thin films on polymer
substrates by pulsed-laser deposition at room temperature. Appl. Phys.Lett., 88:151908
Gamrat G, Favre-Marinet M, Asendrych D (2005) Conduction and entrance effects on laminar
liquid flow and heat transfer in rectangular micro-channels. International Journal of Heat and
Mass Transfer 48:2943–2954
Hsieh CC, Wang SB, Pan C (1997) Dynamic visualization of two-phase flow patterns in a natural
circulation loop. Int. J. Multiphase Flow 23:1147-1170
Horiuchi K, Dutta P (2004) Joule heating effects in electroosmotically driven micro-channel flows.
International Journal of Heat and Mass Transfer 47(14-16):3085-3095
Hrnjak P, Tu X (2007) Single phase pressure drop in micro-channels. International Journal of Heat
and Fluid Flow 28:2-14
Husain A, Kim K-Y (2008) Optimization of a micro-channel heat sink with temperature dependent
fluid properties. Applied Thermal Engineering 28:1101–1107
Jenkins FA, White HW (1981) Fundamentals of optics. International Student Edition, 4th ed.,
McGraw-Hill, pp 44-59
Kuddusi L, Çetegen E (2007) Prediction of temperature distribution and Nusselt number in

15th Int Symp on Applications of Laser Techniques to Fluid Mechanics Lisbon, Portugal, 07-10 July, 2008
-13-
rectangular micro-channels at wall slip condition for all versions of constant heat flux.
International Journal of Heat and Fluid Flow 28:777-786
Lelea D (2007) The conjugate heat transfer of the partially heated micro-channels. Heat and Mass
Transfer 44:33–41
Liu C, Matsutani T, Yamamoto N, Kiuchi M (2002) High-quality indium tin oxide films prepared at
room temperature by oxygen ion beam assisted deposition. Europhys. Lett. 59(4):606
Liu J-T, Peng X-F, Yan W-M (2007) Numerical study of fluid flow and heat transfer in
micro-channel cooling passages. International Journal of Heat and Mass Transfer 50:1855–1864
Martinelli M, Viktorov V (2009) Modelling of laminar flow in the inlet section of rectangular
micro-channels. Journal of Micromechanics and Microengineering 19: 025013
Meinhart CD (2007) Surface/fluid interactions in micro & nano-channels. AFSOR FA9950-04-0106
Meinhart CD, Wereley S, Santiago JG (2000) A PIV algorithm for estimating time-averaged
velocity fields. Journal of Fluids Engineering 122:285-289
Moreira ALN, Moita AS, Cossali E, Marengo M, Santini M (2007) Secondary atomization of water
and isooctane drops impinging on tilted heated surfaces. Experiments in Fluids 43(2-3):297-313
Morini GL, Spiga M (2007) The role of the viscous dissipation in heated micro-channels.
Transactions of the ASME 129:308-318
Ngoma G D, Erchiqui F (2007) Heat flux and slip effects on liquid flow in a micro-channel.
International Journal of Thermal Sciences 46:1076–1083
Nunes de Carvalho C, Lavareda G, Parreira P, Valente J, Amaral A, Botelho do Rego AM (2008)
Influence of oxygen partial pressure on the properties of undoped InOx films deposited at room
temperature by rf-PERTE. Journal of Non-Crystalline Solids 354:1643–1647
Parreira P, Lavareda G, Valente J, Amaral A, Nunes de Carvalho C (2008) Undoped InOx films
deposited by rf-PERTE at room temperature: importance of substrate. 2nd International
Conference on Advanced Nano Materials, AIBAP and Indian Institute of Technology, Aveiro
Santiago JG, Wereley ST, Meinhart CD, Beebe DJ, Adrian RJ (1998) A particle image velocimetry
system for microfluidics. Experiments in Fluids 25:316-319
Silva G, Leal N, Semião V (2008) Determination of micro-channels geometric parameters using
micro-PIV. Chemical Engineering Research and Design
Silva G, Leal N, Semião V (2008b) Micro-PIV and CFD characterization of flows in a
micro-channel: velocity profiles, surface roughness and Poiseuille numbers. International Journal
of Heat and Fluid Flow 29:1211–1220
Silvério V, Moreira ALN (2008) Friction losses and heat transfer in laminar micro-channel
single-phase liquid flow. 6th Int. Conference in Nanochannels, Minichannels and Micro-channels,
ASME, Darmstadt
Silvério V, Semião V, Moreira ALN (2009) Heat and momentum transfer in microscale laminar
fluid flow. III National Conference on Fluid Mechanics, Thermodynamics and Energy, APMTAC,
Bragança, Portugal
Spurk JH, Aksel N (2008) Fluid mechanics, 2nd Ed. Springer-Verlag, Germany, pp 268
Steinke ME, Kandlikar SG (2006) Single-phase liquid friction factors in micro-channels.
International Journal of Thermal Sciences, 45:1073-1083
Subrahmanyam A, Barik UK (2006) Electrical and optical properties of reactive D.C. magnetron
sputtered silver-doped indium oxide thin films: role of oxygen. Appl. Phys. A 84:221-225
Theunissen R, Scarano F, Riethmuller ML (2008) On improvement of PIV image interrogation near
stationary interfaces. Experiments in Fluids 45:557–572
Wereley ST, Meinhart CD (2005) Micro- and nano-scale diagnostic techniques. K. Breuer (Ed.),
Springer Verlag, New York
White FM (1974) Viscous fluid flow. McGraw-Hill 119-125
Yamada N, Shigesato Y, Yasui I, Li H, Ujihira Y, Nomura K (1998) Estimation of chemical states
and carrier density of Sn-doped In2O3 (ITO) by Mössbauer spectrometry. Hyperfine Int.

15th Int Symp on Applications of Laser Techniques to Fluid Mechanics Lisbon, Portugal, 07-10 July, 2008
-14-
112:213-216
Yen T-H, Shoji M, Takemura M, Suzuki Y, Kasagi N (2006) Visualization of convective boiling heat
transfer in single micro channels with different shaped cross-sections. Int. J. of Heat and Mass
Transfer 49:3884–3897