heat transfer measurements in partially ionized … · nasa cr-204 tech library kafb. nm heat...
TRANSCRIPT

N A S A C O N T R A C T O R
R E P O R T
d 0
HEAT TRANSFER MEASUREMENTS I N PARTIALLY IONIZED GASES
by P. H. Rose dad J. 0. Stmzkeuics
Prepared under Contract No. NASw-748 by AVCO-EVERETT RESEARCH LABORATORY Everett, Mass.
for
NATIONAL AERONAUTICS AND SPACE A D M I N I S T R A T I O N WASHINGTON, D. C. APRIL 1965
https://ntrs.nasa.gov/search.jsp?R=19650010801 2018-07-13T00:29:09+00:00Z
NASA CR-204 TECH LIBRARY KAFB. NM
HEAT TRANSFER MEASUREMENTS IN PARTIALLY IONIZED GASES
By P . H. Rose and J. 0. Stankevics
Distribution of this report is provided in the interest of information exchange. Responsibility for the contents res ides i n the author or organization that prepared i t .
Prepared under Contract No. NASw-748 by
Everet t , Mass. AVCO-EVERETT RESEARCH LABORATORY
for
NATIONAL AERONAUTICS AND SPACE ADMINISTRATION
For sale by the Office of Technical Services, Deportment of Commerce,
Washington, D.C. 20230 -- Price $2.00
__ "_ " ~ ~~~~


ABSTRACT
Over the past few yea r s a number of theoretical and experimental
investigations have been published on the subject of convective energy trans-
port in a high temperature partially ionized gas. Although, in general a
fair degree of understanding of this process is now available, certain un-
certainties have arisen, particula.rly with respect to the effect of the sur-
face mater ia l of the heat transfer gage. This experimental investigation
brings a new technique of making heat transfer measurements to bear on
this problem.
The infrared heat transfer gage developed by Camac has been adapted
to the problems peculiar to this experiment. An analysis is presented which
demonstrates the response required of the'measurement in order to enable
accurate heat t ransfer measurements to be made within the limited test
times available. The difficulties of adapting the gage to the requirements
are described, in particular the sensit ivity, opacity, and adherence of the
gage to the MgO window. The calibration of the absolute magnitude of the
output of the infrared cell as well as the response t ime of the measuring
sys tem a re descr ibed in de ta i l . The response of the gage to the heat trans-
fer encountered in both the shock tube end wall and on a model are discussed
with emphasis on the identification of radiative heat transfer effects.
The heat transfer results support the previous results of the authors
with calor imeter gages as wel l as those of other investigations. Variations
of the gage surface material achieved by overcoating the carbon with thin
metallic films did not change the heat transfer rates measured, in contrast
to the results reported by Warren. In view of the fact that the metallic
films used do not change the calibration of the gage this is felt to be a
conclusive result regarding the effect of surface mater ia ls .

TABLE O F CONTENTS
SECTION
Abstract
I. Introduction
11. Analysis of Gage Response
111. Experimental Techniques and Instrumentation
IV. Calibration of the Infrared Gage System
V. Heat Transfer Resul t s
VI. Summary and Conclusions
References
Page
iii
1
3
13
21
39
43
45
-V-


LIST OF SYMBOLS
C
cP h
k
P N u / K e
P
Pr
Q
4 RN
T
t
US
X
P
(5
e
S
w
1
2
specific heat
gas specific heat
enthalpy per unit mass
thermal conductivity
thickness
hea t t ransfer parameter
loca l p ressure
Prandtl number, Cp p/k
heat transfer coefficient
heat t ransfer ra te
nose radius of axisymmetr ic body
temper a tur e
t ime
incident shock wave velocity
length dimension in the gage measured from the interface of the carbon and window material
mass densi ty
SUBSCRIPTS
end wall
stagnation condition
wall
carbon layer
IR transmitt ing window
-vii -

SECTION I
INTRODUCTION
Accurate definition of the severity of the planetary entry problem
has been made difficult by the complexity of performing experiments in
this environment. Although several experimental studies” 2’ have indi-
cated a general agreement of their measurements with the theoret ical work
of Fay and Kemp, Pallone, and Hoshizaki, it has been pointed out that
all these measurements depended on a common technique, the platinum,
ca lor imeter , o r th ick film res i s tance thermometer . Exper iments by
Gruszczynski and Warren7 have indicated that resul ts of considerable var i -
ance can be obtained by the simple expediency of changing the gage ma-
t e r i a l of the ca lor imeter .
6
In this si tuation i t was felt that a completely independent measure-
ment of convective heat transfer by a different experimental technique would
be worthwhile in settling the uncertainties which have been raised by the
above experimental facts. The infrared heat transfer gage developed by
Camac8 appeared to be available to make this independent judgment. Not
only does this gage measure heat transfer through a completely different
sensor system, but i t also had the added advantage of being able to assess
the effects of surface materials without a change in the calibration of the
instrument . This , of course, could be accomplished by coating the same
carbon infrared emit t ing surface with metal l ic coat ings of var ious e lements ,
and yet not change the infrared emission characterist ics of the carbon.
This paper reports on an experiment in which the infrared heat
t ransfer gage was adapted to measure the s tagnat ion point heat t ransfer
on the spherical nose of a model. The experiments were performed in a
six-inch I. D. arc-heated driver shock tube thoroughly discussed in the
l i terature. The existence of a homogeneous hot gas sample of predictable
conditions in this shock tube has been documented in Refs. 1 and 9 . In the
present experiments the tube w a s used a t a length of 30 feet and an init ial
p r e s s u r e of 0 . 2 5 m m Hg of air.

The principle of the infrared heat transfer gage has been discussed
in detail by Camac. In i ts simplest form, the gage consists of a thin, but
opaque, surface of carbon deposited in good thermal contact on an infrared
transmitt ing window. The carbon surface is exposed to the heat transfer
medium while the rear surface of this layer is viewed through the window
with a wide angle optical system which is imaged on the infrared detector.
The obvious advantage of this gage is that i t is electrically decoupled from
the gas and consequently there is no mechanism by which the ionized gases
can interfere with the gage output.
The purpose of the present experiment was to combine these two
techniques to provide the confirmation of the previous work on convective
heat transfer. This combination has required the solution of a number of
problems, such as gage sensit ivity, gage opacity, gage response, analysis
of the data taken in times only somewhat longer than the gage response, and
system calibration. The approaches and solutions found to these problems
as well as the results will be discussed briefly in the following sections.
2

SECTION I1
ANALYSIS OF GAGE RESPONSE
The temperature response of an infinite slab to an ideal heat transfer
pulse has been thoroughly covered in the literature; l o a constant heat trans-
fer ra te gives the fami l ia r r i se of surface temperature varying with the
square root of time, and a heat t ransfer ra te decaying as l / f i gives the
familiar jump to a constant temperature. The infrared heat transfer gage
response to such an ideal heat transfer pulse has been treated by Camac. 8
The problem is made more complex by the fact that the infrared detector
is imaged on the rear sur face of the carbon layer.
Two factors complicate the analysis still further; one, the gage sys -
tem a lso has a finite response time which with extreme care can be kept
to about one microsecond, and second, the heat pulse imposed on the ele-
ment is an odd combination of ideal pulses, i. e. , one that decays inversely
with the square root of t ime as the shock is reflected off the nose of the
model and approaches the steady state geometry and the second a constant
heat transfer rate pulse after the flow geometry has been established.
The interrelation of these three effects and their relationship to
achieving accurate heat transfer measurements within the test time avail-
able has been investigated in some detail. Following Camac, for an arbi-
t ra ry hea t t ransfer ra te t ime h i s tory , 4 ( t ) , the convolution theorem gives
the tempera ture response a t the interface of a composite surface, i. e. ,
a t x = O , a s
f
where Tg ( t ’ ) is the temperature response to a 6 function heat input at time
3

t = t’ . This temperature response can be writ ten as
F o r the case of the heat transfer rate decaying inversely with the Q
square root of t ime, i. e . , ;1 = 4; , Eq. ( 3 ) can be shown to be numerically
equal to the result used by Camac to show the effect of the thermal l a g of
the carbon layer, i. e . ,
The second effect which must be considered is that although the tem-
perature response of the interface is the desired quantity, the actual infrared
gage output as indicated on the oscilloscope, lags behind this quantity by the
finite time response of the gage amplifier oscilloscope circuit. If we r e -
place all the circuit elements by a capacitance and resistance in the simple
circuit shown below
I I
then the problem is reduced to finding the accuracy with which E ( t )
responds to its input E. ( t) . I t can be shown that the current in the resistor
R can be writ ten as
out
In
4

where 7 = R C. If we assume that we are operating in a linear region of
the gage output curve i. e . T aE, which is only true approximately and
over a limited temperature range, then the above
Thus, even though the input to the IR gage
the output would be degraded by the time constant
can be writ ten as
were perfect , i .e . , Tin( t ) ,
of the system, 7 2.
The third effect is due to the complex heat pulse imposed on the model.
When the incident shock arr ives a t the model, it reflects initially as it would
off a solid end wall. The initial reflected shock velocity is known from the
Rankine-Hugoniot equations, i. e . , Ref. 11. At a shock velocity of 8mm/psec
and an init ial pressure of 0 . 25 m m of Hg, the reflected shock will start at
a velocity of 1. 11 mm/p sec and would thus have a characteristic e-folding
time to achieve its steady state location of approximately E R / 1. 11 , where
E i s the density ratio across the shock and Rs is the radius of the bow shock
in i ts permanent geometry. For a body with a nose radius of 1. 905 cm this
time would be almost 3 p sec.
S
During these three microseconds the heat transfer to the body would
be essentially that characterist ic of an end wall of a shock tube, i. e . , a
rate decaying inversely with the square root of t ime. This is the behavior
of heat transfer through a thermal boundary layer growing with time. At
some time the three-dimensional effects will become dominant, and the vis-
cous boundary layer will form to its steady geometry. This time has been
estimated to be roughly the time required for a sound wave to reach the sonic
point; which can be approximated by the nose radills divided by the stagna-
tion sound speed. F o r the above conditions, this amounts to 6 to 7 micro-
seconds. Such times are in agreement with the times estimated for the
calorimeter heat transfer gage output to reach a steady value. Thus, a
significant length of t ime is taken up by this process of setting up the steady
flow geometry.
I t is possible to estimate the expected heat transfer rates during
this transient period. A s the simplest approximation we assume that the
5
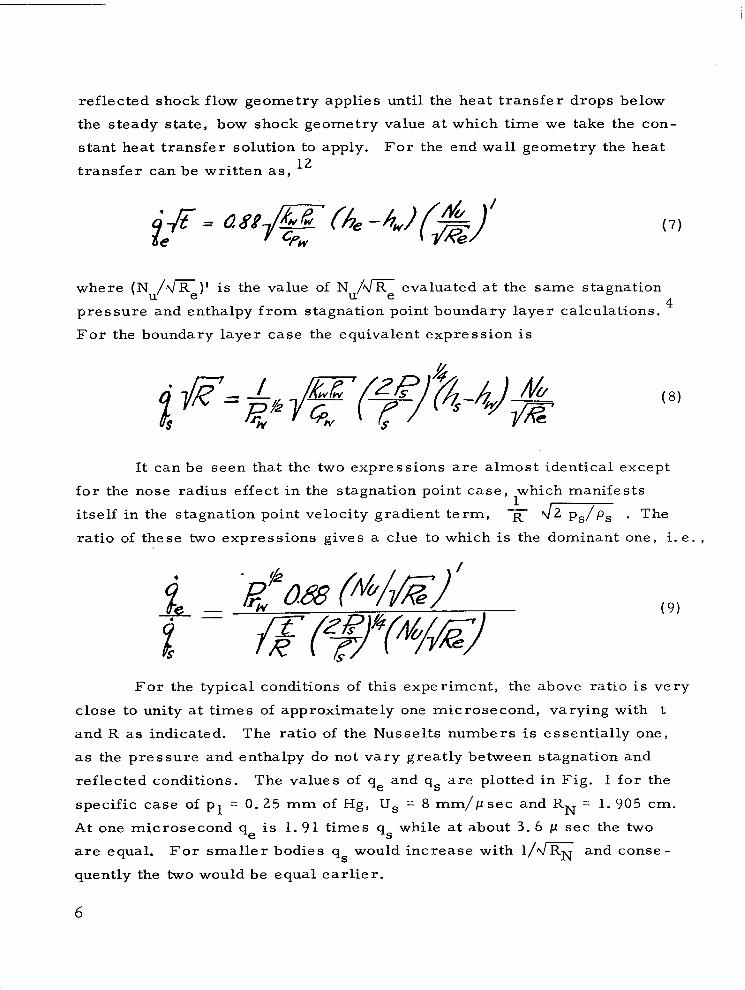
reflected shock flow geometry applies until the heat transfer drops below
the steady state, bow shock geometry value at which time we take the con-
stant heat transfer solution to apply. For the end wall geometry the heat
transfer can be writ ten as, 12
where ( N /me)' is the value of Nu/% evaluated at the same stagnation
pressure and enthalpy from stagnation point boundary layer calculations.
F o r the boundary layer case the equivalent expression is
U 1
It can be seen that the two expressions are almost identical except
fo r the nose radius effect in the stagnation point case, which manifests
itself in the stagnation point velocity gradient term, 4- . The 1
ratio of these two expressions gives a clue to which is the dominant one, i. e . ,
F o r the typical conditions of this experiment, the above ratio is very
close to unity at t imes of approximately one microsecond, varying with t
and R as indicated. The ratio of the Nusselts numbers is essentially one,
as the pressure and enthalpy do not vary greatly between stagnation and
reflected conditions. The values of qe and qs are plotted in Fig. 1 for the
specific case of p1 = 0 . 2 5 mm of Hg, Us = 8 mrn/psec and RN = 1.905 cm.
At one microsecond qe is 1.91 t imes qs while a t about 3 . 6 1-1 sec the two
are equal . For smaller bodies qs would increase with I/% and conse-
quently the two would be equal earlier.
6

24
20
16
cu E < 3 12 x I
-U
8
4
Us= 8.0 mm /p sex
RN= 1.905 cm
PI =0.025 cm Hg-AIR
q = IO K W / C M ~
(FAY 8 KEMP EQ.AIR-15%)
_ _ ~ r \
" I . I I 4 8 12
TIME-SEC X 16
Fig. 1 Estimate of t ransient heat t ransfer t ime his tory a t the stagnation point of a spherical nosed body.
7

In order to determine the requirements on the IR gage system to
accurately reproduce the heating rates within the limit of t e s t times avail-
able , in terms of the lag times due to the carbon layer, as well as the c i r -
cuitry, numerical experiments were performed. Using the heat trans-
fer t ime his tory shown in Fig. 1, we determined the temperature response
of the window-carbon interface from Eq. (3) for various values of 7 This
result can then be used as Tin(t) in order to evaluate the effect of f inite cir-
cuit response by use of Eq. (6) with various values of 7 The resulting
Tout(t) is representative of the signals which are interpreted as the response
of the gage to the heating in the actual experiments.
1'
2'
The final step in the numerical experiment is to subject the T ( t )
in the usual manner for reduction of transient heat transfer data. This is
accomplished by solution of the inver ted form of the heat conduction equation
out
(13), i. e . , t
0 - The resulting plots of hea t t ransfer ra te , ;1 vs t ime, give the degree
to which the input data have been degraded due to various values of 7 and
7 3 . A se t of such results, are shown in Figs. 2 and 3. It was concluded L
from these results that values Of 7 5 10 and 7 -= 2 x 10 seconds were -7 -6 2 -
tolerable under the experimental conditions. Figure 4 shows an example
of the Tout'") history which is the temperature history expected in the experi-
ments. The plot is made for the values of 7 and 7 typical for the present
experiments , 10 and 10 secs respectively. -7 -6 1
This judgment is of course strongly tempered by the test times avail-
able in the experiment. If the transient phase consumes approximately
5 p sec and the lags of the measurements are such as to spread this t ime
into 10 p sec, i t will be very marginal to make meaningful experiments in
test t imes much less than 20 psec. The performance of the shock tube
used with respect to achievement of a uniform test gas has been discussed
in Ref. 9 and is reasonably predictable from the work of Roshko. l4 At the
conditions of the present experiments average test times of 15 p s e c a r e
8

I . .
I
Us = 8 m m / p SEC
PI = 0.25 mm Hg RN= I. 905 cm
I O 20
TIME - /L SEC
3
Fig. 2 Effect of thermal response of the window-carbon interface, T~ on stagnation point heat transfer t ime histories.
9

Fig. 3
25
20
15
I O
5
I I
Us = 8 mm/pSEC
PI = 0.25 mm Hg R N = I .905 cm
IO
TIME IN p SEC
20 30
Effect of infrared gage circuit response t ime, T ~ , on stagnation point heat transfer rate time history.
10

70
60
50
Y 40
I- 3
2 30
20
I O
Fig. 4
I I I I I
US = 8 mm/pSEC
PI = 0.25 mm Hg RN' 1.905 cm
0 0
0
0
0
Degraded temperature t ime history calculated for the infrared detector output signal due to the heat transfer input shown in Fig. 1 for response t imes T~ and T~ typical for this experi- ment.
11

common. Thus the one to two microsecond criteria for the response of the
gage system appeared critical.
If the resolution function of any given instrument is know a pr ior i
then the measurement can of course be corrected after the fact for the
degradation of information due to this resolution. For the case of the c i r -
cuit response as shown in Eq. (6 ) , this is a reasonable procedure and can
be used to lessen the criteria on the electronics. Equation ( 6 ) can be in-
verted by use of Laplace t ransforms into a form where T . (t) can be
expres sed i n t e rms of the measured T (t) and the time constant of circuit ,
r 2 , giving
In
out
Equation (11) can thus be used to recover the original signal with some
degree of accuracy.
The above discussion of the difficulties of making accurate tempera-
ture measurements which in turn accurately reflect the heat transfer imposed
on the surface is extremely important for shock tube experiments in which
the tes t t imes a re very l imi ted . For the model experiments in the high ve-
locity range, the average test t imes are only two to four t imes as long as
the time required to set up the equilibrium flow geometry. A s a consequence,
i t is clear from these calculations that the response must be kept very fast ,
and that response times of the o rde r of one microsecond are required.
12
SECTION 111
EXPERIMENTAL TECHNIQUES AND INSTRUMENTATION
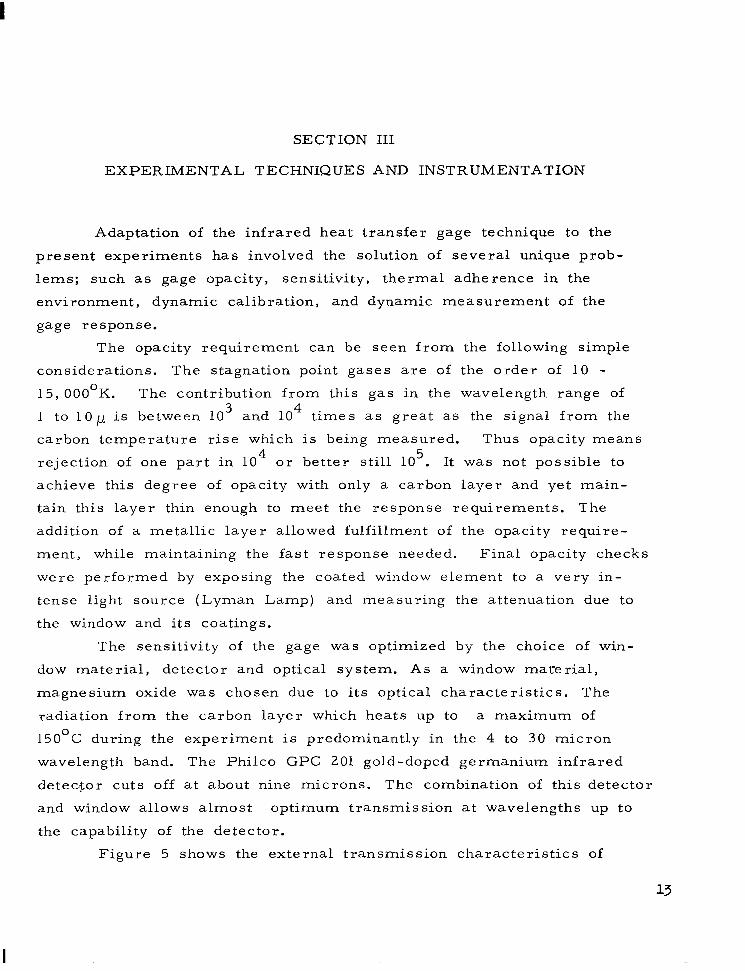
Adaptation of the infrared heat transfer gage technique to the
present experiments has involved the solution of several unique prob-
lems; such as gage opacity, sensit ivity, thermal adherence in the
environment, dynamic calibration, and dynamic measurement of the
gage response.
The opacity requirement can be seen from the following simple
considerations. The stagnation point gases a re of the order of 1 0 - 15, O O O ° K . The contribution from this gas in the wavelength range of
1 to 10 IJ- i s between 10 and 10 t lmes as g rea t as the signal from the
carbon temperature r ise which is being measured. Thus opacity means
rejection of one par t in l o 4 o r be t t e r still lo5. It was not possible to
achieve this degree of opacity with only a carbon layer and yet main-
tain this layer thin enough to meet the response requirements. The
addition of a metallic layer allowed fulfillment of the opacity require-
ment, while maintaining the fast response needed. Final opacity checks
were performed by exposing the coated window element to a very in-
tense l ight source (Lyman Lamp) and measuring the attenuation due to
the window and its coatings.
3 4 .
The sensit ivity of the gage was optimized by the choice of win-
dow mater ia l , detector and opt ical system. A s a window mat'erial,
magnesium oxide was chosen due to its opt ical character is t ics . The
radiation from the carbon layer which heats up to a maximum of
150°C during the experiment is predominantly in the 4 to 30 micron
wavelength band. The Philco GPC 201 gold-doped germanium infrared
detector cuts off at about nine microns. The combination of this detector
and window allows almost optimum transmission at wavelengths up to
the capability of the detector.
Figure 5 shows the external transmission characterist ics of
I

1.0
.90
.80
.70
w o .60 z 2 I- I v) z
- .50
a .40
k
.30
.20
.I 0
0
I I I I I I r
l - MAGNESIUM OXIDE (0.5 mmTHICK)
- - SAPPHIRE (0.5 mm THICK) -.- FUSED SILICA* 7940
(IO mm THICK) I! II -
I I L I I \ I
I 1
I
I I I I I 1 I I
I
I
I
I
I
\ \ 4 I I I
I I I I I I I I I I I I I I
1. \
.I .2 .4 .6 .8 1.0 2 4 6 8 IO
WAVELENGTH-X- (MICRONS)
Fig. 5 Transmiss ion of fused magnesium oxide (MgO) windows (0. 5 mm th ick) .
14
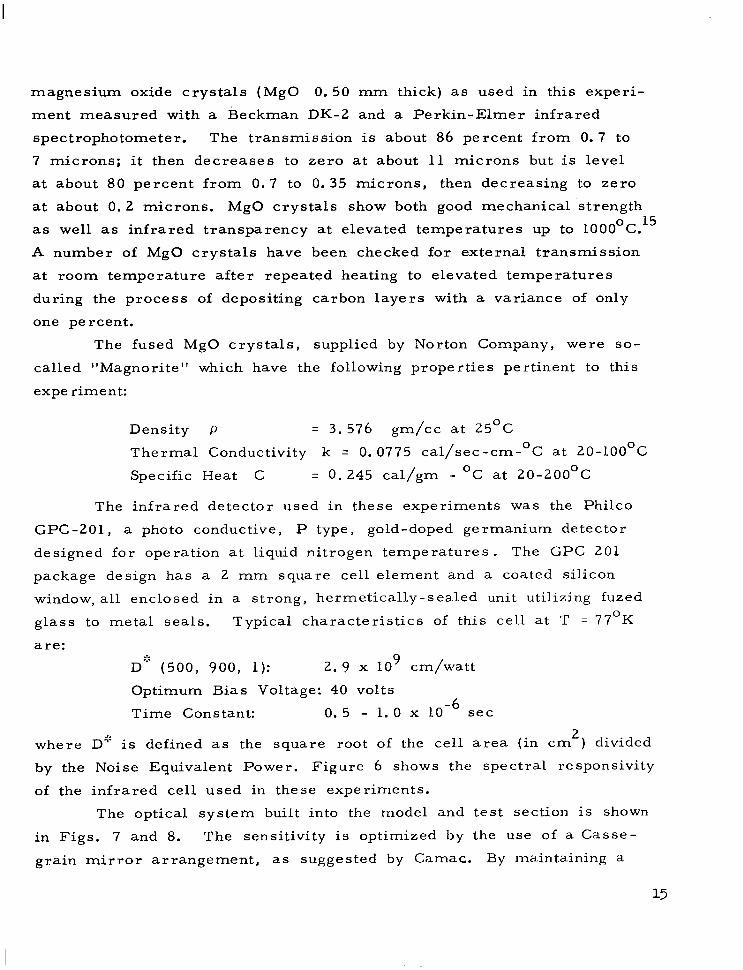
magnesium oxide crystals (MgO 0. 50 mm thick) as used in this experi-
ment measured with a Beckman DK-2 and a Perk in-Elmer in f ra red
spectrophotometer. The transmission is about 86 percent f rom 0.7 to
7 microns ; i t then decreases to zero a t about 11 microns but is level
at about 80 percent from 0.7 to 0.35 microns, then decreasing to zero
at about 0. 2 microns. MgO crystals show both good mechanical strength
as well as infrared t ransparency a t e levated temperatures up to 1000 C.
A number of MgO crystals have been checked for external transmission
at room temperature after repeated heating to elevated temperatures
during the process of depositing carbon layers with a variance of only
one percent.
o 15
The fused MgO crystals, supplied by Norton Company, were so-
called "Magnorite" which have the following properties pertinent to this
experiment:
The infrared detector used in these experiments was the Philco
GPC-201, a photo conductive, P type, gold-doped germanium detector
designed for ope ration at liquid nitrogen temperatures . The GPC 201
package design has a 2 mm square cell element and a coated silicon
window, all enclosed in a strong, hermetically-sealed unit utilizing fuzed
glass to metal seals . Typical character is t ics of this cell at T = 77OK
are : .I.
D'" (500, 900, 1): 2 . 9 x lo9 cm/watt
Optimum Bias Voltage: 40 volts
Time Constant: 0. 5 - 1. 0 x 10 s e c -6
where D"' is defined as the square root of the ce l l a rea ( in cm ) divided
by the Noise Equivalent Power. Figure 6 shows the spectral responsivity
of the infrared cell used in these experiments.
L
The optical system built into the model and test section is shown
in Figs. 7 and 8. The sensitivity is optimized by the use of a Casse-
gra in mir ror a r rangement , as sugges ted by Camac. By maintaining a

P TYPE (GOLD - DOPED) GERMANIUM INFRARED DETECTOR PHILCO "GPC -201"0058" -
\
-
0 2 4 6 8 WAVELENGTH - X- (MICRONS)
\ \
\ 7
IO 12
Fig . 6 Spectral responsibity of the Philco GPL-201 gold-doped germanium infrared detector used.
16

GOLD DOPED GERMANIUM
MgO WINDOW DIMENSIONS
REFLECTION CARBON COATED FUSED MAGNESIUM
ARC- DRIVEN SUPPORT FLANGE FOR SHOCK TUBE
SHOCK TUBE
VISIBLE PM FOR OPACITY CHECK
Fig. 7 Drawing of the infrared carbon gage, optical system and detector built into shock tube model.

Fig . 8 Photograph of the infrared heat transfer gage, detector and model mounted in the 6-inch diameter electric arc-driven shock tube.
18

spherical nose past the sonic point (approximately 40 ), a la rger d iam-
e t e r m i r r o r could be used to enhance the solid angle of the collector
system. In some experiments a phototube operating in the visible wave-
length region monitored the l ight in the mirror system for evidence of
transmitted l ight. '
0
The deposition of sufficiently uniform, thin and adhering carbon
layers on the MgO crystals was by chemical decomposition (pyrolysis)
of methyl iodide, CH I, as suggested by Camac. MgO windows,
0. 50 mm thick, were roughened on one side with "Norbide" #280 grit,
to a surface roughness of about 1/2 micron. On polished MgO crystals,
carbon coatings would invariably peel off. The clean, roughened, MgO
window was then placed on a platinum strip, rough side up, into a
vacuum bell jar containing a mixture of methyl iodide and helium. The
platinum and MgO windows were heated in this atmosphere, and the
C H I decomposes on contact with the hot surfaces. As an end product of
this decomposition we achieve a strong black layer of pyrolytic graphite
on the MgO substrate. A thickness of about 4000 - 8000 8 is deposited
in approximately 15 minutes, which i s opaque and measures to have opti-
cal densities between 5 and 8. (A unit of optical density i s a factor of
10 in the transmission measured at visible wavelengths. )
8 3
3
This method of deposition is assumed to produce pyrolytic graph-
i te. The high degree of anisotropy in the structure of pyrolytic graphite
results in thermal properties, other than specific heat, which are con-
siderably different from commercial graphite. In calculating the response
of the rear face of the carbon layer, as discussed in the previous sec-
tion, the properties of pyrolytic graphite were used as reported in Ref. 16.
These a re :
Density p = 2 . 2 2 gm/cc Thermal Conductivity k = . 0048 cal /sec-cm- C at 50 -150OC
Specific Heat C = 16 cal/gm - C a t 50 - 15OoC
Overcoating the carbon layer with a metall ic reflecting layer in-
0
0
P
creases the thermal l ag of the composi te s t ructure , increases the
opacity and changes the absorption characteristics of the surface. The
latter has the effect of allowing convective heat transfer measurements
19

to be made i n a radiating gas because most OS the incident radiation can
be reflected. The metallic layers, which were about 1000- 5000 x thick,
were vacuum coated onto the carbon sublayers. This thickness of metal
has a character is t ic thermal diffusion t ime an order of magnitude less
than the carbon, and thus the thermal response was not significantly
affected. Uniform deposition of metall ic films (aluminum, gold, copper,
Nichrome) was obtained by following Refs. 17 and 18. The coatings were
obtained by using hot multistrand helical tungsten filaments and room-
temperature coated MgO windows, all in a vacuum of 0. 4 x 10 to
mm of Hg. Each coating was checked both visually under a microscope
as well as in a dark room with the high intensity light source.
-4
The surface of these coatings exhibited the characteristics of the
carbon layers and appeared diffuse in reflectance. Since quantitative
work on the adherence of evaporated metal films on pyrolytic graphite i s
not available in the literature, we concluded from v i s u a l evidence that
chemically reactive metals, such as aluminum, which normally adhere
very well to glass, 17’ l8 and other clean, non-oily inorganic substrates,
also adhere to the carbon layer.
For calculations of the thermal lag and heat capacity effects due
to the metal films, the bulk properties of the pure metal were used.
However, it is known that the properties, particularly the strength, of
thin films can vary significantly from the bulk properties. 18

SECTION IV
CALIBRATION OF THE INFRARED GAGE SYSTEM
The calibration of the infrared heat transfer gage system consists
of calibration of the absolute value of the output as well as the response.
The former followed closely the procedure outlined by Camac' of replac-
ing the shock tube heat source by a black body heat source. A standard
black body source was constructed in which a black body cavity was
heated by well agitated silicon oil through the temperature range of O°C
to 19OoC. The cavity temperature was read by a number of thermo-
couples distributed to check the uniformity of the cavity. The set-up for
the calibration i s shown in F i g . 9. A beam chopper placed in front of
the black body source provides the AC method chopping at a frequency
of 5000/sec. The emission of the chopper blade serves as the reference
level as i t is seen by the detector when the system is "closed. " The
output of the cell is fed through a standard cathode follower to an am-
plifier whose output is displayed on the oscilloscope.
In the shock tube experiment, the heat transfer gage senses a
heating pulse of only 15 to 30 1.1 sec duration. The temperature of the
opaque layers r ises up to 15OoC during this time but the MgO window
remains essent ia l ly a t room temperature . The cal ibrat ion of the detector
output for these short pulses can be evaluated by a s e r i e s of four hypo-
thet ical measurements , as suggested by Ref. 8. Figure 1 0 shows
the results of the two actual measurements 'required by this calibration
procedure in terms of the infrared detector output plotted as a function
of the temperature of the black body source. The highest output of the
infrared cel l , V1, occu r s when the black body source is imaged directly
on the detector. Here,
21

GOLD DOPED GERMANIUM INFRARED
DETECTOR CELL
REFLECTION
ASSEMBLY MIRROR
Fig. 9
CHOPPER WHEEL
BLACK BODY
AIN OPTICAL
Calibration setup of infrared heat transfer gage assembly using the black body source. Radiation from the cavity is imaged by the gage optical system on the infrared cell.
22

IO
8
v)
0 ' 6 I
I- 3
k 3 0
3
n
g 4 I- o W I- W n
n 2 W
a a a LL z
0
- 2 0
Fig. 10
P TYPE (GOLD-DOPED) GERMANIUM INFRARED DETECTOR
"PHILCO GPC-201"
- I R CELL NOISE LEVEL 15 MV
0 BLACK BODY SOURCE
A BLACK BODY SOURCE WITH A MAGNESIUM OXIDE (MgC WINDOW IN BETWEEN THE SOUF AND THE I R DETECTOR - - CALIBRATION CURVE FOR EXPERIMENTS WITH VERY SHORT HEAT PULSES
. ". .
1
0 0
0
""T 40 80 120 I 6 0 200
BLACK BODY WALL TEMPERATURE "C
Calibration curves of the infrared heat transfer gage system.

where V i s the voltage output due to the black body source and V is
the signal due to the temperature of the chopper wheel. Vc is also the
signal from the black body when i t is a t the same temperatures as the
chopper blade.
B C
The lowest output curve in Fig. 10 is generated by the addition
of the MgO windows to the holes in the chopper wheel. These windows
degrade the transmission by the external transmission loss, X , averaged
over the spectral sensitivity of the gold-doped germanium detector.
These windows are, of course, at the chopper wheel temperature which
is essentially room temperature. This output, V is essentially 2
where the external transmission coefficient, X , is the result of combin-
ing the reflectivity at the two air-MgO interfaces , r , and the internal
absorption of the MgO , a, as follows
X = {I- z / e 2 - & X
A third output can be generated if the MgO window is allowed to
come to the temperature of the black body source and thus the output of
the detector will be V degraded only by one single reflection loss a t 1 the MgO -air interface.
A fourth output can be generated i f the MgO window is coated by
an opaque carbon layer, and the whole unit is maintained at the temper-
a ture of the black body source. The detector output can now be written
as
where E is the emissivity of the carbon-magnesium oxide interface.
24

Values of r of 0. 065 t . 005 have been measured for MgO. - The f i r s t t e rm in Eq. (16) represents the contribution of the
emission f rom the carbon layer (degraded by transmission through the
crystal and one reflection at the MgO-air interface) and the second term
is the contribution due to the radiation from the heated MgO windows.
For hea t pu lses of short durat ion, as are experienced in the
present experiments, the only contribution which is observed is due to
the opaque layer. Almost all of the window remains at room temper-
a ture and makes no contribution. Thus, the short pulse becomes in
quantities , t e r m s of the measured
since the emissivity of the carbon-MgO interface is very close to one.
The curve-marked cal ibrat ion curve in Fig. 10 is calculated from the
above equation.
The calibration of the system was checked periodically by
measuring the output of the cell when exposed to the black body source,
i. e . , V1. This value remained constant throughout the experiment
within + 4 percent. - From this calibration data an empirical relationship between
the calibration signal , V G J and the black body temperature has been
determined in the temperature range of 40° to 19OoC. The data fits
the following e quation ,
with the constants K 5 x and n = 2. 1 + 0. 1. -
This calibration procedure has been checked against a dynamic
calibration technique by Camac by a measurement of the end wall heat
transfer in argon. 8’19 The correspondence of the semi-static (chopper
wheel) and dynamic calibration has been assumed in these experiments.
In addition to the calibration of the infrared cell output discussed

above, the time response of the measuring system was determined. Two
methods were used. First , a pulse generator was used to impose an
electronic pulse through the infrared cell and amplifier onto the oscil lo-
scope. A schematic diagram of this calibration set-up is shown in
Fig. 1 1 . In this procedure care must be exercised to be sure that the
cell is not loaded down by the pulse generator. The capacitance of the
connection of the infrared cell to the amplifier is the cri t ical parameter
in determining the rise time of the system. By building the amplifier
cathode follower and amplifier almost as a single integrated unit with
minimum length bare wire connections, it was possible to reduce the
r i se t ime of the system (to 90 percent of the full deflection value) to
slightly less than one microsecond.
A second response calibration was performed by the use of
periodic light pulse generated by a rotating mirror system. The r ise-
t ime of this light pulse itself was approximately one microsecond. The
resulting combination of the cell, amplifier and light source gave a
r i se t ime of about 1. 5 p sec, which is equivalent to the geometric com-
bination of the two one-microsecond r ise t imes.
The response t ime of the system was a lso tes ted by a heat transfer
test behind a reflected shock in the shock tube. A so-called knife edge
model was built for this purpose which replaced the hemispherical nose
heat transfer model shown in Figs. 7 and 8. This model is essentially an
open tube aligned with the flow which holds the infrared gage and optical
system in the same posit ion as the other model but as part of a flat end
wall geometry. The front of the tube is provided with knife edges s o that
the disturbances due to the existence of these edges are isolated to the
flow external to the tube. This model essentially slices a piece out of the
test gas and allows the reflected shock to propagate back in the tube with-
out external disturbances unti l it reaches the knife edge. The tube was
made long enough s o that the whole test time available is usable in this
experiment. Substituting the heat transfer for this geometry, Eq. (7),
into the equation for the interface temperature for this situation, i. e. , Eq. (4), gives the familiar temperature step function response. Figure 12
shows the oscillograph from such an experiment. The risetime of this
26

record shows the fas t response (1-2psec) required of the gages and the
approximately level output thereafter, indicative of the growth of the ther - mal boundary layer.
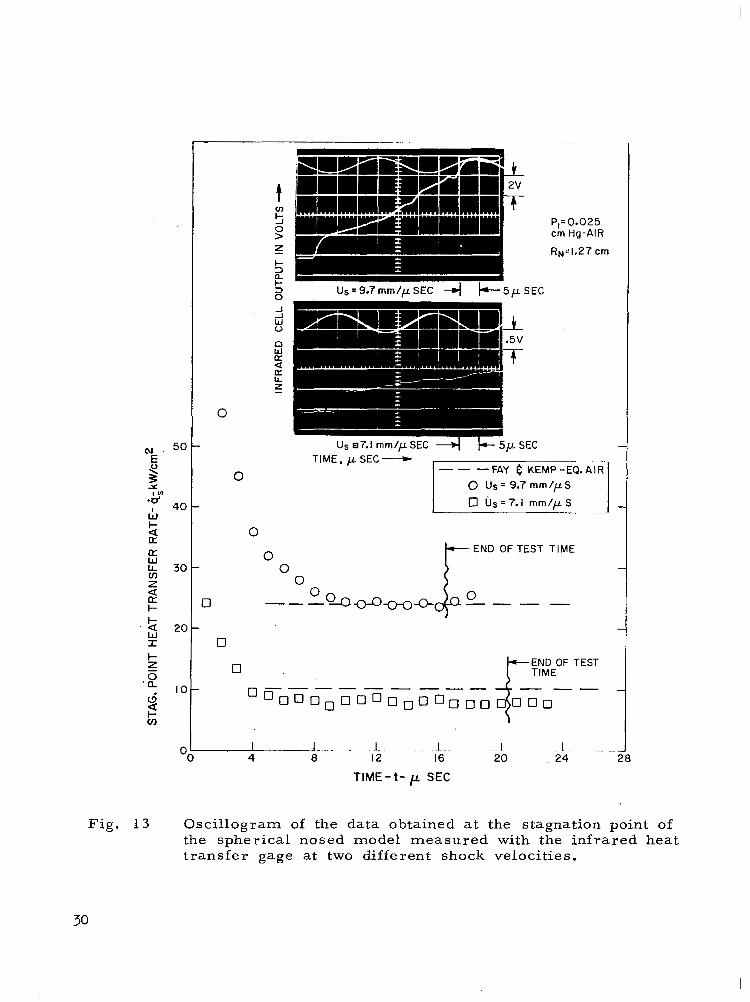
For stagnation point heat transfer experiments, the heat transfer
s t a r t s out as in the above situation and then levels out at a constant value
after the viscous boundary layer has been established. The oscillo-
grams shown in F ig . 13 show this early heat transfer time history
clearly. A s the example shown from the numerical calculation in
the earlier section, the temperature starts to r i s e when the flow geom-
etry becomes established at t imes of the order of 8 - 1 0 psec. For the
constant heat transfer input with time, Eq. ( 8 ) , the temperature response
of the carbon-MgO interface is
as can be seen from Eq. ( 3 ) . If Eq. (18) i s used a s the calibration
curve, then
o r the output should be near ly l inear with time with
proportional to the square root of the heat transfer
te r i s t ic i s shown clearly by the oscillograms shown
the slope being
rate. This charac-
in F i g . 13.
The oscillograms shown have been reduced to heat transfer time
his tor ies by use of the calibration curve, Eq. (18) and the inversion
formula, Eq. (10). The heat transfer time history is seen to indicate
the characteristic discussed in the previous sections but settles down
to a constant value well before the end of the test t ime, determined by
monitoring the visible wavelength radiation with a photomultiplier.
A s the infrared heat transfer gage measures the temperature of
the carbon layer on the surface of the MgO window during its exposure
to the total environment it responds to both convective and radiative
heating. 'In order to differentiate between these two heating mechan-
isms, the reflective properties of the gage surface must be known. F o r

I” 1 -7
PULSE GENERATOR
t-lt P 212A IO’ COAX. CABLE
I SCOPE
b A
0 INPUT
SCOPE ”_ _”
Q, 1”~ TRIGGER PM
A-
LIGHT SOURCE
NOTE: SIGNAL AT OUTPUT OF AMPLIFIER ROTATING MIRROR SYSTEM RISETIME, r 4 . 5 p S E C
Fig. 1 1 Schematic diagrams of two set-ups used for measuring the t ime response character is t ics of the infrared heat t ransfer gage system, one using an electronic pulse and one a light pulse generator.
28

I
INFRARED CELL AND P M OUTPUT IN VOLTS
TIME, SEC
Us = 6.9 mm/pSEC
-. TI ME, SEC
Us% 10.0 mm/pSEC
0
0 U s = . -
0 Us 6.9mm/p SEC . . . . . " -
0
1 1 I I I I I 2 4 6 8 IO 12 14 16 18
I 1. ""
TIME- t -p SEC
0
Fig. 1 2 Oscil lograms of the data measured a t two shock velocities with the infrared heat transfer gage in the knife edge model duplicating the shock tube end wall.
t v)
> 0 5
z a I- 3
I- 3 Us = 9.7 m m / p SEC 4 5p SEC
PI= 0.025 cm Hg-AIR
R~"1.27 Cm
0
0
Us 7.1 m m / p SEC 4 5 p SEC TIME, p SEC -
0 U S = 9.7 m m / p S
~ . . " . " .
0 END OF TEST TIME
W
v) LL 30 - 0 z 0 a a 0 "- I- t- W
I-
0
. a 2 0 - r
'n 10-
0 z 0
ci 2
END OF TEST TIME
v)
OO I I . ~..
4 8 16 20 24 ..I- . , I." 12
..I ~ ~~ ~ . I
TIME - t- /.L. SEC
Fig. 13 Oscil logram of the data obtained at the stagnation point of the spherical nosed model measured with the infrared heat t ransfer gage a t two different shock velocities.

metallic film..evaporated the refLectance is generally quite high and,
consequently, radiative heating is rejected quite efficiently since the
gage is heated by q (convective) + E q (radiative). Figure 14 shows the
reflectance of freshly evaporated films of the various materials used
in the present experiments as compiled in Refs. 20 and 21.
In the process of making the infrared gages, the metallic films
were deposited on the chemically decomposed carbon layers which, in
turn, were on a slightly roughened MgO crystal . The optical character-
ist ics achieved by this process could well be considerably different from
the literature values of evaporated films. In addition, it was also ques-
tioned whether the metallic surfaces deteriorated with time when exposed
to ambient conditions. Generally gages were of the order of one day
old when used in the shock tube and the handling specifications during
this interim were questioned.
The total reflectance of the various coatings was measured by
a Beckman DK-2 (Extended range) Spectrophotometer,22 useful over the
wavelength range of 0. 2 to 2 . 6 microns. In o rde r to deduce absolute
values out of the measurements , correct ions were required because the
inside of the integrating sphere of the instrument was coated with MgO
to provide a pure white reflecting surface?3 The results of these
measurements a re p resented in F ig . 15. It is clear that the plating
procedure used degrades the reflectance somewhat but does not change
the basic pattern of very high reflectance for metallic films and low
reflectance for the carbon.
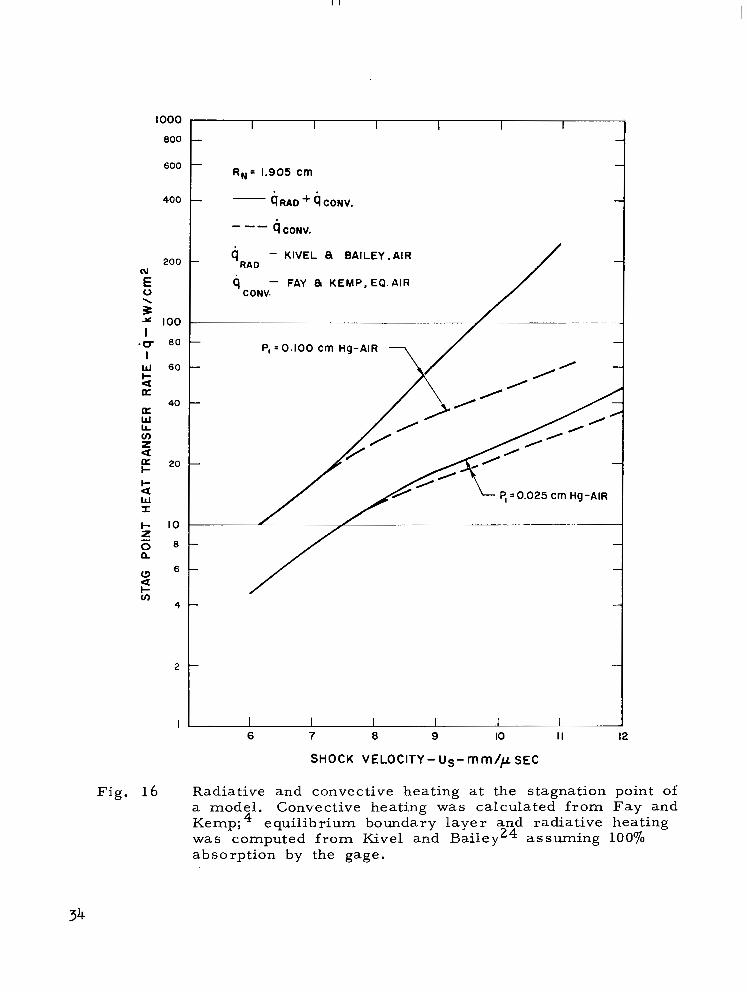
F o r the present se r ies of experiments the effect of radiative
heat t ransfer was small . For the stagnation point experiments radiation
merely manifests i tself as an added increment of constant heat trans-
f e r , As such i t is very difficult to differentiate from the con-
vective heating. Estimates of the magnitude of this effect are shown in
Fig. 16, using Ref. 24 for the intensity of the radiative f l u x , for the
range of conditions of the present experiment. It can be seen that
with an average surface emissivi ty of approximately . 1 2 - -t . 05 it should be
possible to keep radiative effects down to a maximum level of 2 percent
This is probably well within the scatter of the present experiments and
qrad.

+
.7 I I I
I I
I I I +
0 + +
'0 + ' +
+ I I
0 1
(I
f 00 600
+ +
A A A A A I
.. A
A
A A
A A A
0 A A A I
A A - ALUMINUM .2 -
A A $ -" o COPPER 0 SILVER
.I - 0
WAVE LENGTH-X-(p-MICRONS) .I .2 .4 .6 .8 1.0 2.0 4.0 6.0 8.0 IO
+ PLATINUM POLISHED (DEPOSITED 0 A GRAPHITE (POLISHED SURFACE)
REF 21 ELECTROLYTICALLY)
0 I I I I I I I ~ "I I .. - I
Fig. 14 Reflectance of freshly evaporated metal films of the various materials used in the experiments from Refs. 20 and 21.

I
I I I .4
F i g . 15 Total
-ALUMINUM ( F I G . 141
rn ALUMINUM FILM ON POLISHED MgO AND SAPPHIRE
ALUMINUM FILM ON GROUND MgO WINDOWS
A CARBON (PYROLYTIC) FILMS ON GROUND Ma0 WINDOW
CARBON (PYROLYTIC) FILMS ON GROUND
MgO WINDOW MgO WINDOW MEASURED THROUGH THE
I I I 1 1 I I I I 1 I I I I .6 .e 1.0 1.4 1.8 2.2 2.6
WAVE LENGTH -A - (p-MICRONS)
ref lectance measured for evaporated metal coat ings deposited on the carbon layer on an MgO window.
33
I
1000
800
600
400
(u
0 \
200
E
s I
I
100
.u eo
W 60
t a a 40
w LL v) z U I- C
W U I
a 20
I- IO
0 8 z n
w 6 a I- v)
4
2
I
I I I I I I - -
R N = 1.905 cm
- q R A D + 4 CONV.
-" q CONV.
- qRno - KIVEL a BAILEY .AIR
q - FAY e KEMP, ECLAIR CONV.
/ / ..
""
6 7 8 9 IO I I
SHOCK VELOCITY - Us- mm/p SEC
Fig. 16 Radiative and convective heating at the stagnation point of a model. Convective heating was calculated from Fay and kern^;^ equilibrium boundary layer and radiative heating was computed from Kivel and Bailey24 assuming 100% absorption by the gage.
34

END OF TEST TIME 'r
T I M E , P S E C - us = 7.2 mm/p SEC
Fig. 17 Oscil logram of data obtained from carbon-coated infrared gage in the knife edge model.
35

3 5c
0 30c
+ 0 I
? W W W a 25c
E
v, a w 20c a
W
3
a! W a
5
I w I5C I-
I oc
5 c
C
400 -
1 -
) -
) -
) -
) -
) -
l -
I -
I I
I ' 6
I I I I 7 8 9 10 I I 12
I I
us- m m / ~ S E C
Fig. 18 Calculated temperature response of the infrared gage in the knife edge model based on radiative heating estimates from Ref. 24.

the estimate is high because it is known that Ref. 24 overestimates the
radiation in this regime by about a factor of two or three. 25
For the reflected shock geometry afforded by the knife edge
model, the radiative contribution is easier to isolate from the convec-
tive effects. Due to the growth of the thermal boundary layer, the
convective heat transfer rate falls inversely with the square root of
time. The radiative heating will grow directly with time due to the
increasing thickness of the radiating gas region as long as the hot gas
does not become opaque. A linear growth of the heating rate will re-
sult in a surface temperature increasing as the 3/2 power of time and
an infrared gage output rising approximately with time cubed. Such a signal is readily distinguishable from the normal constant output shown
in F ig . 12.
The knife edge model thus becomes a more useful tool for total
radiative heating measurements from gases under these conditions. A
typical oscillogram from an experiment in which significant radiation
was present is shown in F i g . 17. The gage used here was overcoated
with carbon, i. e. , i t was tr iple coated, carbon-metal-carbon, to maxi-
mize the emissivity of the surface. The temperature response of the
knife edge model to the radiative heating predicted from Ref. 24 i s
shown in F ig . 18. It i s seen that the effects are c lear ly measurable ,
even with realistic values of emissivity and the new data on air radia-
tion.
37


I
SECTION V
HEAT TRANSFER RESULTS
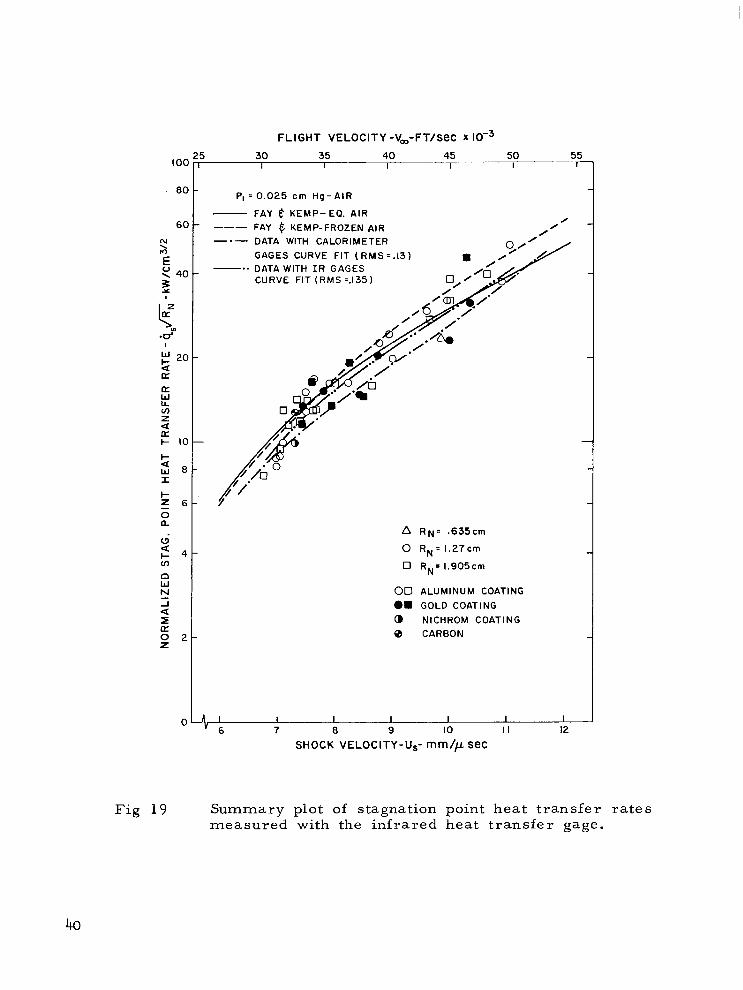
The heat t ransfer data f rom the present ser ies of experiments are
shown in Fig. 19. The initial shock tube pressure was 0. 25 mm Hg, the gas
was room air, and the incident shock wave velocities ranged from Us = 7
to U = 10. 0 mm/psec, simulating1 flight at altitudes of approximately
140, 000 f t and a simulated velocity of up to approximately 50, 000 fps. Only
data points from experiments during which at least 8 y s e c of tes t t ime were
measured by one of the methods stated in Ref. 1 have been used in view of
the response requirements discussed in the previous sections.
Stagnation point convective (aerodynamic) heat transfer data were
measured most ly on sphere-cone models with nose radii RN = 1. 27 cm and
RN = 1.905 cm. Majority of the test runs were made with aluminum and
gold reflective films overcoating the carbon gage. A few data points were
obtained using Nichrome alloy as the evaporated surface film. The infrared
gage coatings lasted only for one shock tube run and usually deteriorated
af ter approximately 30ysec, possibly due to impact of impurities and residues
of the driver gas causing the film to become transparent. This was very
plainly evident by the almost instantaneous r ise of the signal beyond the range
of the amplifier and scopes. The data have been compared with results cal-
culated from the Fay and Kemp binary diffusion model for ionized diatomic
gases. Figure 19 also shows the curve f i t of the data (which had a root-
mean-square deviation of 0. 13) obtained from measurements with calorimeter
gages reported in Ref. 1. In general , the average values of the present .data
appear to follow the theoretical predictions of equilibrium air somewhat more
closely and majority of the data points thus lie slightly above the results of
the Ref. 1 .
There appears to be no significant difference between the data ob-
tained with aluminum and gold films covering the carbon gage. This is in
agreement with Collins and Spiege13 but in contrast to the result of gage
39
U W LL v) z a I- 10
a
0
F i g 19
FLIGHT VELOCITY -V,-FT/SeC X
5 3 0 35 40 45 50 I I I ~- T
-- 5; I I
PI = 0.025 cm Hg- AIR
FAY .$ KEMP-EQ. AIR "_ FAY 4 KEMP-FROZEN AIR / ' -.- DATA WITH CALORIMETER
GAGES CURVE FIT ( R M S =.I31
CURVE FIT ( R M S =.I351 0, ' -.. DATA WITH I R GAGES
A R N = . 6 3 5 c m
0 R N = 1.27cm
0 R N = 1.905cm
00 ALUMINUM COATING om GOLD COATING @ NICHROM COATING 0 CARBON
A I " 6
I I I I "J""." 7 8 9 10 1 1 12
SHOCK VELOCITY-US- mm/p SeC
Summary plot of stagnation point heat transfer rates measured with the infrared heat transfer gage.
mater ia l repor ted by Gruszczynski and Warren. The nickel al loy, Nichrome,
results also fell directly in the group of the data from the other materials.
In view of the fact that these experiments were all performed at the lowest
ini t ia l pressures used in any of these experiments, surface reactions should
certainly have been present. The obvious advantage of this experiment over
the above references is that a single gage calibration is used for a l l the sur-
face materials and, consequently, differences in the measurements, i f p r e s -
ent, could be directly attributed to surface-gas interactions. Consequently,
i t must be assumed that the gage surface material does not have an influence
I on the convective heat transfer. In this experiment the test gas is assumed to be in equilibrium.
These heat transfer measurements must be viewed with the same reserva-
tions with respect to the state of the test gas as discussed thoroughly in
Ref. 1. Experimental measurements of the visible radiation show this to
be a good assumption with respect to dissociation of the inviscid flow at the
stagnation point. Our present knowledge of recombination rates indicates
that the boundary layer may involve some freezing but not to a degree suf-
ficient to influence the heat transfer rate. With respect to ionization,
es t imates of and a discussion of the degree of completion of these pro-
cesses were a lso made in Ref . 1. It was concluded that insufficient data on
the ionization mechanism are available to make a very firm statement about
the state of ionization, but arguments were put forth to support the assump-
tion of ionization equilibrium. Recent experiments of Wilson26 have tended
to confirm these estimates. Wilson finds that behind strong shock waves
the ionization mechanism in air is analogous to the process suggested by
Petschek and Byron27 for argon. Wilson finds that in the air case, the
initial ionization is provided by the atom-atom reactions, as per Lin, 28
and the impact process takes over as soon as sufficient electrons are pro-
duced. The result is that the time to achieve equilibration, in terms of the
number of ambient mean-free-times, does not change radically up to shock
velocit ies as high as 1 2 mm/psec. This result confirms the extrapolations
used in Ref. 1 and adds confidence to the assumption that ionization pro-
cesses are a lso in equi l ibr ium in these experiments .
41


SECTION VI
SUMMARY AND CONCLUSIONS
Heat t ransfer measurements made with an infrared heat t ransfer
gage have been presented. The value of these measurements is , (1 ) a
new technique has been developed for producing such measurements
I which is significantly different from the commonly used calorimeter res i s tance thermometer , ( 2 ) the measurements obtained with the new
technique essentially duplicate and consequently verify the results of
several authors achieved with calor imeter gages, and ( 3 ) variations of
the surface ma.teria1 of the surface undergoing heat transfer did not
a l t e r the resultant heat transfer rates, showing conclusively that sur-
face effects are not important under the experimental conditions.
ACKNOWLEDGMENT
The authors wish to acknowledge many informative discussions
with M. Camac and R. Feinberg, upon whose original work with the
infrared gage this investigation i s based, as well as C. Saunders for
his able help in performing the experiments.
43


REFERENCES
1 .
2.
1 3.
4.
5.
6.
7.
8.
9.
10.
11.
Rose, P. H. and Stankevics, J. 0. , "Stagnation Point Heat Trans - fer Measurements in Par t ia l ly Ionized Air , AIAA J. 1 , 2752-2753 (December 1963), also Avco-Everett Research-Labora- tory Research Report 143, April 1963.
Hoshizaki, H., "Convective Heat Transfer Measurements at Superorbital Speeds, I ' Lockheed Missiles and Space Division, Rept. No. 6-90-62-50, June 1962.
Collins, D. J. and Spiegel J. M. , "Effects of Gage Material on Convective Heat Transfer, ' I AIAA J., 2 , 777-778 (April 1964).
Fay , J. A. and Kemp, N. H. , "Theory of Stagnation Point Heat Transfer in a Partially Ionized Diatomic Gas, I ' AIAA 3. , 2, 2741-2751, also Avco-Everett Research Laboratory Research Report 144, Apri l 1963.
-
Pallone, A. and Van Tasse l l , W. , "The Effects of Ionization on Stagnation-point Heat Transfer in Air and in Nitrogen, I ' Avco Research and Advanced Development Division, RAD TM 62-75 (September 1962)
Hoshizaki, H., "Heat Transfer in Planetary Atmospheres a t Supersatellite Speeds, I ' ARS J. - 32, 1544-1 552 (1 962).
Gruszczynski, J. S. and Warren, W. R. , "Experimental Heat Transfer Studies of Hypervelocity Flight in Planetary Atmos- p h e r e s , I ' AIAA Preprint 63-450 (August 1963).
Camac, M. and Feinberg, R. M. , "High Speed Infrared Bolome- t e r , I ' Rev. Sci, Instr., 33, 964-972 (1962), also Avco-Everett Research Laboratory Research Report 120, March 1962.
Camm, J. C. and Rose, P. H . , "Electric Shock Tube for High Velocity Simulation, I ' Phys. Fluids, - 6, 663-678 (May 1963).
.s 9 Carslaw, H. S. and Jaeger , J. C. , Conduction of Heat in Solid . Oxford a t the Clarendon Press , 1959, 2nd Edition, 55-75-76.
Feldman, S . , "Hypersonic Gas Dynamic Charts for Equilibrium Air , Avco-Everet t Research Laboratory Research Report 40, January 1957.
45

12.
13.
14.
15.
16.
17.
18.
19.
20.
21.
22.
23.
24.
25.
Kemp, N. H. , "Approximate Analytical Solution of Similari ty Boundary Layer Equations with Variable Fluid Properties , I '
Fluid Mechanics Laboratory, Massachusetts Institute of Technology, Research Report to be published, 1964.
Rose, P. H. and Stark, W. I. , "Stagnation Point Heat Transfer Measurements in Dissociated Air , ' I J. Aerospace Sci. , 25, 86-97 (1 958).
Oppenheim, U. P. and Goldman, A. , "Infrared Spectral Trans- mittance of MgO and BaFZ Crystals between 27O and 1000°C, ' ' Journal of the Optical Society of Amer ica , - 54, 127-128 (Jan. 1964).
Garber , A. M. , Nolan, E. J. and Scala, s. M. , ' 'Pyrolytic Graphite- A Status Report , ' ' General Electric-R-63SD84, October 1963.
Hass , G. , Edit. , Physics of Thin Films , Vol. 1 , Academic P r e s s , 1963.
Camac , M. and Feinberg, R. M. , "Thermal Conductivity of Argon a t High Temperatures, ' I Avco-Everet t Research Laboratory Research Report 168, March 1963.
American Inst . of Physics Handbook, 2nd Edition, McGraw- Hill Co., New York, 1963.
Gubareff, C. G. , e t al , "Thermal Radiation Properties Survey, I '
2nd Edit. , Honeywell Research Center, Minneapolis, Minn. , 1960.
Beckman DK-2 Ratio Recording Spectrophotometer Instruction Manual, Beckman Instruments, Inc., 1962.
Edwards, D. K. , e t a1 , "Integrating Sphere for Imperfectly Diffuse Samples, J. 0. S . A. , - 51 , 1279.
Kivel, B. and Bailey, K. , "Tables of Radiation from High Tempera ture Ai r , ' I Avco-Everet t Research Laboratory Research Report 21, December 1957.
Allen, R.A. , "New Measurement and a New Interpretation for High Temperature Air Radiation, ' I AIAA Preprint 64-72 , (January 1964).
46

I
26. Wilson, J . , "lonization Rates of Air behind High Speed Shock Waves , I ' Avco-Everett Research Laboratory Research Report (to be published).
27. Petschek, H. E. and Byron, S. , "Approach to Equilibrium Ioniza- tion behind Strong Shock Waves in Argon, I ' Annals of Physics, 1, 270-315, (1957).
-
NASA-Langley, 1965 CR-204 47