heathrow airport 2016 emission inventory · heathrow airport 2016 emission inventory _____ report...
TRANSCRIPT
Heathrow Airport 2016 Emission Inventory ___________________________________________________
Report for Heathrow Airport Limited
ED 10362 | Issue Number 1 | Date 06/07/2017 Ricardo in Confidence
Ricardo Energy & Environment Heathrow Airport 2016 Emission Inventory | i
Ricardo in Confidence Ref: Ricardo/ED10362/Issue Number 1
Customer: Contact:
Heathrow Airport Limited Charles Walker Ricardo Energy & Environment Chadwick House, Birchwood Park, Warrington, Cheshire, WA3 6AE, United Kingdom
t: +44 (0) 1235 75 3115
Ricardo-AEA Ltd is certificated to ISO9001 and ISO14001
Customer reference:
PO 103793282
Confidentiality, copyright & reproduction:
This report is the Copyright of Heathrow Airport Limited. It has been prepared by Ricardo Energy & Environment, a trading name of Ricardo-AEA Ltd, under contract to Heathrow Airport Limited dated 08/02/2016. The contents of this report may not be reproduced in whole or in part, nor passed to any organisation or person without the specific prior written permission of Heathrow Airport Limited. Ricardo Energy & Environment accepts no liability whatsoever to any third party for any loss or damage arising from any interpretation or use of the information contained in this report, or reliance on any views expressed therein.
Author:
Charles Walker
Approved By:
Gareth Horton
Date:
06 July 2017
Ricardo Energy & Environment reference:
Ref: ED10362- Issue Number 1
Ricardo Energy & Environment Heathrow Airport 2016 Emission Inventory | ii
Ricardo in Confidence Ref: Ricardo/ED10362/Issue Number 1
Glossary
APU Auxiliary Power Unit
CAEP Committee on Aviation Environmental Protection
EFPS Electronic Flight Processing Strips
ICAO International Civil Aviation Organisation
LTO Landing and Take-Off
mppa million passengers per annum
NATS National Air Traffic Services
NTK Noise and Track-Keeping
nvPM non-volatile particulate matter
OPR Overall Pressure Ratio
OSI Operational Safety Instruction
Ricardo Energy & Environment Heathrow Airport 2016 Emission Inventory | iii
Ricardo in Confidence Ref: Ricardo/ED10362/Issue Number 1
Table of contents
1 Introduction ................................................................................................................. 1 1.1 Aircraft and APU emissions ................................................................................................ 1 1.2 Reduced-engine taxi .......................................................................................................... 2
2 Input data..................................................................................................................... 3 2.1 Movements and passenger numbers ................................................................................. 3 2.2 Aircraft data ........................................................................................................................ 4 2.3 Engine assignment ............................................................................................................. 6 2.4 APU running times ............................................................................................................. 7 2.5 Taxi and hold times ............................................................................................................ 9
3 Taxiing emissions ..................................................................................................... 12 3.1 Conventional taxiing ......................................................................................................... 12 3.2 Reduced-engine taxi ........................................................................................................ 13
3.2.1 Taxi-out.................................................................................................................... 13 3.2.2 Taxi-in ...................................................................................................................... 13
4 Results ....................................................................................................................... 14 4.1 NOx .................................................................................... Error! Bookmark not defined.
4.1.1 Alternative operating times ...................................................................................... 17 4.1.1.1 APUs ............................................................................................................ 17 4.1.1.2 Taxi and hold .................................................................................................. 1 4.1.1.3 Combined ....................................................................................................... 2
4.1.2 Reduced-engine taxi ............................................................................................... 18 4.2 PM10 and PM2.5 ................................................................................................................. 18
4.2.1 Alternative operating times ...................................................................................... 22 4.2.1.1 APUs ............................................................................................................ 22 4.2.1.2 Taxi and hold .................................................................................................. 3 4.2.1.3 Combined ....................................................................................................... 5
4.2.2 Reduced-engine taxi ............................................................................................... 23 4.3 CO2 ................................................................................................................................... 24
4.3.1 Alternative operating times ...................................................................................... 27 4.3.1.1 APUs .............................................................................................................. 5 4.3.1.2 Taxi and hold .................................................................................................. 6 4.3.1.3 Combined ....................................................... Error! Bookmark not defined.
4.3.2 Reduced-engine taxi ............................................................................................... 27
5 Summary and conclusions ...................................................................................... 28 5.1 Reduced-engine taxi ........................................................................................................ 32
6 References ................................................................................................................ 33
Ricardo Energy & Environment Heathrow Airport 2016 Emission Inventory | 1
Ricardo in Confidence Ref: Ricardo/ED10362/Issue Number 1
1 Introduction
This report presents the results of an air quality emission study of Heathrow Airport for the year 2016, concentrating on aircraft related emissions. It is the latest in a series of annual updates, which are based on the methodology for a study of the 12-month period April 2008 to March 2009. The 2008/9 study included an emission inventory
i, a dispersion modelling study
ii and a model evaluation study
iii,
which compared model results with measured concentrations. For 2013 there was a thorough update of the inventory and dispersion modelling
iv and a new model evaluation study
v. Subsequent annual
updates for the calendar years 2014vi AND 2015
vii have included specific components of the HAL
2013 emission inventory.
1.1 Aircraft and APU emissions
The motivation for the updates is that total aircraft emissions from the airport will change from one twelve-month period to another. There are a variety of reasons for this, and it is useful to identify two components to the overall change:
a) The change in the number of movements of aircraft of various types
b) The change in the operational parameters (times-in-mode, thrust settings etc.) applicable to aircraft of a given type
Changes to times-in-mode might arise, for example, as a result of infrastructure changes on the airport affecting taxiing routes. Changes in thrust might arise, for example, as a result of a systematic change in load factors or in the distribution of destinations served by a given aircraft type.
It is judged that variations of type “b” above will be modest on the timescale of a few years unless the airport undergoes a major reorganisation, although average parameters may drift slowly over a period of several years. Thus, two timescales can be considered in the process of annual updating of the aircraft emission inventory: aircraft movement and fleet mix data are updated on an annual basis to refer to the actual set of flights that used the airport in the relevant year, whereas operational parameters (e.g. taxiing time by aircraft type) are updated on a longer timescale. This concept is applied here to generate the 2016 calendar year aircraft emissions inventory by retaining operational parameters derived from data for 2013 but updating the aircraft movement and fleet mix data.
However, for this update, data on taxi and hold times, derived from the electronic flight processing strips (EFPS) used by controllers, were available for 2016. These data have been analysed and the effects on the calculated emissions determined. Results using previous (2013), suitably averaged, taxi and hold times are presented as an alternative estimate to the main results.
For APUs, new observations of running times were made during 2016; the new APU data have been analysed and the effects on the calculated emissions determined. Results using previous (2013) APU data are presented as an alternative estimate to the main results.
The main results constitute an enhanced annual update and the alternative estimates a more basic update. A full update would include the following:
Updated times-in-mode for take-off roll, initial climb, climb-out, approach and landing roll
Updated thrust settings for take-off roll, initial climb and climb-out
Updated reverse thrust settings for landing roll
Updated climb and approach profiles
Inclusion of reduced-engine taxiing in the modelling
Updated source data for other airport sources:
o Ground Support Equipment
o Heating Plant
o Car Parks
Updated source data for off airport sources:
o Landside Roads
Ricardo Energy & Environment Heathrow Airport 2016 Emission Inventory | 2
Ricardo in Confidence Ref: Ricardo/ED10362/Issue Number 1
Such a comprehensive update to the modelling would require updated data on the elements such as times-in-mode, use of reduced-engine taxiing, etc., potentially from surveys. The updated climb and approach profiles would be derived from records of radar-based track data (i.e. from the noise and track-keeping (NTK) data).
The details of the methodology for quantifying aircraft emissions have been given in the report quoted earlier
i, and are not discussed further in this report.
1.2 Reduced-engine taxi
Heathrow have started to record the use of reduced-engine taxiing. However, they do not record the duration of its use nor the associated APU use off-stand. Although not included in the main inventory, alternative results are presented that take account of reduced-engine taxiing, albeit making assumptions regarding the duration of its use and the associated APU use off-stand.

Ricardo Energy & Environment Heathrow Airport 2016 Emission Inventory | 3
Ricardo in Confidence Ref: Ricardo/ED10362/Issue Number 1
2 Input data
2.1 Movements and passenger numbers
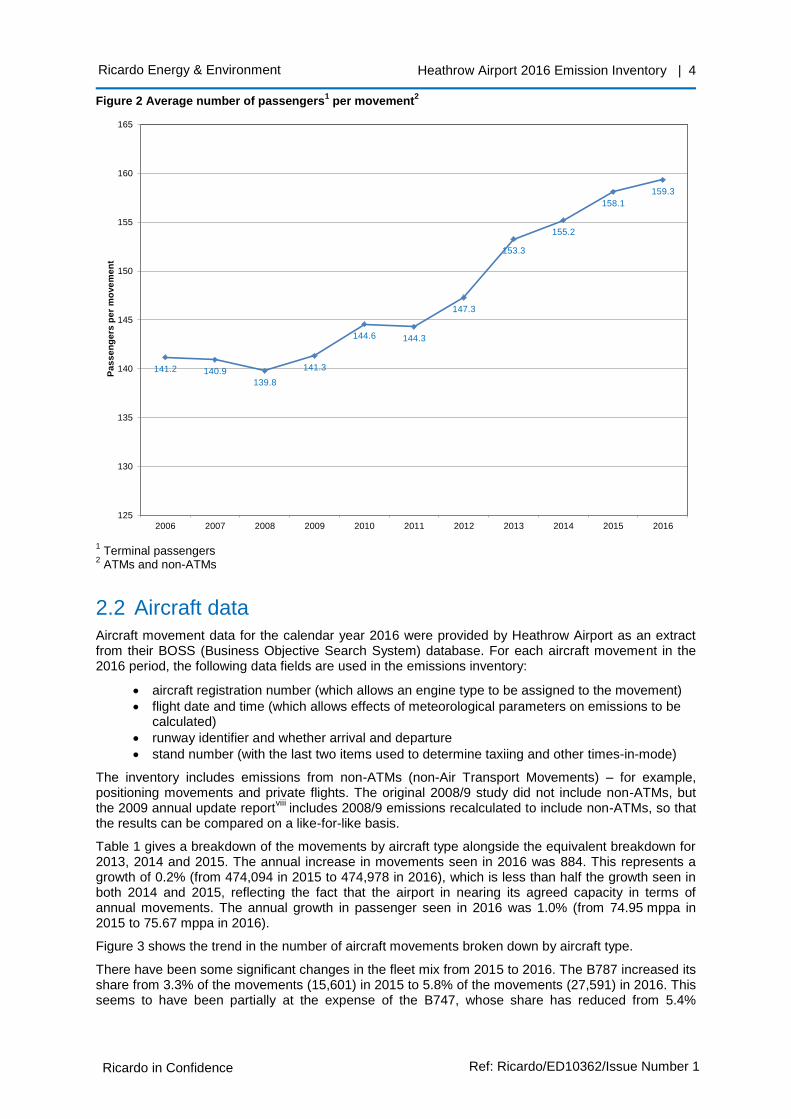
Figure 1 shows the trend in the number of aircraft movements and passengers over the last ten years. The number of aircraft movements has remained broadly constant, reflecting the fact that the airport is operating close to maximum capacity. However, the number of passengers has risen steadily over the period, accommodated by a larger number of passengers per movement on average (Figure 2).
Figure 1 Aircraft movement1 and passenger numbers
2
1 ATMs and non-ATMs
2 Terminal passengers
477 481 479466
455
481 475 472 473 474 475
67.34 67.8566.91
65.91 65.75
69.39 69.98
72.3373.37
74.95 75.67
0
10
20
30
40
50
60
70
80
0
100
200
300
400
500
600
2006 2007 2008 2009 2010 2011 2012 2013 2014 2015 2016
Te
rmin
al P
as
se
ng
ers
(m
pp
a)
Mo
ve
me
nts
(10
00
s)
Movements Terminal Passengers
Ricardo Energy & Environment Heathrow Airport 2016 Emission Inventory | 4
Ricardo in Confidence Ref: Ricardo/ED10362/Issue Number 1
Figure 2 Average number of passengers1 per movement
2
1 Terminal passengers
2 ATMs and non-ATMs
2.2 Aircraft data
Aircraft movement data for the calendar year 2016 were provided by Heathrow Airport as an extract from their BOSS (Business Objective Search System) database. For each aircraft movement in the 2016 period, the following data fields are used in the emissions inventory:
aircraft registration number (which allows an engine type to be assigned to the movement)
flight date and time (which allows effects of meteorological parameters on emissions to be calculated)
runway identifier and whether arrival and departure
stand number (with the last two items used to determine taxiing and other times-in-mode)
The inventory includes emissions from non-ATMs (non-Air Transport Movements) – for example, positioning movements and private flights. The original 2008/9 study did not include non-ATMs, but the 2009 annual update report
viii includes 2008/9 emissions recalculated to include non-ATMs, so that
the results can be compared on a like-for-like basis.
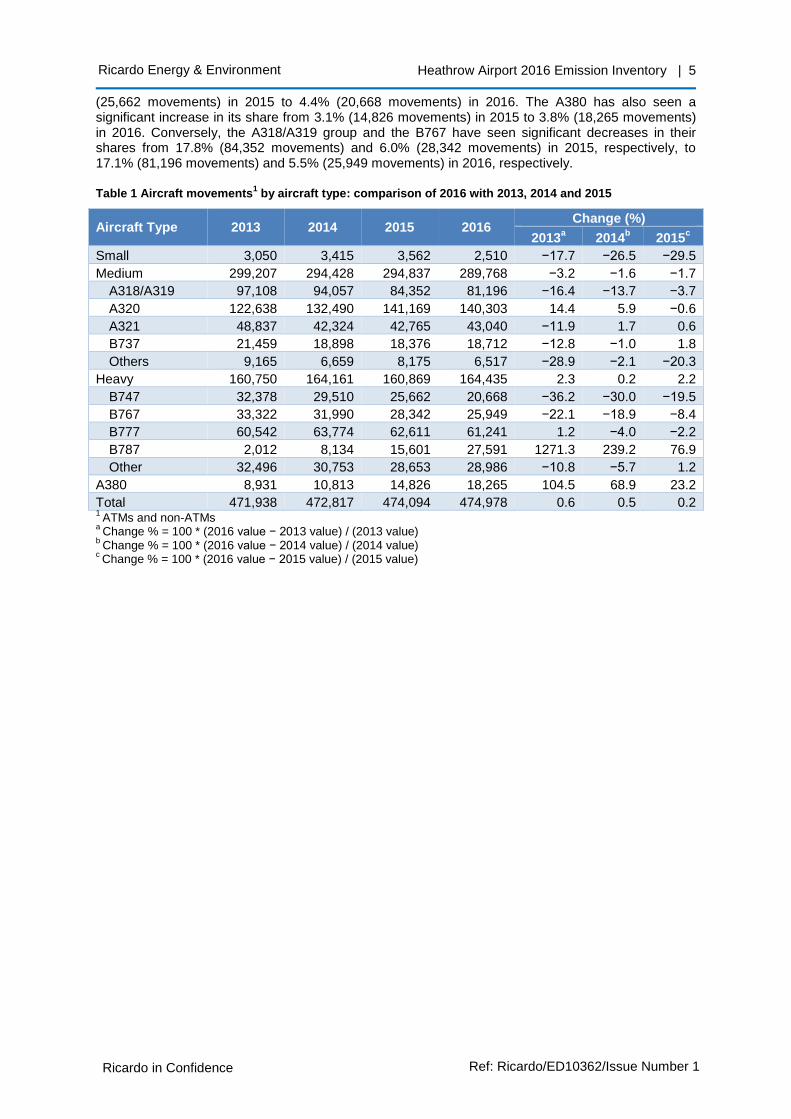
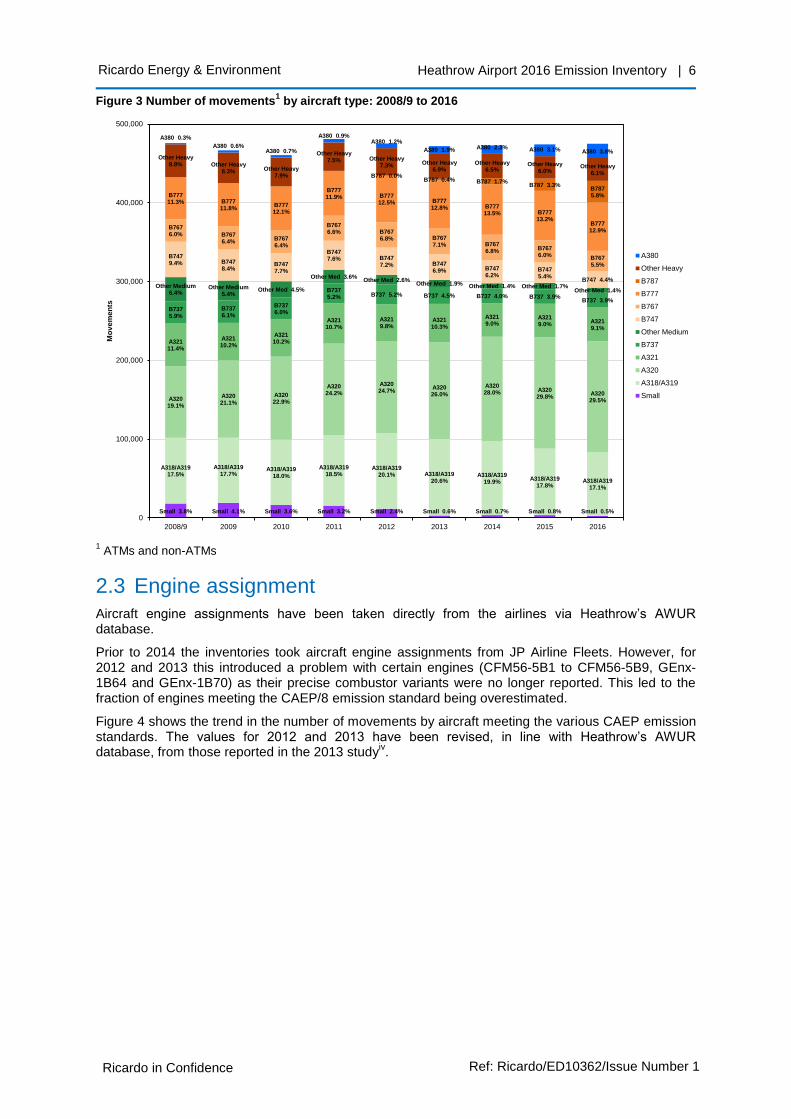
Table 1 gives a breakdown of the movements by aircraft type alongside the equivalent breakdown for 2013, 2014 and 2015. The annual increase in movements seen in 2016 was 884. This represents a growth of 0.2% (from 474,094 in 2015 to 474,978 in 2016), which is less than half the growth seen in both 2014 and 2015, reflecting the fact that the airport in nearing its agreed capacity in terms of annual movements. The annual growth in passenger seen in 2016 was 1.0% (from 74.95 mppa in 2015 to 75.67 mppa in 2016).
Figure 3 shows the trend in the number of aircraft movements broken down by aircraft type.
There have been some significant changes in the fleet mix from 2015 to 2016. The B787 increased its share from 3.3% of the movements (15,601) in 2015 to 5.8% of the movements (27,591) in 2016. This seems to have been partially at the expense of the B747, whose share has reduced from 5.4%
141.2 140.9
139.8
141.3
144.6 144.3
147.3
153.3
155.2
158.1
159.3
125
130
135
140
145
150
155
160
165
2006 2007 2008 2009 2010 2011 2012 2013 2014 2015 2016
Pa
ss
en
ge
rs p
er
mo
ve
me
nt
Ricardo Energy & Environment Heathrow Airport 2016 Emission Inventory | 5
Ricardo in Confidence Ref: Ricardo/ED10362/Issue Number 1
(25,662 movements) in 2015 to 4.4% (20,668 movements) in 2016. The A380 has also seen a significant increase in its share from 3.1% (14,826 movements) in 2015 to 3.8% (18,265 movements) in 2016. Conversely, the A318/A319 group and the B767 have seen significant decreases in their shares from 17.8% (84,352 movements) and 6.0% (28,342 movements) in 2015, respectively, to 17.1% (81,196 movements) and 5.5% (25,949 movements) in 2016, respectively.
Table 1 Aircraft movements1 by aircraft type: comparison of 2016 with 2013, 2014 and 2015
Aircraft Type 2013 2014 2015 2016 Change (%)
2013a 2014
b 2015
c
Small 3,050 3,415 3,562 2,510 −17.7 −26.5 −29.5
Medium 299,207 294,428 294,837 289,768 −3.2 −1.6 −1.7
A318/A319 97,108 94,057 84,352 81,196 −16.4 −13.7 −3.7
A320 122,638 132,490 141,169 140,303 14.4 5.9 −0.6
A321 48,837 42,324 42,765 43,040 −11.9 1.7 0.6
B737 21,459 18,898 18,376 18,712 −12.8 −1.0 1.8
Others 9,165 6,659 8,175 6,517 −28.9 −2.1 −20.3
Heavy 160,750 164,161 160,869 164,435 2.3 0.2 2.2
B747 32,378 29,510 25,662 20,668 −36.2 −30.0 −19.5
B767 33,322 31,990 28,342 25,949 −22.1 −18.9 −8.4
B777 60,542 63,774 62,611 61,241 1.2 −4.0 −2.2
B787 2,012 8,134 15,601 27,591 1271.3 239.2 76.9
Other 32,496 30,753 28,653 28,986 −10.8 −5.7 1.2
A380 8,931 10,813 14,826 18,265 104.5 68.9 23.2
Total 471,938 472,817 474,094 474,978 0.6 0.5 0.2 1
ATMs and non-ATMs a
Change % = 100 * (2016 value − 2013 value) / (2013 value) b
Change % = 100 * (2016 value − 2014 value) / (2014 value) c Change % = 100 * (2016 value − 2015 value) / (2015 value)
Ricardo Energy & Environment Heathrow Airport 2016 Emission Inventory | 6
Ricardo in Confidence Ref: Ricardo/ED10362/Issue Number 1
Figure 3 Number of movements1 by aircraft type: 2008/9 to 2016
1 ATMs and non-ATMs
2.3 Engine assignment
Aircraft engine assignments have been taken directly from the airlines via Heathrow’s AWUR database.
Prior to 2014 the inventories took aircraft engine assignments from JP Airline Fleets. However, for 2012 and 2013 this introduced a problem with certain engines (CFM56-5B1 to CFM56-5B9, GEnx-1B64 and GEnx-1B70) as their precise combustor variants were no longer reported. This led to the fraction of engines meeting the CAEP/8 emission standard being overestimated.
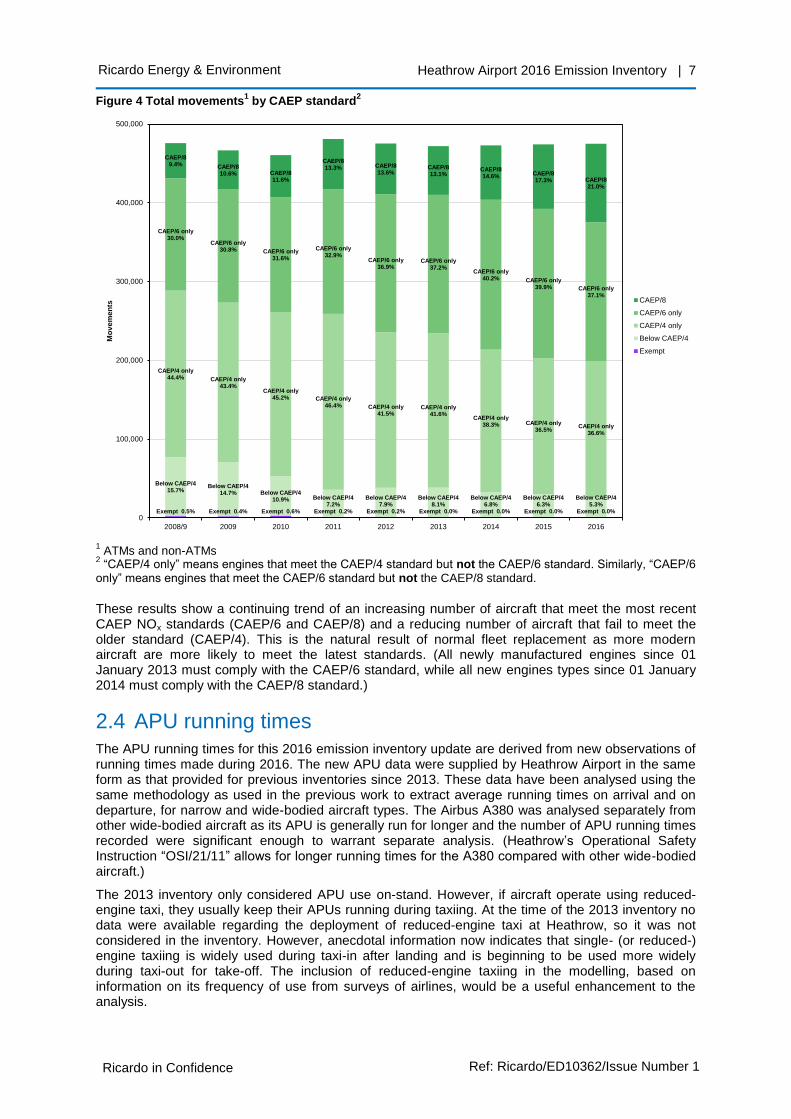
Figure 4 shows the trend in the number of movements by aircraft meeting the various CAEP emission standards. The values for 2012 and 2013 have been revised, in line with Heathrow’s AWUR database, from those reported in the 2013 study
iv.
Small 3.8% Small 4.1% Small 3.6% Small 3.2% Small 2.4% Small 0.6% Small 0.7% Small 0.8% Small 0.5%
A318/A31917.5%
A318/A31917.7%
A318/A31918.0%
A318/A31918.5%
A318/A31920.1% A318/A319
20.6%A318/A319
19.9%A318/A319
17.8%A318/A319
17.1%
A32019.1%
A32021.1%
A32022.9%
A32024.2%
A32024.7%
A32026.0%
A32028.0% A320
29.8%A32029.5%
A32111.4%
A32110.2%
A32110.2%
A32110.7%
A3219.8%
A32110.3%
A3219.0%
A3219.0%
A3219.1%
B7375.9%
B7376.1%
B7376.0%
B7375.2% B737 5.2% B737 4.5% B737 4.0% B737 3.9%
B737 3.9%
Other Medium6.4%
Other Medium5.4%
Other Med 4.5%
Other Med 3.6%Other Med 2.6%
Other Med 1.9% Other Med 1.4% Other Med 1.7%Other Med 1.4%
B7479.4% B747
8.4%B7477.7%
B7477.6% B747
7.2% B7476.9% B747
6.2%B7475.4%
B747 4.4%
B7676.0% B767
6.4%B7676.4%
B7676.6% B767
6.8% B7677.1% B767
6.8% B7676.0%
B7675.5%
B77711.3% B777
11.8%B77712.1%
B77711.9% B777
12.5% B77712.8% B777
13.5% B77713.2%
B77712.9%
B787 0.0%B787 0.4% B787 1.7%
B787 3.3%B7875.8%
Other Heavy8.8% Other Heavy
8.3% Other Heavy7.9%
Other Heavy7.5% Other Heavy
7.3% Other Heavy6.9%
Other Heavy6.5%
Other Heavy6.0%
Other Heavy6.1%
A380 0.3%
A380 0.6%A380 0.7%
A380 0.9%A380 1.2%
A380 1.9% A380 2.3% A380 3.1% A380 3.8%
0
100,000
200,000
300,000
400,000
500,000
2008/9 2009 2010 2011 2012 2013 2014 2015 2016
Mo
ve
me
nts
A380
Other Heavy
B787
B777
B767
B747
Other Medium
B737
A321
A320
A318/A319
Small
Ricardo Energy & Environment Heathrow Airport 2016 Emission Inventory | 7
Ricardo in Confidence Ref: Ricardo/ED10362/Issue Number 1
Figure 4 Total movements1 by CAEP standard
2
1 ATMs and non-ATMs
2 “CAEP/4 only” means engines that meet the CAEP/4 standard but not the CAEP/6 standard. Similarly, “CAEP/6
only” means engines that meet the CAEP/6 standard but not the CAEP/8 standard.
These results show a continuing trend of an increasing number of aircraft that meet the most recent CAEP NOx standards (CAEP/6 and CAEP/8) and a reducing number of aircraft that fail to meet the older standard (CAEP/4). This is the natural result of normal fleet replacement as more modern aircraft are more likely to meet the latest standards. (All newly manufactured engines since 01 January 2013 must comply with the CAEP/6 standard, while all new engines types since 01 January 2014 must comply with the CAEP/8 standard.)
2.4 APU running times
The APU running times for this 2016 emission inventory update are derived from new observations of running times made during 2016. The new APU data were supplied by Heathrow Airport in the same form as that provided for previous inventories since 2013. These data have been analysed using the same methodology as used in the previous work to extract average running times on arrival and on departure, for narrow and wide-bodied aircraft types. The Airbus A380 was analysed separately from other wide-bodied aircraft as its APU is generally run for longer and the number of APU running times recorded were significant enough to warrant separate analysis. (Heathrow’s Operational Safety Instruction “OSI/21/11” allows for longer running times for the A380 compared with other wide-bodied aircraft.)
The 2013 inventory only considered APU use on-stand. However, if aircraft operate using reduced-engine taxi, they usually keep their APUs running during taxiing. At the time of the 2013 inventory no data were available regarding the deployment of reduced-engine taxi at Heathrow, so it was not considered in the inventory. However, anecdotal information now indicates that single- (or reduced-) engine taxiing is widely used during taxi-in after landing and is beginning to be used more widely during taxi-out for take-off. The inclusion of reduced-engine taxiing in the modelling, based on information on its frequency of use from surveys of airlines, would be a useful enhancement to the analysis.
Exempt 0.5% Exempt 0.4% Exempt 0.6%
Below CAEP/47.2%
Exempt 0.2%
Below CAEP/47.9%
Exempt 0.2%
Below CAEP/48.1%
Exempt 0.0%
Below CAEP/46.8%
Exempt 0.0%
Below CAEP/46.3%
Exempt 0.0%
Below CAEP/45.3%
Exempt 0.0%
Below CAEP/415.7%
Below CAEP/414.7% Below CAEP/4
10.9%
CAEP/4 only44.4% CAEP/4 only
43.4%CAEP/4 only
45.2% CAEP/4 only46.4% CAEP/4 only
41.5%CAEP/4 only
41.6%CAEP/4 only
38.3% CAEP/4 only36.5%
CAEP/4 only36.6%
CAEP/6 only30.0%
CAEP/6 only30.8% CAEP/6 only
31.6%
CAEP/6 only32.9%
CAEP/6 only36.9%
CAEP/6 only37.2%
CAEP/6 only40.2% CAEP/6 only
39.9% CAEP/6 only37.1%
CAEP/89.4% CAEP/8
10.6% CAEP/811.6%
CAEP/813.3% CAEP/8
13.6%CAEP/813.1%
CAEP/814.6% CAEP/8
17.3% CAEP/821.0%
0
100,000
200,000
300,000
400,000
500,000
2008/9 2009 2010 2011 2012 2013 2014 2015 2016
Mo
ve
me
nts
CAEP/8
CAEP/6 only
CAEP/4 only
Below CAEP/4
Exempt
Ricardo Energy & Environment Heathrow Airport 2016 Emission Inventory | 8
Ricardo in Confidence Ref: Ricardo/ED10362/Issue Number 1
To remain consistent with previous annual updates (where only aircraft movement data were updated), APU running times taken from the 2013 assessment have been used to generate ‘alternative’ inventories.
The results presented make comparisons with the emissions calculated using the ‘alternative’ APU running times, allowing the effect on emissions of updating the times to be quantified.
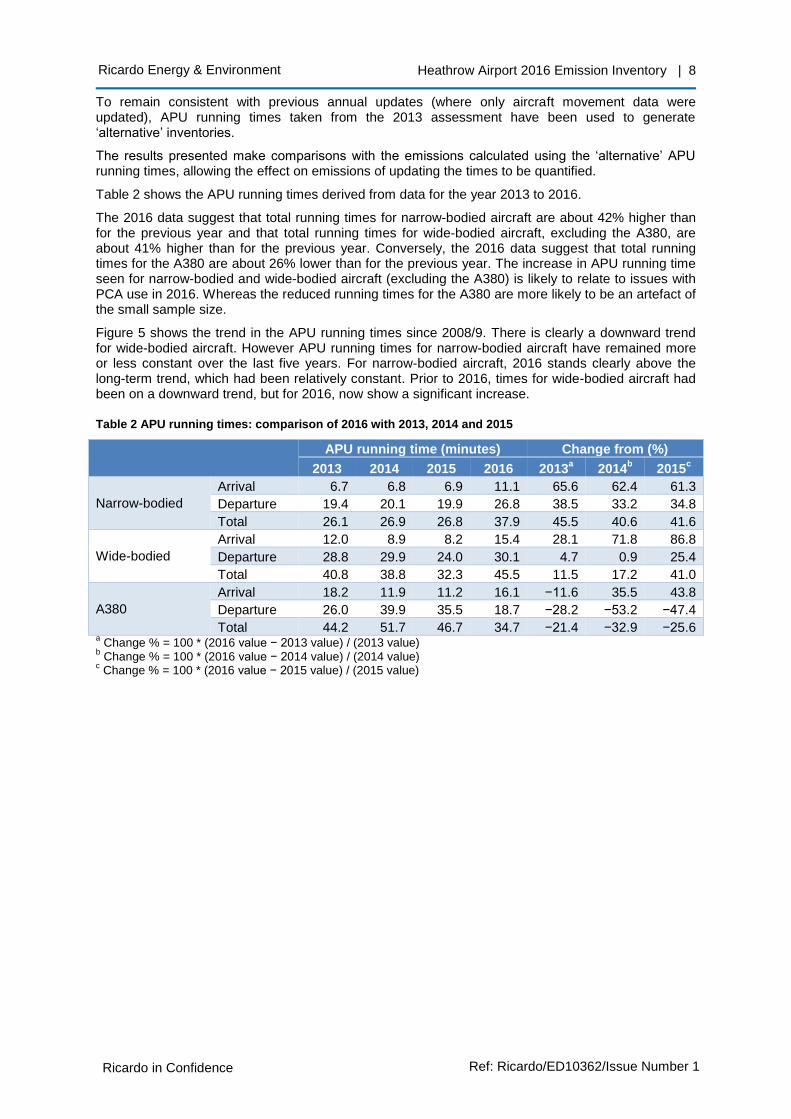
Table 2 shows the APU running times derived from data for the year 2013 to 2016.
The 2016 data suggest that total running times for narrow-bodied aircraft are about 42% higher than for the previous year and that total running times for wide-bodied aircraft, excluding the A380, are about 41% higher than for the previous year. Conversely, the 2016 data suggest that total running times for the A380 are about 26% lower than for the previous year. The increase in APU running time seen for narrow-bodied and wide-bodied aircraft (excluding the A380) is likely to relate to issues with PCA use in 2016. Whereas the reduced running times for the A380 are more likely to be an artefact of the small sample size.
Figure 5 shows the trend in the APU running times since 2008/9. There is clearly a downward trend for wide-bodied aircraft. However APU running times for narrow-bodied aircraft have remained more or less constant over the last five years. For narrow-bodied aircraft, 2016 stands clearly above the long-term trend, which had been relatively constant. Prior to 2016, times for wide-bodied aircraft had been on a downward trend, but for 2016, now show a significant increase.
Table 2 APU running times: comparison of 2016 with 2013, 2014 and 2015
APU running time (minutes) Change from (%)
2013 2014 2015 2016 2013a 2014
b 2015
c
Narrow-bodied
Arrival 6.7 6.8 6.9 11.1 65.6 62.4 61.3
Departure 19.4 20.1 19.9 26.8 38.5 33.2 34.8
Total 26.1 26.9 26.8 37.9 45.5 40.6 41.6
Wide-bodied
Arrival 12.0 8.9 8.2 15.4 28.1 71.8 86.8
Departure 28.8 29.9 24.0 30.1 4.7 0.9 25.4
Total 40.8 38.8 32.3 45.5 11.5 17.2 41.0
A380
Arrival 18.2 11.9 11.2 16.1 −11.6 35.5 43.8
Departure 26.0 39.9 35.5 18.7 −28.2 −53.2 −47.4
Total 44.2 51.7 46.7 34.7 −21.4 −32.9 −25.6 a Change % = 100 * (2016 value − 2013 value) / (2013 value)
b Change % = 100 * (2016 value − 2014 value) / (2014 value)
c Change % = 100 * (2016 value − 2015 value) / (2015 value)
Ricardo Energy & Environment Heathrow Airport 2016 Emission Inventory | 9
Ricardo in Confidence Ref: Ricardo/ED10362/Issue Number 1
Figure 5 APU running times
2.5 Taxi and hold times
The taxi and hold times for this 2016 emission inventory update are taken from data, for 2016, extracted from a NATS database that is populated using electronic flight processing strips (EFPS).
For departures, the EFPS database records time of pushback, time at hold, and actual time of departure, to 1 second precision
1. It therefore includes times for hold, line-up and pilot reaction as well
as taxi-out, and these have also been incorporated. For arrivals, it records actual time of arrival and time on-stand, again to 1 second precision; taxi-in times were obtained by subtracting landing roll times.
It was possible to match 99% of departures with an EFPS record so that they had individual taxi-out and hold times, and similarly for 99% of arrivals. For the other movements which could not be matched, times were taken from tables of times by runway/apron combination derived by averaging the EFPS data.
To remain consistent with previous annual updates (where only aircraft movement data were updated), average taxi and hold times taken from the 2013 assessment have been used to generate ‘alternative’ inventories.
The results presented make comparisons with the emissions calculated using the ‘alternative’ taxi and hold times, allowing the effect on emissions of updating the times to be quantified.
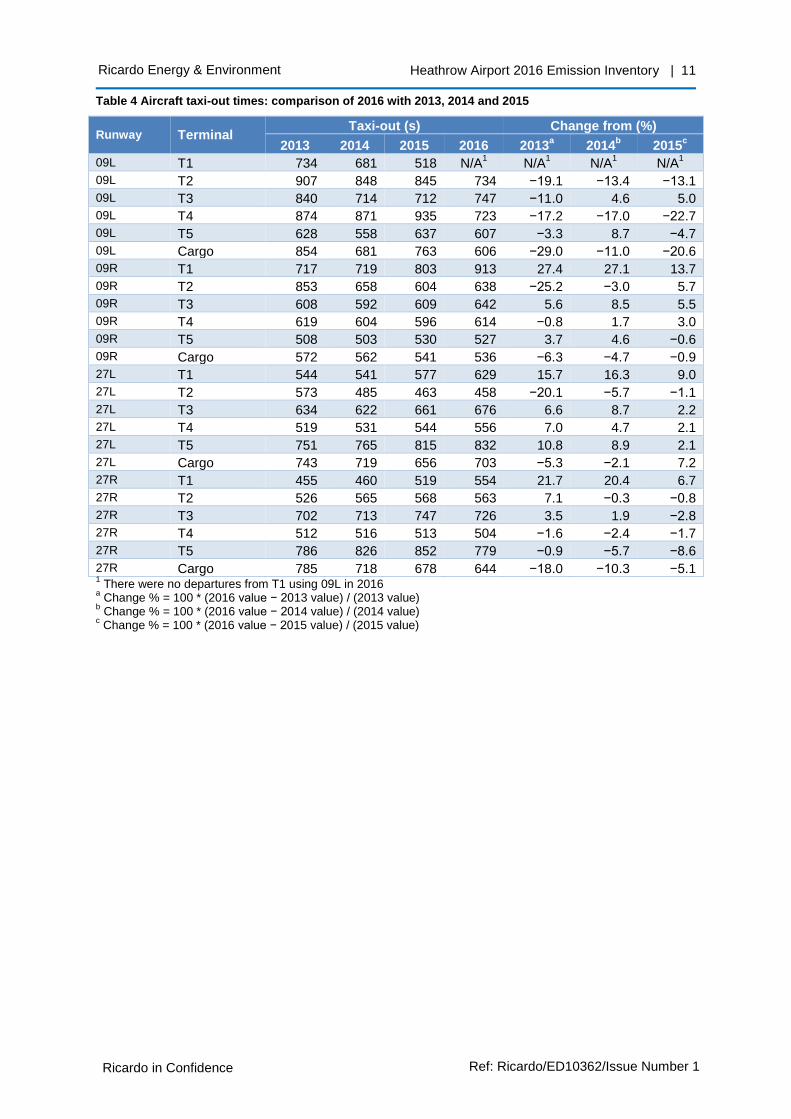
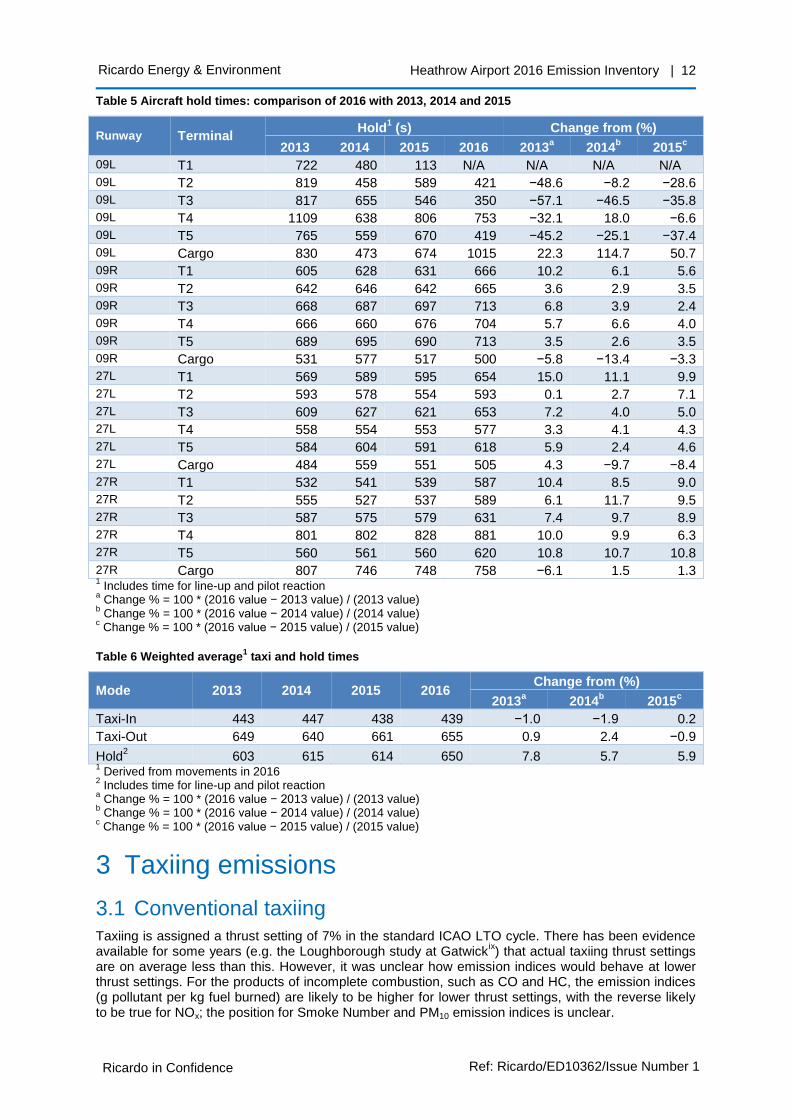
Table 3 show taxi-in times derived from data for the years 2013 to 2016, by runway and terminal. Table 4 and Table 5 show similar data for taxi-out and hold respectively. Table 6 shows that overall, the 2016 taxi and hold times are very similar to the 2013, 2014 and 2015 times. However, there is considerable variation in the differences between runway and terminal pairings.
1 The EFPS system records the time when controllers react to an observation or perform an action, so times are not necessarily accurate to
1 second.
0
20
40
60
80
100
120
140
2008/9 2010 2011 2012 2013 2014 2015 2016
AP
U r
un
nin
g t
ime
s (
min
ute
s)
Narrow Wide A380

Ricardo Energy & Environment Heathrow Airport 2016 Emission Inventory | 10
Ricardo in Confidence Ref: Ricardo/ED10362/Issue Number 1
Table 3 Aircraft taxi-in times: comparison of 2016 with 2013, 2014 and 2015
Runway Terminal Taxi-in (s) Change from (%)
2013 2014 2015 2016 2013a 2014
b 2015
c
09L T1 256 253 246 289 12.9 14.3 17.4
09L T2 327 406 435 407 24.4 0.1 −6.4
09L T3 389 399 407 419 7.8 5.1 3.1
09L T4 732 722 718 694 −5.1 −3.8 −3.3
09L T5 493 493 478 456 −7.5 −7.6 −4.5
09L Cargo 669 667 687 670 0.2 0.4 −2.4
09R T1 517 397 431 460 −11.0 15.9 6.8
09R T2 471 315 306 308 −34.7 −2.3 0.6
09R T3 383 395 409 417 8.9 5.6 1.9
09R T4 291 289 268 262 −9.9 −9.2 −2.0
09R T5 639 586 582 578 −9.6 −1.4 −0.7
09R Cargo 307 306 318 260 −15.3 −15.1 −18.1
27L T1 484 486 499 563 16.2 15.8 12.8
27L T2 576 411 367 339 −41.1 −17.6 −7.5
27L T3 328 329 323 350 6.7 6.4 8.4
27L T4 398 398 359 345 −13.2 −13.3 −3.8
27L T5 423 430 424 447 5.7 3.9 5.4
27L Cargo 223 221 200 185 −17.1 −16.5 −7.7
27R T1 272 273 285 355 30.4 29.9 24.5
27R T2 402 494 521 498 23.9 0.9 −4.4
27R T3 329 339 369 389 18.3 14.7 5.6
27R T4 719 728 734 764 6.2 5.0 4.0
27R T5 428 423 403 424 −0.9 0.4 5.2
27R Cargo 667 654 667 640 −4.1 −2.2 −4.1 a Change % = 100 * (2016 value − 2013 value) / (2013 value)
b Change % = 100 * (2016 value − 2014 value) / (2014 value)
c Change % = 100 * (2016 value − 2015 value) / (2015 value)
Ricardo Energy & Environment Heathrow Airport 2016 Emission Inventory | 11
Ricardo in Confidence Ref: Ricardo/ED10362/Issue Number 1
Table 4 Aircraft taxi-out times: comparison of 2016 with 2013, 2014 and 2015
Runway Terminal Taxi-out (s) Change from (%)
2013 2014 2015 2016 2013a 2014
b 2015
c
09L T1 734 681 518 N/A1 N/A
1 N/A
1 N/A
1
09L T2 907 848 845 734 −19.1 −13.4 −13.1
09L T3 840 714 712 747 −11.0 4.6 5.0
09L T4 874 871 935 723 −17.2 −17.0 −22.7
09L T5 628 558 637 607 −3.3 8.7 −4.7
09L Cargo 854 681 763 606 −29.0 −11.0 −20.6
09R T1 717 719 803 913 27.4 27.1 13.7
09R T2 853 658 604 638 −25.2 −3.0 5.7
09R T3 608 592 609 642 5.6 8.5 5.5
09R T4 619 604 596 614 −0.8 1.7 3.0
09R T5 508 503 530 527 3.7 4.6 −0.6
09R Cargo 572 562 541 536 −6.3 −4.7 −0.9
27L T1 544 541 577 629 15.7 16.3 9.0
27L T2 573 485 463 458 −20.1 −5.7 −1.1
27L T3 634 622 661 676 6.6 8.7 2.2
27L T4 519 531 544 556 7.0 4.7 2.1
27L T5 751 765 815 832 10.8 8.9 2.1
27L Cargo 743 719 656 703 −5.3 −2.1 7.2
27R T1 455 460 519 554 21.7 20.4 6.7
27R T2 526 565 568 563 7.1 −0.3 −0.8
27R T3 702 713 747 726 3.5 1.9 −2.8
27R T4 512 516 513 504 −1.6 −2.4 −1.7
27R T5 786 826 852 779 −0.9 −5.7 −8.6
27R Cargo 785 718 678 644 −18.0 −10.3 −5.1 1 There were no departures from T1 using 09L in 2016
a Change % = 100 * (2016 value − 2013 value) / (2013 value)
b Change % = 100 * (2016 value − 2014 value) / (2014 value)
c Change % = 100 * (2016 value − 2015 value) / (2015 value)
Ricardo Energy & Environment Heathrow Airport 2016 Emission Inventory | 12
Ricardo in Confidence Ref: Ricardo/ED10362/Issue Number 1
Table 5 Aircraft hold times: comparison of 2016 with 2013, 2014 and 2015
Runway Terminal Hold
1 (s) Change from (%)
2013 2014 2015 2016 2013a 2014
b 2015
c
09L T1 722 480 113 N/A N/A N/A N/A
09L T2 819 458 589 421 −48.6 −8.2 −28.6
09L T3 817 655 546 350 −57.1 −46.5 −35.8
09L T4 1109 638 806 753 −32.1 18.0 −6.6
09L T5 765 559 670 419 −45.2 −25.1 −37.4
09L Cargo 830 473 674 1015 22.3 114.7 50.7
09R T1 605 628 631 666 10.2 6.1 5.6
09R T2 642 646 642 665 3.6 2.9 3.5
09R T3 668 687 697 713 6.8 3.9 2.4
09R T4 666 660 676 704 5.7 6.6 4.0
09R T5 689 695 690 713 3.5 2.6 3.5
09R Cargo 531 577 517 500 −5.8 −13.4 −3.3
27L T1 569 589 595 654 15.0 11.1 9.9
27L T2 593 578 554 593 0.1 2.7 7.1
27L T3 609 627 621 653 7.2 4.0 5.0
27L T4 558 554 553 577 3.3 4.1 4.3
27L T5 584 604 591 618 5.9 2.4 4.6
27L Cargo 484 559 551 505 4.3 −9.7 −8.4
27R T1 532 541 539 587 10.4 8.5 9.0
27R T2 555 527 537 589 6.1 11.7 9.5
27R T3 587 575 579 631 7.4 9.7 8.9
27R T4 801 802 828 881 10.0 9.9 6.3
27R T5 560 561 560 620 10.8 10.7 10.8
27R Cargo 807 746 748 758 −6.1 1.5 1.3 1 Includes time for line-up and pilot reaction
a Change % = 100 * (2016 value − 2013 value) / (2013 value)
b Change % = 100 * (2016 value − 2014 value) / (2014 value)
c Change % = 100 * (2016 value − 2015 value) / (2015 value)
Table 6 Weighted average1 taxi and hold times
Mode 2013 2014 2015 2016 Change from (%)
2013a 2014
b 2015
c
Taxi-In 443 447 438 439 −1.0 −1.9 0.2
Taxi-Out 649 640 661 655 0.9 2.4 −0.9
Hold2 603 615 614 650 7.8 5.7 5.9
1 Derived from movements in 2016
2 Includes time for line-up and pilot reaction
a Change % = 100 * (2016 value − 2013 value) / (2013 value)
b Change % = 100 * (2016 value − 2014 value) / (2014 value)
c Change % = 100 * (2016 value − 2015 value) / (2015 value)
3 Taxiing emissions
3.1 Conventional taxiing
Taxiing is assigned a thrust setting of 7% in the standard ICAO LTO cycle. There has been evidence available for some years (e.g. the Loughborough study at Gatwick
ix) that actual taxiing thrust settings
are on average less than this. However, it was unclear how emission indices would behave at lower thrust settings. For the products of incomplete combustion, such as CO and HC, the emission indices (g pollutant per kg fuel burned) are likely to be higher for lower thrust settings, with the reverse likely to be true for NOx; the position for Smoke Number and PM10 emission indices is unclear.
Ricardo Energy & Environment Heathrow Airport 2016 Emission Inventory | 13
Ricardo in Confidence Ref: Ricardo/ED10362/Issue Number 1
For taxi-out and for taxi-in on all engines, the PSDH recommended that idle thrust settings lower than 7% should be taken into account. FDR data compiled for the PSDH indicate that in most cases the ground-idle thrust setting used during most of taxiing and hold is around 5% except for aircraft fitted with Rolls Royce engines, for which 3% thrust is nearer the mark. Clearly, there will be brief periods of higher thrust (perhaps 10% to 15%) to get the aircraft rolling or to negotiate sharp turns, but superimposed on much longer periods at the ground idle setting, so the average thrust level will be significantly below 7%.
It is easier to estimate the impact of these lower thrust settings on fuel flow than on emission indices. Considering the available data as a whole, the PSDH recommended that fuel flow rates for engine types other than Rolls Royce be set 15% - 20% lower than the ICAO 7% value and for Rolls Royce engines be set 30% - 35% lower than the ICAO 7% value, and these recommendations were implemented for Heathrow by using the mid-point of the ranges, i.e. 17.5% and 32.5% respectively, with the values applied to all periods of taxiing and hold. The PSDH further recommended that the NOx and PM10 emission indices at the lower fuel flow rate be held the same as the value at 7% thrust. As noted earlier, this is likely to yield a somewhat conservative estimate (i.e. overestimate) of taxiing NOx emissions; current information
x, albeit more uncertain, suggests that this assumption is also likely
to be conservative for PM10. These recommendations have been applied to LHR inventories since 2008/9.
3.2 Reduced-engine taxi
Reduced-engine taxiing is the practice of shutting down an engine during taxi operations, which helps reduce fuel use, emissions, and noise. In theory, reductions of 20% to 40% of the ground level fuel burn and CO2, and 10% to 30% of ground level NOx emissions, may be realised dependant on aircraft type and operator technique
2.
The estimation of taxiing emissions is made potentially more complex by the practice of reduced-engine taxiing. At the time of the PSDH there were no robust statistical data on the practice at Heathrow, although the PSDH expert panel report estimated it was used for around 25% or less of arrivals. Reduced-engine taxiing for departures was not common practice at the time. In light of this, the PSDH report made no specific recommendation for taking account of reduced-engine taxiing on NOx and PM emissions.
Since the publication of the PSDH report the practice of reduced-engine taxiing has become more widespread, due in part to the achieved fuel savings. Since the summer of 2014, Heathrow have recorded the use of reduced-engine taxiing for departures. During 2016 about 18% of departures used reduced-engine taxiing. The use of reduced-engine taxiing on arrival is expected to be more common than on departures. However, systems to record its use on arrival are not yet available at Heathrow or any other major airport, generally. Currently, Heathrow only record if reduced-engine taxiing is used on departure. They do not record the duration of its use or the associated APU use off-stand.
3.2.1 Taxi-out
In the assessment of reduced-engine taxiing we have assumed that aircraft using reduced-engine taxiing will operate on all engines for the final 2 to 3 minutes of taxi-out; this is to allow for the engines to fully warm-up prior to take-off. During reduced-engine taxiing we have assigned the standard ICAO thrust setting of 7%. We have also assumed that airlines will operate their APUs whilst taxiing using reduced engines. It is likely that the APU would be needed to provide on-board power to the aircraft and to start the remaining engine(s).
3.2.2 Taxi-in
Although reduced-engine taxiing was not recorded for arrivals, anecdotal evidence suggests its use on arrival is much more common than for departures. We have therefore extended the methodology to cover the arrivals corresponding to the reduce engine departures of the turnarounds (~18% of arrivals). We have conservatively assumed that aircraft using reduced-engine taxiing will operate on all engines for the first 2 to 3 minutes of taxi-in; this is to allow for engine cool-down and runway clearance. Anecdotal evidence suggests that pilots shut down one or more engines prior to 2 minutes after touch-down.
2 http://www.sustainableaviation.co.uk/wp-content/uploads/2015/09/Departures-Code-of-Practice-June-2012.pdf
Ricardo Energy & Environment Heathrow Airport 2016 Emission Inventory | 14
Ricardo in Confidence Ref: Ricardo/ED10362/Issue Number 1
3.2.3 100% reduced engine taxi
We have included an additional sensitivity test, which assumes that reduced engine taxiing is used for all movements. This test is designed to estimate the potential reductions that are achievable from more widespread use of reduced engine taxiing.
4 Results
4.1 NOx
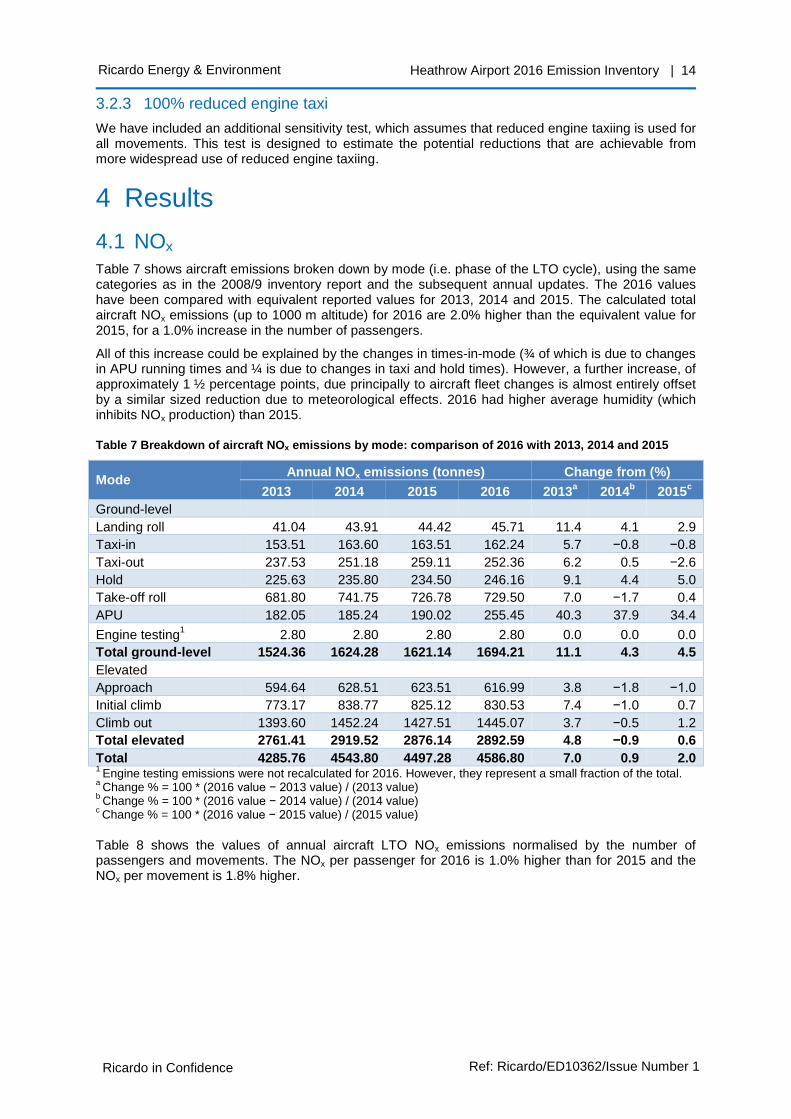
Table 7 shows aircraft emissions broken down by mode (i.e. phase of the LTO cycle), using the same categories as in the 2008/9 inventory report and the subsequent annual updates. The 2016 values have been compared with equivalent reported values for 2013, 2014 and 2015. The calculated total aircraft NOx emissions (up to 1000 m altitude) for 2016 are 2.0% higher than the equivalent value for 2015, for a 1.0% increase in the number of passengers.
All of this increase could be explained by the changes in times-in-mode (¾ of which is due to changes in APU running times and ¼ is due to changes in taxi and hold times). However, a further increase, of approximately 1 ½ percentage points, due principally to aircraft fleet changes is almost entirely offset by a similar sized reduction due to meteorological effects. 2016 had higher average humidity (which inhibits NOx production) than 2015.
Table 7 Breakdown of aircraft NOx emissions by mode: comparison of 2016 with 2013, 2014 and 2015
Mode Annual NOx emissions (tonnes) Change from (%)
2013 2014 2015 2016 2013a 2014
b 2015
c
Ground-level Landing roll 41.04 43.91 44.42 45.71 11.4 4.1 2.9
Taxi-in 153.51 163.60 163.51 162.24 5.7 −0.8 −0.8
Taxi-out 237.53 251.18 259.11 252.36 6.2 0.5 −2.6
Hold 225.63 235.80 234.50 246.16 9.1 4.4 5.0
Take-off roll 681.80 741.75 726.78 729.50 7.0 −1.7 0.4
APU 182.05 185.24 190.02 255.45 40.3 37.9 34.4
Engine testing1 2.80 2.80 2.80 2.80 0.0 0.0 0.0
Total ground-level 1524.36 1624.28 1621.14 1694.21 11.1 4.3 4.5
Elevated
Approach 594.64 628.51 623.51 616.99 3.8 −1.8 −1.0
Initial climb 773.17 838.77 825.12 830.53 7.4 −1.0 0.7
Climb out 1393.60 1452.24 1427.51 1445.07 3.7 −0.5 1.2
Total elevated 2761.41 2919.52 2876.14 2892.59 4.8 −0.9 0.6
Total 4285.76 4543.80 4497.28 4586.80 7.0 0.9 2.0 1
Engine testing emissions were not recalculated for 2016. However, they represent a small fraction of the total. a
Change % = 100 * (2016 value − 2013 value) / (2013 value) b
Change % = 100 * (2016 value − 2014 value) / (2014 value) c Change % = 100 * (2016 value − 2015 value) / (2015 value)
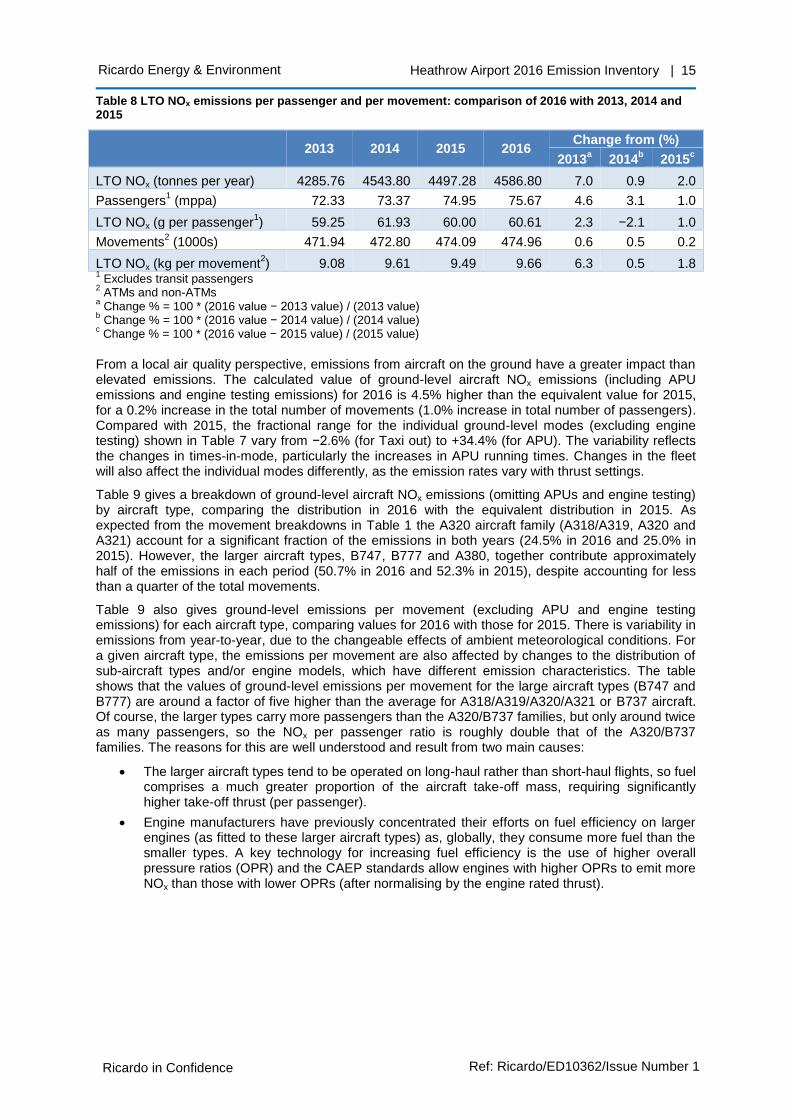
Table 8 shows the values of annual aircraft LTO NOx emissions normalised by the number of passengers and movements. The NOx per passenger for 2016 is 1.0% higher than for 2015 and the NOx per movement is 1.8% higher.
Ricardo Energy & Environment Heathrow Airport 2016 Emission Inventory | 15
Ricardo in Confidence Ref: Ricardo/ED10362/Issue Number 1
Table 8 LTO NOx emissions per passenger and per movement: comparison of 2016 with 2013, 2014 and 2015
2013 2014 2015 2016 Change from (%)
2013a 2014
b 2015
c
LTO NOx (tonnes per year) 4285.76 4543.80 4497.28 4586.80 7.0 0.9 2.0
Passengers1 (mppa) 72.33 73.37 74.95 75.67 4.6 3.1 1.0
LTO NOx (g per passenger1) 59.25 61.93 60.00 60.61 2.3 −2.1 1.0
Movements2 (1000s) 471.94 472.80 474.09 474.96 0.6 0.5 0.2
LTO NOx (kg per movement2) 9.08 9.61 9.49 9.66 6.3 0.5 1.8
1 Excludes transit passengers
2 ATMs and non-ATMs
a Change % = 100 * (2016 value − 2013 value) / (2013 value)
b Change % = 100 * (2016 value − 2014 value) / (2014 value)
c Change % = 100 * (2016 value − 2015 value) / (2015 value)
From a local air quality perspective, emissions from aircraft on the ground have a greater impact than elevated emissions. The calculated value of ground-level aircraft NOx emissions (including APU emissions and engine testing emissions) for 2016 is 4.5% higher than the equivalent value for 2015, for a 0.2% increase in the total number of movements (1.0% increase in total number of passengers). Compared with 2015, the fractional range for the individual ground-level modes (excluding engine testing) shown in Table 7 vary from −2.6% (for Taxi out) to +34.4% (for APU). The variability reflects the changes in times-in-mode, particularly the increases in APU running times. Changes in the fleet will also affect the individual modes differently, as the emission rates vary with thrust settings.
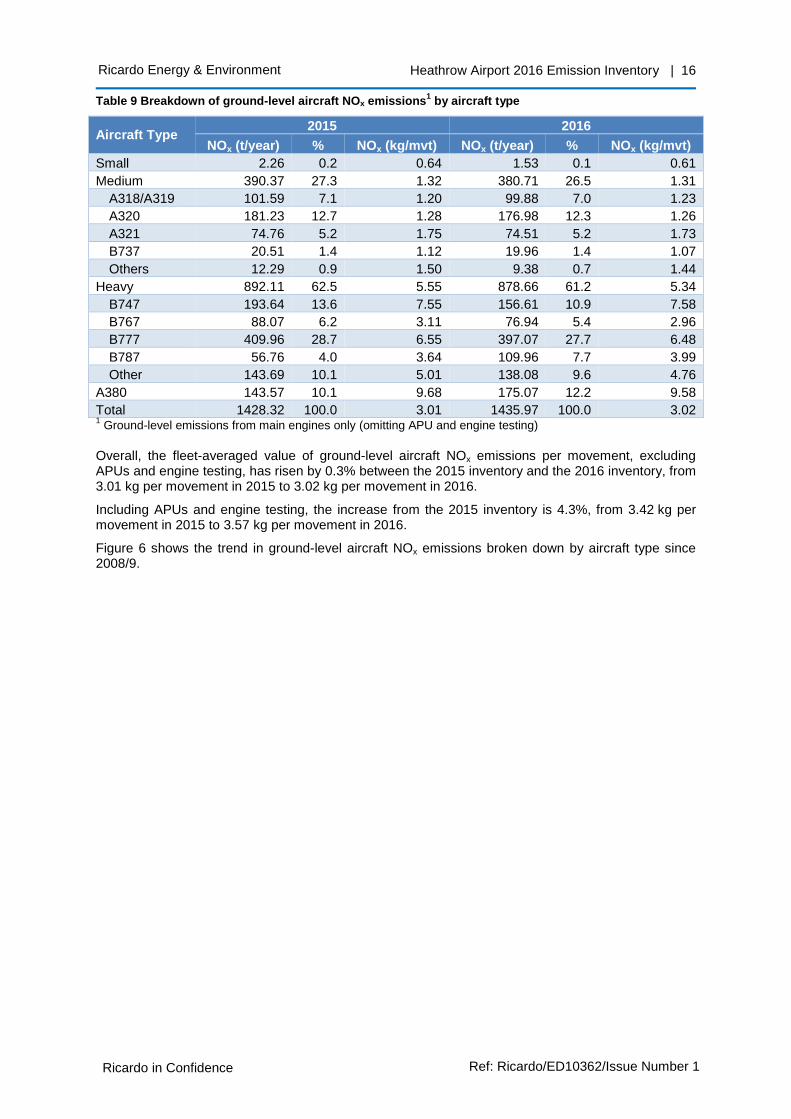
Table 9 gives a breakdown of ground-level aircraft NOx emissions (omitting APUs and engine testing) by aircraft type, comparing the distribution in 2016 with the equivalent distribution in 2015. As expected from the movement breakdowns in Table 1 the A320 aircraft family (A318/A319, A320 and A321) account for a significant fraction of the emissions in both years (24.5% in 2016 and 25.0% in 2015). However, the larger aircraft types, B747, B777 and A380, together contribute approximately half of the emissions in each period (50.7% in 2016 and 52.3% in 2015), despite accounting for less than a quarter of the total movements.
Table 9 also gives ground-level emissions per movement (excluding APU and engine testing emissions) for each aircraft type, comparing values for 2016 with those for 2015. There is variability in emissions from year-to-year, due to the changeable effects of ambient meteorological conditions. For a given aircraft type, the emissions per movement are also affected by changes to the distribution of sub-aircraft types and/or engine models, which have different emission characteristics. The table shows that the values of ground-level emissions per movement for the large aircraft types (B747 and B777) are around a factor of five higher than the average for A318/A319/A320/A321 or B737 aircraft. Of course, the larger types carry more passengers than the A320/B737 families, but only around twice as many passengers, so the NOx per passenger ratio is roughly double that of the A320/B737 families. The reasons for this are well understood and result from two main causes:
The larger aircraft types tend to be operated on long-haul rather than short-haul flights, so fuel comprises a much greater proportion of the aircraft take-off mass, requiring significantly higher take-off thrust (per passenger).
Engine manufacturers have previously concentrated their efforts on fuel efficiency on larger engines (as fitted to these larger aircraft types) as, globally, they consume more fuel than the smaller types. A key technology for increasing fuel efficiency is the use of higher overall pressure ratios (OPR) and the CAEP standards allow engines with higher OPRs to emit more NOx than those with lower OPRs (after normalising by the engine rated thrust).
Ricardo Energy & Environment Heathrow Airport 2016 Emission Inventory | 16
Ricardo in Confidence Ref: Ricardo/ED10362/Issue Number 1
Table 9 Breakdown of ground-level aircraft NOx emissions1 by aircraft type
Aircraft Type 2015 2016
NOx (t/year) % NOx (kg/mvt) NOx (t/year) % NOx (kg/mvt)
Small 2.26 0.2 0.64 1.53 0.1 0.61
Medium 390.37 27.3 1.32 380.71 26.5 1.31
A318/A319 101.59 7.1 1.20 99.88 7.0 1.23
A320 181.23 12.7 1.28 176.98 12.3 1.26
A321 74.76 5.2 1.75 74.51 5.2 1.73
B737 20.51 1.4 1.12 19.96 1.4 1.07
Others 12.29 0.9 1.50 9.38 0.7 1.44
Heavy 892.11 62.5 5.55 878.66 61.2 5.34
B747 193.64 13.6 7.55 156.61 10.9 7.58
B767 88.07 6.2 3.11 76.94 5.4 2.96
B777 409.96 28.7 6.55 397.07 27.7 6.48
B787 56.76 4.0 3.64 109.96 7.7 3.99
Other 143.69 10.1 5.01 138.08 9.6 4.76
A380 143.57 10.1 9.68 175.07 12.2 9.58
Total 1428.32 100.0 3.01 1435.97 100.0 3.02 1 Ground-level emissions from main engines only (omitting APU and engine testing)
Overall, the fleet-averaged value of ground-level aircraft NOx emissions per movement, excluding APUs and engine testing, has risen by 0.3% between the 2015 inventory and the 2016 inventory, from 3.01 kg per movement in 2015 to 3.02 kg per movement in 2016.
Including APUs and engine testing, the increase from the 2015 inventory is 4.3%, from 3.42 kg per movement in 2015 to 3.57 kg per movement in 2016.
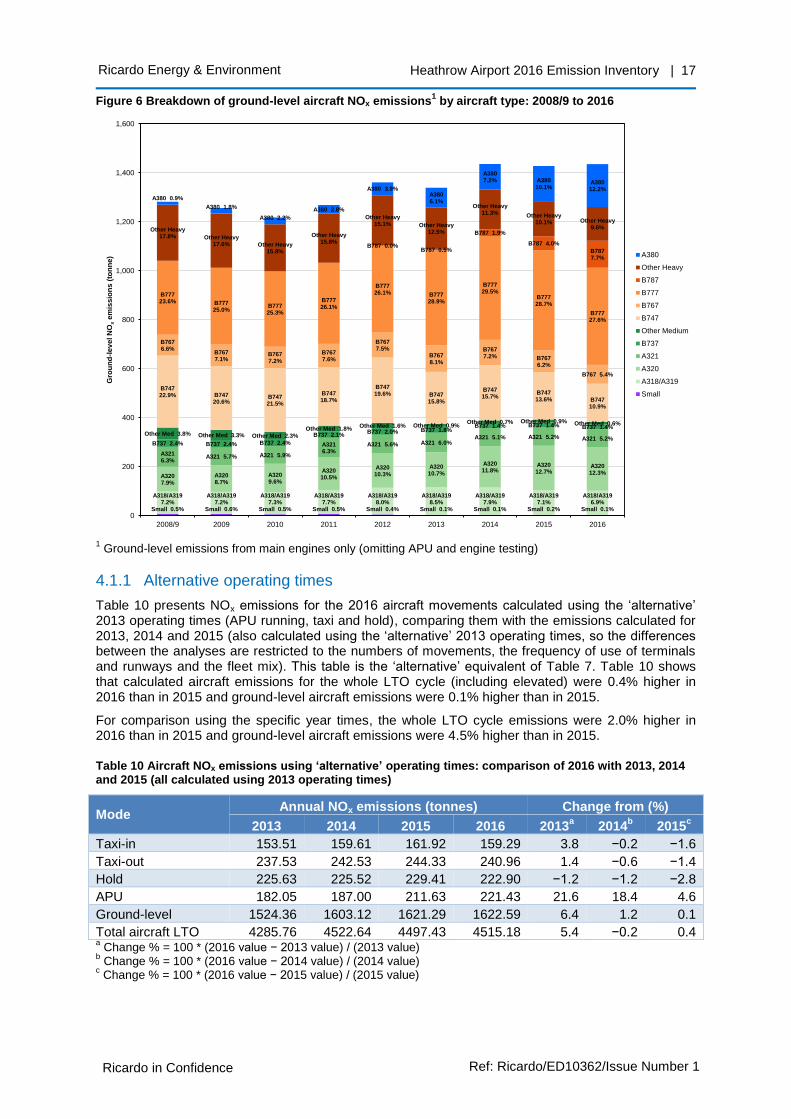
Figure 6 shows the trend in ground-level aircraft NOx emissions broken down by aircraft type since 2008/9.
Ricardo Energy & Environment Heathrow Airport 2016 Emission Inventory | 17
Ricardo in Confidence Ref: Ricardo/ED10362/Issue Number 1
Figure 6 Breakdown of ground-level aircraft NOx emissions1 by aircraft type: 2008/9 to 2016
1 Ground-level emissions from main engines only (omitting APU and engine testing)
4.1.1 Alternative operating times
Table 10 presents NOx emissions for the 2016 aircraft movements calculated using the ‘alternative’ 2013 operating times (APU running, taxi and hold), comparing them with the emissions calculated for 2013, 2014 and 2015 (also calculated using the ‘alternative’ 2013 operating times, so the differences between the analyses are restricted to the numbers of movements, the frequency of use of terminals and runways and the fleet mix). This table is the ‘alternative’ equivalent of Table 7. Table 10 shows that calculated aircraft emissions for the whole LTO cycle (including elevated) were 0.4% higher in 2016 than in 2015 and ground-level aircraft emissions were 0.1% higher than in 2015.
For comparison using the specific year times, the whole LTO cycle emissions were 2.0% higher in 2016 than in 2015 and ground-level aircraft emissions were 4.5% higher than in 2015.
Table 10 Aircraft NOx emissions using ‘alternative’ operating times: comparison of 2016 with 2013, 2014 and 2015 (all calculated using 2013 operating times)
Mode Annual NOx emissions (tonnes) Change from (%)
2013 2014 2015 2016 2013a 2014
b 2015
c
Taxi-in 153.51 159.61 161.92 159.29 3.8 −0.2 −1.6
Taxi-out 237.53 242.53 244.33 240.96 1.4 −0.6 −1.4
Hold 225.63 225.52 229.41 222.90 −1.2 −1.2 −2.8
APU 182.05 187.00 211.63 221.43 21.6 18.4 4.6
Ground-level 1524.36 1603.12 1621.29 1622.59 6.4 1.2 0.1
Total aircraft LTO 4285.76 4522.64 4497.43 4515.18 5.4 −0.2 0.4 a Change % = 100 * (2016 value − 2013 value) / (2013 value)
b Change % = 100 * (2016 value − 2014 value) / (2014 value)
c Change % = 100 * (2016 value − 2015 value) / (2015 value)
A318/A3197.2%
Small 0.5%
A318/A3197.2%
Small 0.6%
A318/A3197.3%
Small 0.5%
A318/A3197.7%
Small 0.5%
A318/A3198.0%
Small 0.4%
A318/A3198.5%
Small 0.1%
A318/A3197.9%
Small 0.1%
A318/A3197.1%
Small 0.2%
A318/A3196.9%
Small 0.1%
A3207.9%
A3208.7%
A3209.6%
A32010.5%
A32010.3%
A32010.7%
A32011.8%
A32012.7%
A32012.3%
A3216.3%
A321 5.7% A321 5.9%
A3216.3%
A321 5.6% A321 6.0%A321 5.1% A321 5.2% A321 5.2%
B737 2.4% B737 2.4% B737 2.4%
B737 2.1%B737 2.0% B737 1.8%
B737 1.4% B737 1.4% B737 1.4%Other Med 3.8% Other Med 3.3% Other Med 2.3%
Other Med 1.8%Other Med 1.6% Other Med 0.9%
Other Med 0.7% Other Med 0.9% Other Med 0.6%
B74722.9% B747
20.6%B74721.5%
B74718.7%
B74719.6% B747
15.8%
B74715.7%
B74713.6% B747
10.9%
B7676.6%
B7677.1%
B7677.2%
B7677.6%
B7677.5%
B7678.1%
B7677.2% B767
6.2%
B767 5.4%
B77723.6% B777
25.0%B77725.3%
B77726.1%
B77726.1% B777
28.9%
B77729.5%
B77728.7%
B77727.6%
B787 0.0%B787 0.5%
B787 1.9%
B787 4.0%
B7877.7%
Other Heavy17.8% Other Heavy
17.6% Other Heavy15.8%
Other Heavy15.8%
Other Heavy15.1% Other Heavy
12.5%
Other Heavy11.3% Other Heavy
10.1% Other Heavy9.6%
A380 0.9%
A380 1.8%
A380 2.2%
A380 2.8%
A380 3.9%A3806.1%
A3807.2% A380
10.1%A38012.2%
0
200
400
600
800
1,000
1,200
1,400
1,600
2008/9 2009 2010 2011 2012 2013 2014 2015 2016
Gro
un
d-l
ev
el N
Ox
em
issio
ns
(to
nn
e) A380
Other Heavy
B787
B777
B767
B747
Other Medium
B737
A321
A320
A318/A319
Small
Ricardo Energy & Environment Heathrow Airport 2016 Emission Inventory | 18
Ricardo in Confidence Ref: Ricardo/ED10362/Issue Number 1
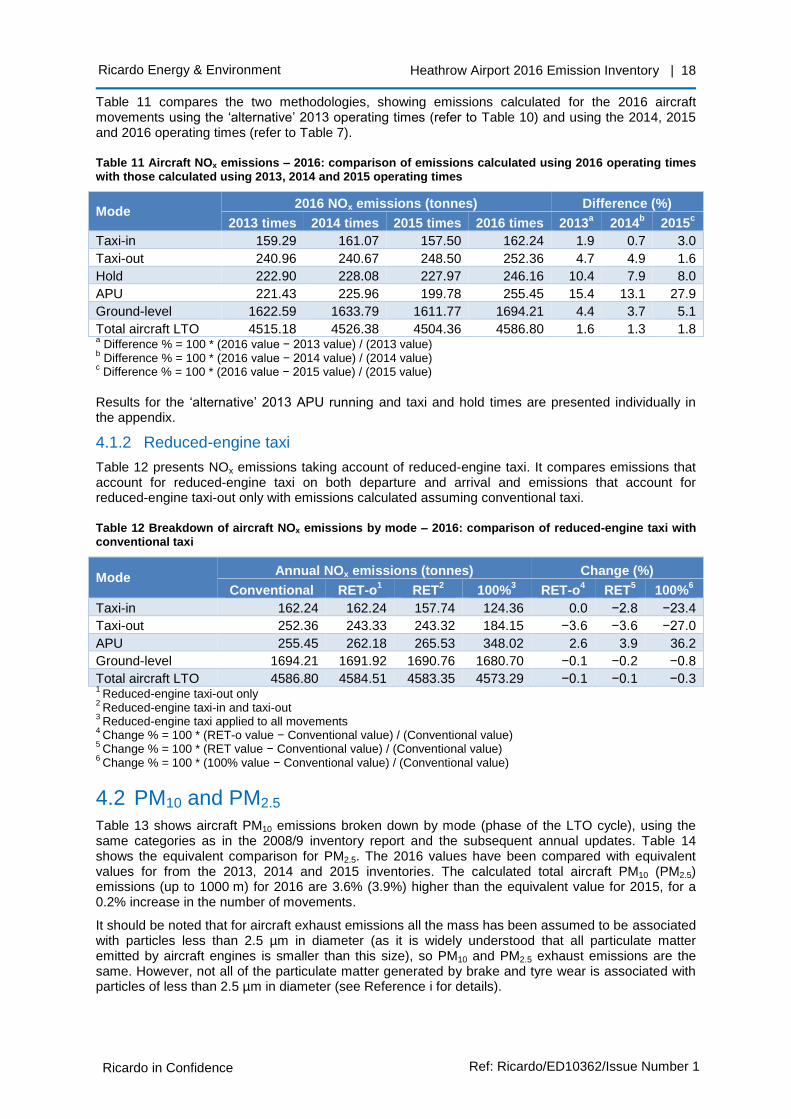
Table 11 compares the two methodologies, showing emissions calculated for the 2016 aircraft movements using the ‘alternative’ 2013 operating times (refer to Table 10) and using the 2014, 2015 and 2016 operating times (refer to Table 7).
Table 11 Aircraft NOx emissions – 2016: comparison of emissions calculated using 2016 operating times with those calculated using 2013, 2014 and 2015 operating times
Mode 2016 NOx emissions (tonnes) Difference (%)
2013 times 2014 times 2015 times 2016 times 2013a 2014
b 2015
c
Taxi-in 159.29 161.07 157.50 162.24 1.9 0.7 3.0
Taxi-out 240.96 240.67 248.50 252.36 4.7 4.9 1.6
Hold 222.90 228.08 227.97 246.16 10.4 7.9 8.0
APU 221.43 225.96 199.78 255.45 15.4 13.1 27.9
Ground-level 1622.59 1633.79 1611.77 1694.21 4.4 3.7 5.1
Total aircraft LTO 4515.18 4526.38 4504.36 4586.80 1.6 1.3 1.8 a Difference % = 100 * (2016 value − 2013 value) / (2013 value)
b Difference % = 100 * (2016 value − 2014 value) / (2014 value)
c Difference % = 100 * (2016 value − 2015 value) / (2015 value)
Results for the ‘alternative’ 2013 APU running and taxi and hold times are presented individually in the appendix.
4.1.2 Reduced-engine taxi
Table 12 presents NOx emissions taking account of reduced-engine taxi. It compares emissions that account for reduced-engine taxi on both departure and arrival and emissions that account for reduced-engine taxi-out only with emissions calculated assuming conventional taxi.
Table 12 Breakdown of aircraft NOx emissions by mode – 2016: comparison of reduced-engine taxi with conventional taxi
Mode Annual NOx emissions (tonnes) Change (%)
Conventional RET-o1 RET
2 100%
3 RET-o
4 RET
5 100%
6
Taxi-in 162.24 162.24 157.74 124.36 0.0 −2.8 −23.4
Taxi-out 252.36 243.33 243.32 184.15 −3.6 −3.6 −27.0
APU 255.45 262.18 265.53 348.02 2.6 3.9 36.2
Ground-level 1694.21 1691.92 1690.76 1680.70 −0.1 −0.2 −0.8
Total aircraft LTO 4586.80 4584.51 4583.35 4573.29 −0.1 −0.1 −0.3 1
Reduced-engine taxi-out only 2
Reduced-engine taxi-in and taxi-out 3
Reduced-engine taxi applied to all movements 4
Change % = 100 * (RET-o value − Conventional value) / (Conventional value) 5
Change % = 100 * (RET value − Conventional value) / (Conventional value) 6
Change % = 100 * (100% value − Conventional value) / (Conventional value)
4.2 PM10 and PM2.5
Table 13 shows aircraft PM10 emissions broken down by mode (phase of the LTO cycle), using the same categories as in the 2008/9 inventory report and the subsequent annual updates. Table 14 shows the equivalent comparison for PM2.5. The 2016 values have been compared with equivalent values for from the 2013, 2014 and 2015 inventories. The calculated total aircraft PM10 (PM2.5) emissions (up to 1000 m) for 2016 are 3.6% (3.9%) higher than the equivalent value for 2015, for a 0.2% increase in the number of movements.
It should be noted that for aircraft exhaust emissions all the mass has been assumed to be associated with particles less than 2.5 µm in diameter (as it is widely understood that all particulate matter emitted by aircraft engines is smaller than this size), so PM10 and PM2.5 exhaust emissions are the same. However, not all of the particulate matter generated by brake and tyre wear is associated with particles of less than 2.5 µm in diameter (see Reference i for details).

Ricardo Energy & Environment Heathrow Airport 2016 Emission Inventory | 19
Ricardo in Confidence Ref: Ricardo/ED10362/Issue Number 1
Table 13 Breakdown of aircraft PM10 emissions by mode: comparison of 2016 with 2013, 2014 and 2015
Mode Annual PM10 emissions (tonnes) Change from (%)
2013 2014 2015 2016 2013a 2014
b 2015
c
Ground-level
Landing roll 0.55 0.53 0.53 0.54 −1.1 3.0 2.1
Taxi-in 3.18 3.12 3.16 3.17 −0.5 1.4 0.4
Taxi-out 4.90 4.75 4.93 4.87 −0.6 2.5 −1.3
Hold 4.62 4.47 4.46 4.75 2.8 6.2 6.5
Take-off roll 3.34 3.07 2.99 2.99 −10.3 −2.7 −0.1
Brake wear 9.25 9.45 9.58 9.74 5.3 3.0 1.7
Tyre wear 6.10 6.27 6.38 6.51 6.8 3.9 2.1
APU 3.52 3.47 3.15 4.33 23.0 24.8 37.4
Engine testing1 0.06 0.06 0.06 0.06 0.0 0.0 0.0
Total ground-level 35.51 35.19 35.24 36.96 4.1 5.0 4.9
Elevated
Approach 5.69 5.50 5.50 5.50 −3.4 0.0 0.0
Initial climb 3.27 3.01 2.95 2.95 −9.5 −1.7 0.1
Climb out 6.50 5.99 5.86 5.92 −8.9 −1.1 1.1
Total elevated 15.46 14.50 14.32 14.38 −7.0 −0.8 0.4
Total 50.97 49.69 49.56 51.34 0.7 3.3 3.6 1
Engine testing emissions were not recalculated for 2016. However, they represent a small fraction of the total. a
Change % = 100 * (2016 value − 2013 value) / (2013 value) b
Change % = 100 * (2016 value − 2014 value) / (2014 value) c Change % = 100 * (2016 value − 2015 value) / (2015 value)
Table 14 Breakdown of aircraft PM2.5 emissions by mode: comparison of 2016 with 2013, 2014 and 2015
Mode Annual PM2.5 emissions (tonnes) Change from (%)
2013 2014 2015 2016 2013a 2014
b 2015
c
Ground-level
Landing roll 0.55 0.53 0.53 0.54 −1.1 3.0 2.1
Taxi-in 3.18 3.12 3.16 3.17 −0.5 1.4 0.4
Taxi-out 4.90 4.75 4.93 4.87 −0.6 2.5 −1.3
Hold 4.62 4.47 4.46 4.75 2.8 6.2 6.5
Take-off roll 3.34 3.07 2.99 2.99 −10.3 −2.7 −0.1
Brake wear 3.68 3.76 3.81 3.88 5.3 3.0 1.7
Tyre wear 4.27 4.39 4.47 4.56 6.8 3.9 2.1
APU 3.52 3.47 3.15 4.33 23.0 24.8 37.4
Engine testing1 0.06 0.06 0.06 0.06 0.0 0.0 0.0
Total ground-level 28.11 27.62 27.56 29.14 3.7 5.5 5.7
Elevated
Approach 5.69 5.50 5.50 5.50 −3.4 0.0 0.0
Initial climb 3.27 3.01 2.95 2.95 −9.5 −1.7 0.1
Climb out 6.50 5.99 5.86 5.92 −8.9 −1.1 1.1
Total elevated 15.46 14.50 14.32 14.38 −7.0 −0.8 0.4
Total 43.57 42.12 41.88 43.52 −0.1 3.3 3.9 1
Engine testing emissions were not recalculated for 2016. However, they represent a small fraction of the total. a
Change % = 100 * (2016 value − 2013 value) / (2013 value) b
Change % = 100 * (2016 value − 2014 value) / (2014 value) c Change % = 100 * (2016 value − 2015 value) / (2015 value)
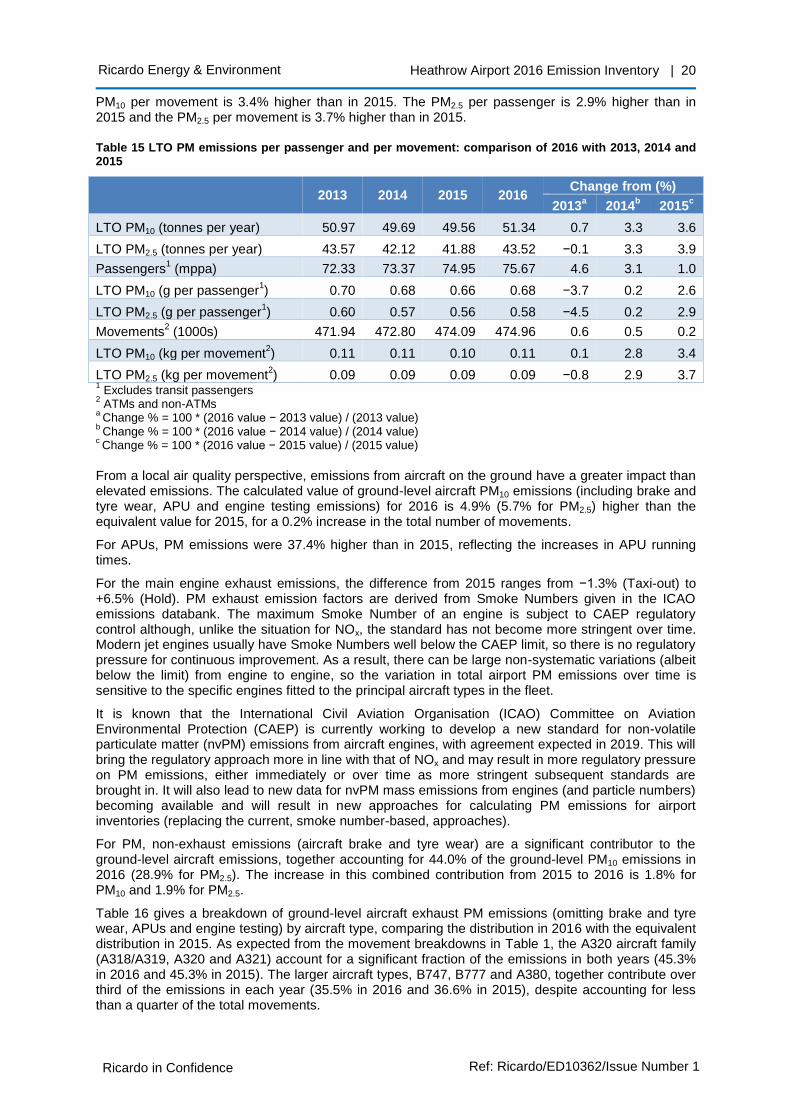
Table 15 shows the values of annual aircraft LTO PM10 and PM2.5 emissions normalised by the number of passengers and movements. The PM10 per passenger is 2.6% higher than in 2015 and the
Ricardo Energy & Environment Heathrow Airport 2016 Emission Inventory | 20
Ricardo in Confidence Ref: Ricardo/ED10362/Issue Number 1
PM10 per movement is 3.4% higher than in 2015. The PM2.5 per passenger is 2.9% higher than in 2015 and the PM2.5 per movement is 3.7% higher than in 2015.
Table 15 LTO PM emissions per passenger and per movement: comparison of 2016 with 2013, 2014 and 2015
2013 2014 2015 2016 Change from (%)
2013a 2014
b 2015
c
LTO PM10 (tonnes per year) 50.97 49.69 49.56 51.34 0.7 3.3 3.6
LTO PM2.5 (tonnes per year) 43.57 42.12 41.88 43.52 −0.1 3.3 3.9
Passengers1 (mppa) 72.33 73.37 74.95 75.67 4.6 3.1 1.0
LTO PM10 (g per passenger1) 0.70 0.68 0.66 0.68 −3.7 0.2 2.6
LTO PM2.5 (g per passenger1) 0.60 0.57 0.56 0.58 −4.5 0.2 2.9
Movements2 (1000s) 471.94 472.80 474.09 474.96 0.6 0.5 0.2
LTO PM10 (kg per movement2) 0.11 0.11 0.10 0.11 0.1 2.8 3.4
LTO PM2.5 (kg per movement2) 0.09 0.09 0.09 0.09 −0.8 2.9 3.7
1 Excludes transit passengers
2 ATMs and non-ATMs
a Change % = 100 * (2016 value − 2013 value) / (2013 value)
b Change % = 100 * (2016 value − 2014 value) / (2014 value)
c Change % = 100 * (2016 value − 2015 value) / (2015 value)
From a local air quality perspective, emissions from aircraft on the ground have a greater impact than elevated emissions. The calculated value of ground-level aircraft PM10 emissions (including brake and tyre wear, APU and engine testing emissions) for 2016 is 4.9% (5.7% for PM2.5) higher than the equivalent value for 2015, for a 0.2% increase in the total number of movements.
For APUs, PM emissions were 37.4% higher than in 2015, reflecting the increases in APU running times.
For the main engine exhaust emissions, the difference from 2015 ranges from −1.3% (Taxi-out) to +6.5% (Hold). PM exhaust emission factors are derived from Smoke Numbers given in the ICAO emissions databank. The maximum Smoke Number of an engine is subject to CAEP regulatory control although, unlike the situation for NOx, the standard has not become more stringent over time. Modern jet engines usually have Smoke Numbers well below the CAEP limit, so there is no regulatory pressure for continuous improvement. As a result, there can be large non-systematic variations (albeit below the limit) from engine to engine, so the variation in total airport PM emissions over time is sensitive to the specific engines fitted to the principal aircraft types in the fleet.
It is known that the International Civil Aviation Organisation (ICAO) Committee on Aviation Environmental Protection (CAEP) is currently working to develop a new standard for non-volatile particulate matter (nvPM) emissions from aircraft engines, with agreement expected in 2019. This will bring the regulatory approach more in line with that of NOx and may result in more regulatory pressure on PM emissions, either immediately or over time as more stringent subsequent standards are brought in. It will also lead to new data for nvPM mass emissions from engines (and particle numbers) becoming available and will result in new approaches for calculating PM emissions for airport inventories (replacing the current, smoke number-based, approaches).
For PM, non-exhaust emissions (aircraft brake and tyre wear) are a significant contributor to the ground-level aircraft emissions, together accounting for 44.0% of the ground-level PM10 emissions in 2016 (28.9% for PM2.5). The increase in this combined contribution from 2015 to 2016 is 1.8% for PM10 and 1.9% for PM2.5.
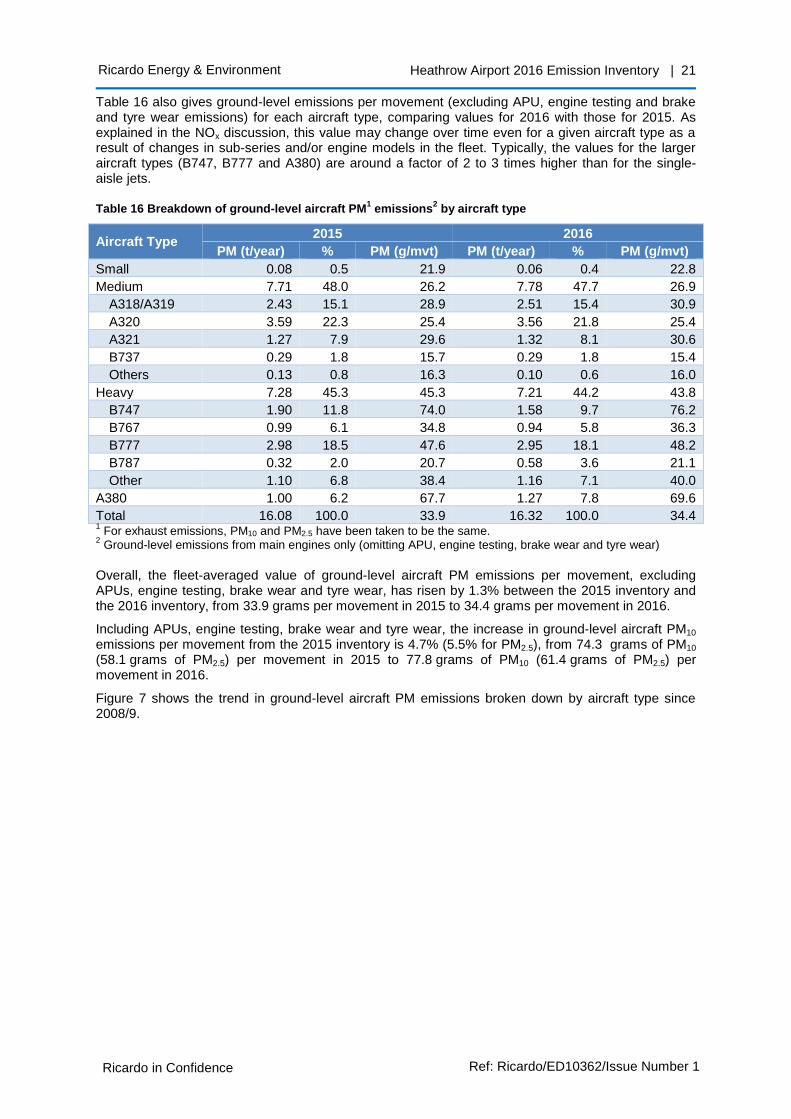
Table 16 gives a breakdown of ground-level aircraft exhaust PM emissions (omitting brake and tyre wear, APUs and engine testing) by aircraft type, comparing the distribution in 2016 with the equivalent distribution in 2015. As expected from the movement breakdowns in Table 1, the A320 aircraft family (A318/A319, A320 and A321) account for a significant fraction of the emissions in both years (45.3% in 2016 and 45.3% in 2015). The larger aircraft types, B747, B777 and A380, together contribute over third of the emissions in each year (35.5% in 2016 and 36.6% in 2015), despite accounting for less than a quarter of the total movements.
Ricardo Energy & Environment Heathrow Airport 2016 Emission Inventory | 21
Ricardo in Confidence Ref: Ricardo/ED10362/Issue Number 1
Table 16 also gives ground-level emissions per movement (excluding APU, engine testing and brake and tyre wear emissions) for each aircraft type, comparing values for 2016 with those for 2015. As explained in the NOx discussion, this value may change over time even for a given aircraft type as a result of changes in sub-series and/or engine models in the fleet. Typically, the values for the larger aircraft types (B747, B777 and A380) are around a factor of 2 to 3 times higher than for the single-aisle jets.
Table 16 Breakdown of ground-level aircraft PM1 emissions
2 by aircraft type
Aircraft Type 2015 2016
PM (t/year) % PM (g/mvt) PM (t/year) % PM (g/mvt)
Small 0.08 0.5 21.9 0.06 0.4 22.8
Medium 7.71 48.0 26.2 7.78 47.7 26.9
A318/A319 2.43 15.1 28.9 2.51 15.4 30.9
A320 3.59 22.3 25.4 3.56 21.8 25.4
A321 1.27 7.9 29.6 1.32 8.1 30.6
B737 0.29 1.8 15.7 0.29 1.8 15.4
Others 0.13 0.8 16.3 0.10 0.6 16.0
Heavy 7.28 45.3 45.3 7.21 44.2 43.8
B747 1.90 11.8 74.0 1.58 9.7 76.2
B767 0.99 6.1 34.8 0.94 5.8 36.3
B777 2.98 18.5 47.6 2.95 18.1 48.2
B787 0.32 2.0 20.7 0.58 3.6 21.1
Other 1.10 6.8 38.4 1.16 7.1 40.0
A380 1.00 6.2 67.7 1.27 7.8 69.6
Total 16.08 100.0 33.9 16.32 100.0 34.4 1 For exhaust emissions, PM10 and PM2.5 have been taken to be the same.
2 Ground-level emissions from main engines only (omitting APU, engine testing, brake wear and tyre wear)
Overall, the fleet-averaged value of ground-level aircraft PM emissions per movement, excluding APUs, engine testing, brake wear and tyre wear, has risen by 1.3% between the 2015 inventory and the 2016 inventory, from 33.9 grams per movement in 2015 to 34.4 grams per movement in 2016.
Including APUs, engine testing, brake wear and tyre wear, the increase in ground-level aircraft PM10 emissions per movement from the 2015 inventory is 4.7% (5.5% for PM2.5), from 74.3 grams of PM10 (58.1 grams of PM2.5) per movement in 2015 to 77.8 grams of PM10 (61.4 grams of PM2.5) per movement in 2016.
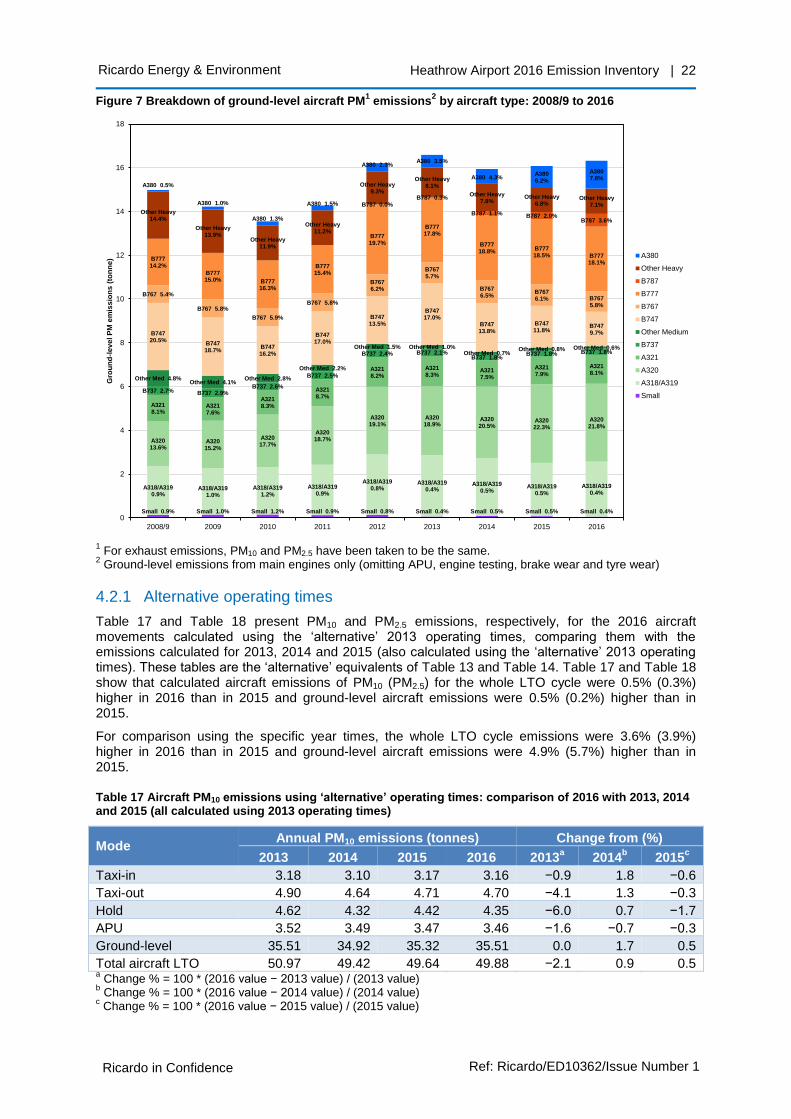
Figure 7 shows the trend in ground-level aircraft PM emissions broken down by aircraft type since 2008/9.
Ricardo Energy & Environment Heathrow Airport 2016 Emission Inventory | 22
Ricardo in Confidence Ref: Ricardo/ED10362/Issue Number 1
Figure 7 Breakdown of ground-level aircraft PM1 emissions
2 by aircraft type: 2008/9 to 2016
1 For exhaust emissions, PM10 and PM2.5 have been taken to be the same.
2 Ground-level emissions from main engines only (omitting APU, engine testing, brake wear and tyre wear)
4.2.1 Alternative operating times
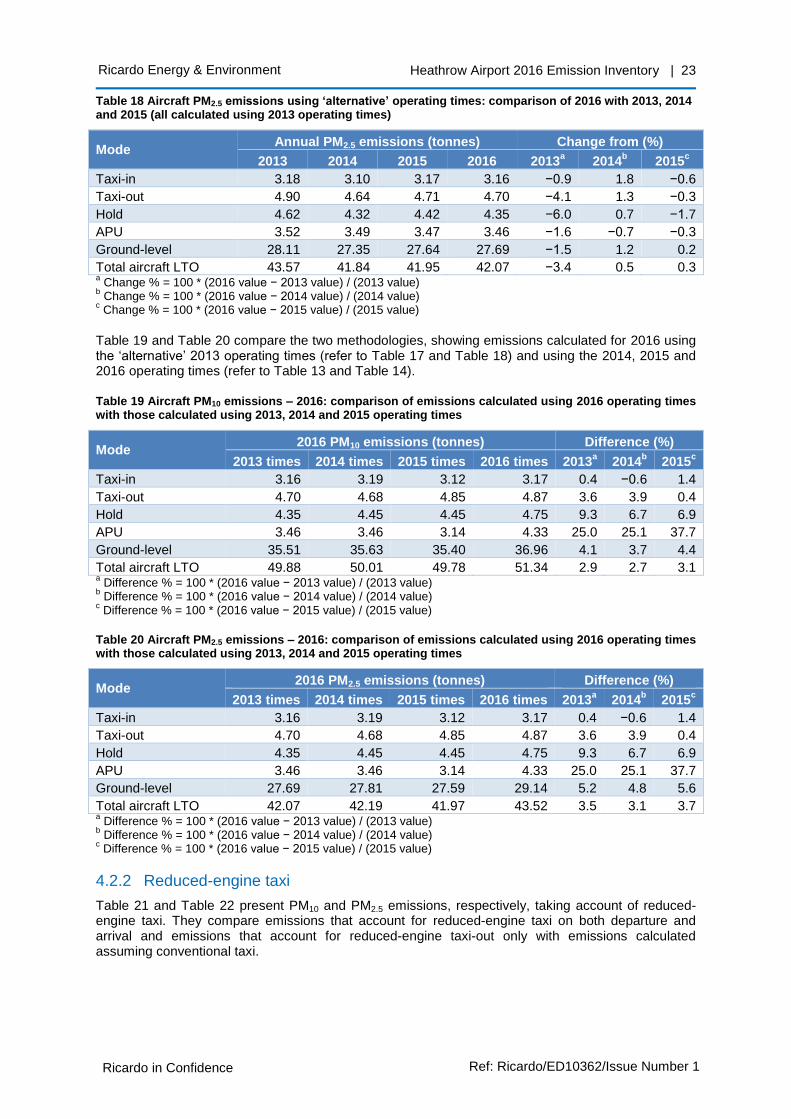
Table 17 and Table 18 present PM10 and PM2.5 emissions, respectively, for the 2016 aircraft movements calculated using the ‘alternative’ 2013 operating times, comparing them with the emissions calculated for 2013, 2014 and 2015 (also calculated using the ‘alternative’ 2013 operating times). These tables are the ‘alternative’ equivalents of Table 13 and Table 14. Table 17 and Table 18 show that calculated aircraft emissions of PM10 (PM2.5) for the whole LTO cycle were 0.5% (0.3%) higher in 2016 than in 2015 and ground-level aircraft emissions were 0.5% (0.2%) higher than in 2015.
For comparison using the specific year times, the whole LTO cycle emissions were 3.6% (3.9%) higher in 2016 than in 2015 and ground-level aircraft emissions were 4.9% (5.7%) higher than in 2015.
Table 17 Aircraft PM10 emissions using ‘alternative’ operating times: comparison of 2016 with 2013, 2014 and 2015 (all calculated using 2013 operating times)
Mode Annual PM10 emissions (tonnes) Change from (%)
2013 2014 2015 2016 2013a 2014
b 2015
c
Taxi-in 3.18 3.10 3.17 3.16 −0.9 1.8 −0.6
Taxi-out 4.90 4.64 4.71 4.70 −4.1 1.3 −0.3
Hold 4.62 4.32 4.42 4.35 −6.0 0.7 −1.7
APU 3.52 3.49 3.47 3.46 −1.6 −0.7 −0.3
Ground-level 35.51 34.92 35.32 35.51 0.0 1.7 0.5
Total aircraft LTO 50.97 49.42 49.64 49.88 −2.1 0.9 0.5 a Change % = 100 * (2016 value − 2013 value) / (2013 value)
b Change % = 100 * (2016 value − 2014 value) / (2014 value)
c Change % = 100 * (2016 value − 2015 value) / (2015 value)
Small 0.9% Small 1.0% Small 1.2% Small 0.9% Small 0.8% Small 0.4% Small 0.5% Small 0.5% Small 0.4%
A318/A3190.9%
A318/A3191.0%
A318/A3191.2%
A318/A3190.9%
A318/A3190.8%
A318/A3190.4%
A318/A3190.5%
A318/A3190.5%
A318/A3190.4%
A32013.6%
A32015.2%
A32017.7%
A32018.7%
A32019.1%
A32018.9%
A32020.5%
A32022.3%
A32021.8%
A3218.1%
A3217.6%
A3218.3%
A3218.7%
A3218.2%
A3218.3%
A3217.5%
A3217.9%
A3218.1%
B737 2.7% B737 2.9%B737 2.6%
B737 2.5%
B737 2.4% B737 2.1%B737 1.8%
B737 1.8% B737 1.8%
Other Med 4.8%Other Med 4.1%
Other Med 2.8%
Other Med 2.2%
Other Med 1.5% Other Med 1.0%Other Med 0.7%
Other Med 0.8% Other Med 0.6%
B74720.5%
B74718.7%
B74716.2%
B74717.0%
B74713.5%
B74717.0%
B74713.8%
B74711.8%
B7479.7%
B767 5.4%
B767 5.8%
B767 5.9%
B767 5.8%
B7676.2%
B7675.7%
B7676.5%
B7676.1% B767
5.8%
B77714.2%
B77715.0% B777
16.3%
B77715.4%
B77719.7%
B77717.8%
B77718.8%
B77718.5% B777
18.1%
B787 0.0%B787 0.3%
B787 1.1% B787 2.0%B787 3.6%
Other Heavy14.4%
Other Heavy13.9%
Other Heavy11.9%
Other Heavy11.2%
Other Heavy9.3%
Other Heavy8.1%
Other Heavy7.8%
Other Heavy6.8%
Other Heavy7.1%
A380 0.5%
A380 1.0%
A380 1.3%
A380 1.5%
A380 2.3%A380 3.5%
A380 4.3%A3806.2%
A3807.8%
0
2
4
6
8
10
12
14
16
18
2008/9 2009 2010 2011 2012 2013 2014 2015 2016
Gro
un
d-l
ev
el P
M e
mis
sio
ns
(to
nn
e) A380
Other Heavy
B787
B777
B767
B747
Other Medium
B737
A321
A320
A318/A319
Small
Ricardo Energy & Environment Heathrow Airport 2016 Emission Inventory | 23
Ricardo in Confidence Ref: Ricardo/ED10362/Issue Number 1
Table 18 Aircraft PM2.5 emissions using ‘alternative’ operating times: comparison of 2016 with 2013, 2014 and 2015 (all calculated using 2013 operating times)
Mode Annual PM2.5 emissions (tonnes) Change from (%)
2013 2014 2015 2016 2013a 2014
b 2015
c
Taxi-in 3.18 3.10 3.17 3.16 −0.9 1.8 −0.6
Taxi-out 4.90 4.64 4.71 4.70 −4.1 1.3 −0.3
Hold 4.62 4.32 4.42 4.35 −6.0 0.7 −1.7
APU 3.52 3.49 3.47 3.46 −1.6 −0.7 −0.3
Ground-level 28.11 27.35 27.64 27.69 −1.5 1.2 0.2
Total aircraft LTO 43.57 41.84 41.95 42.07 −3.4 0.5 0.3 a Change % = 100 * (2016 value − 2013 value) / (2013 value)
b Change % = 100 * (2016 value − 2014 value) / (2014 value)
c Change % = 100 * (2016 value − 2015 value) / (2015 value)
Table 19 and Table 20 compare the two methodologies, showing emissions calculated for 2016 using the ‘alternative’ 2013 operating times (refer to Table 17 and Table 18) and using the 2014, 2015 and 2016 operating times (refer to Table 13 and Table 14).
Table 19 Aircraft PM10 emissions – 2016: comparison of emissions calculated using 2016 operating times with those calculated using 2013, 2014 and 2015 operating times
Mode 2016 PM10 emissions (tonnes) Difference (%)
2013 times 2014 times 2015 times 2016 times 2013a 2014
b 2015
c
Taxi-in 3.16 3.19 3.12 3.17 0.4 −0.6 1.4
Taxi-out 4.70 4.68 4.85 4.87 3.6 3.9 0.4
Hold 4.35 4.45 4.45 4.75 9.3 6.7 6.9
APU 3.46 3.46 3.14 4.33 25.0 25.1 37.7
Ground-level 35.51 35.63 35.40 36.96 4.1 3.7 4.4
Total aircraft LTO 49.88 50.01 49.78 51.34 2.9 2.7 3.1 a Difference % = 100 * (2016 value − 2013 value) / (2013 value)
b Difference % = 100 * (2016 value − 2014 value) / (2014 value)
c Difference % = 100 * (2016 value − 2015 value) / (2015 value)
Table 20 Aircraft PM2.5 emissions – 2016: comparison of emissions calculated using 2016 operating times with those calculated using 2013, 2014 and 2015 operating times
Mode 2016 PM2.5 emissions (tonnes) Difference (%)
2013 times 2014 times 2015 times 2016 times 2013a 2014
b 2015
c
Taxi-in 3.16 3.19 3.12 3.17 0.4 −0.6 1.4
Taxi-out 4.70 4.68 4.85 4.87 3.6 3.9 0.4
Hold 4.35 4.45 4.45 4.75 9.3 6.7 6.9
APU 3.46 3.46 3.14 4.33 25.0 25.1 37.7
Ground-level 27.69 27.81 27.59 29.14 5.2 4.8 5.6
Total aircraft LTO 42.07 42.19 41.97 43.52 3.5 3.1 3.7 a Difference % = 100 * (2016 value − 2013 value) / (2013 value)
b Difference % = 100 * (2016 value − 2014 value) / (2014 value)
c Difference % = 100 * (2016 value − 2015 value) / (2015 value)
4.2.2 Reduced-engine taxi
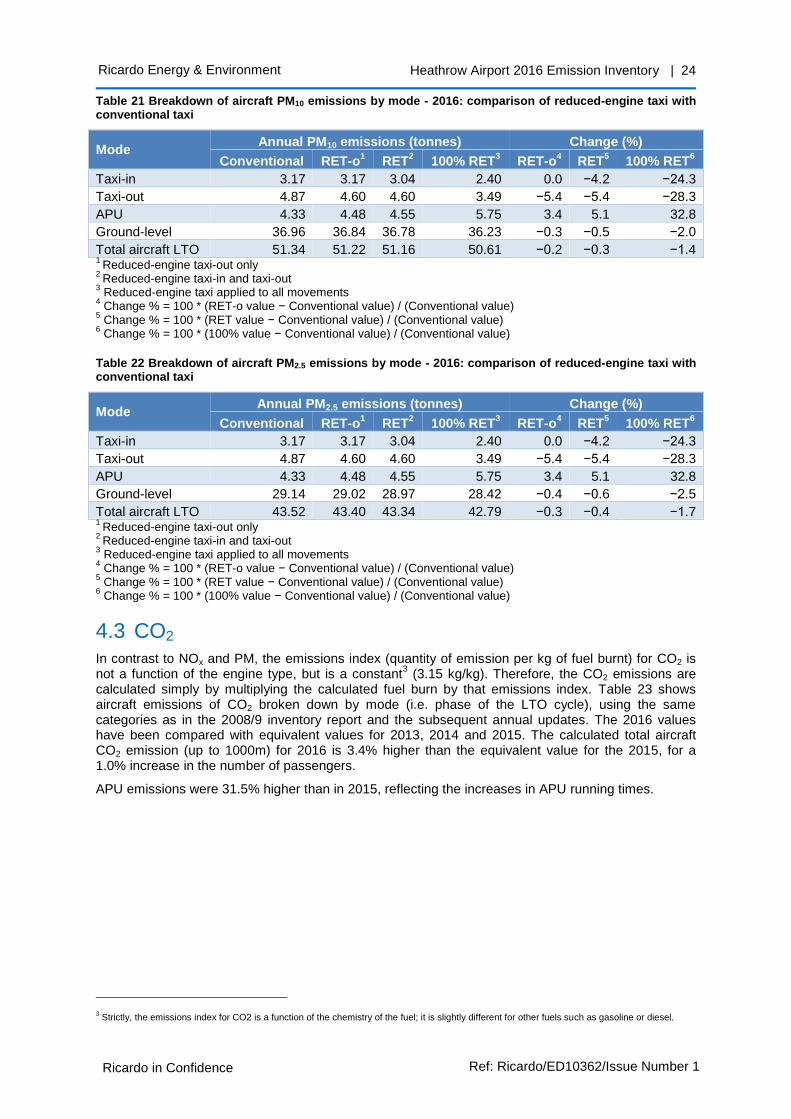
Table 21 and Table 22 present PM10 and PM2.5 emissions, respectively, taking account of reduced-engine taxi. They compare emissions that account for reduced-engine taxi on both departure and arrival and emissions that account for reduced-engine taxi-out only with emissions calculated assuming conventional taxi.
Ricardo Energy & Environment Heathrow Airport 2016 Emission Inventory | 24
Ricardo in Confidence Ref: Ricardo/ED10362/Issue Number 1
Table 21 Breakdown of aircraft PM10 emissions by mode - 2016: comparison of reduced-engine taxi with conventional taxi
Mode Annual PM10 emissions (tonnes) Change (%)
Conventional RET-o1 RET
2 100% RET
3 RET-o
4 RET
5 100% RET
6
Taxi-in 3.17 3.17 3.04 2.40 0.0 −4.2 −24.3
Taxi-out 4.87 4.60 4.60 3.49 −5.4 −5.4 −28.3
APU 4.33 4.48 4.55 5.75 3.4 5.1 32.8
Ground-level 36.96 36.84 36.78 36.23 −0.3 −0.5 −2.0
Total aircraft LTO 51.34 51.22 51.16 50.61 −0.2 −0.3 −1.4 1
Reduced-engine taxi-out only 2
Reduced-engine taxi-in and taxi-out 3 Reduced-engine taxi applied to all movements
4 Change % = 100 * (RET-o value − Conventional value) / (Conventional value)
5 Change % = 100 * (RET value − Conventional value) / (Conventional value)
6 Change % = 100 * (100% value − Conventional value) / (Conventional value)
Table 22 Breakdown of aircraft PM2.5 emissions by mode - 2016: comparison of reduced-engine taxi with conventional taxi
Mode Annual PM2.5 emissions (tonnes) Change (%)
Conventional RET-o1 RET
2 100% RET
3 RET-o
4 RET
5 100% RET
6
Taxi-in 3.17 3.17 3.04 2.40 0.0 −4.2 −24.3
Taxi-out 4.87 4.60 4.60 3.49 −5.4 −5.4 −28.3
APU 4.33 4.48 4.55 5.75 3.4 5.1 32.8
Ground-level 29.14 29.02 28.97 28.42 −0.4 −0.6 −2.5
Total aircraft LTO 43.52 43.40 43.34 42.79 −0.3 −0.4 −1.7 1
Reduced-engine taxi-out only 2
Reduced-engine taxi-in and taxi-out 3 Reduced-engine taxi applied to all movements
4 Change % = 100 * (RET-o value − Conventional value) / (Conventional value)
5 Change % = 100 * (RET value − Conventional value) / (Conventional value)
6 Change % = 100 * (100% value − Conventional value) / (Conventional value)
4.3 CO2
In contrast to NOx and PM, the emissions index (quantity of emission per kg of fuel burnt) for CO2 is not a function of the engine type, but is a constant
3 (3.15 kg/kg). Therefore, the CO2 emissions are
calculated simply by multiplying the calculated fuel burn by that emissions index. Table 23 shows aircraft emissions of CO2 broken down by mode (i.e. phase of the LTO cycle), using the same categories as in the 2008/9 inventory report and the subsequent annual updates. The 2016 values have been compared with equivalent values for 2013, 2014 and 2015. The calculated total aircraft CO2 emission (up to 1000m) for 2016 is 3.4% higher than the equivalent value for the 2015, for a 1.0% increase in the number of passengers.
APU emissions were 31.5% higher than in 2015, reflecting the increases in APU running times.
3 Strictly, the emissions index for CO2 is a function of the chemistry of the fuel; it is slightly different for other fuels such as gasoline or diesel.

Ricardo Energy & Environment Heathrow Airport 2016 Emission Inventory | 25
Ricardo in Confidence Ref: Ricardo/ED10362/Issue Number 1
Table 23 Breakdown of aircraft CO2 emissions by mode: comparison of 2016 with 2013, 2014 and 2015
Mode Annual CO2 emissions (kilotonnes) Change from (%)
2013 2014 2015 2016 2013a 2014
b 2015
c
Ground-level
Landing roll 19.77 20.07 20.25 20.78 5.1 3.6 2.6
Taxi-in 105.45 108.87 109.48 110.26 4.6 1.3 0.7
Taxi-out 161.15 165.34 171.25 169.39 5.1 2.5 −1.1
Hold 152.63 154.55 154.46 164.99 8.1 6.8 6.8
Take-off roll 92.26 92.09 91.89 92.43 0.2 0.4 0.6
APU 63.98 64.41 64.14 84.36 31.8 31.0 31.5
Engine testing1 1.21 1.21 1.21 1.21 0.0 0.0 0.0
Total ground-level 596.46 606.53 612.69 643.42 7.9 6.1 5.0
Elevated
Approach 184.96 184.59 184.47 185.19 0.1 0.3 0.4
Initial climb 89.27 88.63 88.72 89.35 0.1 0.8 0.7
Climb out 177.13 174.27 174.13 177.84 0.4 2.0 2.1
Total elevated 451.36 447.49 447.32 452.38 0.2 1.1 1.1
Total 1047.82 1054.02 1060.01 1095.80 4.6 4.0 3.4 1
Engine testing emissions were not recalculated for 2016. However, they represent a small fraction of the total. a
Change % = 100 * (2016 value − 2013 value) / (2013 value) b
Change % = 100 * (2016 value − 2014 value) / (2014 value) c Change % = 100 * (2016 value − 2015 value) / (2015 value)
Table 24 shows the values of annual aircraft LTO CO2 emissions normalised by the number of passengers and movements. The CO2 per passenger has risen by 2.4% since 2015 and the CO2 per movement is 3.2% higher than in 2015.
Table 24 LTO CO2 emissions per passenger and per movement: comparison of 2016 with 2013, 2014 and 2015
2013 2014 2015 2016 Change from (%)
2013a 2014
b 2015
c
LTO CO2 (kilotonnes per year) 1047.82 1054.02 1060.01 1095.80 4.6 4.0 3.4
Passengers1 (mppa) 72.33 73.37 74.95 75.67 4.6 3.1 1.0
LTO CO2 (kg per passenger1) 14.49 14.37 14.14 14.48 0.0 0.8 2.4
Movements2 (1000s) 471.94 472.80 474.09 474.96 0.6 0.5 0.2
LTO CO2 (tonnes per movement2) 2.22 2.23 2.24 2.31 3.9 3.5 3.2
1 Excludes transit passengers
2 ATMs and non-ATMs
a Change % = 100 * (2016 value − 2013 value) / (2013 value)
b Change % = 100 * (2016 value − 2014 value) / (2014 value)
c Change % = 100 * (2016 value − 2015 value) / (2015 value)
Table 25 gives a breakdown of LTO aircraft CO2 emissions (omitting APUs and engine testing) by aircraft type, comparing the distribution in 2016 with the equivalent distributions in 2015. As expected from the movement breakdowns in Table 1, the A320 aircraft family (A318/A319, A320 and A321) account for a significant fraction of the emissions in both years (30.7% in 2016 and 31.2% in 2015). However, the larger aircraft types, B747, B777 and A380, together contribute almost half of the emissions in each period (44.5% in 2016 and 45.7% in 2015), despite accounting for less than a quarter of the total movements.
Table 25 also gives LTO emissions per movement (excluding APU and engine testing emissions) for each aircraft type. Emissions of CO2 have global impacts on climate change, rather than the more local effects of pollutants such as NOx and PM. Therefore, the values are presented for the complete movement (up to 1,000 m altitude) rather than just the ground-level emissions as presented for the other pollutants. The table shows that the values of LTO emissions per movement for the large
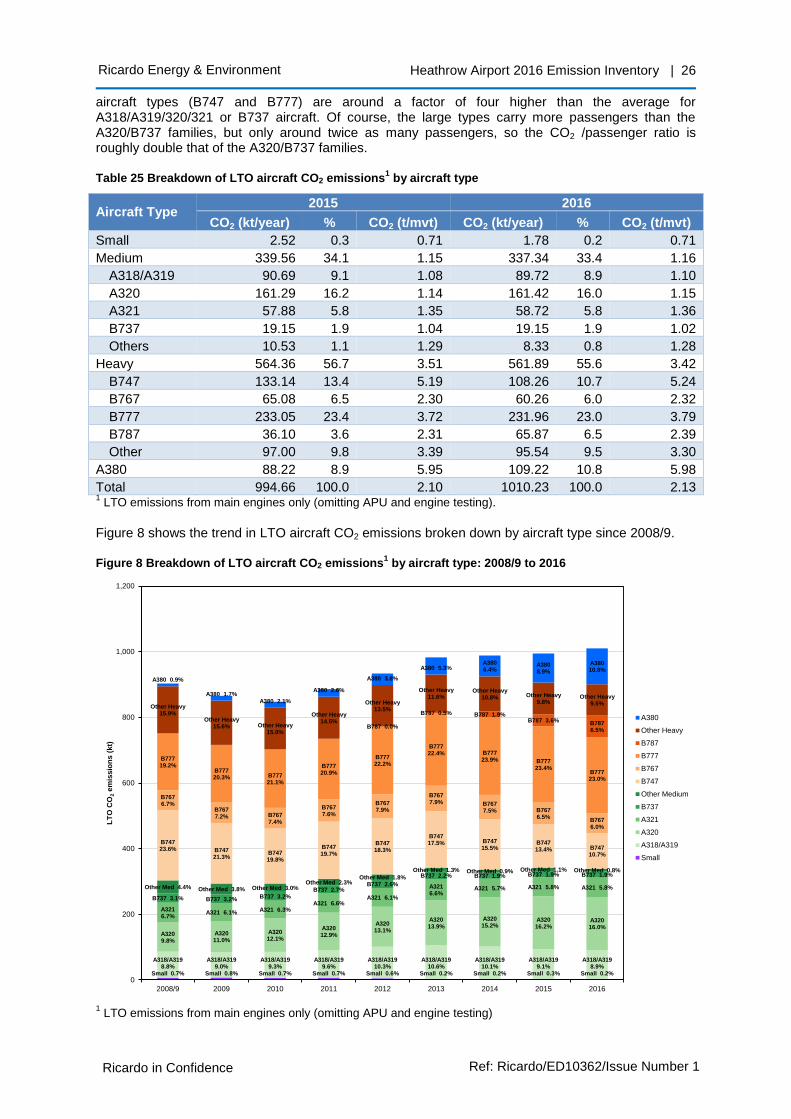
Ricardo Energy & Environment Heathrow Airport 2016 Emission Inventory | 26
Ricardo in Confidence Ref: Ricardo/ED10362/Issue Number 1
aircraft types (B747 and B777) are around a factor of four higher than the average for A318/A319/320/321 or B737 aircraft. Of course, the large types carry more passengers than the A320/B737 families, but only around twice as many passengers, so the CO2 /passenger ratio is roughly double that of the A320/B737 families.
Table 25 Breakdown of LTO aircraft CO2 emissions1 by aircraft type
Aircraft Type 2015 2016
CO2 (kt/year) % CO2 (t/mvt) CO2 (kt/year) % CO2 (t/mvt)
Small 2.52 0.3 0.71 1.78 0.2 0.71
Medium 339.56 34.1 1.15 337.34 33.4 1.16
A318/A319 90.69 9.1 1.08 89.72 8.9 1.10
A320 161.29 16.2 1.14 161.42 16.0 1.15
A321 57.88 5.8 1.35 58.72 5.8 1.36
B737 19.15 1.9 1.04 19.15 1.9 1.02
Others 10.53 1.1 1.29 8.33 0.8 1.28
Heavy 564.36 56.7 3.51 561.89 55.6 3.42
B747 133.14 13.4 5.19 108.26 10.7 5.24
B767 65.08 6.5 2.30 60.26 6.0 2.32
B777 233.05 23.4 3.72 231.96 23.0 3.79
B787 36.10 3.6 2.31 65.87 6.5 2.39
Other 97.00 9.8 3.39 95.54 9.5 3.30
A380 88.22 8.9 5.95 109.22 10.8 5.98
Total 994.66 100.0 2.10 1010.23 100.0 2.13 1 LTO emissions from main engines only (omitting APU and engine testing).
Figure 8 shows the trend in LTO aircraft CO2 emissions broken down by aircraft type since 2008/9.
Figure 8 Breakdown of LTO aircraft CO2 emissions1 by aircraft type: 2008/9 to 2016
1 LTO emissions from main engines only (omitting APU and engine testing)
A318/A3198.8%
Small 0.7%
A318/A3199.0%
Small 0.8%
A318/A3199.3%
Small 0.7%
A318/A3199.6%
Small 0.7%
A318/A31910.3%
Small 0.6%
A318/A31910.6%
Small 0.2%
A318/A31910.1%
Small 0.2%
A318/A3199.1%
Small 0.3%
A318/A3198.9%
Small 0.2%
A3209.8%
A32011.0%
A32012.1%
A32012.9%
A32013.1%
A32013.9%
A32015.2%
A32016.2%
A32016.0%
A3216.7%
A321 6.1% A321 6.3%A321 6.6%
A321 6.1%
A3216.6%
A321 5.7% A321 5.8% A321 5.8%
B737 3.1% B737 3.2% B737 3.2%B737 2.7%
B737 2.6%
B737 2.2% B737 1.9% B737 1.9% B737 1.9%
Other Med 4.4% Other Med 3.8% Other Med 3.0%Other Med 2.3%
Other Med 1.8%
Other Med 1.3% Other Med 0.9% Other Med 1.1% Other Med 0.8%
B74723.6% B747
21.3%B74719.8%
B74719.7%
B74718.3%
B74717.5% B747
15.5%B74713.4% B747
10.7%
B7676.7%
B7677.2% B767
7.4%
B7677.6%
B7677.9%
B7677.9% B767
7.5% B7676.5%
B7676.0%
B77719.2%
B77720.3% B777
21.1%
B77720.9%
B77722.2%
B77722.4% B777
23.9% B77723.4%
B77723.0%
B787 0.0%
B787 0.5% B787 1.9%B787 3.6% B787
6.5%
Other Heavy15.9%
Other Heavy15.6% Other Heavy
15.0%
Other Heavy14.5%
Other Heavy13.5%
Other Heavy11.6%
Other Heavy10.8% Other Heavy
9.8%Other Heavy
9.5%
A380 0.9%
A380 1.7%
A380 2.1%
A380 2.6%
A380 3.8%
A380 5.3%A3806.4%
A3808.9%
A38010.8%
0
200
400
600
800
1,000
1,200
2008/9 2009 2010 2011 2012 2013 2014 2015 2016
LT
O C
O2
em
issio
ns
(k
t)
A380
Other Heavy
B787
B777
B767
B747
Other Medium
B737
A321
A320
A318/A319
Small
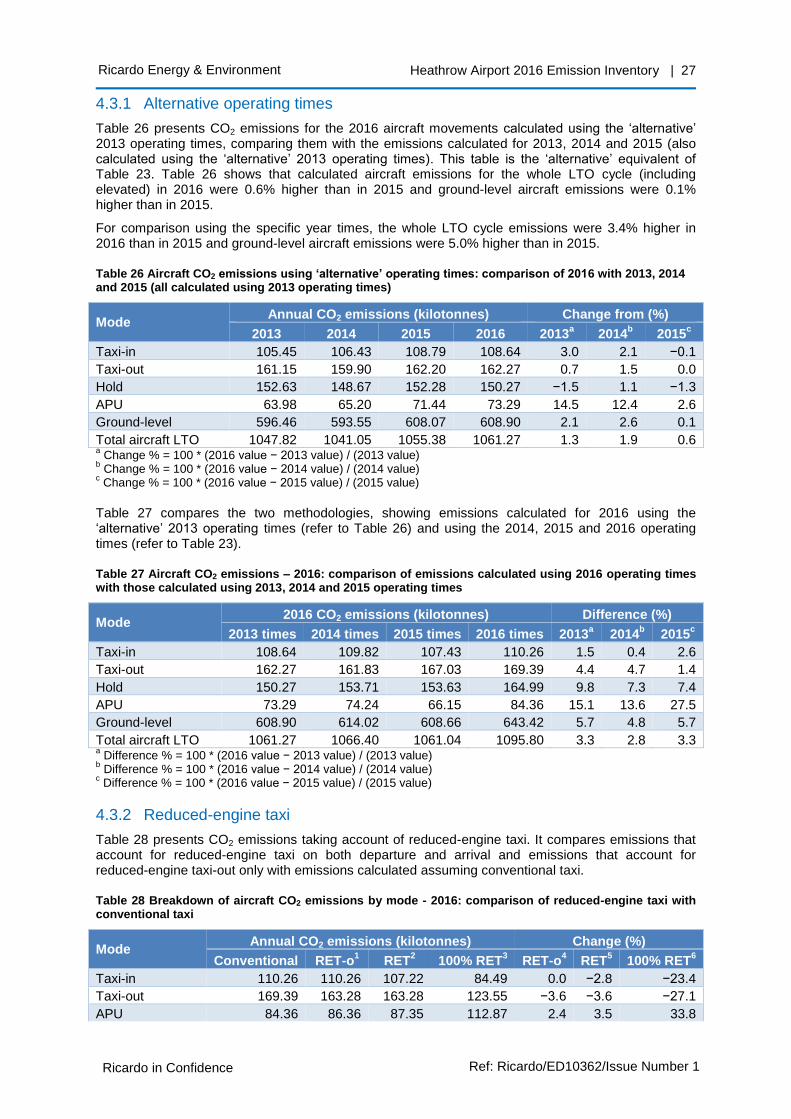
Ricardo Energy & Environment Heathrow Airport 2016 Emission Inventory | 27
Ricardo in Confidence Ref: Ricardo/ED10362/Issue Number 1
4.3.1 Alternative operating times
Table 26 presents CO2 emissions for the 2016 aircraft movements calculated using the ‘alternative’ 2013 operating times, comparing them with the emissions calculated for 2013, 2014 and 2015 (also calculated using the ‘alternative’ 2013 operating times). This table is the ‘alternative’ equivalent of Table 23. Table 26 shows that calculated aircraft emissions for the whole LTO cycle (including elevated) in 2016 were 0.6% higher than in 2015 and ground-level aircraft emissions were 0.1% higher than in 2015.
For comparison using the specific year times, the whole LTO cycle emissions were 3.4% higher in 2016 than in 2015 and ground-level aircraft emissions were 5.0% higher than in 2015.
Table 26 Aircraft CO2 emissions using ‘alternative’ operating times: comparison of 2016 with 2013, 2014 and 2015 (all calculated using 2013 operating times)
Mode Annual CO2 emissions (kilotonnes) Change from (%)
2013 2014 2015 2016 2013a 2014
b 2015
c
Taxi-in 105.45 106.43 108.79 108.64 3.0 2.1 −0.1
Taxi-out 161.15 159.90 162.20 162.27 0.7 1.5 0.0
Hold 152.63 148.67 152.28 150.27 −1.5 1.1 −1.3
APU 63.98 65.20 71.44 73.29 14.5 12.4 2.6
Ground-level 596.46 593.55 608.07 608.90 2.1 2.6 0.1
Total aircraft LTO 1047.82 1041.05 1055.38 1061.27 1.3 1.9 0.6 a Change % = 100 * (2016 value − 2013 value) / (2013 value)
b Change % = 100 * (2016 value − 2014 value) / (2014 value)
c Change % = 100 * (2016 value − 2015 value) / (2015 value)
Table 27 compares the two methodologies, showing emissions calculated for 2016 using the ‘alternative’ 2013 operating times (refer to Table 26) and using the 2014, 2015 and 2016 operating times (refer to Table 23).
Table 27 Aircraft CO2 emissions – 2016: comparison of emissions calculated using 2016 operating times with those calculated using 2013, 2014 and 2015 operating times
Mode 2016 CO2 emissions (kilotonnes) Difference (%)
2013 times 2014 times 2015 times 2016 times 2013a 2014
b 2015
c
Taxi-in 108.64 109.82 107.43 110.26 1.5 0.4 2.6
Taxi-out 162.27 161.83 167.03 169.39 4.4 4.7 1.4
Hold 150.27 153.71 153.63 164.99 9.8 7.3 7.4
APU 73.29 74.24 66.15 84.36 15.1 13.6 27.5
Ground-level 608.90 614.02 608.66 643.42 5.7 4.8 5.7
Total aircraft LTO 1061.27 1066.40 1061.04 1095.80 3.3 2.8 3.3 a Difference % = 100 * (2016 value − 2013 value) / (2013 value)
b Difference % = 100 * (2016 value − 2014 value) / (2014 value)
c Difference % = 100 * (2016 value − 2015 value) / (2015 value)
4.3.2 Reduced-engine taxi
Table 28 presents CO2 emissions taking account of reduced-engine taxi. It compares emissions that account for reduced-engine taxi on both departure and arrival and emissions that account for reduced-engine taxi-out only with emissions calculated assuming conventional taxi.
Table 28 Breakdown of aircraft CO2 emissions by mode - 2016: comparison of reduced-engine taxi with conventional taxi
Mode Annual CO2 emissions (kilotonnes) Change (%)
Conventional RET-o1 RET
2 100% RET
3 RET-o
4 RET
5 100% RET
6
Taxi-in 110.26 110.26 107.22 84.49 0.0 −2.8 −23.4
Taxi-out 169.39 163.28 163.28 123.55 −3.6 −3.6 −27.1
APU 84.36 86.36 87.35 112.87 2.4 3.5 33.8
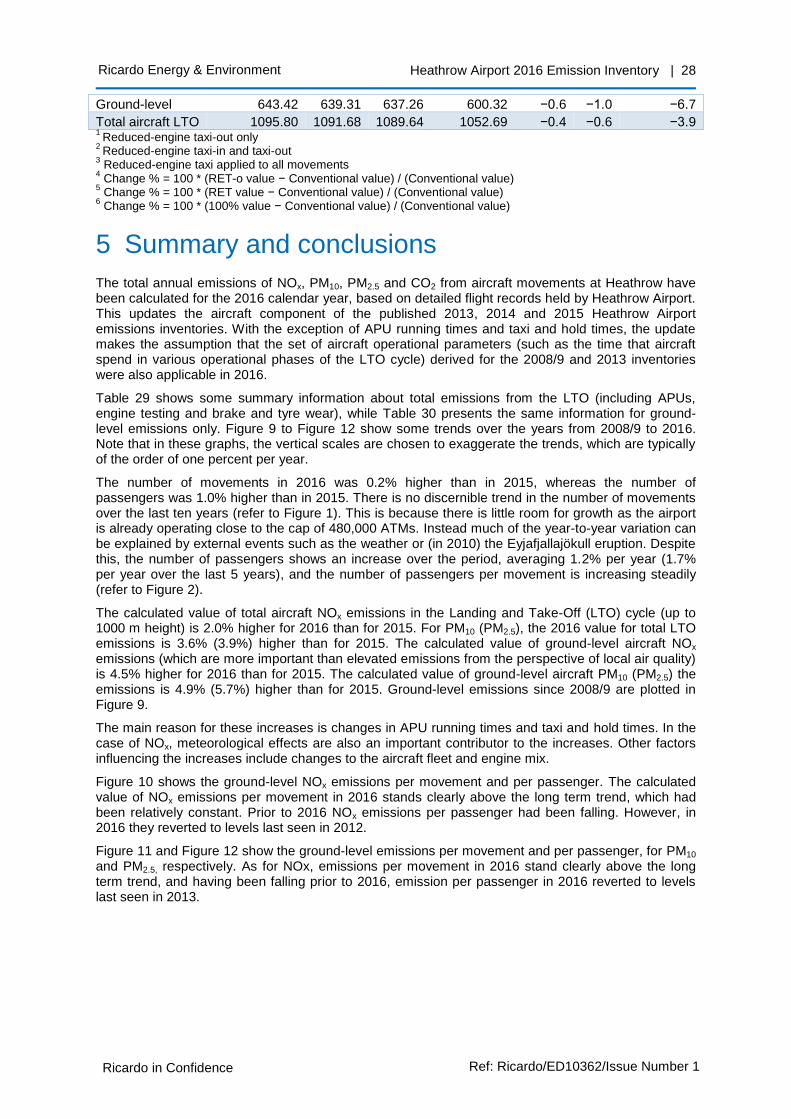
Ricardo Energy & Environment Heathrow Airport 2016 Emission Inventory | 28
Ricardo in Confidence Ref: Ricardo/ED10362/Issue Number 1
Ground-level 643.42 639.31 637.26 600.32 −0.6 −1.0 −6.7
Total aircraft LTO 1095.80 1091.68 1089.64 1052.69 −0.4 −0.6 −3.9 1
Reduced-engine taxi-out only 2
Reduced-engine taxi-in and taxi-out 3 Reduced-engine taxi applied to all movements
4 Change % = 100 * (RET-o value − Conventional value) / (Conventional value)
5 Change % = 100 * (RET value − Conventional value) / (Conventional value)
6 Change % = 100 * (100% value − Conventional value) / (Conventional value)
5 Summary and conclusions
The total annual emissions of NOx, PM10, PM2.5 and CO2 from aircraft movements at Heathrow have been calculated for the 2016 calendar year, based on detailed flight records held by Heathrow Airport. This updates the aircraft component of the published 2013, 2014 and 2015 Heathrow Airport emissions inventories. With the exception of APU running times and taxi and hold times, the update makes the assumption that the set of aircraft operational parameters (such as the time that aircraft spend in various operational phases of the LTO cycle) derived for the 2008/9 and 2013 inventories were also applicable in 2016.
Table 29 shows some summary information about total emissions from the LTO (including APUs, engine testing and brake and tyre wear), while Table 30 presents the same information for ground-level emissions only. Figure 9 to Figure 12 show some trends over the years from 2008/9 to 2016. Note that in these graphs, the vertical scales are chosen to exaggerate the trends, which are typically of the order of one percent per year.
The number of movements in 2016 was 0.2% higher than in 2015, whereas the number of passengers was 1.0% higher than in 2015. There is no discernible trend in the number of movements over the last ten years (refer to Figure 1). This is because there is little room for growth as the airport is already operating close to the cap of 480,000 ATMs. Instead much of the year-to-year variation can be explained by external events such as the weather or (in 2010) the Eyjafjallajökull eruption. Despite this, the number of passengers shows an increase over the period, averaging 1.2% per year (1.7% per year over the last 5 years), and the number of passengers per movement is increasing steadily (refer to Figure 2).
The calculated value of total aircraft NOx emissions in the Landing and Take-Off (LTO) cycle (up to 1000 m height) is 2.0% higher for 2016 than for 2015. For PM10 (PM2.5), the 2016 value for total LTO emissions is 3.6% (3.9%) higher than for 2015. The calculated value of ground-level aircraft NOx emissions (which are more important than elevated emissions from the perspective of local air quality) is 4.5% higher for 2016 than for 2015. The calculated value of ground-level aircraft PM10 (PM2.5) the emissions is 4.9% (5.7%) higher than for 2015. Ground-level emissions since 2008/9 are plotted in Figure 9.
The main reason for these increases is changes in APU running times and taxi and hold times. In the case of NOx, meteorological effects are also an important contributor to the increases. Other factors influencing the increases include changes to the aircraft fleet and engine mix.
Figure 10 shows the ground-level NOx emissions per movement and per passenger. The calculated value of NOx emissions per movement in 2016 stands clearly above the long term trend, which had been relatively constant. Prior to 2016 NOx emissions per passenger had been falling. However, in 2016 they reverted to levels last seen in 2012.
Figure 11 and Figure 12 show the ground-level emissions per movement and per passenger, for PM10 and PM2.5, respectively. As for NOx, emissions per movement in 2016 stand clearly above the long term trend, and having been falling prior to 2016, emission per passenger in 2016 reverted to levels last seen in 2013.
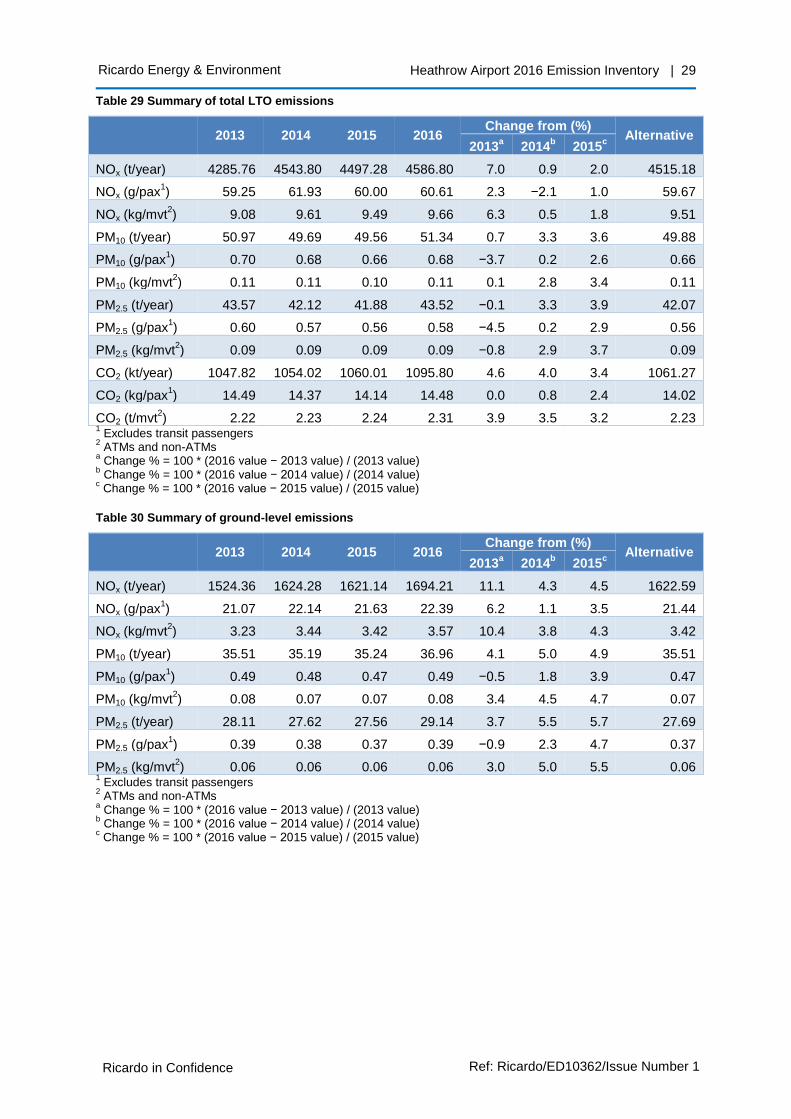
Ricardo Energy & Environment Heathrow Airport 2016 Emission Inventory | 29
Ricardo in Confidence Ref: Ricardo/ED10362/Issue Number 1
Table 29 Summary of total LTO emissions
2013 2014 2015 2016 Change from (%)
Alternative 2013
a 2014
b 2015
c
NOx (t/year) 4285.76 4543.80 4497.28 4586.80 7.0 0.9 2.0 4515.18
NOx (g/pax1) 59.25 61.93 60.00 60.61 2.3 −2.1 1.0 59.67
NOx (kg/mvt2) 9.08 9.61 9.49 9.66 6.3 0.5 1.8 9.51
PM10 (t/year) 50.97 49.69 49.56 51.34 0.7 3.3 3.6 49.88
PM10 (g/pax1) 0.70 0.68 0.66 0.68 −3.7 0.2 2.6 0.66
PM10 (kg/mvt2) 0.11 0.11 0.10 0.11 0.1 2.8 3.4 0.11
PM2.5 (t/year) 43.57 42.12 41.88 43.52 −0.1 3.3 3.9 42.07
PM2.5 (g/pax1) 0.60 0.57 0.56 0.58 −4.5 0.2 2.9 0.56
PM2.5 (kg/mvt2) 0.09 0.09 0.09 0.09 −0.8 2.9 3.7 0.09
CO2 (kt/year) 1047.82 1054.02 1060.01 1095.80 4.6 4.0 3.4 1061.27
CO2 (kg/pax1) 14.49 14.37 14.14 14.48 0.0 0.8 2.4 14.02
CO2 (t/mvt2) 2.22 2.23 2.24 2.31 3.9 3.5 3.2 2.23
1 Excludes transit passengers
2 ATMs and non-ATMs
a Change % = 100 * (2016 value − 2013 value) / (2013 value)
b Change % = 100 * (2016 value − 2014 value) / (2014 value)
c Change % = 100 * (2016 value − 2015 value) / (2015 value)
Table 30 Summary of ground-level emissions
2013 2014 2015 2016 Change from (%)
Alternative 2013
a 2014
b 2015
c
NOx (t/year) 1524.36 1624.28 1621.14 1694.21 11.1 4.3 4.5 1622.59
NOx (g/pax1) 21.07 22.14 21.63 22.39 6.2 1.1 3.5 21.44
NOx (kg/mvt2) 3.23 3.44 3.42 3.57 10.4 3.8 4.3 3.42
PM10 (t/year) 35.51 35.19 35.24 36.96 4.1 5.0 4.9 35.51
PM10 (g/pax1) 0.49 0.48 0.47 0.49 −0.5 1.8 3.9 0.47
PM10 (kg/mvt2) 0.08 0.07 0.07 0.08 3.4 4.5 4.7 0.07
PM2.5 (t/year) 28.11 27.62 27.56 29.14 3.7 5.5 5.7 27.69
PM2.5 (g/pax1) 0.39 0.38 0.37 0.39 −0.9 2.3 4.7 0.37
PM2.5 (kg/mvt2) 0.06 0.06 0.06 0.06 3.0 5.0 5.5 0.06
1 Excludes transit passengers
2 ATMs and non-ATMs
a Change % = 100 * (2016 value − 2013 value) / (2013 value)
b Change % = 100 * (2016 value − 2014 value) / (2014 value)
c Change % = 100 * (2016 value − 2015 value) / (2015 value)
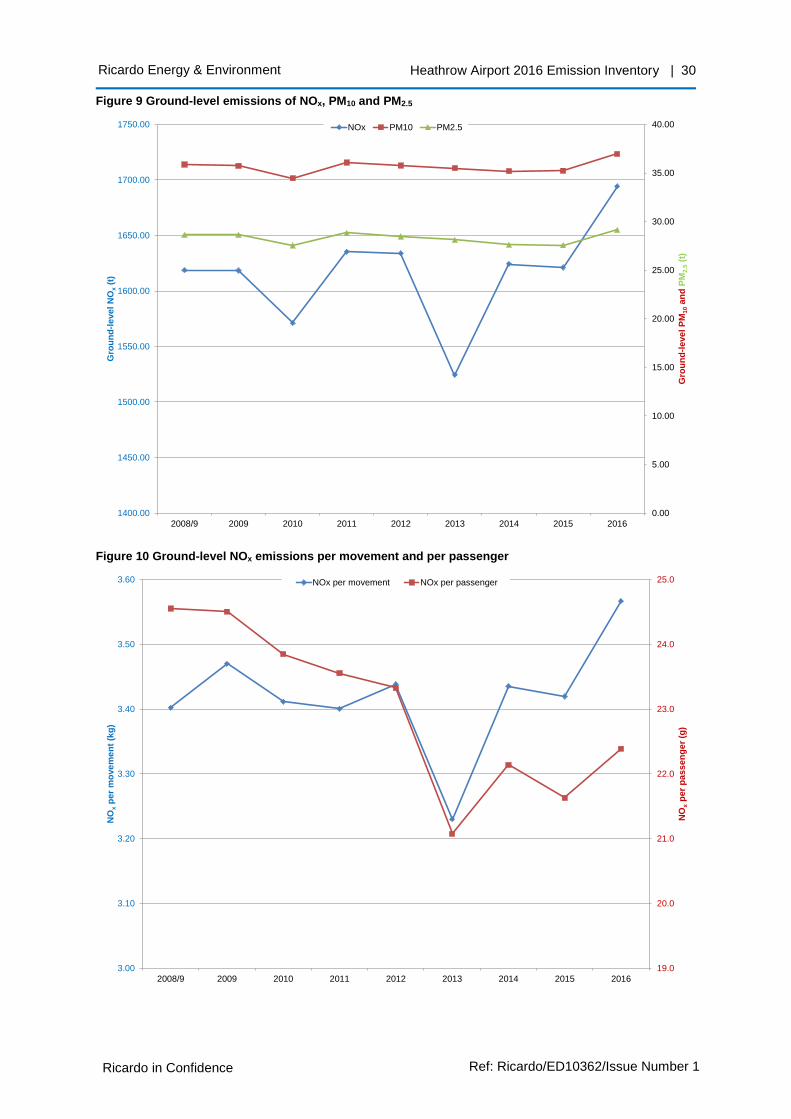
Ricardo Energy & Environment Heathrow Airport 2016 Emission Inventory | 30
Ricardo in Confidence Ref: Ricardo/ED10362/Issue Number 1
Figure 9 Ground-level emissions of NOx, PM10 and PM2.5
Figure 10 Ground-level NOx emissions per movement and per passenger
0.00
5.00
10.00
15.00
20.00
25.00
30.00
35.00
40.00
1400.00
1450.00
1500.00
1550.00
1600.00
1650.00
1700.00
1750.00
2008/9 2009 2010 2011 2012 2013 2014 2015 2016
Gro
un
d-l
eve
l P
M10
an
d P
M2.5
(t)
Gro
un
d-l
eve
l N
Ox
(t)
NOx PM10 PM2.5
19.0
20.0
21.0
22.0
23.0
24.0
25.0
3.00
3.10
3.20
3.30
3.40
3.50
3.60
2008/9 2009 2010 2011 2012 2013 2014 2015 2016
NO
xp
er
pas
se
ng
er
(g)
NO
xp
er
mo
ve
me
nt
(kg
)
NOx per movement NOx per passenger
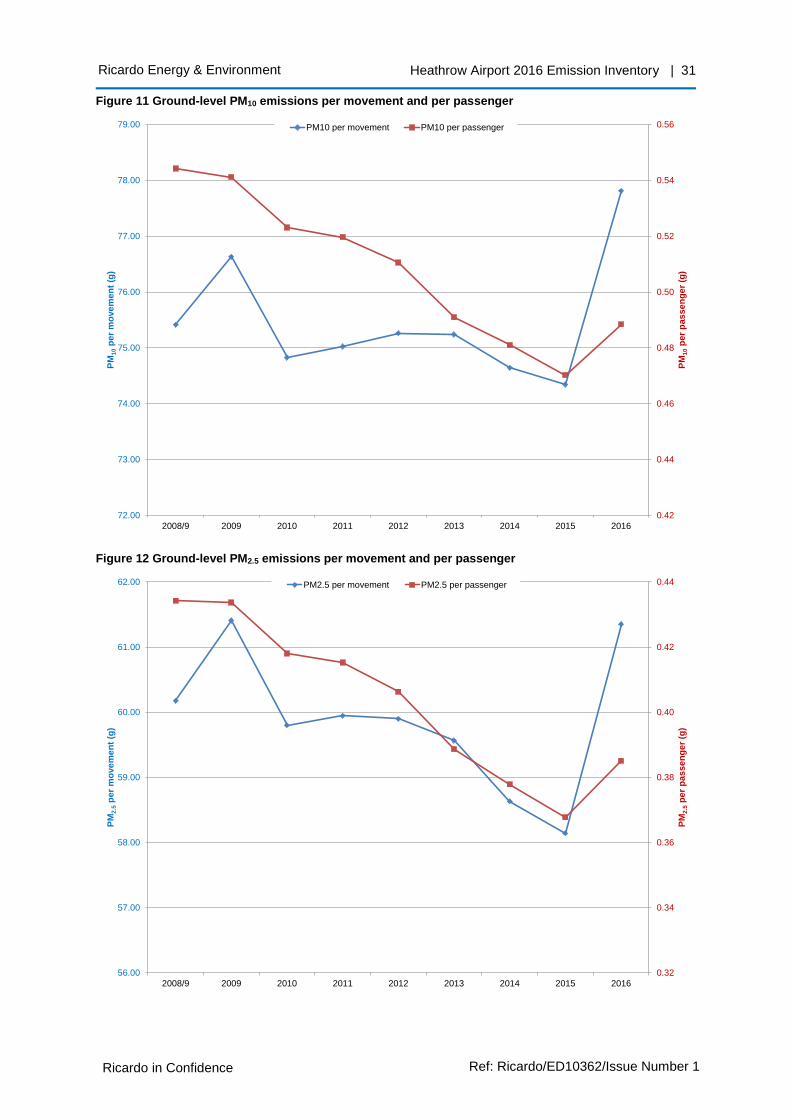
Ricardo Energy & Environment Heathrow Airport 2016 Emission Inventory | 31
Ricardo in Confidence Ref: Ricardo/ED10362/Issue Number 1
Figure 11 Ground-level PM10 emissions per movement and per passenger
Figure 12 Ground-level PM2.5 emissions per movement and per passenger
0.42
0.44
0.46
0.48
0.50
0.52
0.54
0.56
72.00
73.00
74.00
75.00
76.00
77.00
78.00
79.00
2008/9 2009 2010 2011 2012 2013 2014 2015 2016
PM
10
per
pas
se
ng
er
(g)
PM
10
per
mo
ve
me
nt
(g)
PM10 per movement PM10 per passenger
0.32
0.34
0.36
0.38
0.40
0.42
0.44
56.00
57.00
58.00
59.00
60.00
61.00
62.00
2008/9 2009 2010 2011 2012 2013 2014 2015 2016
PM
2.5
per
pa
ss
en
ger
(g)
PM
2.5
per
mo
ve
me
nt
(g)
PM2.5 per movement PM2.5 per passenger
Ricardo Energy & Environment Heathrow Airport 2016 Emission Inventory | 32
Ricardo in Confidence Ref: Ricardo/ED10362/Issue Number 1
5.1 Reduced-engine taxi
Reduced-engine taxing at currently recorded use levels (~18% on taxi-out) offer only modest savings over conventional taxiing. Savings from reduced-engine taxiing in 2016 were almost completely offset by increased emissions from APUs. The net effect is that with reduced-engine taxi ground-level NOx, PM10 and PM2.5 are 0.1%, 0.2% and 0.3% lower than with conventional taxi, respectively.
We recommend that Heathrow should continue to record the use of reduced-engine taxiing for both departures and implement a new system to record use on arrivals. They should also consider recording the duration of reduced-engine taxiing and off-stand APU use.
Emissions from APUs and aircraft main engines (during taxiing) have different dispersion characteristics, so any air quality modelling should take account of reduced-engine taxiing.
Ricardo Energy & Environment Heathrow Airport 2016 Emission Inventory | 33
Ricardo in Confidence Ref: Ricardo/ED10362/Issue Number 1
6 References
i Underwood B Y, Walker C T and Peirce M J (2010) Heathrow Airport emission inventory 2008/9. AEAT/ENV/R/2906. ii Underwood B Y, Walker C T and Peirce M J (2010) Air quality modelling for Heathrow Airport
2008/9: methodology. AEAT/ENV/R/2915. iii Underwood B Y, Walker C T and Peirce M J (2010) Heathrow Airport air quality modelling for
2008/9: results and model evaluation. AEAT/ENV/R/2948. iv
Peace H, Walker C T and Peirce M J (2015) Heathrow Airport 2013 Air Quality Assessment. Ricardo-AEA/R/3438. v Walker C T, Peirce M J and Peace H (2015) Heathrow Airport 2013 Air Quality Assessment: Model
Evaluation. Ricardo-AEA/R/3439. vi
Walker C T (2015) Heathrow Airport 2014 Emission Inventory. Ricardo-AEA/ED60533. vii
Walker C T (2016) Heathrow Airport 2015 Emission Inventory, Ricardo-AEA/ED62191. viii
Underwood B Y (2010) Heathrow 2008/9 air quality. ED45973/N/002. ix Brooke A S, Caves R E and Jenkinson L R (1995) Methodology for assessing fuel use and
emissions from aircraft ground operations. TT 95 R 05. Department of Aeronautical and Automotive Engineering and Transport Studies, the University of Technology, Loughborough x QinetiQ (2006) Personal communication
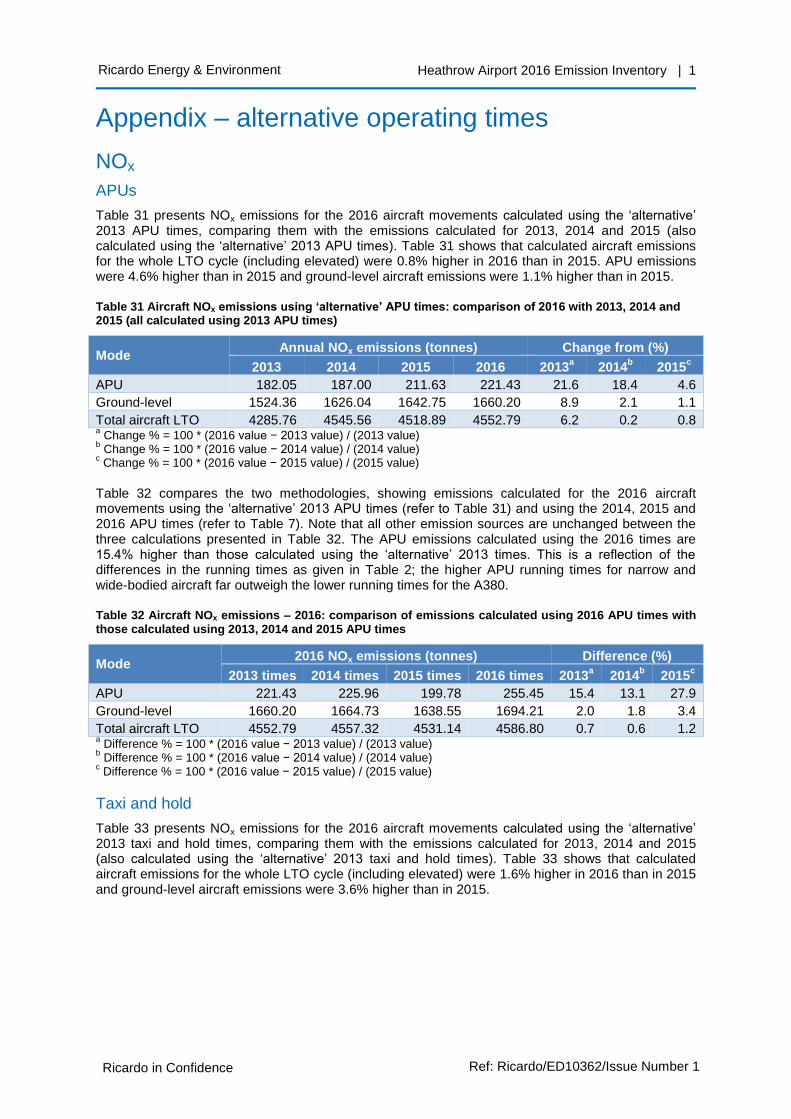
Ricardo Energy & Environment Heathrow Airport 2016 Emission Inventory | 1
Ricardo in Confidence Ref: Ricardo/ED10362/Issue Number 1
Appendix – alternative operating times
NOx
APUs
Table 31 presents NOx emissions for the 2016 aircraft movements calculated using the ‘alternative’ 2013 APU times, comparing them with the emissions calculated for 2013, 2014 and 2015 (also calculated using the ‘alternative’ 2013 APU times). Table 31 shows that calculated aircraft emissions for the whole LTO cycle (including elevated) were 0.8% higher in 2016 than in 2015. APU emissions were 4.6% higher than in 2015 and ground-level aircraft emissions were 1.1% higher than in 2015.
Table 31 Aircraft NOx emissions using ‘alternative’ APU times: comparison of 2016 with 2013, 2014 and 2015 (all calculated using 2013 APU times)
Mode Annual NOx emissions (tonnes) Change from (%)
2013 2014 2015 2016 2013a 2014
b 2015
c
APU 182.05 187.00 211.63 221.43 21.6 18.4 4.6
Ground-level 1524.36 1626.04 1642.75 1660.20 8.9 2.1 1.1
Total aircraft LTO 4285.76 4545.56 4518.89 4552.79 6.2 0.2 0.8 a Change % = 100 * (2016 value − 2013 value) / (2013 value)
b Change % = 100 * (2016 value − 2014 value) / (2014 value)
c Change % = 100 * (2016 value − 2015 value) / (2015 value)
Table 32 compares the two methodologies, showing emissions calculated for the 2016 aircraft movements using the ‘alternative’ 2013 APU times (refer to Table 31) and using the 2014, 2015 and 2016 APU times (refer to Table 7). Note that all other emission sources are unchanged between the three calculations presented in Table 32. The APU emissions calculated using the 2016 times are 15.4% higher than those calculated using the ‘alternative’ 2013 times. This is a reflection of the differences in the running times as given in Table 2; the higher APU running times for narrow and wide-bodied aircraft far outweigh the lower running times for the A380.
Table 32 Aircraft NOx emissions – 2016: comparison of emissions calculated using 2016 APU times with those calculated using 2013, 2014 and 2015 APU times
Mode 2016 NOx emissions (tonnes) Difference (%)
2013 times 2014 times 2015 times 2016 times 2013a 2014
b 2015
c
APU 221.43 225.96 199.78 255.45 15.4 13.1 27.9
Ground-level 1660.20 1664.73 1638.55 1694.21 2.0 1.8 3.4
Total aircraft LTO 4552.79 4557.32 4531.14 4586.80 0.7 0.6 1.2 a Difference % = 100 * (2016 value − 2013 value) / (2013 value)
b Difference % = 100 * (2016 value − 2014 value) / (2014 value)
c Difference % = 100 * (2016 value − 2015 value) / (2015 value)
Taxi and hold
Table 33 presents NOx emissions for the 2016 aircraft movements calculated using the ‘alternative’ 2013 taxi and hold times, comparing them with the emissions calculated for 2013, 2014 and 2015 (also calculated using the ‘alternative’ 2013 taxi and hold times). Table 33 shows that calculated aircraft emissions for the whole LTO cycle (including elevated) were 1.6% higher in 2016 than in 2015 and ground-level aircraft emissions were 3.6% higher than in 2015.
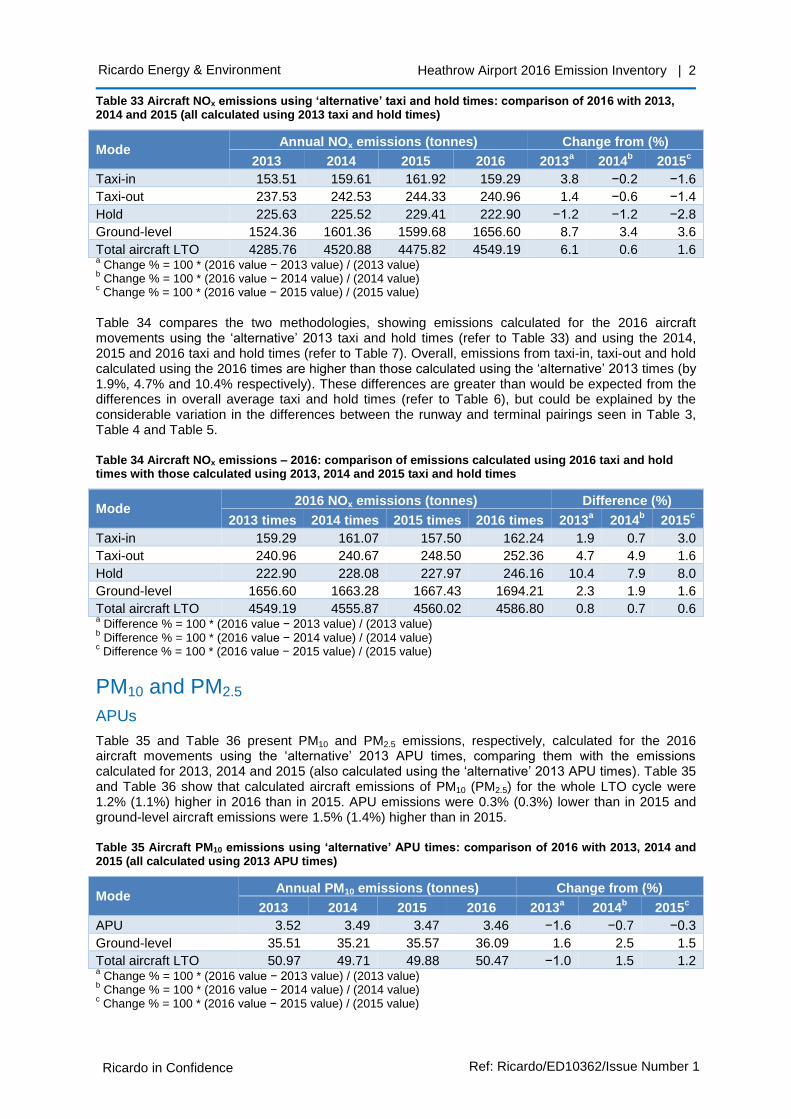
Ricardo Energy & Environment Heathrow Airport 2016 Emission Inventory | 2
Ricardo in Confidence Ref: Ricardo/ED10362/Issue Number 1
Table 33 Aircraft NOx emissions using ‘alternative’ taxi and hold times: comparison of 2016 with 2013, 2014 and 2015 (all calculated using 2013 taxi and hold times)
Mode Annual NOx emissions (tonnes) Change from (%)
2013 2014 2015 2016 2013a 2014
b 2015
c
Taxi-in 153.51 159.61 161.92 159.29 3.8 −0.2 −1.6
Taxi-out 237.53 242.53 244.33 240.96 1.4 −0.6 −1.4
Hold 225.63 225.52 229.41 222.90 −1.2 −1.2 −2.8
Ground-level 1524.36 1601.36 1599.68 1656.60 8.7 3.4 3.6
Total aircraft LTO 4285.76 4520.88 4475.82 4549.19 6.1 0.6 1.6 a Change % = 100 * (2016 value − 2013 value) / (2013 value)
b Change % = 100 * (2016 value − 2014 value) / (2014 value)
c Change % = 100 * (2016 value − 2015 value) / (2015 value)
Table 34 compares the two methodologies, showing emissions calculated for the 2016 aircraft movements using the ‘alternative’ 2013 taxi and hold times (refer to Table 33) and using the 2014, 2015 and 2016 taxi and hold times (refer to Table 7). Overall, emissions from taxi-in, taxi-out and hold calculated using the 2016 times are higher than those calculated using the ‘alternative’ 2013 times (by 1.9%, 4.7% and 10.4% respectively). These differences are greater than would be expected from the differences in overall average taxi and hold times (refer to Table 6), but could be explained by the considerable variation in the differences between the runway and terminal pairings seen in Table 3, Table 4 and Table 5.
Table 34 Aircraft NOx emissions – 2016: comparison of emissions calculated using 2016 taxi and hold times with those calculated using 2013, 2014 and 2015 taxi and hold times
Mode 2016 NOx emissions (tonnes) Difference (%)
2013 times 2014 times 2015 times 2016 times 2013a 2014
b 2015
c
Taxi-in 159.29 161.07 157.50 162.24 1.9 0.7 3.0
Taxi-out 240.96 240.67 248.50 252.36 4.7 4.9 1.6
Hold 222.90 228.08 227.97 246.16 10.4 7.9 8.0
Ground-level 1656.60 1663.28 1667.43 1694.21 2.3 1.9 1.6
Total aircraft LTO 4549.19 4555.87 4560.02 4586.80 0.8 0.7 0.6 a Difference % = 100 * (2016 value − 2013 value) / (2013 value)
b Difference % = 100 * (2016 value − 2014 value) / (2014 value)
c Difference % = 100 * (2016 value − 2015 value) / (2015 value)
PM10 and PM2.5
APUs
Table 35 and Table 36 present PM10 and PM2.5 emissions, respectively, calculated for the 2016 aircraft movements using the ‘alternative’ 2013 APU times, comparing them with the emissions calculated for 2013, 2014 and 2015 (also calculated using the ‘alternative’ 2013 APU times). Table 35 and Table 36 show that calculated aircraft emissions of PM10 (PM2.5) for the whole LTO cycle were 1.2% (1.1%) higher in 2016 than in 2015. APU emissions were 0.3% (0.3%) lower than in 2015 and ground-level aircraft emissions were 1.5% (1.4%) higher than in 2015.
Table 35 Aircraft PM10 emissions using ‘alternative’ APU times: comparison of 2016 with 2013, 2014 and 2015 (all calculated using 2013 APU times)
Mode Annual PM10 emissions (tonnes) Change from (%)
2013 2014 2015 2016 2013a 2014
b 2015
c
APU 3.52 3.49 3.47 3.46 −1.6 −0.7 −0.3
Ground-level 35.51 35.21 35.57 36.09 1.6 2.5 1.5
Total aircraft LTO 50.97 49.71 49.88 50.47 −1.0 1.5 1.2 a Change % = 100 * (2016 value − 2013 value) / (2013 value)
b Change % = 100 * (2016 value − 2014 value) / (2014 value)
c Change % = 100 * (2016 value − 2015 value) / (2015 value)
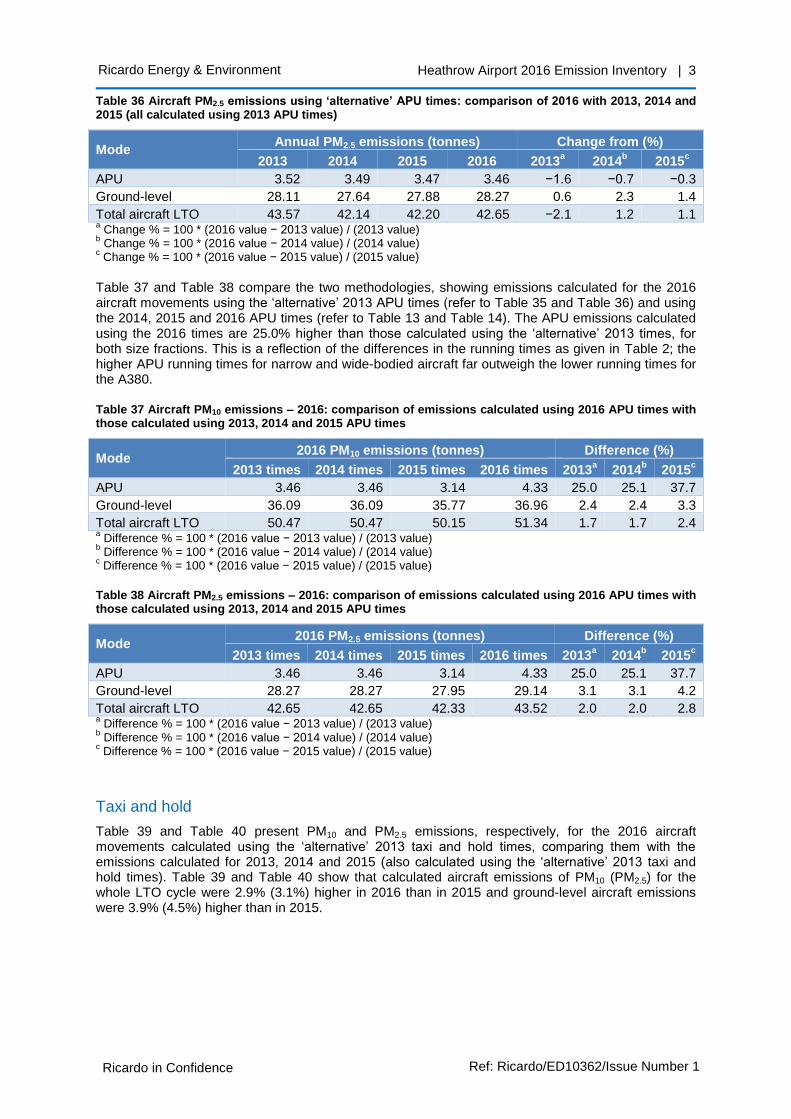
Ricardo Energy & Environment Heathrow Airport 2016 Emission Inventory | 3
Ricardo in Confidence Ref: Ricardo/ED10362/Issue Number 1
Table 36 Aircraft PM2.5 emissions using ‘alternative’ APU times: comparison of 2016 with 2013, 2014 and 2015 (all calculated using 2013 APU times)
Mode Annual PM2.5 emissions (tonnes) Change from (%)
2013 2014 2015 2016 2013a 2014
b 2015
c
APU 3.52 3.49 3.47 3.46 −1.6 −0.7 −0.3
Ground-level 28.11 27.64 27.88 28.27 0.6 2.3 1.4
Total aircraft LTO 43.57 42.14 42.20 42.65 −2.1 1.2 1.1 a Change % = 100 * (2016 value − 2013 value) / (2013 value)
b Change % = 100 * (2016 value − 2014 value) / (2014 value)
c Change % = 100 * (2016 value − 2015 value) / (2015 value)
Table 37 and Table 38 compare the two methodologies, showing emissions calculated for the 2016 aircraft movements using the ‘alternative’ 2013 APU times (refer to Table 35 and Table 36) and using the 2014, 2015 and 2016 APU times (refer to Table 13 and Table 14). The APU emissions calculated using the 2016 times are 25.0% higher than those calculated using the ‘alternative’ 2013 times, for both size fractions. This is a reflection of the differences in the running times as given in Table 2; the higher APU running times for narrow and wide-bodied aircraft far outweigh the lower running times for the A380.
Table 37 Aircraft PM10 emissions – 2016: comparison of emissions calculated using 2016 APU times with those calculated using 2013, 2014 and 2015 APU times
Mode 2016 PM10 emissions (tonnes) Difference (%)
2013 times 2014 times 2015 times 2016 times 2013a 2014
b 2015
c
APU 3.46 3.46 3.14 4.33 25.0 25.1 37.7
Ground-level 36.09 36.09 35.77 36.96 2.4 2.4 3.3
Total aircraft LTO 50.47 50.47 50.15 51.34 1.7 1.7 2.4 a Difference % = 100 * (2016 value − 2013 value) / (2013 value)
b Difference % = 100 * (2016 value − 2014 value) / (2014 value)
c Difference % = 100 * (2016 value − 2015 value) / (2015 value)
Table 38 Aircraft PM2.5 emissions – 2016: comparison of emissions calculated using 2016 APU times with those calculated using 2013, 2014 and 2015 APU times
Mode 2016 PM2.5 emissions (tonnes) Difference (%)
2013 times 2014 times 2015 times 2016 times 2013a 2014
b 2015
c
APU 3.46 3.46 3.14 4.33 25.0 25.1 37.7
Ground-level 28.27 28.27 27.95 29.14 3.1 3.1 4.2
Total aircraft LTO 42.65 42.65 42.33 43.52 2.0 2.0 2.8 a Difference % = 100 * (2016 value − 2013 value) / (2013 value)
b Difference % = 100 * (2016 value − 2014 value) / (2014 value)
c Difference % = 100 * (2016 value − 2015 value) / (2015 value)
Taxi and hold
Table 39 and Table 40 present PM10 and PM2.5 emissions, respectively, for the 2016 aircraft movements calculated using the ‘alternative’ 2013 taxi and hold times, comparing them with the emissions calculated for 2013, 2014 and 2015 (also calculated using the ‘alternative’ 2013 taxi and hold times). Table 39 and Table 40 show that calculated aircraft emissions of PM10 (PM2.5) for the whole LTO cycle were 2.9% (3.1%) higher in 2016 than in 2015 and ground-level aircraft emissions were 3.9% (4.5%) higher than in 2015.
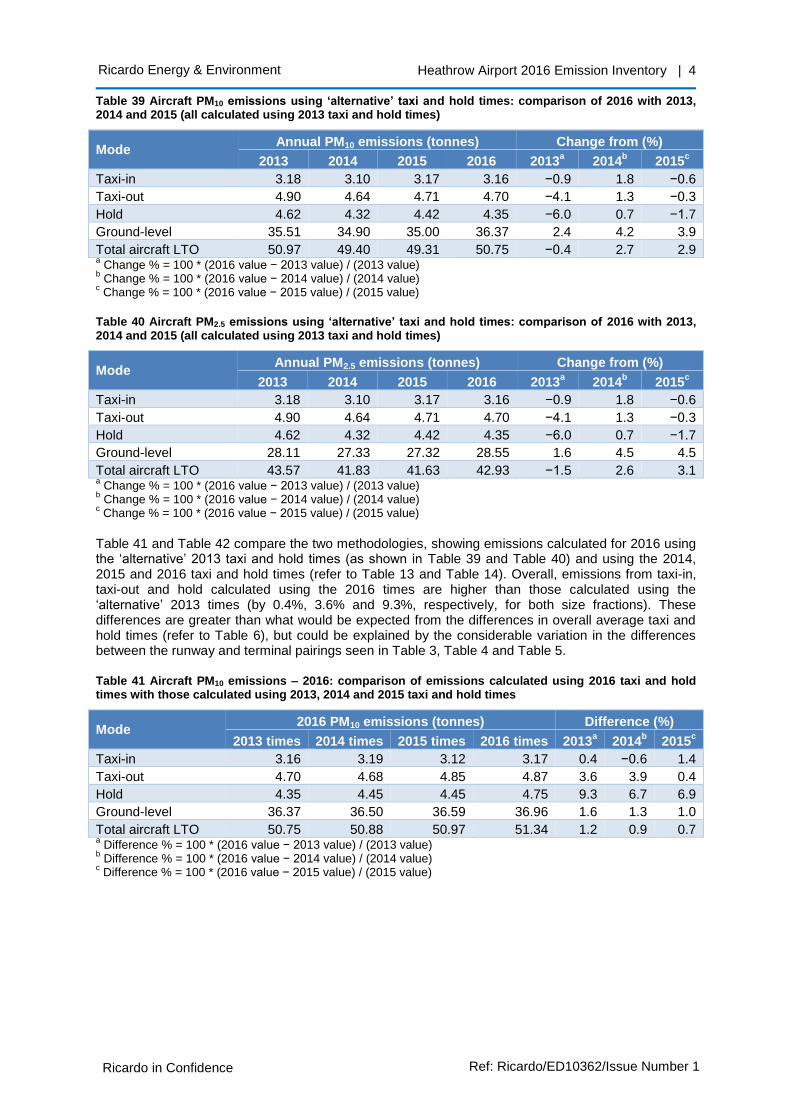
Ricardo Energy & Environment Heathrow Airport 2016 Emission Inventory | 4
Ricardo in Confidence Ref: Ricardo/ED10362/Issue Number 1
Table 39 Aircraft PM10 emissions using ‘alternative’ taxi and hold times: comparison of 2016 with 2013, 2014 and 2015 (all calculated using 2013 taxi and hold times)
Mode Annual PM10 emissions (tonnes) Change from (%)
2013 2014 2015 2016 2013a 2014
b 2015
c
Taxi-in 3.18 3.10 3.17 3.16 −0.9 1.8 −0.6
Taxi-out 4.90 4.64 4.71 4.70 −4.1 1.3 −0.3
Hold 4.62 4.32 4.42 4.35 −6.0 0.7 −1.7
Ground-level 35.51 34.90 35.00 36.37 2.4 4.2 3.9
Total aircraft LTO 50.97 49.40 49.31 50.75 −0.4 2.7 2.9 a Change % = 100 * (2016 value − 2013 value) / (2013 value)
b Change % = 100 * (2016 value − 2014 value) / (2014 value)
c Change % = 100 * (2016 value − 2015 value) / (2015 value)
Table 40 Aircraft PM2.5 emissions using ‘alternative’ taxi and hold times: comparison of 2016 with 2013, 2014 and 2015 (all calculated using 2013 taxi and hold times)
Mode Annual PM2.5 emissions (tonnes) Change from (%)
2013 2014 2015 2016 2013a 2014
b 2015
c
Taxi-in 3.18 3.10 3.17 3.16 −0.9 1.8 −0.6
Taxi-out 4.90 4.64 4.71 4.70 −4.1 1.3 −0.3
Hold 4.62 4.32 4.42 4.35 −6.0 0.7 −1.7
Ground-level 28.11 27.33 27.32 28.55 1.6 4.5 4.5
Total aircraft LTO 43.57 41.83 41.63 42.93 −1.5 2.6 3.1 a Change % = 100 * (2016 value − 2013 value) / (2013 value)
b Change % = 100 * (2016 value − 2014 value) / (2014 value)
c Change % = 100 * (2016 value − 2015 value) / (2015 value)
Table 41 and Table 42 compare the two methodologies, showing emissions calculated for 2016 using the ‘alternative’ 2013 taxi and hold times (as shown in Table 39 and Table 40) and using the 2014, 2015 and 2016 taxi and hold times (refer to Table 13 and Table 14). Overall, emissions from taxi-in, taxi-out and hold calculated using the 2016 times are higher than those calculated using the ‘alternative’ 2013 times (by 0.4%, 3.6% and 9.3%, respectively, for both size fractions). These differences are greater than what would be expected from the differences in overall average taxi and hold times (refer to Table 6), but could be explained by the considerable variation in the differences between the runway and terminal pairings seen in Table 3, Table 4 and Table 5.
Table 41 Aircraft PM10 emissions – 2016: comparison of emissions calculated using 2016 taxi and hold times with those calculated using 2013, 2014 and 2015 taxi and hold times
Mode 2016 PM10 emissions (tonnes) Difference (%)
2013 times 2014 times 2015 times 2016 times 2013a 2014
b 2015
c
Taxi-in 3.16 3.19 3.12 3.17 0.4 −0.6 1.4
Taxi-out 4.70 4.68 4.85 4.87 3.6 3.9 0.4
Hold 4.35 4.45 4.45 4.75 9.3 6.7 6.9
Ground-level 36.37 36.50 36.59 36.96 1.6 1.3 1.0
Total aircraft LTO 50.75 50.88 50.97 51.34 1.2 0.9 0.7 a Difference % = 100 * (2016 value − 2013 value) / (2013 value)
b Difference % = 100 * (2016 value − 2014 value) / (2014 value)
c Difference % = 100 * (2016 value − 2015 value) / (2015 value)
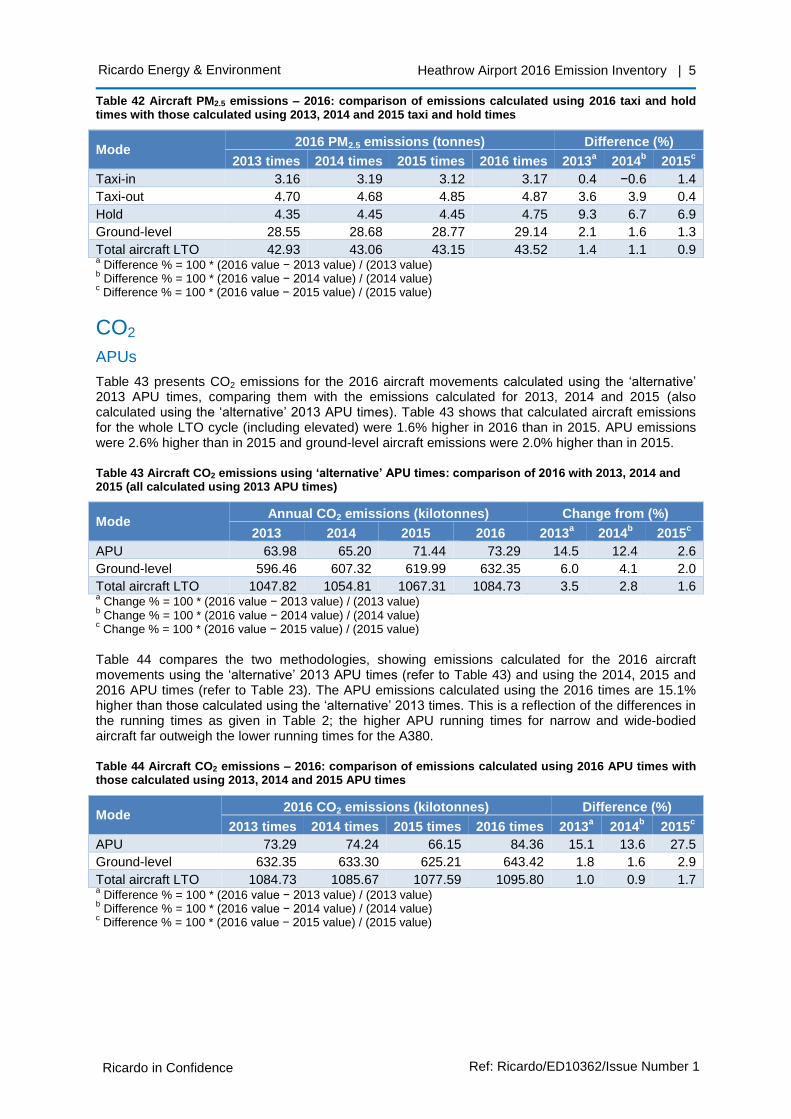
Ricardo Energy & Environment Heathrow Airport 2016 Emission Inventory | 5
Ricardo in Confidence Ref: Ricardo/ED10362/Issue Number 1
Table 42 Aircraft PM2.5 emissions – 2016: comparison of emissions calculated using 2016 taxi and hold times with those calculated using 2013, 2014 and 2015 taxi and hold times
Mode 2016 PM2.5 emissions (tonnes) Difference (%)
2013 times 2014 times 2015 times 2016 times 2013a 2014
b 2015
c
Taxi-in 3.16 3.19 3.12 3.17 0.4 −0.6 1.4
Taxi-out 4.70 4.68 4.85 4.87 3.6 3.9 0.4
Hold 4.35 4.45 4.45 4.75 9.3 6.7 6.9
Ground-level 28.55 28.68 28.77 29.14 2.1 1.6 1.3
Total aircraft LTO 42.93 43.06 43.15 43.52 1.4 1.1 0.9 a Difference % = 100 * (2016 value − 2013 value) / (2013 value)
b Difference % = 100 * (2016 value − 2014 value) / (2014 value)
c Difference % = 100 * (2016 value − 2015 value) / (2015 value)
CO2
APUs
Table 43 presents CO2 emissions for the 2016 aircraft movements calculated using the ‘alternative’ 2013 APU times, comparing them with the emissions calculated for 2013, 2014 and 2015 (also calculated using the ‘alternative’ 2013 APU times). Table 43 shows that calculated aircraft emissions for the whole LTO cycle (including elevated) were 1.6% higher in 2016 than in 2015. APU emissions were 2.6% higher than in 2015 and ground-level aircraft emissions were 2.0% higher than in 2015.
Table 43 Aircraft CO2 emissions using ‘alternative’ APU times: comparison of 2016 with 2013, 2014 and 2015 (all calculated using 2013 APU times)
Mode Annual CO2 emissions (kilotonnes) Change from (%)
2013 2014 2015 2016 2013a 2014
b 2015
c
APU 63.98 65.20 71.44 73.29 14.5 12.4 2.6
Ground-level 596.46 607.32 619.99 632.35 6.0 4.1 2.0
Total aircraft LTO 1047.82 1054.81 1067.31 1084.73 3.5 2.8 1.6 a Change % = 100 * (2016 value − 2013 value) / (2013 value)
b Change % = 100 * (2016 value − 2014 value) / (2014 value)
c Change % = 100 * (2016 value − 2015 value) / (2015 value)
Table 44 compares the two methodologies, showing emissions calculated for the 2016 aircraft movements using the ‘alternative’ 2013 APU times (refer to Table 43) and using the 2014, 2015 and 2016 APU times (refer to Table 23). The APU emissions calculated using the 2016 times are 15.1% higher than those calculated using the ‘alternative’ 2013 times. This is a reflection of the differences in the running times as given in Table 2; the higher APU running times for narrow and wide-bodied aircraft far outweigh the lower running times for the A380.
Table 44 Aircraft CO2 emissions – 2016: comparison of emissions calculated using 2016 APU times with those calculated using 2013, 2014 and 2015 APU times
Mode 2016 CO2 emissions (kilotonnes) Difference (%)
2013 times 2014 times 2015 times 2016 times 2013a 2014
b 2015
c
APU 73.29 74.24 66.15 84.36 15.1 13.6 27.5
Ground-level 632.35 633.30 625.21 643.42 1.8 1.6 2.9
Total aircraft LTO 1084.73 1085.67 1077.59 1095.80 1.0 0.9 1.7 a Difference % = 100 * (2016 value − 2013 value) / (2013 value)
b Difference % = 100 * (2016 value − 2014 value) / (2014 value)
c Difference % = 100 * (2016 value − 2015 value) / (2015 value)
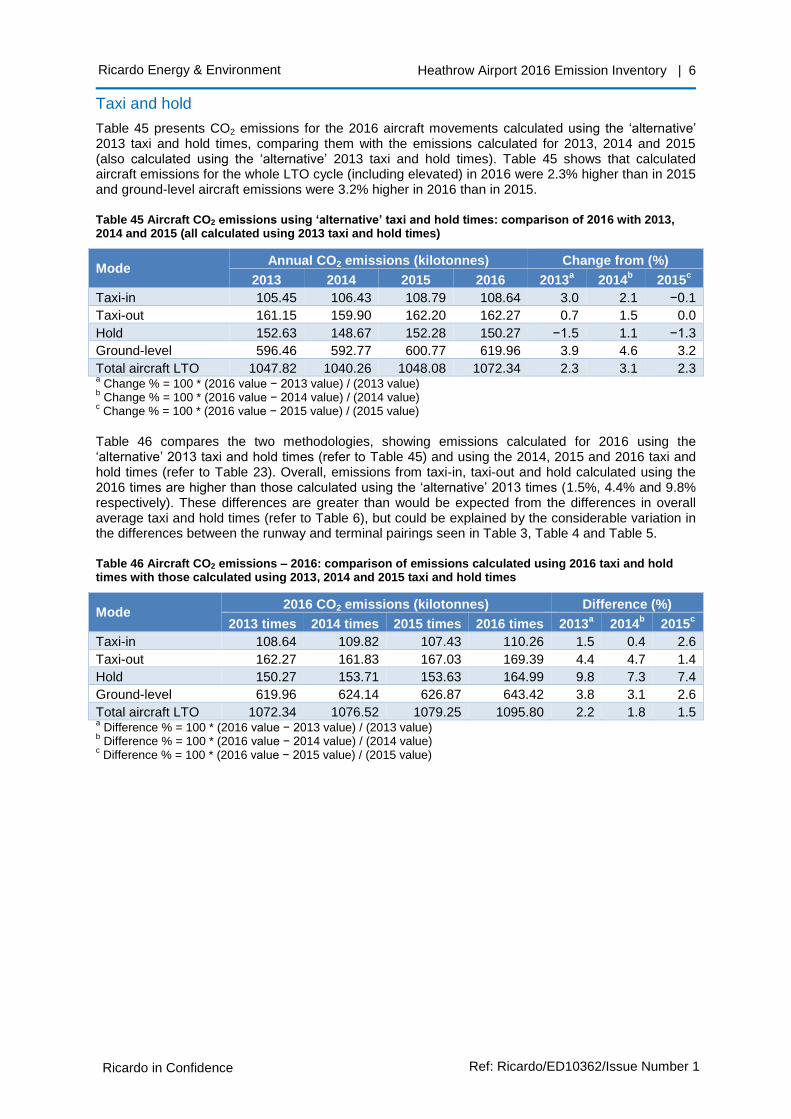
Ricardo Energy & Environment Heathrow Airport 2016 Emission Inventory | 6
Ricardo in Confidence Ref: Ricardo/ED10362/Issue Number 1
Taxi and hold
Table 45 presents CO2 emissions for the 2016 aircraft movements calculated using the ‘alternative’ 2013 taxi and hold times, comparing them with the emissions calculated for 2013, 2014 and 2015 (also calculated using the ‘alternative’ 2013 taxi and hold times). Table 45 shows that calculated aircraft emissions for the whole LTO cycle (including elevated) in 2016 were 2.3% higher than in 2015 and ground-level aircraft emissions were 3.2% higher in 2016 than in 2015.
Table 45 Aircraft CO2 emissions using ‘alternative’ taxi and hold times: comparison of 2016 with 2013, 2014 and 2015 (all calculated using 2013 taxi and hold times)
Mode Annual CO2 emissions (kilotonnes) Change from (%)
2013 2014 2015 2016 2013a 2014
b 2015
c
Taxi-in 105.45 106.43 108.79 108.64 3.0 2.1 −0.1
Taxi-out 161.15 159.90 162.20 162.27 0.7 1.5 0.0
Hold 152.63 148.67 152.28 150.27 −1.5 1.1 −1.3
Ground-level 596.46 592.77 600.77 619.96 3.9 4.6 3.2
Total aircraft LTO 1047.82 1040.26 1048.08 1072.34 2.3 3.1 2.3 a Change % = 100 * (2016 value − 2013 value) / (2013 value)
b Change % = 100 * (2016 value − 2014 value) / (2014 value)
c Change % = 100 * (2016 value − 2015 value) / (2015 value)
Table 46 compares the two methodologies, showing emissions calculated for 2016 using the ‘alternative’ 2013 taxi and hold times (refer to Table 45) and using the 2014, 2015 and 2016 taxi and hold times (refer to Table 23). Overall, emissions from taxi-in, taxi-out and hold calculated using the 2016 times are higher than those calculated using the ‘alternative’ 2013 times (1.5%, 4.4% and 9.8% respectively). These differences are greater than would be expected from the differences in overall average taxi and hold times (refer to Table 6), but could be explained by the considerable variation in the differences between the runway and terminal pairings seen in Table 3, Table 4 and Table 5.
Table 46 Aircraft CO2 emissions – 2016: comparison of emissions calculated using 2016 taxi and hold times with those calculated using 2013, 2014 and 2015 taxi and hold times
Mode 2016 CO2 emissions (kilotonnes) Difference (%)
2013 times 2014 times 2015 times 2016 times 2013a 2014
b 2015
c
Taxi-in 108.64 109.82 107.43 110.26 1.5 0.4 2.6
Taxi-out 162.27 161.83 167.03 169.39 4.4 4.7 1.4
Hold 150.27 153.71 153.63 164.99 9.8 7.3 7.4
Ground-level 619.96 624.14 626.87 643.42 3.8 3.1 2.6
Total aircraft LTO 1072.34 1076.52 1079.25 1095.80 2.2 1.8 1.5 a Difference % = 100 * (2016 value − 2013 value) / (2013 value)
b Difference % = 100 * (2016 value − 2014 value) / (2014 value)
c Difference % = 100 * (2016 value − 2015 value) / (2015 value)

The Gemini Building Fermi Avenue Harwell Didcot Oxfordshire OX11 0QR United Kingdom
t: +44 (0)1235 753000 e: [email protected]
ee.ricardo.com