heathrow (sp) limited · •on track to deliver £600 million q6 efficiency target –further...
TRANSCRIPT

24 February 2017
Heathrow (SP) Limited Results for year ended 31 December 2016

2016 highlights

3
• Record service standards complement strong operational performance
• Once again Skytrax best Airport in Western Europe
• 75.7 million passengers, sixth successive record year
2016 – A milestone year for Heathrow
• Revenue of £2,807 million, up 1.5% and Adjusted EBITDA of £1,682 million, up 4.8%
• Strong cost control and better value
• £1.6 billion raised globally in 2016
• Raising service standards and operational resilience
• Focusing on further cost efficiency and revenue development
• Secured government support for expansion
Operational
highlights 1
Financial
performance 2
Strategic
aims 3
See page 22 for notes, sources and defined terms
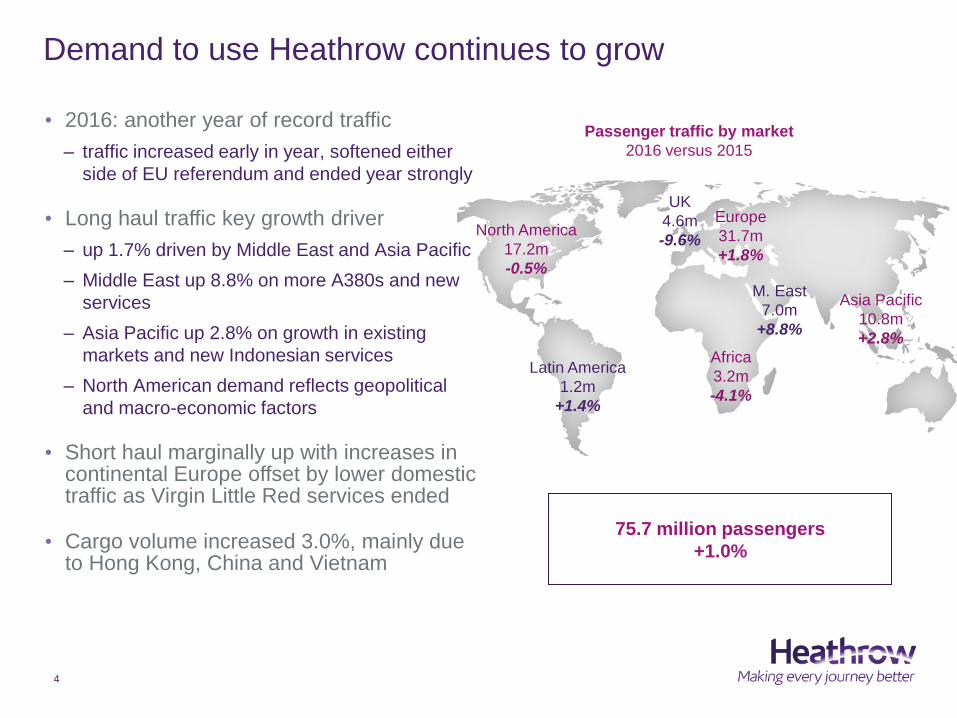
Demand to use Heathrow continues to grow
Passenger traffic by market
2016 versus 2015
Africa
3.2m
-4.1%
M. East
7.0m
+8.8%
Asia Pacific
10.8m
+2.8%
UK
4.6m
-9.6%
Europe
31.7m
+1.8%
Latin America
1.2m
+1.4%
North America
17.2m
-0.5%
75.7 million passengers
+1.0%
• 2016: another year of record traffic
– traffic increased early in year, softened either
side of EU referendum and ended year strongly
• Long haul traffic key growth driver
– up 1.7% driven by Middle East and Asia Pacific
– Middle East up 8.8% on more A380s and new
services
– Asia Pacific up 2.8% on growth in existing
markets and new Indonesian services
– North American demand reflects geopolitical
and macro-economic factors
• Short haul marginally up with increases in continental Europe offset by lower domestic traffic as Virgin Little Red services ended
• Cargo volume increased 3.0%, mainly due to Hong Kong, China and Vietnam
4
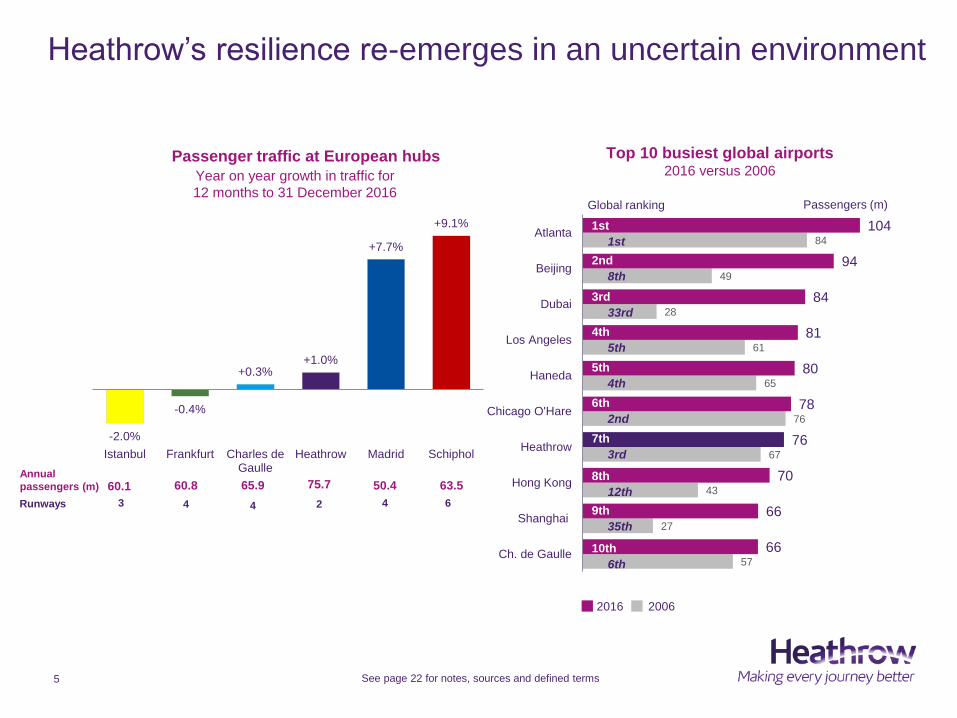
Heathrow’s resilience re-emerges in an uncertain environment
Annual
passengers (m)
5
Runways
-2.0%
-0.4%
+0.3% +1.0%
+7.7%
+9.1%
Istanbul Frankfurt Charles deGaulle
Heathrow Madrid Schiphol
Year on year growth in traffic for
12 months to 31 December 2016
60.8 65.9 60.1 75.7 63.5 50.4
3 4 4 2 6 4
See page 22 for notes, sources and defined terms
Passenger traffic at European hubs Top 10 busiest global airports 2016 versus 2006
57
27
43
67
76
65
61
28
49
84
66
66
70
76
78
80
81
84
94
104
Ch. de Gaulle
Shanghai
Hong Kong
Heathrow
Chicago O'Hare
Haneda
Los Angeles
Dubai
Beijing
Atlanta1st
2nd
3rd
4th
5th
6th
7th
8th
9th
10th
1st
8th
33rd
5th
4th
2nd
3rd
12th
35th
6th
Passengers (m) Global ranking
2016 2006

Record service standards complemented by robust operations
European competitors European comparators
Passenger satisfaction European ranking
Q4 2016
Quarterly passenger satisfaction
Q4 2006 – Q4 2016
Heathrow European average European top quartile
3.20
3.40
3.60
3.80
4.00
4.20
Q4
-06
Q2
-07
Q4
-07
Q2
-08
Q4
-08
Q2
-09
Q4
-09
Q2
-10
Q4
-10
Q2
-11
Q4
-11
Q2
-12
Q4
-12
Q2
-13
Q4
-13
Q2
-14
Q4
-14
Q2
-15
Q4
-15
Q2
-16
Q4
-16
AS
Q s
co
re (
ou
t o
f 5
)
63%
78% 79%
50%
60%
70%
80%
90%
2007 2015 2016
Departures
within 15 minutes of schedule
40
17 14
0
10
20
30
40
50
2007 2015 2016
Baggage performance
misconnect rate per 1,000 passengers
6
4.19
3.30
3.50
3.70
3.90
4.10
4.30
4.50
LHR
AS
Q s
co
re (
ou
t o
f 5
)
See page 22 for notes, sources and defined terms
Best Airport in Western Europe
World’s Best Airport Shopping
Terminal 5 – World’s Best Airport Terminal
World’s Best Independent Airport Lounge
2016 Europe’s Best Airport
(over 40 million passengers)

Heathrow expansion
7 See page 22 for notes, sources and defined terms
• Government support confirmed in October 2016
• Expansion programme moves into delivery mode
– draft National Policy Statement aligned with Heathrow and
Airports Commission proposals
– engagement stepped up with airlines/local communities
– Skills Taskforce and supply chain mobilisation
– scope to increase capacity and reduce noise from 2021
• Affordability and financeability at heart of scheme
– transformational for passengers, airlines and Heathrow
– obtaining planning consent estimated to cost £250-300m
• Confident of delivering for the UK
– overwhelming support of multiple stakeholders
– track record of major project delivery (e.g. Terminal 5)
– high quality, committed shareholder base
– very strong global access to debt capital

2017 2018 2019 2020 2021
CAA
decision on
Category B
costs
Heathrow
consultation 2
CAA final
report to
Secretary of
State on airline
engagement
Government
decision to grant
DCO
Heathrow submits
Development
Consent Order
(DCO) application
Government decision
to grant DCO
8
Heathrow expansion – indicative next steps
Government
consultation on draft
National Policy
Statement (NPS) to
be followed by
parliamentary scrutiny
Government
Heathrow
CAA
Heathrow
consultation 1
CAA policy
update on
H7 review
CAA initial
proposals for
H7 regulation
Indicative
deadline for
CAA decision
on Q6+1+1
NPS
‘designated’ by
Government

Financial review

(£ million)
2016
2015 Versus
2015
Revenue 2,807 2,765 +1.5%
Operating costs1 1,125 1,160 -3.0%
Adjusted EBITDA1 1,682 1,605 +4.8%
Capital expenditure 674 627 +7.5%
Dec
2016
Dec
2015
Change
from
31 Dec 15
Consolidated nominal net debt
Heathrow (SP) 11,908 11,745 +1.4%
Heathrow Finance 13,005 12,670 +2.6%
RAB 15,237 14,921 +2.1%
Financial highlights
10 See page 22 for notes, sources and defined terms

496 498
612 568
1,699 1,699
20162015
Revenues driven by continued strong retail growth
• Flat aeronautical revenue
– +ve: traffic growth; revenue concentration
– -ve: lower tariff (RPI-1.5% formula); non-recurrence
of K factor boost in 2015; lower capital expenditure
• Acceleration in retail income growth
– strongest growth in recent years
– sterling depreciation boosted H2, particularly duty
and tax-free and airside specialist shops
– T5 luxury retail redevelopment continues to deliver
growth; similar initiative just completed in T4
– car parking continues to grow
– delivered over £200 million of £300 million Q6
incremental revenue target
Analysis of revenue (£m)
-
+7.7%
-0.4%
11
Aeronautical Retail Other
2,765 2,807 +1.5%
Per passenger (£) 2015 2016 Change
Aeronautical revenue 22.67 22.45 -1.0%
Retail revenue 7.58 8.09 6.7%

Benefits of cost efficiencies continue to flow through
• ~4% lower operating cost per passenger
– benefits from lower headcount and increased
productivity
– defined benefit pension scheme changes
– utilities saving from re-negotiated contract and
energy demand management
– other re-negotiated contracts
• Increased investment in resilience and training driving lower service quality rebates
• On track to deliver £600 million Q6 efficiency target
– further organisational change being implemented
to drive towards final target
213 183
123 128
187 176
253 265
384 373
2015 2016
-5.9%
-2.9%
-14.1%
4.7%
4.1%
12
Analysis of operating costs (£m)
1,160 1,125 -3.0%
See page 22 for notes, sources and defined terms
Per passenger (£) 2015 2016 Change
Operating costs 15.48 14.87 -3.9%
Employment Operational Maintenance
Business rates Utilities & Other

Operating cash flow significantly exceeds capital expenditure
and interest payments
11,745 11,908
674
521
1,652
139
406
75
11,000
11,250
11,500
11,750
12,000
12,250
12,500
12,750
13,000
Opening(1 January 2016)
Capitalexpenditure
Net interest paidon external debt
Cash flow fromoperations
Index-linkedaccretion
Netdividends/other
restrictedpayments
Tax/other Closing(31 December
2016)
(£m
)
Heathrow (SP) nominal net debt January 2016 – December 2016
13 See page 22 for notes, sources and defined terms

67.6% 68.0% 67.5% 68.3% 67.4% 68.0% 66.7%
77.2% 78.4% 78.7%
79.7% 79.0% 79.5%
78.2%
82.4% 84.5% 84.9%
85.7% 85.3% 84.9% 85.4%
60%
65%
70%
75%
80%
85%
90%
95%
100%
31 December2013
31 December2014
31 December2015
31 March2016
30 June2016
30 September2016
31 December2016
Heathrow (SP) Class A gearing Heathrow (SP) Class B gearing Heathrow Finance gearing
2016 by quarter
Substantial gearing headroom retained
Evolution of gearing ratios
HF 2025 Notes covenant
Class B gearing trigger
Class A gearing trigger
HF 2017/2019 Notes covenant
14 See page 22 for notes, sources and defined terms
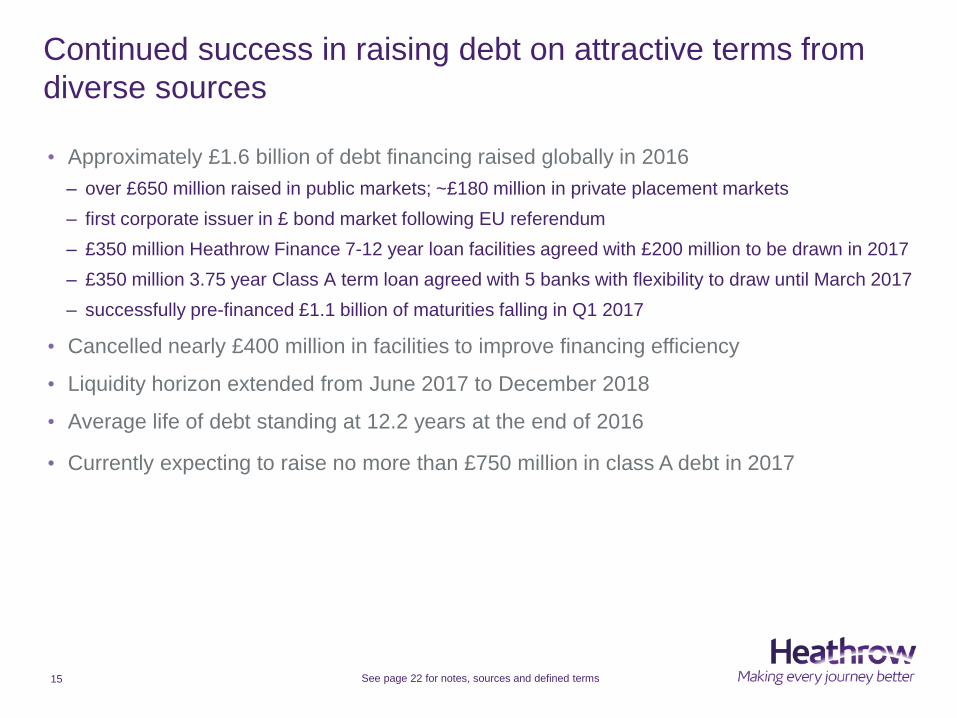
• Approximately £1.6 billion of debt financing raised globally in 2016
– over £650 million raised in public markets; ~£180 million in private placement markets
– first corporate issuer in £ bond market following EU referendum
– £350 million Heathrow Finance 7-12 year loan facilities agreed with £200 million to be drawn in 2017
– £350 million 3.75 year Class A term loan agreed with 5 banks with flexibility to draw until March 2017
– successfully pre-financed £1.1 billion of maturities falling in Q1 2017
• Cancelled nearly £400 million in facilities to improve financing efficiency
• Liquidity horizon extended from June 2017 to December 2018
• Average life of debt standing at 12.2 years at the end of 2016
• Currently expecting to raise no more than £750 million in class A debt in 2017
Continued success in raising debt on attractive terms from
diverse sources
15 See page 22 for notes, sources and defined terms

Outlook
• Early weeks of 2017 characterised by stronger than expected traffic volumes
• Forecast Adjusted EBITDA remains consistent with December 2016 investor report’s
guidance at £1,660 million
16

Strategic update

Giving passengers the best airport service in the world
Mojo 1
Transform
customer service 2
Sustainable
growth 4
Beat the plan 3
18
To come
Heathrow service proposition
New, ‘high care’ passenger service
Autism and dementia – customer focus guide and training
Terminal 5 first class lounge access
Record 4.19 ASQ score, retaining position as top European Hub Airport
1st Hong Kong airport exchange
Savings from new business model
Food and beverage pre-order App
Domestic and US seat sale campaigns
Retail fit-out of Terminal 3 transfer facility
Current regulatory period extended 1 year
First 2 months: >3k Go-Heathrow bookings
>100m people viewed Christmas advert
New Harry Potter store - ~50% higher footfall than comparable Terminal 5 shops
Government consultation on draft NPS
Airline first phase consultation
Environmental audits continue
Sustainable Strategy launch
Government says ‘yes’ to expansion
74% MPs support expansion
Programme team established
Skills Task Force sits, setting strategy and plans
204,000 people engaged via Guardian sustainability business partnership
Sunday Times Best Companies - top 30 major company
Heathrow Careers Fair
Midnight Marathon
Front line manager development
Delivered
78% of colleagues say Heathrow is a great place to work
Diversity strategy and 5 networks launched
327 colleagues internally promoted in 2016

Questions?

Appendices

Heathrow nominal net debt at 31 December 2016
21 See page 22 for notes, sources and defined terms
Heathrow (SP) Limited Amount Available Maturity
Senior debt (£m) (£m)
€700m 4.375% 584 584 2017
CHF400m 2.5% 272 272 2017
€750m 4.6% 510 510 2018
C$400m 4% 250 250 2019
£250m 9.2% 250 250 2021
C$450m 3% 246 246 2021
US$1,000m 4.875% 621 621 2021
£180m RPI +1.65% 199 199 2022
€600m 1.875% 490 490 2022
£750m 5.225% 750 750 2023
CHF400m 0.5% 277 277 2024
C$500m 3.25% 266 266 2025
£700m 6.75% 700 700 2026
NOK1,000m 2.65% 84 84 2027
£200m 7.075% 200 200 2028
NOK1,000m 2.50% 91 91 2029
€750m 1.5% 566 566 2030
£900m 6.45% 900 900 2031
€50m Zero Coupon 42 42 2032
£75m RPI +1.366% 79 79 2032
€50m Zero Coupon 42 42 2032
£50m 4.171% 50 50 2034
€50m Zero Coupon 40 40 2034
£50m RPI +1.382% 53 53 2039
£460m RPI +3.334% 566 566 2039
£100m RPI +1.238% 104 104 2040
£750m 5.875% 750 750 2041
£750m 4.625% 750 750 2046
£75m RPI +1.372% 79 79 2049
£400m 2.75% 400 400 2049
Total senior bonds 10,211 10,211
Term debt 438 788 Various
Index-linked derivative accretion 179 179 Various
Revolving/working capital facilities 0 900 2021
Total other senior debt 617 1,867
Total senior debt 10,828 12,078
Heathrow (SP) Limited cash (660)
Senior net debt 10,168
Heathrow (SP) Limited Amount Available Maturity
Junior debt (£m) (£m)
£400m 6.25% 400 400 2018
£400m 6% 400 400 2020
£600m 7.125% 600 600 2024
£155m 4.221% 155 155 2026
£180m RPI +1.061% 185 185 2036
Total junior bonds 1,740 1,740
Junior revolving credit facilities 0 250 2021
Total junior debt 1,740 1,990
Heathrow (SP) Limited group net debt 11,908
Heathrow Finance plc Amount Available Maturity
(£m) (£m)
£325m 7.125% 265 265 2017
£275m 5.375% 263 263 2019
£250m 5.75% 250 250 2025
Total bonds 778 778
£75m 75 75 2020
£50m 50 50 2022
£50m 50 50 2025
£150m 150 150 2028
Total loans 325 325
Total Heathrow Finance plc debt 1,103 1,103
Heathrow Finance plc cash (6)
Heathrow Finance plc net debt 1,097
Heathrow Finance plc group Amount Available
(£m) (£m)
Heathrow (SP) Limited senior debt 10,828 12,078
Heathrow (SP) Limited junior debt 1,740 1,990
Heathrow Finance plc debt 1,103 1,103
Heathrow Finance plc group debt 13,671 15,171
Heathrow Finance plc group cash (666)
Heathrow Finance plc group net debt 13,005

Page 3
– Adjusted EBITDA: earnings before interest, tax, depreciation and amortisation and exceptional items
Page 5
– Sources: airport websites and ACI annual traffic data
Page 6
– Passenger satisfaction: quarterly Airport Service Quality surveys directed by Airports Council International (ACI). Survey scores range from 0 up to 5
Page 10
– Adjusted operating costs exclude depreciation, amortisation and exceptional items
– Adjusted EBITDA: earnings before interest, tax, depreciation and amortisation and exceptional items
– Consolidated net debt at Heathrow (SP) Limited and Heathrow Finance plc is calculated on a nominal basis excluding intra-group loans and including index-linked accretion
– RAB: Regulatory Asset Base
Page 12
– Operating costs refer to Adjusted operating costs which exclude depreciation, amortisation and exceptional items
– For the year ended 31 December 2015, £11 million of costs previously included under ‘Other’ have been re-classified into ‘Operational’ to be consistent with current year disclosure
Page 13
– Opening and closing nominal net debt includes index-linked accretion
– The financing arrangements of the Group and Heathrow Finance restrict certain payments unless specified conditions are satisfied. These restricted payments include, among other things, payments of dividends, distributions and other returns on share capital, any redemptions or repurchases of share capital, and payments of fees, interest or principal on any intercompany loans
– Net dividends/other restricted payments include dividends and interest payments on the debenture between Heathrow (SP) and Heathrow Finance offset by any cash injections from Heathrow Finance into Heathrow (SP)
– Flows included in ‘Tax/other’ include group relief receipts, external tax payments, fees paid in relation to bond issues , discounts on bonds issued, proceeds from swap restructuring and movements in group deposits
Page 14
– Gearing ratio: external nominal net debt (including index-linked accretion) to RAB (regulatory asset base)
– The more restrictive 90% Group RAR covenant in relation to the Heathrow Finance 2017 Notes and 2019 Notes applies as long as these notes remain outstanding
Page 15
– Average life of debt across Heathrow (SP) Limited group pro forma for inclusion of delayed drawdowns and Q1 2017 bond maturities
Page 21
– Net debt is calculated on a nominal basis excluding intra-group loans and including index-linked accretion and includes non-sterling debt at exchange rate of hedges entered into at inception of relevant financing
– Maturity is defined as the Scheduled Redemption Date
Notes, sources and defined terms
22

Disclaimer
The information and opinions contained in this presentation are provided as at the date of this document.
This presentation contains certain statements regarding the financial condition, results of operations, business and future prospects of Heathrow. All statements, other than
statements of historical fact are, or may be deemed to be, “forward-looking statements”. These forward-looking statements are statements of future expectations and include,
among other things, projections, forecasts, estimates of income, yield and return, pricing, industry growth, other trend projections and future performance targets. These
forward-looking statements are based upon management’s current assumptions (not all of which are stated), expectations and beliefs and, by their nature are subject to a
number of known and unknown risks and uncertainties which may cause the actual results, prospects, events and developments of Heathrow to differ materially from those
assumed, expressed or implied by these forward-looking statements. Future events are difficult to predict and are beyond Heathrow’s control, accordingly, these forward-
looking statements are not guarantees of future performance. Accordingly, there can be no assurance that estimated returns or projections will be realised, that forward-looking
statements will materialise or that actual returns or results will not be materially lower than those presented.
All forward-looking statements are based on information available as the date of this document, accordingly, except as required by any applicable law or regulation, Heathrow
and its advisers expressly disclaim any obligation or undertaking to update or revise any forward-looking statements contained in this presentation to reflect any changes in
events, conditions or circumstances on which any such statement is based and any changes in Heathrow’s assumptions, expectations and beliefs.
This presentation contains certain information which has been prepared in reliance on publicly available information (the “Public Information”). Numerous assumptions may
have been used in preparing the Public Information, which may or may not be reflected herein. Actual events may differ from those assumed and changes to any assumptions
may have a material impact on the position or results shown by the Public Information. As such, no assurance can be given as to the Public Information’s accuracy,
appropriateness or completeness in any particular context, or as to whether the Public Information and/or the assumptions upon which it is based reflect present market
conditions or future market performance. The Public Information should not be construed as either projections or predictions nor should any information herein be relied upon
as legal, tax, financial or accounting advice. Heathrow does not make any representation or warranty as to the accuracy or completeness of the Public Information.
All information in this presentation is the property of Heathrow and may not be reproduced or recorded without the prior written permission of Heathrow. Nothing in this
presentation constitutes or shall be deemed to constitute an offer or solicitation to buy or sell or to otherwise deal in any securities, or any interest in any securities, and nothing
herein should be construed as a recommendation or advice to invest in any securities.
This document has been sent to you in electronic form. You are reminded that documents transmitted via this medium may be altered or changed during the process of
electronic transmission and consequently neither Heathrow nor any person who controls it (nor any director, officer, employee not agent of it or affiliate or adviser of such
person) accepts any liability or responsibility whatsoever in respect of the difference between the document sent to you in electronic format and the hard copy version available
to you upon request from Heathrow.
Any reference to “Heathrow” means Heathrow (SP) Limited (a company registered in England and Wales, with company number 6458621) and will include its parent company,
subsidiaries and subsidiary undertakings from time to time, and their respective directors, representatives or employees and/or any persons connected with them.
