heating and cooling of buildings -...
TRANSCRIPT

Heating andCooling ofBuildings
The houses in the past were built to keep the rain, snow, and thieves out withhardly any attention given to heat losses and energy conservation. Houses hadlittle or no insulation, and the structures had numerous cracks through whichair leaked. We have seen dramatic changes in the construction of residentialand commercial buildings in the 20th century as a result of increased aware-ness of limited energy resources together with the escalating energy prices andthe demand for a higher level of thermal comfort. Today, most local codesspecify the minimum level of insulation to be used in the walls and the roof ofnew houses, and often require the use of double-pane windows. As a result,today’s houses are well insulated, weatherproofed, and nearly air tight, andprovide better thermal comfort.
The failures and successes of the past often shed light to the future, andthus we start this chapter with a brief history of heating and cooling to putthings into historical perspective. Then we discuss the criteria for thermalcomfort, which is the primary reason for installing heating and cooling sys-tems. In the remainder of the chapter, we present calculation procedures forthe heating and cooling loads of buildings using the most recent informationand design criteria established by the American Society of Heating, Refriger-ating and Air-Conditioning Engineers, Inc. (ASHRAE), which publishes andperiodically revises the most authoritative handbooks in the field. This chap-ter is intended to introduce the readers to an exciting application area of heattransfer, and to help them develop a deeper understanding of the fundamentalsof heat transfer using this familiar setup. The reader is referred to ASHRAEhandbooks for more information.
C H A P T E R21

21-1 � A BRIEF HISTORY
Unlike animals such as a fox or a bear that are born with built-in furs, humanbeings come into this world with little protection against the harsh environ-mental conditions (Fig. 21-1). Therefore, we can claim that the search forthermal comfort dates back to the beginning of human history. It is believedthat early human beings lived in caves that provided shelter as well as pro-tection from extreme thermal conditions. Probably the first form of heatingsystem used was open fire, followed by fire in dwellings through the use of achimney to vent out the combustion gases. The concept of central heatingdates back to the times of the Romans, who heated homes by utilizing double-floor construction techniques and passing the fire’s fumes through the open-ing between the two floor layers. The Romans were also the first to usetransparent windows made of mica or glass to keep the wind and rain outwhile letting the light in. Wood and coal were the primary energy sources forheating, and oil and candles were used for lighting. The ruins of south-facinghouses indicate that the value of solar heating was recognized early in thehistory.
The development of the first steam heating system by James Watt datesback to 1770. When the American Society of Heating and Ventilating Engi-neers was established in New York in 1894, central heating systems using castiron warm air furnaces and boilers were in common use. Fans were added in1899 to move the air mechanically, and later automatic firing replaced themanual firing. The steam heating systems gained widespread acceptance inthe early 1900s by the introduction of fluid-operated thermostatic traps to im-prove the fluid circulation. Gravity-driven hot water heating systems were de-veloped in parallel with steam systems. Suspended and floor-type unit heaters,unit ventilators, and panel heaters were developed in the 1920s. Unit heatersand panel heaters usually used steam, hot water, or electricity as the heatsource. It became common practice to conceal the radiators in the 1930s, andthe baseboard radiator was developed in 1944. Today, air heating systemswith a duct distribution network dominate the residential and commercialbuildings.
The development of cooling systems took the back seat in the history ofthermal comfort since there was no quick way of creating “coolness.” There-fore, early attempts at cooling were passive measures such as blocking off di-rect sunlight and using thick stone walls to store coolness at night. A moresophisticated approach was to take advantage of evaporative cooling by run-ning water through the structure, as done in the Alhambra castle. Of course,natural ice and snow served as “cold storage” mediums and provided somecooling.
In 1775, Dr. William Cullen made ice in Scotland by evacuating the air ina water tank (Fig. 21-2). It was also known at those times that some chemicalslowered temperatures. For example, the temperature of snow can be droppedto �33°C (�27°F) by mixing it with calcium chloride. This process was com-monly used to make ice cream. In 1851, Ferdinand Carre designed the firstammonia absorption refrigeration system, while Dr. John Gorrie received apatent for an open air refrigeration cycle to produce ice and refrigerated air.In 1853, Alexander Twining of Connecticut produced 1600 pounds (726 kg)of ice a day using sulfuric ether as the refrigerant. In 1872, David Boyle de-veloped an ammonia compression machine that produced ice. Mechanical re-frigeration at those times was used primarily to make ice and preserveperishable commodities such as meat and fish (Sauer and Howell, Ref. 7).
21-2
CHAPTER 21Heating and Coolingof Buildings
FIGURE 21-1
Most animals come into this world withbuilt-in insulation, but human beingscome with a delicate skin.
Baby
Bird
Fox
FIGURE 21-2
In 1775, ice was made by evacuatingthe air in a water tank.
Water
Ice
vapor
Evaporation
Low vapor pressure
InsulationAir + vapor
pressureHigh
Vacuumpump

Comfort cooling was obtained by ice or by chillers that used ice. Air cool-ing systems for thermal comfort were built in the 1890s, but they did not findwidespread use until the development of mechanical refrigeration in the early1900s. In 1905, 200 Btu/min (or 12,000 Btu/h) was established as 1 ton of re-frigeration, and in 1902 a 400-ton air-conditioning system was installed inthe New York Stock Exchange. The system operated reliably for 20 years. Amodern air-conditioning system was installed in the Boston Floating Hospitalin 1908, which was a first for a hospital. In a monumental paper presented in1911, Willis Carrier (1876–1950), known as the “Father of Air Conditioning,”laid out the formulas related to the dry-bulb, wet-bulb, and dew-point temper-atures of air and the sensible, latent, and total heat loads. By 1922, the cen-trifugal refrigeration machine developed by Carrier made water chilling formedium and large commercial and industrial facilities practical and economi-cal. In 1928 the Milan Building in San Antonio, Texas, was the first commer-cial building designed with and built for comfort air-conditioningspecifications (Sauer and Howell, Ref. 7).
Frigidaire introduced the first room air conditioner in the late 1920s (Fig.21-3). The halocarbon refrigerants such as Freon-12 were developed in 1930.The concept of a heat pump was described by Sadi Carnot in 1824, and theoperation of such a device called the “heat multiplier” was first described byWilliam Thomson (Lord Kelvin) in 1852. T. G. N. Haldane built an experi-mental heat pump in 1930, and a heat pump was marketed by De La Vargne in1933. General Electric introduced the heat pump in the mid 1930s, and heatpumps were being mass produced in 1952. Central air-conditioning systemswere being installed routinely in the 1960s. The oil crises of the 1970s sentshock waves among the consumers and the producers of energy-consumingequipment, which had taken energy for granted, and brought about a renewedinterest in the development of energy-efficient systems and more effective in-sulation materials. Today most residential and commercial buildings areequipped with modern air-conditioning systems that can heat, cool, humidify,dehumidify, clean, and even deodorize the air—in other words, condition theair to people’s desires.
21-2 � HUMAN BODY AND THERMAL COMFORT
The term air-conditioning is usually used in a restricted sense to imply cool-ing, but in its broad sense it means to condition the air to the desired level byheating, cooling, humidifying, dehumidifying, cleaning, and deodorizing. Thepurpose of the air-conditioning system of a building is to provide completethermal comfort for its occupants. Therefore, we need to understand the ther-mal aspects of the human body in order to design an effective air-conditioningsystem.
The building blocks of living organisms are cells, which resemble minia-ture factories performing various functions necessary for the survival of or-ganisms. The human body contains about 100 trillion cells with an averagediameter of 0.01 mm. In a typical cell, thousands of chemical reactions occurevery second during which some molecules are broken down and energy is re-leased and some new molecules are formed. The high level of chemical activ-ity in the cells that maintain the human body temperature at a temperature of37.0°C (98.6°F) while performing the necessary bodily functions is called themetabolism. In simple terms, metabolism refers to the burning of foods suchas carbohydrates, fat, and protein. The metabolizable energy content of foods
21-3
Human Body andThermal Comfort
FIGURE 21-3
The first room air conditioner wasintroduced by Frigidaire in the late 1920s.
FIGURE 21-4
Two fast-dancing people supply more heatto a room than a 1-kW resistance heater.
1.2 kJ/s
1 kJ/s

is usually expressed by nutritionists in terms of the capitalized Calorie. OneCalorie is equivalent to 1 Cal � 1 kcal � 4.1868 kJ.
The rate of metabolism at the resting state is called the basal metabolicrate, which is the rate of metabolism required to keep a body performing thenecessary bodily functions such as breathing and blood circulation at zero ex-ternal activity level. The metabolic rate can also be interpreted as the energyconsumption rate for a body. For an average man (30 years old, 70 kg, 1.73 mhigh, 1.8 m2 surface area), the basal metabolic rate is 84 W. That is, the bodyis converting chemical energy of the food (or of the body fat if the person hadnot eaten) into heat at a rate of 84 J/s, which is then dissipated to the sur-roundings. The metabolic rate increases with the level of activity, and it mayexceed 10 times the basal metabolic rate when someone is doing strenuous ex-ercise. That is, two people doing heavy exercising in a room may be supply-ing more energy to the room than a 1-kW resistance heater (Fig. 21-4). Anaverage man generates heat at a rate of 108 W while reading, writing, typing,or listening to a lecture in a classroom in a seated position. The maximummetabolic rate of an average man is 1250 W at age 20 and 730 at age 70. Thecorresponding rates for women are about 30 percent lower. Maximum meta-bolic rates of trained athletes can exceed 2000 W.
Metabolic rates during various activities are given in Table 21-1 per unitbody surface area. The surface area of a nude body was given by D. DuBoisin 1916 as
A � 0.202m0.425 h0.725 (m2) (21-1)
where m is the mass of the body in kg and h is the height in m. Clothing in-creases the exposed surface area of a person by up to about 50 percent. Themetabolic rates given in the table are sufficiently accurate for most purposes,but there is considerable uncertainty at high activity levels. More accurate val-ues can be determined by measuring the rate of respiratory oxygen consump-tion, which ranges from about 0.25 L/min for an average resting man to morethan 2 L/min during extremely heavy work. The entire energy released duringmetabolism can be assumed to be released as heat (in sensible or latent forms)since the external mechanical work done by the muscles is very small. Be-sides, the work done during most activities such as walking or riding an exer-cise bicycle is eventually converted to heat through friction.
The comfort of the human body depends primarily on three environmen-tal factors: the temperature, relative humidity, and air motion. The temperatureof the environment is the single most important index of comfort. Extensiveresearch is done on human subjects to determine the “thermal comfort zone”and to identify the conditions under which the body feels comfortable in anenvironment. It has been observed that most normally clothed people restingor doing light work feel comfortable in the operative temperature (roughly,the average temperature of air and surrounding surfaces) range of 23 to 27°Cor 73 to 80°F (Fig. 21-5). For unclothed people, this range is 29 to 31°C. Rel-ative humidity also has a considerable effect on comfort since it is a measureof air’s ability to absorb moisture and thus it affects the amount of heat a bodycan dissipate by evaporation. High relative humidity slows down heat rejec-tion by evaporation, especially at high temperatures, and low relative humid-ity speeds it up. The desirable level of relative humidity is the broad range of30 to 70 percent, with 50 percent being the most desirable level. Most peopleat these conditions feel neither hot nor cold, and the body does not need to ac-tivate any of the defense mechanisms to maintain the normal body tempera-ture (Fig. 21-6).
21-4
CHAPTER 21Heating and Coolingof Buildings
TABLE 21-1
Metabolic rates during variousactivities (from ASHRAEHandbook of Fundamentals,Ref. 1, Chap. 8, Table 4).
Metabolicrate*
Activity W/m2
Resting:Sleeping 40Reclining 45Seated, quiet 60Standing, relaxed 70
Walking (on the level):2 mph (0.89 m/s) 1153 mph (1.34 m/s) 1504 mph (1.79 m/s) 220
Office Activities:Reading, seated 55Writing 60Typing 65Filing, seated 70Filing, standing 80Walking about 100Lifting/packing 120
Driving/Flying:Car 60–115Aircraft, routine 70Heavy vehicle 185
Miscellaneous Occupational Activities:Cooking 95–115Cleaning house 115–140Machine work:
Light 115–140Heavy 235
Handling 50-kg bags 235Pick and shovel work 235–280
Miscellaneous Leisure Activities:Dancing, social 140–255Calisthenics/exercise 175–235Tennis, singles 210–270Basketball 290–440Wrestling, competitive 410–505
*Multiply by 1.8 m2 to obtain metabolic ratesfor an average man. Multiply by 0.3171 toconvert to Btu/h · ft2.

Another factor that has a major effect on thermal comfort is excessive airmotion or draft, which causes undesired local cooling of the human body.Draft is identified by many as a most annoying factor in work places, auto-mobiles, and airplanes. Experiencing discomfort by draft is most commonamong people wearing indoor clothing and doing light sedentary work, andleast common among people with high activity levels. The air velocity shouldbe kept below 9 m/min (30 ft/min) in winter and 15 m/min (50 ft/min) in sum-mer to minimize discomfort by draft, especially when the air is cool. A lowlevel of air motion is desirable as it removes the warm, moist air that buildsaround the body and replaces it with fresh air. Therefore, air motion should bestrong enough to remove heat and moisture from the vicinity of the body, butgentle enough to be unnoticed. High speed air motion causes discomfort out-doors as well. For example, an environment at 10°C (50°F) with 48 km/hwinds feels as cold as an environment at �7°C (20°F) with 3 km/h winds be-cause of the chilling effect of the air motion (the wind-chill factor).
A comfort system should provide uniform conditions throughout theliving space to avoid discomfort caused by nonuniformities such as drafts,asymmetric thermal radiation, hot or cold floors, and vertical temperaturestratification. Asymmetric thermal radiation is caused by the cold surfacesof large windows, uninsulated walls, or cold products and the warm surfacesof gas or electric radiant heating panels on the walls or ceiling, solar-heatedmasonry walls or ceilings, and warm machinery. Asymmetric radiation causesdiscomfort by exposing different sides of the body to surfaces at different tem-peratures and thus to different heat loss or gain by radiation. A person whoseleft side is exposed to a cold window, for example, will feel like heat is beingdrained from that side of his or her body (Fig. 21-7). For thermal comfort, theradiant temperature asymmetry should not exceed 5°C in the vertical directionand 10°C in the horizontal direction. The unpleasant effect of radiation asym-metry can be minimized by properly sizing and installing heating panels, us-ing double-pane windows, and providing generous insulation at the walls andthe roof.
Direct contact with cold or hot floor surfaces also causes localized dis-comfort in the feet. The temperature of the floor depends on the way it is con-structed (being directly on the ground or on top of a heated room, being madeof wood or concrete, the use of insulation, etc.) as well as the floor coveringused such as pads, carpets, rugs, and linoleum. A floor temperature of 23 to25°C is found to be comfortable to most people. The floor asymmetry loses itssignificance for people with footwear. An effective and economical way ofraising the floor temperature is to use radiant heating panels instead of turningthe thermostat up. Another nonuniform condition that causes discomfort istemperature stratification in a room that exposes the head and the feet todifferent temperatures. For thermal comfort, the temperature difference be-tween the head and foot levels should not exceed 3°C. This effect can be min-imized by using destratification fans.
It should be noted that no thermal environment will please everyone. Nomatter what we do, some people will express some discomfort. The thermalcomfort zone is based on a 90 percent acceptance rate. That is, an environmentis deemed comfortable if only 10 percent of the people are dissatisfied with it.Metabolism decreases somewhat with age, but it has no effect on the comfortzone. Research indicates that there is no appreciable difference between theenvironments preferred by old and young people. Experiments also show thatmen and women prefer almost the same environment. The metabolism rate ofwomen is somewhat lower, but this is compensated by their slightly lower
21-5
Human Body andThermal Comfort
FIGURE 21-5
The effect of clothing on the environmenttemperature that feels comfortable
(1 clo � 0.155 m2 · °C/W �0.880 ft2 · °F · h/Btu) (from
ASHRAE Standard 55-1981).
Clo
thin
g in
sula
tion
(clo
)
2.0
1.5
1.0
0.5
064 68 72 76 80 84
20
°FOperative temperature
°C
Upper acceptability limit
Optimum
Lower acceptability limit
25 30
Summerclothing
Winterclothing
Heavyclothing
Sedentary50% RH
� ≤ 30 fpm(0.15 m/s)
FIGURE 21-6
A thermally comfortable environment.
23°C
RH = 50%
Air motion
5 m/min

skin temperature and evaporative loss. Also, there is no significant variationin the comfort zone from one part of the world to another and from winter tosummer. Therefore, the same thermal comfort conditions can be used through-out the world in any season. Also, people cannot acclimatize themselves toprefer different comfort conditions.
In a cold environment, the rate of heat loss from the body may exceedthe rate of metabolic heat generation. Average specific heat of the human bodyis 3.49 kJ/kg · °C, and thus each 1°C drop in body temperature corresponds toa deficit of 244 kJ in body heat content for an average 70 kg man. A drop of0.5°C in mean body temperature causes noticeable but acceptable discomfort.A drop of 2.6°C causes extreme discomfort. A sleeping person will wake upwhen his or her mean body temperature drops by 1.3°C (which normallyshows up as a 0.5°C drop in the deep body and 3°C in the skin area). The dropof deep body temperature below 35°C may damage the body temperature reg-ulation mechanism, while a drop below 28°C may be fatal. Sedentary peoplereported to feel comfortable at a mean skin temperature of 33.3°C, uncom-fortably cold at 31°C, shivering cold at 30°C, and extremely cold at 29°C.People doing heavy work reported to feel comfortable at much lower temper-atures, which shows that the activity level affects human performance andcomfort. The extremities of the body such as hands and feet are most easily af-fected by cold weather, and their temperature is a better indication of comfortand performance. A hand-skin temperature of 20°C is perceived to be uncom-fortably cold, 15°C to be extremely cold, and 5°C to be painfully cold. Usefulwork can be performed by hands without difficulty as long as the skin tem-perature of fingers remains above 16°C (ASHRAE Handbook of Fundamen-tals, Ref. 1, Chap. 8).
The first line of defense of the body against excessive heat loss in a coldenvironment is to reduce the skin temperature and thus the rate of heat lossfrom the skin by constricting the veins and decreasing the blood flow to theskin. This measure decreases the temperature of the tissues subjacent tothe skin, but maintains the inner body temperature. The next preventive mea-sure is increasing the rate of metabolic heat generation in the body by shiver-ing, unless the person does it voluntarily by increasing his or her level ofactivity or puts on additional clothing. Shivering begins slowly in small mus-cle groups and may double the rate of metabolic heat production of the bodyat its initial stages. In the extreme case of total body shivering, the rate of heatproduction may reach 6 times the resting levels (Fig. 21-8). If this measurealso proves inadequate, the deep body temperature starts falling. Body partsfurthest away from the core such as the hands and feet are at greatest dangerfor tissue damage.
In hot environments, the rate of heat loss from the body may drop belowthe metabolic heat generation rate. This time the body activates the oppositemechanisms. First the body increases the blood flow and thus heat transport tothe skin, causing the temperature of the skin and the subjacent tissues to riseand approach the deep body temperature. Under extreme heat conditions, theheart rate may reach 180 beats per minute in order to maintain adequate bloodsupply to the brain and the skin. At higher heart rates, the volumetric efficiencyof the heart drops because of the very short time between the beats to fill theheart with blood, and the blood supply to the skin and more importantly tothe brain drops. This causes the person to faint as a result of heat exhaustion.Dehydration makes the problem worse. A similar thing happens when aperson working very hard for a long time stops suddenly. The blood that hasflooded the skin has difficulty returning to the heart in this case since the
21-6
CHAPTER 21Heating and Coolingof Buildings
FIGURE 21-7
Cold surfaces cause excessive heat lossfrom the body by radiation, and thusdiscomfort on that side of the body.
Warmwall
RadiationRadiation
Coldwindow
FIGURE 21-8
The rate of metabolic heat generation maygo up by 6 times the resting level duringtotal body shivering in cold weather.
B r r r !
Shivering

relaxed muscles no longer force the blood back to the heart, and thus there isless blood available for pumping to the brain.
The next line of defense is releasing water from sweat glands and resort-ing to evaporative cooling, unless the person removes some clothing and re-duces the activity level (Fig. 21-9). The body can maintain its coretemperature at 37°C in this evaporative cooling mode indefinitely, even in en-vironments at higher temperatures (as high as 200°C during military en-durance tests), if the person drinks plenty of liquids to replenish his or herwater reserves and the ambient air is sufficiently dry to allow the sweat toevaporate instead of rolling down the skin. If this measure proves inadequate,the body will have to start absorbing the metabolic heat and the deep bodytemperature will rise. A person can tolerate a temperature rise of 1.4°C with-out major discomfort but may collapse when the temperature rise reaches2.8°C. People feel sluggish and their efficiency drops considerably when thecore body temperature rises above 39°C. A core temperature above 41°C maydamage hypothalamic proteins, resulting in cessation of sweating, increasedheat production by shivering, and a heat stroke with an irreversible and life-threatening damage. Death can occur above 43°C.
A surface temperature of 46°C causes pain on the skin. Therefore, directcontact with a metal block at this temperature or above is painful. However, aperson can stay in a room at 100°C for up to 30 min without any damage orpain on the skin because of the convective resistance at the skin surface andevaporative cooling. We can even put our hands into at oven at 200°C for ashort time without getting burned.
Another factor that affects thermal comfort, health, and productivity isventilation. Fresh outdoor air can be provided to a building naturally by do-ing nothing, or forcefully by a mechanical ventilation system. In the first case,which is the norm in residential buildings, the necessary ventilation is pro-vided by infiltration through cracks and leaks in the living space and by theopening of the windows and doors. The additional ventilation needed in thebathrooms and kitchens is provided by air vents with dampers or exhaust fans.With this kind of uncontrolled ventilation, however, the fresh air supply willbe either too high, wasting energy, or too low, causing poor indoor air quality.But the current practice is not likely to change for residential buildings sincethere is not a public outcry for energy waste or air quality, and thus it is diffi-cult to justify the cost and complexity of mechanical ventilation systems.
Mechanical ventilation systems are part of any heating and air condition-ing system in commercial buildings, providing the necessary amount of freshoutdoor air and distributing it uniformly throughout the building. This is notsurprising since many rooms in large commercial buildings have no windowsand thus rely on mechanical ventilation. Even the rooms with windows are inthe same situation since the windows are tightly sealed and cannot be openedin most buildings. It is not a good idea to oversize the ventilation system justto be on the “safe side” since exhausting the heated or cooled indoor airwastes energy. On the other hand, reducing the ventilation rates below the re-quired minimum to conserve energy should also be avoided so that the indoorair quality can be maintained at the required levels. The minimum fresh airventilation requirements are listed in Table 21-2. The values are based on con-trolling the CO2 and other contaminants with an adequate margin of safety,which requires each person be supplied with at least 7.5 L/s (15 ft3/min) offresh air.
Another function of the mechanical ventilation system is to clean the airby filtering it as it enters the building. Various types of filters are available for
21-7
Human Body andThermal Comfort
FIGURE 21-9
In hot environments, a body can dissipatea large amount of metabolic heat by
sweating since the sweat absorbsthe body heat and evaporates.
Evaporation
TABLE 21-2
Minimum fresh air requirementsin buildings (from ASHRAE
Standard 62-1989)Requirement
L/s ft3/minAppli- per per cation person person
Classrooms, laundries, libraries, supermarkets 8 15
Dining rooms, conference rooms, offices 10 20
Hospital rooms 13 25
Hotel rooms 15 30(per room) (per room)
Smoking lounges 30 60
Retail stores 1.0–1.5 0.2–0.3(per m2) (per ft2)
Residential 0.35 air change per buildings hour, but not less than
7.5 L/s (or 15 ft3/min)per person

this purpose, depending on the cleanliness requirements and the allowablepressure drop.
21-3 � HEAT TRANSFER FROM THE HUMAN BODY
The metabolic heat generated in the body is dissipated to the environmentthrough the skin and the lungs by convection and radiation as sensible heatand by evaporation as latent heat (Fig. 21-10). Latent heat represents the heatof vaporization of water as it evaporates in the lungs and on the skin by ab-sorbing body heat, and latent heat is released as the moisture condenses oncold surfaces. The warming of the inhaled air represents sensible heat transferin the lungs and is proportional to the temperature rise of inhaled air. The totalrate of heat loss from the body can be expressed as
Q·
body, total � Q·
skin � Q·
lungs
� (Q·
sensible � Q·
latent)skin � (Q·
sensible � Q·
latent)lungs (21-2)
� (Q·
convection � Q·
radiation � Q·
latent)skin � (Q·
convection � Q·
latent)lungs
Therefore, the determination of heat transfer from the body by analysis aloneis difficult. Clothing further complicates the heat transfer from the body, andthus we must rely on experimental data. Under steady conditions, the total rateof heat transfer from the body is equal to the rate of metabolic heat generationin the body, which varies from about 100 W for light office work to roughly1000 W during heavy physical work.
Sensible heat loss from the skin depends on the temperatures of the skin,the environment, and the surrounding surfaces as well as the air motion. Thelatent heat loss, on the other hand, depends on the skin wettedness and the rel-ative humidity of the environment as well. Clothing serves as insulation andreduces both the sensible and latent forms of heat loss. The heat transfer fromthe lungs through respiration obviously depends on the frequency of breathingand the volume of the lungs as well as the environmental factors that affectheat transfer from the skin.
Sensible heat from the clothed skin is first transferred to the clothing andthen from the clothing to the environment. The convection and radiation heatlosses from the outer surface of a clothed body can be expressed as
Q·
conv � hconv Aclothing(Tclothing � Tambient) (W)(21-3)
Q·
rad � hrad Aclothing(Tclothing � Tsurr) (21-4)
wherehconv � convection heat transfer coefficient, as given in Table 21-3hrad � radiation heat transfer coefficient, 4.7 W/m2 · °C for typical
indoor conditions; the emissivity is assumed to be 0.95,which is typical
Aclothing � outer surface area of a clothed personTclothing � average temperature of exposed skin and clothingTambient � ambient air temperature
Tsurr � average temperature of the surrounding surfaces
The convection heat transfer coefficients at 1 atm pressure are given in Table21-3. Convection coefficients at pressures P other than 1 atm are obtained bymultiplying the values at atmospheric pressure by P 0.55 where P is in atm.Also, it is recognized that the temperatures of different surfaces surrounding a
21-8
CHAPTER 21Heating and Coolingof Buildings
FIGURE 21-10
Mechanisms of heat loss from thehuman body and relative magnitudesfor a resting person.
Radiation40%
Conduction3%
Floor
Evaporation30%Convection
27%
Airmotion
TABLE 21-3
Convection heat transfer coefficientsfor a clothed body at 1 atm (� is inm/s) (compiled from various sources)
hconv,*Activity W/m2 · °C
Seated in air moving at 0 � � � 0.2 m/s 3.10.2 � � � 4 m/s 8.3� 0.6
Walking in still air at 0.5 � � � 2 m/s 8.6� 0.53
Walking on treadmill in still air at 0.5 � � � 2 m/s 6.5� 0.39
Standing in moving air at 0 � � � 0.15 m/s 4.00.15 � � � 1.5 m/s 14.8� 0.69
*At pressures other than 1 atm, multiply byP 0.55, where P is in atm.

person are probably different, and Tsurr represents the mean radiation tem-perature, which is the temperature of an imaginary isothermal enclosure inwhich radiation heat exchange with the human body equals the radiation heatexchange with the actual enclosure. Noting that most clothing and buildingmaterials are essentially black, the mean radiation temperature of an enclo-sure that consists of N surfaces at different temperatures can be determinedfrom
Tsurr � Fperson-1 T1 � Fperson-2 T2 � · · · · � Fperson-N TN (21-5)
where Ti is the temperature of the surface i and Fperson-i is the view factor be-tween the person and surface i.
Total sensible heat loss can also be expressed conveniently by combiningthe convection and radiation heat losses as
Q·
conv�rad � hcombined Aclothing (Tclothing � Toperative) (21-6)
� (hconv � hrad)Aclothing (Tclothing � Toperative)(W)
(21-7)
where the operative temperature Toperative is the average of the mean radiantand ambient temperatures weighed by their respective convection and radia-tion heat transfer coefficients and is expressed as (Fig. 21-11)
Toperative � � (21-8)
Note that the operative temperature will be the arithmetic average of the am-bient and surrounding surface temperatures when the convection and radiationheat transfer coefficients are equal to each other. Another environmental indexused in thermal comfort analysis is the effective temperature, which com-bines the effects of temperature and humidity. Two environments with thesame effective temperature will evoke the same thermal response in peopleeven though they are at different temperatures and humidities.
Heat transfer through the clothing can be expressed as
Q·
conv � rad � (21-9)
where Rclothing is the unit thermal resistance of clothing in m2 · °C/W, whichinvolves the combined effects of conduction, convection, and radiation be-tween the skin and the outer surface of clothing. The thermal resistance ofclothing is usually expressed in the unit clo where 1 clo � 0.155 m2 · °C/W �0.880 ft2 · °F · h/Btu. The thermal resistance of trousers, long-sleeve shirt,long-sleeve sweater, and T-shirt is 1.0 clo, or 0.155 m2 · °C/W. Summer cloth-ing such as light slacks and short-sleeved shirt has an insulation value of0.5 clo, whereas winter clothing such as heavy slacks, long-sleeve shirt, and asweater or jacket has an insulation value of 0.9 clo.
Then the total sensible heat loss can be expressed in terms of the skintemperature instead of the inconvenient clothing temperature as (Fig. 21-12)
Q·
conv � rad � (21-10)Aclothing (Tskin � Toperative)
Rclothing �1
hcombined
Aclothing (Tskin � Tclothing)
Rclothing
Tambient � Tsurr
2hconv Tambient � hrad Tsurr
hconv � hrad
21-9
Heat Transfer fromthe Human Body
FIGURE 21-11
Heat loss by convection and radiation fromthe body can be combined into a single
term by defining an equivalentoperative temperature.
Qconv + rad·
Toperative
(b) Convection and radiation, combined
Qrad·
Qconv·
Tsurr
Tambient
(a) Convection and radiation, separate
FIGURE 21-12
Simplified thermal resistance network forheat transfer from a clothed person.
Toperative
Tcloth
Rcombined
Rcloth
SkinTskin

At a state of thermal comfort, the average skin temperature of the body is ob-served to be 33°C (91.5°F). No discomfort is experienced as the skin temper-ature fluctuates by �1.5°C (2.5°F). This is the case whether the body isclothed or unclothed.
Evaporative or latent heat loss from the skin is proportional to the dif-ference between the water vapor pressure at the skin and the ambient air, andthe skin wettedness, which is a measure of the amount of moisture on the skin.It is due to the combined effects of the evaporation of sweat and the diffusionof water through the skin, and can be expressed as
Q·
latent � m· vapor hfg (21-11)
wherem· vapor � the rate of evaporation from the body, kg/s
hfg � the enthalpy of vaporization of water � 2430 kJ/kg at 30°C
Heat loss by evaporation is maximum when the skin is completely wetted.Also, clothing offers resistance to evaporation, and the rate of evaporation inclothed bodies depends on the moisture permeability of the clothes. The max-imum evaporation rate for an average man is about 1 L/h (0.3 g/s), which rep-resents an upper limit of 730 W for the evaporative cooling rate. A person canlose as much as 2 kg of water per hour during a workout on a hot day, but anyexcess sweat slides off the skin surface without evaporating (Fig. 21-13).
During respiration, the inhaled air enters at ambient conditions and ex-haled air leaves nearly saturated at a temperature close to the deep body tem-perature (Fig. 21-14). Therefore, the body loses both sensible heat byconvection and latent heat by evaporation from the lungs, and these can be ex-pressed as
Q·
conv, lungs � m· air, lungs Cp, air(Texhale � Tambient) (21-12)
Q·
latent, lungs � m· vapor, lungs hfg � m· air, lungs (wexhale � wambient)hfg (21-13)
wherem· air, lungs � rate of air intake to the lungs, kg/s
Cp, air � specific heat of air � 1.0 kJ/kg · °CTexhale � temperature of exhaled air
w � humidity ratio (the mass of moisture per unit mass of dry air)
The rate of air intake to the lungs is directly proportional to the metabolic rateQ·
met. The rate of total heat loss from the lungs through respiration can be ex-pressed approximately as
Q·
conv � latent, lungs � 0.0014Q·
met (34 � Tambient) � 0.0173Q·
met (5.87 � P�, ambient)
(21-14)
where P�, ambient is the vapor pressure of ambient air in kPa.The fraction of sensible heat varies from about 40 percent in the case of
heavy work to about 70 percent during light work. The rest of the energy is re-jected from the body by perspiration in the form of latent heat.
EXAMPLE 21-1 Effect of Clothing on Thermal ComfortIt is well established that a clothed or unclothed person feels comfortable whenthe skin temperature is about 33°C. Consider an average man wearing summerclothes whose thermal resistance is 0.6 clo. The man feels very comfortable whilestanding in a room maintained at 22°C. The air motion in the room is negligible,and the interior surface temperature of the room is about the same as the air
21-10
CHAPTER 21Heating and Coolingof Buildings
FIGURE 21-13
An average person can lose heat at a rateof up to 730 W by evaporation.
Watervapor
mvapor, max = 0.3 g/s·
= mlatent, max hfg @ 30°C
= (0.3 g/s)(2430 kJ/kg)
= 730 W
Qlatent, max· ·
FIGURE 21-14
Part of the metabolic heat generated in thebody is rejected to the air from the lungsduring respiration.
Lungs
Heat andmoisture
Coolambient air
20°C
Warm and moistexhaled air
35°C
37°C

temperature. If this man were to stand in that room unclothed, determine thetemperature at which the room must be maintained for him to feel thermallycomfortable.
Solution A man wearing summer clothes feels comfortable in a room at 22°C.The room temperature at which this man would feel thermally comfortable whenunclothed is to be determined.
Assumptions 1 Steady conditions exist. 2 The latent heat loss from the personremains the same. 3 The heat transfer coefficients remain the same.
Analysis The body loses heat in sensible and latent forms, and the sensible heatconsists of convection and radiation heat transfer. At low air velocities, the con-vection heat transfer coefficient for a standing man is given in Table 21-3 to be4.0 W/m2 · °C. The radiation heat transfer coefficient at typical indoor conditions is4.7 W/m2 · °C. Therefore, the surface heat transfer coefficient for a standing per-son for combined convection and radiation is
hcombined � hconv � hrad � 4.0 � 4.7 � 8.7 W/m2 · °C
The thermal resistance of the clothing is given to be
Rclothing � 0.6 clo � 0.6 � 0.155 m2 · °C/W � 0.093 m2 · °C/W
Noting that the surface area of an average man is 1.8 m2, the sensible heat lossfrom this person when clothed is determined to be (Fig. 21-15)
Q· sensible, clothed � � 95.2 W
From a heat transfer point of view, taking the clothes off is equivalent to removingthe clothing insulation or setting Rcloth � 0. The heat transfer in this case can beexpressed as
Q· sensible, unclothed �
To maintain thermal comfort after taking the clothes off, the skin temperature of theperson and the rate of heat transfer from him must remain the same. Then settingthe equation above equal to 95.2 W gives
Tambient � 26.9°C
Therefore, the air temperature needs to be raised from 22 to 26.9°C to ensure thatthe person will feel comfortable in the room after he takes his clothes off (Fig.21-16). Note that the effect of clothing on latent heat is assumed to be negligiblein the solution above. We also assumed the surface area of the clothed and un-clothed person to be the same for simplicity, and these two effects should coun-teract each other.
21-4 � DESIGN CONDITIONS FOR HEATING AND COOLING
The size of a heating or cooling system for a building is determined on thebasis of the desired indoor conditions that must be maintained based on theoutdoor conditions that exist at that location. The desirable ranges of temper-atures, humidities, and ventilation rates (the thermal comfort zone) discussedearlier constitute the typical indoor design conditions, and they remain fairlyconstant. For example, the recommended indoor temperature for general com-fort heating is 22°C (or 72°F). The outdoor conditions at a location, on theother hand, vary greatly from year to year, month to month, and even hour tohour. The set of extreme outdoor conditions under which a heating or cooling
A(Tskin � Tambient)1
hcombined
�(1.8 m2)(33 � Tambient)°C
18.7 W/m2 · °C
A(Tskin � Tambient)
Rclothing �1
hcombined
�(1.8 m2)(33 � 22)°C
0.093 m2 · °C/ W �1
8.7 W/m2 · °C
21-11
Design Conditionsfor Heating and
Cooling
FIGURE 21-15
Schematic for Example 21-1.
33°C
22°C22°C
FIGURE 21-16
Clothing serves as insulation, and the roomtemperature needs to be raised when a
person is unclothed to maintainthe same comfort level.
Troom = 22°C Troom = 27°C
Tskin = 33°C
Unclothedperson
Clothedperson
Tskin = 33°C

system must be able to maintain a building at the indoor design conditions iscalled the outdoor design conditions (Fig. 21-17).
When designing a heating, ventilating, and air-conditioning (HVAC) sys-tem, perhaps the first thought that comes to mind is to select a system that islarge enough to keep the indoors at the desired conditions at all times even un-der the worst weather conditions. But sizing an HVAC system on the basis ofthe most extreme weather on record is not practical since such an oversizedsystem will have a higher initial cost, will occupy more space, and will prob-ably have a higher operating cost because the equipment in this case will runat partial load most of time and thus at a lower efficiency. Most people wouldnot mind experiencing an occasional slight discomfort under extreme weatherconditions if it means a significant reduction in the initial and operating costsof the heating or cooling system. The question that arises naturally is what isa good compromise between economics and comfort?
To answer this question, we need to know what the weather will be like inthe future. But even the best weather forecasters cannot help us with that.Therefore, we turn to the past instead of the future and bet that the pastweather data averaged over several years will be representative of a typicalyear in the future. The weather data in Tables 21-4 and 21-5 are based on therecords of numerous weather stations in the United States that recorded vari-ous weather data in hourly intervals. For ordinary buildings, it turns out thatthe economics and comfort meet at the 97.5 percent level in winter. That is,the heating system will provide thermal comfort 97.5 percent of the time butmay fail to do so during 2.5 percent of the time (Fig. 21-18). For example, the97.5 percent winter design temperature for Denver, Colorado, is �17°C, andthus the temperatures in Denver may fall below �17°C about 2.5 percent ofthe time during winter months in a typical year. Critical applications such ashealth care facilities and certain process industries may require the more strin-gent 99 percent level.
Table 21-4 lists the outdoor design conditions for both cases as well assummer comfort levels. The winter percentages are based on the weather datafor the months of December, January, and February while the summer per-centages are based on the four months June through September. The threewinter months have a total of 31 � 31 � 28 � 90 days and thus 2160 hours.Therefore, the conditions of a house whose heating system is based on the97.5 percent level may fall below the comfort level for 2160 � 2.5% �54 hours during the heating season of a typical year. However, most peoplewill not even notice it because everything in the house will start giving offheat as soon as the temperature drops below the thermostat setting. This is es-pecially the case in buildings with large thermal masses. The minimum tem-peratures usually occur between 6:00 AM and 8:00 AM solar time, and thuscommercial buildings that open late (such as shopping centers) may even useless stringent outdoor design conditions (such as the 95 percent level) for theirheating systems. This is also the case with the cooling systems of residencesthat are unoccupied during the maximum temperatures, which occur between2:00 PM and 4:00 PM solar time in the summer.
The heating or cooling loads of a building represent the heat that must besupplied to or removed from the interior of a building to maintain it at the de-sired conditions. A distinction should be made between the design load andthe actual load of heating or cooling systems. The design (or peak) heatingload is usually determined with a steady-state analysis using the design con-ditions for the indoors and the outdoors for the purpose of sizing the heatingsystem (Fig. 21-19). This ensures that the system has the required capacity to
21-12
CHAPTER 21Heating and Coolingof Buildings
FIGURE 21-17
The size of a heating system is determinedon the basis of heat loss during indoor andoutdoor design conditions.
Dallas, Texas
Outdoors(winter design)
–6°C
24 km/h winds
Indoors22°C
FIGURE 21-18
The 97.5 percent winter designtemperature represents the outdoortemperature that will be exceeded during97.5 percent of the time in winter.
SALT LAKE CITY, UTAH
97.5% Winter design temp � �13°CNo. of hours during winter (Dec., Jan.,and Feb.) � 90 � 24 � 2160 hoursTherefore,
Toutdoor �
�
�13°C for 2106 h (97.5%)
�13°C for 54 h (2.5%)
FIGURE 21-19
The design heat load of a buildingrepresents the heat loss of a buildingduring design conditions at the indoorsand the outdoors.
Dallas, Texas
Outdoors winterdesign conditions
–6°C
24 km/h
Indoors22°C
Qdesign·

perform adequately at the anticipated worst conditions. But the energy use ofa building during a heating or cooling season is determined on the basis of theactual heating or cooling load, which varies throughout the day.
TABLE 21-4
Weather data for selected cities in the United States (from ASHRAE Handbook of Fundamentals, Ref. 1, Chap. 24, Table 1)Elevation Winter Summer
WetDry bulb, bulb, Daily
99% 97 % 2 % 2 % range
State and station ft m °F °C °F °C °F °C °F °C °F °C
Alabama, Birmingham AP 610 186 17 �8 21 �6 94 34 75 24 21 12Alaska, Anchorage AP 90 27 �23 �31 �18 �28 68 20 58 14 15 8Arizona, Tucson AP 2584 788 28 �2 32 0 102 39 66 19 26 14Arkansas, Little Rock AP 257 78.3 15 �9 20 �7 96 36 77 25 22 12California, San Francisco AP 8 2.4 35 2 38 3 77 25 63 17 20 11Colorado, Denver AP 5283 1610 �5 �21 1 �17 91 33 59 15 28 16Connecticut, Bridgeport AP 7 2.1 �6 �21 9 �13 84 29 71 22 18 10Delaware, Wilmington AP 78 24 10 �12 14 �10 89 32 74 23 20 11Florida, Tallahassee AP 58 18 27 �3 30 �1 92 33 76 24 19 11Georgia, Atlanta AP 1005 306 17 �8 22 �6 92 33 74 23 19 11Hawaii, Honolulu AP 7 2.1 62 17 63 17 86 30 73 23 12 7Idaho, Boise AP 2842 866 3 �16 10 �12 94 34 64 18 31 17Illinois, Chicago O’Hare AP 658 201 �8 �22 �4 �20 89 32 74 23 20 11Indiana, Indianapolis AP 793 242 �2 �19 2 �17 90 32 74 23 22 12Iowa, Sioux City AP 1095 334 �11 �24 �7 �22 92 33 74 23 24 13Kansas, Wichita AP 1321 403 3 �16 7 �14 98 37 73 23 23 13Kentucky, Louisville AP 474 144 5 �15 10 �12 93 34 75 24 23 13Louisiana, Shreveport AP 252 76.8 20 �7 25 �4 96 36 76 24 20 11Maryland, Baltimore AP 146 44.5 10 �12 13 �11 91 33 75 24 21 12Massachusetts, Boston AP 15 4.6 �6 �14 9 �13 88 31 71 22 16 9Michigan, Lansing AP 852 260 �3 �19 1 �17 87 31 72 22 24 13Minnesota, Minneapolis/St. Paul 822 251 �16 �27 �12 �24 89 32 73 23 22 12Mississippi, Jackson AP 330 101 21 �6 25 �4 95 35 76 24 21 12Missouri, Kansas City AP 742 226 2 �17 6 �14 96 36 74 23 20 11Montana, Billings AP 3567 1087 �15 �26 �10 �23 91 33 64 18 31 17Nebraska, Lincoln CO 1150 351 �5 �21 �2 �19 95 35 74 23 24 13Nevada, Las Vegas AP 2162 659 25 �4 28 �12 106 41 65 18 30 17New Mexico, Albuquerque AP 5310 1618 12 �11 16 �9 94 34 61 16 30 17New York, Syracuse AP 424 129 �3 �19 2 �17 87 31 71 22 20 11North Carolina, Charlotte AP 735 224 18 �8 22 �6 93 34 74 23 20 11Ohio, Cleveland AP 777 237 1 �17 5 �15 88 31 72 22 22 12Oklahoma, Stillwater 884 269 8 �13 13 �11 96 36 74 23 24 13Oregon, Pendleton AP 1492 455 �2 �19 5 �15 93 34 64 18 29 16Pennsylvania, Pittsburgh AP 1137 347 1 �17 5 �15 86 30 71 22 22 12South Carolina, Charleston AFB 41 12 24 �4 27 �3 91 33 78 26 18 10Tennessee, Memphis AP 263 80.2 13 �11 18 �8 95 35 76 24 21 12Texas, Dallas AP 481 147 18 �8 22 �6 100 38 75 24 20 11Utah, Salt Lake City 4220 1286 3 �16 8 �13 95 35 62 17 32 18Virginia, Norfolk AP 26 7.9 20 �7 22 �6 91 33 76 24 18 10Washington, Spokane AP 2357 718 �6 �21 2 �17 90 32 63 17 28 16
12
12
12
21-13

21-14
TABLE 21-5
Average winter temperatures and number of degree-days for selected cities in the United States (from ASHRAE Handbook of Systems, 1980)Averagewintertemp. Degree-days,* °F-day Yearly
State and station °F °C July Aug. Sep. Oct. Nov. Dec. Jan. Feb. March April May June total
Alabama, Birmingham 54.2 12.7 0 0 6 93 363 555 592 462 363 108 9 0 2551Alaska, Anchorage 23.0 5.0 245 291 516 930 1284 1572 1631 1316 1293 879 592 315 10,864Arizona, Tucson 58.1 14.8 0 0 0 25 231 406 471 344 242 75 6 0 1800California, San Francisco 53.4 12.2 82 78 60 143 306 462 508 395 363 279 214 126 3015Colorado, Denver 37.6 3.44 6 9 117 428 819 1035 1132 938 887 558 288 66 6283Florida, Tallahassee 60.1 15.9 0 0 0 28 198 360 375 286 202 86 0 0 1485Georgia, Atlanta 51.7 11.28 0 0 18 124 417 648 636 518 428 147 25 0 2961Hawaii, Honolulu 74.2 23.8 0 0 0 0 0 0 0 0 0 0 0 0 0Idaho, Boise 39.7 4.61 0 0 132 415 792 1017 1113 854 722 438 245 81 5809Illinois, Chicago 35.8 2.44 0 12 117 381 807 1166 1265 1086 939 534 260 72 6639Indiana, Indianapolis 39.6 4.56 0 0 90 316 723 1051 1113 949 809 432 177 39 5699Iowa, Sioux City 43.0 1.10 0 9 108 369 867 1240 1435 1198 989 483 214 39 6951Kansas, Wichita 44.2 7.11 0 0 33 229 618 905 1023 804 645 270 87 6 4620Kentucky, Louisville 44.0 6.70 0 0 54 248 609 890 930 818 682 315 105 9 4660Louisiana, Shreveport 56.2 13.8 0 0 0 47 297 477 552 426 304 81 0 0 2184Maryland, Baltimore 43.7 6.83 0 0 48 264 585 905 936 820 679 327 90 0 4654Massachusetts, Boston 40.0 4.40 0 9 60 316 603 983 1088 972 846 513 208 36 5634Michigan, Lansing 34.8 1.89 6 22 138 431 813 1163 1262 1142 1011 579 273 69 6909Minnesota, Minneapolis 28.3 �1.72 22 31 189 505 1014 1454 1631 1380 1166 621 288 81 8382Montana, Billings 34.5 1.72 6 15 186 487 897 1135 1296 1100 970 570 285 102 7049Nebraska, Lincoln 38.8 4.11 0 6 75 301 726 1066 1237 1016 834 402 171 30 5864Nevada, Las Vegas 53.5 12.28 0 0 0 78 387 617 688 487 335 111 6 0 2709New York, Syracuse 35.2 2.11 6 28 132 415 744 1153 1271 1140 1004 570 248 45 6756North Carolina, Charlotte 50.4 10.56 0 0 6 124 438 691 691 582 481 156 22 0 3191Ohio, Cleveland 37.2 3.22 9 25 105 384 738 1088 1159 1047 918 552 260 66 6351Oklahoma, Stillwater 48.3 9.39 0 0 15 164 498 766 868 664 527 189 34 0 3725Pennsylvania, Pittsburgh 38.4 3.89 0 9 105 375 726 1063 1119 1002 874 480 195 39 5987Tennessee, Memphis 50.5 10.6 0 0 18 130 447 698 729 585 456 147 22 0 3232Texas, Dallas 55.3 13.3 0 0 0 62 321 524 601 440 319 90 6 0 2363Utah, Salt Lake City 38.4 3.89 0 0 81 419 849 1082 1172 910 763 459 233 84 6052Virginia, Norfolk 49.2 9.89 0 0 0 136 408 698 738 655 533 216 37 0 3421Washington, Spokane 36.5 2.83 9 25 168 493 879 1082 1231 980 834 531 288 135 6655
*Based on degrees F; quantities may be converted to degree days based on degrees C by dividing by 1.8. This assumes 18°C corresponds to 65°F.

The internal heat load (the heat dissipated off by people, lights, and ap-pliances in a building) is usually not considered in the determination of the de-sign heating load but is considered in the determination of the design coolingload. This is to ensure that the heating system selected can heat the buildingeven when there is no contribution from people or appliances, and the coolingsystem is capable of cooling it even when the heat given off by people and ap-pliances is at its highest level.
Wind increases heat transfer to or from the walls, roof, and windows of abuilding by increasing the convection heat transfer coefficient and also in-creasing the infiltration. Therefore, wind speed is another consideration whendetermining the heating and cooling loads. The recommended values of windspeed to be considered are 15 mph (6.7 m/s) for winter and 7.5 mph (3.4 m/s)for summer. The corresponding design values recommended by ASHRAE forheat transfer coefficients for combined convection and radiation on the outersurface of a building are
ho, winter � 34.0 W/m2 · °C � 6.0 Btu/h · ft2 · °F
ho, summer � 22.7 W/m2 · °C � 4.0 Btu/h · ft2 · °F
The recommended heat transfer coefficient value for the interior surfaces of abuilding for both summer and winter is (Fig. 21-20)
hi � 8.29 W/m2 · °C � 1.46 Btu/h · ft2 · °F
For well-insulated buildings, the surface heat transfer coefficients constitute asmall part of the overall heat transfer coefficients, and thus the effect of pos-sible deviations from the above values is usually insignificant.
In summer, the moisture level of the outdoor air is much higher than thatof indoor air. Therefore, the excess moisture that enters a house from the out-side with infiltrating air needs to be condensed and removed by the coolingsystem. But this requires the removal of the latent heat from the moisture, andthe cooling system must be large enough to handle this excess cooling load.To size the cooling system properly, we need to know the moisture level of theoutdoor air at design conditions. This is usually done by specifying the wet-bulb temperature, which is a good indicator of the amount of moisture in theair. The moisture level of the cold outside air is very low in winter, and thusnormally it does not affect the heating load of a building.
Solar radiation plays a major role on the heating and cooling of build-ings, and you may think that it should be an important consideration in theevaluation of the design heating and cooling loads. Well, it turns out that peakheating loads usually occur early in the mornings just before sunrise. There-fore, solar radiation does not affect the peak or design heating load and thusthe size of a heating system. However, it has a major effect on the actual heat-ing load, and solar radiation can reduce the annual heating energy consump-tion of a building considerably.
EXAMPLE 21-2 Summer and Winter Design Conditions for AtlantaDetermine the outdoor design conditions for Atlanta, Georgia, for summer for the2.5 percent level and for winter for the 97.5 percent and 99 percent levels.
Solution The climatic conditions for major cities in the United States are listedin Table 21-4, and for the indicated design levels we read
21-15
Design Conditionsfor Heating and
Cooling
FIGURE 21-20
Recommended winter design values forheat transfer coefficients for combined
convection and radiation on the outerand inner surfaces of a building.
ho = 34W——–
m2·°Chi = 8.29
W——–m2·°C
Wall
OutdoorsIndoors

Winter: Toutdoor � �6°C (97.5 percent level)
Winter: Toutdoor � �8°C (99 percent level)
Summer: Toutdoor � 33°C
Twet-bulb � 23°C (2.5 percent level)
Therefore, the heating and cooling systems in Atlanta for common applicationsshould be sized for these outdoor conditions. Note that when the wet-bulb andambient temperatures are available, the relative humidity and the humidity ratio ofair can be determined from the psychrometric chart (Fig. 21-21).
Sol-Air Temperature
The sun is the main heat source of the earth, and without the sun, the environ-ment temperature would not be much higher than the deep space temperatureof �270°C. The solar energy stored in the atmospheric air, the ground, and thestructures such as buildings during the day is slowly released at night, andthus the variation of the outdoor temperature is governed by the incident solarradiation and the thermal inertia of the earth. Heat gain from the sun is theprimary reason for installing cooling systems, and thus solar radiation has amajor effect on the peak or design cooling load of a building, which usuallyoccurs early in the afternoon as a result of the solar radiation entering throughthe glazing directly and the radiation absorbed by the walls and the roof thatis released later in the day.
The effect of solar radiation for glazing such as windows is expressed interms of the solar heat gain factor (SHGF), discussed later in this chapter. Foropaque surfaces such as the walls and the roof, on the other hand, the effect ofsolar radiation is conveniently accounted for by considering the outside tem-perature to be higher by an amount equivalent to the effect of solar radiation.This is done by replacing the ambient temperature in the heat transfer relationthrough the walls and the roof by the sol-air temperature, which is definedas the equivalent outdoor air temperature that gives the same rate of heattransfer to a surface as would the combination of incident solar radiation,convection with the ambient air, and radiation exchange with the sky and thesurrounding surfaces (Fig. 21-22).
Heat flow into an exterior surface of a building subjected to solar radia-tion can be expressed as
Q·
surface � Q·
conv � rad � Q·
solar � Q·
radiation correction
� ho A(Tambient � Tsurface) � s Aq· solar � �A�(T 4ambient � T 4
surr) (21-15)
� ho A(Tsol-air � Tsurface)
where s is the solar absorptivity and � is the emissivity of the surface, ho isthe combined convection and radiation heat transfer coefficient, q· solar is thesolar radiation incident on the surface (in W/m2 or Btu/h · ft2) and
Tsol-air � Tambient � (21-16)
is the sol-air temperature. The first term in Equation 21-15 represents theconvection and radiation heat transfer to the surface when the average sur-rounding surface and sky temperature is equal to the ambient air temperature,Tsurr � Tambient, and the last term represents the correction for the radiation heattransfer when Tsurr Tambient. The last term in the sol-air temperature relationrepresents the equivalent change in the ambient temperature corresponding to
s q·solar
ho�
��(T 4ambient � T 4
surr)ho
21-16
CHAPTER 21Heating and Coolingof Buildings
FIGURE 21-21
Determination of the relative humidityand the humidity ratio of air from thepsychrometric chart when the wet-bulband ambient temperatures are given.
φ =co
nst.
Satura
tion
line,
φ =10
0%
Spec
ific
hum
idity
, ω
Dry-bulb temperature
ω = const.
Tdb
= c
onst
.
Twb = const.
FIGURE 21-22
The sol-air temperature represents theequivalent outdoor air temperature thatgives the same rate of heat flow to asurface as would the combination ofincident solar radiation and convection/radiation with the environment.
Indoors
(b) Idealized case (no sun)
Ti
Ts
Qb = ho A(Tsol-air – Ts)·
ho
Tsol-air = To + Solar effect
Indoors
(a) Actual case
Sun
Ti
Ts
Qa = ho A(To – Ts)·
Qsolar·
ho
To
= Qa + Qsolar· ·

this radiation correction effect and ranges from about zero for vertical wallsurfaces to 4°C (or 7°F) for horizontal or inclined roof surfaces facing the sky.This difference is due to the low effective sky temperature.
The sol-air temperature for a surface obviously depends on the absorptiv-ity of the surface for solar radiation, which is listed in Table 21-6 for commonexterior surfaces. Being conservative and taking ho � 17 W/m2 · °C �3.0 Btu/h · ft2 · °F, the summer design values of the ratio s/ho for light- anddark-colored surfaces are determined to be (Fig. 21-23)
� 0.026 m2 · °C/W � 0.15 h · ft2 · °F/Btu
� 0.052 m2 · °C/W � 0.30 h · ft2 · °F/Btu
where we have assumed conservative values of 0.45 and 0.90 for the solar ab-sorptivities of light- and dark-colored surfaces, respectively. The sol-air tem-peratures for light- and dark-colored surfaces are listed in Table 21-7 for July21 at 40° N latitude versus solar time. Sol-air temperatures for other dates andlatitudes can be determined from Equation 21-16 by using appropriate tem-perature and incident solar radiation data.
Once the sol-air temperature is available, heat transfer through a wall (orsimilarly through a roof) can be expressed as
Q·
wall � UA(Tsol-air � Tinside) (21-17)
where A is the wall area and U is the overall heat transfer coefficient ofthe wall. Therefore, the rate of heat transfer through the wall will go up by UAfor each degree rise in equivalent outdoor temperature due to solar radiation.Noting that the temperature rise due to solar radiation is
�Tsolar � (21-18)
the rate of additional heat gain through the wall becomes
Q·
wall, solar � UA�Tsolar � UA (21-19)
The total solar radiation incident on the entire wall is Q·
solar � Aq· solar. There-fore, the fraction of incident solar heat transferred to the interior of thehouse is
Solar fraction transferred � (21-20)Q· wall, solar
Q· solar
�Q· wall, solar
Aq· solar� U
s
ho
s q· solar
ho
s q· solar
ho
�s
ho�
dark�
0.9017 W/m2 · °C
�s
ho�
light�
0.4517 W/m2 · °C
21-17
Design Conditionsfor Heating and
Cooling
FIGURE 21-23
Dark-colored buildings absorb most of theincident solar radiation whereas light-colored ones reflect most of it.(b) Light-colored wall
90 W/m2
(absorbed)45 W/m2
(absorbed)
55 W/m2
(reflected)
100 W/m2100 W/m2
10 W/m2
(reflected)
(a) Dark-colored wall
Sun
αs = 0.9
Sun
αs = 0.45
TABLE 21-6
The reflectivity �s and absorptivity sof common exterior surfaces for
solar radiation (from Kreiderand Rabl, Ref. 3, Table 6.1)
Surface �s s
Natural SurfacesFresh snow 0.75 0.25Soils (clay, loam, etc.) 0.14 0.86Water 0.07 0.93
Artificial SurfacesBituminous and
gravel roof 0.13 0.87Blacktop, old 0.10 0.90Dark building surfaces
(red brick, dark paints, etc.) 0.27 0.73
Light building surfaces (light brick, light paints, etc.) 0.60 0.40
New concrete 0.35 0.65Old concrete 0.25 0.75Crushed rock surface 0.20 0.80Earth roads 0.04 0.96
VegetationConiferous forest (winter) 0.07 0.93Dead leaves 0.30 0.70Forests in autumn, ripe
field crops, plants, green grass 0.26 0.74
Dry grass 0.20 0.80

EXAMPLE 21-3 Effect of Solar Heated Walls on Design Heat LoadThe west masonry wall of a house is made of 4-in. thick red face brick, 4-in.-thickcommon brick, -in.-thick air space, and -in. thick gypsum board, and its overall1
234
TABLE 21-7
Sol-air temperatures for July 21 at 40° latitude (from ASHRAE Handbook of Fundamentals, Ref. 1, Chap. 26, Table 1)(a) SI units
Light-colored surface, Dark-colored surface,/ho � 0.026 m2 · °C/W /ho � 0.052 m2 · °C/WAir Air
Solar temp., Solar temp.,time °C N NE E SE S SW W NW Horiz. time °C N NE E SE S SW W NW Horiz.
5 24.0 24.1 24.2 24.2 24.1 24.0 24.0 24.0 24.0 20.1 5 24.0 24.2 24.4 24.3 24.1 24.0 24.0 24.0 24.0 20.2
6 24.2 27.2 34.5 35.5 29.8 25.1 25.1 25.1 25.1 22.9 6 24.2 30.2 44.7 46.7 35.4 26.0 26.0 26.0 26.0 25.5
7 24.8 27.3 38.1 41.5 35.2 26.5 26.4 26.4 26.4 28.1 7 24.8 29.7 51.5 58.2 45.6 28.2 28.0 28.0 28.0 35.4
8 25.8 28.1 38.0 43.5 38.9 28.2 28.0 28.0 28.0 33.8 8 25.8 30.5 50.1 61.2 52.1 30.7 30.1 30.1 30.1 45.8
9 27.2 29.9 35.9 43.1 41.2 31.5 29.8 29.8 29.8 39.2 9 27.2 32.5 44.5 58.9 55.1 35.8 32.3 32.3 32.3 55.1
10 28.8 31.7 33.4 40.8 41.8 35.4 31.8 31.7 31.7 43.9 10 28.8 34.5 38.0 52.8 54.9 42.0 34.7 34.5 34.5 62.8
11 30.7 33.7 34.0 37.4 41.1 39.0 34.2 33.7 33.7 47.7 11 30.7 36.8 37.2 44.0 51.5 47.4 37.7 36.8 36.8 68.5
12 32.5 35.6 35.6 35.9 39.1 41.4 39.1 35.9 35.6 50.1 12 32.5 38.7 38.7 39.3 45.7 50.4 45.7 39.3 38.7 71.6
13 33.8 36.8 36.8 36.8 37.3 42.1 44.2 40.5 37.1 50.8 13 33.8 39.9 39.9 39.9 40.8 50.5 54.6 47.1 40.3 71.6
14 34.7 37.6 37.6 37.6 37.7 41.3 47.7 46.7 39.3 49.8 14 34.7 40.4 40.4 40.4 40.6 47.9 60.8 58.7 43.9 68.7
15 35.0 37.7 37.6 37.6 37.6 39.3 49.0 50.9 43.7 47.0 15 35.0 40.3 40.1 40.1 40.1 43.6 62.9 66.7 52.3 62.9
16 34.7 37.0 36.9 36.9 36.9 37.1 47.8 52.4 46.9 42.7 16 34.7 39.4 39.0 39.0 39.0 39.6 61.0 70.1 59.0 54.7
17 33.9 36.4 35.5 35.5 35.5 35.6 44.3 50.6 47.2 37.2 17 33.9 38.8 37.1 37.1 37.1 37.3 54.7 67.3 60.6 44.5
18 32.7 35.7 33.6 33.6 33.6 33.6 38.3 44.0 43.0 31.4 18 32.7 38.7 34.5 34.5 34.5 34.5 43.9 55.2 53.2 34.0
19 31.3 31.4 31.3 31.3 31.3 31.3 31.4 31.5 31.5 27.4 19 31.3 31.5 31.3 31.3 31.3 31.3 31.4 31.6 31.7 27.5
20 29.8 29.8 29.8 29.8 29.8 29.8 29.8 29.8 29.8 25.9 20 29.8 29.8 29.8 29.8 29.8 29.8 29.8 29.8 29.8 25.9
Avg. 29.0 30.0 32.0 33.0 32.0 31.0 32.0 33.0 32.0 32.0 Avg. 29.0 32.0 35.0 37.0 37.0 34.0 37.0 37.0 35.0 40.0
(b) English unitsLight-colored surface, Dark-colored surface,
/ho � 0.15 h · ft2 · °F/Btu /ho � 0.30 h · ft2 · °F/BtuAir AirSolar temp., Solar temp.,time °F N NE E SE S SW W NW Horiz. time °F N NE E SE S SW W NW Horiz.
5 74 74 74 74 74 74 74 74 74 67 5 74 74 75 75 74 74 74 74 74 67
6 74 80 93 95 84 76 76 76 76 72 6 74 85 112 115 94 77 77 77 77 77
7 75 80 99 106 94 78 78 78 78 81 7 75 84 124 136 113 81 81 81 81 94
8 77 81 99 109 101 82 81 81 81 92 8 77 85 121 142 125 86 85 85 85 114
9 80 85 96 109 106 88 85 85 85 102 9 80 90 112 138 131 96 89 89 89 131
10 83 88 91 105 107 95 88 88 88 111 10 83 94 100 127 131 107 94 94 94 145
11 87 93 93 99 106 102 93 93 93 118 11 87 98 99 111 125 118 100 98 98 156
12 90 96 96 96 102 106 102 96 96 122 12 90 101 101 102 114 123 114 102 101 162
13 93 99 99 99 99 108 112 105 99 124 13 93 104 104 104 106 124 131 117 105 162
14 94 99 99 99 99 106 118 116 102 122 14 94 105 105 105 105 118 142 138 111 156
15 95 100 100 100 100 103 121 124 111 117 15 95 105 104 104 104 111 146 153 127 146
16 94 98 98 98 98 99 118 126 116 109 16 94 102 102 102 102 103 142 159 138 131
17 93 98 96 96 96 96 112 124 117 99 17 93 102 99 99 99 99 131 154 142 112
18 91 97 93 93 93 93 101 112 110 89 18 91 102 94 94 94 94 111 132 129 94
19 87 87 87 87 87 87 87 87 87 80 19 87 87 87 87 87 87 87 88 88 80
20 85 85 85 85 85 85 85 85 85 78 20 85 85 85 85 85 85 85 85 85 78
Avg. 83 86 88 90 90 87 90 90 88 90 Avg. 83 89 94 99 97 93 97 99 94 104
Note: Sol-air temperatures are calculated based on a radiation correction of 7°F (3.9°C) for horizontal surfaces and 0°F (0°C) for verticalsurfaces.
21-18

heat transfer coefficient is 0.29 Btu/h · ft2 · °F, which includes the effects of con-vection on both the interior and exterior surfaces (Fig. 21-24). The house is lo-cated at 40° N latitude, and its cooling system is to be sized on the basis of theheat gain at 15:00 hour (3 PM) solar time on July 21. The interior of the house is tobe maintained at 75°F, and the exposed surface area of the wall is 210 ft2. If thedesign ambient air temperature at that time at that location is 90°F, determine(a) the design heat gain through the wall, (b) the fraction of this heat gain due tosolar heating, and (c) the fraction of incident solar radiation transferred into thehouse through the wall.
Solution The west wall of a house is subjected to solar radiation at summerdesign conditions. The design heat gain, the fraction of heat gain due to solarheating, and the fraction of solar radiation that is transferred to the house are tobe determined.
Assumptions 1 Steady conditions exist. 2 Thermal properties of the wall and theheat transfer coefficients are constant.
Properties The overall heat transfer coefficient of the wall is given to be0.29 Btu/h · ft2 · °F.
Analysis (a) The house is located at 40° N latitude, and thus we can use thesol-air temperature data directly from Table 21-7. At 15:00 the tabulated air tem-perature is 95°F, which is 5°F higher than the air temperature given in the problem.But we can still use the data in that table provided that we subtract 5°F from alltemperatures. Therefore, the sol-air temperature on the west wall in this case is124 � 5 � 119°F, and the heat gain through the wall is determined to be
Q· wall � UA(Tsol-air � Tinside)
� (0.29 Btu/h · ft2 · °F)(210 ft2)(119 � 75)°F � 2680 Btu/h
(b) Heat transfer is proportional to the temperature difference, and the overalltemperature difference in this case is 119 � 75 � 44°F. Also, the difference be-tween the sol-air temperature and the ambient air temperature is (Fig. 21-25)
�Tsolar � Tsol-air � Tambient � (119 � 90)°F � 29°F
which is the equivalent temperature rise of the ambient air due to solar heating.The fraction of heat gain due to solar heating is equal to the ratio of the solar tem-perature difference to the overall temperature difference, and is determined to be
Solar fraction � � 0.66 (or 66%)
Therefore, almost two-thirds of the heat gain through the west wall in this case isdue to solar heating of the wall.
(c) The outer layer of the wall is made of red brick, which is dark colored. There-fore, the value of s/ho is 0.30 h · ft2 · °F/Btu. Then the fraction of incident solarenergy transferred to the interior of the house is determined directly from Equa-tion 21-20 to be
Solar fraction transferred � U � (029 Btu/h · ft2 · °F)(0.30 h · ft2 · °F/Btu) � 0.087
Therefore, less than 10 percent of the solar energy incident on the surface will betransferred to the house. Note that a glass wall would transmit about 10 timesmore energy into the house.
s
ho
Q·wall, solar
Q·wall, total
�UA �Tsolar
UA �Ttotal�
�Tsolar
�Ttotal�
29°F44°F
21-19
Design Conditionsfor Heating and
Cooling
FIGURE 21-24
Schematic for Example 21-3.
A = 210 ft2
Air space
Brick
Gympsum board
Tambient = 90°F
U = 0.29 Btu/h·ft2·°F
Ti = 75°F
Sun
Qwall·
FIGURE 21-25
The difference between the sol-airtemperature and the ambient air
temperature represents the equivalenttemperature rise of ambient air due
to solar heating.
Equivalent
Actual Wall
90°FAmbient
119°FAmbient
No sun
(∆Tsolar = 29°F)
Sun

21-5 � HEAT GAIN FROM PEOPLE, LIGHTS,AND APPLIANCES
The conversion of chemical or electrical energy to thermal energy in a build-ing constitutes the internal heat gain or internal load of a building. Theprimary sources of internal heat gain are people, lights, appliances, and mis-cellaneous equipment such as computers, printers, and copiers (Fig. 21-26).Internal heat gain is usually ignored in design heating load calculations to en-sure that the heating system can do the job even when there is no heat gain,but it is always considered in design cooling load calculations since the inter-nal heat gain usually constitutes a significant fraction of it.
People
The average amount of heat given off by a person depends on the level ofactivity, and can range from about 100 W for a resting person to more than500 W for a physically very active person. Typical rates of heat dissipation bypeople are given in Table 21-8 for various activities in various applicationareas. Note that latent heat constitutes about one-third of the total heat dissi-pated during resting, but rises to almost two-thirds the level during heavyphysical work. Also, about 30 percent of the sensible heat is lost by con-vection and the remaining 70 percent by radiation. The latent and convectivesensible heat losses represent the “instant” cooling load for people since theyneed to be removed immediately. The radiative sensible heat, on the otherhand, is first absorbed by the surrounding surfaces and then released graduallywith some delay.
It is interesting to note that an average person dissipates latent heat at aminimum rate of 30 W while resting. Noting that the enthalpy of vaporizationof water at 33°C is 2423 kJ/kg, the amount of water an average person loses aday by evaporation at the skin and the lungs is (Fig. 21-27)
Daily water loss �
� � 1.07 kg/day
which justifies the sound advice that a person must drink at least 1 L of waterevery day. Therefore, a family of four will supply 4 L of water a day to the airin the house while just resting. This amount will be much higher during heavywork.
Heat given off by people usually constitutes a significant fraction of thesensible and latent heat gain of a building, and may dominate the cooling loadin high occupancy buildings such as theaters and concert halls. The rate ofheat gain from people given in Table 21-8 is quite accurate, but there is con-siderable uncertainty in the internal load due to people because of the diffi-culty in predicting the number of occupants in a building at any given time.The design cooling load of a building should be determined assuming full oc-cupancy. In the absence of better data, the number of occupants can be esti-mated on the basis of one occupant per 1 m2 in auditoriums, 2.5 m2 in schools,3–5 m2 in retail stores, and 10–15 m2 in offices.
Lights
Lighting constitutes about 7 percent of the total energy use in residentialbuildings and 25 percent in commercial buildings. Therefore, lighting can
(0.030 kJ/s)(24 � 3600 s/day)2423 kJ/kg
Latent heat loss per dayHeat of vaporization
21-20
CHAPTER 21Heating and Coolingof Buildings
FIGURE 21-26
The heat given off by people, lights, andequipment represents the internal heat gainof a building.
Lights
Appliances
Range
TV
People
FIGURE 21-27
If the moisture leaving an averageresting person’s body in one day werecollected and condensed it would fill a1-L container.
Moisture
1 L

have a significant impact on the heating and cooling loads of a building. Notcounting the candle light used for emergencies and romantic settings, and thekerosene lamps used during camping, all modern lighting equipment is pow-ered by electricity. The basic types of electric lighting devices are incandes-cent, fluorescent, and gaseous discharge lamps.
The amount of heat given off per lux of lighting varies greatly with thetype of lighting, and thus we need to know the type of lighting installed in or-der to predict the lighting internal heat load accurately. The lighting efficacyof common types of lighting is given in Table 21-9. Note that incandescentlights are the least efficient lighting sources, and thus they will impose thegreatest load on cooling systems (Fig. 21-28). So it is no surprise that practi-cally all office buildings use high-efficiency fluorescent lights despite theirhigher initial cost. Note that incandescent lights waste energy by (1) consum-ing more electricity for the same amount of lighting and (2) making the cool-ing system work harder and longer to remove the heat given off. Office spacesare usually well lit, and the lighting energy consumption in office buildings isabout 20 to 30 W/m2 (2 to 3 W/ft2) of floor space.
The energy consumed by the lights is dissipated by convection and radia-tion. The convection component of the heat constitutes about 40 percent forfluorescent lamps, and it represents the instantaneous part of the cooling loaddue to lighting. The remaining part is in the form of radiation that is absorbedand reradiated by the walls, floors, ceiling, and the furniture, and thus they
TABLE 21-8
Heat gain from people in conditioned spaces (from ASHRAE Handbook of Fundamentals, Ref. 1, Chap. 26, Table 3).
Total heat, W*Adjusted Sensible Latent
Degree of activity Typical application Adult male M/F/C1 heat, W* heat, W*
Seated at theater Theater—matinee 115 95 65 30Seated at theater, night Theater—evening 115 105 70 35Seated, very light work Offices, hotels, apartments 130 115 70 45Moderately active office work Offices, hotels, apartments 140 130 75 55Standing, light work; walking Department or retail store 160 130 75 55Walking, standing Drug store, bank 160 145 75 70Sedentary work Restaurant2 145 160 80 80Light bench work Factory 235 220 80 80Moderate dancing Dance hall 265 250 90 90Walking 4.8 km/h (3 mph);
light machine work Factory 295 295 110 110Bowling3 Bowling alley 440 425 170 255Heavy work Factory 440 425 170 255Heavy machine work; lifting Factory 470 470 185 285Athletics Gymnasium 585 525 210 315
Note: Tabulated values are based on a room temperature of 24°C (75°F). For a room temperature of 27°C (80°F), the total heat gain remainsthe same but the sensible heat values should be decreased by about 20 percent, and the latent heat values should be increased ac-cordingly. All values are rounded to nearest 5 W. The fraction of sensible heat that is radiant ranges from 54 to 60 percent in calm air(� � 0.2 m/s) and from 19 to 38 percent in moving air (0.2 � � � 4 m/s).
*Multiply by 3.412 to convert to Btu/h.1Adjusted heat gain is based on normal percentage of men, women, and children for the application listed, with the postulate that the gainfrom an adult female is 85 percent of that for an adult male and that the gain from a child is 75 percent of that for an adult male.2Adjusted heat gain includes 18 W (60 Btu/h) for food per individual (9 W sensible and 9 W latent).3Figure one person per alley actually bowling, and all others are sitting (117 W) or standing or walking slowly (231 W).
FIGURE 21-28
A 15-W compact fluorescent lampprovides as much light as a 60-W
incandescent lamp.
15 W 60 W
21-21

affect the cooling load with time delay. Therefore, lighting may continue con-tributing to the cooling load by reradiation even after the lights have beenturned off. Sometimes it may be necessary to consider time lag effects whendetermining the design cooling load.
The ratio of the lighting wattage in use to the total wattage installed iscalled the usage factor, and it must be considered when determining the heatgain due to lighting at a given time since installed lighting does not give offheat unless it is on. For commercial applications such as supermarkets andshopping centers, the usage factor is taken to be unity.
Equipment and Appliances
Most equipment and appliances are driven by electric motors, and thus theheat given off by an appliance in steady operation is simply the power con-sumed by its motor. For a fan, for example, part of the power consumed by themotor is transmitted to the fan to drive it, while the rest is converted to heatbecause of the inefficiency of the motor. The fan transmits the energy to theair molecules and increases their kinetic energy. But this energy is also con-verted to heat as the fast-moving molecules are slowed down by other mole-cules and stopped as a result of friction. Therefore, we can say that the entireenergy consumed by the motor of the fan in a room is eventually converted toheat in that room. Of course, if the motor is in one room (say, room A) and thefan is in another (say, room B), then the heat gain of room B will be equal tothe power transmitted to the fan only, while the heat gain of room A will be theheat generated by the motor due to its inefficiency (Fig. 21-29).
The power rating W·
motor on the label of a motor represents the power thatthe motor will supply under full load conditions. But a motor usually operatesat part load, sometimes at as low as 30 to 40 percent, and thus it consumes anddelivers much less power than the label indicates. This is characterized by theload factor fload of the motor during operation, which is fload � 1.0 for fullload. Also, there is an inefficiency associated with the conversion of electrical
TABLE 21-9
Comparison of different lighting systemsEfficacy,
Type of lighting lumens/W Life, h Comments
CombustionCandle 0.2 10 Very inefficient. Best for emergencies.
IncandescentOrdinary 5–20 1000 Low initial cost; low efficiency.Halogen 15–25 2000 Better efficiency; excellent color rendition.
FluorescentOrdinary 40–60 10,000 Being replaced by high-output types.High output 70–90 10,000 Commonly in offices and plants.Compact 50–80 10,000 Fits into the sockets of incandescent lights.Metal halide 55–125 High efficiency; good color rendition.
Gaseous DischargeMercury vapor 50–60 10,000 Both indoor and outdoor use.High-pressure sodium 100–150 15,000 Good color rendition. Indoor and outdoor use.Low-pressure sodium up to 200 Distinct yellow light. Best for outdoor use.
FIGURE 21-29
An 80 percent efficient motor that drives a100-W fan contributes 25 W and 100 W tothe heat loads of the motor and equipmentrooms, respectively.
100 W
25 W80%
efficient
Motor
125 W
100 W
Room A Room B

energy to rotational mechanical energy. This is characterized by the motor ef-ficiency �motor, which decreases with decreasing load factor. Therefore, it isnot a good idea to oversize the motor since oversized motors operate at a lowload factor and thus at a lower efficiency. Another factor that affects theamount of heat generated by a motor is how long a motor actually operates.This is characterized by the usage factor fusage, with fusage � 1.0 for continuousoperation. Motors with very low usage factors such as the motors of dockdoors can be ignored in calculations. Then the heat gain due to a motor insidea conditioned space can be expressed as
Q·
motor, total � W·
motor � fload � fusage /�motor (W) (21-21)
Heat generated in conditioned spaces by electric, gas, and steam appli-ances such as a range, refrigerator, freezer, TV, dishwasher, clothes washer,drier, computers, printers, and copiers can be significant, and thus must beconsidered when determining the peak cooling load of a building. There isconsiderable uncertainty in the estimated heat gain from appliances owing tothe variations in appliances and the varying usage schedules. The exhausthoods in the kitchen complicate things further. Also, some office equipmentsuch as printers and copiers consume considerable power in the standbymode. A 350-W laser printer, for example, may consume 175 W and a 600-Wcomputer may consume 530 W when in standby mode.
The heat gain from office equipment in a typical office with computer ter-minals on most desks can be up to 47 W/m2. This value can be 10 times aslarge for computer rooms that house mainframe computers. When the equip-ment inventory of a building is known, the equipment heat gain can be deter-mined more accurately using the data given in the ASHRAE Handbook ofFundamentals (Ref. 1).
The presence of thermostatic controls and typical usage practices make ithighly unlikely for all the appliances in a conditioned space to operate at fullload. A more realistic approach is to take 50 percent of the total nameplate rat-ings of the appliances to represent the maximum use. Therefore, the peak heatgain from appliances is taken to be
Q·
unhooded appliance � 0.5Q·
appliance, input (W) (21-22)
regardless of the type of energy or fuel used. For cooling load estimate, about34 percent of heat gain can be assumed to be latent heat, with the remaining66 percent to be sensible in this case.
In hooded appliances, the air heated by convection and the moisture gen-erated are removed by the hood. Therefore, the only heat gain from hoodedappliances is radiation, which constitutes up to 32 percent of the energy con-sumed by the appliance (Fig. 21-30). Therefore, the design value of heat gainfrom hooded electric or steam appliances is simply half of this 32 percent.
EXAMPLE 21-4 Energy Consumption of Electric and Gas BurnersThe efficiency of cooking equipment affects the internal heat gain from them sincean inefficient appliance consumes a greater amount of energy for the same task,and the excess energy consumed shows up as heat in the living space. The effi-ciency of open burners is determined to be 73 percent for electric units and38 percent for gas units (Fig. 21-31). Consider a 2-kW unhooded electric openburner in an area where the unit costs of electricity and natural gas are $0.09/kWhand $0.55/therm, respectively. Determine the amount of electrical energy useddirectly for cooking, the cost of energy per “utilized” kWh, and the contribution ofthis burner to the design cooling load. Repeat the calculations for the gas burner.
21-23
Heat Gain fromPeople, Lights,and Appliances
FIGURE 21-31
Schematic of the 73 percent efficientelectric heating unit and 38 percent
efficient gas burner discussed inExample 21-4.
Gas Range Electric Range
38% 73%
FIGURE 21-30
In hooded appliances, about 68 percent ofthe generated heat is vented out with
the heated and humidified air.
68%Hot and humid air
Range
Exhaust
32%Radiation
Hood

Solution The efficiency of the electric heater is given to be 73 percent. There-fore, a burner that consumes 2 kW of electrical energy will supply
Q· utilized � (Energy input) � (Efficiency) � (2 kW)(0.73) � 1.46 kW
of useful energy. The unit cost of utilized energy is inversely proportional to theefficiency and is determined from
Cost of utilized energy � � $0.123/kWh
The design heat gain from an unhooded appliance is taken to be half of its ratedenergy consumption and is determined to be
Q· unhooded appliance � 0.5Q· appliance, input
� 0.5 � (2 kW) � 1 kW (electric burner)
Noting that the efficiency of a gas burner is 38 percent, the energy input to agas burner that supplies utilized energy at the same rate (1.46 kW) is
Q· input, gas � � 3.84 kW (� 13,100 Btu/h)
since 1 kW � 3412 Btu/h. Therefore, a gas burner should have a rating of at least13,100 Btu/h to perform as well as the electric unit.
Noting that 1 therm � 29.3 kWh, the unit cost of utilized energy in the case ofa gas burner is determined similarly to be
Cost of utilized energy � � $0.049/kWh
which is about one-quarter of the unit cost of utilized electricity. Therefore, despiteits higher efficiency, cooking with an electric burner will cost four times as muchcompared to a gas burner in this case. This explains why cost-conscious con-sumers always ask for gas appliances, and it is not wise to use electricity for heat-ing purposes.
Finally, the design heat gain from this unhooded gas burner is determinedto be
Q· unhooded appliance � 0.5Q· appliance, input
� 0.5 � (3.84 kW) � 1.92 kW (gas burner)
which is 92 percent larger than that of the electric burner. Therefore, an unhoodedgas appliance will contribute more to the heat gain than a comparable electricappliance.
EXAMPLE 21-5 Heat Gain of an Exercise RoomAn exercise room has 10 weight-lifting machines that have no motors and 7 tread-mills each equipped with a 2-hp motor (Fig. 21-32). The motors operate at an av-erage load factor of 0.6, at which their efficiency is 0.75. During peak eveninghours, 17 pieces of exercising equipment are used continuously, and there arealso four people doing light exercises while waiting in line for one piece of theequipment. Determine the rate of heat gain of the exercise room from people andthe equipment at peak load conditions. How much of this heat gain is in the latentform?
Solution The 10 weight-lifting machines do not have any motors, and thus theydo not contribute to the internal heat gain directly. The usage factors of the motorsof the treadmills are taken to be unity since they are used constantly during peakperiods. Noting that 1 hp � 746 W, the total heat generated by the motors is
Cost of energy inputEfficiency
�$0.55/(29.3 kWh)
0.38
Q· utilized
Efficiency�
1.46 kW0.38
Cost of energy inputEfficiency
�$0.09/kWh
0.73
21-24
CHAPTER 21Heating and Coolingof Buildings
FIGURE 21-32
Schematic for Example 21-5.

Q· motors � (No. of motors) � W·motor � fload � fusage /�motor
� 7 � (2 � 746 W) � 0.60 � 1.0/0.75 � 8355 W
The average rate of heat dissipated by people in an exercise room is given inTable 21-8 to be 525 W, of which 315 W is in latent form. Therefore, the heat gainfrom 21 people is
Q· people � (No. of people) � Q· person � 21 � (525 W) � 11,025 W
Then the total rate of heat gain (or the internal heat load) of the exercise roomduring peak period becomes
Q· total � Q· motors � Q· people � 8355 � 11,025 � 19,380 W
The entire heat given off by the motors is in sensible form. Therefore, the latentheat gain is due to people only, which is determined to be
Q· latent � (No. of people) � Q· latent, per person � 21 � (315 W) � 6615 W
The remaining 12,765 W of heat gain is in the sensible form.
21-6 � HEAT TRANSFER THROUGH WALLS AND ROOFS
Under steady conditions, the rate of heat transfer through any section of abuilding wall or roof can be determined from
Q·
� UA(Ti � To) � (21-23)
where Ti and To are the indoor and outdoor air temperatures, A is the heattransfer area, U is the overall heat transfer coefficient (the U-factor), andR � 1/U is the overall unit thermal resistance (the R-value). Walls and roofsof buildings consist of various layers of materials, and the structure and oper-ating conditions of the walls and the roofs may differ significantly from onebuilding to another. Therefore, it is not practical to list the R-values (or U-factors) of different kinds of walls or roofs under different conditions.Instead, the overall R-value is determined from the thermal resistances of theindividual components using the thermal resistance network. The overallthermal resistance of a structure can be determined most accurately in a lab byactually assembling the unit and testing it as a whole, but this approach is usu-ally very time consuming and expensive. The analytical approach describedhere is fast and straightforward, and the results are usually in good agreementwith the experimental values.
The unit thermal resistance of a plane layer of thickness L and thermalconductivity k can be determined from R � L/k. The thermal conductivity andother properties of common building materials are given in the appendix. Theunit thermal resistances of various components used in building structures arelisted in Table 21-10 for convenience.
Heat transfer through a wall or roof section is also affected by the con-vection and radiation heat transfer coefficients at the exposed surfaces. The ef-fects of convection and radiation on the inner and outer surfaces of walls androofs are usually combined into the combined convection and radiation heattransfer coefficients (also called surface conductances) hi and ho, respectively,whose values are given in Table 21-11 for ordinary surfaces (� � 0.9) and
A(Ti � To)R
21-25
Heat Transferthrough Walls
and Roofs
TABLE 21-11
Combined convection and radiationheat transfer coefficients at window,
wall, or roof surfaces (from ASHRAEHandbook of Fundamentals, Ref. 1,
Chap. 22, Table 1).
Direc-tion of
Posi- heattion flow 0.90 0.20 0.05
Still Air (both indoors and outdoors)Horiz. Up ↑ 9.26 5.17 4.32Horiz. Down ↓ 6.13 2.10 1.2545° slope Up ↑ 9.09 5.00 4.1545° slope Down ↓ 7.50 3.41 2.56Vertical Horiz. → 8.29 4.20 3.35
Moving Air (any position, any direction)Winter condition
(winds at 15 mph or 24 km/h) 34.0 — —
Summer condition (winds at 7.5 mph or 12 km/h) 22.7 — —
*Multiply by 0.176 to convert to Btu/h · ft2 · °F. Surface resistance can be obtained from R � 1/h.
h, W/m2 · °C*Surface
emittance, �

reflective surfaces (� � 0.2 or 0.05). Note that surfaces having a low emit-tance also have a low surface conductance due to the reduction in radiationheat transfer. The values in the table are based on a surface temperature of21°C (72°F) and a surface–air temperature difference of 5.5°C (10°F). Also,the equivalent surface temperature of the environment is assumed to be equalto the ambient air temperature. Despite the convenience it offers, this as-sumption is not quite accurate because of the additional radiation heat lossfrom the surface to the clear sky. The effect of sky radiation can be accountedfor approximately by taking the outside temperature to be the average of theoutdoor air and sky temperatures.
The inner surface heat transfer coefficient hi remains fairly constantthroughout the year, but the value of ho varies considerably because of its de-pendence on the orientation and wind speed, which can vary from less than1 km/h in calm weather to over 40 km/h during storms. The commonly usedvalues of hi and ho for peak load calculations are
hi � 8.29 W/m2 · °C � 1.46 Btu/h · ft2 · °F (winter and summer)
ho � �34.0 W/m2 · °C � 6.0 Btu/h · ft2 · °F (winter)22.7 W/m2 · °C � 4.0 Btu/h · ft2 · °F (summer)
TABLE 21-10
Unit thermal resistance (the R-value) of common components used in buildings
R-valueComponent m2 · °C/W ft2 · h · °F/Btu
Outside surface (winter) 0.030 0.17Outside surface (summer) 0.044 0.25Inside surface, still air 0.12 0.68Plane air space, vertical,
ordinary surfaces (�eff � 0.82):13 mm ( in.) 0.16 0.9020 mm ( in.) 0.17 0.9440 mm (1.5 in.) 0.16 0.9090 mm (3.5 in.) 0.16 0.91
Insulation, 25 mm (1 in.)Glass fiber 0.70 4.00Mineral fiber batt 0.66 3.73Urethane rigid foam 0.98 5.56
Stucco, 25 mm (1 in.) 0.037 0.21Face brick, 100 mm (4 in.) 0.075 0.43Common brick, 100 mm (4 in.) 0.12 0.79Steel siding 0.00 0.00Slag, 13 mm ( in.) 0.067 0.38Wood, 25 mm (1 in.) 0.22 1.25Wood stud, nominal 2 in. �
4 in. (3.5 in. or 90 mm wide) 0.63 3.58
R-valueComponent m2 · °C/W ft2 · h · °F/Btu
Wood stud, nominal 2 in. �6 in. (5.5 in. or 140 mm wide) 0.98 5.56
Clay tile, 100 mm (4 in.) 0.18 1.01Acoustic tile 0.32 1.79Asphalt shingle roofing 0.077 0.44Building paper 0.011 0.06Concrete block, 100 mm (4 in.):
Lightweight 0.27 1.51Heavyweight 0.13 0.71
Plaster or gypsum board, 13 mm ( in.) 0.079 0.45
Wood fiberboard, 13 mm ( in.) 0.23 1.31Plywood, 13 mm ( in.) 0.11 0.62Concrete, 200 mm (8 in.):
Lightweight 1.17 6.67Heavyweight 0.12 0.67
Cement mortar, 13 mm (1/2 in.) 0.018 0.10Wood bevel lapped siding,
13 mm � 200 mm (1/2 in. � 8 in.) 0.14 0.81
12
12
12
12
34
12

which correspond to design wind conditions of 24 km/h (15 mph) for winterand 12 km/h (7.5 mph) for summer. The corresponding surface thermal resis-tances (R-values) are determined from Ri � 1/hi and Ro � 1/ho. The surfaceconductance values under still air conditions can be used for interior surfacesas well as exterior surfaces in calm weather.
Building components often involve trapped air spaces between variouslayers. Thermal resistances of such air spaces depend on the thickness of thelayer, the temperature difference across the layer, the mean air temperature,the emissivity of each surface, the orientation of the air layer, and the directionof heat transfer. The emissivities of surfaces commonly encountered in build-ings are given in Table 21-12. The effective emissivity of a plane-parallel airspace is given by
� 1 (21-24)
where �1 and �2 are the emissivities of the surfaces of the air space. Table21-12 also lists the effective emissivities of air spaces for the cases where(1) the emissivity of one surface of the air space is � while the emissivity ofthe other surface is 0.9 (a building material) and (2) the emissivity of both sur-faces is �. Note that the effective emissivity of an air space between buildingmaterials is 0.82/0.03 � 27 times that of an air space between surfaces cov-ered with aluminum foil. For specified surface temperatures, radiation heattransfer through an air space is proportional to effective emissivity, and thusthe rate of radiation heat transfer in the ordinary surface case is 27 times thatof the reflective surface case.
Table 21-13 lists the thermal resistances of 20-mm-, 40-mm-, and90-mm- (0.75-in., 1.5-in., and 3.5-in.) thick air spaces under various condi-tions. The thermal resistance values in the table are applicable to air spaces ofuniform thickness bounded by plane, smooth, parallel surfaces with no airleakage. Thermal resistances for other temperatures, emissivities, and airspaces can be obtained by interpolation and moderate extrapolation. Note thatthe presence of a low-emissivity surface reduces radiation heat transfer acrossan air space and thus significantly increases the thermal resistance. The ther-mal effectiveness of a low-emissivity surface will decline, however, if thecondition of the surface changes as a result of some effects such as condensa-tion, surface oxidation, and dust accumulation.
The R-value of a wall or roof structure that involves layers of uniformthickness is determined easily by simply adding up the unit thermal resis-tances of the layers that are in series. But when a structure involves compo-nents such as wood studs and metal connectors, then the thermal resistancenetwork involves parallel connections and possible two-dimensional effects.The overall R-value in this case can be determined by assuming (1) parallelheat flow paths through areas of different construction or (2) isothermalplanes normal to the direction of heat transfer. The first approach usually over-predicts the overall thermal resistance, whereas the second approach usuallyunderpredicts it. The parallel heat flow path approach is more suitable forwood frame walls and roofs, whereas the isothermal planes approach is moresuitable for masonry or metal frame walls.
1�effective
�1�1
�1�2
21-27
Heat Transferthrough Walls
and Roofs
TABLE 21-12
Emissivities � of various surfaces andthe effective emissivity of air spaces
(from ASHRAE Handbook ofFundamentals, Ref. 1,
Chap. 22, Table 3).
Effectiveemissivity of
air space�1 � � �1 � �
Surface � �2 � 0.9 �2 � �
Aluminum foil, bright 0.05* 0.05 0.03
Aluminum sheet 0.12 0.12 0.06
Aluminum-coated paper, polished 0.20 0.20 0.11
Steel, galva-nized, bright 0.25 0.24 0.15
Aluminum paint 0.50 0.47 0.35
Building materials: Wood, paper, masonry, nonmetallic paints 0.90 0.82 0.82
Ordinary glass 0.84 0.77 0.72
*Surface emissivity of aluminum foil in-creases to 0.30 with barely visible conden-sation, and to 0.70 with clearly visiblecondensation.

TABLE 21-13
Unit thermal resistances (R-values) of well-sealed plane air spaces (from ASHRAE Handbook of Fundamentals, Ref. 1, Chap. 22, Table 2)(a) SI units (in m2 · °C/W)
20-mm air space 40-mm air space 90-mm air spaceEffective Effective Effective
emissivity, �eff emissivity, �eff emissivity, �effPosition Direction Mean Temp.of air of heat temp., diff., space flow °C °C 0.03 0.05 0.5 0.82 0.03 0.05 0.5 0.82 0.03 0.05 0.5 0.82
32.2 5.6 0.41 0.39 0.18 0.13 0.45 0.42 0.19 0.14 0.50 0.47 0.20 0.1410.0 16.7 0.30 0.29 0.17 0.14 0.33 0.32 0.18 0.14 0.27 0.35 0.19 0.15
Horizontal Up ↑10.0 5.6 0.40 0.39 0.20 0.15 0.44 0.42 0.21 0.16 0.49 0.47 0.23 0.16
�17.8 11.1 0.32 0.32 0.20 0.16 0.35 0.34 0.22 0.17 0.40 0.38 0.23 0.18
32.2 5.6 0.52 0.49 0.20 0.14 0.51 0.48 0.20 0.14 0.56 0.52 0.21 0.1410.0 16.7 0.35 0.34 0.19 0.14 0.38 0.36 0.20 0.15 0.40 0.38 0.20 0.15
45° slope Up ↑10.0 5.6 0.51 0.48 0.23 0.17 0.51 0.48 0.23 0.17 0.55 0.52 0.24 0.17
�17.8 11.1 0.37 0.36 0.23 0.18 0.40 0.39 0.24 0.18 0.43 0.41 0.24 0.19
32.2 5.6 0.62 0.57 0.21 0.15 0.70 0.64 0.22 0.15 0.65 0.60 0.22 0.1510.0 16.7 0.51 0.49 0.23 0.17 0.45 0.43 0.22 0.16 0.47 0.45 0.22 0.16
Vertical Horizontal →10.0 5.6 0.65 0.61 0.25 0.18 0.67 0.62 0.26 0.18 0.64 0.60 0.25 0.18
�17.8 11.1 0.55 0.53 0.28 0.21 0.49 0.47 0.26 0.20 0.51 0.49 0.27 0.20
32.2 5.6 0.62 0.58 0.21 0.15 0.89 0.80 0.24 0.16 0.85 0.76 0.24 0.1610.0 16.7 0.60 0.57 0.24 0.17 0.63 0.59 0.25 0.18 0.62 0.58 0.25 0.18
45° slope Down ↓10.0 5.6 0.67 0.63 0.26 0.18 0.90 0.82 0.28 0.19 0.83 0.77 0.28 0.19
�17.8 11.1 0.66 0.63 0.30 0.22 0.68 0.64 0.31 0.22 0.67 0.64 0.31 0.22
32.2 5.6 0.62 0.58 0.21 0.15 1.07 0.94 0.25 0.17 1.77 1.44 0.28 0.1810.0 16.7 0.66 0.62 0.25 0.18 1.10 0.99 0.30 0.20 1.69 1.44 0.33 0.21
Horizontal Down ↓10.0 5.6 0.68 0.63 0.26 0.18 1.16 1.04 0.30 0.20 1.96 1.63 0.34 0.22
�17.8 11.1 0.74 0.70 0.32 0.23 1.24 1.13 0.39 0.26 1.92 1.68 0.43 0.29(b) English units (in h · ft2 · °F/Btu)
0.75-in. air space 1.5-in. air space 3.5-in. air spaceEffective Effective Effective
emissivity, �eff emissivity, �eff emissivity, �effPosition Direction Mean Temp.of air of heat temp., diff., space flow °F °F 0.03 0.05 0.5 0.82 0.03 0.05 0.5 0.82 0.03 0.05 0.5 0.82
90 10 2.34 2.22 1.04 0.75 2.55 2.41 1.08 0.77 2.84 2.66 1.13 0.8050 30 1.71 1.66 0.99 0.77 1.87 1.81 1.04 0.80 2.09 2.01 1.10 0.84
Horizontal Up ↑50 10 2.30 2.21 1.16 0.87 2.50 2.40 1.21 0.89 2.80 2.66 1.28 0.930 20 1.83 1.79 1.16 0.93 2.01 1.95 1.23 0.97 2.25 2.18 1.32 1.03
90 10 2.96 2.78 1.15 0.81 2.92 2.73 1.14 0.80 3.18 2.96 1.18 0.8250 30 1.99 1.92 1.08 0.82 2.14 2.06 1.12 0.84 2.26 2.17 1.15 0.86
45° slope Up ↑50 10 2.90 2.75 1.29 0.94 2.88 2.74 1.29 0.94 3.12 2.95 1.34 0.960 20 2.13 2.07 1.28 1.00 2.30 2.23 1.34 1.04 2.42 2.35 1.38 1.06
90 10 3.50 3.24 1.22 0.84 3.99 3.66 1.27 0.87 3.69 3.40 1.24 0.8550 30 2.91 2.77 1.30 0.94 2.58 2.46 1.23 0.90 2.67 2.55 1.25 0.91
Vertical Horizontal →50 10 3.70 3.46 1.43 1.01 3.79 3.55 1.45 1.02 3.63 3.40 1.42 1.010 20 3.14 3.02 1.58 1.18 2.76 2.66 1.48 1.12 2.88 2.78 1.51 1.14
90 10 3.53 3.27 1.22 0.84 5.07 4.55 1.36 0.91 4.81 4.33 1.34 0.9050 30 3.43 3.23 1.39 0.99 3.58 3.36 1.42 1.00 3.51 3.30 1.40 1.00
45° slope Down ↓50 10 3.81 3.57 1.45 1.02 5.10 4.66 1.60 1.09 4.74 4.36 1.57 1.080 20 3.75 3.57 1.72 1.26 3.85 3.66 1.74 1.27 3.81 3.63 1.74 1.27
90 10 3.55 3.29 1.22 0.85 6.09 5.35 1.43 0.94 10.07 8.19 1.57 1.0050 30 3.77 3.52 1.44 1.02 6.27 5.63 1.70 1.14 9.60 8.17 1.88 1.22
Horizontal Down ↓50 10 3.84 3.59 1.45 1.02 6.61 5.90 1.73 1.15 11.15 9.27 1.93 1.240 20 4.18 3.96 1.81 1.30 7.03 6.43 2.19 1.49 10.90 9.52 2.47 1.62
21-28

The thermal contact resistance between different components of buildingstructures ranges between 0.01 and 0.1 m2 · °C/W, which is negligible in mostcases. However, it may be significant for metal building components such assteel framing members.
EXAMPLE 21-6 The R-Value of a Wood Frame WallDetermine the overall unit thermal resistance (the R-value) and the overall heattransfer coefficient (the U-factor) of a wood frame wall that is built around 38-mm� 90-mm (2 � 4 nominal) wood studs with a center-to-center distance of 400 mm.The 90-mm-wide cavity between the studs is filled with glass fiber insulation. Theinside is finished with 13-mm gypsum wallboard and the outside with 13-mmwood fiberboard and 13-mm � 200-mm wood bevel lapped siding. The insulatedcavity constitutes 75 percent of the heat transmission area while the studs, plates,and sills constitute 21 percent. The headers constitute 4 percent of the area, andthey can be treated as studs.
Also, determine the rate of heat loss through the walls of a house whoseperimeter is 50 m and wall height is 2.5 m in Las Vegas, Nevada, whose winterdesign temperature is �2°C. Take the indoor design temperature to be 22°C andassume 20 percent of the wall area is occupied by glazing.
Solution The R-value and the U-factor of a wood frame wall as well as the rateof heat loss through such a wall in Las Vegas are to be determined.
Assumptions 1 Steady operating conditions exist. 2 Heat transfer through thewall is one-dimensional. 3 Thermal properties of the wall and the heat transfer co-efficients are constant.
Properties The R-values of different materials are given in Table 21-10.
Analysis The schematic of the wall as well as the different elements used in itsconstruction are shown below. Heat transfer through the insulation and throughthe studs will meet different resistances, and thus we need to analyze the thermalresistance for each path separately. Once the unit thermal resistances and theU-factors for the insulation and stud sections are available, the overall averagethermal resistance for the entire wall can be determined from
Roverall � 1/Uoverall
where
Uoverall � (U � farea)insulation � (U � farea)stud
and the value of the area fraction farea is 0.75 for the insulation section and 0.25 forthe stud section since the headers that constitute a small part of the wall are to betreated as studs. Using the available R-values from Table 21-10 and calculatingothers, the total R-values for each section can be determined in a systematicmanner in the table on next page.
We conclude that the overall unit thermal resistance of the wall is 2.23 m2 ·°C/W, and this value accounts for the effects of the studs and headers. It corre-sponds to an R-value of 2.23 � 5.68 � 12.7 (or nearly R-13) in English units. Notethat if there were no wood studs and headers in the wall, the overall thermal re-sistance would be 3.05 m2 · °C/W, which is 37 percent greater than 2.23 m2 ·°C/W. Therefore, the wood studs and headers in this case serve as thermalbridges in wood frame walls, and their effect must be considered in the thermalanalysis of buildings.
21-29
Heat Transferthrough Walls
and Roofs

Schematic R-value,m2 · °C/W
Between At Construction studs studs
1. Outside surface, 24 km/h wind 0.030 0.030
2. Wood bevel lapped siding 0.14 0.14
3. Wood fiberboard sheeting, 13 mm 0.23 0.23
4a. Glass fiber insulation, 90 mm 2.45 —
4b. Wood stud, 38 mm �90 mm — 0.63
5. Gypsum wallboard, 13 mm 0.079 0.079
6. Inside surface, still air 0.12 0.12
Total unit thermal resistance of each section, R (in m2 · °C/W) 3.05 1.23The U-factor of each section, U � 1/R, in W/m2 · °C 0.328 0.813Area fraction of each section, farea 0.75 0.25Overall U-factor: U � �farea, i Ui � 0.75 � 0.328 � 0.25 � 0.813 � 0.449 W/m2 · °COverall unit thermal resistance: R � 1/U � 2.23 m2 · °C/W
The perimeter of the building is 50 m and the height of the walls is 2.5 m.Noting that glazing constitutes 20 percent of the walls, the total wall area is
Awall � 0.80(Perimeter)(Height) � 0.80(50 m)(2.5 m) � 100 m2
Then the rate of heat loss through the walls under design conditions becomes
Q·wall � (UA)wall (Ti � To)
� (0.449 W/m2 · °C)(100 m2)[22 � (�2)°C]
� 1078 W
Discussion Note that a 1-kW resistance heater in this house will make up almostall the heat lost through the walls, except through the doors and windows, whenthe outdoor air temperature drops to �2°C.
EXAMPLE 21-7 The R-Value of a Wall with Rigid FoamThe 13-mm-thick wood fiberboard sheathing of the wood stud wall discussed inthe previous example is replaced by a 25-mm-thick rigid foam insulation. Deter-mine the percent increase in the R-value of the wall as a result.
Solution The overall R-value of the existing wall was determined in Example21-6 to be 2.23 m2 · °C/W. Noting that the R-values of the fiberboard and the foaminsulation are 0.23 m2 · °C/W and 0.98 m2 · °C/W, respectively, and the added andremoved thermal resistances are in series, the overall R-value of the wall aftermodification becomes
Rnew � Rold � Rremoved � Radded
� 2.23 � 0.23 � 0.98
� 2.98 m2 · °C/W
This represents an increase of (2.98 � 2.23)/2.23 � 0.34 or 34 percent in theR-value of the wall. This example demonstrated how to evaluate the new R-valueof a structure when some structural members are added or removed.
4a
1
32
4b
56
21-30
CHAPTER 21Heating and Coolingof Buildings

EXAMPLE 21-8 The R-Value of a Masonry WallDetermine the overall unit thermal resistance (the R-value) and the overall heattransfer coefficient (the U-factor) of a masonry cavity wall that is built around6-in.-thick concrete blocks made of lightweight aggregate with 3 cores filled withperlite (R � 4.2 h · ft2 · °F/Btu). The outside is finished with 4-in. face brick with
-in. cement mortar between the bricks and concrete blocks. The inside finishconsists of in. gypsum wallboard separated from the concrete block by -in.-thick (1-in. � 3-in. nominal) vertical furring (R � 4.2 h · ft2 · °F/Btu) whose center-to-center distance is 16 in. Both sides of the -in.-thick air space between theconcrete block and the gypsum board are coated with reflective aluminum foil(� � 0.05) so that the effective emissivity of the air space is 0.03. For a mean tem-perature of 50°F and a temperature difference of 30°F, the R-value of the air spaceis 2.91 h · ft2 · °F/Btu. The reflective air space constitutes 80 percent of the heattransmission area, while the vertical furring constitutes 20 percent.
Solution The R-value and the U-factor of a masonry cavity wall are to bedetermined.
Assumptions 1 Steady operating conditions exist. 2 Heat transfer through thewall is one-dimensional. 3 Thermal properties of the wall and the heat transfercoefficients are constant.
Properties The R-values of different materials are given in Table 21-10.
Analysis The schematic of the wall as well as the different elements used in itsconstruction are shown below. Following the approach described above and us-ing the available R-values from Table 21-10, the overall R-value of the wall is de-termined in the table below.
Schematic R-value, h · ft2 · °F/Btu
Between AtConstruction furring furring
1. Outside surface, 15 mph wind 0.17 0.17
2. Face brick, 4 in. 0.43 0.433. Cement mortar, 0.5 in. 0.10 0.104. Concrete block, 6 in. 4.20 4.205a. Reflective air space,
in. 2.91 —5b. Nominal 1 � 3 vertical
furring — 0.946. Gypsum wallboard,
0.5 in. 0.45 0.457. Inside surface, still air 0.68 0.68
Total unit thermal resistance of each section, R 8.94 6.97The U-factor of each section, U � 1/R, in Btu/h · ft2 · °F 0.112 0.143Area fraction of each section, farea 0.80 0.20Overall U-factor: U � �farea, i Ui � 0.80 � 0.112 � 0.20 � 0.143 � 0.118 Btu/h · ft2 · °FOverall unit thermal resistance: R � 1/U � 8.46 h · ft2 · °F/Btu
Therefore, the overall unit thermal resistance of the wall is 8.46 h · ft2 · °F/Btu andthe overall U-factor is 0.118 Btu/h · ft2 · °F. These values account for the effects ofthe vertical furring.
34
76
5a
5b
43
2
1
34
34
12
12
21-31
Heat Transferthrough Walls
and Roofs

EXAMPLE 21-9 The R-Value of a Pitched RoofDetermine the overall unit thermal resistance (the R-value) and the overall heattransfer coefficient (the U-factor) of a 45° pitched roof built around nominal2-in. � 4-in. wood studs with a center-to-center distance of 16 in. The 3.5-in.-wideair space between the studs does not have any reflective surface and thus itseffective emissivity is 0.84. For a mean temperature of 90°F and a temperaturedifference of 30°F, the R-value of the air space is 0.86 h · ft2 · °F/Btu. The lowerpart of the roof is finished with -in. gypsum wallboard and the upper part with
-in. plywood, building paper, and asphalt shingle roofing. The air space consti-tutes 75 percent of the heat transmission area, while the studs and headers con-stitute 25 percent.
Solution The R-value and the U-factor of a 45° pitched roof are to bedetermined.
Assumptions 1 Steady operating conditions exist. 2 Heat transfer through theroof is one-dimensional. 3 Thermal properties of the roof and the heat transfercoefficients are constant.
Properties The R-values of different materials are given in Table 21-10.
Analysis The schematic of the pitched roof as well as the different elementsused in its construction are shown below. Following the approach describedabove and using the available R-values from Table 21-10, the overall R-value ofthe roof can be determined in the table below.
Schematic R-value,h · ft2 · °F/Btu
Between At Construction studs studs
1. Outside surface, 15 mph wind 0.17 0.172. Asphalt shingle roofing 0.44 0.443. Building paper 0.10 0.104. Plywood deck, in. 0.78 0.785a. Nonreflective air space, 3.5 in. 0.86 —5b. Wood stud, 2 in. by 4 in. — 3.586. Gypsum wallboard, 0.5 in. 0.45 0.457. Inside surface, 45° slope, still air 0.63 0.63
Total unit thermal resistance of each section, R 3.43 6.15The U-factor of each section, U � 1/R, in Btu/h · ft2 · °F 0.292 0.163Area fraction of each section, farea 0.75 0.25Overall U-factor: U � �farea, i Ui � 0.75 � 0.292 � 0.25 � 0.163 � 0.260 Btu/h · ft2 · °FOverall unit thermal resistance: R � 1/U � 3.85 h · ft2 · °F/Btu
Therefore, the overall unit thermal resistance of this pitched roof is 3.85 h · ft2 ·°F/Btu and the overall U-factor is 0.260 Btu/h · ft2 · °F. Note that the wood studsoffer much larger thermal resistance to heat flow than the air space between thestuds.
The construction of wood frame flat ceilings typically involve 2-in. �6-in. joists on 400-mm (16-in.) or 600-mm (24-in.) centers. The fraction offraming is usually taken to be 0.10 for joists on 400-mm centers and 0.07 forjoists on 600-mm centers.
5845°
1 2 3 4 5a 5b 6 7
58
12
21-32
CHAPTER 21Heating and Coolingof Buildings

Most buildings have a combination of a ceiling and a roof with an atticspace in between, and the determination of the R-value of the roof–attic–ceiling combination depends on whether the attic is vented or not. For ade-quately ventilated attics, the attic air temperature is practically the same as theoutdoor air temperature, and thus heat transfer through the roof is governed bythe R-value of the ceiling only. However, heat is also transferred between theroof and the ceiling by radiation, and it needs to be considered (Fig. 21-33).The major function of the roof in this case is to serve as a radiation shield byblocking off solar radiation. Effectively ventilating the attic in summer shouldnot lead one to believe that heat gain to the building through the attic is greatlyreduced. This is because most of the heat transfer through the attic is byradiation.
Radiation heat transfer between the ceiling and the roof can be minimizedby covering at least one side of the attic (the roof or the ceiling side) by a re-flective material, called radiant barrier, such as aluminum foil or aluminum-coated paper. Tests on houses with R-19 attic floor insulation have shown thatradiant barriers can reduce summer ceiling heat gains by 16 to 42 percentcompared to an attic with the same insulation level and no radiant barrier.Considering that the ceiling heat gain represents about 15 to 25 percent of thetotal cooling load of a house, radiant barriers will reduce the air conditioningcosts by 2 to 10 percent. Radiant barriers also reduce the heat loss in winterthrough the ceiling, but tests have shown that the percentage reduction in heatlosses is less. As a result, the percentage reduction in heating costs will be lessthan the reduction in the air-conditioning costs. Also, the values given are fornew and undusted radiant barrier installations, and percentages will be lowerfor aged or dusty radiant barriers.
Some possible locations for attic radiant barriers are given in Figure21-34. In whole house tests on houses with R-19 attic floor insulation, radiantbarriers have reduced the ceiling heat gain by an average of 35 percent whenthe radiant barrier is installed on the attic floor, and by 24 percent when it isattached to the bottom of roof rafters. Test cell tests also demonstrated that thebest location for radiant barriers is the attic floor, provided that the attic is notused as a storage area and is kept clean.
For unvented attics, any heat transfer must occur through (1) the ceiling,(2) the attic space, and (3) the roof (Fig. 21-35). Therefore, the overall R-value
21-33
Heat Transferthrough Walls
and Roofs
FIGURE 21-33
Ventilation paths for a naturally ventilatedattic and the appropriate size of the flow
areas around the radiant barrier for properair circulation (from DOE/CE-0335P,
U.S. Dept. of Energy).
Airintake
Airintake
3 in.3 in. Radiantbarrier
Airexhaust
6 in.
FIGURE 21-34
Three possible locations for an attic radiant barrier (from DOE/CE-0335P, U.S. Dept. of Energy).
(a) Under the roof deck (b) At the bottom of rafters (c) On top of attic floor insulation
Roof deckingAir space
Rafter
Roof decking
Rafter
Roof decking
Radiantbarrier
JoistJoistJoist InsulationInsulationInsulation
Radiantbarrier
Radiantbarrier
Rafter

of the roof–ceiling combination with an unvented attic depends on the com-bined effects of the R-value of the ceiling and the R-value of the roof as wellas the thermal resistance of the attic space. The attic space can be treated as anair layer in the analysis. But a more practical way of accounting for its effectis to consider surface resistances on the roof and ceiling surfaces facing eachother. In this case, the R-values of the ceiling and the roof are first determinedseparately (by using convection resistances for the still-air case for the atticsurfaces). Then it can be shown that the overall R-value of the ceiling–roofcombination per unit area of the ceiling can be expressed as
R � Rceiling � Rroof (21-25)
where Aceiling and Aroof are the ceiling and roof areas, respectively. The area ra-tio is equal to 1 for flat roofs and is less than 1 for pitched roofs. For a 45°pitched roof, the area ratio is Aceiling/Aroof � 1/ � 0.707. Note that thepitched roof has a greater area for heat transfer than the flat ceiling, and thearea ratio accounts for the reduction in the unit R-value of the roof whenexpressed per unit area of the ceiling. Also, the direction of heat flow is up inwinter (heat loss through the roof) and down in summer (heat gain throughthe roof).
The R-value of a structure determined by analysis assumes that the mate-rials used and the quality of workmanship meet the standards. Poor work-manship and substandard materials used during construction may result inR-values that deviate from predicted values. Therefore, some engineers use asafety factor in their designs based on experience in critical applications.
21-7 � HEAT LOSS FROM BASEMENT WALLS AND FLOORS
The floors and the underground portion of the walls of a basement are in directcontact with the ground, which is usually at a different temperature thanthe basement, and thus there is heat transfer between the basement and theground. This is conduction heat transfer because of the direct contact betweenthe walls and the floor, and it depends on the temperature difference betweenthe basement and the ground, the construction of the walls and the floor, andthe thermal conductivity of the surrounding earth. There is considerableuncertainty in the ground heat loss calculations, and they probably consti-tute the least accurate part of heat load estimates of a building because ofthe large thermal mass of the ground and the large variation of the thermalconductivity of the soil [it varies between 0.5 and 2.5 W/m · °C (or 0.3 to1.4 Btu/h · ft · °F), depending on the composition and moisture content]. How-ever, ground heat losses are a small fraction of total heat load of a large build-ing, and thus it has little effect on the overall heat load.
Temperature measurements of uninsulated basements indicate that heatconduction through the ground is not one-dimensional, and thus it cannot beestimated by a simple one-dimensional heat conduction analysis. Instead, heatconduction is observed to be two-dimensional with nearly circular concentricheat flow lines centered at the intersection of the wall and the earth (Fig.21-36). When partial insulation is applied to the walls, the heat flow lines tendto be straight lines rather than being circular. Also, a basement wall whose topportion is exposed to ambient air may act as a thermal bridge, conducting heatupward and dissipating it to the ambient from its top part. This vertical heatflow may be significant in some cases.
�2
�Aceiling
Aroof�
21-34
CHAPTER 21Heating and Coolingof Buildings
FIGURE 21-35
Thermal resistance network for a pitchedroof–attic–ceiling combination for the caseof an unvented attic.
Rroof
Rceiling
To
Ti
Deck
Shingles
Rafter
Attic
Ceiling joist
Aroof
Tattic
Aceiling
FIGURE 21-36
Radial isotherms and circular heatflow lines during heat flow fromuninsulated basement.
Isotherms
Basement
WallGround
Heat fluxlines

Despite its complexity, heat loss through the below-grade section of base-ment walls can be determined easily from
Q·
basement walls � Uwall, ave Awall (Tbasement � Tground surface) (W) (21-26)
whereUwall, ave � Average overall heat transfer coefficient between the
basement wall and the surface of the groundAwall, ave � Wall surface area of the basement (underground portion)Tbasement � Interior air temperature of the basement
Tground surface � Mean ground surface temperature in winter
The overall heat transfer coefficients at different depths are given in Table21-14a for depth increments of 0.3 m (or 1 ft) for uninsulated and insulatedconcrete walls. These values are based on a soil thermal conductivity of1.38 W/m · °C (0.8 Btu/h · ft · °F). Note that the heat transfer coefficientvalues decrease with increasing depth since the heat at a lower section mustpass through a longer path to reach the ground surface. For a specified wall,Uwall, ave is simply the arithmetic average of the Uwall values corresponding tothe different sections of the wall. Also note that heat loss through a depthincrement is equal to the Uwall value of the increment multiplied by theperimeter of the building, the depth increment, and the temperature difference.
The interior air temperature of the basement can vary considerably, de-pending on whether it is being heated or not. In the absence of reliable data,the basement temperature can be taken to be 10°C since the heating system,water heater, and heating ducts are often located in the basement. Also, theground surface temperature fluctuates about the mean winter ambient temper-ature by an amplitude A that varies with geographic location and the conditionof the surface, as shown in Figure 21-37. Therefore, a reasonable value for thedesign temperature of ground surface can be obtained by subtracting A for thespecified location from the mean winter air temperature. That is,
Tground surface � Twinter, mean � A (21-27)
Heat loss through the basement floor is much smaller since the heat flowpath to the ground surface is much longer in this case. It is calculated in a sim-ilar manner from
Q·
basement floor � Ufloor Afloor (Tbasement � Tground surface) (W) (21-28)
where Ufloor is the overall heat transfer coefficient at the basement floor whosevalues are listed in Table 21-14b, Afloor is the floor area, and the temperaturedifference is the same as the one used for the basement wall.
The temperature of an unheated below-grade basement is between thetemperatures of the rooms above and the ground temperature. Heat lossesfrom the water heater and the space heater located in the basement usuallykeep the air near the basement ceiling sufficiently warm. Heat losses from therooms above to the basement can be neglected in such cases. This will not bethe case, however, if the basement has windows.
EXAMPLE 21-10 Heat Loss from a Below-Grade BasementConsider a basement in Chicago, where the mean winter temperature is 2.4°C.The basement is 8.5 m wide and 12 m long, and the basement floor is 2.1 m be-low grade (the ground level). The top 0.9-m section of the wall below the grade isinsulated with R-2.20 m2 · °C/W insulation. Assuming the interior temperature of
21-35
Heat Loss fromBasement Walls
and Floors
FIGURE 21-37
Lines of constant amplitude of annual soiltemperature swings (from ASHRAEHandbook of Fundamentals, Ref. 1,
Chap. 25, Fig. 6). Multiply by 1.8to get values in °F.
160 140 120 100 80 60
20
40
60
10°C
15°C
12° C
10°C
8°C
3°C5°C

TABLE 21-14
Heat transfer coefficients for heat loss through the basement walls, basement floors, and concrete floors on grade in bothSI and English units (from ASHRAE Handbook of Fundamentals, Ref. 1, Chap. 25, Tables 14, 15, 16)(a) Heat loss through below-grade basement walls
SI Units English UnitsUwall, W/m2 · °C
Insulation level, m2 · °C/WDepth, Nom insulation R-0.73 R-1.47 R-2.2
0.0–0.3 7.77 2.87 1.77 1.270.3–0.6 4.20 2.20 1.50 1.200.6–0.9 2.93 1.77 1.27 1.000.9–1.2 2.23 1.50 1.13 0.901.2–1.5 1.80 1.30 1.00 0.831.5–1.8 1.50 1.13 0.90 0.771.8–2.1 1.30 1.00 0.83 0.70
(b) Heat loss through below-grade basement floorsUfloor, W/m2 · °C
Shortest width of building, mDepth of wall below grade, m 6.0 7.3 8.5 9.7
1.5 0.18 0.16 0.15 0.131.8 0.17 0.15 0.14 0.122.1 0.16 0.15 0.13 0.12
(c) Heat loss through on-grade concrete basement floorsUgrade, W/m · °C
(per unit length of perimeter)
Weather conditionsInsulation
Wall (fromconstruc- edge totion footer) Mild Moderate Severe
8-in. (20-cm) block wall None 1.24 1.17 1.07with brick R-0.95 0.97 0.86 0.83
4-in. (10-cm) block wall None 1.61 1.45 1.38with brick R-0.95 0.93 0.85 0.81
Metal–stud wall with None 2.32 2.07 1.99stucco R-0.95 1.00 0.92 0.88
Poured concrete wall with heating pipes or ducts near None 4.72 3.67 3.18perimeter R-0.95 1.56 1.24 1.11
Uwall, Btu/h · ft2 · °FInsulation level, h · ft2 · °F/Btu
Depth, No ft insulation R-4.17 R-8.34 R-12.5
0–1 0.410 0.152 0.093 0.0671–2 0.222 0.116 0.079 0.0592–3 0.155 0.094 0.068 0.0533–4 0.119 0.079 0.060 0.0484–5 0.096 0.069 0.053 0.0445–6 0.079 0.060 0.048 0.0406–7 0.069 0.054 0.044 0.037
Ufloor, Btu/h · ft2 · °FShortest width of building, ftDepth of
wall below grade, ft 20 24 28 32
5 0.032 0.029 0.026 0.0236 0.030 0.027 0.025 0.0227 0.029 0.026 0.023 0.021
Ugrade, Btu/h · ft · °F (per unit length of perimeter)
Weather conditionsInsulation
Wall (fromconstruc- edge totion footer) Mild Moderate Severe
8-in. (20-cm) block wall None 0.62 0.68 0.72with brick R-5.4 0.48 0.50 0.56
4-in. (10-cm) block wall None 0.80 0.84 0.93with brick R-5.4 0.47 0.49 0.54
Metal–stud wall with None 1.15 1.20 1.34stucco R-5.4 0.51 0.53 0.38
Poured concrete wall with heating pipes or ducts near None 1.84 2.12 2.73perimeter R-5.4 0.64 0.72 0.90
21-36

the basement is 22°C, determine the peak heat loss from the basement to theground through its walls and floor.
Solution The peak heat loss from a below-grade basement in Chicago to theground through its walls and the floor is to be determined.
Assumption Steady operating conditions exist.
Properties The heat transfer coefficients are given in Table 21-14.
Analysis The schematic of the basement is given in Figure 21-38. The floor andwall areas of the basement are
Awall � Height � Perimeter � 2 � (2.1 m)(8.5 � 12)m � 86.1 m2
Afloor � Length � Width � (8.5 m)(12 m) � 102 m2
The amplitude of the annual soil temperature is determined from Figure 21-37 tobe 12°C. Then the ground surface temperature for the design heat loss becomes
Tground surface � Twinter, mean � A � 2.4 � 12 � �9.6°C
The top 0.9-m section of the wall below the grade is insulated with R-2.2, and theheat transfer coefficients through that section are given in Table 21-14a to be1.27, 1.20, and 1.00 W/m2 · °C through the first, second, and third 0.3-m-widedepth increments, respectively. The heat transfer coefficients through the un-insulated section of the wall that extends from the 0.9-m to the 2.1-m level aredetermined from the same table to be 2.23, 1.80, 1.50, and 1.30 W/m2 · °C foreach of the remaining 0.3-m-wide depth increments. The average overall heattransfer coefficient is
Uwall, ave �
� 1.47 W/m2 · °C
Then the heat loss through the basement wall becomes
Q· basement walls � Uwall, ave Awall (Tbasement � Tground surface)
� (1.47 W/m2 · °C)(86.1 m2)[22 � (�9.6)°C] � 4000 W
The shortest width of the house is 8.5 m, and the depth of the foundation belowgrade is 2.1 m. The floor heat transfer coefficient is given in Table 21-14b to be0.13 W/m2 · °C. Then the heat loss through the floor of the basement becomes
Q· basement floor � Ufloor Afloor (Tbasement � Tground surface)
� (0.13 W/m2 · °C)(102 m2)[(22 � (�9.6)]°C � 419 W
which is considerably less than the heat loss through the wall. The total heat lossfrom the basement is then determined to be
Q· basement � Q· basement walls � Q· basement floor � 4000 � 419 � 4419 W
This is the design or peak rate of heat transfer from the below-grade section of thebasement, and this is the value to be used when sizing the heating system. Theactual heat loss from the basement will be much less than that most of the time.
Concrete Floors on Grade (at Ground Level)
Many residential and commercial buildings do not have a basement, and thefloor sits directly on the ground at or slightly above the ground level. Researchindicates that heat loss from such floors is mostly through the perimeter to theoutside air rather than through the floor into the ground, as shown in Figure21-39. Therefore, total heat loss from a concrete slab floor is proportional tothe perimeter of the slab instead of the area of the floor and is expressed as
� Uwall
No. of increments�
1.27 � 1.2 � 1.0 � 2.23 � 1.8 � 1.5 � 1.37
21-37
Heat Loss fromBasement Walls
and Floors
FIGURE 21-38
Schematic for Example 21-10.
Basement
Wall
Insulation
Tground
Ground
22°C
0.9 m
2.1 m
FIGURE 21-39
An on-grade concrete floorwith insulated foundation wall.
Concretefooter
Concrete slab
ToTi
Heat flow
Frostdepth
Gradeline
Foundationwall
Insulation

Q·
floor on grade � Ugrade pfloor (Tindoor � Toutdoor) (W) (21-29)
where Ugrade represents the rate of heat transfer from the slab per unit temper-ature difference between the indoor temperature Tindoor and the outdoor tem-perature Toutdoor and per unit length of the perimeter pfloor of the building.
Typical values of Ugrade are listed in Table 21-14c for four common typesof slab-on-grade construction for mild, moderate, and severe weather condi-tions. The ground temperature is not involved in the formulation since the slabis located above the ground level and heat loss to the ground is negligible.Note from the table that perimeter insulation of slab-on-grade reduces heatlosses considerably, and thus it saves energy while enhancing comfort. Insu-lation is a must for radiating floors that contain heated pipes or ducts throughwhich hot water or air is circulated since heat loss in the uninsulated case isabout three times that of the insulated case. This is also the case when base-board heaters are used on the floor near the exterior walls. Heat transferthrough the floors and the basement is usually ignored in cooling loadcalculations.
Heat Loss from Crawl Spaces
A crawl space can be considered to be a small basement except that it may bevented year round to prevent the accumulation of moisture and radioactivegases such as radon. Venting the crawl space during the heating season createsa low temperature region underneath the house and causes considerable heatloss through the floor. The ceiling of the crawl space (i.e., the floor of thebuilding) in such cases must be insulated. If the vents are closed during theheating season, then the walls of the crawl space can be insulated instead.
The temperature of the crawl space will be very close to the ambient airtemperature when it is well ventilated. The heating ducts and hot water pipespassing through the crawl space must be adequately insulated in this case. Insevere climates, it may even be necessary to insulate the cold water pipes toprevent freezing. The temperature of the crawl space will approach the indoortemperature when the vents are closed for the heating season. The air infiltra-tion in this case is estimated to be 0.67 air change per hour.
When the crawl space temperature is known, heat loss through the floorof the building is determined from
Q·
building floor � Ubuilding floor Afloor (Tindoor � Tcrawl) (W) (21-30)
where Ubuilding floor is the overall heat transfer coefficient for the floor, Afloor isthe floor area, and Tindoor and Tcrawl are the indoor and crawl space tempera-tures, respectively.
Overall heat transfer coefficients associated with the walls, floors, andceilings of typical crawl spaces are given in Table 21-15. Note that heat lossthrough the uninsulated floor to the crawl space is three times that of the in-sulated floor. The ground temperature can be taken to be 10°C when calculat-ing heat loss from the crawl space to the ground. Also, the infiltration heat lossfrom the crawl space can be determined from
Q·
infiltration, crawl � (� CpV·
)air (Tcrawl � Tambient)
� � Cp(ACH)(Vcrawl)(Tcrawl � Tambient)(J/h) (21-31)
21-38
CHAPTER 21Heating and Coolingof Buildings
TABLE 21-15
Estimated U-values for insulated anduninsulated crawl spaces (fromASHRAE Handbook of Fundamentals,Ref. 1, Chap. 25, Table 13)
U, W/m2 · °C1
Un- In-Application insulated sulated2
Floor above crawl space 1.42 0.432
Ground of crawl space 0.437 0.437
Wall of crawl space 2.77 1.07
1Multiply given values by 0.176 to convertthem to Btu/h · ft2 · °F.2An insulation R-value of 1.94 m2 · °C/W isused on the floor, and 0.95 m2 · °C/W on thewalls.

where ACH is the air changes per hour, Vcrawl is the volume of the crawlspace, and Tcrawl and Tambient are the crawl space and ambient temperatures,respectively.
In the case of closed vents, the steady state temperature of the crawl spacewill be between the indoors and outdoors temperatures and can be determinedfrom the energy balance expressed as
Q·
floor � Q·
infiltration � Q·
ground � Q·
wall � 0 (W) (21-32)
and assuming all heat transfer to be toward the crawl space for convenience informulation.
EXAMPLE 21-11 Heat Loss to the Crawl Space through FloorsConsider a crawl space that is 8-m wide, 21-m long, and 0.70-m high, as shownin Figure 21-40, whose vent is kept open. The interior of the house is maintainedat 22°C and the ambient temperature is �5°C. Determine the rate of heat lossthrough the floor of the house to the crawl space for the cases of (a) an insulatedand (b) an uninsulated floor.
Solution The vent of the crawl space is kept open. The rate of heat loss to thecrawl space through insulated and uninsulated floors is to be determined.
Assumption Steady operating conditions exist.
Properties The overall heat transfer coefficient for the insulated floor is given inTable 21-15 to be 0.432 W/m2 · °C.
Analysis (a) The floor area of the house (or the ceiling area of the crawlspace) is
Afloor � Length � Width � (8 m)(12 m) � 96 m2
Then the heat loss from the house to the crawl space becomes
Q· insulated floor � Uinsulated floor Afloor (Tindoor � Tcrawl)
� (0.432 W/m2 · °C)(96 m2)[(22 � (�5)]°C � 1120 W
(b) The heat loss for the uninsulated case is determined similarly to be
Q· uninsulated floor � Uuninsulated floor Afloor (Tindoor � Tcrawl)
� (1.42 W/m2 · °C)(96 m2)[(22 � (�5)]°C � 3681 W
which is more than three times the heat loss through the insulated floor. Therefore,it is a good practice to insulate floors when the crawl space is ventilated to con-serve energy and enhance comfort.
21-8 � HEAT TRANSFER THROUGH WINDOWS
Windows are glazed apertures in the building envelope that typically consistof single or multiple glazing (glass or plastic), framing, and shading. In abuilding envelope, windows offer the least resistance to heat flow. In a typi-cal house, about one-third of the total heat loss in winter occurs through thewindows. Also, most air infiltration occurs at the edges of the windows. Thesolar heat gain through the windows is responsible for much of the coolingload in summer. The net effect of a window on the heat balance of a buildingdepends on the characteristics and orientation of the window as well as the so-lar and weather data. Workmanship is very important in the construction andinstallation of windows to provide effective sealing around the edges while al-lowing them to be opened and closed easily.
21-39
Heat Transferthrough Windows
FIGURE 21-40
Schematic for Example 21-11.
Crawlspace
Floor
House22°C
–5°C
Vent
0.7 m
Q·
Wall

Despite being so undesirable from an energy conservation point of view,windows are an essential part of any building envelope since they enhance theappearance of the building, allow daylight and solar heat to come in, and al-low people to view and observe outside without leaving their home. For low-rise buildings, windows also provide easy exit areas during emergencies suchas fire. Important considerations in the selection of windows are thermal com-fort and energy conservation. A window should have a good light transmit-tance while providing effective resistance to heat flow. The lightingrequirements of a building can be minimized by maximizing the use of naturaldaylight. Heat loss in winter through the windows can be minimized by usingairtight double- or triple-pane windows with spectrally selective films or coat-ings, and letting in as much solar radiation as possible. Heat gain and thuscooling load in summer can be minimized by using effective internal or ex-ternal shading on the windows.
Even in the absence of solar radiation and air infiltration, heat transferthrough the windows is more complicated than it appears to be. This is be-cause the structure and properties of the frame are quite different than theglazing. As a result, heat transfer through the frame and the edge section ofthe glazing adjacent to the frame is two-dimensional. Therefore, it is custom-ary to consider the window in three regions when analyzing heat transferthrough it: (1) the center-of-glass, (2) the edge-of-glass, and (3) the frame re-gions, as shown in Figure 21-41. Then the total rate of heat transfer throughthe window is determined by adding the heat transfer through each region as
Q·
window � Q·
center � Q·
edge � Q·
frame
� Uwindow Awindow (Tindoors � Toutdoors)(21-33)
where
Uwindow � (Ucenter Acenter � Uedge Aedge � Uframe Aframe)/Awindow (21-34)
is the U-factor or the overall heat transfer coefficient of the window; Awindow
is the window area; Acenter, Aedge, and Aframe are the areas of the center, edge,and frame sections of the window, respectively; and Ucenter, Uedge, and Uframe
are the heat transfer coefficients for the center, edge, and frame sections of thewindow. Note that Awindow � Acenter � Aedge � Aframe, and the overall U-factorof the window is determined from the area-weighed U-factors of each regionof the window. Also, the inverse of the U-factor is the R-value, which is theunit thermal resistance of the window (thermal resistance for a unit area).
Consider steady one-dimensional heat transfer through a single-paneglass of thickness L and thermal conductivity k. The thermal resistance net-work of this problem consists of surface resistances on the inner and outer sur-faces and the conduction resistance of the glass in series, as shown in Figure21-42, and the total resistance on a unit area basis can be expressed as
Rtotal � Rinside � Rglass � Routside � (21-35)
Using common values of 3 mm for the thickness and 0.92 W/m · °C for thethermal conductivity of the glass and the winter design values of 8.29 and34.0 W/m2 · °C for the inner and outer surface heat transfer coefficients, thethermal resistance of the glass is determined to be
1hi
�Lglass
kglass�
1ho
21-40
CHAPTER 21Heating and Coolingof Buildings
FIGURE 21-41
The three regions of a window consideredin heat transfer analysis.
Glazing(glass or plastic)
Frame
Edge of glass
Center of glass
FIGURE 21-42
The thermal resistance network for heattransfer through a single glass.
1—hi
L—k
1—ho
L
khi
Ti To
ho
RglassRinside Routside
Glass

Rtotal �
� 0.121 � 0.003 � 0.029 � 0.153 m2 · °C/W
Note that the ratio of the glass resistance to the total resistance is
� 2.0%
That is, the glass layer itself contributes about 2 percent of the total ther-mal resistance of the window, which is negligible. The situation would not be much different if we used acrylic, whose thermal conductivity is0.19 W/m · °C, instead of glass. Therefore, we cannot reduce the heat transferthrough the window effectively by simply increasing the thickness of theglass. But we can reduce it by trapping still air between two layers of glass.The result is a double-pane window, which has become the norm in windowconstruction.
The thermal conductivity of air at room temperature is kair � 0.025 W/m · °C, which is one-thirtieth that of glass. Therefore, the thermal resis-tance of 1-cm-thick still air is equivalent to the thermal resistance of a 30-cm-thick glass layer. Disregarding the thermal resistances of glass layers, thethermal resistance and U-factor of a double-pane window can be expressed as(Fig. 21-43)
� (21-36)
where hspace � hrad, space � hconv, space is the combined radiation and convectionheat transfer coefficient of the space trapped between the two glass layers.
Roughly half of the heat transfer through the air space of a double-panewindow is by radiation and the other half is by conduction (or convection, ifthere is any air motion). Therefore, there are two ways to minimize hspace andthus the rate of heat transfer through a double-pane window:
1. Minimize radiation heat transfer through the air space. This can bedone by reducing the emissivity of glass surfaces by coating them with low-emissivity (or “low-e” for short) material. Recall that the effective emissivityof two parallel plates of emissivities �1 and �2 is given by
�effective �
The emissivity of an ordinary glass surface is 0.84. Therefore, the effectiveemissivity of two parallel glass surfaces facing each other is 0.72. But whenthe glass surfaces are coated with a film that has an emissivity of 0.1, the ef-fective emissivity reduces to 0.05, which is one-fourteenth of 0.72. Then forthe same surface temperatures, radiation heat transfer will also go down by afactor of 14. Even if only one of the surfaces is coated, the overall emissivityreduces to 0.1, which is the emissivity of the coating. Thus it is no surprisethat about one-fourth of all windows sold for residences have a low-e coating.The heat transfer coefficient hspace for the air space trapped between the twovertical parallel glass layers is given in Table 21-16 for 13-mm- ( -in.) and6-mm- ( -in.) thick air spaces for various effective emissivities and tempera-ture differences.
14
12
11/�1 � 1/�2 � 1
1hi
�1
hspace�
1ho
1Udouble-pane (center region)
Rglass
Rtotal�
0.003 m2 · °C/W0.153 m2 · °C/W
18.29 W/m2 · °C
�0.003 m
0.92 W/m · °C�
134.0 W/m2 · °C
21-41
Heat Transferthrough Windows
FIGURE 21-43
The thermal resistance network for heattransfer through the center section of a
double-pane window (the resistancesof the glasses are neglected).
1—hi
1——hspace
1—ho
Ti ToRspace
Airspace
Glass
Rinside Routside

It can be shown that coating just one of the two parallel surfaces facingeach other by a material of emissivity � reduces the effective emissivity nearlyto �. Therefore, it is usually more economical to coat only one of the facingsurfaces. Note from Figure 21-44 that coating one of the interior surfaces of adouble-pane window with a material having an emissivity of 0.1 reduces therate of heat transfer through the center section of the window by half.
21-42
CHAPTER 21Heating and Coolingof Buildings
TABLE 21-16
The heat transfer coefficient hspace for the air space trapped between the twovertical parallel glass layers for 13-mm- and 6-mm-thick air spaces (fromBuilding Materials and Structures, Report 151, U.S. Dept. of Commerce).
(a) Air space thickness � 13 mm (b) Air space thickness � 6 mmhspace, W/m2 · °C*
�effectiveTave, �T,°C °C 0.72 0.4 0.2 0.1
0 5 5.3 3.8 2.9 2.40 15 5.3 3.8 2.9 2.40 30 5.5 4.0 3.1 2.6
10 5 5.7 4.1 3.0 2.510 15 5.7 4.1 3.1 2.510 30 6.0 4.3 3.3 2.7
30 5 5.7 4.6 3.4 2.730 15 5.7 4.7 3.4 2.830 30 6.0 4.9 3.6 3.0
hspace, W/m2 · °C*�effectiveTave, �T,
°C °C 0.72 0.4 0.2 0.1
0 5 7.2 5.7 4.8 4.30 50 7.2 5.7 4.8 4.3
10 5 7.7 6.0 5.0 4.510 50 7.7 6.1 5.0 4.5
30 5 8.8 6.8 5.5 4.930 50 8.8 6.8 5.5 4.9
50 5 10.0 7.5 6.0 5.250 50 10.0 7.5 6.0 5.2
*Multiply by 0.176 to convert to Btu/h · ft2 · °F.
FIGURE 21-44
The variation of the U-factor for the center section of double- and triple-pane windows with uniform spacing between the panes (fromASHRAE Handbook of Fundamentals, Ref. 1, Chap. 27, Fig. 1).
0 5 10
Gap width, mm
(a) Double-pane window (b) Triple-pane window
Gap width, mm
15 20 25
4.5
4
3.5
3
2.5
2
1.5
1
0.5
0
Cen
ter-
of-g
lass
U-f
acto
r, W
/m2 ·
K
0 5 10 15 20 25
4.5
4
3.5
3
2.5
2
1.5
1
0.5
0
Cen
ter-
of-g
lass
U-f
acto
r, W
/m2 ·
K
Air
Gas fill in gap
Argon
Krypton
Air
Gas fill in gapTriple-paneglazing
Innerglass
Outerglass
Argon
Krypton
2 4 6
1 3 5
2 4
1 3
Outerglass Inner
glass
ε = 0.10 on surface 2 or 3
Double-paneglazing
ε = 0.10 on surfaces2 or 3 and 4 or 5
ε = 0.84
ε = 0.84

2. Minimize conduction heat transfer through air space. This can be done byincreasing the distance d between the two glasses. However, this cannot bedone indefinitely since increasing the spacing beyond a critical value initiatesconvection currents in the enclosed air space, which increases the heat trans-fer coefficient and thus defeats the purpose. Besides, increasing the spacingalso increases the thickness of the necessary framing and the cost of the win-dow. Experimental studies have shown that when the spacing d is less thanabout 13 mm, there is no convection, and heat transfer through the air is byconduction. But as the spacing is increased further, convection currents appearin the air space, and the increase in heat transfer coefficient offsets any bene-fit obtained by the thicker air layer. As a result, the heat transfer coefficient re-mains nearly constant, as shown in Figure 21-44. Therefore, it makes no senseto use an air space thicker than 13 mm in a double-pane window unless a thinpolyester film is used to divide the air space into two halves to suppress con-vection currents. The film provides added insulation without adding much tothe weight or cost of the double-pane window. The thermal resistance of thewindow can be increased further by using triple- or quadruple-pane windowswhenever it is economical to do so. Note that using a triple-pane window in-stead of a double-pane reduces the rate of heat transfer through the center sec-tion of the window by about one-third.
Another way of reducing conduction heat transfer through a double-panewindow is to use a less-conducting fluid such as argon or krypton to fill thegap between the glasses instead of air. The gap in this case needs to be wellsealed to prevent the gas from leaking outside. Of course, another alternativeis to evacuate the gap between the glasses completely, but it is not practicalto do so.
Edge-of-Glass U-Factor of a WindowThe glasses in double- and triple-pane windows are kept apart from each otherat a uniform distance by spacers made of metals or insulators like aluminum,fiberglass, wood, and butyl. Continuous spacer strips are placed around theglass perimeter to provide edge seal as well as uniform spacing. However, thespacers also serve as undesirable “thermal bridges” between the glasses,which are at different temperatures, and this short-circuiting may increase heattransfer through the window considerably. Heat transfer in the edge region ofa window is two-dimensional, and lab measurements indicate that the edge ef-fects are limited to a 6.5-cm-wide band around the perimeter of the glass.
The U-factor for the edge region of a window is given in Figure 21-45relative to the U-factor for the center region of the window. The curve wouldbe a straight diagonal line if the two U-values were equal to each other. Notethat this is almost the case for insulating spacers such as wood and fiberglass.But the U-factor for the edge region can be twice that of the center region forconducting spacers such as those made of aluminum. Values for steel spacersfall between the two curves for metallic and insulating spacers. The edge ef-fect is not applicable to single-pane windows.
Frame U-FactorThe framing of a window consists of the entire window except the glazing.Heat transfer through the framing is difficult to determine because of the dif-ferent window configurations, different sizes, different constructions, and dif-ferent combination of materials used in the frame construction. The type ofglazing such as single pane, double pane, and triple pane affects the thicknessof the framing and thus heat transfer through the frame. Most frames are made
21-43
Heat Transferthrough Windows
FIGURE 21-45
The edge-of-glass U-factor relative to thecenter-of-glass U-factor for windows with
various spacers (from ASHRAE Handbookof Fundamentals, Ref. 1, Chap. 27, Fig. 2).
5
4
3
2
1
00 1 2
Metallic
Insulating
Ideal
Spacer type
Center-of-glass U-factor, W/m2·K
3 4 5
Edg
e-of
-gla
ss U
-fac
tor,
W/m
2 ·K

of wood, aluminum, vinyl, or fiberglass. However, using a combination ofthese materials (such as aluminum-clad wood and vinyl-clad aluminum) isalso common to improve appearance and durability.
Aluminum is a popular framing material because it is inexpensive,durable, and easy to manufacture, and does not rot or absorb water like wood.However, from a heat transfer point of view, it is the least desirable framingmaterial because of its high thermal conductivity. It will come as no surprisethat the U-factor of solid aluminum frames is the highest, and thus a windowwith aluminum framing will lose much more heat than a comparable windowwith wood or vinyl framing. Heat transfer through the aluminum framingmembers can be reduced by using plastic inserts between components to serveas thermal barriers. The thickness of these inserts greatly affects heat transferthrough the frame. For aluminum frames without the plastic strips, the pri-mary resistance to heat transfer is due to the interior surface heat transfer co-efficient. The U-factors for various frames are listed in Table 21-17 as afunction of spacer materials and the glazing unit thicknesses. Note that theU-factor of metal framing and thus the rate of heat transfer through a metalwindow frame is more than three times that of a wood or vinyl window frame.
Interior and Exterior Surface Heat Transfer CoefficientsHeat transfer through a window is also affected by the convection and radia-tion heat transfer coefficients between the glass surfaces and surroundings.The effects of convection and radiation on the inner and outer surfaces ofglazings are usually combined into the combined convection and radiationheat transfer coefficients hi and ho, respectively. Under still air conditions, thecombined heat transfer coefficient at the inner surface of a vertical windowcan be determined from
hi � hconv � hrad � 1.77(Tg � Ti)0.25 � (W/m2 · °C)(21-37)
where Tg � glass temperature in K, Ti � indoor air temperature in K, �g �emissivity of the inner surface of the glass exposed to the room (taken to be0.84 for uncoated glass), and � � 5.67 � 10�8 W/m2 · K4 is the Stefan–Boltzmann constant. Here the temperature of the interior surfaces facing thewindow is assumed to be equal to the indoor air temperature. This assumptionis reasonable when the window faces mostly interior walls, but it becomesquestionable when the window is exposed to heated or cooled surfaces or toother windows. The commonly used value of hi for peak load calculation is
hi � 8.29 W/m2 · °C � 1.46 Btu/h · ft2 · °F (winter and summer)
which corresponds to the winter design conditions of Ti � 22°C andTg � �7°C for uncoated glass with �g � 0.84. But the same value of hi canalso be used for summer design conditions as it corresponds to summer con-ditions of Ti � 24°C and Tg � 32°C. The values of hi for various temperaturesand glass emissivities are given in Table 21-18. The commonly used values ofho for peak load calculations are the same as those used for outer wall surfaces(34.0 W/m2 · °C for winter and 22.7 W/m2 · °C for summer).
Overall U-Factor of Windows
The overall U-factors for various kinds of windows and skylights are evalu-ated using computer simulations and laboratory testing for winter design con-ditions; representative values are given in Table 21-19. Test data may provide
�g�(T 4g � T 4
i )
Tg � Ti
21-44
CHAPTER 21Heating and Coolingof Buildings
TABLE 21-17
Representative frame U-factorsfor fixed vertical windows (fromASHRAE Handbook of Fundamentals,Ref. 1, Chap. 27, Table 2)
U-factor, Frame material W/m2 · °C*
Aluminum:Single glazing (3 mm) 10.1Double glazing (18 mm) 10.1Triple glazing (33 mm) 10.1
Wood or vinyl:Single glazing (3 mm) 2.9Double glazing (18 mm) 2.8Triple glazing (33 mm) 2.7
*Multiply by 0.176 to convert to Btu/h · ft2 · °F
TABLE 21-18
Combined convection and radiationheat transfer coefficient hi at the innersurface of a vertical glass under stillair conditions (in W/m2 · °C)*
Glass emissivity, �gTi, Tg,°C °C 0.05 0.20 0.84
20 17 2.6 3.5 7.120 15 2.9 3.8 7.320 10 3.4 4.2 7.720 5 3.7 4.5 7.920 0 4.0 4.8 8.120 �5 4.2 5.0 8.220 �10 4.4 5.1 8.3
*Multiply by 0.176 to convert to Btu/h · ft2 · °F.

more accurate information for specific products and should be preferred whenavailable. However, the values listed in the table can be used to obtain satis-factory results under various conditions in the absence of product-specificdata. The U-factor of a fenestration product that differs considerably fromthe ones in the table can be determined by (1) determining the fractions ofthe area that are frame, center-of-glass, and edge-of-glass (assuming a
TABLE 21-19
Overall U-factors (heat transfer coefficients) for various windows and skylights in W/m2 · °C (from ASHRAE Handbook of Fundamentals, Ref. 1, Chap. 27, Table 5)Aluminum frame
Glass section (without thermal(glazing) only break) Wood or vinyl frame
Center- Edge-of- Double Sloped Double SlopedType → of-glass glass Fixed door skylight Fixed door skylight
32 mm 53 mm 19 mm 41 mm 88 mm 23 mmFrame width → (Not applicable) (1 in.) (2 in.) ( in.) (1 in.) (3 in.) ( in.)
Spacer type → — Metal Insul. All All All Metal Insul. Metal Insul. Metal Insul.
Glazing Type
Single Glazing3 mm ( in.) glass 6.30 6.30 — 6.63 7.16 9.88 5.93 — 5.57 — 7.57 —6.4 mm ( in.) acrylic 5.28 5.28 — 5.69 6.27 8.86 5.02 — 4.77 — 6.57 —3 mm ( in.) acrylic 5.79 5.79 — 6.16 6.71 9.94 5.48 — 5.17 — 7.63 —
Double Glazing (no coating)6.4 mm air space 3.24 3.71 3.34 3.90 4.55 6.70 3.26 3.16 3.20 3.09 4.37 4.2212.7 mm air space 2.78 3.40 2.91 3.51 4.18 6.65 2.88 2.76 2.86 2.74 4.32 4.176.4 mm argon space 2.95 3.52 3.07 3.66 4.32 6.47 3.03 2.91 2.98 2.87 4.14 3.9712.7 mm argon space 2.61 3.28 2.76 3.36 4.04 6.47 2.74 2.61 2.73 2.60 4.14 3.97
Double Glazing [� � 0.1, coating on one of the surfaces of air space (surface 2 or 3, counting from the outside toward inside)]6.4 mm air space 2.44 3.16 2.60 3.21 3.89 6.04 2.59 2.46 2.60 2.47 3.73 3.5312.7 mm air space 1.82 2.71 2.06 2.67 3.37 6.04 2.06 1.92 2.13 1.99 3.73 3.536.4 mm argon space 1.99 2.83 2.21 2.82 3.52 5.62 2.21 2.07 2.26 2.12 3.32 3.0912.7 mm argon space 1.53 2.49 1.83 2.42 3.14 5.71 1.82 1.67 1.91 1.78 3.41 3.19
Triple Glazing (no coating)6.4 mm air space 2.16 2.96 2.35 2.97 3.66 5.81 2.34 2.18 2.36 2.21 3.48 3.2412.7 mm air space 1.76 2.67 2.02 2.62 3.33 5.67 2.01 1.84 2.07 1.91 3.34 3.096.4 mm argon space 1.93 2.79 2.16 2.77 3.47 5.57 2.15 1.99 2.19 2.04 3.25 3.0012.7 mm argon space 1.65 2.58 1.92 2.52 3.23 5.53 1.91 1.74 1.98 1.82 3.20 2.95
Triple Glazing [� � 0.1, coating on one of the surfaces of air spaces (surfaces 3 and 5, counting from the outside toward inside)]6.4 mm air space 1.53 2.49 1.83 2.42 3.14 5.24 1.81 1.64 1.89 1.73 2.92 2.6612.7 mm air space 0.97 2.05 1.38 1.92 2.66 5.10 1.33 1.15 1.46 1.30 2.78 2.526.4 mm argon space 1.19 2.23 1.56 2.12 2.85 4.90 1.52 1.35 1.64 1.47 2.59 2.3312.7 mm argon space 0.80 1.92 1.25 1.77 2.51 4.86 1.18 1.01 1.33 1.17 2.55 2.28
Notes:
(1) Multiply by 0.176 to obtain U-factors in Btu/h · ft2 · °F.
(2) The U-factors in this table include the effects of surface heat transfer coefficients and are based on winter conditions of �18°C outdoorair and 21°C indoor air temperature, with 24 km/h (15 mph) winds outdoors and zero solar flux. Small changes in indoor and outdoor tem-peratures will not affect the overall U-factors much. Windows are assumed to be vertical, and the skylights are tilted 20° from the horizontalwith upward heat flow. Insulation spacers are wood, fiberglass, or butyl. Edge-of-glass effects are assumed to extend the 65-mm bandaround perimeter of each glazing. The product sizes are 1.2 m � 1.8 m for fixed windows, 1.8 m � 2.0 m for double-door windows, and1.2 m � 0.6 m for the skylights, but the values given can also be used for products of similar sizes. All data are based on 3-mm ( -in.) glassunless noted otherwise.
18
18
14
18
78
718
58
34
14
21-45

65-mm-wide band around the perimeter of each glazing), (2) determining theU-factors for each section (the center-of-glass and edge-of-glass U-factors canbe taken from the first two columns of Table 21-19 and the frame U-factorcan be taken from Table 21-18 or other sources), and (3) multiplying the areafractions and the U-factors for each section and adding them up (or fromEq. 21-34 for Uwindow).
Glazed wall systems can be treated as fixed windows. Also, the data fordouble-door windows can be used for single-glass doors. Several observationscan be made from the data in the table:
1. Skylight U-factors are considerably greater than those of vertical win-dows. This is because the skylight area, including the curb, can be 13 to 240percent greater than the rough opening area. The slope of the skylight also hassome effect.
2. The U-factor of multiple-glazed units can be reduced considerably by fill-ing cavities with argon gas instead of dry air. The performance of CO2-filledunits is similar to those filled with argon. The U-factor can be reduced evenfurther by filling the glazing cavities with krypton gas.
3. Coating the glazing surfaces with low-e (low-emissivity) films reducesthe U-factor significantly. For multiple-glazed units, it is adequate to coat oneof the two surfaces facing each other.
4. The thicker the air space in multiple-glazed units, the lower the U-factor,for a thickness of up to 13 mm ( in.) of air space. For a specified number ofglazings, the window with thicker air layers will have a lower U-factor. For aspecified overall thickness of glazing, the higher the number of glazings, thelower the U-factor. Therefore, a triple-pane window with air spaces of 6.4 mm(two such air spaces) will have a lower U-value than a double-pane windowwith an air space of 12.7 mm.
5. Wood or vinyl frame windows have a considerably lower U-value thancomparable metal-frame windows. Therefore, wood or vinyl frame windowsare called for in energy-efficient designs.
EXAMPLE 21-12 U-Factor for Center-of-Glass Section of WindowsDetermine the U-factor for the center-of-glass section of a double-pane windowwith a 6-mm air space for winter design conditions (Fig. 21-46). The glazings aremade of clear glass that has an emissivity of 0.84. Take the average air spacetemperature at design conditions to be 0°C.
Solution The U-factor for the center-of-glass section of a double-pane windowis to be determined.
Assumptions 1 Steady operating conditions exist. 2 Heat transfer through thewindow is one-dimensional. 3 The thermal resistance of glass sheets is negligible.
Properties The emissivity of clear glass is 0.84.
Analysis Disregarding the thermal resistance of glass sheets, which are small,the U-factor for the center region of a double-pane window is determined from
�
where hi, hspace, and ho are the heat transfer coefficients at the inner surface of thewindow, the air space between the glass layers, and the outer surface of the win-dow, respectively. The values of hi and ho for winter design conditions were given
1hi
�1
hspace�
1ho
1Ucenter
12
21-46
CHAPTER 21Heating and Coolingof Buildings
FIGURE 21-46
Schematic of Example 21-12.
1—hi
1——hspace
1—ho
Airspace
6 mm
Glass
ε = 0.84

earlier to be hi � 8.29 W/m2 · °C and ho � 34.0 W/m2 · °C. The effective emissivityof the air space of the double-pane window is
�effective � � 0.72
For this value of emissivity and an average air space temperature of 0°C, we readhspace � 7.2 W/m2 · °C from Table 21-16 for 6-mm-thick air space. Therefore,
→ Ucenter � 3.46 W/m2 · °C
Discussion The center-of-glass U-factor value of 3.24 W/m2 · °C in Table 21-19(fourth row and second column) is obtained by using a standard value of ho �29 W/m2 · °C (instead of 34.0 W/m2 · °C) and hspace � 6.5 W/m2 · °C at an averageair space temperature of �15°C.
EXAMPLE 21-13 Heat Loss through Aluminum Framed WindowsA fixed aluminum-framed window with glass glazing is being considered for anopening that is 4 ft high and 6 ft wide in the wall of a house that is maintained at72°F (Fig. 21-47). Determine the rate of heat loss through the window and theinner surface temperature of the window glass facing the room when the outdoorair temperature is 15°F if the window is selected to be (a) -in. single glazing,(b) double glazing with an air space of in., and (c) low-e-coated triple glazingwith an air space of in.
Solution The rate of heat loss through an aluminum framed window and theinner surface temperature are to be determined from the cases of single-pane,double-pane, and low-e triple-pane windows.
Assumptions 1 Steady operating conditions exist. 2 Heat transfer through thewindow is one-dimensional. 3 Thermal properties of the windows and the heattransfer coefficients are constant.
Properties The U-factors of the windows are given in Table 21-19.
Analysis The rate of heat transfer through the window can be determined from
Q· window � Uoverall Awindow(Ti � To)
where Ti and To are the indoor and outdoor air temperatures, respectively; Uoverall
is the U-factor (the overall heat transfer coefficient) of the window; and Awindow isthe window area, which is determined to be
Awindow � Height � Width � (4 ft)(6 ft) � 24 ft2
The U-factors for the three cases can be determined directly from Table 21-19 tobe 6.63, 3.51, and 1.92 W/m2 · °C, respectively, to be multiplied by the factor0.176 to convert them to Btu/h · ft2 · °F. Also, the inner surface temperature of thewindow glass can be determined from Newton’s law
Q· window � hi Awindow (Ti � Tglass) → Tglass � Ti �
where hi is the heat transfer coefficient on the inner surface of the window, whichis determined from Table 21-18 to be hi � 8.3 W/m2 · °C � 1.46 Btu/h · ft2 · °F.Then the rate of heat loss and the interior glass temperature for each case are de-termined as follows:
(a) Single glazing:
Q· window � (6.63 � 0.176 Btu/h · ft2 · °F)(24 ft2)(72 � 15)°F � 1596 Btu/h
Tglass � Ti � � 72°F � � 26.5°F1596 Btu/h
(1.46 Btu/h · ft2 · °F)(24 ft2)
Q·
window
hi Awindow
Q·window
hi Awindow
12
12
18
1Ucenter
�1
8.29�
17.2
�1
34.0
11/�1 � 1/�2 � 1
�1
1/0.84 � 1/0.84 � 1
21-47
Heat Transferthrough Windows
FIGURE 21-47
Schematic for Example 21-13.
Aluminumframe
4 ft
6 ft
Glazing(a) Single(b) Double(c) Low-e triple

(b) Double glazing ( in. air space):
Q· window � (3.51 � 0.176 Btu/h · ft2 · °F)(24 ft2)(72 � 15)°F � 845 Btu/h
Tglass � Ti � � 72°F � � 47.9°F
(c) Triple glazing ( in. air space, low-e coated):
Q· window � (1.92 � 0.176 Btu/h · ft2 · °F)(24 ft2)(72 � 15)°F � 462 Btu/h
Tglass � Ti � � 72°F � � 58.8°F
Therefore, heat loss through the window will be reduced by 47 percent in the caseof double glazing and by 71 percent in the case of triple glazing relative to thesingle-glazing case. Also, in the case of single glazing, the low inner-glass sur-face temperature will cause considerable discomfort in the occupants because ofthe excessive heat loss from the body by radiation. It is raised from 26.5°F, whichis below freezing, to 47.9°F in the case of double glazing and to 58.8°F in thecase of triple glazing.
EXAMPLE 21-14 U-Factor of a Double-Door WindowDetermine the overall U-factor for a double-door-type, wood-framed double-panewindow with metal spacers, and compare your result to the value listed in Table21-19. The overall dimensions of the window are 1.80 m � 2.00 m, and the di-mensions of each glazing are 1.72 m � 0.94 m (Fig. 21-48).
Solution The overall U-factor for a double-door type window is to be deter-mined, and the result is to be compared to the tabulated value.
Assumptions 1 Steady operating conditions exist. 2 Heat transfer through thewindow is one-dimensional.
Properties The U-factors for the various sections of windows are given in Tables21-17 and 21-19.
Analysis The areas of the window, the glazing, and the frame are
Awindow � Height � Width � (1.8 m)(2.0 m) � 3.60 m2
Aglazing � 2 � (Height � Width) � 2(1.72 m)(0.94 m) � 3.23 m2
Aframe � Awindow � Aglazing � 3.60 � 3.23 � 0.37 m2
The edge-of-glass region consists of a 6.5-cm-wide band around the perimeter ofthe glazings, and the areas of the center and edge sections of the glazing are de-termined to be
Acenter � 2 � (Height � Width) � 2(1.72 � 0.13 m)(0.94 � 0.13 m) � 2.58 m2
Aedge � Aglazing � Acenter � 3.23 � 2.58 � 0.65 m2
The U-factor for the frame section is determined from Table 21-17 to beUframe � 2.8 W/m2 · °C. The U-factors for the center and edge sections are deter-mined from Table 21-19 (fifth row, second and third columns) to be Ucenter �3.24 W/m2 · °C and Uedge � 3.71 W/m2 · °C. Then the overall U-factor of the entirewindow becomes
Uwindow � (Ucenter Acenter � Uedge Aedge � Uframe Aframe)/Awindow
� (3.24 � 2.58 � 3.71 � 0.65 � 2.8 � 0.37)/3.60
� 3.28 W/m2 · °C
462 Btu/h(1.46 Btu/h · ft2 · °F)(24 ft2)
Q·
window
hi Awindow
12
845 Btu/h(1.46 Btu/h · ft2 · °F)(24 ft2)
Q·
window
hi Awindow
1221-48
CHAPTER 21Heating and Coolingof Buildings
FIGURE 21-48
Schematic for Example 21-14.
FrameEdge
of glassCenterof glass
1.72 m
1.8 m
0.94 m 0.94 m
2 m
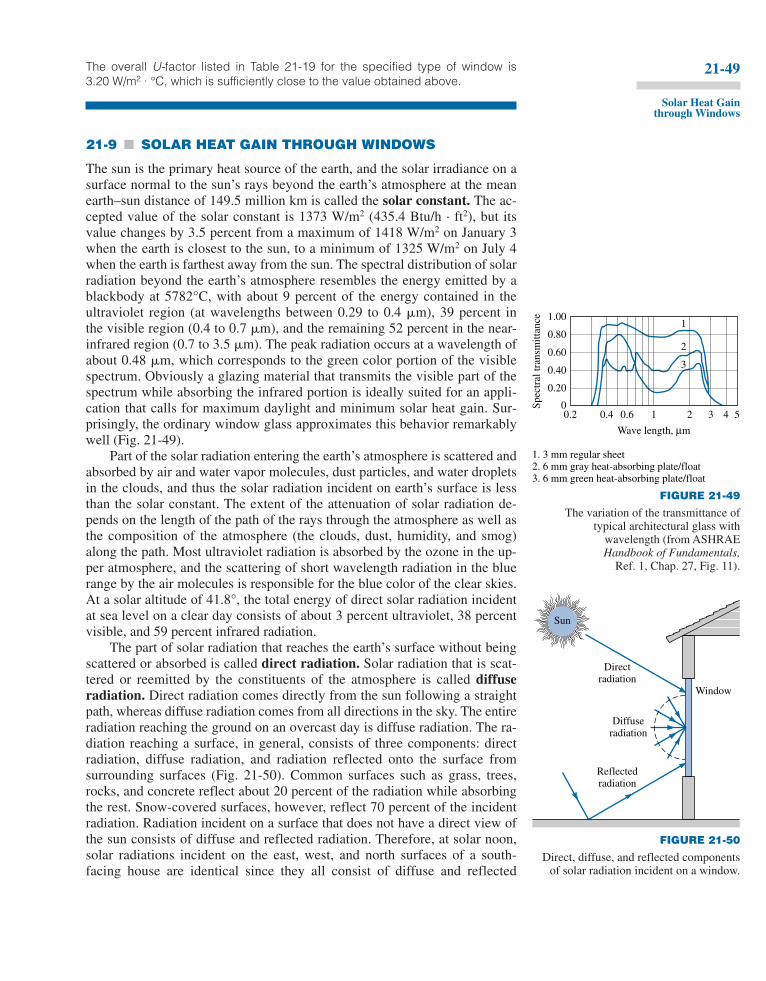
The overall U-factor listed in Table 21-19 for the specified type of window is3.20 W/m2 · °C, which is sufficiently close to the value obtained above.
21-9 � SOLAR HEAT GAIN THROUGH WINDOWS
The sun is the primary heat source of the earth, and the solar irradiance on asurface normal to the sun’s rays beyond the earth’s atmosphere at the meanearth–sun distance of 149.5 million km is called the solar constant. The ac-cepted value of the solar constant is 1373 W/m2 (435.4 Btu/h · ft2), but itsvalue changes by 3.5 percent from a maximum of 1418 W/m2 on January 3when the earth is closest to the sun, to a minimum of 1325 W/m2 on July 4when the earth is farthest away from the sun. The spectral distribution of solarradiation beyond the earth’s atmosphere resembles the energy emitted by ablackbody at 5782°C, with about 9 percent of the energy contained in theultraviolet region (at wavelengths between 0.29 to 0.4 �m), 39 percent inthe visible region (0.4 to 0.7 �m), and the remaining 52 percent in the near-infrared region (0.7 to 3.5 �m). The peak radiation occurs at a wavelength ofabout 0.48 �m, which corresponds to the green color portion of the visiblespectrum. Obviously a glazing material that transmits the visible part of thespectrum while absorbing the infrared portion is ideally suited for an appli-cation that calls for maximum daylight and minimum solar heat gain. Sur-prisingly, the ordinary window glass approximates this behavior remarkablywell (Fig. 21-49).
Part of the solar radiation entering the earth’s atmosphere is scattered andabsorbed by air and water vapor molecules, dust particles, and water dropletsin the clouds, and thus the solar radiation incident on earth’s surface is lessthan the solar constant. The extent of the attenuation of solar radiation de-pends on the length of the path of the rays through the atmosphere as well asthe composition of the atmosphere (the clouds, dust, humidity, and smog)along the path. Most ultraviolet radiation is absorbed by the ozone in the up-per atmosphere, and the scattering of short wavelength radiation in the bluerange by the air molecules is responsible for the blue color of the clear skies.At a solar altitude of 41.8°, the total energy of direct solar radiation incidentat sea level on a clear day consists of about 3 percent ultraviolet, 38 percentvisible, and 59 percent infrared radiation.
The part of solar radiation that reaches the earth’s surface without beingscattered or absorbed is called direct radiation. Solar radiation that is scat-tered or reemitted by the constituents of the atmosphere is called diffuseradiation. Direct radiation comes directly from the sun following a straightpath, whereas diffuse radiation comes from all directions in the sky. The entireradiation reaching the ground on an overcast day is diffuse radiation. The ra-diation reaching a surface, in general, consists of three components: directradiation, diffuse radiation, and radiation reflected onto the surface fromsurrounding surfaces (Fig. 21-50). Common surfaces such as grass, trees,rocks, and concrete reflect about 20 percent of the radiation while absorbingthe rest. Snow-covered surfaces, however, reflect 70 percent of the incidentradiation. Radiation incident on a surface that does not have a direct view ofthe sun consists of diffuse and reflected radiation. Therefore, at solar noon,solar radiations incident on the east, west, and north surfaces of a south-facing house are identical since they all consist of diffuse and reflected
21-49
Solar Heat Gainthrough Windows
FIGURE 21-50
Direct, diffuse, and reflected componentsof solar radiation incident on a window.
Window
Directradiation
Reflectedradiation
Diffuseradiation
Sun
FIGURE 21-49
The variation of the transmittance oftypical architectural glass with
wavelength (from ASHRAEHandbook of Fundamentals,
Ref. 1, Chap. 27, Fig. 11).
1.00
0.2 0.4 0.6 1
Wave length, µm
1. 3 mm regular sheet2. 6 mm gray heat-absorbing plate/float3. 6 mm green heat-absorbing plate/float
1
2
3
2 3 4 5
0.80
0.60
0.40
0.20
0Spec
tral
tran
smitt
ance

components. The difference between the radiations incident on the south andnorth walls in this case gives the magnitude of direct radiation incident on thesouth wall.
When solar radiation strikes a glass surface, part of it (about 8 percent foruncoated clear glass) is reflected back to outdoors, part of it (5 to 50 percent,depending on composition and thickness) is absorbed within the glass, and theremainder is transmitted indoors, as shown in Figure 21-51. The conservationof energy principle requires that the sum of the transmitted, reflected, andabsorbed solar radiations be equal to the incident solar radiation. That is,
�s � �s � s � 1
where �s is the transmissivity, �s is the reflectivity, and s is the absorptivity ofthe glass for solar energy, which are the fractions of incident solar radiationtransmitted, reflected, and absorbed, respectively. The standard 3-mm- ( -in.)thick single-pane double-strength clear window glass transmits 86 percent,reflects 8 percent, and absorbs 6 percent of the solar energy incident on it. Theradiation properties of materials are usually given for normal incidence, butcan also be used for radiation incident at other angles since the transmissivity,reflectivity, and absorptivity of the glazing materials remain essentially con-stant for incidence angles up to about 60° from the normal.
The hourly variation of solar radiation incident on the walls and windowsof a house is given in Table 21-20. Solar radiation that is transmitted indoorsis partially absorbed and partially reflected each time it strikes a surface, butall of it is eventually absorbed as sensible heat by the furniture, walls, people,and so forth. Therefore, the solar energy transmitted inside a building repre-sents a heat gain for the building. Also, the solar radiation absorbed by theglass is subsequently transferred to the indoors and outdoors by convectionand radiation. The sum of the transmitted solar radiation and the portion of theabsorbed radiation that flows indoors constitutes the solar heat gain of thebuilding.
The fraction of incident solar radiation that enters through the glazing iscalled the solar heat gain coefficient SHGC and is expressed as
SHGC �
(21-38)
� � �s � fis
where s is the solar absorptivity of the glass and fi is the inward flowing frac-tion of the solar radiation absorbed by the glass. Therefore, the dimensionlessquantity SHGC is the sum of the fractions of the directly transmitted (�s) andthe absorbed and reemitted ( fis) portions of solar radiation incident on thewindow. The value of SHGC ranges from 0 to 1, with 1 corresponding to anopening in the wall (or the ceiling) with no glazing. When the SHGC of a win-dow is known, the total solar heat gain through that window is determinedfrom
Q·
solar, gain � SHGC � Aglazing � q· solar, incident (W) (21-39)
where Aglazing is the glazing area of the window and q· solar, incident is the solar heatflux incident on the outer surface of the window, in W/m2.
q· solar, gain
q· solar, incident
Solar heat gain through the windowSolar radiation incident on the window
18
21-50
CHAPTER 21Heating and Coolingof Buildings
FIGURE 21-51
Distribution of solar radiation incidenton a clear glass.
Sun
Incidentsolar
radiation100%
Reflected8%
Outward transferof absorbed
radiation8%
Inward transferof absorbed
radiation4%
Absorbed12%
Transmitted80%
6-mm thickclear glass

21-51
TABLE 21-20
Hourly variation of solar radiation incident on various surfaces and the daily totals throughout the year at 40° latitude(from ASHRAE Handbook of Fundamentals, Ref. 1, Chap. 27, Table 15)
Solar radiation incident on the surface,* W/m2
Solar timeDirection of 12 Daily
Date surface 5 6 7 8 9 10 11 noon 13 14 15 16 17 18 19 total
Jan. N 0 0 0 20 43 66 68 71 68 66 43 20 0 0 0 446NE 0 0 0 63 47 66 68 71 68 59 43 20 0 0 0 489E 0 0 0 402 557 448 222 76 68 59 43 20 0 0 0 1863SE 0 0 0 483 811 875 803 647 428 185 48 20 0 0 0 4266S 0 0 0 271 579 771 884 922 884 771 579 271 0 0 0 5897SW 0 0 0 20 48 185 428 647 803 875 811 483 0 0 0 4266W 0 0 0 20 43 59 68 76 222 448 557 402 0 0 0 1863NW 0 0 0 20 43 59 68 71 68 66 47 63 0 0 0 489Horizontal 0 0 0 51 198 348 448 482 448 348 198 51 0 0 0 2568Direct 0 0 0 446 753 865 912 926 912 865 753 446 0 0 0 —
Apr. N 0 41 57 79 97 110 120 122 120 110 97 79 57 41 0 1117NE 0 262 508 462 291 134 123 122 120 110 97 77 52 17 0 2347E 0 321 728 810 732 552 293 131 120 110 97 77 52 17 0 4006SE 0 189 518 682 736 699 582 392 187 116 97 77 52 17 0 4323S 0 18 59 149 333 437 528 559 528 437 333 149 59 18 0 3536SW 0 17 52 77 97 116 187 392 582 699 736 682 518 189 0 4323W 0 17 52 77 97 110 120 392 293 552 732 810 728 321 0 4006NW 0 17 52 77 97 110 120 122 123 134 291 462 508 262 0 2347Horizontal 0 39 222 447 640 786 880 911 880 786 640 447 222 39 0 6938Direct 0 282 651 794 864 901 919 925 919 901 864 794 651 282 0 —
July N 3 133 109 103 117 126 134 138 134 126 117 103 109 133 3 1621NE 8 454 590 540 383 203 144 138 134 126 114 95 71 39 0 3068E 7 498 739 782 701 531 294 149 134 126 114 95 71 39 0 4313SE 2 248 460 580 617 576 460 291 155 131 114 95 71 39 0 3849S 0 39 76 108 190 292 369 395 369 292 190 108 76 39 0 2552SW 0 39 71 95 114 131 155 291 460 576 617 580 460 248 2 3849W 0 39 71 95 114 126 134 149 294 531 701 782 739 498 7 4313NW 0 39 71 95 114 126 134 138 144 203 383 540 590 454 8 3068Horizontal 1 115 320 528 702 838 922 949 922 838 702 528 320 115 1 3902Direct 7 434 656 762 818 850 866 871 866 850 818 762 656 434 7 —
Oct. N 0 0 7 40 62 77 87 90 87 77 62 40 7 0 0 453NE 0 0 74 178 84 80 87 90 87 87 62 40 7 0 0 869E 0 0 163 626 652 505 256 97 87 87 62 40 7 0 0 2578SE 0 0 152 680 853 864 770 599 364 137 66 40 7 0 0 4543S 0 0 44 321 547 711 813 847 813 711 547 321 44 0 0 5731SW 0 0 7 40 66 137 364 599 770 864 853 680 152 0 0 4543W 0 0 7 40 62 87 87 97 256 505 652 626 163 0 0 2578NW 0 0 7 40 62 87 87 90 87 80 84 178 74 0 0 869Horizontal 0 0 14 156 351 509 608 640 608 509 351 156 14 0 0 3917Direct 0 0 152 643 811 884 917 927 917 884 811 643 152 0 0 —
*Multiply by 0.3171 to convert to Btu/h · ft2.

Another way of characterizing the solar transmission characteristics ofdifferent kinds of glazing and shading devices is to compare them to a well-known glazing material that can serve as a base case. This is done by takingthe standard 3-mm- ( -in.) thick double-strength clear window glass sheetwhose SHGC is 0.87 as the reference glazing and defining a shading coeffi-cient SC as
SC �(21-40)
� � 1.15 � SHGC
Therefore, the shading coefficient of a single-pane clear glass window isSC � 1.0. The shading coefficients of other commonly used fenestrationproducts are given in Table 21-21 for summer design conditions. The valuesfor winter design conditions may be slightly lower because of the higher heattransfer coefficients on the outer surface due to high winds and thus higherrate of outward flow of solar heat absorbed by the glazing, but the differenceis small.
Note that the larger the shading coefficient, the smaller the shading ef-fect, and thus the larger the amount of solar heat gain. A glazing material witha large shading coefficient will allow a large fraction of solar radiation tocome in.
Shading devices are classified as internal shading and external shading,depending on whether the shading device is placed inside or outside. Externalshading devices are more effective in reducing the solar heat gain since theyintercept the sun’s rays before they reach the glazing. The solar heat gainthrough a window can be reduced by as much as 80 percent by exterior shad-ing. Roof overhangs have long been used for exterior shading of windows.The sun is high in the horizon in summer and low in winter. A properly sizedroof overhang or a horizontal projection blocks off the sun’s rays completelyin summer while letting in most of them in winter, as shown in Figure 21-52.Such shading structures can reduce the solar heat gain on the south, southeast,and southwest windows in the northern hemisphere considerably. A windowcan also be shaded from outside by vertical or horizontal architectural projec-tions, insect or shading screens, and sun screens. To be effective, air must beable to move freely around the exterior device to carry away the heat absorbedby the shading and the glazing materials.
Some type of internal shading is used in most windows to provide privacyand aesthetic effects as well as some control over solar heat gain. Internalshading devices reduce solar heat gain by reflecting transmitted solar radiationback through the glazing before it can be absorbed and converted into heat inthe building.
Draperies reduce the annual heating and cooling loads of a building by5 to 20 percent, depending on the type and the user habits. In summer, they
SHGCSHGCref
�SHGC0.87
Solar heat gain of productSolar heat gain of reference glazing
18
21-52
CHAPTER 21Heating and Coolingof Buildings
Notes on Table 21-20: Values given are for the 21st of the month for average days with no clouds. The values can be up to 15 percent higherat high elevations under very clear skies and up to 30 percent lower at very humid locations with very dusty industrial atmospheres. Dailytotals are obtained using Simpson’s rule for integration with 10-minute time intervals. Solar reflectance of the ground is assumed to be 0.2,which is valid for old concrete, crushed rock, and bright green grass. For a specified location, use solar radiation data obtained for thatlocation. The direction of a surface indicates the direction a vertical surface is facing. For example, W represent the solar radiation incidenton a west-facing wall per unit area of the wall.
Solar time may deviate from the local time. Solar noon at a location is the time when the sun is at the highest location (and thus whenthe shadows are shortest). Solar radiation data are symmetric about the solar noon: the value on a west wall two hours before the solar noonis equal to the value on an east wall two hours after the solar noon.
TABLE 21-21
Shading coefficient SC and solartransmissivity �solar for somecommon glass types for summerdesign conditions (from ASHRAEHandbook of Fundamentals, Ref. 1,Chap. 27, Table 11).
NominalthicknessType of
glazing mm in. �solar SC*
(a) Single GlazingClear 3 0.86 1.0
6 0.78 0.9510 0.72 0.9213 0.67 0.88
Heat absorbing 3 0.64 0.856 0.46 0.73
10 0.33 0.6413 0.24 0.58
(b) Double GlazingClear in, 3a 0.71b 0.88
clear out 6 0.61 0.82Clear in, heat
absorbing outc 6 0.36 0.58
*Multiply by 0.87 to obtain SHGC.aThe thickness of each pane of glass.bCombined transmittance for assembledunit.
cRefers to gray-, bronze-, and green-tintedheat-absorbing float glass.
14
14
18
12
38
14
18
12
38
14
18

reduce heat gain primarily by reflecting back direct solar radiation (Fig.21-53). The semiclosed air space formed by the draperies serves as an addi-tional barrier against heat transfer, resulting in a lower U-factor for the win-dow and thus a lower rate of heat transfer in summer and winter. The solaroptical properties of draperies can be measured accurately, or they can be ob-tained directly from the manufacturers. The shading coefficient of draperiesdepends on the openness factor, which is the ratio of the open area betweenthe fibers that permits the sun’s rays to pass freely, to the total area of the fab-ric. Tightly woven fabrics allow little direct radiation to pass through, and thusthey have a small openness factor. The reflectance of the surface of the drap-ery facing the glazing has a major effect on the amount of solar heat gain.Light-colored draperies made of closed or tightly woven fabrics maximize theback reflection and thus minimize the solar gain. Dark-colored draperiesmade of open or semi-open woven fabrics, on the other hand, minimize theback reflection and thus maximize the solar gain.
The shading coefficients of drapes also depend on the way they are hung.Usually, the width of drapery used is twice the width of the draped area to al-low folding of the drapes and to give them their characteristic “full” or“wavy” appearance. A flat drape behaves like an ordinary window shade.A flat drape has a higher reflectance and thus a lower shading coefficient thana full drape.
External shading devices such as overhangs and tinted glazings do not re-quire operation, and provide reliable service over a long time without signifi-cant degradation during their service life. Their operation does not depend ona person or an automated system, and these passive shading devices are con-sidered fully effective when determining the peak cooling load and the annualenergy use. The effectiveness of manually operated shading devices, on theother hand, varies greatly depending on the user habits, and this variationshould be considered when evaluating performance.
The primary function of an indoor shading device is to provide thermalcomfort for the occupants. An unshaded window glass allows most of the in-cident solar radiation in, and also dissipates part of the solar energy it absorbsby emitting infrared radiation to the room. The emitted radiation and the trans-mitted direct sunlight may bother the occupants near the window. In winter,the temperature of the glass is lower than the room air temperature, causingexcessive heat loss by radiation from the occupants. A shading device allowsthe control of direct solar and infrared radiation while providing various de-grees of privacy and outward vision. The shading device is also at a highertemperature than the glass in winter, and thus reduces radiation loss from oc-cupants. Glare from draperies can be minimized by using off-white colors. In-door shading devices, especially draperies made of a closed-weave fabric, areeffective in reducing sounds that originate in the room, but they are not as ef-fective against the sounds coming from outside.
The type of climate in an area usually dictates the type of windows to beused in buildings. In cold climates where the heating load is much larger thanthe cooling load, the windows should have the highest transmissivity for theentire solar spectrum, and a high reflectivity (or low emissivity) for the far in-frared radiation emitted by the walls and furnishings of the room. Low-e win-dows are well suited for such heating-dominated buildings. Properly designedand operated windows allow more heat into the building over a heating seasonthan it loses, making them energy contributors rather then energy losers. Inwarm climates where the cooling load is much larger than the heating load,the windows should allow the visible solar radiation (light) in, but should
21-53
Solar Heat Gainthrough Windows
FIGURE 21-52
A properly sized overhang blocks offthe sun’s rays completely in summer
while letting them in in winter.
Window
OverhangSun
Winter
Sun
Summer
FIGURE 21-53
Draperies reduce heat gain in summer byreflecting back solar radiation, and reduce
heat loss in winter by forming an airspace before the window.
Drape
Window
Reflectedby glass
Sun
Reflectedby drapes

block off the infrared solar radiation. Such windows can reduce the solar heatgain by 60 percent with no appreciable loss in daylighting. This behavior isapproximated by window glazings that are coated with a heat-absorbing filmoutside and a low-e film inside (Fig. 21-54). Properly selected windows canreduce the cooling load by 15 to 30 percent compared to windows with clearglass.
Note that radiation heat transfer between a room and its windows is pro-portional to the emissivity of the glass surface facing the room, �glass, and canbe expressed as
Q·
rad, room-window � �glass Aglass �(T 4room � T 4
glass)
Therefore, a low-e interior glass will reduce the heat loss by radiation in win-ter (Tglass � Troom) and heat gain by radiation in summer (Tglass Troom).
Tinted glass and glass coated with reflective films reduce solar heat gainin summer and heat loss in winter. The conductive heat gains or losses can beminimized by using multiple-pane windows. Double-pane windows are usu-ally called for in climates where the winter design temperature is less than 7°C(45°F). Double-pane windows with tinted or reflective films are commonlyused in buildings with large window areas. Clear glass is preferred for show-rooms since it affords maximum visibility from outside, but bronze-, gray-,and green-colored glass are preferred in office buildings since they provideconsiderable privacy while reducing glare.
EXAMPLE 21-15 Installing Reflective Films on WindowsA manufacturing facility located at 40° N latitude has a glazing area of 40 m2 thatconsists of double-pane windows made of clear glass (SHGC � 0.766). To re-duce the solar heat gain in summer, a reflective film that will reduce the SHGC to0.261 is considered. The cooling season consists of June, July, August, and Sep-tember, and the heating season October through April. The average daily solarheat fluxes incident on the west side at this latitude are 1.86, 2.66, 3.43, 4.00,4.36, 5.13, 4.31, 3.93, 3.28, 2.80, 1.84, and 1.54 kWh/day · m2 for January throughDecember, respectively. Also, the unit cost of the electricity and natural gas are$0.08/kWh and $0.50/therm, respectively. If the coefficient of performance of thecooling system is 2.5 and efficiency of the furnace is 0.8, determine the net an-nual cost savings due to installing reflective coating on the windows. Also, deter-mine the simple payback period if the installation cost of reflective film is $20/m2
(Fig. 21-55).
Solution The net annual cost savings due to installing reflective film on thewest windows of a building and the simple payback period are to be determined.
Assumptions 1 The calculations given below are for an average year. 2 The unitcosts of electricity and natural gas remain constant.
Analysis Using the daily averages for each month and noting the number ofdays of each month, the total solar heat flux incident on the glazing during sum-mer and winter months are determined to be
Qsolar, summer � 5.13 � 30 � 4.31 � 31 � 3.93 � 31 � 3.28 � 30 � 508 kWh/year
Qsolar, winter � 2.80 � 31 � 1.84 � 30 � 1.54 � 31 � 1.86 � 31
� 2.66 � 28 � 3.43 � 31 � 4.00 � 30
� 548 kWh/year
Then the decrease in the annual cooling load and the increase in the annual heat-ing load due to the reflective film become
21-54
CHAPTER 21Heating and Coolingof Buildings
FIGURE 21-54
Radiation heat transfer between a roomand its windows is proportional to theemissivity of the glass surface, andlow-e coatings on the inner surfaceof the windows reduce heat loss inwinter and heat gain in summer.
Sun
Qrad ~ ε·
Glass(warmer than room)
Low-e filmReflective film
Infrared Visible
(b) Warm climates
SunQrad ~ ε·
Glass(colder than room)
Low-e film(high infraredreflectivity)
Noreflective
film
(a) Cold climates


providing “fresh outdoor air” to a building, but it is not a reliable ventilationmechanism since it depends on the weather conditions and the size and loca-tion of the cracks.
The air infiltration rate of a building can be determined by direct mea-surements by (1) injecting a tracer gas into a building and observing the de-cline of its concentration with time or (2) pressurizing the building to 10 to 75Pa gage pressure by a large fan mounted on a door or window, and measuringthe air flow required to maintain a specified indoor–outdoor pressure differ-ence. The larger the air flow to maintain a pressure difference, the more thebuilding may leak. Sulfur hexafluoride (SF6) is commonly used as a tracer gasbecause it is inert, nontoxic, and easily detectable at concentrations as low as1 part per billion. Pressurization testing is easier to conduct, and thus prefer-able to tracer gas testing. Pressurization test results for a whole house aregiven in Figure 21-57.
Despite their accuracy, direct measurement techniques are inconvenient,expensive, and time consuming. A practical alternative is to predict the air in-filtration rate on the basis of extensive data available on existing buildings.One way of predicting the air infiltration rate is by determining the type andsize of all the cracks at all possible locations (around doors and windows,lighting fixtures, wall–floor joints, etc., as shown in Fig. 21-58), as well as thepressure differential across the cracks at specified conditions, and calculatingthe air flow rates. This is known as the crack method.
A simpler and more practical approach is to “estimate” how many timesthe entire air in a building is replaced by the outside air per hour on the basisof experience with similar buildings under similar conditions. This is calledthe air-change method, and the infiltration rate in this case is expressed interms of air changes per hour (ACH), defined as
ACH � �
(21-41)
The mass of air corresponding to 1 ACH is determined from m � �V where� is the density of air whose value is determined at the outdoor temperature
V·(m3/h)V(m3)
Flow rate of indoor air into the building (per hour)Internal volume of the building
21-56
CHAPTER 21Heating and Coolingof Buildings
FIGURE 21-57
Typical data from a whole housepressurization test for the variation of airflow rate with pressure difference (fromASHRAE Handbook of Fundamentals,Ref. 1, Chap. 23, Fig. 8).
1000
800
600
400
200
0
–200
–400
–600
–800
–1000
Air
flo
w, L
/s
–90 –60 –30 0 30 60 90
Pressure, Pa
FIGURE 21-58
Typical air-leakage sites of a house (from U.S. Department of Energy pamphlet, FS 203, 1992).
Electricmeter
Joint between joistsand basement walls
Joint between bottomplate and floor
Holes throughair-vapor barrier
Vents from bathroomand kitchen
Joints atattic hatch
Electrical wirespenetrating
vapor barrier
Ceiling lightfixture
Electricalservice entrance
Service entrancefor cable television,telephone, fuel, etc.
Joints betweenwall and ceiling
Joints atwindows
Electricaloutlets andswitches
Joints atinterior partitions
Plumbingstack
penetration
Chimneypenetrationof ceiling
Electricalpanel
Crackaround doors

and pressure. Therefore, the quantity ACH represents the number of buildingvolumes of outdoor air that infiltrates (and eventually exfiltrates) per hour. Atsea-level standard conditions of 1 atm (101.3 kPa or 14.7 psia) and 20°C(68°F), the density of air is
�air, standard � 1.20 kg/m3 � 0.075 lbm/ft3
However, the atmospheric pressure and thus the density of air will drop byabout 20 percent at 1500 m (5000 ft) elevation at 20°C, and by about 10 per-cent when the temperature rises to 50°C at 1 atm pressure. Therefore, local airdensity should be used in calculations to avoid such errors.
Infiltration rate values for hundreds of buildings throughout the UnitedStates have been measured during the last two decades, and the seasonal av-erage infiltration rates have been observed to vary from about 0.2 ACH fornewer energy-efficient tight buildings to about 2.0 ACH for older buildings.Therefore, infiltration rates can easily vary by a factor of 10 from one build-ing to another. Seasonal average infiltration rates as low as 0.02 have beenrecorded. A study that involved 312 mostly new homes determined the aver-age infiltration rate to be about 0.5 ACH. Another study that involved 266mostly older homes determined the average infiltration rate to be about 0.9ACH. The infiltration rates of some new office buildings with no outdoor airintake are measured to be between 0.l and 0.6 ACH. Occupancy is estimatedto add 0.1 to 0.15 ACH to unoccupied infiltration rate values. Also, the infil-tration rate of a building can vary by a factor of 5, depending on the weather.
A minimum of 0.35 ACH is required to meet the fresh air requirements ofresidential buildings and to maintain indoor air quality, provided that at least7.5 L/s (15 ft3/min) of fresh air is supplied per occupant to keep the indoorCO2 concentration level below 1000 parts per million (0.1 percent). Usuallythe infiltration rates of houses are above 0.35 ACH, and thus we do not needto be concerned about mechanical ventilation. However, the infiltration ratesof some of today’s energy-efficient buildings are below the required mini-mum, and additional fresh air must be supplied to such buildings by mechan-ical ventilation. It may be necessary to install a central ventilating system inaddition to the bathroom and kitchen fans to bring the air quality to desiredlevels.
Venting the cold outside air directly into the house will obviously increasethe heating load in winter. But part of the energy in the warm air vented outcan be recovered by installing an air-to-air heat exchanger (also called an“economizer” or “heat recuperator”) that transfers the heat from the exhaustedstale air to the incoming fresh air without any mixing (Fig. 21-59). Such heatexchangers are commonly used in superinsulated houses, but the benefits ofsuch heat exchangers must be weighed against the cost and complexity oftheir installation. The effectiveness of such heat exchangers is typically low(about 40 percent) because of the small temperature differences involved.
The primary cause of excessive infiltration is poor workmanship, but itmay also be the settling and aging of the house. Infiltration is likely to developwhere two surfaces meet such as the wall–foundation joint. Large differencesbetween indoor and outdoor humidity and temperatures may aggravate theproblem. Winds exert a dynamic pressure on the house, which forces the out-side air through the cracks inside the house.
Infiltration should not be confused with ventilation, which is the in-tentional and controlled mechanism of air flow into or out of a building. Ven-tilation can be natural or forced (or mechanical), depending on how it isachieved. Ventilation accomplished by the opening of windows or doors isnatural ventilation, whereas ventilation accomplished by an air mover such as
21-57
InfiltrationHeat Load and
Weatherizing
FIGURE 21-59
An air-to-air heat exchanger recuperatessome of the energy of warm indoor
air vented out of a building.
–5°CCold
outdoorair
23°CWarm indoor air
3°C
15°C
Air-to-airheat exchanger

a fan is forced ventilation. Forced ventilation gives the designer the greatestcontrol over the magnitude and distribution of air flow throughout a building.The airtightness or air exchange rate of a building at any given time usuallyincludes the effects of natural and forced ventilation as well as infiltration.
Air exchange, or the supply of fresh air, has a significant role on health,air quality, thermal comfort, and energy consumption. The supply of freshair is a double-edged sword: too little of it will cause health and comfortproblems such as the sick-building syndrome that was experienced in super-airtight buildings, and too much of it will waste energy. Therefore, the rate offresh air supply should be just enough to maintain the indoor air quality at anacceptable level. The infiltration rate of older buildings is several times the re-quired minimum flow rate of fresh air, and thus there is a high energy penaltyassociated with it.
Infiltration increases the energy consumption of a building in two ways:First, the incoming outdoor air must be heated (or cooled in summer) to the in-door air temperature. This represents the sensible heat load of infiltration andis expressed as
Q·
infiltration, sensible � �o CpV·
(Ti � To) (21-42)
� �o Cp(ACH)(Vbuilding)(Ti � To)
where �o is the density of outdoor air; Cp is the specific heat of air (about1 kJ/kg · °C or 0.24 Btu/lbm · °F); V
·� (ACH)(Vbuilding) is the volumetric flow
rate of air, which is the number of air changes per hour times the volume ofthe building; and Ti � To is the temperature difference between the indoor andoutdoor air. Second, the moisture content of outdoor air, in general, is differ-ent than that of indoor air, and thus the incoming air may need to be humidi-fied or dehumidified. This represents the latent heat load of infiltration andis expressed as (Fig. 21-60)
Q·
infiltration, latent � �o hfgV·
(wi � wo) (21-43)
� �o hfg(ACH)(Vbuilding)(wi � wo)
where hfg is the latent heat of vaporization at the indoor temperature (about2340 kJ/kg or 1000 Btu/lbm) and wi � wo is the humidity ratio differencebetween the indoor and outdoor air, which can be determined from the psy-chrometric charts. The latent heat load is particularly significant in summermonths in hot and humid regions such as Florida and coastal Texas. In winter,the humidity ratio of outdoor air is usually much lower than that of indoor air,and the latent infiltration load in this case represents the energy needed to va-porize the required amount of water to raise the humidity of indoor air to thedesired level.
Preventing Infiltration
Infiltration accounts for a significant part of the total heat loss, and sealing thesites of air leaks by caulking or weather-stripping should be the first step toreduce energy waste and heating and cooling costs. Weatherizing requiressome work, of course, but it is relatively easy and inexpensive to do.
Caulking can be applied with a caulking gun inside and outside wheretwo stationary surfaces such as a wall and a window frame meet. It is easy toapply and is very effective in fixing air leaks. Potential sites of air leaks that
21-58
CHAPTER 21Heating and Coolingof Buildings
FIGURE 21-60
The energy removed while water vapor inthe air is condensed constitutes the latentheat load of an air-conditioning system.
Air conditioner
20°C
20°CCoolair
Dry airLatentheat
Sensibleheat
Liquidwater
Water vapor
35°CWarmmoist
air

can be fixed by caulking are entrance points of electrical wires, plumbing, andtelephone lines; the sill plates where walls meet the foundation; joints betweenexterior window frames and siding; joints between door frames and walls; andaround exhaust fans.
Weather-stripping is a narrow piece of metal, vinyl, rubber, felt, or foamthat seals the contact area between the fixed and movable sections of a joint.Weather-stripping is best suited for sites that involve moving parts such asdoors and windows. It minimizes air leakage by closing off the gaps betweenthe moving parts and their fixed frames when they are closed. All exteriordoors and windows should be weatherized. There are various kinds ofweather-stripping, and some kinds are more suitable for particular kinds ofgaps. Some common types of weather-stripping are shown in Figure 21-61.
EXAMPLE 21-16 Reducing Infiltration Losses by WinterizingThe average atmospheric pressure in Denver, Colorado (elevation � 5300 ft), is12.1 psia, and the average winter temperature is 38°F. The pressurization test ofa 9-ft-high, 2500 ft2 older home revealed that the seasonal average infiltration rateof the house is 1.8 ACH (Fig. 21-62). It is suggested that the infiltration rate of thehouse can be reduced by one-third to 1.2 ACH by winterizing the doors andthe windows. If the house is heated by natural gas whose unit cost is $0.58/thermand the heating season can be taken to be six months, determine how much thehome owner will save from the heating costs per year by this winterization project.Assume the house is maintained at 70°F at all times and the efficiency of thefurnace is 0.75. Also, the latent heat load during the heating season in Denver isnegligible.
Solution A winterizing project will reduce the infiltration rate of a house from1.8 ACH to 1.2 ACH. The resulting cost savings are to be determined.
Assumptions 1 The house is maintained at 70°F at all times. 2 The latent heatload during the heating season is negligible. 3 The infiltrating air is heated to 70°Fbefore it exfiltrates.
Properties The specific heat of air at room temperature is 0.24 Btu/lbm · °F(Table A-11E). The molar mass of air is 0.3704 psia · ft3/lbm · R (Table A-1E).
Analysis The density of air at the outdoor conditions is
�o � � 0.0656 lbm/ft3
The volume of the building is
Vbuilding � (Floor area)(Height) � (2500 ft2)(9 ft) � 22,500 ft3
The sensible infiltration heat load corresponding to the reduction in the infiltrationrate of 0.6 ACH is
Q· infiltration, saved � �o Cp(ACHsaved)(Vbuilding)(Ti � To)
� (0.0656 lbm/ft3)(0.24 Btu/lbm · °F)(0.6/h)(22,500 ft3)(70 � 38)°F
� 6800 Btu/h � 0.068 therm/h
since 1 therm � 100,000 Btu. The number of hours during a six-month period is 6� 30 � 24 � 4320 h. Noting that the furnace efficiency is 0.75 and the unit cost ofnatural gas is $0.58/therm, the energy and money saved during the six-month pe-riod are
Energy savings � (Q· infiltration, saved)(No. of hours per year)/Efficiency
� (0.068 therm/h)(4320 h/year)/0.75
� 392 therms/year
Po
RTo�
12.1 psia(0.3704 psia · ft3/lbm · R)(498 R)
21-59
InfiltrationHeat Load and
Weatherizing
FIGURE 21-61
Some common types of weather-stripping.
Door sweep(vinyl lip with metal, wood, or plastic retainer)
Nonreinforced, self-adhesive
Rolled vinyl with rigid metal backing
FIGURE 21-62
Schematic for Example 21-16.
70°FInfiltration
38°F12.1 psia
1.8 ACH

Cost savings � (Energy savings)(Unit cost of energy)
� (392 therms/year)($0.58/therm)
� $227/year
Therefore, reducing the infiltration rate by one-third will reduce the heating costsof this home owner by $227 per year.
21-11 � ANNUAL ENERGY CONSUMPTION
In the thermal analysis of buildings, two quantities of major interest are (1) thesize or capacity of the heating and the cooling system and (2) the annual en-ergy consumption. The size of a heating or cooling system is based on themost demanding situations under the anticipated worst weather conditions,whereas the average annual energy consumption is based on average usagesituations under average weather conditions. Therefore, the calculation pro-cedure of annual energy usage is quite different than that of design heating orcooling loads.
An analysis of annual energy consumption and cost usually accompaniesthe design heat load calculations and plays an important role in the selectionof a heating or cooling system. Often a choice must be made among severalsystems that have the same capacity but different efficiencies and initial costs.More efficient systems usually consume less energy and money per year, butthey cost more to purchase and install. The purchase of a more efficient butmore expensive heating or cooling system can be economically justified onlyif the system saves more in the long run from energy costs than its initial costdifferential.
The impact on the environment may also be an important consideration onthe selection process: A system that consumes less fuel pollutes the environ-ment less, and thus reduces all the adverse effects associated with environ-mental pollution. But it is difficult to quantify the environmental impact in aneconomic analysis unless a price is put on it.
One way of reducing the initial and operating costs of a heating or cool-ing system is to compromise the thermal comfort of occupants. This optionshould be avoided, however, since a small loss in employee productivity dueto thermal discomfort can easily offset any potential gains from reduced en-ergy use. The U.S. Department of Energy periodically conducts comprehen-sive energy surveys to determine the energy usage in residential as well asnonresidential buildings and the industrial sector. Two 1983 reports(DOE/EIA-0246 and DOE/EIA-0318) indicate that the national average nat-ural gas usage of all commercial buildings in the United States is 70,000Btu/ft2 · year, which is worth about $0.50/ft2 or $5/m2 per year. The reportsalso indicate that the average annual electricity consumption of commercialbuildings due to air-conditioning is about 12 kWh/ft2 · year, which is worthabout $1/ft2 or $10/m2 per year. Therefore, the average cost of heating andcooling of commercial buildings is about $15/m2 per year. This corresponds to$300/year for a 20 m2 floor space, which is large enough for an average officeworker. But noting that the average salary and benefits of a worker are no lessthan $30,000 a year, it appears that the heating and cooling cost of a com-mercial building constitutes about 1 percent of the total cost (Fig. 21-63).Therefore, even a 1 percent loss in productivity due to thermal discomfortmay cost the business owner more than the entire cost of energy. Likewise, theloss of business in retail stores due to unpleasant thermal conditions will costthe store owner many times what he or she is saving from energy. Thus, the
21-60
CHAPTER 21Heating and Coolingof Buildings
FIGURE 21-63
The heating and cooling cost of acommercial building constitutes about1 percent of the total cost. Therefore,thermal comfort and thus productivityshould not be risked to conserve energy.
$100
— Salaries— Raw materials$99
$1
Heating andair-conditioning

message to the HVAC engineer is clear: in the design of heating and coolingsystems of commercial buildings, treat the thermal comfort conditions as de-sign constraints rather than as variables. The cost of energy is a very smallfraction of the goods and services produced, and thus, do not incorporate anyenergy conservation measures that may result in a loss of productivity or lossof revenues.
When trying to minimize annual energy consumption, it is helpful to havea general idea about where most energy is used. A breakdown of energy usagein residential and commercial buildings is given in Figure 21-64. Note thatspace heating accounts for most energy usage in all buildings, followed bywater heating in residential buildings and lighting in commercial buildings.Therefore, any conservation measure dealing with them will have the greatestimpact.
For existing buildings, the amount and cost of energy (fuel or electricity)used for heating and cooling of a building can be determined by simply ana-lyzing the utility bills for a typical year. For example, if a house uses naturalgas for space and water heating, the natural gas consumption for space heat-ing can be determined by estimating the average monthly usage for waterheating from summer bills, multiplying it by 12 to estimate the yearly usage,and subtracting it from the total annual natural gas usage. Likewise, the annualelectricity usage and cost for air-conditioning can be determined by simplyevaluating the excess electricity usage during the cooling months and addingthem up. If the bills examined are not for a typical year, corrections can bemade by comparing the weather data for that year to the average weather data.
For buildings that are at the design or construction stage, the evaluation ofannual energy consumption involves the determination of (1) the space loadfor heating or cooling due to heat transfer through the building envelope andinfiltration, (2) the efficiency of the furnace where the fuel is burned or theCOP of cooling or heat pump systems, and (3) the parasitic energy consumedby the distribution system (pumps or fans) and the energy lost or gained fromthe pipes or ducts (Fig. 21-65). The determination of the space load is similarto the determination of the peak load, except the average conditions are usedfor the weather instead of design conditions. The space heat load is usuallybased on the average temperature difference between the indoors and the out-doors, but internal heat gains and solar effects must also be considered for bet-ter accuracy. Very accurate results can be obtained by using hourly data for awhole year and by making a computer simulation using one of the commer-cial building energy analysis software packages.
The simplest and most intuitive way of estimating the annual energy con-sumption of a building is the degree-day (or degree-hour) method, which isa steady-state approach. It is based on constant indoor conditions during theheating or cooling season and assumes the efficiency of the heating or coolingequipment is not affected by the variation of outdoor temperature. These con-ditions will be closely approximated if all the thermostats in a building are setat the same temperature at the beginning of a heating or cooling season andare never changed, and a seasonal average efficiency is used (rather than thefull-load or design efficiency) for the furnaces or coolers.
You may think that anytime the outdoor temperature To drops below theindoor temperature Ti at which the thermostat is set, the heater will turn on tomake up for the heat losses to the outside. However, the internal heat gener-ated by people, lights, and appliances in occupied buildings as well as the heatgain from the sun during the day, Q
·gain, will be sufficient to compensate for
the heat losses from the building until the outdoor temperature drops below acertain value. The outdoor temperature above which no heating is required is
21-61
Annual EnergyConsumption
FIGURE 21-64
Breakdown of energy consumption inresidential and commercial buildings in
1986 (from U.S. Department of Energy).
Space heating40%
15.3 quads
11.7 quads
Lighting25%
Other15%
Ventilation13%
Air-conditioning9%Water heaters 5%
Space heating32%
(a) Residential buildings
(b) Commercial buildings
Waterheating
17%
Freezers 3%
Ranges/ovens 6%
Lighting 7%
Air conditioners 7%
Refrigerators 9%
Other11%
FIGURE 21-65
The various quantities involved in theevaluation of the annual energy
consumption of a building.
Fan
Fuelconsumption
Furnaceηheating
Spaceheating
loadDuctlosses
Stacklosses
Spaceheating
load

called the balance point temperature Tbalance (or the base temperature) and isdetermined from (Fig. 21-66)
Koverall(Ti � Tbalance) � Q·
gain → Tbalance � Ti � (21-44)
where Koverall is the overall heat transfer coefficient of the building in W/°C orBtu/h · °F. There is considerable uncertainty associated with the determinationof the balance point temperature, but based on the observations of typicalbuildings, it is usually taken to be 18°C in Europe and 65°F (18.3°C) in theUnited States for convenience. The rate of energy consumption of the heatingsystem is
Q·
heating � (Tbalance � To)� (21-45)
where �heating is the efficiency of the heating system, which is equal to 1.0 forelectric resistance heating systems, COP for the heat pumps, and combustionefficiency (about 0.6 to 0.95) for furnaces. If Koverall, Tbalance, and �heating aretaken to be constants, the annual energy consumption for heating can bedetermined by integration (or by summation over daily or hourly averages) as
Qheating, year � [Tbalance � To(t)]� dt � DDheating (21-46)
where DDheating is the heating degree-days. The � sign above the parenthesisindicates that only positive values are to be counted, and the temperature dif-ference is to be taken to be zero when To Tbalance. The number of degree-days for a heating season is determined from
DDheating � (1 day) (Tbalance � To, ave, day)� (°C-day) (21-47)
where To, ave, day is the average outdoor temperature for each day (without con-sidering temperatures above Tbalance), and the summation is performed daily(Fig. 21-67). Similarly, we can also define heating degree-hours by usinghourly average outdoor temperatures and performing the summation hourly.Note that the number of degree-hours is equal to 24 times the number of de-gree-days. Heating degree-days for each month and the yearly total for a bal-ance point temperature of 65°F are given in Table 21-5 for several cities.Cooling degree-days are defined in the same manner to evaluate the annualenergy consumption for cooling, using the same balance point temperature.
Expressing the design energy consumption of a building for heating asQ·
design � Koverall(Ti � To)design/�heating and comparing it to the annual energyconsumption gives the following relation between energy consumption at de-signed conditions and the annual energy consumption (Table 21-22),
(21-48)
where (Ti � To)design is the design indoor–outdoor temperature difference.Despite its simplicity, remarkably accurate results can be obtained with
the degree-day method for most houses and single-zone buildings using ahand calculator. Besides, the degree-days characterize the severity of the
Qheating, year
Q· design
�DDheating
(Ti � To)design
�days
Koverall�heating
Koverall�heating
�
Koverall�heating
Q· gain
Koverall
21-62
CHAPTER 21Heating and Coolingof Buildings
FIGURE 21-67
The outdoor temperatures for a day duringwhich the heating degree-day is 25°F-day.
For a given day:
Highest outdoor temperature: 50°F
Lowest outdoor temperature: 30°F
Average outdoor temperature: 40°F
Degree-days for that day for abalance-point temperature of 65°F:
DD � (1 day)(65 � 40)°F
� 25°F-day
� 600°F-hour
FIGURE 21-66
The heater of a building will not turn on aslong as the internal heat gain makes up forthe heat loss from a building (the balancepoint outdoor temperature).
22°C
18°CPeople
Lights
Appliances
Qgain·
Qgain·
TABLE 21-22
The ratio of annual energyconsumption to the hourly energyconsumption at design conditionsat several locations for Ti � 70°F(from Eq. 21-48).City To, design °F-days Ratio
Tucson 32°F 1800 1137Las Vegas 28°F 2709 1548Charleston 11°F 4476 1821Cleveland 5°F 6351 2345Minneapolis �12°F 8382 2453Anchorage �18°F 10,864 2963

weather at a location accurately, and the degree-day method serves as a valu-able tool for gaining an intuitive understanding of annual energy consump-tion. But when the efficiency of the HVAC equipment changes considerablywith the outdoor temperature, or the balance-point temperature varies signifi-cantly with time, it may be necessary to consider several bands (or “bins”) ofoutdoor temperatures and to determine the energy consumption for each bandusing the equipment efficiency for those outdoor temperatures and the num-ber of hours those temperatures are in effect. Then the annual energy con-sumption is obtained by adding the results of all bands. This modifieddegree-day approach is known as the bin method, and the calculations canstill be performed using a hand calculator.
The steady-state methods become too crude and unreliable for buildingsthat experience large daily fluctuations, such as a typical, well-lit, crowdedoffice building that is open Monday through Friday from 8 AM to 5 PM. This isespecially the case when the building is equipped with programmable ther-mostats that utilize night setback to conserve energy. Also, the efficiency of aheat pump varies considerably with the outdoor temperatures, and the effi-ciencies of boilers and chillers are lower at part load. Further, the internal heatgain and necessary ventilation rate of commercial buildings vary greatly withoccupancy. In such cases, it may be necessary to use a dynamic method suchas the transfer function method to predict the annual energy consumptionaccurately. Such dynamic methods are based on performing hourly calcula-tions for the entire year and adding the results. Obviously they require the useof a computer with a well-developed and hopefully user-friendly program.Very accurate results can be obtained with dynamic methods since they con-sider the hourly variation of indoor and outdoor conditions as well as the solarradiation, the thermal inertia of the building, the variation of the heat loss co-efficient of the building, and the variation of equipment efficiency with out-door temperatures. Even when a dynamic method is used to determine theannual energy consumption, the simple degree-day method can still be used asa check to ensure that the results obtained are in the proper range.
Some simple practices can result in significant energy savings in residen-tial buildings while causing minimal discomfort. The annual energy con-sumption can be reduced by up to 50 percent by setting the thermostat back inwinter and up in summer, and setting it back further at nights (Table 21-23).Reducing the thermostat setting in winter by 4°F (2.2°C) alone can save 12 to18 percent; setting the thermostat back by 10°F (5.6°C) alone for 8 h on win-ter nights can save 7 to 13 percent. Setting the thermostat up in summer by4°F (2.2°C) can reduce the energy consumption of residential cooling units by18 to 32 percent. Cooling energy consumption can be reduced by up to 25 per-cent by sunscreening and by up to 9 percent by attic ventilation (ASHRAEHandbook of Fundamentals, Ref. 1, p. 28.14).
EXAMPLE 21-17 Energy and Money Savings by WinterizationYou probably noticed that the heating bills are highest in December and Januarybecause the temperatures are the lowest in those months. Imagine that you havemoved to Cleveland, Ohio, and your roommate offered to pay the remaining heat-ing bills if you pay the December and January bills only. Should you accept thisoffer?
Solution It makes sense to accept this offer if the cost of heating in Decemberand January is less than half of the heating bill for the entire winter. The energyconsumption of a building for heating is proportional to the heating degree-days.For Cleveland, they are listed in Table 21-5 to be 1088°F-day for December,
21-63
Annual EnergyConsumption
TABLE 21-23
Approximate percent savings fromthermostat setback from 65°F for14 hours per night and the entire
weekends (from National Frozen FoodAssociation/U.S. Department of
Energy, “Reducing Energy CostsMeans a Better Bottom Line”).
Amount of setback, °F°F-days 5°F 10°F 15°F 20°F
1000 13% 25% 38% 50%2000 12 24 36 483000 11 22 33 444000 10 20 30 405000 9 19 28 386000 8 16 24 327000 7 15 22 308000 7 13 19 269000 6 11 16 22
10,000 5 9 14 18

1159°F-day for January, and 6371°F-day for the entire year (Table 21-24). Theratio of December–January degree-days to the annual degree-days is
� 0.354
which is less than half. Therefore, this is a good offer and should be accepted.
EXAMPLE 21-18 Annual Heating Cost of a HouseUsing indoor and outdoor winter design temperatures of 70°F and 8°F, respec-tively, the design heat load of a 3000-ft2 house in Salt Lake City, Utah, is deter-mined to be 72,000 Btu/h (Fig. 21-68). The house is to be heated by natural gasthat is to be burned in an 80 percent efficient furnace. If the unit cost of naturalgas is $0.55/therm, estimate the annual gas consumption of this house and itscost.
Solution The annual gas consumption and its cost for a house in Salt Lake Citywith a design heat load of 72,000 Btu/h are to be determined.
Assumption The house is maintained at 70°F at all times during the heatingseason.
Analysis The rate of gas consumption of the house for heating at design con-ditions is
Q· design � Q· design, load/�heating
� (70,000 Btu/h)/0.80 � 87,500 Btu/h � 0.875 therm/h
The annual heating degree-days of Salt Lake City are listed in Table 21-5 to be6052°F-day. Then the annual natural gas usage of the house can be determinedfrom Equation 21-48 to be
Qheating, year � Q· design
� (0.875 therm/h) � 2050 therms/year
whose cost is
Annual heating cost � (Annual energy consumption)(Unit cost of energy)
� (2050 therms/year)($0.55/therm) � $1128/year
Therefore, it will cost $1128 per year to heat this house.
EXAMPLE 21-19 Choosing the Most Economical Air ConditionerConsider a house whose annual air-conditioning load is estimated to be 40,000kWh in an area where the unit cost of electricity is $0.09/kWh. Two air conditionersare considered for the house. Air conditioner A has a seasonal average COP of2.5 and costs $2500 to purchase and install. Air conditioner B has a seasonal av-erage COP of 5.0 and costs $4000 to purchase and install. If all else is equal, de-termine which air conditioner is a better buy (Fig. 21-69).
Solution A decision is to be made between a cheaper but inefficient and anexpensive but efficient air conditioner for a house.
Assumption The two air conditioners are comparable in all aspects other thanthe initial cost and the efficiency.
Analysis The unit that will cost less during its lifetime is a better buy. The totalcost of a system during its lifetime (the initial, operation, maintenance, etc.) can
6052°F-day(70 � 8)°F
� 24 h1 day�
DDheating
(Ti � To)design
DDheating, Dec-Jan
DDheating, annual�
(1088 � 1159)°F-day6351°F-day
21-64
CHAPTER 21Heating and Coolingof Buildings
FIGURE 21-68
Schematic for Example 21-18.
70°F3000 ft2Salt Lake
City
Naturalgas
72,000Btu/h
8°F
FIGURE 21-69
Schematic for Example 21-19.
House
40,000 kWh
Air cond. A$2500
COP = 2.5
Air cond. B$4000
COP = 5
TABLE 21-24
Monthly heating degree-days forCleveland, Ohio, and the yearly total(Example 21-17).
Degree-daysMonth °F-days °C-days
July 9 5August 25 14September 105 58October 384 213November 738 410December 1088 604January 1159 644February 1047 582March 918 510April 552 307May 260 144June 66 37
Yearly total 6351 3528

be determined by performing a life cycle cost analysis. A simpler alternative is todetermine the simple payback period. The energy and cost savings of the moreefficient air conditioner in this case are
Energy savings � (Annual energy usage of A) � (Annual energy usage of B)
� (Annual cooling load)(1/COPA � 1/COPB)
� (40,000 kWh/year)(1/2.5 � 1/5.0)
� 8000 kWh/year
Cost savings � (Energy savings)(Unit cost of energy)
� (8000 kWh/year)($0.09/kWh) � $720/year
Therefore, the more efficient air conditioner will pay for the $1500 cost differentialin this case in about two years. A cost-conscious consumer will have no difficultyin deciding that the more expensive but more efficient air conditioner B is clearlya better buy in this case since air conditioners last at least 15 years. But the deci-sion would not be so easy if the unit cost of electricity at that location was$0.03/kWh instead of $0.09/kWh, or if the annual air-conditioning load of thehouse was just 10,000 kWh instead of 40,000 kWh.
21-12 � SUMMARY
In a broad sense, air-conditioning means to condition the air to the desiredlevel by heating, cooling, humidifying, dehumidifying, cleaning, and deodor-izing. The purpose of the air-conditioning system of a building is to providecomplete thermal comfort for its occupants. The metabolic heat generated inthe body is dissipated to the environment through the skin and lungs by con-vection and radiation as sensible heat and by evaporation as latent heat. Thetotal sensible heat loss can be expressed by combining convection and radia-tion heat losses as
Q·
conv � rad � (hconv � hrad) Aclothing(Tclothing � Toperative) �
where Rclothing is the unit thermal resistance of clothing, which involves thecombined effects of conduction, convection, and radiation between the skinand the outer surface of clothing. The operative temperature Toperative is ap-proximately the arithmetic average of the ambient and surrounding surfacetemperatures. Another environmental index used in thermal comfort analysisis the effective temperature, which combines the effects of temperature andhumidity.
The desirable ranges of temperatures, humidities, and ventilation rates forindoors constitute the typical indoor design conditions. The set of extremeoutdoor conditions under which a heating or cooling system must be able tomaintain a building at the indoor design conditions is called the outdoor de-sign conditions. The heating or cooling loads of a building represent the heatthat must be supplied to or removed from the interior of a building to maintainit at the desired conditions. The effect of solar heating on opaque surfaces isaccounted for by replacing the ambient temperature in the heat transfer rela-tion through the walls and the roof by the sol-air temperature, which is de-fined as the equivalent outdoor air temperature that gives the same rate of heatflow to a surface as would the combination of incident solar radiation, con-vection with the ambient air, and radiation exchange with the sky and the sur-rounding surfaces.
Aclothing(Tskin � Tclothing)
Rclothing
21-65
Summary

Heat flow into an exterior surface of a building subjected to solar radia-tion can be expressed as
Q·
surface � ho A(Tsol-air � Tsurface)
where
Tsol-air � Tambient �
and s is the solar absorptivity and � is the emissivity of the surface, ho is thecombined convection and radiation heat transfer coefficient, and q· solar isthe solar radiation incident on the surface.
The conversion of chemical or electrical energy to thermal energy in abuilding constitutes the internal heat gain of a building. The primary sourcesof internal heat gain are people, lights, appliances, and miscellaneous equip-ment such as computers, printers, and copiers. The average amount of heatgiven off by a person depends on the level of activity and can range fromabout 100 W for a resting person to more than 500 W for a physically veryactive person. The heat gain due to a motor inside a conditioned space can beexpressed as
Q·
motor, total � W·
motor � fload � fusage/�motor
where W·
motor is the power rating of the motor, fload is the load factor of the mo-tor during operation, fusage is the usage factor, and �motor is the motor efficiency.
Under steady conditions, the rate of heat transfer through any section of abuilding wall or roof can be determined from
Q·
� UA(Ti � To) �
where Ti and To are the indoor and outdoor air temperatures, A is the heattransfer area, U is the overall heat transfer coefficient (the U-factor), andR � 1/U is the overall unit thermal resistance (the R-value). The overallR-value of a wall or roof can be determined from the thermal resistances ofthe individual components using the thermal resistance network. The effectiveemissivity of a plane-parallel air space is given by
� 1
where �1 and �2 are the emissivities of the surfaces of the air space.Heat losses through the below-grade section of a basement wall and
through the basement floor are given as
Q·
basement walls � Uwall, ave Awall(Tbasement � Tground surface)
Q·
basement floor � Ufloor Afloor(Tbasement � Tground surface)
where Uwall, ave is the average overall heat transfer coefficient between thebasement wall and the surface of the ground and Ufloor is the overall heat trans-fer coefficient at the basement floor. Heat loss from floors that sit directly onthe ground at or slightly above the ground level is mostly through the perime-ter to the outside air rather than through the floor into the ground and is ex-pressed as
Q·
floor on grade � Ugrade pfloor(Tindoor � Toutdoor)
where Ugrade represents the rate of heat transfer from the slab per unit temper-ature difference between the indoor temperature Tindoor and the outdoor tem-perature Toutdoor and per unit length of the perimeter pfloor of the building.
1�effective
�1�1
�1�2
A(Ti � To)R
s q· solar
ho�
��(T 4ambient � T 4
surr)ho
21-66
CHAPTER 21Heating and Coolingof Buildings

When the crawl space temperature is known, heat loss through the floor of thebuilding is determined from
Q·
building floor � Ubuilding floor Afloor(Tindoor � Tcrawl)
where Ubuilding floor is the overall heat transfer coefficient for the floor.Windows are considered in three regions when analyzing heat transfer
through them: (1) the center-of-glass, (2) the edge-of-glass, and (3) the frameregions. Total rate of heat transfer through the window is determined byadding the heat transfer through each region as
Q·
window � Q·
center � Q·
edge � Q·
frame � Uwindow Awindow(Tindoors � Toutdoors)
where
Uwindow � (Ucenter Acenter � Uedge Aedge � Uframe Aframe)/Awindow
is the U-factor or the overall heat transfer coefficient of the window; Awindow
is the window area; Acenter, Aedge, and Aframe are the areas of the center, edge,and frame sections of the window, respectively; and Ucenter, Uedge, and Uframe
are the heat transfer coefficients for the center, edge, and frame sections of thewindow.
The sum of the transmitted solar radiation and the portion of the absorbedradiation that flows indoors constitutes the solar heat gain of the building.The fraction of incident solar radiation that enters through the glazing is calledthe solar heat gain coefficient SHGC, and the total solar heat gain through thatwindow is determined from
Q·
solar, gain � SHGC � Aglazing � q· solar, incident
where Aglazing is the glazing area of the window and q· solar, incident is the solar heatflux incident on the outer surface of the window. Using the standard 3-mm-thick double-strength clear window glass sheet whose SHGC is 0.87 as thereference glazing, the shading coefficient SC is defined as
SC �
� � 1.15 � SHGC
Shading devices are classified as internal shading and external shading, de-pending on whether the shading device is placed inside or outside.
The uncontrolled entry of outside air into a building through unintentionalopenings is called infiltration, and it wastes a significant amount of energysince the air entering must be heated in winter and cooled in summer. The sen-sible and latent heat load of infiltration are expressed as
Q·
infiltration, sensible � �o CpV·
(Ti � To) � �o Cp(ACH)(Vbuilding)(Ti � To)
Q·
infiltration, latent � �o hfgV·
(wi � wo) � �o hfg(ACH)(Vbuilding)(wi � wo)
where �o is the density of outdoor air; Cp is the specific heat of air (about1 kJ/kg · °C or 0.24 Btu/lbm · °F); V
·� (ACH)(Vbuilding) is the volumetric flow
rate of air, which is the number of air changes per hour times the volume ofthe building; and Ti � To is the temperature difference between the indoor andoutdoor air. Also, hfg is the latent heat of vaporization at indoor temperature(about 2340 kJ/kg or 1000 Btu/lbm) and wi � wo is the humidity ratio differ-ence between the indoor and outdoor air.
SHGCSHGCref
�SHGC0.87
Solar heat gain of productSolar heat gain of reference glazing
21-67
Summary

The annual energy consumption of a building depends on the space loadfor heating or cooling, the efficiency of the heating or cooling equipment, andthe parasitic energy consumed by the pumps or fans and the energy lost orgained from the pipes or ducts. The annual energy consumption of a buildingcan be estimated using the degree-day method as
Qheating, year � DDheating
where DDheating is the heating degree-days, Koverall is the overall heat transfercoefficient of the building in W/°C or Btu/h · °F, and �heating is the efficiencyof the heating system, which is equal to 1.0 for electric resistance heating sys-tems, COP for the heat pumps, and combustion efficiency (about 0.6 to 0.95)for furnaces.
REFERENCES AND SUGGESTED READING
1. American Society of Heating, Refrigeration, and Air-Conditioning Engi-neers. Handbook of Fundamentals. Atlanta: ASHRAE, 1993.
2. How to Reduce Your Energy Costs. 2nd ed. Boston: Center for Informa-tion Sharing, Inc. (through Sierra Pacific Power Company), 1991.
3. J. F. Kreider and A. Rabl. Heating and Cooling of Buildings. New York:McGraw-Hill, 1994.
4. F. C. McQuiston and J. D. Parker. Heating, Ventilating, and Air Condi-tioning. 4th ed. NewYork: Wiley, 1994.
5. Radiant Barrier Attic Fact Sheet. DOE/CE-0335P. Washington, DC:U.S. Department of Energy, 1991.
6. “Replacement Windows.” Consumer Reports, Yonkers, NY: ConsumerUnion. October 1993, p. 664.
7. H. J. Sauer, Jr., and R. H. Howell. Principles of Heating, Ventilating, andAir Conditioning. Atlanta: ASHRAE, 1994.
8. W. F. Stoecker and J. W. Jones. Refrigeration and Air Conditioning.New York: McGraw-Hill, 1982.
PROBLEMS*
A Brief History
21-1C In 1775, Dr. William Cullen made ice in Scotland by evacuatingthe air in a water tank. Explain how that device works, and discuss how theprocess can be made more efficient.
21-2C When was the first ammonia absorption refrigeration system devel-oped? Who developed the formulas related to dry-bulb, wet-bulb, and dew-point temperatures, and when?
21-3C When was the concept of heat pump conceived and by whom? Whenwas the first heat pump built, and when were the heat pumps mass produced?
Koverall�heating
21-68
CHAPTER 21Heating and Coolingof Buildings
*Students are encouraged to answer all the concept “C” questions.

Human Body and Thermal Comfort
21-4C What is metabolism? What is the range of metabolic rate for an aver-age man? Why are we interested in metabolic rate of the occupants of a build-ing when we deal with heating and air conditioning?
21-5C Why is the metabolic rate of women, in general, lower than that ofmen? What is the effect of clothing on the environmental temperature thatfeels comfortable?
21-6C What is asymmetric thermal radiation? How does it cause thermaldiscomfort in the occupants of a room?
21-7C How do (a) draft and (b) cold floor surfaces cause discomfort for aroom’s occupants?
21-8C What is stratification? Is it likely to occur at places with low or highceilings? How does it cause thermal discomfort for a room’s occupants? Howcan stratification be prevented?
21-9C Why is it necessary to ventilate buildings? What is the effect of ven-tilation on energy consumption for heating in winter and for cooling in sum-mer? Is it a good idea to keep the bathroom fans on all the time? Explain.
Heat Transfer from the Human Body
21-10C Consider a person who is resting or doing light work. Is it fair to saythat roughly one-third of the metabolic heat generated in the body is dissipatedto the environment by convection, one-third by evaporation, and the remain-ing one-third by radiation?
21-11C What is sensible heat? How is the sensible heat loss from a humanbody affected by (a) skin temperature, (b) environment temperature, and(c) air motion?
21-12C What is latent heat? How is the latent heat loss from the humanbody affected by (a) skin wettedness and (b) relative humidity of the environ-ment? How is the rate of evaporation from the body related to the rate of la-tent heat loss?
21-13C How is the insulating effect of clothing expressed? How does cloth-ing affect heat loss from the body by convection, radiation, and evaporation?How does clothing affect heat gain from the sun?
21-14C Explain all the different mechanisms of heat transfer from thehuman body (a) through the skin and (b) through the lungs.
21-15C What is operative temperature? How is it related to the mean ambi-ent and radiant temperatures? How does it differ from effective temperature?
21-16 The convection heat transfer coefficient for a clothed person whilewalking in still air at a velocity of 0.5 to 2 m/s is given by h � 8.6�0.53 where� is in m/s and h is in W/m2 · °C. Plot the convection coefficient against thewalking velocity, and compare the convection coefficients in that range to theaverage radiation coefficient of about 5 W/m2 · °C.
21-17 A clothed or unclothed person feels comfortable when the skin tem-perature is about 33°C. Consider an average man wearing summer clotheswhose thermal resistance is 0.7 clo. The man feels very comfortable while
21-69
Problems

standing in a room maintained at 20°C. If this man were to stand in that roomunclothed, determine the temperature at which the room must be maintainedfor him to feel thermally comfortable. Assume the latent heat loss from theperson to remain the same. Answer: 26.4°C
21-18E An average person produces 0.50 lbm of moisture while takinga shower and 0.12 lbm while bathing in a tub. Consider a family of four whoshower once a day in a bathroom that is not ventilated. Taking the heat ofvaporization of water to be 1050 Btu/lbm, determine the contribution of show-ers to the latent heat load of the air conditioner in summer per day.
21-19 An average (1.82 kg or 4.0 lbm) chicken has a basal metabolic rate of5.47 W and an average metabolic rate of 10.2 W (3.78 W sensible and 6.42 Wlatent) during normal activity. If there are 100 chickens in a breeding room,determine the rate of total heat generation and the rate of moisture productionin the room. Take the heat of vaporization of water to be 2430 kJ/kg.
21-20 Consider a large classroom with 150 students on a hot summer day.All the lights with 4.0 kW of rated power are kept on. The room has no exter-nal walls, and thus heat gain through the walls and the roof is negligible.Chilled air is available at 15°C, and the temperature of the return air is not toexceed 25°C. Determine the required flow rate of air, in kg/s, that needs to besupplied to the room. Answer: 1.45 kg/s
21-21 A smoking lounge is to accommodate 15 heavy smokers. Determinethe minimum required flow rate of fresh air that needs to be supplied to thelounge. Answer: 0.45 m3/s
21-22 A person feels very comfortable in his house in light clothing whenthe thermostat is set at 22°C and the mean radiation temperature (the averagetemperature of the surrounding surfaces) is also 22°C. During a cold day, theaverage mean radiation temperature drops to 18°C. To what value must the in-door air temperature be raised to maintain the same level of comfort in thesame clothing?
21-23 A car mechanic is working in a shop whose interior space is notheated. Comfort for the mechanic is provided by two radiant heaters that radi-ate heat at a total rate of 10 kJ/s. About 5 percent of this heat strikes the me-chanic directly. The shop and its surfaces can be assumed to be at the ambienttemperature, and the emissivity and absorptivity of the mechanic can be takento be 0.95 and the surface area to be 1.8 m2. The mechanic is generating heatat a rate of 350 W, half of which is latent, and is wearing medium clothingwith a thermal resistance of 0.7 clo. Determine the lowest ambient tempera-ture in which the mechanic can work comfortably.
Design Conditions for Heating and Cooling
21-24C What is winter outdoor design temperature? How does it differ fromaverage winter outdoor temperature? How do 97.5 percent and 99 percentwinter outdoor design temperatures differ from each other?
21-25C Weather data for two different cities A and B are compared. Is itpossible for city A to have a lower winter design temperature but a higheraverage winter temperature? Explain.
21-26C What is the effect of solar radiation on (a) the design heating load inwinter and (b) the annual energy consumption for heating? Answer the samequestion for the heat generated by people, lights, and appliances.
21-70
CHAPTER 21Heating and Coolingof Buildings
FIGURE P21-18E
Moisture0.50 lbm
FIGURE P21-22
22°C
22°C
FIGURE P21-23
Radiantheater

21-27C What is the effect of solar radiation on (a) the design cooling loadin summer and (b) the annual energy consumption for cooling? Answer thesame question for the heat generated by people, lights, and appliances.
21-28C Does the moisture level of the outdoor air affect the cooling load insummer, or can it just be ignored? Explain. Answer the same question for theheating load in winter.
21-29C The recommended design heat transfer coefficients for combinedconvection and radiation on the outer surface of a building are 34 W/m2 · °Cfor winter and 22.7 W/m2 · °C for summer. What is the reason for differentvalues?
21-30C What is sol-air temperature? What is it used for? What is the effectof solar absorptivity of the outer surface of a wall on the sol-air temperature?
21-31C Consider the solar energy absorbed by the walls of a brick house.Will most of this energy absorbed by the wall be transferred to indoors or lostto the outdoors? Why?
21-32 Determine the outdoor design conditions for Lincoln, Nebraska, forsummer for the 2.5 percent level and for winter for the 97.5 percent level.
21-33 Specify the indoor and outdoor design conditions for a hospital inWichita, Kansas.
21-34 The south masonry wall of a house is made of 10-cm-thick red facebrick, 10-cm-thick common brick, 19-mm-thick air space, and 13-mm-thickgypsum board, and its overall heat transfer coefficient is 1.6 W/m2 · °C, whichincludes the effects of convection on both sides. The house is located at 40° Nlatitude, and its cooling system is to be sized on the basis of the heat gain at3 PM solar time on July 21. The interior of the house is to be maintained at22°C, and the area of the wall is 20 m2. If the design ambient air temperatureat that time is 35°C, determine (a) the design heat gain through the wall,(b) the fraction of this heat gain due to solar heating, and (c) the fraction ofincident solar radiation transferred into the house through the wall.
21-35E The west wall of a shopping center in Pittsburgh, Pennsylvania (40°latitude), is 150 ft long and 12 ft high. The 2.5 percent summer design tem-perature of Pittsburgh is 86°F, and the interior of the building is maintained at72°F. The wall is made of face brick and concrete block with cement mortarin between, reflective air space, and a gypsum wallboard. The overall heattransfer coefficient of the wall is 0.14 Btu/h · ft2 · °F, which includes theeffects of convection on both sides. The cooling system is to be sized onthe basis of the heat gain at 16:00 hour (4 PM) solar time in late July. Deter-mine (a) the design heat gain through the wall and (b) the fraction of this heatgain due to solar heating.
21-36 The roof of a building in Istanbul, Turkey (40° latitude), is made of a30-cm-thick horizontal layer of concrete, painted white to minimize solargain, with a layer of plaster inside. The overall heat transfer coefficient of theroof is 1.8 W/m2 · °C, which includes the effects of convection on both the in-terior and exterior surfaces. The cooling system is to be sized on the basis ofthe heat gain at 16:00 hour solar time in late July. The interior of the buildingis to be maintained at 22°C, and the summer design temperature of Istanbul is30°C. If the exposed surface area of the roof is 150 m2, determine (a) thedesign heat gain through the roof and (b) the fraction of this heat gain due tosolar heating. Answers: (a) 4320 W, (b) 50 percent
21-71
Problems
FIGURE P21-34
Airspace Plaster
22°C35°C
Brick
Sun
FIGURE P21-36
Concrete
Plaster
White
30°C
22°C
Sun

Heat Gain from People, Lights, and Appliances
21-37C Is the heat given off by people in a concert hall an important con-sideration in the sizing of the air-conditioning system for that building or canit be ignored? Explain.
21-38C During a lighting retrofitting project, all the incandescent lamps ofa building are replaced by high-efficiency fluorescent lamps. Explain how thisretrofit will affect the (a) design cooling load, (b) annual energy consumptionfor cooling, and (c) annual energy consumption for heating for the building.
21-39C Give two good reasons why it is usually a good idea to replace in-candescent light bulbs by compact fluorescent bulbs that may cost 40 times asmuch to purchase.
21-40C Explain how the motors and appliances in a building affect the(a) design cooling load, (b) annual energy consumption for cooling, and(c) annual energy consumption for heating of the building.
21-41C Define motor efficiency, and explain how it affects the design cool-ing load of a building and the annual energy consumption for cooling.
21-42C Consider a hooded range in a kitchen with a powerful fan thatexhausts all the air heated and humidified by the range. Does the heat gener-ated by this range still need to be considered in the determination of the cool-ing load of the kitchen or can it just be ignored since all the heated air isexhausted?
21-43 Consider a 3-kW hooded electric open burner in an area where theunit costs of electricity and natural gas are $0.09/kWh and $0.55/therm, re-spectively. The efficiency of open burners can be taken to be 73 percent forelectric burners and 38 percent for gas burners. Determine the amount of theelectrical energy used directly for cooking, the cost of energy per “utilized”kWh, and the contribution of this burner to the design cooling load. Repeat thecalculations for the gas burner.
21-44 An exercise room has eight weight-lifting machines that have no mo-tors and four treadmills each equipped with a 2.5-hp motor. The motors oper-ate at an average load factor of 0.7, at which their efficiency is 0.77. Duringpeak evening hours, all 12 pieces of exercising equipment are used continu-ously, and there are also two people doing light exercises while waiting in linefor one piece of the equipment. Determine the rate of heat gain of the exerciseroom from people and the equipment at peak load conditions. How much ofthis heat gain is in the latent form?
21-45 A 75-hp motor with an efficiency of 91.0 percent is worn out and isreplaced by a high-efficiency motor having an efficiency of 95.4 percent. De-termine the reduction in the rate of internal heat gain due to higher efficiencyunder full-load conditions. Answer: 2836 W
21-46 The efficiencies of commercial hot plates are 48 and 23 percent forelectric and gas models, respectively. For the same amount of “utilized” en-ergy, determine the ratio of internal heat generated by gas hot plates to that byelectric ones.
21-47 Consider a classroom for 40 students and one instructor. Lighting isprovided by 18 fluorescent light bulbs, 40 W each, and the ballasts consumean additional 10 percent. Determine the rate of internal heat generation in thisclassroom when it is fully occupied. Answer: 5507 W
21-72
CHAPTER 21Heating and Coolingof Buildings
FIGURE P21-43
Openburner
Hood

21-48 A 60-hp electric car is powered by an electric motor mounted in theengine compartment. If the motor has an average efficiency of 88 percent,determine the rate of heat supply by the motor to the engine compartment atfull load.
21-49 A room is cooled by circulating chilled water through a heat ex-changer located in a room. The air is circulated through the heat exchanger bya 0.25-hp fan. Typical efficiency of small electric motors driving 0.25-hpequipment is 54 percent. Determine the contribution of the fan-motor assem-bly to the cooling load of the room. Answer: 345 W
21-50 Consider an office room that is being cooled adequately by a 12,000Btu/h window air conditioner. Now it is decided to convert this room into acomputer room by installing several computers, terminals, and printers witha total rated power of 3.5 kW. The facility has several 4000 Btu/h air condi-tioners in storage that can be installed to meet the additional cooling require-ments. Assuming a usage factor of 0.4 (i.e., only 40 percent of the rated powerwill be consumed at any given time) and additional occupancy of four people,determine how many of these air conditioners need to be installed in the room.
21-51 A restaurant purchases a new 8-kW electric range for its kitchen. De-termine the increase in the design cooling load of the kitchen if the range is(a) hooded and (b) unhooded. Answers: (a) 4.0 kW, (b) 1.28 kW
21-52 A department store expects to have 80 customers and 15 employees atpeak times in summer. Determine the contribution of people to the sensible,latent, and total cooling load of the store.
21-53E In a movie theater in winter, 500 people are watching a movie. Theheat losses through the walls, windows, and the roof are estimated to be150,000 Btu/h. Determine if the theater needs to be heated or cooled.
Heat Transfer through the Walls and Roofs
21-54C What is the R-value of a wall? How does it differ from the unit ther-mal resistance of the wall? How is it related to the U-factor?
21-55C What is effective emissivity for a plane-parallel air space? How is itdetermined? How is radiation heat transfer through the air space determinedwhen the effective emissivity is known?
21-56C The unit thermal resistances (R-values) of both 40-mm and 90-mmvertical air spaces are given in Table 21-13 to be 0.22 m2 · °C/W, which im-plies that more than doubling the thickness of air space in a wall has no effecton heat transfer through the wall. Do you think this is a typing error? Explain.
21-57C What is a radiant barrier? What kind of materials are suitable for useas radiant barriers? Is it worthwhile to use radiant barriers in the attics ofhomes?
21-58C Consider a house whose attic space is ventilated effectively so thatthe air temperature in the attic is the same as the ambient air temperature at alltimes. Will the roof still have any effect on heat transfer through the ceiling?Explain.
21-59 Determine the summer R-value and the U-factor of a wood framewall that is built around 38-mm � 140-mm wood studs with a center-to-centerdistance of 400 mm. The 140-mm-wide cavity between the studs is filled with
21-73
Problems
FIGURE P21-48
Electricmotor
η = 88%
Heat
FIGURE P21-50
12,000Btu/h
A/C
3.5 kWComputers
FIGURE P21-59
4a
1
32
4b
56

mineral fiber batt insulation. The inside is finished with 13-mm gypsum wall-board and the outside with 13-mm wood fiberboard and 13-mm � 200-mmwood bevel lapped siding. The insulated cavity constitutes 80 percent of theheat transmission area, while the studs, headers, plates, and sills constitute20 percent. Answers: 3.213 m2 · °C/W, 0.311 W/m2 · °C
21-60 The 13-mm-thick wood fiberboard sheathing of the wood stud wall inProblem 21-59 is replaced by a 25-mm-thick rigid foam insulation. Determinethe percent increase in the R-value of the wall as a result.
21-61E Determine the winter R-value and the U-factor of a masonry cavitywall that is built around 4-in.-thick concrete blocks made of lightweight ag-gregate. The outside is finished with 4-in. face brick with -in. cement mortarbetween the bricks and concrete blocks. The inside finish consists of -in.gypsum wallboard separated from the concrete block by -in.-thick (1-in. by3-in. nominal) vertical furring whose center-to-center distance is 16 in.Neither side of the -in.-thick air space between the concrete block andthe gypsum board is coated with any reflective film. When determining theR-value of the air space, the temperature difference across it can be taken tobe 30°F with a mean air temperature of 50°F. The air space constitutes 80 per-cent of the heat transmission area, while the vertical furring and similar struc-tures constitute 20 percent.
21-62 Consider a flat ceiling that is built around 38-mm � 90-mm woodstuds with a center-to-center distance of 400 mm. The lower part of the ceil-ing is finished with 13-mm gypsum wallboard, while the upper part consistsof a wood subfloor (R � 0.166 m2 · °C/W), a 16-mm plywood, a layer of felt(R � 0.011 m2 · °C/W), and linoleum (R � 0.009 m2 · °C/W). Both sides ofthe ceiling are exposed to still air. The air space constitutes 82 percent of theheat transmission area, while the studs and headers constitute 18 percent.Determine the winter R-value and the U-factor of the ceiling assuming the90-mm-wide air space between the studs (a) does not have any reflective sur-face, (b) has a reflective surface with � � 0.05 on one side, and (c) has reflec-tive surfaces with � � 0.05 on both sides. Assume a mean temperature of10°C and a temperature difference of 5.6°C for the air space.
21-63 Determine the winter R-value and the U-factor of a masonry cavitywall that consists of 100-mm common bricks, a 90-mm air space, 100-mmconcrete blocks made of lightweight aggregate, 20-mm air space, and 13-mmgypsum wallboard separated from the concrete block by 20-mm-thick(1-in. � 3-in. nominal) vertical furring whose center-to-center distance is 400mm. Neither side of the two air spaces is coated with any reflective films.When determining the R-value of the air spaces, the temperature differenceacross them can be taken to be 16.7°C with a mean air temperature of 10°C.The air space constitutes 84 percent of the heat transmission area, while thevertical furring and similar structures constitute 16 percent.
Answers: 1.02 m2 · °C/W, 0.978 W/m2 · °C
21-64 Repeat Problem 21-63 assuming one side of both air spaces is coatedwith a reflective film of � � 0.05.
21-65 Determine the winter R-value and the U-factor of a masonry wall thatconsists of the following layers: 100-mm face bricks, 100-mm commonbricks, 25-mm urethane rigid foam insulation, and 13-mm gypsum wallboard.
Answers: 1.404 m2 · °C/W, 0.712 W/m2 · °C
34
34
12
12
21-74
CHAPTER 21Heating and Coolingof Buildings
FIGURE P21-61E
76
5a
5b
43
2
1
FIGURE P21-62
1 2 3 4 5 6 7 8
FIGURE P21-63
76
54
32
1

21-66 The overall heat transfer coefficient (the U-value) of a wall underwinter design conditions is U � 1.55 W/m2 · °C. Determine the U-value of thewall under summer design conditions.
21-67 The overall heat transfer coefficient (the U-value) of a wall underwinter design conditions is U � 2.25 W/m2 · °C. Now a layer of 100-mm facebrick is added to the outside, leaving a 20-mm air space between the wall andthe bricks. Determine the new U-value of the wall. Also, determine the rate ofheat transfer through a 3-m-high, 7-m-long section of the wall after modi-fication when the indoor and outdoor temperatures are 22°C and �5°C,respectively.
21-68 Determine the summer and winter R-values, in m2 · °C/W, of a ma-sonry wall that consists of 100-mm face bricks, 13-mm of cement mortar,100-mm lightweight concrete block, 40-mm air space, and 20-mm plaster-board. Answers: 0.809 and 0.795 m2 · °C/W
21-69E The overall heat transfer coefficient of a wall is determined to beU � 0.09 Btu/h · ft2 · °F under the conditions of still air inside and winds of7.5 mph outside. What will the U-factor be when the wind velocity outside isdoubled? Answer: 0.0907 Btu/h · ft2 · °F
21-70 Two homes are identical, except that the walls of one house consist of200-mm lightweight concrete blocks, 20-mm air space, and 20-mm plaster-board, while the walls of the other house involve the standard R-2.4 m2 · °C/Wframe wall construction. Which house do you think is more energy efficient?
21-71 Determine the R-value of a ceiling that consists of a layer of 19-mmacoustical tiles whose top surface is covered with a highly reflective alu-minum foil for winter conditions. Assume still air below and above the tiles.
Heat Loss from Basement Walls and Floors
21-72C What is the mechanism of heat transfer from the basement wallsand floors to the ground? What is the effect of the composition and moisturecontent of the soil on this heat transfer?
21-73C Consider a basement wall that is completely below grade. Will heatloss through the upper half of the wall be greater or smaller than the heat lossthrough the lower half? Why?
21-74C Does a building lose more heat to the ground through the floor of abasement or through the below-grade section of the basement wall per unitsurface area? Explain.
21-75C Is heat transfer from a floor on grade at ground level proportional tothe surface area or perimeter of the floor?
21-76C Crawl spaces are often vented to prevent moisture accumulationand associated problems. How does venting the crawl space affect heat lossthrough the floor?
21-77C Consider a house with an unheated crawl space in winter. If thevents of the crawl space are tightly closed, do you think the cold water pipesshould still be insulated to avoid the danger of freezing?
21-78 Consider a basement in Anchorage, Alaska, where the mean wintertemperature is �5.0°C. The basement is 7 m wide and 10 m long, and the
21-75
Problems
FIGURE P21-67
Existingwall
Facebrick
FIGURE P21-71
19 mm
Highlyreflective
foil
Acousticaltiles
FIGURE P21-78
Basement
Wall
Insulation
Ground
22°C
0.9 m
1.8 m

basement floor is 1.8 m below the ground level. The top 0.9-m section of thewall below the grade is insulated with R-2.20 m2 · °C/W insulation. Assumingthe interior temperature of the basement to be 20°C, determine the peak heatloss from the basement to the ground through its walls and floor.
21-79 Consider a crawl space that is 10 m wide, 18 m long, and 0.80 m highwhose vent is kept open. The interior of the house is maintained at 21°C andthe ambient temperature is 2.5°C. Determine the rate of heat loss through thefloor of the house to the crawl space for the cases of (a) insulated and (b) un-insulated floor. Answers: (a) 1439 W, (b) 4729 W
21-80 The dimensions of a house with basement in Boise, Idaho, are18 m � 12 m. The 1.8-m-high portion of the basement wall is below theground level and is not insulated. If the basement is maintained at 18°C,determine the rate of design heat loss from the basement through its wallsand floor.
21-81E The dimensions of a house with basement in Boise, Idaho, are 60 ft� 32 ft. The 6-ft-high portion of the basement wall is below the ground leveland is not insulated. If the basement is maintained at 68°F, determine the rateof design heat loss from the basement through its walls and floor.
21-82 A house in Baltimore, Maryland, has a concrete slab floor that sitsdirectly on the ground at grade level. The house is 18 m long and 15 m wide,and the weather in Baltimore can be considered to be moderate. The walls ofthe house are made of 20-cm block wall with brick and are insulated from theedge to the footer with R-0.95 m2 · °C/W insulation. If the house is maintainedat 22°C, determine the heat loss from the floor at winter design conditions.
Answer: 1873 W
21-83 Repeat Problem 21-82 assuming the below-grade section of the wallis not insulated.
21-84 The crawl space of a house is 12 m wide, 20 m long, and 0.70 m high.The vents of the crawl space are kept closed, but air still infiltrates at a rate of1.2 ACH. The indoor and outdoor design temperatures are 22°C and �5°C,respectively, and the deep-down ground temperature is 10°C. Determine theheat loss from the house to the crawl space, and the crawl space temperatureassuming the walls, floor, and ceiling of the crawl space are (a) insulated and(b) uninsulated. Answers: (a) 1.3°C, (b) 11.7°C
21-85 Repeat Problem 21-84 assuming the vents are tightly sealed forwinter and thus air infiltration is negligible.
Heat Transfer through Windows
21-86C Why are the windows considered in three regions when analyzingheat transfer through them? Name those regions and explain how the overallU-value of the window is determined when the heat transfer coefficients forall three regions are known.
21-87C Consider three similar double-pane windows with air gap widths of5, 10, and 20 mm. For which case will the heat transfer through the windowwill be a minimum?
21-88C In an ordinary double-pane window, about half of the heat transferis by radiation. Describe a practical way of reducing the radiation componentof heat transfer.
21-76
CHAPTER 21Heating and Coolingof Buildings
FIGURE P21-81E
Basement
Wall
Ground
68°F6 ft
FIGURE P21-84
Crawlspace
Floor
House22°C
–5°C
Vent
0.7 m
Q·
10°C
Wall

21-89C Consider a double-pane window whose air space width is 20 mm.Now a thin polyester film is used to divide the air space into two 10-mm-widelayers. How will the film affect (a) convection and (b) radiation heat transferthrough the window?
21-90C Consider a double-pane window whose air space is flashed andfilled with argon gas. How will replacing the air in the gap by argon affect(a) convection and (b) radiation heat transfer through the window?
21-91C Is the heat transfer rate through the glazing of a double-panewindow higher at the center or edge section of the glass area? Explain.
21-92C How do the relative magnitudes of U-factors of windows with alu-minum, wood, and vinyl frames compare? Assume the windows are identicalexcept for the frames.
21-93 Determine the U-factor for the center-of-glass section of a double-pane window with a 13-mm air space for winter design conditions. The glaz-ings are made of clear glass having an emissivity of 0.84. Take the average airspace temperature at design conditions to be 10°C and the temperature differ-ence across the air space to be 15°C.
21-94 A double-door wood-framed window with glass glazing and metalspacers is being considered for an opening that is 1.2 m high and 1.8 m widein the wall of a house maintained at 20°C. Determine the rate of heat lossthrough the window and the inner surface temperature of the window glassfacing the room when the outdoor air temperature is �8°C if the window isselected to be (a) 3-mm single glazing, (b) double glazing with an air space of13 mm, and (c) low-e-coated triple glazing with an air space of 13 mm.
21-95 Determine the overall U-factor for a double-door-type wood-frameddouble-pane window with 13-mm air space and metal spacers, and compareyour result to the value listed in Table 21-19. The overall dimensions ofthe window are 2.00 m � 2.40 m, and the dimensions of each glazing are1.92 m � 1.14 m.
21-96 Consider a house in Atlanta, Georgia, that is maintained at 22°C andhas a total of 20 m2 of window area. The windows are double-door-type withwood frames and metal spacers. The glazing consists of two layers of glasswith 12.7 mm of air space with one of the inner surfaces coated with reflec-tive film. The winter average temperature of Atlanta is 11.3°C. Determine theaverage rate of heat loss through the windows in winter. Answer: 456 W
21-97E Consider an ordinary house with R-13 walls (walls that have anR-value of 13 h · ft2 · °F/Btu). Compare this to the R-value of the commondouble-door windows that are double pane with in. of air space and havealuminum frames. If the windows occupy only 20 percent of the wall area,determine if more heat is lost through the windows or through the remaining80 percent of the wall area. Disregard infiltration losses.
21-98 The overall U-factor of a fixed wood-framed window with doubleglazing is given by the manufacturer to be U � 2.76 W/m2 · °C under the con-ditions of still air inside and winds of 12 km/h outside. What will the U-factorbe when the wind velocity outside is doubled?
Answer: 2.88 W/m2 · °C
21-99 The owner of an older house in Wichita, Kansas, is consideringreplacing the existing double-door type wood-framed single-pane windowswith vinyl-framed double-pane windows with an air space of 6.4 mm. The
14
21-77
Problems
FIGURE P21-94
Double-doorwindow Wood frame
GlassGlass
FIGURE P21-99
Single pane
Double pane

new windows are of double-door type with metal spacers. The house is main-tained at 22°C at all times, but heating is needed only when the outdoor tem-perature drops below 18°C because of the internal heat gain from people,lights, appliances, and the sun. The average winter temperature of Wichita is7.1°C, and the house is heated by electric resistance heaters. If the unit cost ofelectricity is $0.07/kWh and the total window area of the house is 12 m2, de-termine how much money the new windows will save the home owner permonth in winter.
Solar Heat Gain through Windows
21-100C What fraction of the solar energy is in the visible range (a) outsidethe earth’s atmosphere and (b) at sea level on earth? Answer the same questionfor infrared radiation.
21-101C Describe the solar radiation properties of a window that is ideallysuited for minimizing the air-conditioning load.
21-102C Define the SHGC (solar heat gain coefficient), and explain how itdiffers from the SC (shading coefficient). What are the values of the SHGCand SC of a single-pane clear-glass window?
21-103C What does the SC (shading coefficient) of a device represent?How do the SCs of clear glass and heat-absorbing glass compare?
21-104C What is a shading device? Is an internal or external shading devicemore effective in reducing the solar heat gain through a window? How doesthe color of the surface of a shading device facing outside affect the solarheat gain?
21-105C What is the effect of a low-e coating on the inner surface of a win-dow glass on the (a) heat loss in winter and (b) heat gain in summer throughthe window?
21-106C What is the effect of a reflective coating on the outer surface of awindow glass on the (a) heat loss in winter and (b) heat gain in summerthrough the window?
21-107 A manufacturing facility located at 32° N latitude has a glazing areaof 60 m2 facing west that consists of double-pane windows made of clearglass (SHGC � 0.766). To reduce the solar heat gain in summer, a reflectivefilm that will reduce the SHGC to 0.35 is considered. The cooling season con-sists of June, July, August, and September, and the heating season, Octoberthrough April. The average daily solar heat fluxes incident on the west side atthis latitude are 2.35, 3.03, 3.62, 4.00, 4.20, 4.24, 4.16, 3.93, 3.48, 2.94, 2.33,and 2.07 kWh/day · m2 for January through December, respectively. Also, theunit costs of electricity and natural gas are $0.09/kWh and $0.45/therm, re-spectively. If the coefficient of performance of the cooling system is 3.2 andthe efficiency of the furnace is 0.90, determine the net annual cost savings dueto installing reflective coating on the windows. Also, determine the simplepayback period if the installation cost of reflective film is $20/m2.
Answers: $53, 23 years
21-108 A house located in Boulder, Colorado (40° N latitude), has ordinarydouble-pane windows with 6-mm-thick glasses and the total window areas are8, 6, 6, and 4 m2 on the south, west, east, and north walls. Determine the totalsolar heat gain of the house at 9:00, 12:00, and 15:00 solar time in July. Also,
21-78
CHAPTER 21Heating and Coolingof Buildings

determine the total amount of solar heat gain per day for an average day inJanuary.
21-109 Repeat Problem 21-108 for double-pane windows that are gray-tinted.
21-110 Consider a building in New York (40° N latitude) that has 200 m2 ofwindow area on its south wall. The windows are double-pane heat-absorbingtype, and are equipped with light-colored venetian blinds with a shading co-efficient of SC � 0.30. Determine the total solar heat gain of the buildingthrough the south windows at solar noon in April. What would your answer beif there were no blinds at the windows?
21-111 A typical winter day in Reno, Nevada (39° N latitude), is cold butsunny, and thus the solar heat gain through the windows can be more than theheat loss through them during daytime. Consider a house with double-door-type windows that are double paned with 3-mm-thick glasses and 6.4 mm ofair space and have aluminum frames and spacers. The house is maintained at22°C at all times. Determine if the house is losing more or less heat than it isgaining from the sun through an east window on a typical day in January fora 24-h period if the average outdoor temperature is 10°C.
Answer: less
21-112 Repeat Problem 21-111 for a south window.
21-113E Determine the rate of net heat gain (or loss) through a 9-ft-high,15-ft-wide, fixed -in. single-glass window with aluminum frames on thewest wall at 3 PM solar time during a typical day in January at a location near40° N latitude when the indoor and outdoor temperatures are 70°F and 45°F,respectively. Answer: 16,840 Btu/h gain
21-114 Consider a building located near 40° N latitude that has equal win-dow areas on all four sides. The building owner is considering coating thesouth-facing windows with reflective film to reduce the solar heat gain andthus the cooling load. But someone suggests that the owner will reduce thecooling load even more if she coats the west-facing windows instead. What doyou think?
Infiltration Heat Load and Weatherizing
21-115C What is infiltration? How does it differ from ventilation? Howdoes infiltration affect the heating load in winter and the cooling load in sum-mer? Explain.
21-116C Describe briefly two ways of measuring the infiltration rate ofa building. Also, explain how the design infiltration rate differs from theseasonal average infiltration rate, and which is used when sizing a heatingsystem.
21-117C How is the infiltration unit ACH (air changes per hour) defined?Why should too low and too high values of ACH be avoided?
21-118C How can the energy of the air vented out from the kitchens andbathrooms be saved?
21-119C Is latent heat load of infiltration necessarily zero when the relativehumidity of the hot outside air in summer is the same as that of inside air?Explain.
18
21-79
Problems
FIGURE P21-110
Heat-absorbingglass
Double-panewindow
Venetianblinds
Lightcolored
FIGURE P21-111
Solarheat gain
Heatloss
22°C10°C
Double-panewindow
Sun

21-120C Is latent heat load of infiltration necessarily zero when the humid-ity ratio (absolute humidity) of the hot outside air in summer is the same asthat of inside air? Explain.
21-121C What are some practical ways of preventing infiltration in homes?
21-122C It is claimed that the infiltration rate and infiltration losses can bereduced by using radiant panel heaters since the air temperature can be low-ered without sacrificing comfort. It is also claimed that radiant panels will in-crease the heat losses through the wall and the roof by conduction as a resultof increased surface temperature. What do you think of these claims?
21-123E The average atmospheric pressure in Spokane, Washington (eleva-tion � 2350 ft), is 13.5 psia, and the average winter temperature is 36.5°F.The pressurization test of a 9-ft-high, 3000-ft2 older home revealed that theseasonal average infiltration rate of the house is 2.2 ACH. It is suggested thatthe infiltration rate of the house can be reduced by half to 1.1 ACH by winter-izing the doors and the windows. If the house is heated by natural gas whoseunit cost is $0.62/therm and the heating season can be taken to be six months,determine how much the home owner will save from the heating costs peryear by this winterization project. Assume the house is maintained at 72°F atall times, and the efficiency of the furnace is 0.65. Also, assume the latent heatload during the heating season to be negligible.
Answer: $765
21-124 Consider two identical buildings, one in Los Angeles, California,where the atmospheric pressure is 101 kPa and the other in Denver, Colorado,where the atmospheric pressure is 83 kPa. Both buildings are maintained at21°C, and the infiltration rate for both buildings is 1.2 ACH on a day when theoutdoor temperature at both locations is 10°C. Disregarding latent heat, deter-mine the ratio of the heat losses by infiltration at the two cities.
21-125 Determine the rate of sensible heat loss from a building due to infil-tration if outdoor air at �10°C and 90 kPa enters the building at a rate of35 L/s when the indoors is maintained at 22°C. Answer: 1335 W
21-126 The ventilating fan of the bathroom of a building has a volume flowrate of 30 L/s and runs continuously. The building is located in San Francisco,California, where the average winter temperature is 12.2°C, and is maintainedat 22°C at all times. The building is heated by electricity whose unit cost is$0.09/kWh. Determine the amount and cost of the heat “vented out” permonth in winter. Answers: 256 kWh, $23.00
21-127 For an infiltration rate of 1.2 ACH, determine the sensible, latent,and total infiltration heat load, in kW, of a building at sea level, that is 20 mlong, 13 m wide, and 3 m high when the outdoor air is at 32°C and 50 percentrelative humidity. The building is maintained at 24°C and 50 percent relativehumidity at all times.
Annual Energy Consumption
21-128C Is it possible for a building in a city to have a higher peak heatingload but a lower energy consumption for heating in winter than an identicalbuilding in another city? Explain.
21-129C Can we determine the annual energy consumption of a building forheating by simply multiplying the design heating load of the building by thenumber of hours in the heating season? Explain.
21-80
CHAPTER 21Heating and Coolingof Buildings
FIGURE P21-123E
72°F
2.2 ACHInfiltration
36.5°F
FIGURE P21-126
22°C
12.2°C
30 L/s
Bathroom
Fan

21-130C Considerable energy can be saved by lowering the thermostat set-ting in winter and raising it in summer by a few degrees. As the manager of alarge commercial building, would you implement this measure to save energyand cut costs?
21-131C What is the number of heating degree-days for a winter day duringwhich the average outdoor temperature was 10°C, and it never went above18°C?
21-132C What is the number of heating degree-days for a winter month dur-ing which the average outdoor temperature was 12°C, and it never went above18°C?
21-133C Someone claims that the °C-days for a location can be convertedto °F-days by simply multiplying °C-days by 1.8. But another person insiststhat 32 must be added to the result because of the formula T(°F) �1.8T(°C) � 32. Which person do you think is right?
21-134C What is balance-point temperature? Why is the balance-pointtemperature used in the determination of degree-days instead of the actualthermostat setting of a building?
21-135C Under what conditions is it proper to use the degree-day method todetermine the annual energy consumption of a building? What is the numberof heating degree-days for a day during which the average outdoor tempera-ture was 10°C, and it never went above 18°C?
21-136 Suppose you have moved to Syracuse, New York, in August, andyour roommate, who is short of cash, offered to pay the heating bills duringthe upcoming year (starting January l) if you pay the heating bills for the cur-rent calendar year until December 31. Is this a good offer for you?
21-137E Using indoor and outdoor winter design temperatures of 70°F and�10°F, respectively, the design heat load of a 2500-ft2 house in Billings,Montana, is determined to be 83,000 Btu/h. The house is to be heated by nat-ural gas that will be burned in a 95 percent efficient, high-efficiency furnace.If the unit cost of natural gas is $0.65/therm, estimate the annual gas con-sumption of this house and its cost. Answers: 1848 therms, $1201
21-138 Consider a building whose annual air-conditioning load is estimatedto be 120,000 kWh in an area where the unit cost of electricity is $0.10/kWh.Two air conditioners are considered for the building. Air conditioner A has aseasonal average COP of 3.2 and costs $5500 to purchase and install. Air con-ditioner B has a seasonal average COP of 5.0 and costs $7000 to purchase andinstall. If all else are equal, determine which air conditioner is a better buy.
21-139 The lighting requirements of an industrial facility are being met by700 40-W standard fluorescent lamps. The lamps are close to completing theirservice life, and are to be replaced by their 34-W high-efficiency counterpartsthat operate on the existing standard ballasts. The standard and high-efficiencyfluorescent lamps can be purchased at quantity at a cost of $1.77 and $2.26each, respectively. The facility operates 2800 hours a year and all of the lampsare kept on during operating hours. Taking the unit cost of electricity to be$0.08/kWh and the ballast factor to be 1.1, determine how much energy andmoney will be saved a year as a result of switching to the high-efficiency flu-orescent lamps. Also, determine the simple payback period.
Answers: 12,936 kWh, $1035, 4 months
21-81
Problems
FIGURE P21-138
House
120,000 kWh
120,000 kWh
Air cond. ACOP = 3.2
Air cond. BCOP = 5.0

21-140 The lighting needs of a storage room are being met by six fluores-cent light fixtures, each fixture containing four lamps rated at 60 W each. Allthe lamps are on during operating hours of the facility, which are 6 AM to 6 PM
365 days a year. The storage room is actually used for an average of threehours a day. If the price of the electricity is $0.08/kWh, determine the amountof energy and money that will be saved as a result of installing a motion sen-sor. Also, determine the simple payback period if the purchase price of thesensor is $32 and it takes 1 hour to install it at a cost of $40.
21-141 An office building in the Reno area (3346°C-days) is maintained ata temperature of 20°C at all times during the heating season, which is taken tobe November 1 through April 30. The work hours of the office are 8 AM to6 PM Monday through Friday, and there is no air-conditioning. An examina-tion of the heating bills of the facility for the previous year reveals that the fa-cility used 3530 therms of natural gas at an average price of $0.58/therm, andthus paid $2047 for heating. There are five thermostats in the facility to con-trol the temperatures of various sections. The existing manual thermostats areto be replaced by programmable ones to reduce the heating costs. The newthermostats are to lower the temperature setting shortly before closing hourand raise it shortly before the opening hour. The thermostats will be set to7.2°C during the off-work hours and to 20°C during the work hours. Deter-mine the annual energy and cost savings as a result of installing five pro-grammable thermostats. Also, determine the simple payback period if theinstalled cost of each programmable thermostat is $190.
21-142 A 75-hp motor with an efficiency of 91.0 percent is worn out and isto be replaced with a high-efficiency motor having an efficiency of 95.4 per-cent. The machine operates 4368 hours a year at a load factor of 0.75. Takingthe cost of electricity to be $0.08/kWh, determine the amount of energy andmoney saved as a result of installing the high-efficiency motor instead of thestandard one. Also, determine the simple payback period if the purchase pricesof the standard and high-efficiency motors are $5449 and $5520, respectively.
Answers: 9290 kWh, $743, 1.1 months
21-143E The steam requirements of a manufacturing facility are being metby a boiler of 3.8 million Btu/h input. The combustion efficiency of the boileris measured to be 0.7 by a handheld flue gas analyzer. After tuning up theboiler, the combustion efficiency rises to 0.8. The boiler operates 1500 hoursa year intermittently. Taking the unit cost of energy to be $4.35 per millionBtu, determine the annual energy and cost savings as a result of tuning up theboiler.
21-144 The space heating of a facility is accomplished by natural gasheaters that are 80 percent efficient. The compressed air needs of the facilityare met by a large liquid-cooled compressor. The coolant of the compressor iscooled by air in a liquid-to-air heat exchanger whose air flow section is 1.0 mhigh and 1.0 m wide. During typical operation, the air is heated from 20°C to52°C as it flows through the heat exchanger. The average velocity of air on theinlet side is measured to be 3 m/s. The compressor operates 20 hours a dayand 5 days a week throughout the year. Taking the heating season to be6 months (26 weeks) and the cost of the natural gas to be $0.50/therm(1 therm � 105,500 kJ), determine how much money will be saved by divert-ing the compressor waste heat into the facility during the heating season.
21-82
CHAPTER 21Heating and Coolingof Buildings
FIGURE P21-140
Storageroom
Motionsensor
FIGURE P21-144
Hotliquid Liquid-to-air
heat exchanger
52°C
Coolliquid
20°C
Air
3 m/s

21-145 Consider a family in Atlanta, Georgia, whose average heating billhas been $600 a year. The family now moves to an identical house in Denver,Colorado, where the fuel and electricity prices are also the same. How muchdo you expect the annual heating bill of this family to be in their new home?
21-146E The design heating load of a new house in Cleveland, Ohio, is cal-culated to be 65,000 Btu/h for an indoor temperature of 72°F. If the house isto be heated by a natural gas furnace that is 90 percent efficient, predict theannual natural gas consumption of this house, in therms. Assume the entirehouse is maintained at indoor design conditions at all times.
21-147 For inside and outside design temperatures of 22°C and �12°C,respectively, a home located in Boise, Idaho, has a design heating load of38 kW. The house is heated by electric resistance heaters, and the cost of elec-tricity is $0.06/kWh. Determine how much money the home owner will saveif she lowers the thermostat from 22°C to 14°C from 11 PM to 7 AM everynight in December.
Review Problems
21-148 Consider a home owner who is replacing his 20-year-old natural gasfurnace that has an efficiency of 60 percent. The home owner is considering aconventional furnace that has an efficiency of 82 percent and costs $1600, anda high-efficiency furnace that has an efficiency of 95 percent and costs $2700.The home owner would like to buy the high-efficiency furnace if the savingsfrom the natural gas pay for the additional cost in less than eight years. If thehome owner is presently paying $1100 a year for heating, determine if heshould buy the conventional or high-efficiency model.
21-149 The convection heat transfer coefficient for a clothed person seatedin air moving at a velocity of 0.2 to 4 m/s is given by h � 8.3�0.6 where � isin m/s and h is in W/m2 · °C. The convection coefficient at lower velocities is3.1 W/m2 · °C. Plot the convection coefficient against the air velocity, andcompare the average convection coefficient to the average radiation coeffi-cient of about 5 W/m2 · °C.
21-150 Workers in a casting facility are surrounded with hot surfaces, withan average temperature of 40°C. The activity level of the workers correspondsto a heat generation rate of 300 W, half of which is latent. If the air tempera-ture is 22°C, determine the velocity of air needed to provide comfort for theworkers. Take the average exposed surface area and temperature of the work-ers to be 1.8 m2 and 30°C, respectively.
21-151 Replacing incandescent lights by energy-efficient fluorescent lightscan reduce the lighting energy consumption to one-fourth of what it was be-fore. The energy consumed by the lamps is eventually converted to heat, andthus switching to energy-efficient lighting also reduces the cooling load insummer but increases the heating load in winter. Consider a building that isheated by a natural gas furnace having an efficiency of 80 percent and cooledby an air conditioner with a COP of 3.5. If electricity costs $0.08/kWh andnatural gas costs $0.70/therm, and the annual heating load of the building isroughly equal to the annual cooling load, determine if efficient lighting willincrease or decrease the total heating and cooling cost of the building.
Answer: Decrease
21-83
Problems

21-152 A wall of a farmhouse is made of 200-mm common brick. Deter-mine the rate of heat transfer through a 20-m2 section of the wall when the in-door and outdoor temperatures are 20°C and �5°C, respectively, and the wallis exposed to 24 km/h winds. Answer: 1280 W
21-153E Determine the R-value and the overall heat transfer coefficient (theU-factor) of a 45° pitched roof that is built around nominal 2-in. � 4-in. woodstuds with a center-to-center distance of 24 in. The 3.5-in.-wide air space be-tween the studs has a reflective surface and its effective emissivity is 0.05.The lower part of the roof is finished with -in. gypsum wallboard and theupper part with -in. plywood, building paper, and asphalt shingle roofing.The air space constitutes 80 percent of the heat transmission area, while thestuds and headers constitute 20 percent.
21-154 The winter design heat load of a planned house is determined to be32 kW. The original design involved aluminum-frame single-pane windowswith a U-factor of 7.16 W/m2 · °C, and heat losses through the windowsaccounted for 26 percent of the total. Alarmed by the projected high cost ofannual energy usage, the owner decided to switch to vinyl-frame double-panewindows whose U-factor is 2.74 W/m2 · °C. Determine the reduction in theheat load of the house as a result of switching to double-pane windows.
21-155 The attic of a 150-m2 house in Thessaloniki, Greece (40° N latitude),is not vented in summer. The R-values of the roof and the ceiling are 1.4 m2 · °C/W and 0.50 m2 · °C/W, respectively, and the ratio of the roof areato ceiling area is 1.30. The indoors are maintained at 23°C at all times. Deter-mine the rate of heat gain through the roof in late July at 16:00 (4 PM) solartime if the outdoor temperature is 32°C, assuming the roof is (a) light coloredand (b) dark colored. Answers: (a) 1700 W, (b) 2900 W
21-156 The dimensions of a house in Norfolk, Virginia, are 19 m � 10 m,and the house has a basement. The 1.8-m-high portion of the basement wall isbelow the ground level, and the top 0.6-m section of the wall below the gradeis insulated with R-0.73 m2 · °C/W insulation. If the basement is maintained at17°C, determine the rate of design heat loss from the basement through itswalls and floor.
21-157 A house in Anchorage, Alaska, has a concrete slab floor that sitsdirectly on the ground at grade level. The house is 20 m long and 15 m wide,and the weather in Alaska is very severe. The walls of the house are made of20-cm block wall with brick and are insulated from the edge to the footer withR-0.95 m2 · °C/W insulation. If the house is maintained at 22°C, determine theheat loss from the floor at winter design conditions.
21-158 Repeat Problem 21-157 assuming the below-grade section of thewall is not insulated. Answer: 3931 W
21-159 A university campus has 200 classrooms and 400 faculty offices.The classrooms are equipped with 12 fluorescent light bulbs, each consuming110 W, including the electricity used by the ballasts. The faculty offices, onaverage, have half as many light bulbs. The campus is open 240 days a year.The classrooms and faculty offices are not occupied an average of 4 hours aday, but the lights are kept on. If the unit cost of electricity is $0.075/kWh, de-termine how much energy and money the campus will save a year if the lightsin the classrooms and faculty offices are turned off during unoccupied periods.
58
12
21-84
CHAPTER 21Heating and Coolingof Buildings
FIGURE P21-153E
45°
1 2 3 4 5a 5b 6 7
FIGURE P21-155
Rroof
Rceiling
To
Ti
Deck
RafterAttic
23°C
32°C Aroof
Tattic
Aceiling
Sun
FIGURE P21-157
Gradeline
Foundationwall
Insulation

21-160E For an infiltration rate of 0.8 ACH, determine the sensible, latent,and total infiltration heat load, in Btu/h, of a building at sea level that is 60 ftlong, 50 ft wide, and 9 ft high when the outdoor air is at 82°F and 40 percentrelative humidity. The building is maintained at 74°F and 40 percent relativehumidity at all times.
21-161 It is believed that January is the coldest month in the Northern hemi-sphere. On the basis of Table 21-5, determine if this is true for all locations.
21-162 The December space heating bill of a fully occupied house inLouisville, Kentucky, that was kept at 22°C at all times was $110. How muchdo you think the December space heating bill of this house would be if it stillwere kept at 22°C but there were no people living in the house, no lights wereon, no appliances were operating, and there was no solar heat gain?
21-163 For an indoor temperature of 22°C, the design heating load of a resi-dential building in Charlotte, North Carolina, is determined to be 28 kW. Thehouse is to be heated by natural gas, which costs $0.70/therm. The efficiencyof the gas furnace is 80 percent. Determine (a) the heat loss coefficient of thebuilding, in kW/°C, and (b) the annual energy usage for heating and its cost.
Answers: (a) 1 kW/°C, (b) 1815 therms, $1271
Computer, Design, and Essay Problems
21-164 On average, superinsulated homes use just 15 percent of the fuel re-quired to heat the same size conventional home built before the energy crisesin the 1970s. Write an essay on superinsulated homes, and identify the fea-tures that make them so energy efficient as well as the problems associatedwith them. Do you think superinsulated homes will be economically attractivein your area?
21-165 Conduct the following experiment to determine the heat loss coeffi-cient of your house or apartment in W/°C or Btu/h · °F. First make sure thatthe conditions in the house are steady and the house is at the set temperatureof the thermostat. Use an outdoor thermometer to monitor outdoor tempera-ture. One evening, using a watch or timer, determine how long the heater wason during a 3-h period and the average outdoor temperature during that pe-riod. Then using the heat output rating of your heater, determine the amountof heat supplied. Also, estimate the amount of heat generation in the houseduring that period by noting the number of people, the total wattage of lightsthat were on, and the heat generated by the appliances and equipment. Usingthat information, calculate the average rate of heat loss from the house and theheat loss coefficient.
21-166 Numerous professional software packages are available in the mar-ket for performing heat transfer analysis of buildings, and they are advertisedin professional magazines such as the ASHRAE Journal magazine publishedby the American Society of Heating, Refrigerating, and Air-ConditioningEngineers (ASHRAE). Your company decides to purchase such a softwarepackage and asks you to prepare a report on the available packages, theircosts, capabilities, ease of use, compatibility with the available hardware andother software, as well as the reputation of the software company, their his-tory, financial health, customer support, training, and future prospects, amongother things. After a preliminary investigation, select the top three packages
21-85
Problems

and prepare a full report on them. Also, find out if there are any free softwarepackages available that can be used for the same purpose.
21-167 A 1982 U.S. Department of Energy article (FS 204) states that a leakof one drip of hot water per second can cost $1.00 per month. Making reason-able assumptions about the drop size and the unit cost of energy, determine ifthis claim is reasonable.
21-168 Obtain the following weather data for the city in which you live:the elevation, the atmospheric pressure, the number of heating and coolingdegree-days, the 97.5 percent level winter and summer design temperatures,the average annual and winter temperatures, the record high and low temper-atures and when they occurred, and the unit cost of natural gas and electricityfor residential buildings.
21-169 Your neighbor lives in a 2500-ft2 (about 250-m2) older house heatedby natural gas. The current gas heater was installed in the early 1970s and hasan efficiency (called the annual fuel utilization efficiency, or AFUE, rating of65 percent. It is time to replace the furnace, and the neighbor is trying to de-cide between a conventional furnace that has an efficiency of 80 percent andcosts $1500 and a high-efficiency furnace that has an efficiency of 95 percentand costs $2500. Your neighbor offered to pay you $100 if you help him makethe right decision. Considering the weather data, typical heating loads, and theprice of natural gas in your area, make a recommendation to your neighborbased on a convincing economic analysis.
21-170 The decision of whether to invest in an energy-saving measure ismade on the basis of the length of time for it to pay for itself in projectedenergy (and thus cost) savings. The easiest way to reach a decision is to cal-culate the simple payback period by simply dividing the installed cost of themeasure by the annual cost savings and comparing it to the lifetime of the in-stallation. This approach is adequate for short payback periods (less than fiveyears) in stable economies with low interest rates (under 10 percent) since theerror involved is no larger than the uncertainties. However, if the paybackperiod is long, it may be necessary to consider the interest rate if the money isto be borrowed, or the rate of return if the money is invested elsewhereinstead of the energy conservation measure. For example, a simple paybackperiod of five years corresponds to 5.0, 6.12, 6.64, 7.27, 8.09, 9.919, 10.84,and 13.91 for an interest rate (or return on investment) of 0, 6, 8, 10, 12, 14,16, and 18 percent, respectively. Finding out the proper relations from engi-neering economics books, determine the payback periods for the interest ratesgiven above corresponding to simple payback periods of 1 through 10 years.
21-171 A radiant heater mounted on the ceiling is to be designed to assistthe heating of a 250-m2 residence in Las Vegas, Nevada, whose walls are 4 mhigh. The indoor air is to be maintained at 15°C at all times, and the radiantheater is to provide thermal comfort for the sedentary occupants in light cloth-ing. The system considered consists of hot water pipes buried in the ceilingand occupies the entire ceiling. Recommend a temperature for the ceiling, andestimate the energy consumption of the radiant heater. Does the radiant heaterappear to save enough energy to justify its cost?
21-86
CHAPTER 21Heating and Coolingof Buildings