heavy-duty flexible bases: field performance and draft
TRANSCRIPT

Technical Report Documentation Page 1. Report No. FHWA/TX-06/0-4358-4
2. Government Accession No.
3. Recipient's Catalog No.
4. Title and Subtitle HEAVY-DUTY FLEXIBLE BASES: FIELD PERFORMANCE AND DRAFT SPECIFICATIONS
5. Report Date June 2006 Published: December 2007
6. Performing Organization Code
7. Author(s) Tom Scullion, John P. Harris, Stephen Sebesta, and Soheil Nazarian
8. Performing Organization Report No. Report 0-4358-4 10. Work Unit No. (TRAIS)
9. Performing Organization Name and Address Texas Transportation Institute The Texas A&M University System College Station, Texas 77843-3135
11. Contract or Grant No. Project 0-4358 13. Type of Report and Period Covered Technical Report: September 2004-August 2005
12. Sponsoring Agency Name and Address Texas Department of Transportation Research and Technology Implementation Office P. O. Box 5080 Austin, Texas 78763-5080
14. Sponsoring Agency Code
15. Supplementary Notes Project performed in cooperation with the Texas Department of Transportation and the Federal Highway Administration. Project Title: Materials, Specifications, and Construction Techniques for High Performance Flexible Bases URL: http://tti.tamu.edu/documents/0-4358-4.pdf 16. Abstract Traditional Texas flexible bases specified under Item 247 perform well as long as they are kept dry. However, rapid and sudden failures can occur if water enters these bases. The source of the moisture susceptibility problems is the fine clay in these bases. One base in this study contained over 2 percent Smectite, a highly expansive clay mineral. The concept of heavy-duty bases resolves around (a) controlling the type and amount of fine material and (b) requiring a high-strength rock. In Project 4358 laboratory and field studies were conducted. The use of heavy-duty bases with fines contents between 5 and 10 percent requires modifications to laboratory testing, design, and field construction procedures. Three TxDOT projects containing bases which met the proposed heavy-duty base specifications were monitored in this study. The long-term benefits of these low-fines bases could not be demonstrated in this short study, as all the applicable sections are new and performing well. However, the oldest section on FM-1810 in the Fort Worth District has higher long-term modulus than the control Item 247 base section. This report includes a draft construction specification (Item 245) for consideration on future heavy-duty base projects. This specification is based on recommendations from Texas district laboratory engineers. Heavy-duty bases will cost more than traditional bases, and they are not required in many areas of west Texas where rainfall is low. However, these bases will be economically viable in many areas of Northeast Texas, especially with the escalating prices of traditional road building materials. 17. Key Words Flexible Pavements, Granular Bases, Heavy-Duty Bases, Specifications, GPR, FWD
18. Distribution Statement No restrictions. This document is available to the public through NTIS: National Technical Information Service Springfield, Virginia 22161 http://www.ntis.gov
19. Security Classif.(of this report) Unclassified
20. Security Classif.(of this page) Unclassified
21. No. of Pages 126
22. Price
Form DOT F 1700.7 (8-72) Reproduction of completed page authorized


HEAVY-DUTY FLEXIBLE BASES: FIELD PERFORMANCE AND DRAFT SPECIFICATIONS
by
Tom Scullion, P.E. Senior Research Engineer
Texas Transportation Institute
John P. Harris Associate Research Scientist
Texas Transportation Institute
Stephen Sebesta Associate Transportation Researcher
Texas Transportation Institute
and
Soheil Nazarian Professor and Research Engineer
University of Texas at El Paso
Report 0-4358-4 Project 0-4358
Project Title: Materials, Specifications, and Construction Techniques for High Performance Flexible Bases
Performed in cooperation with the Texas Department of Transportation
and the Federal Highway Administration
June 2006 Published: December 2007
TEXAS TRANSPORTATION INSTITUTE The Texas A&M University System College Station, Texas 77843-3135


v
DISCLAIMER
The contents of this report reflect the views of the authors, who are responsible for the
facts and the accuracy of the data presented herein. The contents do not necessarily reflect the
official views or policies of the Texas Department of Transportation (TxDOT) or the Federal
Highway Administration (FHWA). The United States Government and the State of Texas do not
endorse products or manufacturers. Trade or manufacturers’ names appear herein solely because
they are considered essential to the object of this report. This report does not constitute a
standard, specification, or regulation. The engineer in charge was Tom Scullion, P.E.
(Texas, # 62683).

vi
ACKNOWLEDGMENTS
This project was made possible by funding from the Texas Department of Transportation
and the Federal Highway Administration. Special thanks must be extended to Caroline Herrera,
P.E. for serving as the project director and to Mike Arellano, P.E., of the Austin District for
providing direction and critical input on the topic of flexible base specifications and
performance. Many district personnel assisted, including: Richard Williammee and Andrew
Wimsatt, P.E., Fort Worth District; Miles Garrison, P.E., from the Atlanta District, and Bill
Williford, P.E., from the Tyler District. George Barbu of TTI conducted the rutting investigation
of the bases used in the Riverside sections and Lee Gustavus supervised most of the laboratory
testing.

vii
TABLE OF CONTENTS
Page List of Figures ................................................................................................................................ ix
List of Tables ................................................................................................................................ xii
Chapter 1. Introduction ...................................................................................................................1
Chapter 2. Mineralogical Evaluation of Texas Base Materials ......................................................5
Study of Four Texas Base Materials....................................................................................6
Central Texas Limestone XRD Results ...............................................................................9
Oklahoma Sandstone XRD Results ...................................................................................11
Pharr Caliche XRD Results ...............................................................................................13
Arkansas Granite XRD Results .........................................................................................15
Discussion..........................................................................................................................17
Conclusions/Recommendations.........................................................................................19
Chapter 3. Advanced Laboratory Test Procedures for Characterizing the Engineering Properties of Texas Base Material .....................................................................................21
Tube Suction Test ..............................................................................................................21
Seismic Modulus Test Protocols........................................................................................24
Chapter 4. Forensic Investigations................................................................................................31
Case Study 1 Failure on State Highway (SH 6).................................................................31
Case Study 2 Rapid Failure of Detour on IH 35 Base .......................................................35
Test Results........................................................................................................................39
Summary ............................................................................................................................40
Chapter 5. Field Performance of Heavy-Duty Base Sections.......................................................43
FM-1810 Test Sections in Fort Worth District .................................................................43
SH 31 Tyler District...........................................................................................................50
US 287 Bryan District........................................................................................................55
Riverside Test Sections......................................................................................................60
Chapter 6. Recommended Changes to Texas Laboratory Sample Preparation Procedures .........71
Introduction........................................................................................................................71
Problems with Tex-113-E Compaction .............................................................................73

viii
TABLE OF CONTENTS (Continued)
Page Proposed New Vibration Laboratory Compaction ............................................................75
Comparison of Results between 113-E and Vibratory ......................................................75
Recommendations..............................................................................................................77
Chapter 7. Construction Issues with Heavy-Duty Bases ..............................................................79
Summary ............................................................................................................................81
Chapter 8. Conclusions and Recommendations............................................................................83
References......................................................................................................................................85
Appendix A. Sample Preparation and Test Procedures for Mineralogical Testing.......................87
Appendix B. Item 245 Aggregate Base .......................................................................................105

ix
LIST OF FIGURES
Figure Page 1. Visual Appearance of Existing Item 247 (left) and Item 245 Bases....................................3
2. XRD of the Silt Fraction of the Central Texas Limestone...................................................9
3. XRD of the Coarse Clay Fraction of the Central Texas Limestone Sample.
M/S = Mica/Smectite Interstratified Mineral.....................................................................10
4. XRD of Fine Clay Fraction of the Central Texas Limestone Sample ...............................11
5. XRD of Oklahoma Silt Fraction. M = Mica, F = Feldspar, K = Kaolinite.......................11
6. XRD Pattern of Oklahoma Sandstone Coarse Clay Fraction ............................................12
7. XRD Pattern of Oklahoma Sandstone Fine Clay Fraction ................................................13
8. XRD Pattern of the Pharr Caliche Silt Fraction.................................................................13
9. XRD of Coarse Clay Fraction of the Pharr Caliche Sample..............................................14
10. XRD of the Fine Clay Fraction of the Pharr Caliche Sample............................................15
11. XRD of Silt Fraction from Arkansas Granite ....................................................................16
12. XRD of Coarse Clay Fraction from Arkansas Granite ......................................................16
13. XRD Patterns of Fine Clay Fraction of Arkansas Granite.................................................17
14. Percometer Used for TST ..................................................................................................22
15. Free-Free Resonant Column Device and Testing ..............................................................25
16. Typical Load Cell and Accelerometer Response...............................................................25
17. Typical Transfer Function..................................................................................................26
18. Unconfined Resilient Modulus vs. Seismic Modulus........................................................27
19. Schematic of Protocol for Moisture Susceptibility with FFRC Device.............................28
20. Variations in Modulus and Moisture Content with Time ..................................................29
21. Initial Distress Shown on SH 6..........................................................................................32
22. Rapid Deterioration to Structural Failure ..........................................................................32
23. TST Results from the Base on SH 6 ..................................................................................33
24. MODULUS 6 Structural Evaluation of SH 6 ....................................................................34
25. Base Dielectric Data from IH 35 .......................................................................................35
26. Trench in Failed Area of IH 35 (Chen, 2004)....................................................................36
27. Poorly Compacted Core from the IH 35 Detour Failure....................................................37

x
LIST OF FIGURES (Continued)
Figure Page 28. TST Results on Material from IH 35 Detour Failure.........................................................37
29. Setup for Deformation and Resilient Modulus Test ..........................................................38
30. Comparison of Permanent Strain with Varying Moisture Content....................................41
31. Construction of the Large Stone Base on FM-1810 ..........................................................46
32. Surface Condition of FM-1810 Test Section July 2005 ....................................................47
33. GPR Images from Cracked Section of FM-1810...............................................................49
34. Base Layer Moduli of FM-1810 from 1999 to 2006 .........................................................50
35. Arkansas Granite Base Being Placed on SH 31.................................................................51
36. Compaction Sequence on SH 31........................................................................................52
37. Close-Up of Arkansas Granite Base on SH 31 ..................................................................53
38. FWD Results from Arkansas Granite Base on SH 31 .......................................................54
39. US 287 Heavy-Duty Base Section.....................................................................................55
40. GPR Data from Oklahoma Granite Base Section on SH 287, Bryan District ...................58
41. FWD Data from SH 287 ....................................................................................................59
42. Layout of Base Experimental Sections at TTI’s Riverside Campus..................................60
43. Subgrade Just Prior to Base Placement..............................................................................62
44. Completed Base Section at TTI’s Riverside Campus........................................................63
45. Segregation in the Sandstone Section ................................................................................63
46. GPR Data from Riverside Test Sections............................................................................64
47. FWD Data from Riverside Test Sections...........................................................................65
48. Flatbed Truck for Rut Determinations...............................................................................66
49. Rut Determination on Test Sections ..................................................................................67
50. Trench Profiles from Failed Sections ................................................................................69
51. Handling Compacted (Item 247) Bases .............................................................................71
52. Comparing Item 245 and 247 Bases ..................................................................................72
53. Extruding Item 245 Bases Directly into Membranes.........................................................72
54. Failed New York Base in Resilient Modulus Test (Kancherla, unpublished data) ...........74

xi
LIST OF FIGURES (Continued)
Figure Page 55. TTI’s Prototype Vibratory Laboratory Compactor............................................................75
56. Pilot Results Comparing Vibratory to Tex-113-E Laboratory Compaction......................76
57. Base Paver Operations in the Waco District......................................................................79
58. Completed Section.............................................................................................................80
A1. Typical 1 X 2 Inch and 2 X 3 Inch Thin Sections .............................................................88
A2. Petrographic Microscope Used to Analyze Thin Sections ................................................88
A3. Caliche Sample in Water Bath for Carbonate Removal ....................................................89
A4. Removal of Organic Matter Often Results in a Violent Reaction .....................................90
A5. Centrifuge Used to Aggregate the Sample Prior to Decanting Supernatant ......................92
A6. Ring Stand, Funnel, and Sieve Assembly Used for Sand Fractionation............................93
A7. IEC Centra GP8R Centrifuge Used to Separate Silt and Clay Fractions...........................94
A8. Oven Set for 60 ºC for Drying Sand, Silt, and Coarse Clay Fractions ..............................94
A9. Fine Clay (Tan) Concentrated at Bottom of Beaker So Supernatant Can Be Removed....95
A10. Fine Clay Placed in Dialysis Tubing to Remove Salt by Osmosis ....................................96
A11. Freeze Dryer Used to Remove Water from the Fine Clay Fraction of Samples................97
A12. Clay-Water Suspension Being Placed in Freeze Dryer Flask............................................97
A13. Freezing Clay-Water Suspension Using Liquid Nitrogen .................................................98
A14. Rotation of Freezing Suspension to Achieve Inverted Cone Shape ..................................98
A15. White Coating of Ice on the Flask, Indicative of a Successful Freezing Job.....................99
A16. Aluminum Oxide (left) and Agate Mortars and Pestles for Sand Reduction ..................100
A17. Aluminum Holders Used for Side Loading Sand and Silt into X-Ray Unit....................100
A18. Centrifuge Tubes (40 mL) with Mg2+ and K+ Saturated 2 to 4 mL Aliquots ..................101
A19. Adding K+ Saturated Clay Suspension to Vycor Slide....................................................102
A20. Magnesium (left) and Potassium (right) Saturated Samples Drying ...............................103

xii
LIST OF TABLES
Table Page 1. Proposed Materials Properties for Heavy-Duty Flexible Bases
(Item 245) (TxDOT, 2004) ..................................................................................................2
2. Data for Minus 200 Sieve Fraction of the Limestone and Sandstone..................................6
3. Data for Minus 200 Sieve Fraction of the Caliche and Granite...........................................6
4. Cation Exchange Capacities of Selected Clay Samples ......................................................7
5. Proposed Material Classification Based on TST ...............................................................23
6. Moduli Results from IH 35 Base at Different Moisture Contents .....................................39
7. Positions and Pavements Structures of FM-1810 Test Sections........................................43
8. Base Material Properties for Test Sections on FM-1810
(Williammee and Thomas, 2000) ......................................................................................45
9. Base Dielectric Constants and Layer Thicknesses for FM-1810
(Hefer and Scullion, 2002).................................................................................................48
10. Laboratory Test Results from Arkansas Granite SH 31 ....................................................51
11. Standard Test Results for the Oklahoma Granite Base Materials......................................56
12. Base Densities Measured with Different Techniques........................................................57
13. Laboratory Results from Bases Used in Field Test Sections.............................................61
14. Rut Determinations (in) for Clay Site after 30 Passes .......................................................68
15. Subgrade Moisture Contents for Three Tests ....................................................................69
16. Gradation of New York Base (Kancherla, unpublished data) ...........................................74
17. Laboratory Resilient Modulus Results (Kancherla, unpublished data) .............................74
B1. Material Requirements.....................................................................................................106

1
CHAPTER 1
INTRODUCTION
Thick granular bases are the main structural component of most flexible pavements in
Texas. TxDOT has a long history of very successful performance with these bases in most areas
of the state. TxDOT currently constructs these bases using the Item 247 specification of the
2004 specifications book. However, in recent years problems have been reported with Item 247
bases on several projects. It is generally acknowledged that the Texas bases, which are typically
crushed limestone, caliche, or crushed gravel, perform very well as long as they are kept dry.
But performance problems have been encountered primarily in East Texas, when moisture is
allowed to enter the base.
Project 0-4358 was initiated to evaluate the current specifications and construction
practices for flexible bases in Texas. Hefer and Scullion (2002) conducted a survey of base
specifications and construction practices in the first report in the Project 0-4358 series. They
discovered several items, including:
TxDOT is the only agency that does not control the amount of fines (minus 200) in its
bases; most other state Departments of Transportation (DOTs) have an upper limit of 10
percent, whereas with Texas bases it is common to have fines contents in excess of 20
percent.
In-house studies (Williammee and Thomas, 2000) found large variations in fines in bases
from a single supplier. Variations from 18 to 28 percent were found from a single source.
These variations had major impacts on laboratory strength values.
Many states set maximum plasticity index (PI) values of 6 for their bases, whereas
TxDOT permits values of 10 for Class 1 and higher for Classes 2 and 3.
To minimize segregation problems many DOTs use base pavers to place granular
materials for their major highway projects.
Several forensic studies in recent years have specified the primary cause of structural
failure to be saturated base.

2
In ongoing efforts to improve base performance and specifications, earlier TxDOT
research studies have developed new test procedures for measuring the quality of flexible bases.
These new test procedures include the Tube Suction Test (TST) for measuring base moisture
susceptibility, which has been approved as Test Method Tex-144-E, and the Free-Free resonant
column (FFRC) for measuring base stiffness is under review by TxDOT as Test Method Tex-
148-E (Draft procedure). The status of these new tests is described in Chapter 3 of this report.
Both methods show potential for inclusion in future material specifications.
At the onset of this study a draft material specification was proposed by TxDOT’s
Construction Division (TxDOT, personal communication, 2004). One key feature of this
specification is the improved materials requirements shown in Table 1 below. Table 1 compares
the existing Item 247 specification with TxDOT’s proposed Item 245 requirement.
Table 1. Proposed Material Properties for Heavy-Duty Flexible Bases (Item 245) (TxDOT, 2004).
Material Characteristic Item 245 Item 247 (Class 1)
Passing No. 200 sieve (-200)
5 - 10% <30%
Liquid Limit (LL) <25% <35%
Plasticity Index (PI) <8% <10%
Wet Ball % (max)
<30% <40
% inc Passing # 40
<15 <20
Tube Suction Test Tex 144-E
<10 None
It is important to note that the proposed heavy-duty bases (Item 245) are not no-fines
bases. There is considerable resistance from Texas contractors and aggregate suppliers,
primarily based on their experiences with zero-fines bases (0 percent passing the No. 200 sieve),
as specified for runway application. In contrast to current Texas bases, no-fines bases are very
difficult to place without segregation, hard to compact, problematic when trying to achieve a
smooth finish, and troublesome to drive on during construction without “shelling out.” Work

3
reported in earlier Project Reports 0-4358 (0-4358-2 and 0-4358-3) concluded that fines contents
below 5 percent were not recommended, because of handling and testing concerns.
Consequently for TxDOT heavy-duty bases the amount passing the 200 sieve was recommended
to be between 5 and 10 percent. This is consistent with the practices in other DOTs as reported
by Hefer and Scullion (2002).
During the course of this project several bases matching the Item 245 requirements were
placed in Texas with minimal construction problems. The difference in surface finish is shown
in Figure 1.
Figure 1. Visual Appearance of Existing Item 247 (left) and Item 245 Bases.
Figure 1 shows the current Texas bases on the left and lower fines bases on the right.
The fines in the Texas bases are often brought to the surface during the watering and compaction
process. The current bases are relatively easy to compact to a smooth finish. This is important,
as in many areas the final surface is a surface treatment. In contrast, the Item 245 bases are more

4
open and have a coarser surface finish. Construction and performance issues of bases such as
those shown in Figure 1 will be described in the remainder of this report.
In terms of moisture susceptibility of Texas bases as measured in the TST, it is known
from earlier studies (Scullion and Saarenketo, 1997) that the amount of fines is important in
controlling moisture access. However, a much more critical item is the type of fines and that the
presence of even small amounts of clay have a marked effect on both laboratory results and field
performance of bases. Chapter 2 reports on an investigation conducted into the type of fines
present in typical Texas bases. The four bases shown in Figure 1 were analyzed to determine
their chemical components. This investigation was directed by Dr. Pat Harris of Texas
Transportation Institute (TTI), with the assistance of Ms. Jore von Holdt. The sample
preparation techniques are described in Appendix A, and the detailed laboratory results are
presented in Chapter 2.
Chapter 3 describes the new laboratory test procedures, the TST and FFRC along with
their current status. Chapter 4 describes performance problems documented with existing bases.
Case studies from forensic studies conducted during the course of this project are presented
where water entering the base was a major factor in structural failure. Chapter 5 gives a
summary of the construction techniques and performance history of sections constructed with
Item 245 materials specifications as shown in Table 1. Chapter 6 discusses issues relating to
laboratory testing of the new bases. The lower fines contents make the bases more difficult to
compact and handle in the laboratory. Toward the end of this project new base placement
techniques became available in Texas. Researchers visited the operation to document procedures
and collect limited uniformity data. The use of base pavers in Texas is described in Chapter 7.
A draft Item 245 specification is presented in Appendix B. This is modeled after the
specification prepared by TxDOT (personal communication, 2004). Modifications were
suggested by several TxDOT laboratory engineers as well as the authors of this report.

5
CHAPTER 2
MINERALOGICAL EVALUATION OF TEXAS BASE MATERIALS
One of the early findings from research conducted at the Texas Transportation Institute is
that bases used in Texas are often moisture susceptible (Scullion and Saarenketo, 1997; Guthrie
et al., 2002). Chapter 5 provides examples of failures associated with moisture-susceptible
bases. Texas bases typically perform well in dry conditions, but a dramatic loss of strength can
occur if moisture enters the base. In the laboratory these typical bases perform poorly in the TST
(Tex Method 144-E), which is described in Chapter 3 of this report. Performance in this test is
related to both the amount of fines in the base and type of fines in the base.
As part of Project 4358 an investigation was undertaken to perform a chemical analysis
of two Texas bases and compare them with two low-fines bases that pass the TST. The goal of
this project was to attempt to identify why the Texas bases perform poorly in moisture
susceptibility tests. The bases selected for this project are those shown in Figure 1, namely, an
Arkansas Granite, an Oklahoma Sandstone, a Central Texas Limestone, and a Caliche from Pharr
in South Texas. The dielectric values of these bases at the end of the TST are 5.5, 10.5, 18.3,
and 25.8, respectively. From earlier studies, criteria for the TST were set so that values below 10
represent top-quality materials, that are non-moisture susceptible, whereas values higher than 16
are classified as unacceptable. Both Texas bases are classified as highly moisture susceptible.
Performing a comprehensive chemical/mineralogical analysis is complex. The tools used
to do the chemical analysis are relatively well known, being primarily scanning electron
microscopy (SEM) and X-ray diffraction (XRD); however, what is not known is how to prepare
samples of each base prior to subjecting them to these tests. The preparation techniques are
complex and are described in detail in Appendix A. The main goal of the investigation described
in this chapter was to identify each mineral in these bases and then to focus on the quantity and
quality of the clay fraction (coarse and fine) of these bases, as it is assumed that this fraction
controls the bases affinity for moisture and performance in the TST.

6
STUDY OF FOUR TEXAS BASE MATERIALS
Earlier studies have found that it is both the type and content of fines which control their
moisture susceptibility, so in this study the focus was on the material passing the Number 200
sieve. Tables 2 and 3 show the results of the chemical pretreatments and sieve analysis of the
fines on the four bases used in this project. The bulk sieve analysis of the entire base found that
the Central Texas Limestone had 18.3 percent minus 200 material, the sandstone 10.6 percent,
caliche 20.9 percent, and the granite 7.2 percent. The percent insoluble material insoluble in
acetic acid is a good indicator of carbonates. The acetic acid dissolves carbonates so the percent
removed is a good estimate of the percent carbonates. The Central Texas Limestone sample is
almost entirely limestone (90 percent removed), and the Pharr Caliche was found to contain
around 50 percent limestone. In contrast, the other material had very low limestone contents and
the Oklahoma Sandstone (0.7 percent) and Arkansas Granite (3.9 percent) samples contain very
little if any carbonates. There was a 3.9 percent loss in the Arkansas Granite sample due to the
hydrogen peroxide treatment removing pyrite.
Table 2. Data for Minus 200 Sieve Fraction of the Limestone and Sandstone.
Sample Central Texas Limestone Oklahoma Sandstone Type Dolomitic Limestone Quartz Sandstone % Insoluble* 9.74 99.32 Size Fraction % of Total % of Insoluble % of Total % of Insoluble Sand** 0.14 1.41 7.28 7.33 Silt** 2.58 26.46 81.44 82.00 Coarse Clay** 0.85 8.69 7.57 7.62 Fine Clay** 6.31 64.85 3.05 3.05
Table 3. Data for Minus 200 Sieve Fraction of the Caliche and Granite.
Sample Pharr Caliche Arkansas Granite Type Quartzitic Limestone Nepheline Syenite % Insoluble* 50.8 96.1 Size Fraction % of Total % of Insoluble % of Total % of Insoluble Sand** 18.88 37.2 23.74 24.7 Silt** 16.11 31.7 64.53 67.2 Coarse Clay** 4.69 9.2 7.04 7.3 Fine Clay** 11.10 21.9 0.78 0.8 * Sample not dissolved by pH 5 Na acetate (noncarbonate fraction). ** Sand 2000 – 50 μm; Silt 50 – 2 μm; Coarse clay 2 – 0.2 μm; and
Fine clay < 0.2 μm.

7
As shown in Tables 2 and 3 the primary difference in these samples is the concentration
of fine clay in the -200 fraction. The Central Texas Limestone sample contains 6.31% fine clay,
Oklahoma Sandstone contains 3.05% fine clay, Pharr Caliche contains 11.1% fine clay, and
Arkansas Granite contains 0.8% fine clay. As a percentage of the total base, this translates to
1.08%, 0.32%, 2.31%, and 0.06%, respectively. For the caliche a total of 2.31% of the bulk
sample is fine clay. The fine clay fraction is significant because an equivalent weight of fine
clay has a surface area that is 10,000 times that of sand particles. As a result, the fine clay, due
to surface tension between water and the particles, will hold much more water even if the
mineralogy is equivalent. In the remainder of this chapter the components of the -200 fraction
will be identified.
Cation Exchange Capacity (CEC)
The cation exchange capacity was measured on the coarse and fine clay fractions of the
Oklahoma Sandstone and the Central Texas Limestone samples (Table 4). CEC is a measure of
the exchangeable cations in a soil sample. A larger number represents more exchangeable
cations which are characteristic of swelling clays like smectite. The samples were saturated with
calcium followed by replacement with magnesium. The calcium (Ca) released by magnesium
(Mg) saturation was determined by atomic adsorption spectroscopy. All samples were run in
triplicate.
Table 4. Cation Exchange Capacities of Selected Clay Samples.
Sample Fraction CEC (cmol/kg) Coarse clay 33.4 Central Texas Limestone Fine clay 74.4 Coarse clay 29.5 Oklahoma Sandstone Fine clay 53.2
The cation exchange capacities for the Central Texas Limestone fractions were higher than the
values for the Oklahoma Sandstone sample. The difference was very small for the coarse clay
fractions but was significant for the fine clay fractions. The relatively high cation exchange
capacities suggest the presence of swelling clays in both samples. This presence of swelling
clays will be investigated in the remainder of this chapter.

8
X-Ray Diffraction
To determine if the composition of the minus 200 fraction varies for different base
courses, a technique called X-ray diffraction is used. XRD simply measures the atomic spacing
in mineral grains using X-rays. X-rays are electromagnetic waves whose wavelengths are in the
0.1 to 10 Å range (1 Å = 10-10 m); the small size makes X-rays ideal to measure the atomic
spacing of minerals. Each mineral generates a unique pattern (like fingerprints), so if two
samples that look identical are composed of different minerals, then a different X-ray pattern
would emerge for the samples.
For example, the X-rays hit the sample (minus 200 fraction) as it rotates in a circular arc
through degrees theta. A detector measures the intensity of the X-rays that are diffracted from
the sample as it rotates along this same arc at degrees 2-theta (2θ). When the detector measures a
large number of counts from the X-rays it sends a signal to a computer, which generates a plot
like the one shown in Figure 2. Degrees 2-theta through which the detector rotates, are
represented on the x-axis, and the X-ray counts measured by the detector are marked as counts
per second on the y-axis. The size and location of each of the peaks generated are unique for
each mineral, so the peaks can be used to identify what minerals are present in the sample.
Interpretation of the X-ray patterns is performed by an expert; Dr. Pat Harris of TTI conducted
this study.
The mineralogy of the different size fractions in the -200 sample for each base was
determined by powder X-ray diffraction. Sample preparation is described in Appendix A. The
sands and silts were examined as random powders in the 2º to 65º 2θ range. The clay fractions
were first saturated with potassium (K) or magnesium (Mg) by washing with 1 N solutions of the
salts followed by centrifugation. The excess salts were removed by centrifuge washing with
distilled water. After saturation, the clay was sedimented onto a glass slide if the sample was
Mg-saturated or a Vycor slide if K-saturated. These oriented samples were allowed to dry at
room temperature and then examined by X-ray diffraction in the 2º to 32º 2θ range. This range
was chosen because it is the minimum range required to identify most minerals in sediments.
After the first X-ray diffraction pattern, the Mg-saturated slides were equilibrated with ethylene
glycol or glycerol and reexamined in the 2º to 16º 2θ range to detect the presence of swelling
phyllosilicates, which have peak shifts in this region. The K-saturated slides were reexamined in

9
the 2º to 16º 2θ range after heating to 300 and 550 ºC to observe the collapse and structural
changes resulting from heating as a further aid in interpretation of the phyllosilicate fraction.
CENTRAL TEXAS LIMESTONE XRD RESULTS
For each material the silt and fine clay fractions were analyzed. The silt fraction of the
Central Texas Limestone sample was dominated by quartz (Q). A very small amount of
kaolinite (K), mica (M), either smectite or chlorite (S or C), and feldspar (F) were also detected,
but at insignificant quantities compared to the quartz (Figure 2). The kaolinite may either be the
result of kaolinite formation within the limestone, which is relatively common in Texas
limestones, or it may be from a poorly dispersed aggregate. The second possibility is more likely
since kaolinite formed within the limestone is extremely well crystallized and would have very
sharp XRD peaks, which is not true of this sample.
Figure 2. XRD of the Silt Fraction of the Central Texas Limestone.
The coarse clay fraction of the Central Texas Limestone sample (Figure 3) contains
kaolinite (K), quartz (Q), goethite, mica (M), and a lesser concentration of a mica/smectite (M/S)
interstratified mineral (a mineral intermediate between mica and smectite that swells less than
smectite).
0
1000
2000
3000
4000
5000
6000
0 5 10 15 20 25 30 35 40 45 50 55 60 65
Degrees 2-theta
Cou
nts
per S
econ
d
M
SorC
KF
F
F
F
x20

10
Figure 3. XRD of the Coarse Clay Fraction of the Central Texas Limestone Sample. M/S = Mica/Smectite Interstratified Mineral.
The Central Texas Limestone fine clay fraction is dominantly smectite, with kaolinite,
mica, and goethite (Figure 4). The broadness of the smectite peaks is more indicative of a soil-
derived smectite than a geological smectite. The CEC data suggest the fraction is 72 percent
smectite with the remainder divided between mica and kaolinite. The XRD data suggest that the
kaolinite represents 18–25 percent of the fraction.
The mineralogy of the sand, silt, and clay fractions suggests that much of the insoluble
material in the minus 200 sieve fraction of the Central Texas Limestone sample is derived from
soil carried into the limestone by water infiltration into cracks or mixed into the limestone during
the mining operation. The smectite and mica in most limestone have much sharper XRD peaks
than those in soils because soil clays have been subjected to more weathering.
0
100
200
300
400
500
600
700
800
900
1000
0 2 4 6 8 10 12 14 16 18 20 22 24 26 28 30 32
Degrees 2-theta
Cou
nts
per S
econ
d
M
K
M/S
Q
Q
K
Mg, RT
Mg glycerol
K, RT
K, 300CM

11
Figure 4. XRD of Fine Clay Fraction of the Central Texas Limestone Sample.
OKLAHOMA SANDSTONE XRD RESULTS
The Oklahoma silt fraction was dominantly quartz with few impurities. The silt fraction
(Figure 5) contained quartz with some feldspar, kaolinite, and mica.
Figure 5. XRD of Oklahoma Silt Fraction. M = Mica, F = Feldspar, K = Kaolinite.
0
100
200
300
400
500
600
700
0 2 4 6 8 10 12 14 16 18 20 22 24 26 28 30 32
Degrees 2-theta
Cou
nts
per S
econ
d
Mg, RT
Mg,glycerol
K, RT
K, 300C
K
K
MS
M G
0
1000
2000
3000
4000
5000
6000
0 5 10 15 20 25 30 35 40 45 50 55 60 65
Degrees 2-theta
Cou
nts
per S
econ
d
M K F F Fx20

12
The Oklahoma coarse clay fraction (Figure 6) contains chlorite (C), mica (M), quartz (Q),
and kaolinite (K). The presence of kaolinite can be confirmed by the shoulder on the peak near
25º 2θ resulting from the magnification of the difference in d-spacings for the chlorite and
kaolinite peaks. There is also some swelling component (smectite interstratified with mica)
judging from the increasing sharpness of the patterns when glycerol solvated, K-saturated, or
heated and the cation exchange capacity data. Notice the sharpness of the kaolinite XRD peaks
(K) compared to those in the Central Texas Limestone sample, suggesting formation within the
rock.
Figure 6. XRD Pattern of Oklahoma Sandstone Coarse Clay Fraction.
Figure 7 shows the Oklahoma Sandstone fine clay fraction which contains chlorite (C),
mica (M), goethite (G), and kaolinite (K). The presence of kaolinite can be confirmed by the
splitting of the peak near 25º 2θ resulting from the difference in d-spacings for the chlorite and
kaolinite peaks. The sharpening of the mica peak near 9º 2θ, and the shift of the peak in the
glycerol solvated pattern show interstratified mica/smectite or smectite in this fraction. Chlorite
is a common mineral in sedimentary rocks but is uncommon in soils, as it is easily weathered.
The presence of the chlorite suggests that the minus 200 sieve fraction of the Oklahoma
Sandstone sample is ground up rock matrix rather than admixed soil material.
0
500
1000
1500
2000
2500
0 2 4 6 8 10 12 14 16 18 20 22 24 26 28 30 32
Degrees 2-theta
Cou
nts
per S
econ
d
CM
K
M C Q
K
QM
Mg, RT
Mg glycerol
K, RT
K, 300C
K, 550C

13
Figure 7. XRD Pattern of Oklahoma Sandstone Fine Clay Fraction.
PHARR CALICHE XRD RESULTS
The silt fraction from the Pharr Caliche sample is dominated by quartz (Q) with a much
lower concentration of feldspar (F) minerals (Figure 8). Remember that this is the
0
1000
2000
3000
4000
5000
6000
7000
0 5 10 15 20 25 30 35 40 45 50 55 60 65
Degrees 2-theta
Cou
nts
per S
econ
d
Q
Q
Q Q QQ
Q
QF F F
F
Figure 8. XRD Pattern of the Pharr Caliche Silt Fraction.
0
100
200
300
400
500
600
0 2 4 6 8 10 12 14 16 18 20 22 24 26 28 30 32
Degrees 2-theta
Cou
nts
per S
econ
d
C
MK
M C
K M
Mg, RT
Mg glycerol
K, RT
K, 300C
K, 550C
G
14
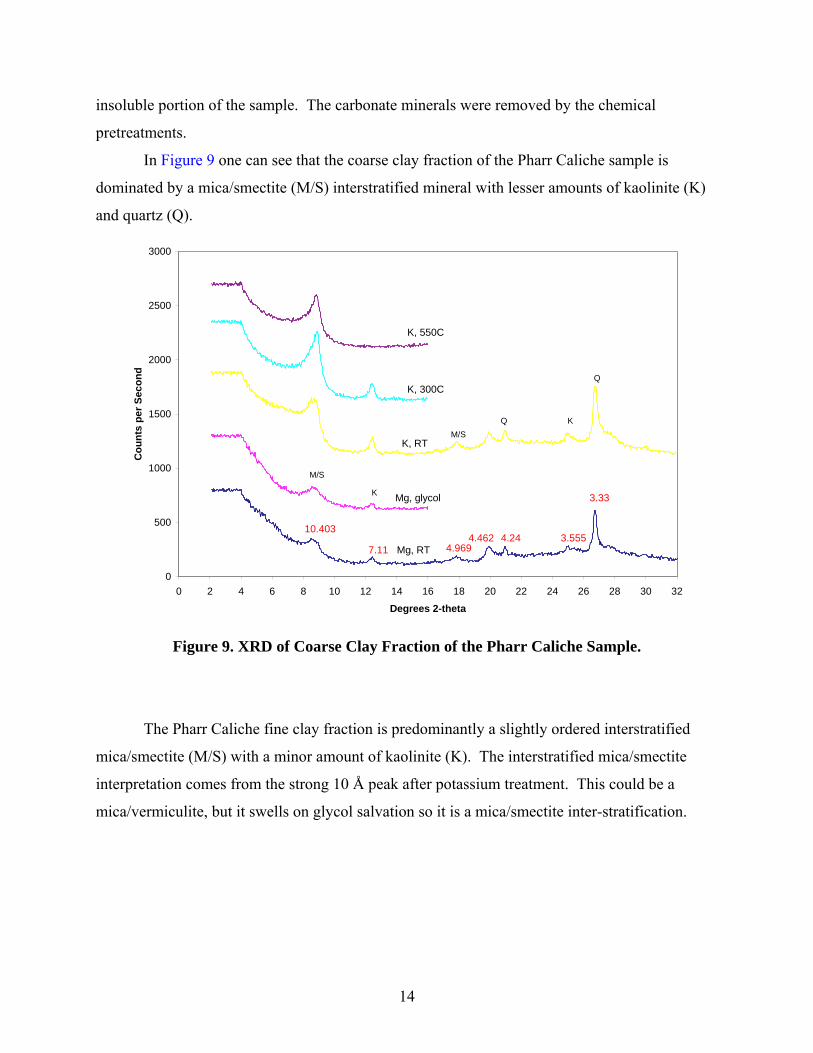
insoluble portion of the sample. The carbonate minerals were removed by the chemical
pretreatments.
In Figure 9 one can see that the coarse clay fraction of the Pharr Caliche sample is
dominated by a mica/smectite (M/S) interstratified mineral with lesser amounts of kaolinite (K)
and quartz (Q).
0
500
1000
1500
2000
2500
3000
0 2 4 6 8 10 12 14 16 18 20 22 24 26 28 30 32
Degrees 2-theta
Cou
nts
per S
econ
d
Mg, RT
Mg, glycol
K, RT
K, 300C
K, 550C
7.11
10.403
4.969
3.33
3.5554.244.462
M/S
K
Q
Q KM/S
Figure 9. XRD of Coarse Clay Fraction of the Pharr Caliche Sample.
The Pharr Caliche fine clay fraction is predominantly a slightly ordered interstratified
mica/smectite (M/S) with a minor amount of kaolinite (K). The interstratified mica/smectite
interpretation comes from the strong 10 Å peak after potassium treatment. This could be a
mica/vermiculite, but it swells on glycol salvation so it is a mica/smectite inter-stratification.

15
0
2000
4000
6000
8000
10000
12000
2 4 6 8 10 12 14 16 18 20 22 24 26 28 30 32
Degrees 2-theta
Cou
nts
per S
econ
d
Mg, RT
Mg, glycolK, RT
K, 300C
K, 550C
20.083
10.223
7.196 4.997 3.5413.302
6.304K
M/S
K
M/S
Figure 10. XRD of the Fine Clay Fraction of the Pharr Caliche Sample.
ARKANSAS GRANITE XRD RESULTS
This sample is an oddball. It does not contain any quartz, which is typically used as an
internal standard for XRD work. The silt-sized material from the minus 200 sieve fraction is
dominated by feldspar (F) minerals with minor accessory minerals like pyroxenes, amphiboles,
and biotite (Figure 11).
The coarse clay fraction (Figure 12) from the Arkansas Granite material is composed
primarily of smectite (S) and iron-rich chlorite (C) with minor mica (M) and feldspar (F)
concentrations (peaks in the 4 Å and 3 Å regions). Kaolinite may also be present, but the 7 Å
chlorite peak masks the kaolinite peak. Infra-red analysis would need to be run to identify the
presence of kaolinite.

16
0
1000
2000
3000
4000
5000
6000
0 5 10 15 20 25 30 35 40 45 50 55 60 65
Degrees 2-theta
Cou
nts
per S
econ
d
F F F
F
F F F F
Figure 11. XRD of Silt Fraction from Arkansas Granite.
0
500
1000
1500
2000
2500
3000
0 2 4 6 8 10 12 14 16 18 20 22 24 26 28 30 32
Degrees 2-theta
Cou
nts
per S
econ
d
K, RT
Mg, glycol
Mg, RT
K, 300C
K, 550C
7.05
3
4.73
3
3.76
2 3.54
1
15.3
70
3.23
23.
187
8.46
6
14.4
89
16.9
95 12.4
5113
.598
9.99
2
3.33
3
13.5
98
4.01
3
4.21
1
S
C
M
F
F
F
Figure 12. XRD of Coarse Clay Fraction from Arkansas Granite.

17
Figure 13 presents the XRD patterns of the fine clay fraction of the Arkansas Granite
sample. The primary difference between the coarse and fine clay fractions is the absence of
feldspar minerals in the fine clay. Only two clay minerals can be identified in this size fraction:
smectite (S) and high-iron chlorite (C).
0
1000
2000
3000
4000
5000
6000
7000
8000
2 4 6 8 10 12 14 16 18 20 22 24 26 28 30 32
Degrees 2-theta
Cou
nts
per S
econ
d
Mg, RT
Mg, glycol
K, RT
K, 300C
K, 550C
15.2
38
7.053 3.541 3.1815.17
17.1
6
8.506 7.110
12.4
51
13.393
S
C
Figure 13. XRD Patterns of Fine Clay Fraction of Arkansas Granite.
DISCUSSION
Following is a discussion of the detailed mineralogical analyses made on the minus 200
fraction of these four base materials. It must be remembered that the percent clay is based on the
minus 200 sieve fraction, and the clay content as a percentage of the total base is much lower.
Central Texas Limestone
The high content of fine clay (6.3%) in the Central Texas Limestone bulk sample and the
dominance of smectite in the XRD pattern for the fraction suggest that these may have been the
factors contributing to poor performance in the Tube Suction Test.

18
The XRD patterns are broad, indicating poor crystallinity and small particle size for the
clay fractions. These clay patterns appear more similar to those of soil clays than to those
observed in sedimentary rocks, suggesting that much of the material may have derived from the
overlying soil, possibly filtering down fissures into the limestone or mixed during the mining
process. If this is correct, it may be possible to remove this material by washing with water. The
clay fraction suggests a relatively high shrink-swell capacity. The smectite content could readily
hydrate with any addition of water and would be very slow to dry at normal relative humidity.
Oklahoma Sandstone
This sample is very low in carbonates based on the content remaining after the chemical
pretreatments to remove carbonates and organics. The low content of carbonates and good
hardness suggest that this material is silica cemented, ideal for almost all aggregate uses.
Petrographic analysis of the coarse aggregates from this sample confirms that this aggregate is
pervasively silica cemented.
The sand and silt fractions are quartz. The XRD patterns for the clay fractions suggest
that the rock was formed at relatively high temperatures and is only slightly weathered. Note
how the peaks for the Oklahoma sandstone are much sharper, indicating well-crystallized clay
minerals. The minerals in the clay fraction have a relatively low shrink-swell capacity, but over
very long periods of time (hundreds of years at normal surface conditions) may weather resulting
in a moderate shrink-swell capacity.
Pharr Caliche
This sample contains an extremely large amount of clay repetitive (15.8 percent). The
unique thing about this caliche sample is that both the coarse and fine clay fractions are
composed of essentially the same minerals. The interstratified mica/smectite is a swelling clay,
as evidenced by the expansion of the 20 Å peak on glycol solvation. This means that the
mica/smectite minerals in this aggregate are moisture susceptible and there are a large percentage
of these minerals in the fines. The broad peak at 20 Å indicates poor crystallinity and a fine
grain size, which combine to make the fines in this base material moisture susceptible.

19
Arkansas Granite
The mineralogy of the fines from this sample is indicative of the igneous rocks from
which this sample was derived. The silt fraction is predominately feldspar minerals, which are
less stable than quartz but are still very stable during a human lifetime. Ferromagnesian minerals
present in this sample readily weather to chlorite and other clay minerals. The coarse and fine
clay fractions have sharp peaks indicating that the clays are derived from weathering of unstable
minerals in the nepheline syenite and are not of pedogenic origin. Again, we mention that
crystallinity is important in gauging the reactivity of clay minerals. The more crystalline a clay
mineral is, the less chemically reactive it will be.
Two factors contribute to the fines in this sample not making this aggregate moisture
susceptible: (1) the amount of fine clay is low (0.8 percent), and (2) the fine clay contains
smectite (a moisture susceptible mineral) that is of high crystallinity.
CONCLUSIONS/RECOMMENDATIONS
Based on the results of the detailed mineralogical analysis for these four base course
aggregates, several issues stand out.
(1) The good performing base materials from Oklahoma Sandstone and Arkansas Granite
have a lower percentage of fine clay at 3 percent and 0.8 percent, relative to the moisture
susceptible base materials. The limestone from Central Texas Limestone and the caliche from
Pharr have fine clay percentages of 6.3 percent and 11 percent, respectively. In addition to the
amount of fine clay the fine clay composition is dominated by the highly expansive mineral
smectite. This fine clay fraction is significant because an equivalent weight of fine clay has a
surface area that is 10,000 times that of sand particles. As a result, the fine clay, due to surface
tension between water and the particles, holds much more water even if the mineralogy is
equivalent.
(2) The fine clay in the Central Texas Limestone sample appears to be introduced as part of
the mining operation, possibly mixing overburden material during blasting. This could
potentially infer that this material could be variable as the amount of overburden introduced will
depend on the status of the mining operation.
(3) The crystalline nature of the fine clay fraction. What is meant by crystalline is a regular
arrangement of atoms in a space lattice. Minerals with low crystallinity do not possess the

20
regular arrangement of atoms in the space lattice, which makes that mineral more reactive to
outside influences. The two good base materials contain clay minerals in the fine clay fraction
that are well crystallized, as evidenced by sharp XRD peaks. The base materials that are more
moisture susceptible contain clay minerals in the fine clay fraction that are more poorly
crystallized as evidenced by broad XRD peaks.
Based on these findings, not all fines are created equal. Some base materials with a high
percentage of fines will not be moisture susceptible, while other bases will be highly susceptible
to moisture. It may be difficult to regulate the type of fines in a base, so the best approach may
be to regulate the amount. We recommend regulating the fines content in base materials to
decrease the potential for moisture susceptibility problems.

21
CHAPTER 3
ADVANCED LABORATORY TEST PROCEDURES FOR
CHARACTERIZING THE ENGINEERING PROPERTIES OF TEXAS
BASE MATERIAL
Earlier reports in Project 4358 described the advanced materials testing procedures
available to characterize and model pavements constructed with heavy-duty bases. The resilient
modulus tests and the permanent deformation test were described in Report 4358-3 (Kancheria
and Scullion, 2005). These tests provide materials input parameters for advanced mechanistic-
empirical thickness design programs such as VESYS 5 M (Zhou and Scullion, 2004). However,
these laboratory tests are too complex to be used as specification tests. During earlier studies
two new tests were developed, namely the Tube Suction Test and Free-Free Resonant column,
which have been shown to measure parameters important to eventual pavement performance and
are simple enough to be incorporated into materials acceptance tests. The status of both of these
tests is described in this chapter.
TUBE SUCTION TEST
The TST was developed in a cooperative effort between the Finnish National Road
Administration and TTI for assessing the moisture susceptibility of granular base material
(Scullion and Saarenketo, 1997). Moisture susceptibility represents the potential of a soil to
develop or hold capillary water and produces detrimental or unstable conditions under traffic
load.
The dielectric value is a measure of the unbound water within the soil sample. The
strength of the material and its ability to resist traffic loads and the impact of repeated freeze-
thaw cycling are considered to be directly influenced by the unbound water. The TST reveals the
state of bonding of water within soil particles and should not be considered as a simple measure
of the moisture content (Guthrie et al., 2002).
The equipment used for the TST consists of a percometer equipped with a capacitance-
based dielectric surface probe with a head diameter of 50 mm and a measuring frequency of 50
MHz (Figure 14). The dielectric values are measured at the surface of the sample at specific
time intervals for 10 days.

22
Figure 14. Percometer Used for the TST.
The test is now a standard test conducted by TxDOT (Tex Method 144-E). Recent inter-
laboratory studies (Barbu and Scullion, 2005) found significant impacts of several issues which
effect the final results, namely the permeability of the porous stones on which the samples stand
and the coarseness of surface texture. Recommendations on each are included in the latest test
protocol.
A graph of surface dielectric values versus time is used for moisture susceptibility
analysis. The final dielectric is selected as the asymptotic value from the plot of average surface
dielectric versus time. Table 5 shows a tentative ranking system for bases.
The classification provided in this table is an extension of the previous tables. In the past,
dielectric values in the 10–16 range were labeled marginal; however, this is a broad category in
which many of the Texas bases fit. We recommend that consideration be given to using ranges
of 10–13 and 10–16 to represent good and marginal materials, respectively. Base materials with
final dielectric values greater than 16 will be prone to loss of strength on wetting, have poor rut
resistance, and will be highly susceptible to freeze-thaw damage (Guthrie et al., 2002).

23
Table 5. Proposed Material Classification Based on TST.
Final Dielectric Value Classification
<10 Excellent – no moisture related problems.
10-13 Good – typical of most Texas Class 1 aggregates. Should
perform well except in very cold/wet climates.
13-16 Moderate – some concern about moisture problems.
Consider chemical modification (low levels of cement or
lime) if this is to be used on a high-volume roadway.
16 + Fair-Poor – moisture susceptible, consider for modification
for all applications.
Substantial work was conducted in Project 4358 to evaluate bases with the TST. Report
4358-2 reported that changing the amount of fines in a typical base (Texas Crushed Stone) from
5, 10, and 17 percent would provide dielectric values of 9, 12.7, and 14.2 and corresponding
compressive strength at 15 psi confining of 136.0, 141.2, and 76.3 psi. Similar trends were also
observed in resilient modulus and permanent deformation properties. One conclusion from
Report 4358-2 was that the optimum fines content for this typical limestone base appears to be
between 5 and 10 percent; values lower than 5 percent are difficult to compact and prone to
segregation, and values higher than 10 tend to be more moisture susceptible.
The bases shown in Figure 1, namely Arkansas Granite, Oklahoma Sandstone, Central
Texas Limestone, and Pharr Caliche had final dielectric values at the end of the TST of 5.5, 10.5,
18.3, and 25.8, respectively.
Status of Test Protocol
The TST test procedure has been published as Tex Method 144-E. A dielectric probe has
been purchased for each TxDOT district, and workshops are under way in early 2006 for district
staff. TxDOT’s Construction Division is conducting the training. The TST has reached the
stage of development that it should be considered for incorporation in the Item 245 specification.
24
SEISMIC MODULUS TEST PROTOCOLS
The seismic modulus test was developed by Dr. Nazarian at the University of
Texas at El Paso (UTEP) for measuring the modulus of all types of pavement material. In each
case the seismic modulus value is correlated with traditional resilient modulus procedures. The
seismic modulus with the FFRC device developed in several earlier TxDOT studies is now being
evaluated by TxDOT, and a draft test procedure (Tex-149-E) has been developed. Originally
developed for Portland cement concrete specimens, the method has been adapted for base and
subgrade materials through hardware and software modifications.
In FFRC tests seismic energy propagates over a large range of frequencies when an
impulse load is applied to the specimen. The energy associated with one or more frequencies is
trapped and magnified (resonate), depending on the dimensions and stiffness of the specimen.
The specimen dimensions can easily be measured, and when combined with the resonant
frequencies, the modulus of the specimen can be determined using the principles of wave
propagation in a solid rod.
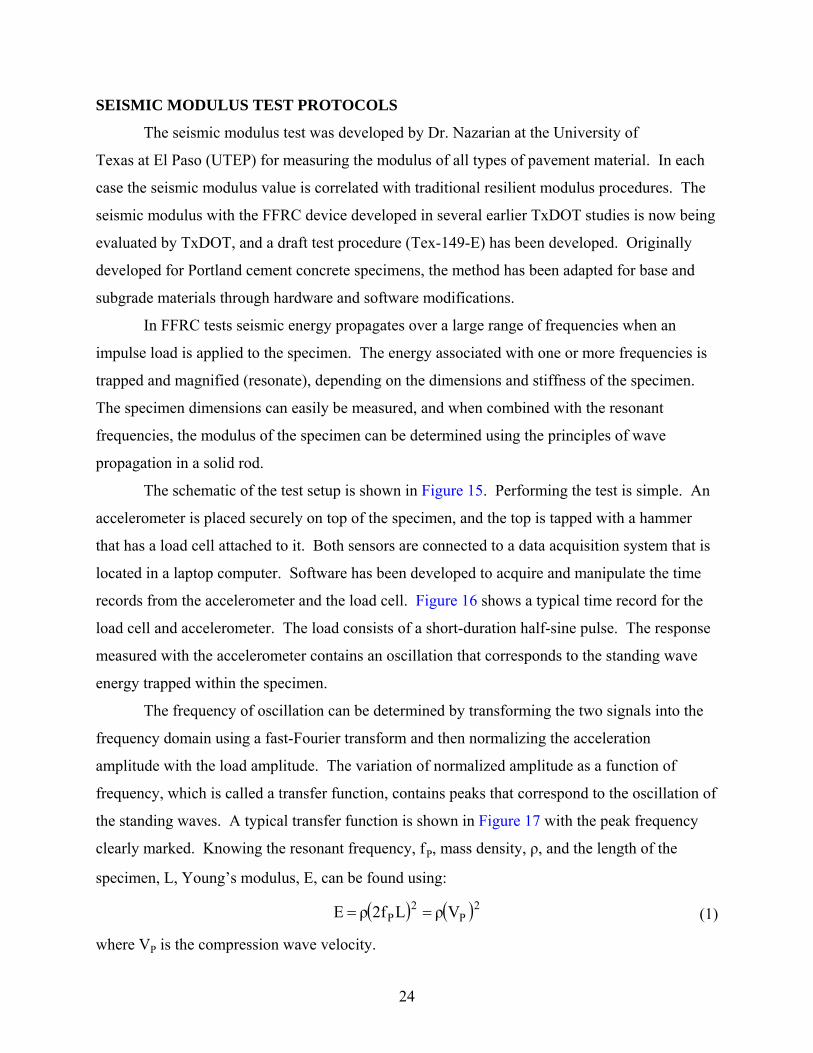
The schematic of the test setup is shown in Figure 15. Performing the test is simple. An
accelerometer is placed securely on top of the specimen, and the top is tapped with a hammer
that has a load cell attached to it. Both sensors are connected to a data acquisition system that is
located in a laptop computer. Software has been developed to acquire and manipulate the time
records from the accelerometer and the load cell. Figure 16 shows a typical time record for the
load cell and accelerometer. The load consists of a short-duration half-sine pulse. The response
measured with the accelerometer contains an oscillation that corresponds to the standing wave
energy trapped within the specimen.
The frequency of oscillation can be determined by transforming the two signals into the
frequency domain using a fast-Fourier transform and then normalizing the acceleration
amplitude with the load amplitude. The variation of normalized amplitude as a function of
frequency, which is called a transfer function, contains peaks that correspond to the oscillation of
the standing waves. A typical transfer function is shown in Figure 17 with the peak frequency
clearly marked. Knowing the resonant frequency, fP, mass density, ρ, and the length of the
specimen, L, Young’s modulus, E, can be found using:
( ) ( )2P2
P VρL2fρE == (1)
where VP is the compression wave velocity.

25
(a)
Testing & Data Acquisition Equipment
(b)
Testing of Specimen
Figure 15. Free-Free Resonant Column Device and Testing.
Figure 16. Typical Load Cell and Accelerometer Response.
0 10 20 30 40 50Time (msec)
Mag
nitu
de
Load Cell
Accelerometer

26
Figure 17. Typical Transfer Function.
The resilient and seismic moduli were also compared to develop a model that relates
these two tests. Since the specimens are not subjected to confinement when the seismic test is
performed, resilient modulus values for the unconfined test were used in this analysis even
though the resilient modulus test was performed at several different confining pressures. The
results from tests on about two dozen soils are shown in Figure 18. The relationship between the
two moduli is more or less linear. As indicated before, the unconfined MR tests were added to
the test protocol for this purpose. This does not impact the generality of the resilient modulus
data since the constitutive model can be used to determine the modulus at any other state of
stress. The ratio of seismic modulus to resilient modulus is approximately two to one with an R2
value of about 0.8. Figure 18 contains data from tests on several different materials and material
types. The correlation can be improved by developing relationships for individual material
types. These methods and other methods can be used to further explore the relationship between
the resilient modulus and the seismic modulus.
0 100 200 300 400 500 600 700 800 900 1000Frequency (Hz)
Am
plitu
de
Longitudinal Resonance (fP)
Shear Resonance (fS)

27
MR = 0.4713 ER2 = 0.7771
0
100
200
300
400
500
600
700
0 100 200 300 400 500 600 700 800 900 1000Seismic Modulus (MPa)
Res
ilien
t Mod
ulus
(MPa
)
Figure 18. Unconfined Resilient Modulus vs. Seismic Modulus.
As part of Project 0-4358, similar to the tube suction test, the moisture susceptibility of
the base material was evaluated by using a series of measurements from the FFRC tests.
Figure 19 illustrates the procedure. After the seismic modulus of a specimen is obtained
on the day of compaction, it is placed in an oven at 40 ºC for four days to allow the specimen to
dry. After the fourth day, the specimen is placed in a water bath to soak moisture through
capillary action for six days. While drying or soaking, the specimen is weighed every 24 hours
to determine the bulk moisture loss or gain, and then is tested with the FFRC device.

28
Figure 19. Schematic of Protocol for Moisture Susceptibility with FFRC Device.
Typical responses from the FFRC and the variations in moisture content over the 10-day
time span are shown for the specimen containing 5 percent fines in Figure 20. During the drying
period, the modulus increases as the moisture content decreases. However, a sudden drop in
modulus occurs after the first day of soaking in the water bath. Within only a few days in the
water bath the base material has absorbed enough water such that the modulus is very close to
the residual modulus of the specimen. The residual modulus is considered the average of the
modulus values during the test that are near-constant, most commonly the last three readings
taken during the moisture susceptibility phase. Nazarian et al. (2003) in Project 0-1735
demonstrated that the ratio of the peak modulus to the residual modulus is the best indicator of
the performance of a base material.
Repeat at 120, 144, 160, ...
240 hours
Compact Specimen
Test Using FFRC
Test Using FFRC
Specimen Placed in Water Bath
Repeat at 48, 56, & 72 hours
96 hours
Specimen Placed in Oven

29
Figure 20. Variations in Modulus and Moisture Content with Time. Status of Test Protocol
The test procedure is currently not an approved TxDOT procedure. It is under review by
TxDOT, and a draft test protocol Tex Method 149-E is available. Five sets of FFRC equipment
have been purchased by TxDOT, and four of these have been distributed to the districts. Several
training schools have been taught by Dr. Nazarian, and a set of training DVDs has been
developed to assist in training and data interpretation.
Recommendations for using both the TST and FFRC have been included in the draft Item
245 specification provided in Appendix B of this report.
0
1
2
3
4
5
6
0 48 96 144 192 240
Time, hrs
Moi
stur
e C
onte
nt, %
0
100
200
300
400
500
Seis
mic
Mod
ulus
, ksi
M oisture Content Seismic M odulus Dry ing Period Soaking Period


31
CHAPTER 4
FORENSIC INVESTIGATIONS
The TxDOT Item 247 bases used in Texas provide a solid foundation for most of the
existing highway network. They perform very well with the proviso that they are kept dry. All
Texas districts understand this principle and most now insist on placing an underseal over these
bases prior to placing the surfacing layer. However, over time moisture enters these bases,
typically from surface cracks. In some instances the water is drawn into the base by capillary
rise and in others water enters from pavement edges.
In the past 10 years several forensic studies have been conducted when the failure of the
base due to moisture ingress led to rapid structural failure. In most cases the base failure is the
secondary issue; moisture ingress is often associated with poor asphalt surface layers. However,
in all cases the failures are rapid and dramatic when the typical bases become wet. Based on
work completed in this study it is proposed that failures would have been much less severe if
higher quality non-moisture susceptible bases had been used.
CASE STUDY 1 FAILURE ON STATE HIGHWAY (SH 6)
The northbound lanes were new construction consisting of 6 inches of lime-stabilized
subgrade, 20 inches of Class 1 flexible base, an underseal, and 2 inches of Hot Mix Asphalt
(HMA) with PG 76-22 binder. The section was only 6 months old when problems started to
occur. The first sign of problems was fine cracking and staining around the cracks as shown in
Figure 21. With subsequent rain events, severe alligator cracking became evident, and rapid
pavement deterioration occurred as shown in Figure 22.
The failure of the newly constructed lanes on SH 6 was attributed to the quality of the
Type C hot mix surface layer, a non-functioning underseal, and a moisture-susceptible base.

32
Figure 21. Initial Distress Shown on SH 6.
Figure 22. Rapid Deterioration to Structural Failure.
The proposed failure mechanism is that initial surface cracks occurred in the wheel paths;
these appear as short transverse cracks which could be either roller cracks or load-associated
shear cracks. Cores of asphalt were recovered from this section and tested in TTI’s research
laboratory. The binder was found to be excessively stiff, and the mix was very brittle; it had all
the appearances of burnt binder. The initial cracks permitted moisture to enter the pavement’s
lower layers. This moisture eventually found a break in the underseal and entered the flexible
base. Laboratory tests found that the base is moisture susceptible and that this is a secondary
factor in the severity of the pavement failures.

33
The TST was run on base material taken from this project. The test measures the
capillary rise of moisture through an 8 inch high sample compacted at optimum moisture content
and dried back for 1 day. The results in Figure 23 show that the final dielectric value after the 10
days capillary rise was on average 14.2. Based on our experience this falls into the marginal
quality category. The implication is that if moisture is available it will be readily drawn into this
base; this moisture will lead to a loss in the load-bearing capacity of the pavement.
Figure 23. TST Results from the Base on SH 6.
Figure 24 shows the structural evaluation results from the Falling Weight Deflectometer
(FWD) testing conducted in the northbound (NB) outside lane. The major performance
problems were found in the last half of the section after 3100 ft. From a structural standpoint the
average base modulus on the entire project is judged as good at 75 ksi. Recall that the FWD
testing was conducted at least one month after any appreciable rainfall. On close inspection of
the results in Figure 24 it is clear that there is a significant increase in overall maximum
deflection in the second half of the section, after 3100 ft. Summarizing the results for before and
after 3100 ft, the average maximum deflection increased from 9.3 mils to 16.3 mils, and the
average base modulus dropped from 92 ksi to 42 ksi. In the forensic report for this project, more
extensive analysis of the FWD data was performed which indicated weakening of the upper part
of the 20 inch flexible base in the section after 3100 ft. This further supports the conclusion of
moisture ingress from the surface weakening the top of the base.

-------------------------------------------------------------------------------------------------------------------------------------- TTI MODULUS ANALYSIS SYSTEM (SUMMARY REPORT) (Version 6.0) -------------------------------------------------------------------------------------------------------------------------------------- District: MODULI RANGE(psi) County : Thickness(in) Minimum Maximum Poisson Ratio Values Highway/Road: Pavement: 2.70 663,400 663,400 H1: v = 0.35 Base: 20.00 10,000 150,000 H2: v = 0.35 Subbase: 8.00 75,000 75,000 H3: v = 0.35 Subgrade: 269.30(by DB) 20,000 H4: v = 0.40 -------------------------------------------------------------------------------------------------------------------------------------- Load Measured Deflection (mils): Calculated Moduli values (ksi): Absolute Dpth to Station (lbs) R1 R2 R3 R4 R5 R6 R7 SURF(E1) BASE(E2) SUBB(E3) SUBG(E4) ERR/Sens Bedrock -------------------------------------------------------------------------------------------------------------------------------------- 0.000 9,728 12.14 5.22 3.19 2.37 1.82 1.43 1.21 663.4 62.5 75.0 26.3 2.08 300.0 200.000 9,875 10.09 3.29 2.08 1.81 1.44 1.09 0.97 663.4 84.9 75.0 40.2 12.19 300.0 400.000 9,819 9.57 4.57 2.88 2.18 1.65 1.32 1.04 663.4 89.2 75.0 28.3 1.44 300.0 600.000 9,744 11.57 4.31 2.58 2.22 1.84 1.43 1.26 663.4 70.1 75.0 29.7 9.72 300.0 800.000 9,740 9.42 3.65 2.26 1.70 1.33 1.03 0.84 663.4 86.6 75.0 38.8 4.05 300.0 1000.000 9,787 7.50 3.69 2.71 2.17 1.69 1.31 1.06 663.4 138.8 75.0 27.5 2.33 300.0 1200.000 9,851 8.02 3.31 2.32 1.94 1.54 1.25 1.06 663.4 122.6 75.0 33.0 6.33 300.0 1600.000 9,811 9.11 3.81 2.49 1.89 1.46 1.16 1.04 663.4 95.0 75.0 34.0 2.62 300.0 1800.000 9,811 10.27 4.64 2.75 2.03 1.59 1.19 1.09 663.4 77.3 75.0 31.1 1.54 300.0 2000.000 9,732 10.83 4.47 2.48 1.78 1.26 0.96 0.81 663.4 66.2 75.0 37.9 2.99 300.0 2200.000 9,883 7.97 3.62 2.34 1.82 1.38 1.11 0.93 663.4 115.3 75.0 35.2 1.17 300.0 2400.000 9,895 9.58 4.13 2.82 2.18 1.79 1.39 1.13 663.4 94.9 75.0 28.2 3.33 300.0 2600.000 9,903 8.13 3.15 1.96 1.59 1.26 1.05 0.91 663.4 111.3 75.0 42.4 7.05 300.0 2800.000 9,998 6.40 2.89 2.02 1.75 1.38 1.12 0.95 663.4 150.0 75.0 35.3 6.27 300.0 * 3000.000 9,775 10.18 3.95 2.31 1.72 1.38 1.15 0.90 663.4 77.5 75.0 37.4 4.98 300.0 3200.000 9,656 21.72 7.28 2.59 2.06 1.63 1.36 1.22 663.4 24.0 75.0 32.2 14.05 61.9 3400.000 9,883 8.72 3.18 2.03 1.76 1.33 1.10 0.94 663.4 103.4 75.0 40.2 9.28 300.0 3600.000 9,692 14.06 5.82 3.35 2.63 2.03 1.50 1.35 663.4 50.6 75.0 24.5 4.36 300.0 3800.000 9,668 18.43 6.84 3.39 2.67 2.16 1.67 1.39 663.4 33.3 75.0 24.1 8.33 300.0 4000.000 9,553 20.57 7.54 4.16 3.10 2.46 1.90 1.60 663.4 29.4 75.0 20.1 7.00 300.0 4200.000 9,609 17.39 5.94 3.40 2.53 2.05 1.59 1.34 663.4 37.4 75.0 25.1 8.41 300.0 4400.000 9,692 13.69 4.23 2.88 2.30 1.83 1.50 1.30 663.4 57.4 75.0 29.2 12.14 300.0 4600.000 9,688 15.19 3.20 1.98 1.59 1.27 1.06 0.93 663.4 47.4 75.0 47.4 22.91 300.0 4800.000 9,640 16.77 4.51 2.50 1.94 1.57 1.12 1.03 663.4 38.6 75.0 36.2 14.84 300.0 5000.000 9,708 16.39 3.06 2.20 1.83 1.51 1.21 0.99 663.4 47.5 75.0 43.5 27.50 300.0 5200.000 9,632 17.93 4.96 2.46 2.09 1.68 1.33 1.13 663.4 35.0 75.0 33.8 17.71 300.0 -------------------------------------------------------------------------------------------------------------------------------------- Mean: 12.37 4.43 2.62 2.06 1.63 1.28 1.09 663.4 74.9 75.0 33.1 8.25 300.0 Std. Dev: 4.37 1.31 0.53 0.37 0.30 0.22 0.19 0.0 34.9 0.0 6.7 6.75 193.2 Var Coeff(%): 35.31 29.54 20.37 17.88 18.72 17.50 17.60 0.0 46.6 0.0 20.4 81.75 64.4 --------------------------------------------------------------------------------------------------------------------------------------
Figure 24. MODULUS 6 Structural Evaluation of SH 6.
Average base value is good. However, substantial increase in deflections after 3100 ft, this is where most of the repairs are occurring in the field.
34

35
CASE STUDY 2 RAPID FAILURE OF DETOUR ON IH 35 BASE
In early 2004 a temporary detour was constructed on IH 35 to carry main lane traffic
while the concrete main lanes were being constructed. The design life of the detour was set to be
one year. However, rapid structural failure occurred after only 3 months in service. The failure
consisted of alligator cracking and severe rutting and potholing. The pavement structure
consisted of 6 inches of asphalt surface over 14 inches of Class 1 flexible base over select
embankment material.
A forensics study was initiated and falling weight deflectometer, dynamic cone
penetrometer, and ground penetrating radar data were collected. Dr. Dar Hao Chen from the
Construction Division led the forensic study, and details can be found in the TxDOT forensic
report (Chen, 2004). For all of the collected data the indication was that the flexible base had
become saturated and this was assigned as the main cause of the structural failure. Ground
Penetrating Radar (GPR) data from the site are shown in Figure 25.
Figure 25. Base Dielectric Data from IH 35.
Figure 25 shows the dielectric values from the top of the flexible base from diagonal
passes over the failed section. The values are high in several places above 18. For typical Class
1 flexible base at or below optimum moisture content (OMC) the value should be less than 12.

36
The implication from the radar was that the base on this section was excessively wet. This was
further investigated by digging a test trench. A diamond saw was used to cut the asphalt in the
test area, the surface was dried as well as possible, and a backhoe was used to remove the surface
and base layers. The test pit is shown in Figure 26.
Figure 26. Trench in Failed Area of IH 35 (Chen, 2004).
Upon first opening the trench the base appeared moist; however, after a period of time water was
observed to seep into the trench from the surrounding base. This water was possibly from the
sawing operation, but all indications from the samples taken were that the existing base was
saturated. Samples taken from the base ranged in moisture content from 8 to 9.5 percent,
whereas subsequent testing found the optimum moisture content for the material to be
7.7 percent.
Two possibilities were investigated as the cause of the moisture entering the base. The
first was via the surface through poorly compacted asphalt layers, and the second was via
capillary rise from the support select fill material. The asphalt layer in this detour section was
found to be poorly compacted. This was evident in the GPR data and in cores taken from the
site. A typical core is shown in Figure 27.

37
Figure 27. Poorly Compacted Core from the IH 35 Detour Failure.
Samples of the base and select subbase materials were taken from the trench and returned to TTI
and TxDOT laboratories for detailed evaluation. TxDOT labs tested the base using Tex Method
117-E and reported that the base was not a Class 1 material as specified but a Class 2.3 material.
The results from the TST are shown in Figure 28.
Dielectric Value vs. Time
0.0
5.0
10.0
15.0
20.0
25.0
30.0
0.0 50.0 100.0 150.0 200.0 250.0 300.0
Time (hr)
Die
lect
ric V
alue
Flex base Top Fill Bottom Fill
Figure 28. TST Results on Material from IH 35 Detour Failure.

38
Dielectric values indicate that the base material used on this project is marginal, whereas select
fill materials were poor in terms of moisture susceptibility.
To further explore the moisture susceptibility issue a laboratory evaluation was made on
the flexible base samples removed from IH 35. In particular, the effect of moisture content on
the important engineering properties of resilient modulus and resistance to permanent
deformation was determined. In all cases standard American Association of State Highway
Transportation Officials (AASHTO) protocols were followed. Six inch diameter by 12 inch high
specimens were prepared for all samples with maximum particle sizes greater than 0.75 inch.
All material greater than 1 inch was scalped off prior to testing. Test specimens were prepared to
the maximum dry density (γd) and optimum moisture content (w). The test setup is shown in
Figure 29. The compacted specimen was prepared for testing by placing a rubber membrane
around it. The membrane was sealed to the top and bottom platens with rubber “O” rings as
shown in Figure 29.
Figure 29. Setup for Deformation and Resilient Modulus Test.

39
TEST RESULTS
In this investigation it was attempted to conduct the resilient modulus determination at
optimum moisture content and at optimum ± 1 percent. It was impossible to get data at the +1
percent moisture content. The sample was too weak to endure the testing sequence without
failing. The results from the optimum and optimum -1 percent are tabulated in Table 6.
Table 6. Moduli Results from IH 35 Base at Different Moisture Contents.
k1 k2 k3 Mr (ksi)
Optimum -1% 2315 1.17 -0.83 56.6
Optimum 1496 1.19 -0.84 37.0
The resilient modulus in the table was computed at an applied load of 15 psi and a
confining stress of 5 psi, which is thought reasonable for the IH 35 pavement structure under
truck loading. At 1 percent below optimum the resilient modulus of this material was predicted
to be 56 ksi, which is typical for Texas bases. However, the values decrease substantially as the
base becomes wetter.
The results from the permanent deformation tests are even more dramatic. In this
laboratory test samples were compacted to maximum density at three different moisture contents
6.7, 7.7, and 8.7 percent, with 7.7 percent being OMC as determined by standard TxDOT
procedures. The results of this test are shown in Figure 30. The presence of moisture has a large
impact on the resistance of this base material to resist permanent deformation. Setting the
traditional failure level at 2 percent strain, the sample failed after 10 load cycles at 1 percent
above optimum moisture and at 850 cycles at optimum moisture content. At 1 percent below
optimal moisture content the sample did not fail under these stress conditions.
The results obtained from this test are consistent with the failure mechanisms observed in
the field. The base used on IH 35 rapidly lost strength and became highly rutting prone upon
wetting.

40
SUMMARY
The case studies presented in this chapter illustrate the main reason for Project 4358.
TxDOT districts have long known that the bases used in our typical flexible pavements will
perform well if they are kept dry, but will fail very quickly if moisture enters them. During the
life of a pavement, moisture will eventually enter the base, perhaps not as soon as the two cases
discussed in this chapter. The non-moisture susceptible bases and those described in the next
chapter are hopefully a step toward improving the long-term performance of flexible pavements.

Permanent Strain Vs Number of load cycles
0.1
1
10
0.1 1 10 100 1000 10000
Number of load cycles
Perm
anen
t Stra
in(%
)
OMC1% below OMC1% above OMC
2 % Failure Line
Figure 30. Comparison of Permanent Strain with Varying Moisture Content.
41


43
CHAPTER 5
FIELD PERFORMANCE OF HEAVY-DUTY BASE SECTIONS
FM-1810 TEST SECTIONS IN FORT WORTH DISTRICT
These test sections were designed and constructed in research Project 0-3931 conducted
in-house by the Texas Department of Transportation in cooperation with the Federal Highway
Administration from September 1998 to December 2000 (Williammee and Thomas, 2000).
Several roadway failures were reported in the Fort Worth District that were thought to have
originated in the flexible base course. This district recognized that the standard flexible base
requirement had not provided adequate support for the surface layers. Although the gradation
specification of the 1993 Texas Standard Specifications was used, this situation revealed the
detrimental effect that high fines content can have on the strength of the aggregate mass if it is
not controlled.
The main objective of Project 3931 was to investigate the influence of fines on strength
and to propose a new gradation envelope. A proposed large stone gradation and a regular
gradation were used in the base courses of two experimental sections (Table 7) constructed in
August 1999. These sections of FM-1810 are located in Wise County, north-west of Decatur,
near Chico. Within the broad climatic regions, this project can be categorized under intermediate
freeze-thaw.
This portion of FM-1810 carries a large number of heavy trucks, as it serves as an access
route to the Pioneer quarry. The design was based on an average annual daily traffic of 5280
vehicles in 2000 and 8480 in 2020, with 29.3 percent trucks (which is a low estimate). The 20-
year design ESALs was 6.38 million.
Table 7. Positions and Pavement Structures of FM-1810 Test Sections.
Section (North) Pavement Structure Begin Station End Station
1 7.5” ACP Surface 12” Large aggregate crushed stone 12” Cement stabilized subgrade
1 + 100 1 + 900
2 7.5” ACP Surface 12” Regular graded crushed stone 12” Cement stabilized subgrade
4 + 000 4 + 800
Note: All sections located across northbound and southbound lanes.

44
Materials Used
Laboratory tests were performed on aggregate mixes prepared to represent the limits
currently used, and then on modified gradations. Aggregates from three local producers were
used. Based on these results, a new flexible base gradation envelope was proposed with
improved shear strength as indicated by its triaxial class.
In this study a laboratory program was undertaken to evaluate the variation in triaxial
strength classification which could be possible within the current gradation bands. Using a
single aggregate source researchers found that varying the -200 fraction from 14 to 27.5 percent,
which is within specifications, showed a triaxial classification range between 1.9 and 3.5. At the
14 percent level of fines the strength at 15 psi confining was 158 psi; this dropped to 91 psi at the
high fines level. Based on concerns about variations in strength within the current gradation
specifications the district proposed a new large stone gradation that would narrow the wide
strength range obtained, improve strength, and potentially lower cost due to less crushing. The
proposed gradation, with maximum aggregate size of 4 inches, was tested and provided a triaxial
classification of 1.0. It was agreed among the research committee members that this gradation
would be used in a demonstration test section. A limestone from the lab study was selected to
produce material for construction. Table 8 summarizes the results obtained for the two bases
used.

45
Table 8. Base Material Properties for Test Sections on FM-1810 (Williammee and Thomas, 2000).
Parameter Description
Section 1: Station 1+000 to Station 1+900 (meter)
Section 2: Station 4+ 000 to Station 4+800 (meter)
Gradation Proposed Large Stone Gradation Regular Type A, Grade 6
English Metric (mm) Specification Constructed Specification Lower Limit Upper Limit
4” 100 < 100 100 - - - 3” 75 80 – 100 99 - - - 45 50 – 75 70 95 – 100 95 100
3/2” 37.5 - - - - - 22.4 - - 65 – 95 65 95
3/8” 9.5 15 – 40 54 - - - No. 4 4.75 - - 25 – 60 25 60
No. 40 0.425 0 – 10 9 20 – 35 20 35 No. 200 0.075 - - - 18 28
PI Max. 12 Min. 0 NP Max. 12
Min. 4 6 6 Fines LL Max. 45 NP Max. 45 22 22
Wet Ball Mill, % Max. 50 - Max. 50 - - Increase in % fines (No. 40) Max. 20 - Max. 20 - -
Texas Triaxial Class - 1.0 - 1.9 3.5 Strength (psi) at 0 psi lateral pressure - 82.7 - 56.5 9.0
Strength (psi) at 15 psi lateral pressure - 253.4 - 158.2 90.9
Maximum Dry Density, MDD (pcf) - 138.1 - 126.3 130.2
Optimum Moisture Content, % OMC - 6.4 - 5.9 4.9
Construction
As shown in Figure 31, the sections described in Table 7 were constructed in August
1999. The large stone base proved difficult to work with, as it was prone to segregation.
Various efforts were made to place the material with base recycling equipment, but this seemed
to worsen the problem with the large rocks coming to the surface and fines going to the bottom.
The final recommended compaction procedure used a Sheep’s foot (in vibratory mode), followed
by a pneumatic then a steel wheel for finishing. It was also recommended that consideration be
given to making sure the edges of the base are day-lighted to avoid trapping water.

46
The section was placed using ordinary compaction, which required proof rolling with a
loaded water truck. These test sections were experimental, and after the segregation experience
the district recommended that more fines should be added to keep the large rocks at the surface
from “shelling out” under traffic. The gradation for the large rock is essentially a zero fines.
Figure 31. Construction of the Large Stone Base on FM-1810. Post-Construction Condition and Nondestructive Testing (NDT) Surveys
A visual condition survey was made in July 2005. As shown in Figure 32, at that time
the large stone base section was showing some longitudinal cracking along construction joints;
substantially more cracking was found in the section with regular high fines base. However,
there was no indication that this cracking was caused by either base. Coring over cracks in the
large stone base section found that this cracking did not propagate through the entire HMA layer;
it appeared to be confined to the top surface layer.

47
a) Large Stone Base
b) Regular Type A Base
Figure 32. Surface Condition of FM-1810 Test Section July 2005.
GPR surveys were carried out in July 2002, and results are summarized in Table 9. The
average dielectric values are generally between 7.5 and 9.0, which are indicative of good dry
base conditions. The GPR trace images also show no problem with either base. A few
longitudinal cracks are observed on the surface, but these currently do not extend into the base.

48
Table 9. Base Dielectric Constants and Layer Thicknesses for FM-1810 (Hefer and
Scullion, 2002).
Eastbound (EB) Westbound (WB)
Section1 Statistic Dielectric Constant
Layer Thickness
(in)
Dielectric Constant
Layer Thickness
(in) Average 7.6 11.6 8.8 12.2 CoV 0.07 0.12 0.05 0.05 Minimum 6.5 7.7 7.2 10.2
No. 1 (Large Stone)
Maximum 10.5 15.4 10.1 14.1 Average 8.3 11.7 7.6 12.2 CoV 0.06 0.06 0.06 0.15 Minimum 7.0 9.9 7.0 7.1
No. 2 (Regular)
Maximum 10.2 13.7 9.3 16.9
A repeat GPR survey was conducted in July 2005, and very similar results were obtained.
The average base dielectrics for the large stone base was 7.3 and 7.5 (EB and WB) and for the
Type A base, 7.7 and 7.9. Neither of the sections had a base dielectric value greater than 10.
Both bases on this highway are dry, and clearly moisture is not entering from above or below.
In the cracked area shown in Figure 32 the GPR display shown in Figure 33 was
obtained. The top of the base and subbase are clear in the data. The significant feature is a strong
reflection at a depth of 2 inches; this is the bottom of the final lift of HMA. There appears to be
moisture buildup at this interface, which supports the idea that the surface cracking is simply in
the top layer and caused by either top-down cracking or layer debonding.

49
Figure 33. GPR Images from Cracked Section of FM-1810.
Backcalculated elastic moduli for the two experimental sections on FM-1810 were
reported by Williammee and Thompson (2000) determined from FWD data collected in
September 1999 and October 2000. Deflections were measured again in July 2002 and again in
July 2005. The average moduli for the two directions are plotted in Figure 34. Although the
initial modulus of the regular graded base was initially high (180 ksi just after construction), it
decreased significantly with time to an average value of 64 ksi, while that of the large stone
aggregate base increased gradually with time and seems to have stabilized at an average value of
80 ksi.
Data for all years shows that the moduli of both sections in the westbound lanes are
slightly higher than those in the eastbound lanes. As reported by Hefer and Scullion (2002), the
2002 results are 93 ksi and 74 ksi, respectively, for the large stone base and 73 ksi and 49 ksi,
respectively, for the regular graded base.

50
FM 1810 Fort Worth
0
50
100
150
200
0 20 40 60 80
Months Since Construction
Bas
e M
oduli (
ksi)
LargeStonebaseRegularBase
Figure 34. Base Layer Moduli on FM-1810 from 1999 to 2006.
Summary
The trends shown in Figure 34 are very interesting. The regular base with high minus
200 content (>20 percent) had a very high initial base modulus. It is theorized that this may be
related to the practice of “slush rolling” whereby during the process of watering and rolling with
a steel wheel roller the excess fines migrated to the upper base. When they dry they create a
dense stiff layer, which when tested with the FWD produces a backcalculated modulus of 180
ksi. However, over time this modulus has dropped. After almost 3 years in service the average
backcalculated modulus has dropped to around 65 ksi. The large stone base shows a different
trend. The initial modulus is low, on the order of 50 ksi, but over time this has increased
gradually to a value of over 80 ksi after almost 3 years. This could indicate that these bases need
trafficking to consolidate and with time they will provide a dense stiff support layer.
Overall, both bases on FM-1810 are performing well, with the thick asphalt surface and
the stiff cement-treated subbase ensuring that little or no moisture enters the base. The distresses
on the Type A base are attributed to problems in the asphalt layer.
SH 31 TYLER DISTRICT
In April 2005 the Tyler District constructed a short section of SH 31 using the Arkansas
Granite flexible base. The section under construction is shown in Figure 35.
Bas
e M
odul
i (ks
i)

51
Figure 35. Arkansas Granite Base Being Placed on SH 31.
Materials Used
The material properties for this base are shown in Table 10.
Table 10. Laboratory Test Results from Arkansas Granite SH 31. Property Test
Method
Criteria
Item 247
Existing
Criteria
Item 245
Proposed
Granite
Mountain
Master Gradation (% Retained) 1 3/4 in. 0 0 0 1 1/2 in. 0-15 0-15 7/8 in. 10-35 10-35 10.7 3/8 in. 30-50 35-55 37.4 No. 4 45-65 50-75 54.3 No. 40 70-85 70-90 81.6 No. 200
Tex-110-E
N.A. 88-98 92.1 Plasticity Index Tex-106-E ≤ 10 ≤ 8 None Plastic
Wet Ball Mill, % passing Tex-116-E ≤ 40 ≤ 30 26.6 Max. Increase Passing No. 40, % Tex-116-E ≤ 20 ≤ 12 8.1
Texas Triaxial Class Tex- 117-E 1.0 N.A. 1.0 Strength (psi) @ 0 psi Confining Tex-117-E ≤ 45 N.A. 54.1 Strength (psi)(@15 psi Confining Tex-117-E > 175 > 225 270.1
Maximum Dry Density, MDD (pcf) Tex-113-E - - 138.6 Optimum Moisture Content, % Tex-113-E - - 6.0--

52
Construction Issues
The section was placed by the local contractor using the sequence shown in Figure 36.
The pneumatic compactor and vibratory steel wheel worked in tandem. The first pass was
immediately behind the grader as shown in Figure 36. In the early passes the steel wheel was in
vibratory mode. The final pass was in non-vibratory mode. The local contractor was very
concerned about compacting this base because of his experience working with similar materials
using the Federal Aviation Administrations (FAA) airfield specification for a P-154 base, which
calls for 0 percent passing the -200 sieve. However, on SH 31 no problems were encountered
with handling or compaction. The specifications for this job called for 100 percent of laboratory
density achieved with TxDOT 113-E procedure. This was achieved with three passes of the
tandem configuration and one finishing pass with the steel wheel in static mode.
Figure 36. Compaction Sequence on SH 31.
A close-up of the completed base is shown in Figure 37. The surface of the base is tight
with a smooth finish. Densities were checked with a standard nuclear device. One comment
heard with all of these bases is that the nuclear test could be problematic with these granular low-
fines bases, particularly as they do not retain moisture. When driving the rod for the nuclear
gauge, cracks appear in the base, and when removing the rod, some disturbance (uplift) of the
base is sometimes observed. This was not a problem on the SH 31 base, but it was a large
concern with the section constructed on US 287.

53
a) finished base b) cracks induced before density test
Figure 37. Close-Up of Arkansas Granite Base on SH 31. Nondestructive Testing Results
During construction of this section the contractor ran into problems with the subgrade
stabilization. In one area the subgrade was very weak and wet. For the whole length the depth
of subgrade treatment was changed from the designed 10 inch depth to 20 inch depth. The
original plans called for 10 inches of lime treatment. Because of the poor support, this was
changed to 20 inches; at the south end of the project a select material was added, and it was
treated with cement. The support layers for this new base are very stiff.
After compaction of the base the section received 2 inches of HMA and was opened to
traffic. Just prior to opening a set of deflection data were collected with a Falling Weight
Deflectometer. The backcalculated moduli values after one week were in the 40 to 50 ksi range.
The section eventually received its full asphalt layer of 6 inches and was retested in November
2005 (7 months after construction), and the deflection data and FWD results are shown in Figure
38. There are several items to note in this figure: the first is the uniformity of the overall
deflections for this site. The average deflection was 8 mils with a standard deviation of 1.1 mils.
This low variability is attributed to the quality of support in this section. The subbase appears to
be very stiff and providing excellent support.

-------------------------------------------------------------------------------------------------------------------------------------- TTI MODULUS ANALYSIS SYSTEM (SUMMARY REPORT) (Version 6.0) -------------------------------------------------------------------------------------------------------------------------------------- District: MODULI RANGE(psi) County : Thickness(in) Minimum Maximum Poisson Ratio Values Highway/Road: Pavement: 6.00 210,000 800,000 H1: v = 0.35 Base: 12.00 10,000 150,000 H2: v = 0.35 Subbase: 20.00 75,000 75,000 H3: v = 0.35 Subgrade: 79.59(by DB) 20,000 H4: v = 0.40 -------------------------------------------------------------------------------------------------------------------------------------- Load Measured Deflection (mils): Calculated Moduli values (ksi): Absolute Dpth to Station (lbs) R1 R2 R3 R4 R5 R6 R7 SURF(E1) BASE(E2) SUBB(E3) SUBG(E4) ERR/Sens Bedrock -------------------------------------------------------------------------------------------------------------------------------------- 76.000 9,668 8.38 4.71 2.46 1.49 1.10 0.83 0.64 467.9 48.2 75.0 20.3 2.85 91.9 149.000 9,640 8.91 5.22 2.67 1.50 1.11 0.90 0.69 517.0 37.0 75.0 19.7 4.40 71.5 226.000 9,589 9.02 5.26 2.70 1.57 1.19 0.93 0.85 488.9 38.3 75.0 18.5 4.09 79.4 301.000 9,704 7.89 4.71 2.27 1.31 0.96 0.78 0.67 572.0 43.9 75.0 23.6 5.72 74.5 375.000 9,672 8.44 4.75 2.26 1.31 1.01 0.84 0.76 444.9 46.4 75.0 22.7 6.76 75.7 450.000 9,624 8.89 5.15 2.39 1.37 1.04 0.89 0.81 459.7 39.1 75.0 21.5 7.11 73.4 525.000 9,390 9.80 5.83 3.09 1.96 1.52 1.28 1.12 428.0 37.7 75.0 13.2 4.57 127.1 600.000 9,442 9.93 5.82 3.14 2.04 1.59 1.34 1.19 399.8 40.2 75.0 12.5 4.28 159.9 675.000 9,458 9.43 5.85 3.22 2.09 1.59 1.29 1.04 511.2 37.6 75.0 12.5 3.40 159.4 74.000 9,573 6.67 3.89 2.06 1.35 1.01 0.79 0.64 546.9 75.0 75.0 22.3 4.27 152.1 150.000 9,593 6.27 3.66 2.06 1.41 1.10 0.87 0.73 522.3 99.7 75.0 20.4 4.57 300.0 230.000 9,620 6.05 3.35 1.73 1.15 0.92 0.74 0.65 466.7 106.5 75.0 26.4 7.39 168.3 300.000 9,628 7.15 3.91 1.92 1.20 0.92 0.75 0.63 440.9 70.0 75.0 25.5 6.54 101.8 375.000 9,473 7.13 4.15 2.17 1.41 1.09 0.88 0.78 503.0 67.7 75.0 20.3 5.29 141.8 450.000 9,454 6.87 4.08 2.30 1.45 1.15 0.98 0.95 544.1 73.7 75.0 18.5 5.18 114.8 526.000 9,501 7.27 4.36 2.49 1.78 1.49 1.27 1.08 452.8 87.3 75.0 14.0 6.28 300.0 600.000 9,438 9.50 5.87 3.79 2.88 2.34 1.93 1.62 380.0 64.7 75.0 7.4 2.21 300.0 675.000 9,481 7.45 4.37 2.23 1.28 0.89 0.71 0.61 603.3 45.9 75.0 24.4 4.00 74.1 75.000 9,569 7.92 4.51 2.32 1.43 1.04 0.78 0.63 498.5 50.5 75.0 21.4 2.98 98.8 151.000 9,605 7.60 4.39 2.35 1.50 1.09 0.84 0.72 519.0 57.3 75.0 20.1 2.79 124.6 225.000 9,589 7.72 4.49 2.31 1.47 1.07 0.85 0.72 512.4 54.3 75.0 20.5 3.93 120.2 300.000 9,581 6.72 3.78 1.95 1.23 0.93 0.77 0.72 493.4 76.5 75.0 24.5 5.65 108.9 375.000 9,557 7.29 4.22 2.19 1.35 1.01 0.80 0.69 532.5 59.1 75.0 22.1 4.43 97.8 451.000 9,593 7.58 4.30 2.22 1.39 1.06 0.88 0.79 468.1 61.5 75.0 21.0 5.31 107.0 526.000 9,609 8.10 4.42 2.39 1.68 1.40 1.20 1.06 331.7 80.2 75.0 15.7 7.06 300.0 600.000 9,485 9.26 5.48 3.23 2.25 1.80 1.44 1.23 402.2 53.5 75.0 10.8 2.75 300.0 675.000 9,446 8.80 4.76 2.43 1.55 1.16 0.89 0.72 372.2 49.9 75.0 18.8 3.43 125.0 -------------------------------------------------------------------------------------------------------------------------------------- Mean: 8.00 4.64 2.46 1.57 1.21 0.98 0.84 477.0 59.3 75.0 19.2 4.71 117.6 Std. Dev: 1.10 0.71 0.47 0.38 0.33 0.28 0.24 63.8 19.2 0.0 4.8 1.48 47.3 Var Coeff(%): 13.70 15.31 19.12 24.37 27.32 28.83 28.84 13.4 32.4 0.0 24.8 31.42 40.2 --------------------------------------------------------------------------------------------------------------------------------------
Figure 38. FWD Results from Arkansas Granite Base on SH 31.
54

55
The average stiffness of the Granite base is reasonable at around 60 ksi. This section is
performing similarly to the Fort Worth section with low initial moduli values that increase with
time. More deflection testing is planned for this site. After 2 years in service the project is
performing well with no surface distress.
US 287 BRYAN DISTRICT
This section is approximately 2 miles long, stretching from near the intersection with
FM-488 to the Trinity River Bridge. The subgrade in the area is very wet; this entire area is next
to a large dam and it is largely wetlands. The pavement is built up on select fill embankment.
The pavement structure initially called for 8 inches of lime-treated subgrade, 10 inches of
Grade 1 limestone base, an underseal and 4 inches of HMA surfacing. However, because of
transportation problems the limestone base (from Central Texas) was not available for this
project. At the last minute the contractor proposed to change to an Oklahoma Granite base. This
new material was supplied at the same cost as the original Texas Grade 1 limestone.
Photographs of the site during and after construction are shown in Figure 39.
a) Underseal prior to HMA placement b) after placement of HMA
Figure 39. U.S. 287 Heavy-Duty Base Section.
The district reported that there were several problems with the HMA layer placed on this project.
As shown in Figure 39 b) the right lane was completely milled and replaced.

56
Materials Used
The materials used in this section are shown in Table 11. This is high-quality granite
with a very low wet ball increase of 4 percent, substantially less than the allowable 20 percent.
Subsequent testing at TTI showed the minus 200 fraction of the base to be around 8 percent.
Table 11. Standard Test Results for the Oklahoma Granite Base Materials. Property Test
Method
Criteria
Item 247
Existing
Criteria
Item 245
Proposed
Oklahoma
Granite
Master Gradation (% Retained) 1 3/4 in. 0 0 0 1 1/2 in. 0-15 0-15 7/8 in. 10-35 10-35 8.7 3/8 in. 30-50 35-55 37.4 No. 4 45-65 50-75 55.8 No. 40 70-85 70-90 81.9 No. 200
Tex-110-E
N.A. 88-98 92.0 Plasticity Index Tex-106-E ≤ 10 ≤ 8 None Plastic
Wet Ball Mill, % passing Tex-116-E ≤ 40 ≤ 30 22.1 Max. Increase Passing No. 40, % Tex-116-E ≤ 20 ≤ 12 4.0
Texas Triaxial Class Tex- 117-E 1.0 N.A. 1.0 Strength (psi) @ 0 psi Confining Tex-117-E ≤ 45 N.A. 71.2 Strength (psi)(@15 psi Confining Tex-117-E > 175 > 225 244.7
Maximum Dry Density, MDD (pcf)
Tex-113-E - - 144.8
Optimum Moisture Content, % Tex-113-E - - 4.8--
The contractor claimed to have major problems making required field density
(100 percent Method 113-E). He experimented with heavier rollers and different rolling
patterns. His claim was that the base was well compacted but that it was difficult to get a true
density measurement of this base with the nuclear device, which cracked and disturbed the base
when the rod was driven in. Removal of the rod from the base was also reported to be difficult,
causing slight upheaval in the material. In an attempt to evaluate this claim, testing was
performed with the nuclear and sand cone tests, and the results are shown in Table 12. These
data indicate some validity to the claim. On average the dry density with the sand cone test is 3
lb/cu ft higher than with the nuclear device.

57
Table 12. Base Densities Measured with Different Techniques.
Station
Nuclear Wet Density
(lb/cu ft)
Nuclear Dry Density
(lb/cu ft)
Nuclear %
moisture
Sand Cone Wet
Density (lb/cu ft)
Sand Cone Dry
Density (lb/cu ft)
Sand Cone
% Moisture
16+480 154.7 146.3 5.8 158.6 149.9 5.8
16+530 147.9 142.9 3.6 154.5 148.5 4.0
16+570 151.3 145.7 3.9 153.3 146.9 4.3
16+610 153.9 147.3 4.5 156.0 149.5 4.3
19+310 150.9 147.8 2.0 153.7 150.2 2.3
It is also interesting to note that all of the density values provided (except the value at
16+530) are well above the laboratory value of 144.5 lb/cu ft. In fact, from the sand cone the
average density was 149.0 lb/cu ft or 103% of optimum. More work is required in this are a to
set acceptable limits on field densities for these bases. Resistance to increasing requirements
over the existing 100 percent of Method 113-E will be strong, within the contracting community
and as of yet we do not have performance data to support increasing this density requirement.
Nondestructive Testing of Section
This section was tested with the FWD and GPR in April 2006. The FWD results are
shown in Figure 41. The average moduli value for this base is close to 60 ksi. However, for
these data there is one weak area, from 1.12 mils to 1.27 mils. The deflection at one location is
24 mils (0.024 inches), well above the average for this section. The increase appears to be
related to a weakening or lack of support in the stabilized layer. The GPR also indicated
moisture at the bottom of the base at the high deflection location; this is shown in Figure 40 and
labeled as a wet spot. Figure 40 shows about 1000 ft of GPR data from one location next to a
bridge. The top of the base is the yellow line at a depth of 4 inches, whereas the top of the lime-
treated layer is at a depth of approximately 16 inches. The red areas in the reflection from the
top of the lime layer indicate a build up in moisture. From the GPR data there is also some
concern about the asphalt layer on this project. The surface dielectric varies, which is an
indication of variable surface density, and there is an interface in the middle of the 4 inch mat.
This is possibly an indication of moisture build up at the bottom of the top lift of asphalt. The

58
GPR data did not indicate any problem with the Oklahoma Granite base. The dielectric values
for the base were all less than 10.
Figure 40. GPR Data from Oklahoma Granite Base Section on SH 287, Bryan District.
Summary
From discussions with the contractor this base was difficult to compact in order to pass
the density requirement. He commented that the raw base was trafficked by over 100
channelized trucks delivering concrete to a bridge construction area with no damage to the base.
Meeting the density requirement is perhaps more related to the method of measurement. In
control tests the sand cone test gave 3 lb/cu ft higher densities than the nuclear gauge. The GPR
and FWD data from the base looked reasonable but concerns were raised about the quality of the
HMA surfacing and the permanency of the lime-stabilized subgrade. The current visual
condition is very good; monitoring of this section will continue.

Thickness(in) Minimum Maximum Poisson Ratio Values Highway/Road: US 287 Pavement: 4.00 180,000 750,000 H1: v = 0.35 Base: 10.00 10,000 150,000 H2: v = 0.35 Subgrade: 252.48(by DB) 20,000 H4: v = 0.40 -------------------------------------------------------------------------------------------------------------------------------------- Load Measured Deflection (mils): Calculated Moduli values (ksi): Absolute Dpth to Station (lbs) R1 R2 R3 R4 R5 R6 R7 SURF(E1) BASE(E2) SUBB(E3) SUBG(E4) ERR/Sens Bedrock -------------------------------------------------------------------------------------------------------------------------------------- 0.398 9,048 14.94 11.29 7.46 4.85 3.20 2.35 1.89 750.0 60.6 0.0 12.1 4.31 209.3 * 0.551 9,152 14.90 7.98 4.07 2.70 1.93 1.48 1.25 282.9 54.5 0.0 21.5 3.58 300.0 0.851 9,215 13.35 8.10 4.33 2.73 1.74 1.31 1.14 750.0 41.6 0.0 21.8 1.46 169.1 * 0.900 9,172 11.79 7.00 3.94 2.76 1.96 1.54 1.26 390.3 90.7 0.0 21.3 3.52 300.0 0.950 9,235 11.94 7.30 4.43 3.10 2.13 1.60 1.31 413.4 98.6 0.0 19.5 1.47 300.0 0.950 9,215 11.92 7.28 4.40 3.11 2.13 1.59 1.33 407.2 99.1 0.0 19.5 1.58 292.1 1.000 9,128 10.64 6.70 4.06 2.78 1.92 1.50 1.26 585.4 100.1 0.0 21.1 1.93 300.0 1.025 9,056 15.21 9.46 5.57 3.80 2.54 1.81 1.49 511.0 55.4 0.0 15.7 1.01 231.1 1.050 9,005 13.48 7.96 4.31 2.74 1.85 1.43 1.19 550.0 50.0 0.0 20.7 1.75 252.3 1.075 8,897 14.27 8.61 4.36 2.52 1.61 1.24 1.06 750.0 23.8 0.0 23.4 4.49 165.2 * 1.100 8,949 12.27 7.08 3.57 2.30 1.57 1.20 0.99 566.7 50.5 0.0 24.5 2.34 280.4 1.125 8,945 16.75 10.18 4.57 2.70 1.77 1.41 1.22 694.9 20.2 0.0 20.6 2.89 194.1 1.250 8,894 24.54 16.62 9.30 5.31 3.11 2.21 1.80 750.0 10.0 0.0 11.8 3.27 119.3 * 1.275 8,953 18.30 11.81 7.05 4.65 3.07 2.30 1.87 567.2 39.6 0.0 12.5 1.01 208.9 1.300 9,148 12.41 7.87 4.17 2.76 1.88 1.45 1.20 750.0 53.4 0.0 21.1 2.56 274.2 * 1.325 8,981 13.76 7.63 4.05 2.71 1.82 1.37 1.13 353.7 57.4 0.0 21.5 1.83 240.8 1.350 8,993 12.70 7.85 4.43 3.04 2.09 1.61 1.34 536.2 68.4 0.0 19.1 2.20 300.0 1.375 8,747 12.02 6.24 3.43 2.44 1.79 1.45 1.23 180.0 98.3 0.0 23.4 5.45 300.0 * 1.400 8,985 11.85 7.06 4.11 3.00 2.17 1.71 1.39 306.7 108.8 0.0 19.5 4.29 300.0 1.425 8,997 11.99 6.47 3.63 2.54 1.86 1.49 1.26 209.1 100.8 0.0 22.8 4.88 300.0 1.450 9,017 11.65 6.26 3.50 2.46 1.69 1.35 1.15 238.4 95.4 0.0 24.2 3.44 300.0 1.475 8,894 12.49 7.34 4.04 2.74 1.87 1.43 1.17 443.7 67.4 0.0 20.9 2.12 280.3 1.500 8,957 12.28 7.28 4.15 2.79 1.89 1.46 1.22 457.0 72.4 0.0 20.7 1.84 261.1 1.525 8,953 12.24 7.65 4.34 2.84 1.92 1.47 1.22 699.3 59.4 0.0 20.2 1.61 255.9 1.550 8,925 11.27 6.46 3.60 2.39 1.59 1.21 1.05 463.4 73.7 0.0 24.2 1.61 224.1 1.575 8,925 11.38 7.06 4.04 2.71 1.87 1.43 1.18 630.1 73.4 0.0 21.1 1.78 300.0 1.600 8,858 11.99 7.16 3.67 2.32 1.57 1.22 1.04 701.2 47.2 0.0 24.0 2.24 257.8 1.625 9,021 15.73 9.37 4.88 2.86 1.80 1.41 1.15 724.8 26.7 0.0 20.0 1.91 158.0 1.650 8,882 12.83 7.22 3.75 2.41 1.63 1.29 1.06 453.6 53.4 0.0 23.2 2.31 256.5 1.675 8,941 10.09 5.72 3.08 2.05 1.46 1.19 1.03 443.5 87.9 0.0 27.4 4.00 300.0 1.700 8,969 11.55 7.30 4.11 2.64 1.80 1.39 1.18 750.0 60.5 0.0 21.6 1.96 277.9 * 1.725 8,882 11.63 7.62 4.51 2.92 2.00 1.57 1.32 750.0 67.8 0.0 19.3 2.22 291.4 * 1.750 9,025 10.51 6.56 3.66 2.42 1.67 1.32 1.11 750.0 73.8 0.0 23.6 2.65 300.0 * 1.775 8,933 10.96 6.69 3.57 2.33 1.62 1.29 1.12 687.8 64.3 0.0 24.0 3.13 300.0 1.800 9,033 9.36 5.44 3.03 2.13 1.55 1.22 1.05 427.7 115.8 0.0 27.1 4.44 300.0 1.825 8,909 12.96 8.58 4.27 2.57 1.79 1.43 1.19 750.0 39.1 0.0 21.0 4.47 232.6 * 1.850 8,886 11.33 6.81 3.71 2.46 1.66 1.30 1.11 607.8 65.6 0.0 23.1 2.29 252.0 1.875 8,866 10.79 6.57 3.82 2.54 1.73 1.33 1.11 601.6 79.6 0.0 22.4 1.53 276.0 -------------------------------------------------------------------------------------------------------------------------------------- Mean: 13.05 8.02 4.45 2.89 1.95 1.49 1.25 583.1 62.4 0.0 20.8 2.61 266.5 Std. Dev: 2.52 1.93 1.18 0.68 0.40 0.27 0.21 175.6 24.9 0.0 3.5 1.19 65.0 Var Coeff(%): 19.32 24.13 26.50 23.41 20.31 18.21 16.88 30.1 39.9 0.0 16.7 45.71 26.0
Figure 41. FWD Data from SH 287.
59

60
RIVERSIDE TEST SECTIONS
In the summer of 2004 TxDOT Project 0-4519 constructed a series of test sections at
TTI’s Riverside campus to evaluate the performance of traditional flexible base materials
(Fernando and Estakhri, 2006). The test plan layout is shown in Figure 42. On the upper lane
(sections 21 - 25) the design base thickness was 12 inches; in the lower lane the thickness was
6 inches.
Figure 42. Layout of Base Experimental Sections at TTI’s Riverside Campus.
In Project 4519 the following five bases from Texas were constructed:
• Sections 1, 6 Crushed sandstone (Oklahoma Sandstone)
• Sections 2, 7 Uncrushed gravel (Victoria Gravel)
• Sections 3, 8 Caliche (with 2% lime) (Pharr Caliche)
• Sections 4, 9 Grade 2 crushed limestone (Texas Grade 2 Limestone )
• Sections 5, 10 Grade 1 crushed limestone (Texas Grade 1 Limestone)
In addition to these 3 materials heavy-duty base materials were used:
Test Sections 21 and 22
Test Sections 21 and 22 were constructed with a crushed granite from Arkansas (Arkansas DOT
Standard Specification Item 303, Class 7). This is designated as Arkansas Granite Type 1.

61
Test Sections 23 and 24
Test Sections 23 and 24 were constructed with a different crushed granite from Arkansas
(Arkansas DOT Standard Specification Item 303, Class 7), designated Type 2.
Test Sections 25 and 26
Test Sections 25 and 26 were constructed with a Oklahoma sandstone base (Oklahoma DOT
Standard Specifications Item 703, Type A).
Table 13 shows results of TTI laboratory tests on these materials.
Table 13. Laboratory Results from Bases Used in Field Test Sections.
Test Arkansas
Granite 1
Arkansas
Granite 2
Oklahoma
Sandstone
Tex-110-E Percent of Fines 7.2 % 8.0 % 10.67 %
Tex-106-E Plasticity Index NP 4 6
Optimum Moisture Content 6.0 % 5.5 % 5.5 % Tex-113-E
Max Dry Density 137.4 lb/ft3 147 lb/ft3 138 lb/ft3
Tex-116-E Wet Ball Mill Value 19.7 20 36.5
Tex 116-E % Increase in fines (- 40) 5 8 10
Strength @ 0 psi 36 psi 65 psi 44 psi Tex-117-E
Strength @ 15 psi 218 psi 213.2 psi 209 psi
Tex-144-E Dielectric Value 9.2 9.8 10.5
Problems were encountered with molding these samples using traditional TxDOT
procedures. The low-fines materials tend to collapse when extruded from the molds after the
standard drop hammer compaction. Modifications were required to handle these materials in the
laboratory. These will be described in the next chapter of this report.

62
These bases performed well on all the standard laboratory tests except the unconfined
strength in test procedure Tex 117-E. Two of the bases failed the zero confining strength
requirement for the current Item 247, which is a minimum strength of 45 psi. However, all of
the bases did very well in the confined strength test, easily exceeding the required strength of
175 psi.
Construction
Details of the construction of these sections can be found in the final report in Project 0-
4519 (Fernando and Estakhri, 2006). The subgrade for this site was a heavy clay with a
plasticity index in the mid 30s and an optimum moisture content of 18 percent. The objective of
Project 0-4519 was to determine the surface loads required to induce a shear failure in the
subgrade. Therefore in this project the subgrade was not treated. This is unusual, as with soil
conditions such as this the clay material would either be treated with lime, or a subbase layer
would have been included.
The subgrade conditions prior to placing the base are shown in Figure 43.
Figure 43. Subgrade Just Prior to Base Placement.
The subgrade was approved for base placement on September 2, 2004, the densities as
measured by the nuclear density gauge averaged 103 percent of maximum density, and the
measured moisture contents after compaction were between 14 and 16 percent. The 6 inch base
was placed on the left side of the section shown in Figure 43, and the right received 12 inches of
base.

63
As the sections were short, the base was placed using a front-end loader. Compaction of
the base was achieved using three to four passes of a pneumatic roller, followed by a steel
vibratory steel wheel. The base did not pass the initial density tests, so a heavier steel wheel
roller was brought to the project. The base was finally approved (100 percent density as
measured in Tex Method 113-E). The completed section is shown in Figure 44.
Figure 44. Completed Base Section at TTI’s Riverside Campus.
Some segregation of several of the bases was noted; the segregation in the sandstone section is
shown in Figure 45. After acceptance of the bases a surface seal was placed on all sections.
Figure 45. Segregation in the Sandstone Section.

64
Nondestructive Testing of Sections
Nondestructive testing of the sections was performed shortly after compaction with both
ground penetrating radar and falling weight deflectometer. A typical set of GPR data is shown in
Figure 46. The only significant feature of this figure is the strong reflection from the top of the
subgrade on all the sections with low-fines bases, sections 21, 23, 1, and 25. Section 1 is very
similar sandstone material to that used in section 25. The indication and the observation during
construction is that these bases do not hold moisture. Any moisture added for compaction
quickly drains to the bottom of the layer and possibly wets the subgrade. This is a problem on
this site, as the subgrade material for this project is untreated clay. During compaction it was
observed that the bases did not hold water, they dried very quickly. This issue needs to be
considered when deciding where and how to construct these low-fines bases, especially if
significant rainfall is possible during construction. Consideration needs to be given to day-
lighting these bases to avoid trapping moisture. It will also be critical that the subbase material
be non-moisture susceptible or possibly sealing or priming the supporting layer. The FWD data
collected are shown in Figure 47.
Figure 46. GPR Data from Riverside Test Sections.

-------------------------------------------------------------------------------------------------------------------------------------- TTI MODULUS ANALYSIS SYSTEM (SUMMARY REPORT) (Version 6.0) -------------------------------------------------------------------------------------------------------------------------------------- District: MODULI RANGE(psi) County : Thickness(in) Minimum Maximum Poisson Ratio Values Highway/Road: Pavement: 0.50 1,500,000 1,500,000 H1: v = 0.35 Base: 12.00 8,000 50,000 H2: v = 0.35 Subbase: 24.00 2,000 6,000 H3: v = 0.35 Subgrade: 240.00(User Input) 5,000 H4: v = 0.40 -------------------------------------------------------------------------------------------------------------------------------------- Load Measured Deflection (mils): Calculated Moduli values (ksi): Absolute Dpth to Station (lbs) R1 R2 R3 R4 R5 R6 R7 SURF(E1) BASE(E2) SUBB(E3) SUBG(E4) ERR/Sens Bedrock -------------------------------------------------------------------------------------------------------------------------------------- 21.000 8,850 74.53 26.72 11.56 8.04 5.91 4.33 3.67 1500.0 12.8 6.0 7.7 6.75 134.3 * 21.000 8,731 73.09 27.11 10.48 7.83 6.02 4.67 3.91 1500.0 12.8 6.0 8.0 11.48 71.6 * 23.000 8,770 72.75 34.10 11.62 7.37 5.49 4.32 3.52 1500.0 13.6 4.6 8.5 13.66 57.9 23.000 8,266 91.11 39.07 11.64 7.45 5.54 4.49 3.88 1500.0 9.2 4.0 7.9 15.93 56.5 1.000 7,944 111.95 39.55 10.66 7.20 5.69 4.40 3.75 1500.0 8.0 3.0 9.0 22.76 60.5 * 1.000 8,099 102.43 43.44 12.74 6.80 5.15 4.92 4.22 1500.0 8.0 3.1 8.6 19.52 59.1 * 2.000 8,520 87.31 22.66 9.10 5.77 4.26 3.27 2.75 1500.0 9.1 6.0 10.5 10.63 84.4 * 2.000 8,933 56.80 20.23 9.23 5.91 4.14 3.34 2.72 1500.0 18.8 6.0 11.9 10.40 232.6 * 3.000 8,743 73.94 36.00 10.11 5.85 4.80 4.01 3.14 1500.0 12.8 4.2 10.9 21.49 58.5 3.000 8,556 76.74 40.35 10.66 5.91 5.24 4.21 3.44 1500.0 12.3 3.5 11.0 25.28 63.3 4.000 8,635 76.33 32.81 11.09 6.85 5.18 4.24 3.65 1500.0 12.0 5.0 8.5 13.72 57.6 4.000 8,623 79.58 37.72 13.93 6.92 5.34 4.36 3.89 1500.0 12.6 3.4 9.3 15.67 69.8 5.000 8,600 81.60 34.43 9.89 6.69 5.15 4.17 3.18 1500.0 10.5 5.1 8.7 16.57 56.4 5.000 8,572 79.63 33.16 10.67 6.25 5.15 4.21 3.34 1500.0 11.0 5.0 8.9 16.30 56.2 25.000 8,008 108.54 32.46 9.12 6.76 4.98 3.74 3.35 1500.0 8.0 3.9 9.7 19.15 56.7 * 25.000 8,278 87.04 28.87 7.78 5.67 4.50 3.47 2.76 1500.0 8.5 6.0 9.9 16.55 58.7 * -------------------------------------------------------------------------------------------------------------------------------------- Mean: 83.34 33.04 10.64 6.70 5.16 4.13 3.45 1500.0 11.3 4.7 9.3 15.99 63.5 Std. Dev: 14.42 6.53 1.50 0.75 0.54 0.46 0.45 0.0 2.8 1.1 1.2 4.91 16.3 Var Coeff(%): 17.30 19.75 14.14 11.24 10.41 11.24 13.09 0.0 25.3 23.8 13.3 30.73 25.7 --------------------------------------------------------------------------------------------------------------------------------------
Figure 47. FWD Data from Riverside Test Sections.
65

66
The FWD data shown in Figure 47 were collected in January 2005 approximately 3
months after placement of the base but prior to trafficking. The results are problematic. The
deflections on all sections are very high. This is attributed to a very weak layer at the top of the
subgrade. This layer was calculated to have an average modulus value of less than 5 ksi.
Between construction and testing this site received substantial rainfall; the edges of the project
ponded water for several weeks. It is clear that this moisture entered the pavement layers and, as
will be discussed later, had a large impact on the performance of these bases under traffic loads.
Trafficking of Test Sections
As part of Project 0-4519, plate-bearing tests were conducted on each test section
(Fernando and Estakhri, 2006). As part of this study the test sections were also trafficked to
failure with the flatbed truck shown in Figure 48. The gross vehicle weight was 91,000 lb, with
approximately 40,000 lb on each set of dual axles. The 12 inch thick base sections were
trafficked with this vehicle traveling at 5 mph. In the first few passes of the truck it was clear
that several of the sections were not structurally adequate to carry this load. The test was
stopped after five passes and rut depth measurements were made. Then after another 25 passes
the test was stopped because several of the sections were exhibiting severe edge shear failures.
Figure 48. Flatbed Truck for Rut Determinations.

67
Rut depth measurements were made both manually and with the transverse profiler
shown in Figure 49. These were taken both before trafficking and after 5 and 30 passes of the
loaded truck. In Figure 49 there is substantial water standing at the side of the section, as several
inches of rain fell prior to testing. The ditches stayed filled with water for extended periods. As
soon as trafficking started, major stability problems were encountered, primarily at the outside
edge of the sections. There is no substantial shoulder on this section.
Figure 49. Rut Determination on Test Sections.
The average rut depths for the test sections are presented in Table 14 where the average
and highest values are reported. Edge failures of several sections, primarily the crushed gravel
and Grade 1 limestone, made additional trafficking impossible.

68
Table 14. Rut Determinations (in) for Clay Site after 30 Passes.
Section Number
Base Type
Rutting (in) Outer WP
Avg. (Highest)
Rutting (in) Inner WP
Avg. (Highest) 21 Arkansas Granite Type 1 1.0 (1.8) 0.5 (0.6)
23 Arkansas Granite Type 2 0.8 (0.9) 0.4 (0.6)
1 Oklahoma Sandstone 1.1 (1.3) 0.6 (0.7)
2 Uncrushed Gravel 2.2 (3.5) 1.8 (3.5)
3 Caliche (+ 1.5% lime) 0.5 (0.7) 0.4 (0.7)
4 Grade 2 Limestone 0.8 (0.9) 0.5 (0.6)
5 Grade 1 Limestone 2.2 (2.6) 0.9 (1.4)
25 Sandstone (Oklahoma) 0.8 (1.4) 0.5 (0.6)
Post-Mortem of Test Section
Following the rapid failure of the test section, test pits were dug to identify the source of
the problem. The results from one of the pits are shown in Figure 50. The blue line in the top of
the pit represents the surface of the test section; the red line at the bottom of the figure represents
the top of the clay subgrade. The yellow shaded area represents the wheel paths in the test
section. From this figure it is clear that the failure is entirely in the subgrade. The base
maintained close to its design thickness of 12 inches for the entire trench. The rutting was found
to be entirely in the subgrade layer.
Soil samples from each base were obtained and the corresponding moisture content was
determined in the TTI laboratory. The results for the heavy-duty base sections are presented in
Table 15. The base moisture contents for the three sections were all below optimum moisture
content. However, the subgrade was found to be completely saturated.

69
Figure 50. Trench Profiles from Failed Sections.
Moisture buildup within the subgrade of this project was a big factor influencing the
performance. The plasticity index of the soil was 31 percent, with an optimum moisture content
of 18 percent. After compaction of the subgrade the average moisture content was measured to
be 15 to 16 percent, or 2 - 3 percent below optimum. The moisture content of the base and
subgrade measured immediately after trafficking is shown in Table 15. The soils after failure
were found to be 5 to 7 percent above optimum moisture content.
Table 15. Subgrade Moisture Contents for Three Tests.
Cell 21 Arkansas Granite 1
Cell 23 Arkansas Granite 2
Cell 25 Oklahoma Sandstone
Base moisture(%)
% of Optimum
3.2
53
3.1
56
5.3
96
Subgrade Moisture
(%) of optimum
23.0
127
23.5
130
25.3
140

70
Water draining from the base into the subgrade was one potential source of water entering the
subgrade soils. But similar high moisture contents were found in all test sections, not just the
heavy-duty bases. The failure is thought to be caused more by the heavy rainfall prior to
trafficking, the fact that the high-PI soil was not treated, and the lack of an adequate shoulder.
Given these facts the benefits of using heavy-duty bases could not be documented in this
experiment. In summary, heavy-duty bases are no different from any other base in that they will
only perform well if they are placed on a solid foundation. This was not the case with this
experiment.

71
CHAPTER 6
RECOMMENDED CHANGES TO TEXAS LABORATORY SAMPLE
PREPARATION PROCEDURES
INTRODUCTION
In the course of laboratory testing heavy-duty low-fines bases, concerns arose regarding
the suitability of Tex-113-E impact hammer compaction and handling procedures for preparing
laboratory test specimens. In many instances, test specimens prepared with Tex-113-E in the
laboratory were so fragile that they fell apart after extrusion from the compaction mold. With
traditional Texas bases the samples can be handled as shown in Figure 51; these are free-
standing columns of material that can be dried and then subjected to capillary rise as required in
strength test procedures. The visual contrast between the Item 245 and 247 bases is shown in
Figure 52. Many times the heavy-duty bases simply fell apart during extrusion from the
compaction molds. To minimize this problem several samples were extruded directly into a
latex membrane as shown in Figure 53.
Figure 51. Handling Compacted (Item 247) Bases.

72
Figure 52. Comparing Item 245 and 247 Bases.
Figure 53. Extruding Item 245 Bases Directly into Membranes.

73
Additionally, low-fines heavy-duty materials with a long history of acceptable field
performance oftentimes perform poorly in repeated load laboratory tests. Because of these
concerns, TTI built a prototype vibratory laboratory compactor to use for preparing test
specimens. Pilot results with this new compactor appear to indicate substantially different
mechanistic properties in laboratory tests result when using the vibratory compactor as compared
to specimens made with Tex-113-E.
PROBLEMS WITH TEX-113-E COMPACTION
The basic impact hammer method of compaction as used in Tex-113-E has served Texas
for decades. However, several reasons exist why the impact hammer lab compaction method
may not always be optimal for preparation of laboratory specimens. In the laboratory, TxDOT
test specimens are compacted in lifts of approximately 1.5 inch for soils and 2 inch for base.
Field construction rarely involves such thin layers. Furthermore, the resulting structure
(orientation of particles within the laboratory sample) may not replicate the field. Hoeg et al.
(2000) concluded that when reconstituting specimens, simply satisfying correct density and
particle size distribution is not sufficient: the soil fabric must be reproduced or analyses based on
results of reconstituted specimens may be misleading. Weibiao and Hoeg (2002) attributed poor
correlation between field behavior and laboratory specimen performance to differences in
particle orientation as a result of laboratory molding techniques. Clearly, the need exists for
laboratory specimens to replicate both field moisture and density and field structure.
To illustrate problems between the laboratory and the field with low-fines bases, the
results below (Kancherla, unpublished data) were obtained on a low-fines base from New York
with decades of good field performance. It was reported that this base is the foundation layer for
most of the pavements in upper New York, it has excellent resistance to freeze-thaw cycling, and
provides excellent long-term pavement support. Table 16 shows the gradation for this material,
and the material performed very well in the tube suction test with a final dielectric value of 9.0.
However, problems were found with both resilient modulus and permanent deformation tests.
For both of these tests, samples were compacted with the modified proctor method, which has
significantly higher compactive effort than the traditional TxDOT 113-E procedure. Table 17
shows the resulting laboratory-determined resilient modulus. Clearly, the laboratory resilient
modulus value is very low for a top-quality base, and, as Figure 54 illustrates, the test specimens

74
failed during the repeated load testing. The poor performance and failure of the samples in the
laboratory do not match the positive historical field performance of these materials. As the
material consists of angular crushed aggregates with low fines content, researchers hypothesized
that the laboratory sample compaction technique was at least partly responsible for the poor
laboratory performance, and alternative laboratory compaction methods may be necessary with
the material.
Table 16. Gradation of New York Base (Kancherla, unpublished data).
Sieve Size Percent Passing 1 ¼ in. 100.0 7/8 in. 88.7 5/8 in. 82.4 3/8 in. 67.8
#4 57.4 #10 42.5 #40 14.9 #200 9.4
Table 17. Laboratory Resilient Modulus Results (Kancherla, unpublished data).
Specimen Resilient Modulus
(ksi)*
k1 k2 k3
New York Base Type 1- Specimen #1
20.62 1063.62 .55 -.29
New York Base Type 1- Specimen #2
30.75 1381.41 .65 -.12
*At 5 psi confining pressure and 15 psi deviator stress.
Figure 54. Failed New York Base in Resilient Modulus Test (Kancherla, unpublished data).

75
PROPOSED NEW VIBRATORY LABORATORY COMPACTION
Due to problems encountered with preparing and testing low-fines base materials, TTI
built the prototype vibratory compactor shown in Figure 55. Ideally, this compactor would
produce specimens with a structure more representative of bases in the field and therefore result
in laboratory test results that more closely predict true field performance.
Figure 55. TTI’s Prototype Vibratory Laboratory Compactor.
COMPARISON OF RESULTS BETWEEN 113-E AND VIBRATORY
To investigate differences in mechanistic properties between laboratory specimens
prepared with Tex-113-E and vibratory compaction, the research team performed a pilot study
with high quality Texas crushed limestone Type A Grade 1 flex base meeting the 2005 TxDOT
Standard Specifications. In this pilot investigation, lab specimens were tested in the 10,000
cycle permanent deformation test described by Zhou and Scullion (2004). Initially, one
specimen with each test method was tested. Due to the drastic difference in results, a second
vibratory specimen was tested to verify the preliminary observations. Figure 48 illustrates the
findings, which show test specimens prepared with Tex-113-E had approximately 5 times the
amount of accumulated permanent deformation after the 10,000 cycle test. Additionally, the two
replicate vibratory specimens resulted in very similar results.

76
While the permanent deformation parameters clearly appear to differ between the two lab
compaction methods, the resilient modulus values of the specimens also appear to differ at first
glance. However, with this limited number of test specimens and previous observations of poor
repeatability of the resilient modulus test, the research team believes sufficient data do not exist
at this time to evaluate if the resilient modulus values truly differ. Additionally, other
researchers (Kolisoja et al., 2003) concluded that the best indicator of long-term field
performance for base materials was the permanent deformation characteristics rather than the
resilient modulus properties. Therefore, the research team believes the drastic difference in
permanent deformation properties observed in this pilot testing is an extremely significant
finding, regardless of whether resilient modulus values are impacted by the lab compaction
method.
Vibratory #2500th cycle's resilient strain=0.000369,
Mr = 75.85 ksiAlpha = 0.895 Gnu = 0.181
y = 0.002x0.1848
y = 0.0005x0.1434
y = 0.0006x0.10450
0.002
0.004
0.006
0.008
0.01
0.012
0 2000 4000 6000 8000 10000 12000
Number of Load Repetitions
Perm
anen
t Str
ain Tex-113-E
500th cycle's resilient strain=0.000546,Mr = 51.05 ksi
Alpha = 0.815 Gnu = 0.66
Vibratory #1500th cycle's resilient
strain=0.000313,Mr = 90.55 ksi
Alpha = 0.857 Gnu = 0.235
Figure 56. Pilot Results Comparing Vibratory to Tex-113-E Lab Compaction.

77
RECOMMENDATIONS
Based upon the results presented, ongoing work should be initiated to more extensively
evaluate the prototype vibratory compaction system. Research needs to address:
• What materials are most sensitive to the laboratory molding method?
• For a given material, which lab tests are impacted by the specimen molding technique?
• Which results are most representative of the field compaction?


79
CHAPTER 7
CONSTRUCTION ISSUES WITH HEAVY-DUTY BASES
One of the main construction concerns with the low-fines bases studied in this project is
segregation during placement. Problems were reported on the FM-1810 projects with their large
stone base, and Figure 45 illustrated issues with segregation in placing the sandstone base at
TTI’s Riverside campus. One cause of the segregation has been reported to be excessive
handling and blading of the materials during standard base construction operations.
Late in Project 4358 new base paving materials were introduced to Texas. The base
paver shown in Figure 57 was operated by Big Creek Construction Inc. on a new construction
project in the Waco District. As reported by Hefer and Scullion 2002, placing base using pavers
such as this is routine in other states, but has not been done in Texas.
Figure 57. Base Paver Operations in the Waco District.
The construction operation shown in Figure 57 consisted of a pugmill for blending and adding
moisture to the base (two man operation), the base paver shown (two man operation), and one
steel wheel vibratory roller (one man). The contractor commented that the operation was
economically viable, because of the reduction in manpower and equipment over standard
operations.
Photographs of the placed base are shown in Figure 58.

80
a) Overall View b) Joint in placed base
Figure 58. Completed Section.
To achieve compaction the base was placed at 2 percent above optimum moisture
content. The TxDOT inspector reported that the base was measured to be at 92 percent of
required density before rolling. The base was left for about 30 minutes before rolling
commenced. No problems were reported obtaining the 100 percent density required called for in
the current specification. To obtain a desired lift thickness a 1 inch roll down was anticipated, so
if the design thickness was 6 inches then 7 inches was placed directly out of the paver. The
completed section looked excellent and offered a smooth ride. Handling and working of the base
was minimal; no evidence of any segregation was found with this operation.
A second project using this paver was constructed in the Bryan District in early 2006 on
FM-80. In that project part of the section was placed using a traditional dump truck plus blade
operation and another with the paver operation shown in Figure 57. To compare the uniformity
of the section field seismic modulus tests were conducted by TxDOT Construction Division
(2006). Tests were conducted before and after compaction at various locations across the layer.
The reported conclusions were:
• Using the paver resulted in about 3.5 times (51 percent vs. 14 percent) less variability in
measured modulus than the blade operation for the compacted layer.

81
• Once compacted, the variability across the mat reduced by half (from 29 percent to 14
percent) for paver-laid base.
• Given the high variability of the bladed sections, one can conclude the paver segregates
the base less than a blade.
SUMMARY
All indications are that the base paver operation provides a more uniform base than that
obtained by traditional operations. This will particularly hold true with the low-fines bases
promoted in this research project. For that reason the pugmill and paver operation has been
included in the draft Item 245 specification given in Appendix B.


83
CHAPTER 8
CONCLUSIONS AND RECOMMENDATIONS
The following conclusions are drawn from this project;
1) The cause of the moisture susceptibility problems in traditional Texas bases is believed to be
the presence of expansive clay minerals within the fines. Extensive laboratory characterization
studies were developed and conducted on four base materials. For the two Texas bases the
minus 200 fraction was measured to contain 6.3 and 11.1% fine clay. X-ray diffraction found
that this clay was highly expansive material and most probably introduced during the mining
process.
2) The current Texas bases perform very well in many parts of the state, they are easy to
construct and compact, and they provide a smooth finish for final surfacing. However,
problems have been found on several projects in East Texas when water enters the base. Two
case studies are presented in Chapter 4 of this report. The cause of the failures was not purely
a base failure. Poor compaction of the thin asphalt layers is a major contributing factor.
However, once water entered the base the structural failures were rapid and severe.
3) The section of large stone base on FM-1810 is performing excellently under extremely heavy
traffic loadings. Contributing to the success is a very stiff cement-treated subbase and a well-
constructed 6 inch asphalt surface. FWD data indicated that the large stone base initially had a
lower moduli value than the companion traditional high-fines base. However, with time the
situation has reversed; the large stone base now has slightly higher field modulus than the
traditional materials. Both sections continue to perform well.
4) During the course of this study two sections of heavy-duty base were incorporated into two
ongoing TxDOT projects. On SH 31 in the Tyler District a granite base material from
Arkansas was used. The contractor reported no problems with handling or compaction of this
material. On US 287 in the Bryan District an Oklahoma granite base material was used. The
main difficulty reported here was meeting the 100 percent density requirement with nuclear
gauge equipment. Comparison tests with the sand cone method found that the nuclear
procedures consistently underestimate the density of the compacted base material.

84
5) Three test sections of heavy-duty base were constructed at TTI’s Riverside campus. The
performance of these sections was directly related to the very weak subgrade layer. Clearly,
the performance of any granular base is directly related to the subgrade support.
6) At the test sections at Riverside campus researchers noted that the heavy-duty bases are free
draining; they will not hold any water. Therefore, water used for compaction and water from
rainfall will directly penetrate the base. Based on this it is recommended that consideration be
given to ensuring that the layer beneath the base is free draining or preferably sealed.
Consideration should also be given to “day-lighting” these bases, so that lateral drainage is
possible. Day-lighting is the term used to ensure that the base will allow water to flow laterally
into the shoulder area. This is critical for these highly permeable materials. The common
Texas practice of “shouldering-up” the base with existing clay materials must not be allowed.
Any rainfall experienced during construction must be allowed to drain prior to placing the final
surface.
7) Laboratory testing procedures need to be modified when performing strength tests on these
bases. At a minimum the compacted samples compacted should be extruded directly into a
membrane.
8) For advanced materials characterization tests such as resilient modulus and permanent
deformation the preliminary test results indicate that the drop hammer as used in Tex Method
113E may not be the optimal compaction procedure for the heavy-duty bases. More studies
should be undertaken with the vibratory compactor developed in this project.
As part of this project a draft Item 245 specification was developed, and this is shown in
Appendix B of this report. The initial version of this draft Item 245 specification was proposed
by TxDOT’s Construction Division. This specification was first modified by research staff
based on the findings of Project 4358. It was further reviewed and modified by laboratory
engineers from the Fort Worth and Atlanta Districts. Highlights of this specification include the
modified materials specifications, which include limits on the -200 fraction, tighter limits on the
wet ball mill test, and the use of the TST and FFRC test to ensure material quality. The use of
the pugmill and base paver is recommended to minimize the likelihood of materials segregation.
It is proposed that consideration be given to using this specification on future heavy-duty base
projects within Texas.

85
REFERENCES
Barbu., G., and Scullion, T. “Repeatability and Reproducibility Study of the Tube Suction
Test,” Report 4114-01, Texas Transportation Institute, College Station, TX, October 2005.
Chen, D.H. “Forensic Report on IH35-Detour Failure,” TxDOT Forensic Report, June 2004.
Fernando, E., and Estakhri, C. “Validation of the Texas Triaxial Design Procedure,” Report
4519-2, Texas Transportation Institute, College Station, TX, August 2006.
Guthrie, W.S., Hermansson, Е., and Scullion, T. Determining Aggregate Frost Susceptibility
with the Tube Suction Test. In Cold Regions Engineering: Cold Regions Impacts on
Transportation and Infrastructure, American Society of Civil Engineers, Reston, VA, 2002,
pp. 663-674.
Hefer, A., and Scullion, T. “Material, Specifications and Construction Techniques for Heavy
Duty Flexible Bases; Literature Review and Status Report on Experimental Section,” Report
4358-1, Texas Transportation Institute, College Station, TX, October 2002.
Hoeg, K., Dyvik, R., and Sandbaekken, G. Strength of Undisturbed versus Reconstituted Silt
and Silty Sand Specimens. ASCE Journal of Geotechnical and Geoenvironmental
Engineering, Vol. 126, Issue 7, July 2000, pp. 583-673.
Kancheria, A., and Scullion, T. “Heavy Duty Flexible Bases: Year 3 Progress Report,”
Report 4358-3, Texas Transportation Institute, College Station, TX, April 2005.
Kolisoja, P., Saarenketo, T., Peltoniemi, H., and Vuorimies, N. “Laboratory Testing of
Suction and Deformation Properties of Base Course Aggregates,” Transportation Research
Record: Journal of the Transportation Research Board, TRB, National Research Council,
Washington, D.C., 2003, pp. 83-89.

86
Nazarian, S., Yuan, D., Tandon, V., and Arellano, M. “Quality Management of Flexible
Pavement Layers with Seismic Methods,” Research Report 1735-3, Center for Highway
Materials Research, UTEP, El Paso, TX, 2003.
Scullion, T., and Saarenketo, T. “Using Suction and Dielectric Measurements as
Performance Indicators for Aggregate Base Materials,” Transportation Research
Record: Journal of the Transportation Research Board, TRB, National Research Council,
Washington, D.C., 1997, pp. 37-44.
TxDOT 2004, Draft Item 245 Specification, provided to research team by Soils and
Aggregates group, TxDOT’s Construction Division.
Weibiao, W., and Hoeg, K. “Effects of Compaction Method on the Properties of Asphalt
Concrete for Hydraulic Structures,” In International Journal on Hydropower and Dams,
Volume 9, No. 6, 2002, pp. 63-71.
Williammee, R.S., and Thomas, G.L. “Reevaluation of Flexible Base in the Fort Worth
District,” TxDOT Research Report 7-3931, December 2000.
Zhou, F., and Scullion, T. “Guidelines for Developing Input Parameters of Enhanced
VESYS Program,” Product 9-1502-01-P5, Texas Transportation Institute, College Station,
TX, August 2004.

87
APPENDIX A
SAMPLE PREPARATION AND TEST PROCEDURES FOR
MINERALOGICAL TESTING
INTRODUCTION
Most states limit the amount of fines (minus 200 sieve fraction) of flexible base courses;
however, Texas requires a minimum unconfined compressive strength that cannot be attained
unless fines are used to main sample integrity in the unconfined state. Based on recent work by
Harris and Chowdhury (2005), the mineralogy of an aggregate can have a significant impact on
pavement performance. Soils and sediments are composed predominantly of small crystals
(minerals) that determine most of their properties (Dixon and White, 2000). Soil scientists have
developed special techniques to identify these minerals and their properties. In order to obtain an
accurate analysis of flexible base course mineralogy, the researchers recommend using some of
the techniques developed by soil scientists combined with geological techniques. The following
discussion will lead one through the procedures used at TTI to characterize these materials.
METHODS
The first thing one needs to do is sieve the base course aggregate to separate the large
rocks from the smaller ones. The researchers use the following sieves: 7/8 in. (22.4 mm); 3/8 in.
(9.5 mm); #10, 0.0787 in. (2 mm); #40, 0.0165 in. (0.42 mm), and; #200, 0.0029 in. (0.074 mm).
After sieving is completed, the aggregate larger than 3/8 in. is visually analyzed for similarities
and differences (i.e., angularity, porosity, color, grain size, and composition) and separated into
like groups. An aggregate from each group is then selected for thin section preparation. Thin
sections (Figure A1) are slices of rock (~0.03 mm thick) mounted on glass slides for observation
with a microscope. The thin sections are typically impregnated with a blue-dyed epoxy to
facilitate identification of pores in the rock.

88
Figure A1. Typical 1 X 2 Inch and 2 X 3 Inch Thin Sections.
The thin sections are examined with a petrographic microscope (Figure A2) to identify
mineralogy, weathered or altered mineral grains, cementation, grain boundary types, and pore
types.
Figure A2. Petrographic Microscope Used to Analyze Thin Sections.

89
Pretreatments for Clay Mineralogy
Any time chemical pretreatments are used there is a risk of altering or destroying parts of
the soil or rock not intended by the treatments. However, without the pretreatments, the data are
very limited because the clay fraction (the most important of the minerals as far as reactivity is
concerned) is generally in concentrations too low to be detected by conventional XRD analysis.
Weigh portions of the minus 200 sieve fraction and place into 250 mL Nalgene centrifuge
bottles (Figure A3). The amount of material (-200) needed will vary because some soils and
rocks have higher concentrations of clay than others. Only 1 g of clay is needed for the full
analysis, so select enough sample to yield 1 g of coarse clay and 1 g of fine clay. The
researchers typically start with 100 g of soil.
The first step is removal of carbonates. This step is necessary to get separation of the silt
and clay by centrifugation. Carbonates also decrease the efficiency of hydrogen peroxide
treatment. To remove the carbonates add a 1N Na acetate solution buffered to pH 5.0 with acetic
acid to the 250 mL centrifuge bottles and place in a hot water bath to speed up carbonate removal
(Figure A3). During carbonate removal, bubbles will appear in the solution from evolution of
CO2 gas as the carbonate is dissolved. A sign that the reaction is complete is a lack of bubbles in
the sample.
Figure A3. Caliche Sample in Water Bath for Carbonate Removal.

90
After the reaction has subsided, centrifuge the sample at 1500 to 2000 rpm for 10 to 15
minutes. Pour off the clear supernatant and add more of the Na acetate solution to the sample
and react as before, until there is no reaction (carbonate bubbles) when the Na acetate is added to
the sample, which indicates that the carbonate removal is complete. Police down the sides of the
centrifuge bottle and wash two more times with pH 5, 1N Na acetate.
The second step is to remove the organic matter because it tends to aggregate mineral
grains as well, making it difficult for mineralogical analyses requiring sample dispersion. The
procedure follows Jackson (1969) where 30 percent H2O2 is buffered by a pH 5, 1N Na acetate
solution. Following the completion of carbonate and soluble salt removal, add 5 to 10 mL of 30
precent H2O2 along with equal quantities of pH 5 1N Na acetate to remove organic matter by
oxidation. Pyrite and maganese oxides are also removed in this step. Place the 250 mL
centrifuge bottles inside beakers because violent reactions can occur in this step,and the sample
can all boil out onto the countertop unless the sample is placed inside a beaker to catch all of the
material that boils over (Figure A4).
Figure A4. Removal of Organic Matter Often Results in a Violent Reaction.

91
The removal of organic matter is complete when the sample loses its dark color and/or
the effervescence has dramatically decreased. After organic matter has all been destroyed, add
about 10 mL of 30 percent H2O2 and place the centrifuge bottle in the water bath (Figure A3) at a
temperature slightly less than 100 ºC to ensure that the reaction is complete. Vigorous
effervescence indicates that organic removal is not complete, but some bubbling will occur
because the H2O2 is decomposing to H2O plus O2.
After organic matter is removed, wash the sample one time with 200 mL of pH 5 1N Na
acetate followed by one wash with 200 mL of 1N NaCl.
The next step, removal of free iron oxides, is often deleted from pretreatments because it
is not problematic in most soils or samples. However, Oxisols and some Ultisols are difficult to
disperse unless free iron oxides are removed (Kunze and Dixon, 1986).
Add a sodium citrate-bicarbonate-dithionite solution to the sample to chelate, buffer, and
reduce the ferric iron to a soluble ferrous form which is then washed out. After the sample has
been treated to remove organics and carbonates, add approximately 40 mL of 0.3M of Na citrate
solution and 5 mL of 0.5M Na bicarbonate solution. Heat to 80 ºC in a water bath (Figure A3)
and add 1 g of sodium dithionite. Stir the solution constantly for 1 minute and periodically for
15 minutes. Add 10 mL of saturated NaCl solution to flocculate the suspension. Acetone can be
added in a 10 mL aliquot if suspension does not flocculate. Centrifuge for 10 to 15 minutes at
1600 to 2200 rpm and pour off supernatant. Perform the above treatment one or two more times
if necessary.
Dispersion and Fractionation
As stated previously, data are limited unless the samples are separated into different size
fractions. Fractionation achieves two objectives: (1) it concentrates mineral phases, and (2) it
improves the preferred orientation of layer silicates (Dixon and White, 2000). In order to
separate the soil into the different size fractions, the sample must first be dispersed, which is
usually accomplished by raising the pH to about 10 for most soils. Add pH 10 sodium carbonate
(Na2CO3) solution to the sample following carbonate and organic removal, which leaves the
sample with a pH of about 5 and will not allow most samples to disperse. Following the
procedure of Jackson (1969), wash the sample several times with the pH 10 water (Na2CO3).

92
Centrifuge for 10 to 15 minutes at 1600 to 2200 rpm and pour off the supernatant (Figure A5).
When the sample does not yield a clear supernatant, then the sample is considered dispersed.
Figure A5. Centrifuge Used to Aggregate the Sample Prior to Decanting Supernatant.
Following dispersion is fractionation. Depending upon your discipline (engineer,
geologist, or soil scientist), obtain an appropriate sieve (#200, #230, or #325) to separate the sand
from the silt and clay fractions. Using a setup like the one illustrated in Figure A6, wet sieve the
sample with pH 10 water and collect the clay and silt fractions in a 4 L nalgene beaker. The sand
fraction retained on the sieve is transferred to a beaker and placed in an ultrasonic cleaner to
further remove clay particles that adhere to sand grains. The supernatant will become clouded as
a result of the ultrasonic cleaner. Return the sand fraction to the sieve and wash again to remove
the disaggregated clay particles. After the sand has been cleaned with the ultrasonic cleaner a
couple of times, wash the sand fraction with distilled water into a preweighed beaker and place
in an oven to dry. Once the water is removed from the sand fraction, weigh the beaker to obtain
the amount of sand in the soil sample.

93
Figure A6. Ring Stand, Funnel, and Sieve Assembly Used for Sand Fractionation.
Following the wet sieving, the silt and clay fractions are contained in the 4 L Nalgene
beaker. Pour the silt and clay fractions into 750 mL centrifuge bottles and place in an IEC
Centra GP8R centrifuge (Figure A7) and run for 2.5 minutes at 1000 rpm. Decant the
supernatant into a large plastic beaker without pouring any of the silt fraction into the beaker.
Refill the centrifuge bottles containing the silt with pH 10 water and repeat the procedure until
the supernatant is relatively clear. Wash the silt an additional time with distilled water and pour
into a weighed beaker and dry at 60ºC overnight in the oven (Figure A8).
The coarse and fine clay fractions are separated the same way as the silt and clay. The
coarse clay is material in the 2.0 to 0.2 μm size range and should be separated from the fine clay
(below 0.2 µm) because the mineralogy of the two fractions can be drastically different. Pour
the supernatant again into 750 mL centrifuge bottles (Figure A8) and place into the centrifuge for
16 minutes at 4000 rpm. Pour the fine clay remaining in suspension into 4 L beakers. Following
the coarse clay separation, the fine clay will be dispersed in several liters of water. The object is
to remove as much of the water as possible before further treatment of the fine clay.

94
Figure A7. IEC Centra GP8R Centrifuge Used to Separate Silt and Clay Fractions.
Figure A8. Oven Set at 60 ºC for Drying Sand, Silt, and Coarse Clay Fractions.

95
In order to concentrate the fine clay fraction and remove the excess water, add sodium
chloride (NaCl) to the dispersed sample to collapse the diffuse double layer and allow
flocculation (Figure A9). Place foil on top of the beaker to keep foreign matter out of the
sample. Pour the clear supernatant off, and place the fine clay fraction at the bottom of the
beaker in dialysis tubing (Figure A10) to remove the salt that was added to flocculate the fine
clay fraction.
Figure A9. Fine Clay (Tan) Concentrated at Bottom of Beaker So Supernatant Can Be
Removed.
Dialysis tubing is a permeable membrane that allows particles smaller than a certain size
to pass through. Different types of tubing allow different sizes of particles to pass through. Fill
a beaker with double distilled water and place the salt-bearing clay-water suspension in the
dialysis tubing (Figure A10) and suspend in the beaker filled with distilled water. The salt ions
migrate into the distilled water until the salt concentration inside the dialysis tubing is equal to
the concentration in the beaker. Periodically change the distilled water in the beaker so the salt
can continue to pass through the membrane until there is essentially no salt left. When the salt is
removed, the clay inside the dialysis tubing will disperse and fill the entire length of the tubing.

96
Figure A10. Fine Clay Placed in Dialysis Tubing to Remove Salt by Osmosis.
After the salt has been removed by dialysis, the water has to be removed from the fine
clay fraction. This is accomplished by freeze drying the sample. Freeze drying is a process that
removes water from the sample by sublimation (water changing from solid directly to a gaseous
state). Figure A11 is a Labconco Freezone 4.5 benchtop freeze dryer used for removing water
from the fine clay fraction. The fine clay fraction is freeze dried and not dried in an oven
because the sample is easier to disperse and it preserves the structure of the clay for transmission
electron microscope (TEM) analysis.
Place the clay-water suspension directly into a cylindrical freeze dryer flask from the
dialysis tubing (Figure A12). Freeze the clay-water suspension into an inverted cone shape by
placing in a 2 L dewar containing liquid nitrogen and continuously rotating until cracking noises
are heard (Figure A13). When it sounds like the glass is cracking remove the flask of the
freezing suspension from the dewar and quickly rotate at about a 60º angle in the palm of a hand
covered with a cryogenic glove to allow the suspension to freeze (Figure A14). Be sure to freeze
all of the liquid because any liquid in the flask will cause the sample to melt and not sublimate.

97
Figure A11. Freeze Dryer Used to Remove Water from the Fine Clay Fraction of Samples.
Figure A12. Clay-Water Suspension Being Placed in Freeze Dryer Flask.

98
Figure A13. Freezing Clay-Water Suspension Using Liquid Nitrogen.
Figure A14. Rotation of Freezing Suspension to Achieve Inverted Cone Shape.

99
After the clay-water suspension is completely frozen, attach the flask to the freeze dryer
and place a strong vacuum on the sample to prevent melting of the frozen suspension. If the
technique has been properly followed, then the outside of the flask should contain a coating of
ice (Figure A15).
Figure A15. White Coating of Ice on the Flask, Indicative of a Successful Freezing Job.
After freeze drying is complete, weigh the fine clay fraction and place in a plastic bag
labeled with the sample name and size fraction for the next step in the procedure. Compile the
weights of all size fractions (sand, silt, coarse clay, and fine clay) and determine percentages of
each fraction as well as percent lost due to chemical pretreatments and/or mechanical loss.
Preparation for XRD Analysis
Sand and Silt - In order to obtain meaningful XRD data, pulverize the sand fraction in a mortar
and pestle (preferably agate or aluminum oxide; Figure A16) and pass through a #325 sieve. If
one uses the #325 sieve for the silt and sand separation, then the silt fraction does not need to be
pulverized because the silt particles are already smaller than the #325 sieve.

100
Figure A16. Aluminum Oxide (left) and Agate Mortars and Pestles for Sand Reduction.
Once all particles in the sand fraction pass the #325 sieve the sand and silt fractions are
ready to be analyzed. They are side loaded into an aluminum holder (Figure A17) to reduce
preferred orientation of minerals with strong cleavage which may lead to erroneous data
resulting in misleading concentrations of those minerals in the sample.
Figure A17. Aluminum Holders Used for Side Loading Sand and Silt into X-Ray Unit.
Coarse and Fine Clay – The coarse and fine clay fractions need to be saturated with specific
cations in order to obtain uniform X-ray spacings for smectite and vermiculite. The two clay
fractions are saturated with potassium (K+), which is then heat treated to help identify chlorite,
hydroxyl-interlayered phyllosilicates, kaolinite, and mica. The clay fractions are also saturated

101
with magnesium (Mg2+), which is then treated with glycerol or glycol to identify the presence of
smectite.
Saturate the coarse and fine clay fractions with Mg2+ by weighing 0.15 g of clay into a
40 mL centrifuge tube. Add about 25 mL of 1N MgCl2 to the centrifuge tube and mix well. The
centrifuge tube may need to be placed into an ultrasonic bath to break up clay aggregates.
Centrifuge the clay suspension and decant the clear supernatant. Wash the clay with MgCl2 two
more times. Following the three washes with MgCl2, add 25 mLof distilled water to the sample,
mix, centrifuge, and decant as before. Wash the sample with distilled water until the sample
disperses (making it difficult to centrifuge): this step may require several washes. Centrifuge for
a longer time and decant most of the supernatant (leave about 2 to 4 mL of distilled water in the
centrifuge tube, Figure A18) from the centrifuge tube.
Figure A18. Centrifuge Tubes (40 mL) with Mg2+ and K+ Saturated 2 to 4 mL Aliquots.
To saturate the sample with potassium, follow the procedure just outlined using 1N KCl
instead of MgCl2. One should have four centrifuge tubes, following the saturations, as shown
above. Be sure to label each centrifuge tube with the sample name, what clay fraction (coarse or
fine), and what cation (K+ or Mg2+) the clay is saturated with.
After this step is complete, the sample is ready to be dried on slides for the X-ray unit.
Place an aliquot of the K+ saturated sample on a Vycor glass slide (label is etched into bottom of

102
slide) using a disposable pipet (Figure A19). Vycor is a very heat-resistant glass that does not
warp upon heat treatment.
Figure A19. Adding K+ Saturated Clay Suspension to Vycor Slide.
Select a clean, standard petrographic microscope slide, and label it with the sample name
using a permanent marker. Use a new disposable pipet to place an aliquot of Mg2+ saturated clay
suspension onto the labeled petrographic slide as described for potassium. Place the slides under
a watch glass or other suitable barrier to dry without being contaminated by dust (Figure A20).
After the samples dry onto the slides, they are ready to be X-rayed. After the Mg2+
saturated sample is X-rayed, place the slide into a dessicator containing ethylene glycol or
glycerol for 24 hours. X-ray the slide again. X-ray the K+ saturated Vycor slide at room
temperature (25ºC) and again after heat treatments of 300ºC and 550ºC in a muffle furnace.
Sample preparation for clay mineral analysis is concluded. These techniques were used
to prepare the base materials prior to XRD analysis. Chapter 2 of this report presents the details
of the full mineralogical characterization.

103
Figure A20. Magnesium (left) and Potassium (right) Saturated Samples Drying.
References to Appendix A
Dixon, J.B., and White, G.W. Soil Mineralogy Lab Manual, Dept. of Soil and Crop sciences,
Texas A&M University, College Station, TX, 2000.
Harris, P., and Chowdhury, A. “Controlling Mineralogical Segregation in Bituminous Mixes,”
TTI Report 4523-1 F, College Station, TX, November 2005.
Kunze, G.W., and Dixon, J.B. “Pretreatments for Mineralogical Analysis,” Soil Science Series of
America Book Series, Part 1, pp. 91-100, ISSN 1047-4986, 1986.
Jackson, M.L. “Soil Chemical Analysis,” Dept of Soil Science, University of Wisconsin,
Madison, WI, 1969.


105
APPENDIX B
ITEM 245 AGGREGATE BASE
245.1. Description. Construct foundation courses composed of flexible base in accordance with
the typical sections, lines, and grades shown on the plans or as directed.
245.2. Materials. Furnish uncontaminated materials of uniform quality that meet the
requirements of the plans and specifications. Notify the Engineer of the proposed material
sources to be used at least 30 days prior to production. Do not change any material source
without written approval from the Engineer. When a source change is approved, the Contractor
will verify that the specification requirements are met. The Engineer may sample and test
project materials at any time throughout the duration of the project to assure specification
compliance. Use Test Method Tex-100-E to define materials.
A. Aggregate. Furnish the type and grade shown on the plans and conforming to the
requirements specified in Table B1. Do not use additives to modify aggregates to
meet the requirements of Table B1, unless shown on the plans.
1. Type A. Crushed stone produced and graded from oversize quarried aggregate
that originates from a single, naturally occurring source. Do not use gravel or
multiple sources.
2. Type B. Crushed or uncrushed gravel. (Blending of two or more sources is
allowed.)
3. Type C. Crushed gravel with a minimum of 60 percent of the particles retained
on a No. 4 sieve and with two or more crushed faces as determined by Test
Method Tex-460-A, Part 1. (Blending of two or more sources is allowed.)
4. Type D. Crushed stone, crushed concrete, approved recycled materials.
(Blending of two or more sources is allowed.)

106
Table B1. Material Requirements.
Property Test Method
Grade 1 Grade 2 Grade 3
Master Gradation (% Retained)
1 ¾ in. 0 0 1 ½ in. 0-15 0-10 7/8 in. 10-35 10-30 3/8 in. 35-55 30-55 No. 4 50-75 45-70 No. 40 70-95 70-90 No. 200
Tex-110-E
90-95 87- 95
As shown on the plans
Liquid Limit 1 Tex-104-E ≤ 25 ≤ 35 Plasticity Index 1 Tex-106-E ≤ 8 ≤ 10
Wet Ball Mill, % 2,3 Tex-116-E ≤ 30 ≤ 35 Max. Increase Passing
No. 40, % Tex-116-E ≤ 12 ≤ 15
Deleterious Materials, % Tex-413-E ≤1.5 ≤1.5 Confined Compressive Strength (psi)(@15 psi
confining)
Tex-144-E >190 >175
Dielectric Value Tex-144-E <10 <13 Initial Seismic Modulus
(ksi) Tex-147-E > 100 > 80
As shown on the plans
Notes: 1. Use Tex-107-E when the Liquid Limit is unattainable as defined in Tex-104-E.
2. Test material in accordance with Test Method Tex-411-A, when shown on the plans.
3. The wet ball requirements do not apply when lightweight aggregates are specified. Meet the Los Angeles
Abrasion, Pressure Slaking, and Freeze-Thaw requirements of Item 302, “Aggregate for Surface Treatment
(Lightweight),” when shown on the plans.
B. Recycled Materials. When Type D aggregate is shown on the plans, a maximum of
20 percent of recycled materials, including recycled asphalt pavement (RAP) and/or
crushed concrete, will be allowed when Table B1 requirements for the grade specified
are met. Recycled materials in quantities greater than 20 percent will be allowed
when shown on the plans. Recycled materials will be free from other objectionable
material and will have a decantation less than 5.0 precent when tested in accordance
with Test Method Tex-406-A. Recycled material will be crushed or broken such that
100 percent passes a 2 inch sieve. Test RAP without removing the asphalt.
Department-owned recycled material is available to the Contractor only when the

107
location, quantity, and approximate gradation are shown on the plans. Contractor-
owned recycled materials are allowed and remain the property of the Contractor,
while stockpiled. Do not intermingle Contractor-owned recycled material with
Department-owned recycled material. Remove unused Contractor-owned recycled
material from the project site upon completion of the project. Return unused
Department-owned recycled materials to the Department stockpile location designed
by the Engineer.
C. Water. Furnish water meeting the requirements of Item 204, “Sprinkling.” Water
from municipal supplies approved by the State Health Department requires no testing.
Provide test reports of chemical composition when using water from other sources, as
directed.
D. Asphalt. Furnish asphalt or emulsion for tack coat that meets the requirements of
Item 300, “Asphalts, Oils, and Emulsions,” as shown on the plans. When required by
the Engineer, verify that emulsified or cut-back asphalt proposed for use meets the
minimum residual asphalt percentage listed in Item 300, “Asphalts, Oils, and
Emulsions.”
E. Material Sources. When non-commercial sources are utilized, expose the vertical
faces of all strata of material proposed for use. Secure and process the material by
successive vertical cuts extending through all exposed strata, unless otherwise
directed.
245.3 Equipment. Provide approved machinery, tools, and equipment necessary for proper
execution of the work. Maintain in satisfactory working condition.
A. Pugmill. Provide a pugmill or mixer that will combine all aggregate sizes at the
required moisture into a uniform product to reduce segregation.

108
B. Spreaders. Provide a hot-mix paver or base laydown machine that will spread the
base material in a uniform layer. When shown on the plans, equip spreaders with
electronic grade controls.
C. Compaction Equipment. Provide rollers in accordance with Item 210, “Rolling.”
D. Weighing and Measuring Equipment. Provide weighing and measuring equipment
that meets the requirements of Item 520, “Weighing and Measuring Equipment.”
245.4 Construction. Construct a uniform course, free of loose or segregated areas, with
required compaction and moisture content producing a smooth surface that conforms to the
typical sections, lines, and grades as shown on the plans or as directed.
Stockpile base material temporarily at an approved location before delivery to the roadway.
Build stockpiles in layers no greater than 2 ft thick. Stockpiles must have a total height between
10 and 16 ft unless otherwise shown on the plans. After construction and acceptance of the
stockpile, loading from the stockpile for delivery is allowed. Load by making successive vertical
cuts through the entire depth of the stockpile.
Do not add or remove material from temporary stockpiles that require sampling and testing
before unless otherwise approved. Charges for additional sampling and testing required as a
result of adding or removing material will be deducted at the rate shown on the plans from the
Contractor’s estimates.
A. Production. Prepare the final aggregate base in a pugmill capable of combining all
sieve sizes at the same time to produce a uniform, non-segregated product.
B. Delivery. Haul approved aggregate base material in clean trucks as shown on the
plans.
1. Roadway Delivery. Deliver the required quantity to each 100 ft station. Process
or manipulate in accordance with the applicable bid items.
2. Stockpile Delivery. Prepare the stockpile site as directed. Provide and deliver the
required quantity of approved base material to the designated stockpile site. Build

109
stockpiles in layers no greater than 2 ft thick. Stockpiles will have a total height
no less than 10 ft, unless otherwise shown on the plans.
C. Preparation of Subgrade or Existing Subbase. Remove or scarify existing
asphalt concrete pavement in accordance with Item 105, “Removing Stabilized Base
and Asphalt Pavement,” when shown on the plans or as directed. Prior to placing
base, shape the subgrade and existing subbase to conform to the typical sections as
shown on the plans or as directed.
When shown on the plans or when directed, proof roll the roadbed in accordance with
Item 216, “Proof Rolling.” Correct soft spots as directed.
D. Placing. Spread and shape the aggregate base into a uniform layer with an approved
spreader, to the depth shown on the plans, the same day as delivered. In the event of
inclement weather or circumstances that render this impractical, spread and shape as
soon as practical. Control dust by sprinkling, as directed. Correct or replace
segregated areas as directed. Replace these areas with well-graded material at no
additional expense to the Department, as directed. Measure layer thickness in
accordance with Test Method Tex-140-E, as directed. Correct locations with a
thickness deficient by more than ½ in. by scarifying, adding material as required,
reshaping, recompacting, and refinishing.
Place successive base courses and finish courses using the same construction methods
required for the first course.
E. Establishing Rolling Pattern. Designate a test section at least 500 ft in length and
the width of the pavement for establishing a rolling pattern. Spread and shape the
aggregate base in a uniform layer to the depth of the first course. When necessary,
sprinkle the material in accordance with Item 204, “Sprinkling.” Roll and compact
the entire test section in the proposed method and pattern.

110
Measure the density, in accordance with Tex-115-E, and the in-place modulus, in
accordance to Tex-148-E, once the proposed rolling pattern is completed. The design
density is 100 percent of Tex-113-E and the design modulus requirements are
specified in Table B1. If 100 percent of the required density and modulus is
achieved, use the amount of compactive effort and sprinkling from this rolling pattern
for the rest of the project. If the required density and modulus fail the requirement,
increase the compactive effort and adjust the sprinkling as needed, until both
requirements are achieved.
F. Compaction. Compact using “Density Control” unless otherwise shown on plans.
Begin rolling longitudinally at the sides and proceed toward the center, overlapping
on successive trips by at least one-half the width of the roller unit. On super-elevated
curves, begin rolling at the low side and progress toward the high side. Offset
alternate trips of the roller. Operate rollers at a speed between 2 and 6 mph, as
directed.
Rework, recompact, and refinish materials that fail to meet compaction requirement.
Replace with new base that meets specification requirements, as directed. Repeat
compaction operations. Continue work until specification requirements are met.
Perform the work at no additional expense to the Department.
1. Density Control. Compact base to at least 100 percent of the maximum density
determined by Tex-113-E unless otherwise shown on plans. Determine the
moisture content at the beginning and after compaction in accordance with Tex-
103-E. In cases of disputes the sand cone method may be used as an alternative
density measuring test.
The Engineer may accept the section if no more than one of the five most recent
density tests is below the specified density and the failing tests are not less than
98 percent of the specified density.

111
2. Modulus Control. Determine the moisture content in the mixture at the
beginning and during compaction in accordance with Test Method Tex-103-E.
Compact to achieve a modulus of at least 100 percent of the initial modulus
determined by Test Method Tex-147-E, Part II, unless otherwise shown on the
plans. The Engineer will determine roadway modulus of completed sections in
accordance with Test Method Tex-148-E. Measure the modulus at three points in
every 100 ft station of the project. Measure at least three points in cross section at
each third of the station and average the modulus as the result of each point.
Rework, recompact, and refinish or remove and replace areas that do not meet
modulus requirements shown in Table B1 or on the plans.
G. Finishing. Brush and sweep the surface of the final base course. Remove loosened
material and dispose at an approved location. Maintain the shape of the course and
surface in conformity with the typical sections, lines, and grades as shown on the
plans or as directed.
In areas where surfacing is to be placed, correct grade deviations greater than ¼ in. in
16 ft measured longitudinally or greater than ¼ in. over the entire width of the cross
section. Correct by loosening, adding, or removing material reshape and recompact in
accordance with Section 247.E, “Compaction.”
H. Curing. Cure the final section until the moisture content is at least 2 percentage
points below optimum moisture or as directed before applying the next successive
course or prime coat. After curing, apply asphalt material at the rate of 0.05 to 0.20
gal. per sq. yd2 as directed. Use the type and grade of asphaltic material shown on the
plans.
245.5. Measurement. Aggregate base will be measured as follows:
• Aggregate Base (Complete In Place). The ton, square yard, or any cubic yard method.
• Aggregate Base (Roadway Delivery). The ton or cubic yard in vehicle.

112
• Aggregate Base (Stockpile Delivery). The ton, cubic yard in vehicle, or cubic yard in
stockpile.
Measurement by the cubic yard in final position and square yard is a plans quantity
measurement. The quantity to be paid for is the quantity shown in the proposal unless modified
by Article 9.2, “Plans Quantity Measurement.” Additional measurements or calculations will be
made if adjustments of quantities are required.
Measurement is further defined for payment as follows.
Cubic Yard in Vehicle. By the cubic yard in vehicles of uniform capacity at the point of delivery.
Cubic Yard in Stockpile. By the cubic yard in the final stockpile position by the method of
average end areas.
Cubic Yard in Final Position. By the cubic yard in the completed and accepted final position.
The volume of base course is computed in place by the method of average end areas between
the original subgrade or existing base surfaces and the lines, grades, and slopes of the
accepted base course as shown on the plans.
Square Yard. By the square yard of surface area in the completed and accepted final position.
The surface area of the base course is based on the width of flexible base as shown on the
plans.
Ton. By the ton of dry weight in vehicles as delivered. The dry weight is determined by
deducting the weight of the moisture in the material at the time of weighing from the gross
weight of the material. The Engineer will determine the moisture content in the material in
accordance with Tex-103-E from samples taken at the time of weighing.
When material is measured in trucks, the weight of the material will be determined on certified
scales, or the Contractor must provide a set of standard platform truck scales at a location
approved by the Engineer. Scales must conform to the requirements of Item 520, “Weighing and
Measuring Equipment.”
245.6. Payment. The work performed and materials furnished in accordance with this Item and
measured as provided under “Measurement” will be paid for at the unit price bid for the types of

113
work shown below. No additional payment will be made for thickness or width exceeding that
shown on the typical section or provided on the plans for cubic yard in the final position or
square yard measurement.
Sprinkling and rolling, except proof rolling, will not be paid for directly but will be subsidiary to
this Item unless otherwise shown on the plans. When proof rolling is shown on the plans or
directed, it will be paid for in accordance with Item 216, “Proof Rolling.”
Where subgrade is constructed under this Contract, correction of soft spots in the subgrade will
be at the Contractor’s expense. Where subgrade is not constructed under this project, correction
of soft spots in the subgrade will be paid in accordance with pertinent Items or Article 4.2,
“Changes in the Work.”
Aggregate Base (Complete In Place). Payment will be made for the type and grade specified. For
cubic yard measurement, “In Vehicle,” “In Stockpile,” or “In Final Position” will be
specified. For square yard measurement, a depth will be specified. This price is full
compensation for furnishing materials, temporary stockpiling, assistance provided in
stockpile sampling and operations to level stockpiles for measurement, loading, hauling,
delivery of materials, spreading, blading, mixing, shaping, placing, compacting, reworking,
finishing, correcting locations where thickness is deficient, curing, furnishing scales and
labor for weighing and measuring, and equipment, labor, tools, and incidentals.
Aggregate Base (Roadway Delivery). Payment will be made for the type and grade specified. For
cubic yard measurement, “In Vehicle” will be specified. The unit price bid will not include
processing at the roadway. This price is full compensation for furnishing materials,
temporary stockpiling, assistance provided in stockpile sampling, and operations to level
stockpiles for measurement, loading, hauling, delivery of materials, furnishing scales and
labor for weighing and measuring, and equipment, labor, tools, and incidentals.
Aggregate Base (Stockpile Delivery). Payment will be made for the type and grade specified. For
cubic yard measurement, “In Vehicle” or “In Stockpile” will be specified. The unit price bid
will not include processing at the roadway. This price is full compensation for furnishing and
disposing of materials, preparing the stockpile area, temporary or permanent stockpiling,
assistance provided in stockpile sampling and operations to level stockpiles for measurement,

114
loading, hauling, delivery of materials to the stockpile, furnishing scales and labor for
weighing and measuring, and equipment, labor, tools, and incidentals.