heavy metal characterization of chinese spices and … · the measurements were performed using a...
TRANSCRIPT
Heavy metal characterization of Chinese spices and herbs using GFAAS and CVAAS
P. Sarojam1, D. Hoult2 & J.-M. Chen3 1PerkinElmer Inc., India 2PerkinElmer Inc., U.K 3PerkinElmer Inc., China
Abstract
Heavy metals have important positive and negative roles in human life. Some heavy metals are considered essential, and these include iron, zinc and copper, while some other metals such as mercury, cadmium, lead and arsenic have toxic roles in biochemical reactions of our body. The addition of spices, which may be contaminated with trace and heavy metals, to food as a habit may result in the accumulation of these metals in human organs. India and China have a high diversity of plants used as spices, herbs, and traditional medicines. Several herbs and spices are either produced on small farmlands or are grown naturally in different regions. There is often little information available about the safety of those plants and their products in respect to heavy metal contamination. Due to the significant amount of spices consumed, it is important to know the toxic metal contents in these spices. The objective of this work is two-fold: (1) to accurately analyze the levels of toxic heavy metals like mercury, lead, cadmium, arsenic that may be present in some major spice brands available in the local markets in China, by using graphite furnace atomic absorption spectrophotometry (GFAAS), cold vapor atomic absorption spectrophotometry (CVAAS) with confirmation by inductively coupled plasma mass spectrometry (ICPMS); (2) to cross-reference these measured levels to the recommended limits specified by the U.S.FDA. Keywords: heavy metals, CVAAS, GFAAS, ICPMS, spices, herbs.
1 Introduction
Heavy metals have important positive and negative roles in human life. Some of the heavy metals are considered essential, and these include iron, zinc and
Sustainability Today 221
www.witpress.com, ISSN 1743-3541 (on-line) WIT Transactions on Ecology and The Environment, Vol 167, © 2011 WIT Press
doi:10.2495/ 11ST 0201
copper, while some other metals such as mercury, cadmium, lead and arsenic have toxic roles in biochemical reactions of our body [1]. Spices are dried parts of plants. Together with herbs, these plants grow widely in various regions of the world and have been used for several purposes since ancient times. Most are fragrant, aromatic and pungent and are used for culinary purposes to improve color, aroma, palatability and acceptability of food [2]. In addition, they are also used in folk medicine as antiscorbutic, antispasmodic, and tonic, carminative agents against bronchitis, ulcers and as diuretics etc. Natural food spices, such as pepper and mustard, have been reported to contain significant quantities of some trace metals3. The addition of spices, which may be contaminated with trace and heavy metals, to food as a habit may result in accumulation of these metals in human organs. Exposure to trace and heavy metals above the permissible affects human health and may result in illness to human fetus, abortion and preterm labor, as well as mental retardation to children. Adults also may experience high blood pressure, fatigue and kidney and neurological disorders [3]. Contamination with heavy metals may be accidental (e.g. contamination of environment during plant cultivation) or deliberate – in some cultures, according to traditional belief, specially treated heavy metals are associated with health benefits and are thus an intentional ingredient of traditional remedies. The sources of heavy metals for plants are: rainfall, traffic density, use of oil or fossil fuels for heating, atmospheric dusts, plant protection agents, and fertilizers, which could be adsorbed through leaf blades. In addition, they could be contaminated from various species including trace metals as farmers wash them with wastewater before bringing them to market. Spices and herbal plants contain heavy-metal ions over a wide range of concentrations [4, 5]. India and China have a high diversity of plants used as spices, herbs, and traditional medicines. Several herbs and spices are either produced on small farmlands or naturally grow in different regions. There is often little information available about the safety of those plants and their products in respect to heavy metal contamination. Due to the significant amount of spices consumed, it is important to know the toxic metal contents in these spices [6]. The objective of this work is two-fold: (1) to accurately analyze the levels of toxic heavy metals like mercury, lead, cadmium, arsenic that may be present in some major spice brands available in the local markets in China, by using graphite furnace atomic absorption spectrophotometry (GFAAS), cold vapor atomic absorption spectrophotometry (CVAAS) with confirmation by inductively coupled plasma mass spectrometry (ICPMS); (2) to cross-reference these measured levels to the recommended limits specified by the U.S.FDA.
2 Experimental
The measurements were performed using a PerkinElmer® AAnalyst™ 800 Atomic Absorption Spectrophotometer (Shelton, CT, USA) equipped with the intuitive WinLab32™ for AA (Version 6.5) software, which features all the tools to analyze samples, report and archive data and ensure regulatory compliance.
222 Sustainability Today
www.witpress.com, ISSN 1743-3541 (on-line) WIT Transactions on Ecology and The Environment, Vol 167, © 2011 WIT Press
High-energy electrodeless discharge lamps (EDL) were used for all the elements. The determination of mercury by flow injection cold vapor atomic absorption spectrophotometry (FI-CVAAS) was performed using a PerkinElmer® FIAS-400 system (Shelton, CT, USA). A Multiwave™ 3000 microwave sample-preparation system (PerkinElmer/Anton-Paar) was used for the microwave-assisted digestion. PerkinElmer single-element calibration standards for Atomic Spectroscopy were used as the stock standards for preparing the working standards. Working standards were prepared by serial volume/volume dilution in polypropylene vials (Sarstedt®, Germany). ASTM® Type I water (from a Millipore® filtration system, Millipore®, Corporation, Billerica, Massachusetts, U.S) acidified with 0.2% Suprapur® nitric acid, from Merck® (Darmstadt, Germany) was used as the calibration blank and for all dilutions. The hydrogen peroxide used for sample digestion (30%) was also from Merck®. Chemical modifiers (PerkinElmer) were prepared from stock solutions, by diluting with acidified Millipore® water and were added automatically to each standard, blank and sample by the AS 800 autosampler, an integral part of the AAnalyst 800. Micropipettes (Eppendorf®, Germany) with disposable tips were used for pippetting solutions. NIST® 1573e certified reference material for trace metals in tomato leaves and GBW 10016 certified reference material for trace metals in tea leaves were used to validate the method developed. Multi-element ICP standards for trace metal ions in nitric acid (Spex. Certiprep.®, New Jersey, USA), prepared at concentrations of the midpoint of the calibration curves for different elements, were used as quality control (QC) check standards.
2.1 Sample and certified reference material preparation
Four branded powdered spices and herbs samples available in China (five-spice mix, ground szechuan, five-spice powder and curry powder), bought from a local Chinese supermarket, were used for the analysis. Approx. 0.5 g of each sample, accurately weighed in duplicate, was transferred to the digestion vessels of the microwave digestion system and the sample digestion was done in accordance with the program given in Table 1. The digested samples were diluted with 0.2% HNO3 and made up to 20 mL in polypropylene vials. Preservation of mercury has been done as per the U.S. EPA method for the preservation of lower
Table 1: Program used for the digestion of spices and herbs with Multiwave 3000.
Sequence Power Ramp Time (min) Hold Time (min) Fan 1 1200 15 15 1 2 0 0 15 3
Weight Taken ~500 mg HNO3 5.0 mL H2O2 1.0 mL Rate 0.5 bar/sec
Pressure 55 Bars
Sustainability Today 223
www.witpress.com, ISSN 1743-3541 (on-line) WIT Transactions on Ecology and The Environment, Vol 167, © 2011 WIT Press
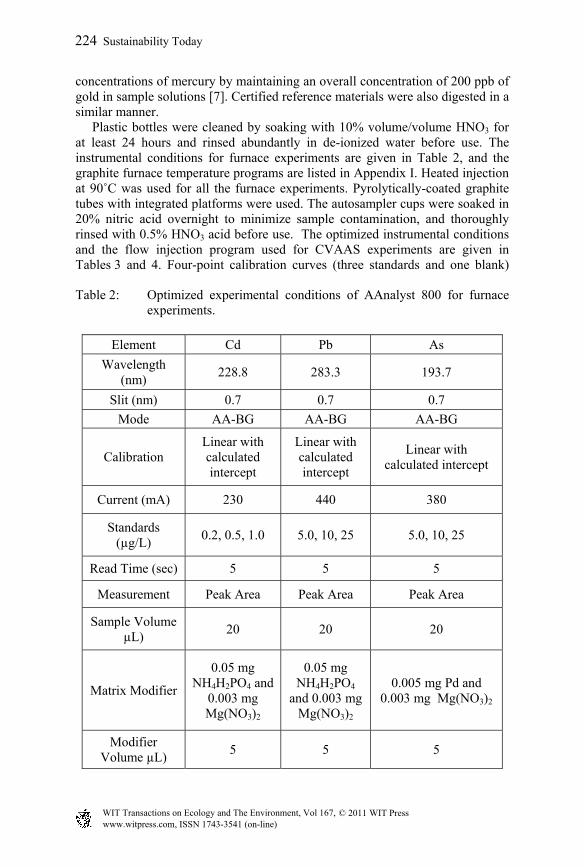
concentrations of mercury by maintaining an overall concentration of 200 ppb of gold in sample solutions [7]. Certified reference materials were also digested in a similar manner. Plastic bottles were cleaned by soaking with 10% volume/volume HNO3 for at least 24 hours and rinsed abundantly in de-ionized water before use. The instrumental conditions for furnace experiments are given in Table 2, and the graphite furnace temperature programs are listed in Appendix I. Heated injection at 90˚C was used for all the furnace experiments. Pyrolytically-coated graphite tubes with integrated platforms were used. The autosampler cups were soaked in 20% nitric acid overnight to minimize sample contamination, and thoroughly rinsed with 0.5% HNO3 acid before use. The optimized instrumental conditions and the flow injection program used for CVAAS experiments are given in Tables 3 and 4. Four-point calibration curves (three standards and one blank)
Table 2: Optimized experimental conditions of AAnalyst 800 for furnace experiments.
Element Cd Pb As
Wavelength (nm) 228.8 283.3 193.7
Slit (nm) 0.7 0.7 0.7
Mode AA-BG AA-BG AA-BG
Calibration Linear with calculated intercept
Linear with calculated intercept
Linear with calculated intercept
Current (mA) 230 440 380
Standards (µg/L) 0.2, 0.5, 1.0 5.0, 10, 25 5.0, 10, 25
Read Time (sec) 5 5 5
Measurement Peak Area Peak Area Peak Area
Sample Volume µL) 20 20 20
Matrix Modifier
0.05 mg NH4H2PO4 and
0.003 mg Mg(NO3)2
0.05 mg NH4H2PO4
and 0.003 mg Mg(NO3)2
0.005 mg Pd and 0.003 mg Mg(NO3)2
Modifier Volume µL) 5 5 5
224 Sustainability Today
www.witpress.com, ISSN 1743-3541 (on-line) WIT Transactions on Ecology and The Environment, Vol 167, © 2011 WIT Press
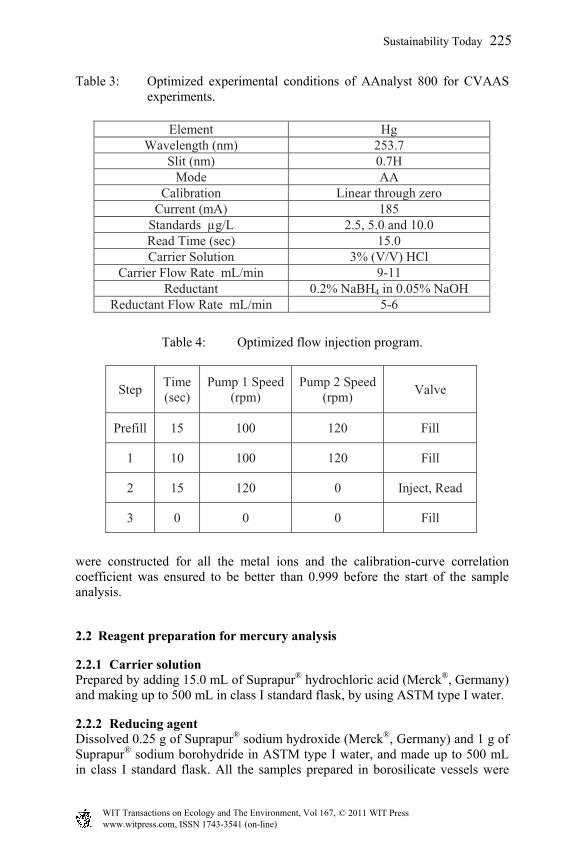
Table 3: Optimized experimental conditions of AAnalyst 800 for CVAAS experiments.
Table 4: Optimized flow injection program.
were constructed for all the metal ions and the calibration-curve correlation coefficient was ensured to be better than 0.999 before the start of the sample analysis.
2.2 Reagent preparation for mercury analysis
2.2.1 Carrier solution Prepared by adding 15.0 mL of Suprapur® hydrochloric acid (Merck®, Germany) and making up to 500 mL in class I standard flask, by using ASTM type I water.
2.2.2 Reducing agent Dissolved 0.25 g of Suprapur® sodium hydroxide (Merck®, Germany) and 1 g of Suprapur® sodium borohydride in ASTM type I water, and made up to 500 mL in class I standard flask. All the samples prepared in borosilicate vessels were
Element Hg Wavelength (nm) 253.7
Slit (nm) 0.7H Mode AA
Calibration Linear through zero Current (mA) 185
Standards μg/L 2.5, 5.0 and 10.0 Read Time (sec) 15.0 Carrier Solution 3% (V/V) HCl
Carrier Flow Rate mL/min 9-11 Reductant 0.2% NaBH4 in 0.05% NaOH
Reductant Flow Rate mL/min 5-6
Step Time (sec)
Pump 1 Speed (rpm)
Pump 2 Speed (rpm) Valve
Prefill 15 100 120 Fill
1 10 100 120 Fill
2 15 120 0 Inject, Read
3 0 0 0 Fill
Sustainability Today 225
www.witpress.com, ISSN 1743-3541 (on-line) WIT Transactions on Ecology and The Environment, Vol 167, © 2011 WIT Press
stabilized by the addition of 1-2 drops of a 5% weight/volume potassium permanganate solution. Prior to the analyses, the flows of the 0.2% weight/volume sodium borohydride reductant and 3% volume/volume hydrochloric acid carrier solution was adjusted and set at 5-6 mL/minute and 9-11 mL/minute respectively. The argon gas flow was set at about 50-60 mL/minute. The waste flow from the gas-liquid separator was adjusted to the rate such that the liquid leaves the gas-liquid separator effectively, without any of it getting into the transfer tubing to the quartz cell. The sensitivity was checked using a 10 µg/L mercury standard solution. 500 µL sample volume was used in every analysis. The results were obtained using peak height calculation with 2 seconds BOC (baseline offset correction) time and 19-point peak smoothing algorithm. Each result was calculated as a mean of two replicate determinations.
3 Results and discussions
Problems in the digestion of samples for mercury and arsenic determination are volatility, mobility, adsorption on the walls of the containers as well as possibility of contamination [9]. The spice samples contain a number of organic substances of different types and impurities of sparingly soluble mineral components. Incomplete mineralization of samples during the microwave-digestion process may cause difficulty in transferring analytes into solution and, on the other hand, disturb spectrochemical measurements [8]. The complete decomposition of organic matter could be achieved only under vigorous conditions such as excess of acid mixtures, high temperature and pressure, and long digestion times. In addition, oxidative conversion of all mercury species to mercury (II) in the sample is an elementary step prior to analysis [9]. Thus, digestion of the samples was carried out in an oxidizing environment using the combination of nitric acid and hydrogen peroxide. The oxidative conversion of all mercury species to inorganic mercury is further ensured by the addition of potassium permanganate. On the other hand, there is no need to decompose silicates because mercury cannot form natural silicate minerals due to its large ionic radius. The commonly observed interference caused by volatile nitrogen oxide was minimized by using the combination of nitric acid and hydrogen peroxide. However, as our experience shows, preservation using gold will help to hold the mercury in solution so that there is no need to analyze the samples immediately after digestion. Allowing some time (with occasional shaking) before analysis (~1 hour) will help to remove all dissolved nitrogen oxide, if present. Prior to starting sample analysis, the method detection limit (MDL) was measured using seven reagent blanks and then multiplying the standard deviation with the student t value of 3.14 for a confidence interval of 98% (Table 7). The validity of the developed method has been ensured by incorporating various quality control (QC) checks and analysis of certified reference materials (CRMs). The agreement between the certified values and the measured values were excellent which demonstrates the accuracy of the generated calibration as well as the overall accuracy of the developed method (Table 5). The slightly
226 Sustainability Today
www.witpress.com, ISSN 1743-3541 (on-line) WIT Transactions on Ecology and The Environment, Vol 167, © 2011 WIT Press
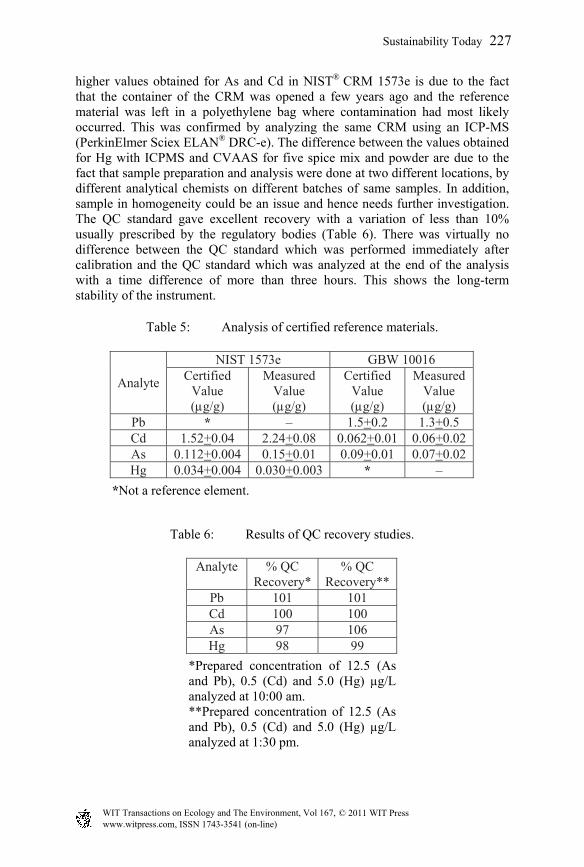
higher values obtained for As and Cd in NIST® CRM 1573e is due to the fact that the container of the CRM was opened a few years ago and the reference material was left in a polyethylene bag where contamination had most likely occurred. This was confirmed by analyzing the same CRM using an ICP-MS (PerkinElmer Sciex ELAN® DRC-e). The difference between the values obtained for Hg with ICPMS and CVAAS for five spice mix and powder are due to the fact that sample preparation and analysis were done at two different locations, by different analytical chemists on different batches of same samples. In addition, sample in homogeneity could be an issue and hence needs further investigation. The QC standard gave excellent recovery with a variation of less than 10% usually prescribed by the regulatory bodies (Table 6). There was virtually no difference between the QC standard which was performed immediately after calibration and the QC standard which was analyzed at the end of the analysis with a time difference of more than three hours. This shows the long-term stability of the instrument.
Table 5: Analysis of certified reference materials.
*Not a reference element.
Table 6: Results of QC recovery studies.
*Prepared concentration of 12.5 (As and Pb), 0.5 (Cd) and 5.0 (Hg) µg/L analyzed at 10:00 am. **Prepared concentration of 12.5 (As and Pb), 0.5 (Cd) and 5.0 (Hg) µg/L analyzed at 1:30 pm.
Analyte
NIST 1573e GBW 10016 Certified
Value (μg/g)
Measured Value (μg/g)
Certified Value (μg/g)
Measured Value (μg/g)
Pb * – 1.5+0.2 1.3+0.5 Cd 1.52+0.04 2.24+0.08 0.062+0.01 0.06+0.02 As 0.112+0.004 0.15+0.01 0.09+0.01 0.07+0.02 Hg 0.034+0.004 0.030+0.003 * –
Analyte % QC Recovery*
% QC Recovery**
Pb 101 101 Cd 100 100 As 97 106 Hg 98 99
Sustainability Today 227
www.witpress.com, ISSN 1743-3541 (on-line) WIT Transactions on Ecology and The Environment, Vol 167, © 2011 WIT Press
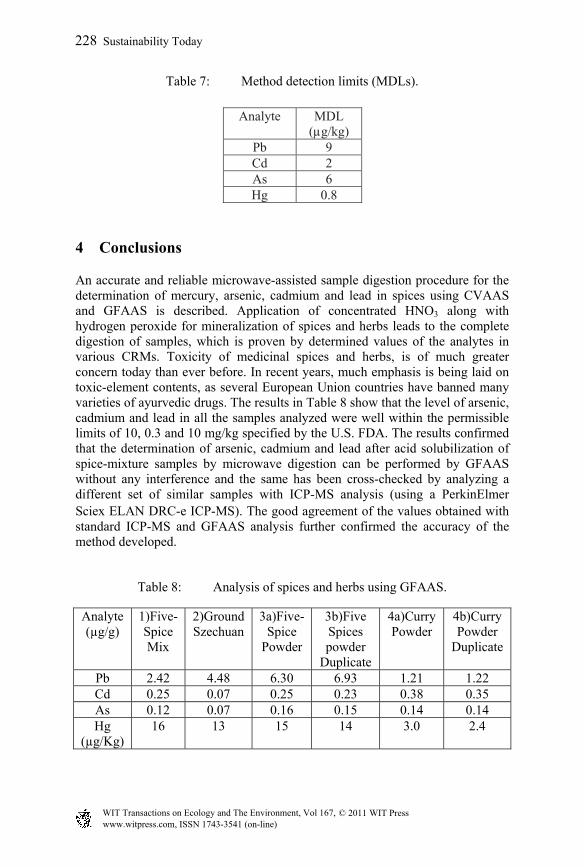
Table 7: Method detection limits (MDLs).
4 Conclusions
An accurate and reliable microwave-assisted sample digestion procedure for the determination of mercury, arsenic, cadmium and lead in spices using CVAAS and GFAAS is described. Application of concentrated HNO3 along with hydrogen peroxide for mineralization of spices and herbs leads to the complete digestion of samples, which is proven by determined values of the analytes in various CRMs. Toxicity of medicinal spices and herbs, is of much greater concern today than ever before. In recent years, much emphasis is being laid on toxic-element contents, as several European Union countries have banned many varieties of ayurvedic drugs. The results in Table 8 show that the level of arsenic, cadmium and lead in all the samples analyzed were well within the permissible limits of 10, 0.3 and 10 mg/kg specified by the U.S. FDA. The results confirmed that the determination of arsenic, cadmium and lead after acid solubilization of spice-mixture samples by microwave digestion can be performed by GFAAS without any interference and the same has been cross-checked by analyzing a different set of similar samples with ICP-MS analysis (using a PerkinElmer
Sciex ELAN DRC-e ICP-MS). The good agreement of the values obtained with standard ICP-MS and GFAAS analysis further confirmed the accuracy of the method developed.
Table 8: Analysis of spices and herbs using GFAAS.
Analyte (µg/g)
1)Five-Spice Mix
2)Ground Szechuan
3a)Five-Spice
Powder
3b)Five Spices powder
Duplicate
4a)Curry Powder
4b)Curry Powder
Duplicate
Pb 2.42 4.48 6.30 6.93 1.21 1.22 Cd 0.25 0.07 0.25 0.23 0.38 0.35 As 0.12 0.07 0.16 0.15 0.14 0.14 Hg
(µg/Kg) 16 13 15 14 3.0 2.4
Analyte MDL (μg/kg)
Pb 9 Cd 2 As 6 Hg 0.8
228 Sustainability Today
www.witpress.com, ISSN 1743-3541 (on-line) WIT Transactions on Ecology and The Environment, Vol 167, © 2011 WIT Press

Table 9: Analysis of spices and herbs using ICP-MS*.
Analyte (µg/g)
Five-Spice Mix
Ground Szechuan
Five-Spice
Powder
Curry Powder
Pb 2.72 4.69 6.04 1.28 Cd 0.11 0.06 0.27 0.26 As 0.19 0.16 0.18 0.31 Hg
(µg/Kg) 38 11 7.0 4.0
*Different set of similar samples measured at a different site.
Appendix I – Graphite furnace temperature program.
Element Step Temp oC Ramp Time (sec)
Hold Time (sec)
Internal Gas Flow (mL/min)
Gas Type
Cd 1 110 1 30 250 Argon 2 130 15 30 250 Argon 3 500 10 20 250 Argon 4 1500 0 5 0 Argon 5 2450 1 3 250 Argon
As 1 110 1 30 250 Argon 2 130 15 30 250 Argon 3 1200 10 20 250 Argon 4 2000 0 5 0 Argon 5 2450 1 3 250 Argon
Pb 1 110 1 30 250 Argon 2 130 15 30 250 Argon 3 850 10 20 250 Argon 4 1600 0 5 0 Argon 5 2450 1 3 250 Argon
References
[1] U. Divrikli, N. Horzum, M. Soylak and L. Elc, International Journal of Food Science and Technology, 41 (2006) 712–716
[2] H. Mubeen, I. Naeem, A. Taskeen and Z. Saddiqe, New York Science Journal, 2 (5) (2009) 1554-0200
[3] L. Järup, British Medical Bulletin, 68 (2003) 167–182 [4] K. K Gupta, S. Bhattacharjee, S. Kar, S. Chakrabarty, P. Thakar, G.
Bhattacharyya and S. C. Srivastava, Comm. Soil Plant Anal., 34 (2003) 681-693.
[5] T. M. Ansari, N. Ikram, M. Najam-ul-Haq, O. Fayyaz, I. Ghafoor and N. Khalid, J. Biol. Sci., 4 (2004) 95-99.
Sustainability Today 229
www.witpress.com, ISSN 1743-3541 (on-line) WIT Transactions on Ecology and The Environment, Vol 167, © 2011 WIT Press
[6] R. P. Choudhury and A. N. Garg, Food Chemistry, 104 (2007) 1454-1463 [7] United States Environmental Protection Agency Mercury preservation
techniques [8] H. Lippo, T. Jauhiainen and P. Peramaki, Atomic Spectroscopy, 18 (3)
(1997) 102-108 [9] I. Baranowska, K. Srogi, A. Włochowicz, K. Szczepanik, Polish Journal of
Environmental Studies, 11( 5) (2002) 467-471
230 Sustainability Today
www.witpress.com, ISSN 1743-3541 (on-line) WIT Transactions on Ecology and The Environment, Vol 167, © 2011 WIT Press