hecla apr13invpres
TRANSCRIPT

K E Y M I L E S T O N E S O R G A N I C G R O W T H H E C L A P R O P E R T I E S C R E A T I N G V A L U E
European Gold Forum
April 2013

H E C L A M I N I N G C O M P A N Y
Cautionary Statements Statements made which are not historical facts, such as anticipated payments, litigation outcome, production, sales of assets, exploration results and plans, prospects and opportunities including reserves, resources, and mineralization, costs, and prices or sales performance are "forward-looking statements" within the meaning of the Private Securities Litigation Reform Act of 1995. Words such as “may”, “will”, “should”, “expects”, “intends”, “projects”, “believes”, “estimates”, “targets”, “anticipates” and similar expressions are used to identify these forward-looking statements. Forward-looking statements involve a number of risks and uncertainties that could cause actual results to differ materially from those projected, anticipated, expected or implied. These risks and uncertainties include, but are not limited to, metals price volatility, volatility of metals production and costs, environmental and litigation risks, operating risks, project development risks, political and regulatory risks, labor issues, ability to raise financing and exploration risks and results. Refer to the company's Form 10-K and 10-Q reports for a more detailed discussion of factors that may impact expected future results. The company undertakes no obligation and has no intention of updating forward-looking statements other than as may be required by law. Cautionary Statements to Investors on Reserves and Resources The United States Securities and Exchange Commission permits mining companies, in their filings with the SEC, to disclose only those mineral deposits that a company can economically and legally extract or produce. We use certain terms on this release, such as “resource,” “other resources,” and “mineralized materials” that the SEC guidelines strictly prohibit us from including in our filings with the SEC. U.S. investors are urged to consider closely the disclosure in our Form 10-K and Form 10-Q. You can review and obtain copies of these filings from the SEC's website at www.sec.gov. Cautionary Note Regarding Non-GAAP measures Total cash cost per ounce of silver and earnings before adjustments represent non-U.S. Generally Accepted Accounting Principles (GAAP) measurements. A reconciliation of earnings before adjustments and total cash cost to cost of sales and other direct production costs and depreciation, depletion and amortization (GAAP) can be found in the Appendix. Industry and Market Data We obtained the market and competitive position data used throughout this offering memorandum from our own research, surveys or studies conducted by third parties and industry or general publications, including from the Gold Fields Mineral Service, the World Gold Council, the Silver Institute, FactSet and Bloomberg. Industry publications and surveys generally state that they have obtained information from sources believed to be reliable, but do not guarantee the accuracy and completeness of such information. While we believe that each of these studies and publications is reliable, neither we nor the initial purchasers have independently verified such data and neither we nor the initial purchasers make any representation as to the accuracy of such information. Similarly, we believe our internal research is reliable but it has not been verified by any independent sources.
Cautionary Statements
2
H E C L A M I N I N G C O M P A N Y
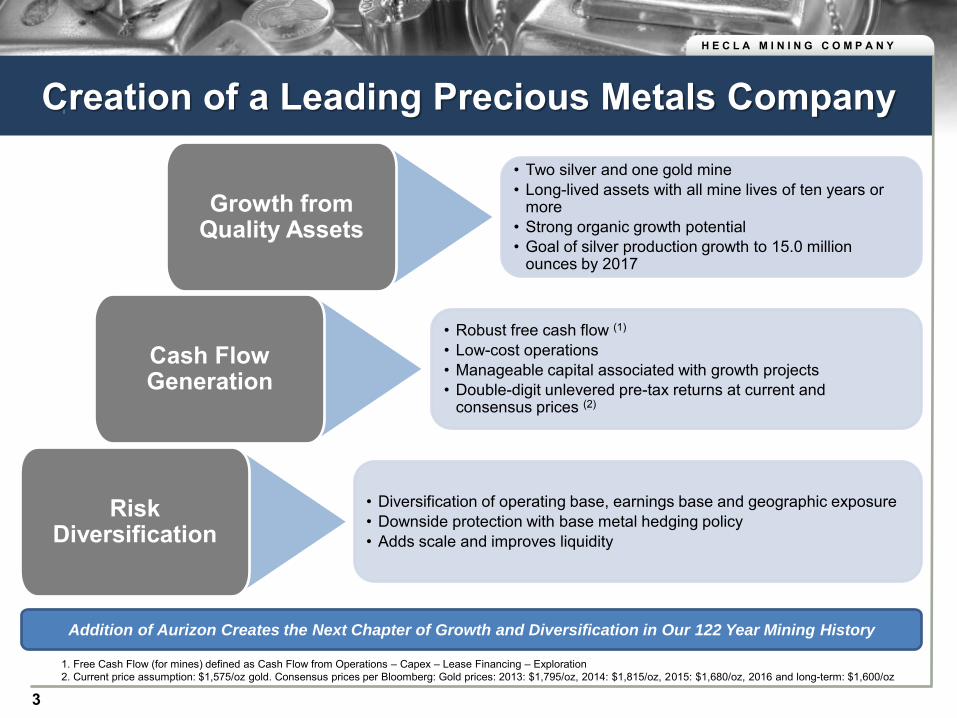
Creation of a Leading Precious Metals Company
• Diversification of operating base, earnings base and geographic exposure • Downside protection with base metal hedging policy • Adds scale and improves liquidity
Risk Diversification
• Robust free cash flow (1)
• Low-cost operations • Manageable capital associated with growth projects • Double-digit unlevered pre-tax returns at current and
consensus prices (2)
Cash Flow Generation
• Two silver and one gold mine • Long-lived assets with all mine lives of ten years or
more • Strong organic growth potential • Goal of silver production growth to 15.0 million
ounces by 2017
Growth from Quality Assets
1. Free Cash Flow (for mines) defined as Cash Flow from Operations – Capex – Lease Financing – Exploration 2. Current price assumption: $1,575/oz gold. Consensus prices per Bloomberg: Gold prices: 2013: $1,795/oz, 2014: $1,815/oz, 2015: $1,680/oz, 2016 and long-term: $1,600/oz
Addition of Aurizon Creates the Next Chapter of Growth and Diversification in Our 122 Year Mining History
3

H E C L A M I N I N G C O M P A N Y
Hecla made a “white knight” bid after a substantial search process was triggered by a hostile bid, which has since been dropped
Casa Berardi, Aurizon’s principal operating mine, is a well-known asset to Hecla, having followed it closely since 2006
Consideration comprised of C$514 million maximum cash and 57 million shares of Hecla common stock
Acquisition by a Plan of Arrangement (the Arrangement) which is like a U.S. merger requiring a 2/3rd approval vote by Aurizon shareholders
Deal protection
Hecla has right to match any competing transaction
Break fee to Hecla of C$27.2 million
Aurizon shareholders meeting to approve the Arrangement and completion of the transaction expected in Q2/2013
Aurizon Acquisition Highlights
4

H E C L A M I N I N G C O M P A N Y
Hecla at a Glance
Historical Production
Silver Equiv: 489.4mm oz
Gold Equiv: 8.3mm oz
2012 Revenue:
US$545 million
1. Reserves as of December 31, 2012. 2. In 2012, production at Lucky Friday was suspended.
Pro forma three 100% owned long-lived, low cost mines 10 years or more of mine life at all
operations All operations located in stable and mining-
friendly jurisdictions – U.S. and Canada Multi-metal production of silver, gold, lead
and zinc with base metals hedging Estimated Ag production of 8-9 million ounces
in 2013, anticipated to grow to 15 million ounces by 2017
On a pro forma basis, Au production in 2012 was 192,000 ounces and is expected to grow to 195,000 by 2014
Pro forma for the Acquisition and Notes offering, Hecla will have modest leverage and maintain a strong liquidity position
Reserves by Metal (1) 2012A Revenue by Metal Pro Forma Operational Statistics
(k oz Ag) (k oz Au)
Aurizon Hecla
Stable Balance Sheet with Growing
Cash Flow Profile 0
100
200
300
400
0
3000
6000
9000
12000
2008A 2009A 2010A 2011A 2012A(2)
5

H E C L A M I N I N G C O M P A N Y
North American Focused Asset Portfolio The New Hecla has assets in 3 of the top 6 mining-friendly jurisdictions
Source: Behre Dolbear’s – 2012 ranking of countries for mining investment
Rank Country
1 Australia
2 Canada
3 Chile
4 Brazil
5 Mexico
6 United States
7 Colombia
8 Botswana
9 Peru
10 Ghana
2012 Rankings of Countries for Mining Investment
36
36
37
39
41
43
45
51
52
57
6

H E C L A M I N I N G C O M P A N Y
Financial Strength
7

H E C L A M I N I N G C O M P A N Y
Multiple Revenue Streams Base Metals Hedging
1. Reserves as of December 31, 2012.
Hecla Standalone Pro Forma
2011 Revenue by Metals
2011 Revenue by Mines
Proven and Probable Reserves(1) Policy is to hedge up to 60% of the next three years’ production of lead and zinc
Locking in revenue to cover costs
Currently, base metals hedging offsets approximately 50% of cash operating costs at Lucky Friday and Greens Creek for next 3 years
100% unhedged exposure to silver and gold
Multi-metal Mining Company with
Revenue from Diverse Sources
8

H E C L A M I N I N G C O M P A N Y
Q1/12 Q2/12 Q3/12 Q4/12 Q4/12 Pro forma
$266
$233 $232
$191
$3321
Strong Balance Sheet Cash and Cash Equivalents
(millions)
9
Note: All monetary amounts presented in millions of dollars. All metrics presented on an unadjusted basis. 1. Includes $500 million from senior notes less $515 million for Aurizon acquisition.

H E C L A M I N I N G C O M P A N Y
Issuer Date Issued Coupon MaturityAmount Raised1
Current Ratings
Hecla 12-Apr-13 6.875% Sr. Notes 1-May-21 $500 B2/B
Coeur 24-Jan-13 7.875% Sr. Notes 1-Feb-21 $300 B2/B+
Eldorado Gold 10-Dec-12 6.125% Sr. Notes 15-Dec-20 $600 Ba3/BB
IAMGOLD Corp. 14-Sep-12 6.750% Sr. Notes 1-Oct-20 $650 Ba/BB-
New Gold 8-Nov-12 6.250% Sr. Notes 15-Nov-22 $500 B2/BB-
2-Apr-12 7.000% Sr. Notes 15-Apr-20 $300 B2/BB-
Allied Nevada Gold 18-May-12 8.750% Sr. Notes 1-Jun-19 $400 B3/B
HudBay Minerals 18-Jan-13 9.500% Sr. Notes 1-Oct-20 $500 B3/B
Senior Notes Overview
Peer Comparison
10
1. In millions Source: Company Reports

H E C L A M I N I N G C O M P A N Y
$0.24
($2.81)
$4.20 $1.91 ($1.46)
$1.15 $2.70
$11.86 $16.59 $10.20 $13.72
$24.16
$34.15 $29.41
$12.10
$13.78 $14.40
$15.63
$22.70
$35.30
$32.11
($5)
$0
$5
$10
$15
$20
$25
$30
$35
$40
2006 2007 2008 2009 2010 2011 2012
$/oz
Cash Cost Per Ounce (1) Cash Margin Realized Silver Price (2)
98%
120% 71% 88%
106%
97% 92%
Low Cash Costs - 2012 Margin of $29.41 Per Ounce
1. Total cash cost per ounce of silver represents a non-U.S. Generally Accepted Accounting Principles (GAAP) measurement. A reconciliation of total cash costs to cost of sales and other direct production costs and depreciation, depletion and amortization (GAAP) can be found in the Appendix.
2. Realized prices are calculated by dividing gross revenues for each metal by the payable quantities of each metal included in the concentrate and doré sold during the period.
Strong Cash Margins
11

H E C L A M I N I N G C O M P A N Y
Strong Cash Margins at Casa Berardi
1. Total cash cost per ounce of gold represents a non-U.S. Generally Accepted Accounting Principles (GAAP) measurement. A reconciliation of total cash costs to cost of sales and other direct production costs and depreciation, depletion and amortization (GAAP) can be found in the Appendix.
2. Realized prices are calculated by dividing gross revenues for each metal by the payable quantities of each metal included in the concentrate and doré sold during the period.
$308 $331 $399 $401
$541 $537
$696
$317 $365
$448 $514
$604
$1,041 $962
$625 $696
$847 $915
$1,145
$1,578 $1,658
$0
$200
$400
$600
$800
$1,000
$1,200
$1,400
$1,600
$1,800
2006 2007 2008 2009 2010 2011 2012
$/oz
Cash Cost Per Ounce (1) Cash Margins Realized Gold Price (2)
51% 52%53%
56%
53%
66%
58%
12

H E C L A M I N I N G C O M P A N Y
191
$694
$268
$193$103
$45
40
$105
$231
0
200
400
600
800
1,000
2009 Ending Cash
EBITDAX Capex Basin Stmt. Expl. & Predev. Others 2012 PF Ending Cash
Cash Flow Generation Adjusted EBITDAX(1)
2009-2012 Cash Bridge(2)
1. Adjusted EBITDAX reconciliation in appendix. 2. Aurizon’s cash of $75 million is net of the cash portion of the transaction after assuming $500 million in notes financing. 3. Includes dividends, Lucky Friday suspension costs and miscellaneous.
Aurizon Hecla
(3)
(US$mm)
(US$mm)
$143
$235 $288
$171
$287
$0
$100
$200
$300
2009A 2010A 2011A 2012A 2012 Pro forma
13
$116
$171
$41
$190
H E C L A M I N I N G C O M P A N Y
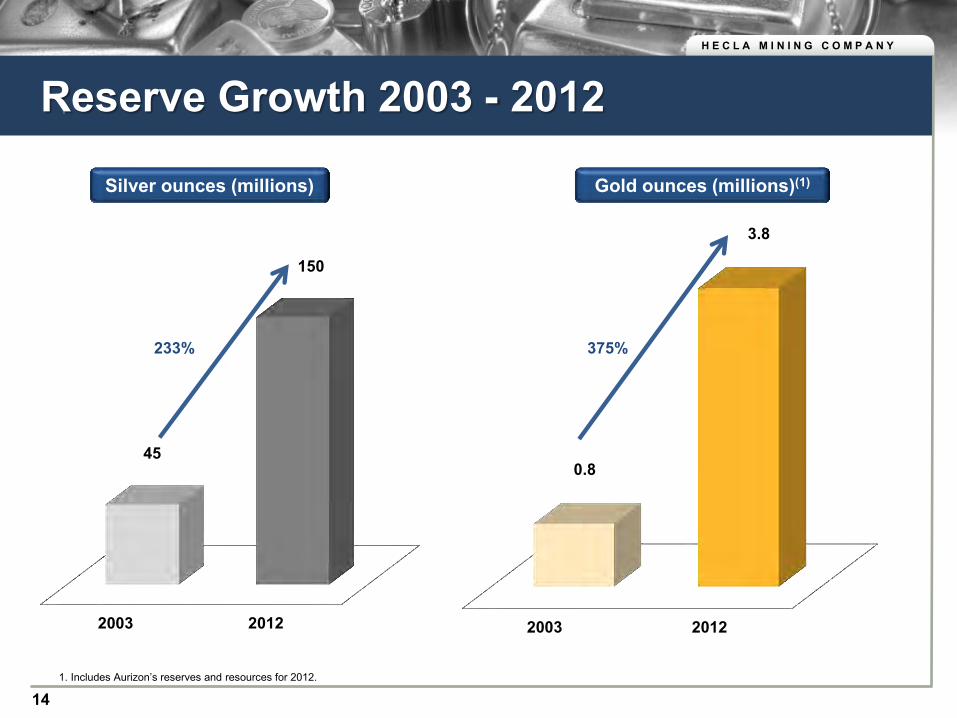
2003 2012
45
150
2003 2012
0.8
3.8
Reserve Growth 2003 - 2012
Silver ounces (millions) Gold ounces (millions)(1)
1. Includes Aurizon’s reserves and resources for 2012.
233% 375%
14

H E C L A M I N I N G C O M P A N Y
2012 2014E
192
195
2012 2017E
6.4
15
Strong, Disciplined Production Growth
Silver ounces (millions) Gold ounces (thousands)(1)
134%
2%
1. Includes Aurizon’s production levels for 2012.
15

H E C L A M I N I N G C O M P A N Y
High Quality Silver and Gold Mines
16

H E C L A M I N I N G C O M P A N Y
Greens Creek Lucky Friday Casa BerardiLocation Alaska Idaho Quebec
Ownership 100% 100% 100%
Primary Metal Ag Ag Au
Primary Metal Grade (oz/t) 12.1 13.4 0.2
Proven and Probable Reserves (mm oz)Au Eq. 3.6 -- 1.5 Ag Eq. 213 92 87
Mine Life (Years) 10+ years 25+ years 10+ years(1)
2013 Metal ProductionAg (mm oz) / Au (koz) 6.0 - 7.0 M oz 2.0 M oz* 125 - 130 koz*
2013 By-Product Cash Cost ($/oz) $3.25/oz $11.00/oz(2) $810/oz
2013 Sustaining Capex (Sustaining Capex) $76 M (~$35 M) $76 M (~$30 M) $102 M (~$30 M)
Proven and Probable Reserves
Gold100%Silver
61%
Lead29%
Zinc10%
Silver44%
Gold20%
Lead10%
Zinc26%
Portfolio of High Quality, Long-Life Assets
1. Based on reserves only 2. Cash costs at Lucky Friday in the second half of 2013 are expected to be
$9.50/oz once the ramp-up is complete. *Lucky Friday and Casa Berardi in transition years
17
2013 Capital (Sustaining Capex)

H E C L A M I N I N G C O M P A N Y
Greens Creek - Low Cost Silver Production
Highlights
One of the largest and lowest-cost primary silver mines in the world
Has produced approximately 200 million ounces of silver and approximately 1.5 million ounces of gold since production commenced in 1989
Expected 2013 silver production of 6-7 million ounces at estimated cash cost of $3.25 per ounce
Mine presently undergoing significant re-investment to extend mine life
CAPEX of $62 million spent in 2012 and $76 million forecast for 2013
Large, under-explored 27-square-mile land position
Location AlaskaOwnership 100%
Metal Composition Ag / Au / Zn / Pb
2013 Silver Prodction 6.0 - 7.0 mm oz
2013 Forecast Cash Costs $3.25/oz
Projected Life of Mine 10+ years
Proven & Probable Reserves (Ag) 94.6Moz
Mineralized Material (Ag) 2.7Moz
Other Resources (Ag) 43.0Moz
18

H E C L A M I N I N G C O M P A N Y
Re-Opened Lucky Friday
Highlights
Operations and production resumed in Q1/13
Conservative and manageable ramp-up through 1st half of year
2 million ounces of silver production expected in 2013 and 3 million in 2014
Expected cash costs of $17.00 per ounce in first half of year, declining to $9.50 per ounce in second half of 2013 for an average cash cost of $11.00 for 2013
State-of-the-art safety initiatives MSHA approvals – release from PPOV Work has resumed on $200 million #4 Shaft
Project Currently 45% complete To provide access to higher grades
Location IdahoOwnership 100%
Metal Composition Ag / Au / Zn / Pb
Expected 2013 Silver Production 2.0+ mm oz
Projected Cash Costs $11.00/oz
Projected Life of Mine 25+ years
Proven and Probable Reserves (Ag) 55.5Moz
Mineralized Material (Ag) 108.7Moz
Other Resources (Ag) 62.7Moz
19

H E C L A M I N I N G C O M P A N Y
050100150200250300350400450500
0
20
40
60
80
100
120
San
Cris
toba
l (50
%)*
Pita
rilla
(SSR
I)*
San
Bar
tolo
me
(CD
E)*
Gre
ens
Cre
ek (H
L)
Pirq
uita
s (S
SRI)*
Ying
(SVM
)
Hua
ron
(PA
A)
Luck
y Fr
iday
(HL)
Palm
arej
o (C
DE)
*
Roc
hest
er (C
DE)
*
La C
olor
ada
(PA
A)
Mor
ococ
ha (P
AA
)
La P
arril
la (F
R)
La E
ncan
tada
(FR
)
San
Vice
nte
(PA
A)
Man
antia
l Esp
ejo
(PA
A)
Ala
mo
Dor
ado
(PA
A)*
Arc
ata
(HO
C)
Palla
ncat
a (H
OC
)
GC
(SVM
)
San
Jose
(HO
C)
San
Luis
(SSR
I)
Silv
er G
rade
- g/
t
Silv
er R
eser
ves
- Moz
Reserves Grades
High Quality Assets Silver Reserves and Grades of Primary Silver Mines
Source: Public filings, *Open pit mines - Palmarejo is both open pit and underground.
Peer-leading Silver Grade Profile Results in Low-cost, High-margin Production
San
Cris
toba
l (SM
M)*
20

H E C L A M I N I N G C O M P A N Y
Casa Berardi - Long-Life Gold Asset
Highlights
Produced 688,000 oz gold at 7.1 g/t from 1988 to 1997
Gold production of 937,100 oz at 7.8 g/t gold since the restart of operations in 2006
Potential to increase processing capacity to 2,400 tpd
High conversion (~65%) of resources to reserves and consistent replacement of mined reserves
Expected to complete shaft deepening project in late 2013
Upside potential with completion of paste back-fill plant (Q3/13) and mill expansion in long-term mine plan
21
Location Western QuebecOwnership 100%
Metal Composition Au
Expected 2013 Production 125 - 130 koz
Estimated 2013 Cash Costs $810/oz
Projected Life of Mine 20+ years
Proven and Probable Reserves (Au) 1.46Moz
2013 Capital Program $102M
10+ years (reserve only)

H E C L A M I N I N G C O M P A N Y
Casa Berardi - Long Section
1
22

H E C L A M I N I N G C O M P A N Y
Exploration and Pre-development Projects
23

H E C L A M I N I N G C O M P A N Y
Organic Growth - San Sebastian (Mexico)
1 KmAndrea Vein
Hugh Zone Middle Vein 185-square-mile land package
Potential extensions to both Middle Vein and Hugh Zone structures
Andrea Vein remains open along strike and at depth
24

H E C L A M I N I N G C O M P A N Y
Longitudinal of Middle Vein
Reserve and Resource Growth - Middle Vein (Mexico)
Middle Vein at San Sebastian defined over 3,000 feet along strike, from surface to over 1,000 feet in depth
New other resources of 8.8 million silver ounces and 45,000 ounces gold appears open along strike
25

H E C L A M I N I N G C O M P A N Y
New Quebec Gold Exploration Projects
Gold producer and exploration portfolio in western Quebec
Heva and Hosco West extension and the Joanna Hosco Pit Large in-pit gold resource at Hosco Additional gold resources at Heva
and Hosco West Extension Attractive exploration potential
Significant exploration portfolio Portfolio of other earlier stage projects
and investments
1. Based on only Casa Berardi reserves as of December 31, 2012
26
H E C L A M I N I N G C O M P A N Y
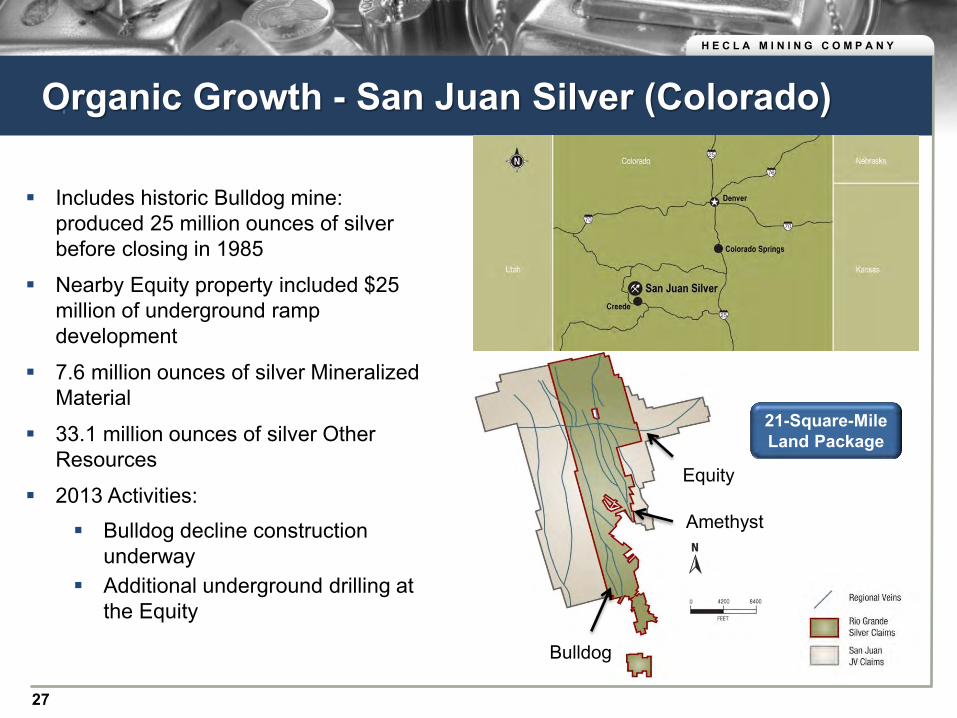
Organic Growth - San Juan Silver (Colorado)
Includes historic Bulldog mine: produced 25 million ounces of silver before closing in 1985
Nearby Equity property included $25 million of underground ramp development
7.6 million ounces of silver Mineralized Material
33.1 million ounces of silver Other Resources
2013 Activities: Bulldog decline construction
underway Additional underground drilling at
the Equity
Bulldog
Equity
Amethyst
21-Square-Mile Land Package
27

H E C L A M I N I N G C O M P A N Y
Strong Precious Metals Fundamentals
28

H E C L A M I N I N G C O M P A N Y
Silver - The Metal of This Age Has the highest electrical conductivity of all the metals
80% more conductive than aluminum
50% more conductive than gold, 6% more conductive than copper
Critically important in the miniaturization of circuits as electronic items become increasingly compact and users expect more power or utility
Has superior thermal conductivity
Transfers heat efficiently; doesn’t overheat
Highest reflectivity (94%) in visible light of the metals
Gold 72%, Aluminum 92%
Source – The Silver Institute 2011 29

H E C L A M I N I N G C O M P A N Y
Silver Consumption per Capita
United States
China India
Japan Germany
South Korea
-
0.10
0.20
0.30
0.40
0.50
0.60
0.70
0.80
(10,000) 10,000 30,000 50,000 70,000
Silv
er O
unce
Per
Cap
ita
1990 GDP Per Capita (2000 US$)
United States
China India
Japan
Germany
South Korea
-
0.10
0.20
0.30
0.40
0.50
0.60
0.70
0.80
(10,000) 10,000 30,000 50,000 70,000
Silv
er O
unce
Per
Cap
ita
2010 GDP Per Capita (2000 US$)
Increasing Silver Consumption Per Person in China and India
30

H E C L A M I N I N G C O M P A N Y
100% Precious Metals Exposure… Historical Silver Price
Historical Gold Price
$-
$10.00
$20.00
$30.00
$40.00
$50.00
Silv
er P
rice
Per O
unce
$- $200 $400 $600 $800
$1,000 $1,200 $1,400 $1,600 $1,800 $2,000
Gol
d Pr
ice
Per O
unce
Gold Mine production has peaked with
completion of most large-scale projects Supply-demand fundamentals remain
favorable due to lack of quality gold mines
Weakening U.S. dollar; continued quantitative easing bodes well for gold prices
31
Silver Mine production increased 40% over
the past 20 years to 700 million ounces Modern/technology-driven demand up
78% in same period to nearly 500 million ounces – nearly half of the total world demand
Limited exploration in the past 20 years

H E C L A M I N I N G C O M P A N Y
Free Cash Flow
Secure Multiple Revenue Streams
1 2
3
4
6
7
Established Work Force with Commitment to
Safety
Operating in Low Political
Risk Jurisdictions
Strong Investment Fundamentals Pro Forma
Led by a management team with over 150 years of experience, Hecla is a multi-metal and operationally diversified
company, operating low-cost mines in stable jurisdictions, generating strong and growing cash flow.
Low R
isk, Stable Operations St
rong
Cas
h Fl
ow G
ener
atio
n
Portfolio of Three High Quality,
Long-Life Operations
High Cash
Margins Growth and Strong Credit
Strong Financial Position
5
32

K E Y M I L E S T O N E S O R G A N I C G R O W T H H E C L A P R O P E R T I E S C R E A T I N G V A L U E
Appendix

H E C L A M I N I N G C O M P A N Y
Seasoned Management Team with Significant Experience
Phillips S. Baker, Jr., has 15+ years of mining experience. He was previously VP and CFO of Battle Mountain Gold Company and before that was CFO at Pegasus Gold Inc.
James A. Sabala, has 30+ years mining experience. James was previously executive VP and CFO at Coeur d’Alene Mines and VP and CFO of Stillwater Mining.
Lawrence P. Radford, has 30+ years mining experience. He previously worked for Kinross Gold as VP of South American operations overseeing the La Coipa and Maricunga mines.
Dr. Dean W.A. McDonald, is a geologist with over 30+ years experience. He was previously VP of Exploration for Committee Bay Resources Ltd. and exploration manager at Miramar Mining Company.
David C. Sienko, was appointed VP and General Counsel in 2010. Prior to working at Hecla, he was a partner of K&L Gates LLP and its predecessor, Bell, Boyd & Lloyd, LLP, where he specialized in counseling public and private entities on securities compliance, M&A, and corporate governance.
Don Poirier, has 20+ years of mining experience. Prior to joining Hecla, Mr. Poirier was a mining analyst with Blackmont Capital from 2002-2007. Don held other mining analyst positions from 1988 to 2002.
President and CEO
Senior VP and CFO
VP - Operations
VP - Exploration
VP - Corporate
Development
VP - General
Counsel
Over 150 Years of Combined Experience
34

H E C L A M I N I N G C O M P A N Y
35
Notes to Unaudited Pro Forma Financial Statements
The unaudited pro forma condensed combined financial statements and notes have been prepared based on historical financial statements of Hecla and Aurizon to assist shareholders in analyzing the potential financial results of the combined company. The Arrangement is accounted for as a business combination. The unaudited pro forma condensed combined financial statements are prepared on that basis, and are presented to give effect to the acquisition of all of the outstanding common shares of Aurizon by Hecla. The unaudited pro forma condensed combined financial statements represent the combined company’s unaudited pro forma condensed combined balance sheet as of December 31, 2012, and unaudited pro forma condensed combined statement of operations for the year ended December 31, 2012. The unaudited pro forma condensed combined balance sheet gives effect to the acquisition as if it occurred on the date of such balance sheet. The accompanying unaudited pro forma condensed combined statement of operations gives effect to the acquisition as if it occurred on January 1, 2012. Historical information for Hecla has been derived from historical financial statements, which were prepared and presented in accordance with United States Generally Accepted Accounting Principles (“U.S. GAAP”). Aurizon’s historical consolidated financial statements are presented in Canadian dollars and were prepared in accordance with International Financial Reporting Standards (“IFRS”), which differs in certain respects from U.S. GAAP. As described in the notes to Aurizon’s financial statements and the notes to these unaudited pro forma condensed combined financial statements, Aurizon’s historical financial statements were adjusted to be presented under U.S. GAAP, were translated from CAD$ to US$, and were adjusted to conform to Hecla’s accounting policies and presentation. The unaudited pro forma condensed combined financial statements are not necessarily indicative of the operating results or financial condition that would have been achieved if the Arrangement had been completed on the dates or for the periods presented, nor do they purport to project the results of operations or financial position of the combined entities for any future period or as of any future date. Actual amounts recorded upon consummation of the Arrangement will likely differ from those recorded in the unaudited pro forma condensed combined financial statements. The unaudited pro forma condensed combined financial statements do not reflect any special items such as integration costs or operating synergies that may be realized as a result of the Arrangement. The pro forma adjustments and allocations of the estimated consideration transferred are based in part on preliminary estimates of the fair value of assets to be acquired and liabilities to be assumed. As of the date of this Management Proxy Circular, the Arrangement has not yet been completed. The final determination of the consideration transferred and the related allocation will be completed after asset and liability valuations are finalized as of the date of completion of the Arrangement. Changes to these adjustments may affect both the estimated value of the consideration transferred and the allocation of that value to the assets and liabilities as presented in the unaudited pro forma condensed combined financial statements. In preparing the unaudited pro forma condensed combined balance sheet and statement of operations in accordance with U.S. GAAP, the following historical information was used: Aurizon’s balance sheet as of December 31, 2012 included in their Annual Report for 2012 and prepared in accordance with IFRS; Aurizon’s statement of comprehensive income for the year ended December 31, 2012 included in their Annual Report for 2012 and prepared in accordance with IFRS; Hecla’s consolidated balance sheet as of December 31, 2012 filed on Form 10-K for the year ended December 31, 2012 and prepared in accordance with U.S. GAAP; and Hecla’s consolidated statement of operations and comprehensive income for the year ended December 31, 2012 filed on Form 10-K for the year ended December 31, 2012 and prepared in accordance with U.S. GAAP. The unaudited pro forma condensed combined balance sheet and statement of operations should be read in conjunction with the historical financial statements including the notes thereto, as listed above, which are incorporated by reference herein. The significant accounting policies used in preparing the unaudited pro forma condensed combined financial statements are set out in Hecla’s consolidated financial statements filed on Form 10-K for the year ended December 31, 2012. Amounts in these unaudited pro forma condensed combined financial statements and notes are presented in U.S. dollars (“US$” or “$”) unless otherwise indicated.

H E C L A M I N I N G C O M P A N Y
Hecla Total Cash Cost GAAP Reconciliation
1. Cash cost per ounce of silver represents a non-U.S. Generally Accepted Accounting Principles (GAAP) measurement that the Company believes provide management and investors an indication of net cash flow. Management also uses this measurement for the comparative monitoring of performance of mining operations period-to-period from a cash flow perspective. “Total cash cost per ounce” is a measure developed by mining companies in an effort to provide a comparable standard; however, there can be no assurance that our reporting of this non-GAAP measure is similar to that reported by other mining companies. Cost of sales and other direct production costs and depreciation, depletion and amortization, was the most comparable financial measures calculated in accordance with GAAP to total cash costs.
2. Various accidents and other events resulted in temporary suspensions of production at the Lucky Friday unit during 2011 and throughout 2012. See the Lucky Friday Segment section for more further discussion of these events. Care-and-maintenance, mine rehabilitation, investigation, and other costs incurred during the suspension periods not related to production have been excluded from total cash costs and the calculation of total cash cost per ounce produced.
Reconciliation of Cash Costs per Ounce to Generally Accepted Accounting Principles (GAAP)
(dollars and ounces in thousands, except per ounce - unaudited) (dollars and ounces in thousands, except per ounce - unaudited)
2012 2011 2010 2009 2008 2007 2006
Total cash costs(1)17,262$ 10,934$ (15,435)$ 20,958$ 36,621$ (15,873)$ 1,329$
Divided by silver ounces produced 6,394 9,483 10,566 10,989 8,709 5,643 5,510 Total cash cost per ounce produced 2.70$ 1.15$ (1.46)$ 1.91$ 4.20$ (2.81)$ 0.24$
Reconciliation to GAAP:
Total cash costs 17,262$ 10,934$ (15,435)$ 20,958$ 36,621$ (15,873)$ 1,329$
Depreciation, depletion and amortization 43,522$ 47,066$ 60,011$ 62,837$ 35,207$ 12,323$ 11,757$
Treatment costs (73,355)$ (99,019)$ (92,144)$ (80,830)$ (70,776)$ (27,617)$ (33,523)$
By- products credits 190,916$ 254,372$ 267,272$ 206,608$ 164,963$ 112,079$ 86,216$ Change in product inventory (1,381)$ (4,805)$ 3,660$ 310$ 20,254$ (1,261)$ 1,278$ Suspension-related costs(2) -$ 4,135$ -$ -$ -$ -$ -$ Reclamation, severance and other costs 663$ (44)$ 630$ 1,596$ 537$ 203$ 190$
Costs of sales and other direct production costs and depreciation, depletion and amortization (GAAP) 177,627$ 212,639$ 223,994$ 211,479$ 186,806$ 79,854$ 67,247$
36

H E C L A M I N I N G C O M P A N Y
Aurizon Total Cash Cost GAAP Reconciliation
1. Cash cost per ounce of silver represents a non-U.S. Generally Accepted Accounting Principles (GAAP) measurement that the Company believes provide management and investors an indication of net cash flow. Management also uses this measurement for the comparative monitoring of performance of mining operations period-to-period from a cash flow perspective. “Total cash cost per ounce” is a measure developed by mining companies in an effort to provide a comparable standard; however, there can be no assurance that our reporting of this non-GAAP measure is similar to that reported by other mining companies. Cost of sales and other direct production costs and depreciation, depletion and amortization, was the most comparable financial measures calculated in accordance with GAAP to total cash costs.
Reconciliation of Cash Costs per Ounce to Generally Accepted Accounting Principles (GAAP)
(dollars and ounces in thousands, except per ounce - unaudited)
2012 2011 2010 2009 2008 2007 2006
Cash Operating Costs (1) US$000 93,259$ 88,711$ 75,713$ 63,869$ 63,602$ 53,099$ 2,120$ Divided by gold ounces sold 133,990 165,250 139,950 159,275 159,404 160,600 6,882
Total cash cost per ounce sold US$/oz 696$ 537$ 541$ 401$ 399$ 331$ 308$
Reconciliation to GAAP:
Cash Operating Costs US$000 93,259$ 88,711$ 75,713$ 63,869$ 63,602$ 53,099$ 2,120$
Average US$/C$ exchange rate 1.000$ 0.989$ 1.030$ 1.140$ 1.070$ 1.075$ 1.150$
Cash Operating Costs C$000 93,259$ 87,735$ 77,984$ 72,811$ 68,054$ 57,081$ 2,438$
Less: Silver by-product credits (990)$ (1,063)$ (679)$ (668)$ (551)$ (392)$ -$ Less: Depreciation and amortization (37,539)$ (38,927)$ (34,288)$ (36,514)$ (35,582)$ (30,120)$ (500)$
Costs of sales and other direct production costs and C$000
depreciation, depletion and amortization (GAAP) 131,788$ 127,725$ 112,951$ 109,993$ 104,187$ 87,593$ 2,937$
37

H E C L A M I N I N G C O M P A N Y
Portfolio of Three High Quality, Long-Life Operations
Substantial Reserve and Resource Base Provides Future Stability
38
Proven ReservesTons Silver Gold Lead Zinc Silver Gold Lead Zinc Silver Eq. Gold Eq.
Location Ownership ('000's) (oz/ton) (oz/ton) % % (mm oz) (mm oz) (kt) (kt) (mm oz) (mm oz)Greens Creek United States 100.0% 12 9.3 0.10 2.7 7.8 0.1 0.0 0.3 0.9 0.28 0.0 Lucky Friday United States 100.0% 2,207 12.1 -- 7.4 2.7 26.8 -- 163.4 58.6 44.5 0.75 Casa Berardi Canada 100.0% 1,117 -- 0.19 -- -- -- 0.2 -- -- 11.4 0.2 Joanna Dev. Property Canada 100.0% 31,640 -- 0.04 -- -- -- 1.2 -- -- 70.2 1.2 Total 34,975 26.9 1.4 163.7 59.5 126.4 2.1
Probable ReservesTons Silver Gold Lead Zinc Silver Gold Lead Zinc Silver Eq. Gold Eq.
Location Ownership ('000's) (oz/ton) (oz/ton) % % (mm oz) (mm oz) (kt) (kt) (mm oz) (mm oz)Greens Creek United States 100.0% 7,846 12.0 0.09 3.4 9.0 94.5 0.7 267.4 702.3 212.7 3.6 Lucky Friday United States 100.0% 1,931 14.8 -- 8.7 3.2 28.7 -- 167.4 62.3 47.0 0.8 Casa Berardi Canada 100.0% 8,080 -- 0.18 -- -- -- 1.3 -- -- 75.21 1.3 Joanna Dev. Property Canada 100.0% 14,392 -- 0.04 -- -- -- 0.5 -- -- 28.21 0.5 Total 32,248 123.2 2.5 434.8 764.6 363.2 6.1
Proven and Probable ReservesSilver Gold Lead Zinc Silver Gold Lead Zinc Silver Eq. Gold Eq.
Location Ownership M Tons (oz/ton) (oz/ton) % % (mm oz) (mm oz) (kt) (kt) (mm oz) (mm oz)Greens Creek United States 100.0% 7,858 12.0 0.09 3.4 9.0 94.6 0.7 267.7 703.2 213.0 3.6 Lucky Friday United States 100.0% 4,138 13.4 0.00 8.0 3.0 55.5 -- 330.7 120.9 91.5 1.5 Casa Berardi Canada 100.0% 9,196 -- 0.18 -- -- - 1.5 -- -- 86.6 1.5 Joanna Dev. Property Canada 100.0% 46,032 -- 0.04 -- -- - 1.7 - - 98.4 1.7 Total 67,224 150.0 3.8 598.5 824.1 489.5 8.3
Asset
Asset
Asset

H E C L A M I N I N G C O M P A N Y
Hecla EBITDAX Reconciliation
Note: All monetary amounts presented in thousands of dollars.
39
US$ millions 2008A 2009A 2010A 2011A 2012A PF 2012A
Net Income from Continuing Operations ($37,173) $67,826 $48,983 $151,164 $14,954 $21,625
Plus: Depreciation 35,846 63,061 60,235 47,348 50,113 96,530
Plus: Income Taxes 3,807 (7,680) (123,532) 81,978 8,879 18,054
Plus: Interest Expense 19,573 11,326 2,211 2,875 2,427 32,218
Less: Interest and Other Income (3,842) (1,121) (126) 87 (22) (2,258)
Plus: Debt-Related Fees -- 5,973 -- -- -- --
EBITDA $18,211 $139,385 ($12,229) $283,452 $76,351 $166,169
Plus: Loss on Impairment of Investments $373 $3,018 $739 $140 $1,171 $1,171
Plus / (Less): Net Loss (Gain) on Sale of Investments (8,097) (4,070) (588) (611) -- --
Plus / (Less): Loss (Gain) on Derivative Contracts -- -- 20,758 (37,988) 10,457 10,264
Plus: Provision for Closed Operations and Environmental Matters 4,312 7,721 201,136 9,747 4,652 4,652
Plus: Termination of Employee Benefit Plan -- (8,950) -- -- -- --
Plus: Lucky Friday Suspension-Related Costs -- -- -- -- 25,309 25,309
Plus / (Less): Loss (Gain) on Disposition of PPE and Mineral Interests (203) (6,234) 80 -- 275 275
Plus: Pre-Development -- -- -- 4,446 17,916 17,916
Plus: Share-Based Compensation 4,122 2,746 3,446 2,073 3,101 8,415
Adjusted EBITDA $18,718 $133,616 $213,342 $261,259 $139,232 $234,171
Plus: Discretionary exploration expense $22,471 $9,247 $21,605 $26,959 $31,822 $52,708
Adjusted EBITDAX $41,189 $142,863 $234,947 $288,218 $171,054 $286,879

H E C L A M I N I N G C O M P A N Y
Aurizon EBITDAX Reconciliation
Note: All monetary amounts presented in thousands of dollars.
C$ millions 2008A 2009A 2010A 2011A 2012A
Net Income from Continuing Operations $4,921 $36,706 $17,240 $43,931 $31,807
Plus: Income Taxes 6,602 20,706 13,911 42,653 24,266
Plus: Interest Expense 2,692 485 750 1,112 856
Plus: Depreciation 35,582 36,514 34,249 39,131 37,729
Less: Interest and Other Income (1,705) (498) (719) (1,538) (2,236)
EBITDA $48,092 $93,913 $65,431 $125,289 $92,422
Plus / (Less) : Other Net Losses (Gains) ($4,524) ($288) ($2,157) $457 $1,840
Plus / (Less): Loss (Gain) on Derivative Contracts 10,586 (4,946) 4,402 (165) (193)
Plus / (Less): Loss (Gain) on Foreign Exchange (1,059) 2,413 -- -- --
Plus: Non refundable tax credits -- (4,468) -- -- --
Plus / (Less): Capital Taxes (Recoveries) 397 837 -- -- --
Plus: Share-Based Compensation 4,003 2,865 7,564 6,526 5,313
Plus: Pre-Development -- -- -- -- --
Adjusted EBITDA $57,495 $90,326 $75,240 $132,107 $99,382
Plus: Exploration $11,426 $3,769 $15,643 $26,468 $17,899
Adjusted EBITDAX $68,921 $94,095 $90,883 $158,575 $117,281
40

H E C L A M I N I N G C O M P A N Y
Lucky Friday - #4 Shaft
41
#4 Shaft construction resumed in Q1/13 - focus on shaft sinking & station development activities
Total project is 40% complete and 80% of major procurements have been ordered or installed
Total project capital is expected to be approximately $200 million
Hoist Room Shaft Sheave Deck

H E C L A M I N I N G C O M P A N Y
2013 - Silver Exploration Programs Highlights of 2013 exploration programs consist of:
At Greens Creek, underground drilling expects to convert resources to reserves and define extensions to the 200 South, Southwest Bench and NNW. Surface drilling at Killer Creek may define a new mineralizing center at Greens Creek.
At Lucky Friday, drilling will evaluate resources to the east from the 6900 to 7200 levels and at depth.
San Sebastian drilling is expected to expand the Middle Vein resource and examine the North Vein potential along strike and at depth.
Surface drilling at San Juan Silver will concentrate on the northern extent of the Bulldog complex and evaluate the high-grade mineralized zones at the intersection of the Equity and North Amethyst veins.
Drilling in the Silver Valley will continue to evaluate surface targets along main mineralized trends.
Drilling planned at Monte Cristo.
42

H E C L A M I N I N G C O M P A N Y
2013 - Pre-Development Programs Pre-development programs consist of:
San Sebastian:
Further scoping studies are in progress to determine the production viability, rate and sequencing of mining the three areas and are expected to be completed in the third quarter.
A ramp is being engineered for initial construction planned this year to allow access to both the Hugh Zone and the Middle Vein.
San Juan Silver:
Expected completion of the 2800-foot decline to access the underground workings at the Bulldog.
Advance of the scoping studies to determine the production viability, rate and sequencing of mining at the Bulldog.
43
H E C L A M I N I N G C O M P A N Y
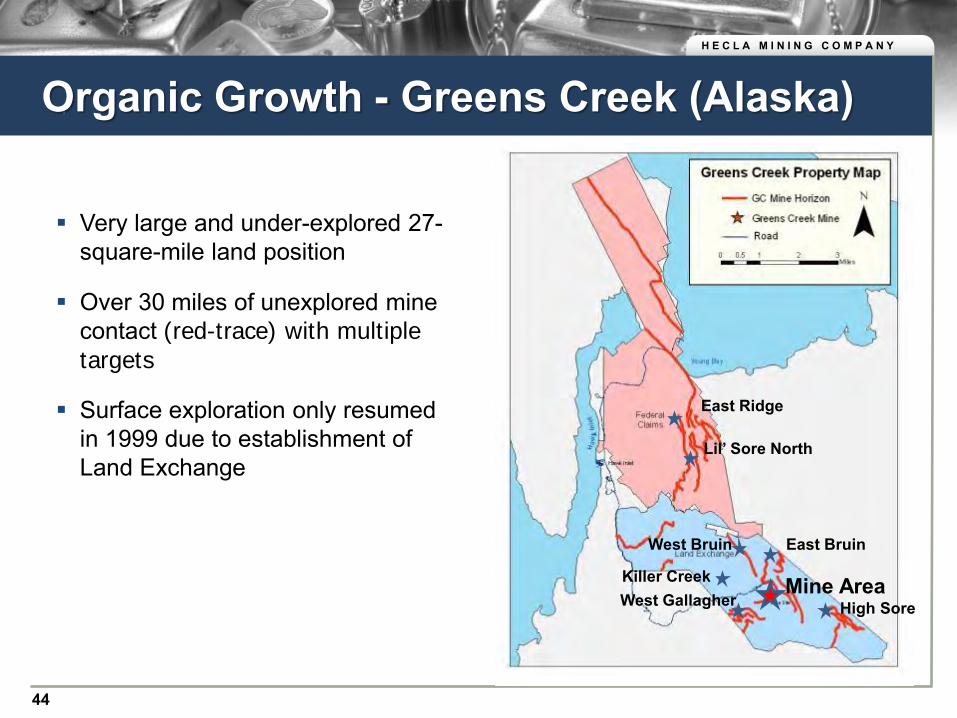
Mine Area West Gallagher
East Bruin
High Sore
West Bruin
East Ridge
Lil’ Sore North
44
Very large and under-explored 27-square-mile land position
Over 30 miles of unexplored mine contact (red-trace) with multiple
targets
Surface exploration only resumed in 1999 due to establishment of Land Exchange
Organic Growth - Greens Creek (Alaska)
Killer Creek

H E C L A M I N I N G C O M P A N Y
Exploration - Greens Creek (Alaska)
45
Underground Exploration Targets
Gallagher
200 South Resource extensions
Looking NE
5250 South Resource Extension
East Ore extension
SW Bench

H E C L A M I N I N G C O M P A N Y
46
Looking NW
Silver Shaft
7500 level
6500 level
#4 Shaft
30 Vein
5900 level
4900 level
4050 level
Current mining from 5900 level access
Lucky Friday - Idaho

H E C L A M I N I N G C O M P A N Y
Organic Growth - Lucky Friday (Idaho)
47
Lucky Friday Expansion Area - Increased Grade and Thickness at Depth
*As of 2010

H E C L A M I N I N G C O M P A N Y
Organic Growth - Star Pre-Development (Idaho) Hecla has re-opened the Star for definition & exploration drilling Portal rehabilitation and ventilation adit have been successfully completed A Preliminary Economic Assessment (PEA) of the “Upper Country” Star mine
complex is under review A mine dewatering study is also under way
#4 Shaft behind Lucky Friday expansion area
Longitudinal Section Looking North
- Water level
8100 L
Star/Morning
Lucky Friday
Lucky Friday Expansion
5900 L
4900 L
Silver Shaft
Gold Hunter
7300 L
1 Mile
3000’
StopesResource outlines (colored blocks)
Noonday Resource
48
Water level

H E C L A M I N I N G C O M P A N Y
Advance of the Bulldog Decline
49
Delivering Growth - San Juan Silver (Colorado)
Shotcrete Application
• Bulldog underground infrastructure now advanced over 800 feet
• Completion expected in 4th Quarter

H E C L A M I N I N G C O M P A N Y
New Innovation has Changed Silver Demand
February 1900
Long-running popular series of simple and inexpensive cameras
Introduced the concept of the “snapshot”
Transformed the demand of silver
Today new innovation has changed demand again
50

H E C L A M I N I N G C O M P A N Y
Medicine: silver is added to bandages and wound-dressings, catheters and other medical instruments and is a key part of technology behind X-rays
Solar Panels: 90% of crystalline silicon photovoltaic cells use silver paste; over 100 mm ounces of silver are estimated for use by solar energy in 2015
Electronics: almost all electronics are configured with silver; its excellent conductivity makes it a natural choice
Batteries: silver oxide batteries are replacing lithium ion batteries due to environmental and safety concerns
Automobiles: every electrical action in a modern car is activated with silver coated contacts; over 36 mm ounces of silver are used annually
Water Filters: silver prevents bacteria and algae from building up in filters
Growing Silver Demand
51 Source – GFMS, The Silver Institute 2012
New technologies and innovations have the potential for creating new sources of silver demand such as RFID’s
Uses of Silver