hedge fund investing in distressed securities
TRANSCRIPT

A member of Man Group
Hedge fund investing in distressed securities
Capturing the unique value created by corporate and economic turnarounds
April 2008
• Current stressed/distressed market environment offers
ample trading opportunities for hedge funds
• The implicit value of distressed securities is often significantly
higher than the prevailing market price
• Investing early is better than late
Research, Analysis and Strategy Group Thomas Della Casa Mark Rechsteiner Ayako Lehmann The team can be contacted at: [email protected]
Hedge fund investing in distressed securities 2 / 25
Table of contents
Executive summary...............................................................................................................3
Growth of the credit market ..................................................................................................4
The credit cycle ....................................................................................................................5
Recent developments (Summer 2007 until March 2008) .......................................................7
Introduction to the credit/distressed universe ........................................................................8 Distressed securities ....................................................................................................................................... 9
Distressed hedge fund investing............................................................................................9 Distressed universe ....................................................................................................................................... 11 Investment strategy ....................................................................................................................................... 11
Sub-strategies within distressed hedge fund investing.........................................................13 Active versus passive .................................................................................................................................... 13 Outright short ................................................................................................................................................ 14 Long/short .................................................................................................................................................... 14 Capital structure arbitrage ............................................................................................................................. 14 Value/ Deep value ......................................................................................................................................... 16 Rescue financing........................................................................................................................................... 17
Performance characteristics of distressed hedge funds.......................................................17
Credit outlook – it may get worse before it gets better.........................................................22
Conclusion .........................................................................................................................24
Appendix ............................................................................................................................25

Hedge fund investing in distressed securities 3 / 25
Executive summary The sharp correction in the US subprime market in mid-2007 was the catalyst for what has been a near perfect
storm in global credit markets. Competing fears of recession, default, inflation and the possible collapse of a
large financial institution and subsequent fire-sale of their loan book helped chase liquidity from the market and
lead to a substantial re-pricing of all forms of credit risk.
Distressed securities are primarily debt securities which originate from companies that are in the process of
reorganisation or liquidation under local bankruptcy law, or companies engaged in other extraordinary
transactions such as balance sheet restructurings. Distressed securities typically trade at a yield-to-maturity of
more than 1,000 bps over US Treasuries (UST) or below 80 cents on the dollar. Looking at the US high yield
market today approximately USD 200 billion, or 28%, would be considered distressed, up from only USD 8 bn a
year ago. Trading in distressed securities is highly inefficient, partly because of forced selling. A hedge fund
specialising in credit is often able to purchase securities at a substantial discount to its intrinsic value.
In this paper, we briefly examine the historical growth and the cyclical nature of credit markets. Then we focus
on recent developments and provide an overview of distressed hedge fund investing. Finally, we touch on the
likely outcome of the current credit crisis and discuss how hedge funds can profit. We base our analysis on the
US high yield and leveraged loan market which, despite the growth of other market sectors in recent years,
remains the largest and most actively traded distressed securities market.
Currently, the leveraged loan market trades below its previous cyclical lows whereas the high yield market is in
better shape. Hence, at current prices, the loan markets offer a more compelling opportunity. We examined the
previous bear market in 2002 to estimate the best time to enter the distressed market and found compelling
evidence that investing early, before the bottom, offers more upside than investing late. Therefore, we
recommend increasing allocations in anticipation of a J-curve like recovery. It is not necessary to pick the
bottom of the market to generate above-average returns.
Readers should also keep in mind that distressed managers do not solely play the credit market cycle. While
they tend to perform better during bull markets (by harvesting their ‘investment seeds’) they can also make
money in downturns, for example with outright shorts and hedges. Additionally, turbulent markets often deliver
pricing opportunities that will improve future performance.

Hedge fund investing in distressed securities 4 / 25
Growth of the credit market For the purpose of this report, we concentrated on the two largest corporate debt markets: high yield bonds
and leveraged loans (bank debt of non-investment grade companies). While some distressed funds also include
structured credit products (such as mortgage backed securities), trade claims, leases, receivables vendor
financing and other debt-like instruments, most managers focus on loans and high yield bonds.
Since the vast majority of managers solely invest in the US, we will not cover European or Asian distressed
topics. In the US, the bankruptcy process is consistent and well established whereas in Europe and Asia each
country is different and laws are often ambiguous.
In the US a distressed opportunity typically arises when a company, unable to meet all its debts, files for
Chapter 11 (reorganisation) or Chapter 7 (liquidation) bankruptcy. Chapter 7 involves shutting a company’s
doors and parcelling out its assets to its creditors. Chapter 11 gives the company legal protection to continue
operating while working out a repayment plan, known as a plan for reorganisation, with a committee of its major
creditors.
At the end of 2007, the high yield market was worth USD 888 bn and the leveraged loan market USD 1,061 bn.
While the high yield market has not grown since 2002, the loan market has grown rapidly during the last few
years and last year overtook the high yield market for the first time.
Figure 1: Growth of the US high yield market 1977 – 2007
High Yield Market SizeNew Issue Volume
Source: Credit Suisse. *As at 31 December 2007. Includes non-investment grade USD-denominated straight corporate debt. Floating rate
and convertible bonds and preferred stocks are not included.
Figure 2: Growth of the US institutional leveraged loan market 1989 – 2007
5 16 3488
126 145 141
1061
5323
176
746
332
225
472
2 55455 508 14 25
426
366
11864
32
223 241
Institutional Loan Market SizeNew Institutional Loan Volume
Source: Credit Suisse. As at 31 December 2007. Includes USD-denominated grade fully-drawn term loans.

Hedge fund investing in distressed securities 5 / 25
The rapid growth of the loan market during the last few years has occurred on the back of a boom in large
leveraged buyout deals, often financed by issuing leveraged loans. At the height of the credit boom last
summer, over 30% of all M&A deals in the US were announced by private equity firms.
The credit cycle Credit markets are cyclical and generally follow the economic cycle. As can be seen in the figure below, there
were two significant bear markets in credit before and during the last two US recessions (1989/90 and
2001/2002). The default rate always lags the credit spreads (credit risk spreads over US Treasuries (UST),
spreads to worst, STW) as the market prices in the estimated default rates for the subsequent 18-24 months.
Historically, spreads have been a leading indicator of economic weakness and widened before the economic
downturn was evident.
When the economy is healthy, as it was from 2003-2006, default rates decline and risk spreads tighten. This
environment is supportive for long credit strategies as investors benefit from rising bond prices and falling credit
spreads in addition to the current income from coupon payments. When spreads widen, as in the late 1980s,
2001/2002 and H2 2007/YTD 2008, credit risk is re-priced and while the current default rate is still low, higher
future default rates are priced in. Credit spreads are sensitive to liquidity which is a leading indicator to equities
and the economy. Therefore leveraged loans are usually the first to correct, followed by high yield bonds and
eventually equity markets. Please keep in mind that high yield bonds, as any fixed income investment, exhibit an
inverse relationship between price and yield.
Figure 3: Default rate versus high yield spreads
Source: JPMorgan, Default Monitor March 2008. January 1987 to March 2007.
As at 31 March 2008, STW are at 794 bps. This is still some way below the previous two peaks of around 1,000
bps, but significantly higher than last summer. The average default rate has been 4.2% and average credit
spreads 535 bps since 1987. It is important to keep in mind that spreads do not follow the economic cycle
exactly. For example during 2002 spreads widened as the economy was recovering, primarily due to accounting
fraud (Enron, WorldCom) and larger issues of corporate disclosures. Usually, spreads peak at the end of a
recession or closely thereafter (e.g. 1980, 1991).
0.0 %
2.0 %
4.0 %
6.0 %
8.0 %
10.0 %
12.0 %
14.0 %
16.0 %
18.0 %
Dec
-86
Dec
-87
Dec
-88
Dec
-89
Dec
-90
Dec
-91
Dec
-92
Dec
-93
Dec
-94
Dec
-95
Dec
-96
Dec
-97
Dec
-98
Dec
-99
Dec
-00
Dec
-01
Dec
-02
Dec
-03
Dec
-04
Dec
-05
Dec
-06
Dec
-07
Def
ault
rate
0
250
500
750
1000
1250
Spreadto
worst (bps)
High-yield default rateHigh-yield spreads
21-year average= 535bp
25-year average= 4.2%

Hedge fund investing in distressed securities 6 / 25
It is also worthwhile to compare the credit cycle to equities. Both are risky asset classes and exhibit sensitivity to
the economy. However, they can be in different stages with respect to risk appetite. The next graph shows the
four different phases of the credit market cycle.
Figure 4: The credit/equity cycle (prices)
Source: Citi Investment Research/Datastream, Man Investments.
Phase 1: Credit spreads tighten (i.e. credit markets rise) while equity markets still fall: Most interesting
phase to be long distressed or credit risk in general as STW quickly come in. Balance sheets
are being repaired and troubled companies restructured. In this situation credit outperforms
equities.
Phase 2: Credit spreads continue to tighten while equity markets are rising: Everybody is happy and
volatility across all asset classes is low or declining.
Phase 3: Credit spreads are rising (i.e. credit markets fall) while equity markets still rise: Late stage of the
equity bull market as credit enters the emerging bear market. In this phase, corporate debt
starts growing faster than profits and volatility is increasing. During the current cycle, this phase
lasted only four months as equities peaked in October 2007 while credit markets began their
decline in July.
Phase 4: Both equity and credit are in a bear market (current phase): This phase is bad for all risky asset
classes. During this phase, investors can slowly build up exposure in the credit markets before
phase 1 begins again. Entering the markets in this phase can yield the best future returns but
requires patience as initial returns are often negative (J-curve or U curve).

Hedge fund investing in distressed securities 7 / 25
Figure 5: US equities and high yield spreads (with phases indicated)
Source: Citi Investment Research. January 1988 to 27 February 2008.
We think that this framework, although simplistic, is extremely helpful in demonstrating the cyclical nature of
equity and credit markets. Moreover, an understanding of where we are in this cycle will help forecast future
trends. Late phase 4 and early phase 1 are the best periods to invest. Since we are in phase 4, we think that it
is an appropriate time to begin slowly building exposure in credit markets. Of course, nobody knows how long
this phase will last and it is possible that credit spreads will widen a few hundred basis points more. The
important finding is that credit markets lead equity markets, i.e. they usually recover before equity markets do.
Currently, credit markets price in a higher probability of a recession than equity markets. Morgan Stanley
estimates that if credit pricing is correct, equities have to undergo a further correction of 10-15% from mid
March levels.
Recent developments (Summer 2007 until March 2008) The slowdown in the US housing market in early 2007 had a spill over effect on to structured products that
bundled US home loans. This crisis in US subprime lending triggered a wave of selling in the credit markets in
July and August 2007. Almost overnight, investors lost their appetite for risk and banks were left with hundreds
of billions of unsold loans on their balance sheets. As investors were increasingly pricing in a serious downturn in
the US, risk appetite diminished further and all but the best credits were re-priced. Rating agencies, which were
blamed for being to generous with subprime-related securities, quickly downgraded large quantities of lower
quality paper.
Structured credit products, such as CDOs (Collateralised Debt Obligations), became hard to value as market
liquidity disappeared almost completely. During November and December general credit risk was re-priced as it
became apparent that the problem had spread from Wall Street to Main Street. Forced liquidations were the
driving force in the first quarter of 2008 as credit markets became trapped in a negative spiral. The need to
reduce risk forced investors to sell assets into an illiquid market. Those fire sales drove prices down further
which, in turn, prompted more investors to reduce risk. As a result, loan demand was acutely reduced. This
precipitated a supply/demand mismatch resulting in the current credit crunch.
The leveraged loan market has experienced unprecedented volatility and price declines in a very short period of
time. This has been the result of a number of factors including an overhang of new issuances, the
0
200
400
600
800
1000
1200
1400
1600
1800
88 89 90 91 92 93 94 95 96 97 98 99 00 01 02 03 04 05 06 07 080
250
500
750
1000
12503 4 1 2 3 4 1 2 3
US High YieldSpreads (RHS)
S&P 500
4
Spreadto
worst (bps)S&P
500 I
ndex

Hedge fund investing in distressed securities 8 / 25
disappearance of CLOs (Collateralised Loan Obligations) and declining LIBOR rates (the loans’ interest rates are
tied to LIBOR). With an assumed recovery rate of 70%, leveraged loans currently trade at prices that reflect
default levels not previously experienced in the market. Due to technical factors, some loans even trade below
their recovery value.
Figure 6: Market has re-priced risk in leveraged companies
Source: Underlying manager of RMF Investment Management, a wholly owned subsidiary of Man Group plc/adjusted by Man Investments
Research.
Unlike previous credit downturns, leveraged loans have corrected more sharply than more liquid, higher volatility
assets such as high yield bond and equities. This indicates that the current correction is driven primarily by
liquidity concerns unlike the historical pattern of volatility led corrections where more volatile assets would adjust
to a greater extent than less volatile assets. Hence, while high yield spreads are narrower than 2002 levels,
loans are currently wider.
The three key factors that have changed since the credit crunch of 1989-90 are disintermediation, availability of
derivatives and the rapid increase in liquidity from 2003-2006. These factors meant financial markets reacted
much faster and in a more exaggerated fashion to stressful events. In the loan market, for example, prices
dropped much quicker than in previous corrections.
Introduction to the credit/distressed universe The credit/distressed universe primarily consists of debt securities of companies that are in the process of
reorganisation or liquidation under local bankruptcy law, or companies engaged in other extraordinary
transactions such as balance sheet restructurings. Companies can become distressed for any number of
reasons such as:
• Too much leverage on their balance sheet
• Liquidity problems
• Credit downgrades
• Poor operating performances that require reorganisation
• Accounting irregularities
• Inadequate cash flows
• Competitive pressure
Trading in distressed securities is highly inefficient, partly because of forced selling. When a security defaults or
is downgraded, investors such as high yield mutual funds, endowments, CLOs and any other investor whose
mandates does not permit them to hold such securities are frequently obliged to sell them, often at a discount.
The leveraged loan market, for example, has recently witnessed forced selling due to CLO liquidations. Some of

Hedge fund investing in distressed securities 9 / 25
these vehicles had to unwind positions when prices dropped below USD 90 to remain in compliance with their
investment guidelines.
The implicit value of distressed securities is often significantly higher than the prevailing market price.
Furthermore, sellers may react emotionally in anticipation of a potential bankruptcy and overlook or ignore the
company’s true worth. In addition, distressed investing requires a highly specialised skill set – most investors do
not have the skills or the information required to properly assess the value of a distressed company or its likely
evolution through the bankruptcy process. Those that do can generate outsized returns.
Distressed debt investors require strong negotiating skills, asset valuation skills and industry expertise. They
typically come from a legal background, in which they have had exposure to the bankruptcy process,
particularly in the US. In addition, sourcing of and access to distressed deals is often only possible if one has a
large network in this particular investment field.
Distressed securities
The distressed securities universe is huge and includes all kinds of securities of below investment grade debt.
The investments may include high yield bonds, below par/distressed bank loans, debtor-in-possession loans1,
second lien notes, seller paper2, trade claims/receivables, ‘busted’ convertibles3 and municipals, credit default
swaps, credit default indices, preferred stock as well as common stock, rights/warrants, equity ‘stubs’4, PIPES5,
collateralised debt, bond and loan obligations, futures, options, swaps and indices, bridge and mezzanine loans,
bonds including both corporate and municipal, real estate assets including leasehold interests, among others.
The structured credit universe is a different category altogether. It has only been in existence for the last six to
seven years and has so far been considered by only a handful of hedge fund managers, as the proper valuation
and risks of the structures is fairly complex making it more difficult to analyse arbitrage opportunities.
Distressed debt instruments trade at a yield-to-maturity of more than 1,000 bps over US Treasuries or prices
below 80 cents of a dollar. As of 31 March 2008 approximately USD 200 bn of the USD 888 bn US high yield
market could be considered distressed, up from only USD 8 bn a year ago.
Distressed hedge fund investing Hedge fund managers focussing on distressed securities tend to perform best during bull markets as they then
harvest profits from the ‘investment seeds’ sown during previous economic downturns and recessions. In that
sense, distressed hedge fund investing has some similarities to private equity investments, where it also takes
considerable time until profits are returned. Nevertheless, even in a good economy there can be bargains. The
auto and airline sector, for example, offered ample opportunities during 2004-2006 even though the economy
was strong. Distressed investing is largely a bottom-up strategy where returns depend less on the overall credit
market cycle than on company or sector-specific factors.
1 Debtor-in-possession loans: loans of a company that continues to operate while under the Chapter 11 bankruptcy process. 2 Seller paper: Notes issued by companies, filling the gap in the capital structure after traditional financing sources have been exhausted. Unlike third party financing, terms for seller papers are privately negotiated and thus bear an intrinsic risk. 3 Busted convertible: convertible trading well below its conversion value. 4 Equity stubs: Stocks in a company that are over-leveraged as a result of recapitalisation. They are very speculative and risky, but have an unlimited potential if the company manages a turnaround. 5 PIPES: private investment in public equity, i.e. a private company’s or other qualified investor’s purchase of stock in a company at a discount to the current market value per share for the purpose of raising capital.

Hedge fund investing in distressed securities 10 / 25
Figure 7: Distressed hedge funds find value across the full credit cycle
Source: RMF Investment Management, a wholly owned subsidiary of Man Group plc. Schematic illustration.
As the figure above shows, the lifecycle of a troubled company can be broadly divided into five different stages:
pre-default, early, mid and late bankruptcy as well as emergence.
A company in the pre-default stage is in the process of restructuring its balance sheet, often due to poor risk
management. In the early bankruptcy stage, the affected company tries to negotiate an out-of-court exchange
offer with its creditors. In such a case the company usually offers an equity stake in exchange for an extension
of the debt maturities or even a reduction of debt.
During the mid-bankruptcy stage, the company decreases leverage, thereby stabilising its balance sheet. Hedge
fund managers often purchase pre-structured debt at this stage.
In the late bankruptcy stage, companies have almost recovered and hedge funds purchase post-restructured
debt. The final emergence stage refers to the strong recovery of a company.
The majority of strategies employed by distressed hedge fund managers involve investments in ‘below
investment grade’ securities. This means that successful strategy and security identification largely depends on
the individual manager’s industry knowledge, bottom-up securities selection expertise and the correct
identification and/or diversification of risks associated with securities. Successful credit/distressed trading thus
requires in-depth knowledge in the following areas:
• Understanding the true risk and values involved
• Legal background
• Previous exposure to the bankruptcy process
• Restructuring expertise
• Negotiation skills
• Correct valuation
• Large network to source/access distressed deals

Hedge fund investing in distressed securities 11 / 25
Distressed universe
Distressed hedge funds only make up a small portion of the total hedge fund universe. According to Hedge
Fund Research, 5.64% of the entire hedge fund universe was managed by distressed hedge funds as at
December 2007. Nevertheless, figure 8 below shows that assets managed by distressed hedge funds have
grown rapidly since 2002, when the credit cycle had its last peak.
Figure 8: Estimated growth of assets / net asset flow of distressed hedge funds 1990 – 2007
Source: Hedge Fund Research, Inc. Data as at end December 2007.
Looking at the whole of 2007, 9.42% of total net hedge fund asset inflow went into distressed hedge funds. This
figure is expected to increase quite a bit in 2008, as several hedge fund managers have already indicated that
they are planning to launch a dedicated credit/distressed fund in order to benefit from the current market
turmoil. As investors are flocking to funds that specialise in distressed debt, competition might dampen returns if
pickings are too slim.
Investment strategy
Most of the distressed hedge fund managers apply both a top down and bottom up approach for their
investment process. The top down approach looks at the development of macro themes whereby potential
investment ideas are originated in a number of different ways, including:
• Monitoring market behaviour and price movements of specific securities
• Networking with contacts in a variety of industries
• Networking with contacts on the buy and sell side
• Monitoring news and other events
• Reviewing industry journals, research reports and publications

Hedge fund investing in distressed securities 12 / 25
During this process, hedge fund analysts try to anticipate specific industries undergoing a) rapid change, b)
cyclical recession or c) regulatory adversity in order to determine potentially attractive investment opportunities
in their target industries.
Once these target industries have been identified, a bottom up approach is executed on a company level,
whereby fundamental research is carried out. Hedge fund analysts thus:
• Assess, through quantitative and qualitative analysis, the company’s fundamental business, its
creditworthiness, and its competitive strengths and weaknesses, including its current market share, margins
and future growth prospects
• Analyse historical trends
• Develop and maintain a framework for detailed financial modelling
• Review the capital structure along with a complete analysis of the covenants in its debt instruments
• Search for positive catalysts for debt and equity appreciation/refinancing opportunities/ free cash flow
generation
• Examine bankruptcy and potential regulatory, tax and legal issues that may subject the company to
additional risks
• Review public documents and available research reports
• Maintain dialogue with management, industry participants, analysts and consultants
Only when both the top down and bottom up analysis have been carried out can the hedge fund manager move
on to the investment execution. This includes understanding the market/trading dynamics, creating positions at
a discount to asset value as well as optimising the risk/return profile within the capital structure. Different to
other hedge fund strategies, distressed hedge funds do not tend to use leverage.
Once a portfolio has been set up, its positions are reviewed on a regular basis as part of the risk management
process. Beside standard risk management measures such as Value-at-Risk (VaR) calculations and review of
price movements of each security in the portfolio versus expectations, risk management for distressed hedge
fund investing also covers the following aspects:
• Arbitrage risk models that analyse individual relationships among securities
• Diversification through sector and position limits
• Leverage limitations
• Credit information: market share, historical margins and future growth prospects
• Quantify tail risk in portfolio
• Analyse cost and effectiveness of various hedging instruments
• Liquidity analysis – how long does it take to liquidate a position

Hedge fund investing in distressed securities 13 / 25
Sub-strategies within distressed hedge fund investing Some distressed hedge fund strategies can overlap with private equity strategies. However, there is a key
difference between the two. While private equity investors usually work with the management on a day-to-day
basis, hedge funds are less involved in the operative leadership of company. Instead, they concentrate on
trading opportunities surrounding the company’s outstanding stock and bond securities.
Active versus passive
Hedge fund managers focussing on the distressed universe can be categorised as active or passive. Active
managers are more situation specific and thus show a lower correlation to the overall credit market. Active
managers can be further split into ‘control’ and ‘non-control’. ‘Active control’ managers – as the name suggests
- get more involved in the daily business of their target company, meaning that they can also take a seat in the
board or work on site with the company, working closely with the management. Active control managers thus
acquire control and block positions – usually more than one third of the impaired asset class – in order to have
an appropriate influence. ‘Active non-control’ managers on the other hand do not lead restructurings, even
though they own a large enough chunk of the company’s shares. As active distressed hedge fund managers
receive company inside information they are restricted with regards to trading. Hence, they cannot sell their
positions until the bankruptcy process is complete. Also, active managers find opportunities in all credit
environments whereas passive funds are more cyclical.
Passive managers are more trading oriented, benefit from cyclical opportunities and tend to focus on large
caps. As they only rely on public information, they are not restricted with regards to trading positions. They
usually base their analysis on liquidation break-through analysis and apply shorting as well as relative value
trades, mainly in the high yield sector. Their performance tends to have a higher correlation to credit markets
than their active counterparts. Furthermore, while active managers typically focus on a long-only strategy with a
few short positions for hedging purposes, passive distressed managers tend to apply both long and short
positions. Table 1 below shows the differences between active and passive distressed hedge fund strategies.
Table 1: Active versus passive distressed approach
Source: RMF Investment Management, a whole owned subsidiary of Man Group plc.
There are several sub-strategies within distressed hedge fund investing. We have tried to come up with some
clear distinctions, but please note that these categories are only one way of dividing up the distressed hedge
fund universe and are not exhaustive.

Hedge fund investing in distressed securities 14 / 25
Outright short
An outright short is a strategy where the manager expresses a bearish view on the credit fundamentals of a
company. Often, this is implemented by buying Credit Default Swaps (CDS). CDS are derivatives that gain in
value when the credit deteriorates, i.e. the likelihood of bankruptcy increases. As the name implies, outright
short are single-legged, unhedged trades that are employed opportunistically. During Q4 2007 and Q1 2008
some managers have bought CDS on banks and profited handsomely. Bear Stearns, for example, was
perceived to suffer most from a liquidity dry-up as the US fifth largest investment bank relied heavily on short
term refinancing. During March 2008, Bear Stearns almost collapsed and had to be rescued by JP Morgan and
the Fed.
Figure 9: Senior 5 yr CDS on Bear Stearns
Source: Bloomberg. Performance in USD. January 2007 to 27 March 2008.
Long/short
Long/short managers typically go long securities of companies that are undervalued and where they expect that
the company’s fortune will improve. For short positions managers sell securities of companies where
fundamentals are expected to deteriorate. Positions are often taken inter-company within the same sector.
Depending on the market cycle and the managers’ view positions can be more or less long biased. This
approach is very similar to long/short equity with the difference that debt securities are used.
Capital structure arbitrage
Managers focussing on capital structure arbitrage analyse the mispricings between securities of the same issuer
and generate profits by taking a long position in the security that is higher in the capital structure and a short
position in the security that is lower in the capital structure or vice versa.
Examples include buying senior secured debt and shorting junior subordinated debt or buying bonds and
shorting the common stock. Both the senior secured debt and the bond enjoy a higher standing in the
bankruptcy process than either junior debt or common equity.
Hedge fund investing in distressed securities 15 / 25
As a result, when the distressed situation occurs or progresses, senior secured debt should appreciate in value
relative to the junior subordinated debt. Furthermore, the price spread between the bond and common stock
should increase. In such a situation, the distressed hedge fund manager closes out the positions and locks in
the profit that occurs from the increase in the spread.
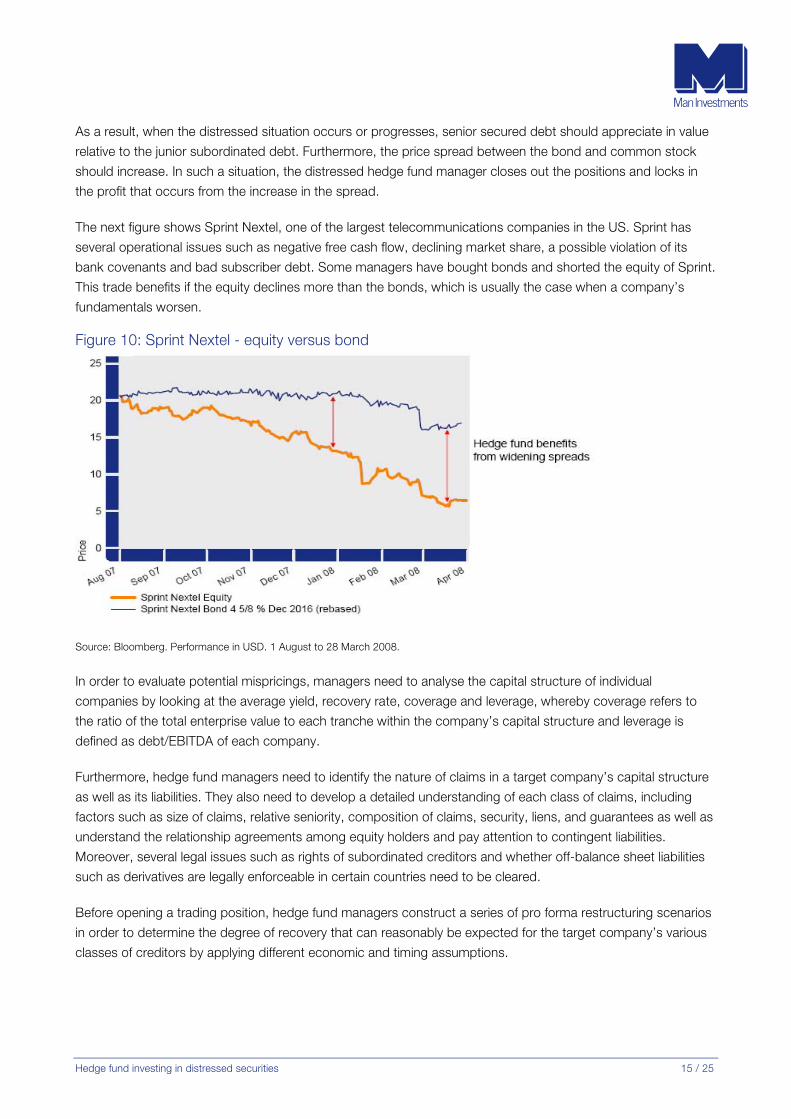
The next figure shows Sprint Nextel, one of the largest telecommunications companies in the US. Sprint has
several operational issues such as negative free cash flow, declining market share, a possible violation of its
bank covenants and bad subscriber debt. Some managers have bought bonds and shorted the equity of Sprint.
This trade benefits if the equity declines more than the bonds, which is usually the case when a company’s
fundamentals worsen.
Figure 10: Sprint Nextel - equity versus bond
Source: Bloomberg. Performance in USD. 1 August to 28 March 2008.
In order to evaluate potential mispricings, managers need to analyse the capital structure of individual
companies by looking at the average yield, recovery rate, coverage and leverage, whereby coverage refers to
the ratio of the total enterprise value to each tranche within the company’s capital structure and leverage is
defined as debt/EBITDA of each company.
Furthermore, hedge fund managers need to identify the nature of claims in a target company’s capital structure
as well as its liabilities. They also need to develop a detailed understanding of each class of claims, including
factors such as size of claims, relative seniority, composition of claims, security, liens, and guarantees as well as
understand the relationship agreements among equity holders and pay attention to contingent liabilities.
Moreover, several legal issues such as rights of subordinated creditors and whether off-balance sheet liabilities
such as derivatives are legally enforceable in certain countries need to be cleared.
Before opening a trading position, hedge fund managers construct a series of pro forma restructuring scenarios
in order to determine the degree of recovery that can reasonably be expected for the target company’s various
classes of creditors by applying different economic and timing assumptions.

Hedge fund investing in distressed securities 16 / 25
Value/ Deep value
Managers concentrating on value/deep value trading invest in securities that are undervalued. They tend to
purchase securities of a distressed company shortly before it announces its reorganisation plan to the
bankruptcy court. Hedge funds investing in those companies expect that there will be a positive resolution with
the company’s creditors. Currently one area of interest for these investors is asbestos. Many compelling
franchises are trading at depressed valuations because of investors’ fear and confusion surrounding the
asbestos liabilities of these companies. Examples include Owens-Illinois (glass packaging), Crown Holdings
(metal can manufacturing) and W.R.Grace (refining catalysts and construction additives).
Another area of interest for distressed managers focusing on value investing is securities of companies that have
just undergone a restructuring. Often the securities of these companies remain undervalued even though the
company has completed the restructuring process and has new management in place. Recent examples
include the airline sector, where competition and soaring costs pushed many companies to the brink and
triggered a wave of consolidation. Another example is US automotive OEMS (Original Equipment
Manufacturers), who are under pricing pressure in a rapidly globalising market dominated by a handful of major
manufacturers, a number of which are going through financial difficulties of their own. Although many OEMS
have implemented cost-led restructuring plans, they continue to face significant pressures due to declining
margins and excessive debt.
During 2002 new capacity and a soft economy resulted in a US power glut. Many power and energy companies
suffered. Mirant, an Atlanta based power operator, unsuccessfully attempted to renegotiate its debt and was
forced to file for Chapter 11 in July 2003. The company was subsequently restructured through operations
efficiency, workforce reductions and other cost saving measures. In early 2006, the company exited Chapter 11
and was successfully re-listed on the NYSE.
Figure 11: Mirant 5 ¾% bond July 2007
Source: Bloomberg and RMF Investment Management, a wholly owned subsidiary of Man Group plc. Performance in USD. 1 May 2003 to
31 December 2005.
Hedge fund investing in distressed securities 17 / 25
Rescue financing
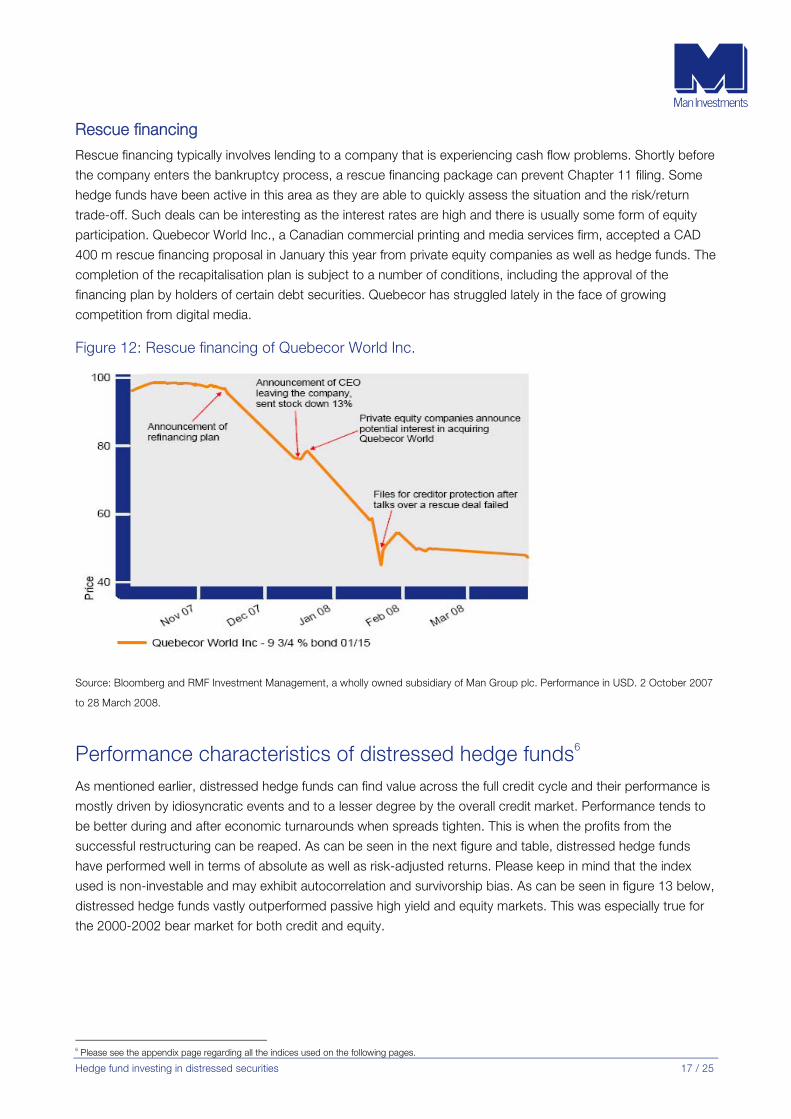
Rescue financing typically involves lending to a company that is experiencing cash flow problems. Shortly before
the company enters the bankruptcy process, a rescue financing package can prevent Chapter 11 filing. Some
hedge funds have been active in this area as they are able to quickly assess the situation and the risk/return
trade-off. Such deals can be interesting as the interest rates are high and there is usually some form of equity
participation. Quebecor World Inc., a Canadian commercial printing and media services firm, accepted a CAD
400 m rescue financing proposal in January this year from private equity companies as well as hedge funds. The
completion of the recapitalisation plan is subject to a number of conditions, including the approval of the
financing plan by holders of certain debt securities. Quebecor has struggled lately in the face of growing
competition from digital media.
Figure 12: Rescue financing of Quebecor World Inc.
Source: Bloomberg and RMF Investment Management, a wholly owned subsidiary of Man Group plc. Performance in USD. 2 October 2007
to 28 March 2008.
Performance characteristics of distressed hedge funds6 As mentioned earlier, distressed hedge funds can find value across the full credit cycle and their performance is
mostly driven by idiosyncratic events and to a lesser degree by the overall credit market. Performance tends to
be better during and after economic turnarounds when spreads tighten. This is when the profits from the
successful restructuring can be reaped. As can be seen in the next figure and table, distressed hedge funds
have performed well in terms of absolute as well as risk-adjusted returns. Please keep in mind that the index
used is non-investable and may exhibit autocorrelation and survivorship bias. As can be seen in figure 13 below,
distressed hedge funds vastly outperformed passive high yield and equity markets. This was especially true for
the 2000-2002 bear market for both credit and equity.
6 Please see the appendix page regarding all the indices used on the following pages.

Hedge fund investing in distressed securities 18 / 25
Figure 13: Performance comparison – distressed versus high yield and world stocks/bonds
Source: Bloomberg. Performance in USD. Period analysed: 1 January 1994 to 29 February 2008.
While distressed hedge funds showed steady growth from 1994 to 2001, the significant growth of this hedge
fund strategy occurred from 2002 until 2005 as the strategy capitalised on the recovering US credit markets and
the US economy following the three year bear market from 2000 to 2002. Distressed hedge funds performed
much better than traditional or alternative high yield indices during this period as they benefited from corporate
turnarounds and successful reorganisations of companies coming out of bankruptcy during the bull market.
During 2006 and 2007, distressed hedge funds benefited from company specific deals and less from the overall
market movement .The table below shows the statistics underlying figure 13 above.
Table 2: HFRI Distressed versus traditional and non-traditional high yield, world stocks and bonds
Source: Bloomberg. Performance in USD, calculated by Man Investments. Sharpe ratio and Sortino ratio are measures of risk-adjusted
performance that indicate the level of excess return per unit of risk. Risk is expressed as standard deviation for the Sharpe ratio and as
downside deviation for the Sortino ratio. Both ratios are calculated using the risk-free rate in the appropriate currency over the period
analysed.

Hedge fund investing in distressed securities 19 / 25
As mentioned earlier, distressed hedge funds benefit from company specific events and are thus less
dependent on the overall market movement. This can be illustrated with the below correlation table. While
distressed hedge funds show negative correlation to world bonds for the time period 1994 to most recent, they
show some medium positive correlation to high yield indices. This is to be expected, as distressed hedge funds
invest in the same securities, but following a different approach. Nevertheless, the reader should not forget that
distressed hedge funds have a smaller downside deviation compared to long only investments.
Table 3: Correlation of distressed hedge funds to other indices
Source: Bloomberg. Performance in USD, calculated by Man Investments.
Performance and correlation, however, are only one aspect when analysing distressed hedge fund investing. In
order to get a full understanding of this strategy, key characteristics such as skewness7 and kurtosis8 should
also be taken into account. Figure 14 below shows the monthly distribution of the HFRI Distressed Index for the
period 1994 to January 2008. For that period, the monthly return distribution of returns for the HFRI Distressed
Index ranged from -8.50% to 5.06%. The return distribution indicates that distressed funds exhibit negative
skewness (more negative outliers than positive ones) and positive kurtosis (fat tails).
Figure 14: Monthly distribution of HFRI Distressed Index (January 1994 to February 2008)
Source: Bloomberg. Performance in USD, calculated by Man Investments.
7Skewness measures the asymmetry in a distribution around its mean. A positive skew indicates that the mean of the distribution is to the right of the median
and that there are more frequent large positive returns than there are large negative returns. A positive skew thus demonstrates a bias to the upside. A negative skew indicates that the mean of the distribution is to the left of the median of the distribution. This means that there are more frequent large return observations to the left of the distribution (negative returns) and there are more small- and midrange positive return observations to the right of the distribution. 8Kurtosis measures how fat the positive and the negative tails of a distribution are. A positive value of kurtosis indicates that the distribution of returns has
greater probability mass in the tail of the distribution than would be expected compared to a normal distribution. A negative value of kurtosis indicates the reverse, i.e. that there is less probability mass in the tails (fewer outlier events) than a normal distribution.

Hedge fund investing in distressed securities 20 / 25
The distribution above only reflects historical aggregated performance and does not capture the entire range of
possible outcomes that can be reasonably expected in the future. Figure 15 below shows the results of the
Monte Carlo modelling for the HFRI Distressed Index. The probability distribution indicates that the expected
annual return ranges from around -10% to over 30%. It also reinforces the fact that returns are negatively
skewed with fat tails.
Fat tails stem from the fact that distressed hedge funds are exposed to significant event risks such as
bankruptcy, liquidation, foreclosure, creditors seizing assets, among others. As distressed hedge funds tend to
invest in below investment grade securities, they are affected first in case of the above mentioned problems. On
the other hand, distressed hedge funds generate higher annualised mean returns with lower risk than high yield
bonds.
Figure 15: Probability distribution of HFRI Distressed Index
Source: Bloomberg. Performance in USD, calculated by Man Investments.
Compared to traditional investments such as stocks and bonds, distressed hedge funds provide downside
protection, as their returns are mostly driven by idiosyncratic positions and to a lesser degree by market events.
Both figures 16 and 17 below show that distressed hedge funds have been able to protect capital during the
ten worst months for world stocks and world bonds since 1994.

Hedge fund investing in distressed securities 21 / 25
Figure 16: Distressed hedge funds during ten worst months for world stocks
Source: Bloomberg. Performance in USD, calculated by Man Investments.
Figure 17: Distressed hedge funds during ten worst months for world bonds
Source: Bloomberg. Performance in USD, calculated by Man Investments.

Hedge fund investing in distressed securities 22 / 25
Credit outlook – it may get worse before it gets better During 2007, close to 50% of all new high yield issues were rated B- or below. Given the recent market turmoil
and the resultant closure of the credit markets, we expect to see a significant increase in the number of
companies going into default as they will no longer be able to refinance. The situation is further exacerbated by
the strong possibility of a recession in the US. This will greatly improve the opportunity set for distressed
managers.
In a study conducted by Ed Altman, 23.4% of bonds rated B (by S&P) defaulted over the four years ended
September 2007. For bonds rated CCC, the default rate for the same time period increased significantly to
49%. This is notable as nearly 25% of issuance was rated lower quality over the period. Due to the massive
growth of the credit markets and the fact that lending standards were extremely loose over the last few years,
the opportunities are likely to be unprecedented in size.
Figure 18: Seeds for future defaults have been planted
Source: JPMorgan, High Yield Weekly Update, 22 February 2008.
If the US economy is slipping into a recession, we believe default rates of 6-7% are likely in 2009. Presently, at
794 bps STW, the high yield market is pricing in a greater than 50% probability of this outcome. According to
JP Morgan, current spreads reflect a 5.4% default rate. For reference, historical average default rate are about
4%. The current average price of a high yield bond is 89.38% of par. In the last two bottoms for the credit
markets (1991 and 2002), this figure was just below 70%, as seen in the figure. During both periods the US was
in a recession, which is where it seems to be heading now. Therefore, historical guidance indicates that there is
still some downside left before markets reverse. However, if markets rebound quickly, we may not have as
many compelling distressed opportunities but rather a recovery opportunity.
72.0
40.2
22.2
33.7
16.6
2.53.47.67.6
31.0
17.7
7.95.9
0.0
10.0
20.0
30.0
40.0
50.0
60.0
70.0
80.0
1995 1996 1997 1998 1999 2000 2001 2002 2003 2004 2005 2006 2007
Lower-rated bond issuance
Lower-rated loan issuance

Hedge fund investing in distressed securities 23 / 25
Figure 19: Average price of the CS High Yield Index 1986 – 31 March 2008
Source: Credit Suisse.
Prices in the loan market have already reached, or even overshot, their 2002 lows. As previously mentioned this
is due to lower liquidity and forced selling. Opportunities in the leveraged loan markets are plentiful. Given the
sharp drop in loan prices over the past several months, with most issues currently trading in the mid to high 80s,
loans are priced at deeply recessionary levels. Some estimates point to an implied default rate three times
higher than during the savings & loan crisis in the early 1990s which is widely considered to be the worst credit
crisis in the last 30 years. Hence, loans currently offer a more compelling investment opportunity compared to
bonds.
Figure 20: Average price of the CS Leveraged Loan Index 1992 – 31 March 2008
Source: Credit Suisse.

Hedge fund investing in distressed securities 24 / 25
In order to capture potential defaults and possible recoveries, it is absolutely crucial for distressed hedge funds
to invest early, as spreads usually tighten faster than they widen, especially for fundamentally sound companies.
Figure 21 below shows the difference between early and late investing after the 2001/2002 recession. It
demonstrates that the optimal date to invest would have been November 2002, thereby generating a two-year
annualised return of 21.9% as October 2002 was the bottom of the market.
As it is hard to capture the bottom of a credit cycle, it is better to invest early rather than late. The average two-
year annualised return for investing 1-12 months earlier than the optimal month was 15.9%, while the average
for investing 1-12 months later was 13.9%. On average, investors who purchased high yield early earned nearly
¾ of the return of investors who timed the market perfectly and they outperformed investors who invested too
late. This asymmetrical response rate is a function of the illiquid nature of the high yield market.
Figure 21: The early bird catches the worm
Source: Credit Suisse, Leveraged Finance Strategy Update, 12 February 2008.
Conclusion The current credit crisis offers attractive investment opportunities for distressed hedge funds, as distressed
markets are inefficient and hedge funds can often buy securities at deep discounts, benefiting from forced
selling by other market participants. As a result of the very loose lending standards such as covenant-lite
structures that were put in place between 2005 and H1 2007, average prices for high yield bonds have fallen
substantially during the last few months while those for leveraged loans have already overshot their 2002 lows
and are priced at deeply recessionary levels.
Credit markets are cyclical in nature, but capturing the bottom of the credit cycle is difficult. In anticipation of a
J-curve like recovery, investing early offers more upside potential than investing late. This has been evident
during the previous bear market in 2002. Furthermore, investors should not forget that distressed investing
should be seen as a long-term investment.
While distressed hedge funds tend to perform better during bull markets by harvesting their ‘investment seeds’
sown during bear markets, they can also make money independent of the overall market credit cycle by
focussing on company specific turnarounds.

Hedge fund investing in distressed securities 25 / 25
Appendix
Indices used:
Style/security Index name
Distressed HFRI Distressed Index
World stocks MSCI World Total Return Index (hedged to USD)
World bonds Citigroup WGB Index (hedged to USD)
High yield HFRI Fixed Income: High Yield Index
High yield CS High Yield Index
Leveraged loans CS Leveraged Loan Index
Please note: As the investable hedge fund indices only have a track record going back to 2003, the non-
investable indices have been used. Due to survivorship and backfilling biases, only the time period starting in
January 1994 has been considered. There is no guarantee of trading performance and past performance is no
indication of current or future performance/results.
Important information
In preparing this publication, we have relied upon and assumed, without independent verification, the accuracy and completeness of all information available from public sources or which was provided to us or otherwise reviewed by us. We do not assume any liability in the case of incorrectly reported or incomplete information. This material is proprietary information of Man Investments and its affiliates and may not be reproduced or otherwise disseminated in whole or in part without prior written consent from Man Investments. Please be aware that investment products involve investment risks, including the possible loss of the principal amount invested. Furthermore, we recommend you to consult your bank, investment and/or tax adviser. Man Investments and/or any of its affiliates may have an investment in the described investment products. This material is communicated by Man Investments Ltd, which is authorised and regulated by the Financial Services Authority.