heef competition template 2016 final (2)
TRANSCRIPT


HISTORY 63rd Street & Halsted Street
SITE
INTRODUCTION
1870’sPost-Chicago Fire Growth
1960’sCity Undertakes “Urban Renewal”
1980’s Re-Opened Streets Triggers
Brief Resurgence
TodayEnglewood Junction
1850’sArea known as Junction Grove
1940’sPopulation Peak at 90,000
2000’sPopulation 40,000; City Invests Again
1970’sMall Fails - Sears & Wieboldt’s Close

SITE
INTRODUCTION
S. Morgan St.
S. Halsted St.
W. 61st St.
W. 63rd St.
S Sangamon
St.
S. Peoria St.West 64th St.
S. Green St.
W. 63rd St.
S. Peoria St.
S. Sangamon St.
W. 65th St.

S. Morgan St.
S. Halsted St.
W. 61st St.
S Sat.
S. Peoria
West 64th St.S. G
reen St.
W. 63rd St.
S. Peoria St.
S. Sangamon St.
W. 65th St.
POPULATION & RIDERSHIPNEIGHBORHOOD
KKC 9,532
ENGLEWOOD ~30,000
GREEN LINE 680RED LINE 5,868
63RD 3,032HALSTED 1,769
63RD 21,864HALSTED 41,968

DEMOGRAPHICS
0.00%
5.00%
10.00%
15.00%
20.00%
0-4 5-9 10-14
15-24
25-34
35-44
45-54
55-64
65-74
75-84
85+
Population (Age)
-0.50%0.00%0.50%1.00%1.50%2.00%2.50%3.00%
2015 - 2020 Trend Estimates
Englewood Illinois United States
44%
15%
13%
12%
8%4%4%
Household Income
<$15,000
$15,000 -$24,999
$25,000 -$34,999
$35,000 -$49,999
$50,000 -$74,999
Population: 29,664Median Age: 31.9Median Income: $18,336
NEIGHBORHOOD

HEALTH CARE & MEDICAL DEMAND
Within 1 Mile : ● 35% of the population filled
prescriptions at a drugstore/pharmacy in 2015
● 10,000 adults age 50 and older ● 6 senior housing facilities
In Illinois: ● 11% uninsured rate (-4.5% from 2013)● 475,003 Illinoisans have gained Medicaid or
CHIP coverage● $554,195,224 Medicare prescription drug
savings
NEIGHBORHOOD

RETAIL DEMANDNEIGHBORHOOD
$ 8.5M in demand for full-service restaurants within 1 mile of the site.
$0 $4 $8 $12 $16 $20
Bldg Materials, Garden Equip, Supply
Stores, Lawn, Florists
Full-Service Restaurants
Millions
Demand Supply

MAJOR EMPLOYERS
NEIGHBORHOOD
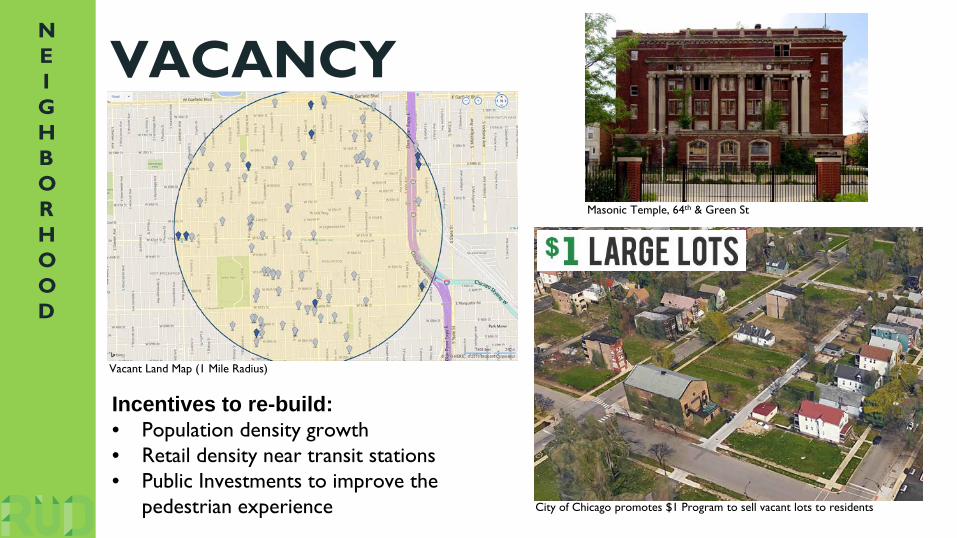
VACANCYNEIGHBORHOOD
Incentives to re-build:• Population density growth • Retail density near transit stations• Public Investments to improve the
pedestrian experience
Vacant Land Map (1 Mile Radius)
Masonic Temple, 64th & Green St
City of Chicago promotes $1 Program to sell vacant lots to residents

Community SpeaksNEIGHBORHOOD
High Demand: ● Healthy sit-down Restaurants● Physical Therapy● Building Materials● Garden equipment & supply
stores● Dry cleaning● Video Games
Construction and healthcare industries are growing
The aging population demographic draws the demand for health and personal care stores

SWOT
ANALYSIS
strengths
opportunities
weaknesses
threats
Kennedy King College
Public Transportation & Accessibility
Engaged Community Organizations
Crime
Population Decline/DensityDevelopment Site Limitations
Vacant Lots
Englewood Reputation
Traditional Financing
Culinary / Health Synergy
Increased TIF/Revenue
TOD Development
Community Support
Englewood Square

Vision

VisionGOALS FOR ENGLEWOOD:• Improve the Vitality, Reputation and Self-
image• Employ Locally-focused Strategies with Long-
term Effects
OBJECTIVES:• Make 63rd/Halsted a major focal point of
improvement efforts• Create local options for satisfying demand for
goods and services• Emphasize synergistic effects in re-
development efforts• Create job opportunities and tax revenues• Ensure that all improvement efforts are
socially and environmentally responsible
IMAGE / REPUTATION
CONSUMER $
POPULATION
INVESTOR INTEREST
JOBSENGLEWOOD’S
LOSS
IMAGE/REPUTATION
CONSUMER $
POPULATION
INVESTOR INTEREST
JOBSENGLEWOOD’S
GAIN
VISION

SITE PLAN
DEVELOPMENT SF
SITE A: 21,400 SF
SITE B: 19,000 SF
SITE C: 18,900 SF
REVENUE
ANNUAL WAGE IMPACT $2,550,000
ANNUAL SALES $20,870,000
ANNUAL SALES TAX$1,730,000
JOB CREATION
908 121

380 35
SITE
A
RETAIL CENTER21,400 SF
CVS 13,000 SFATHLETICO 4,200 SFANYTIME 4,200 SFFITNESS
PARKING: 86~ 4 : 1,000
REVENUE
ANNUAL WAGE IMPACT $740,000
ANNUAL SALES$13,340,000
ANNUAL SALES TAX$1,280,000
JOB CREATION
380 35

RETAIL CENTER21,400 SF
CVS 13,000 SFATHLETICO 4,200 SFANYTIME 4,200 SFFITNESS
PARKING: 86~ 4 : 1,000
380 35REVENUE
ANNUAL WAGE IMPACT $740,000
ANNUAL SALES$13,340,000
ANNUAL SALES TAX$1,280,000
JOB CREATION
380 35
SITE
A

380 35275
SITE
B
GREEN ST. STATION + COMMERCIAL
KITCHEN19,000 SF
RESTAURANT 4,500 SFHYDRO. FARM 4,500 SFKITCHEN 10,000 SF
PARKING: 62
REVENUE
ANNUAL WAGE IMPACT $1,050,000
ANNUAL SALES $3,630,000
ANNUAL SALES TAX$70,000
JOB CREATION
275 50

380 35275
SITE
B
JOB CREATION
275 50
REVENUE
ANNUAL WAGE IMPACT $1,050,000
ANNUAL SALES $3,630,000
ANNUAL SALES TAX$70,000
GREEN ST. STATION + COMMERCIAL
KITCHEN19,000 SF
RESTAURANT 4,500 SFHYDRO. FARM 4,500 SFKITCHEN 10,000 SF
PARKING: 62

RETAIL CENTER18,900 SF
ACE 9,900 SFWORK N GEAR 4,500 SFGAMESTOP 1,000 SFCLEANERS 3,500 SF
PARKING: 754 : 1,000
380 35
SITE
C
JOB CREATION
253 36
REVENUE
ANNUAL WAGE IMPACT $1,050,000
ANNUAL SALES $3,630,000
ANNUAL SALES TAX$70,000

SITE
C
RETAIL CENTER18,900 SF
ACE 9,900 SFWORK N GEAR 4,500 SFGAMESTOP 1,000 SFCLEANERS 3,500 SF
PARKING: 754 : 1,000
JOB CREATION
253 36
REVENUE
ANNUAL WAGE IMPACT $1,050,000
ANNUAL SALES $3,630,000
ANNUAL SALES TAX$70,000

380
OPPORTUNITIES SITE
PLANS
Local Artist Rahmaan Statik &
Englewood Safety Network
Local Artist Murals
Security Collaboration
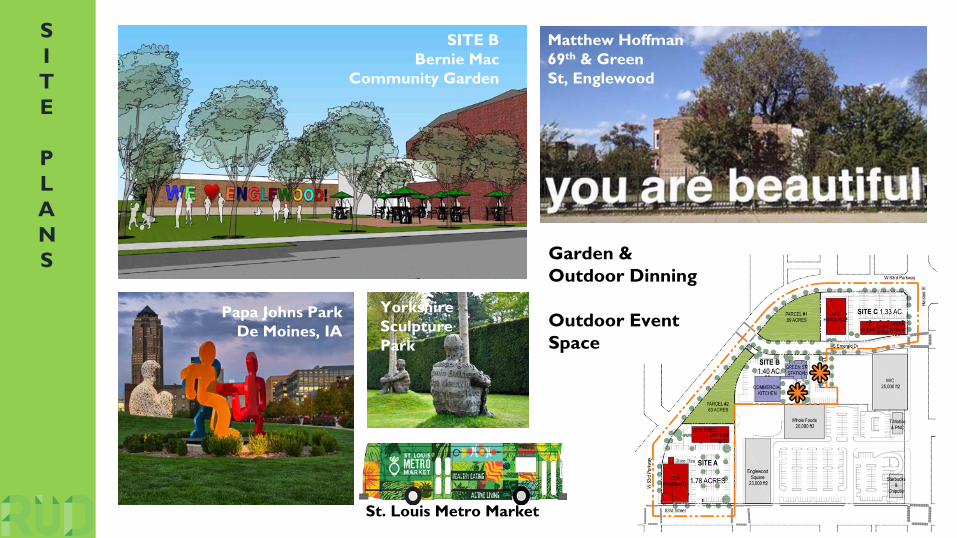
SITE
PLANS
Matthew Hoffman69th & Green St, Englewood
Yorkshire Sculpture Park
Papa Johns Park De Moines, IA
SITE BBernie Mac
Community Garden
Garden & Outdoor Dinning
Outdoor Event Space
St. Louis Metro Market

SITE
PLANS
Pop – Up Parks
Pedestrian Connection
Vacant Lot Treatment
Sustainable Features

ASSUMPTIONSFEASIBILITY
PROJECT SOURCES TOTAL $ % PROJECT USES TOTAL $ %
Construction Loan 8,229,629$ 69% Land Acquisition 5,383,122$ 45%
TIF- Contribution -$ 0% Development (Hard & Soft Costs) 5,702,738$ 48%
Historic Tax Credits (Firehouse) 123,250$ 1% Interest Expense 164,123$ 1%
($.85 to the dollar) - Leasing Commissions 506,629$ 4%
Sale of CVS Ground Lease 445,035$ 4% Tenant Contributions 185,584$ 2%
Equity 3,144,283$ 26%
0%
TOTAL SOURCES 11,942,197$ 100% TOTAL USES 11,942,197$ 100%
Project with NO Incentives Project With Incentives
Development Budget 11,942,197$ 11,818,947$
Stabilized NOI (All Phases Year 3) 722,599$ 826,724$
Return on Cost 6.05% 6.99%
Construction Loan38%
Historic Tax Credits
(Firehouse)1%Sale of CVS
Ground Lease4%
Equity57%
Sources
Unleveraged IRR 9.00%Leveraged IRR 11.21%
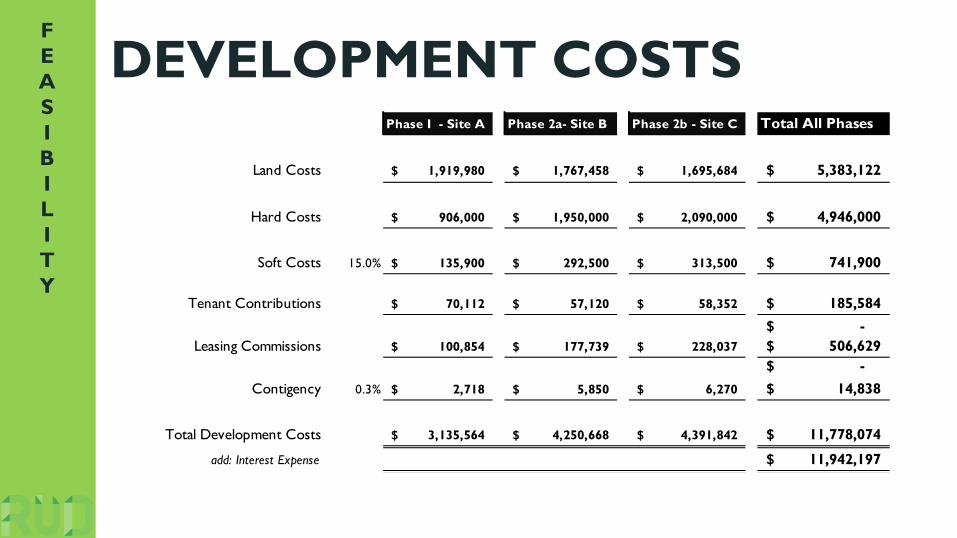
DEVELOPMENT COSTSFEASIBILITY
Phase I - Site A Phase 2a- Site B Phase 2b - Site C Total All Phases
Land Costs 1,919,980$ 1,767,458$ 1,695,684$ 5,383,122$
Hard Costs 906,000$ 1,950,000$ 2,090,000$ 4,946,000$
Soft Costs 15.0% 135,900$ 292,500$ 313,500$ 741,900$
Tenant Contributions 70,112$ 57,120$ 58,352$ 185,584$ -$
Leasing Commissions 100,854$ 177,739$ 228,037$ 506,629$ -$
Contigency 0.3% 2,718$ 5,850$ 6,270$ 14,838$
Total Development Costs 3,135,564$ 4,250,668$ 4,391,842$ 11,778,074$
add: Interest Expense 11,942,197$

TIMELINE & PHASING STRATEGY
FEASIBILITY
PHASE I PHASE II(a) PHASE II(b)

THE FUTUREEnglewood Junction will deliver:• Goods and Services Tied to Local Demand• Jobs• Increased Tax Revenues• Attractive, Community-sensitive Development

QUESTIONS?